Embed Size (px)
Citation preview
21st Century Lessons
Interquartile Range as a Measure of Variation
Primary Lesson Designer:
Katelyn Fournier
1

2
21st Century Lessons is funded by the American Federation of Teachers.
3
*1st Time Users of 21st Century Lesson:Click HERE for a detailed description of our project.
21st Century Lessons – Teacher Preparation
• Spend AT LEAST 30 minutes studying the Lesson Overview, Teacher Notes on each slide, and accompanying worksheets.
• Set up your projector and test this PowerPoint file to make sure all animations, media, etc. work properly.
Please do the following as you prepare to deliver this lesson:
• Feel free to customize this file to match the language and routines in your classroom.
4
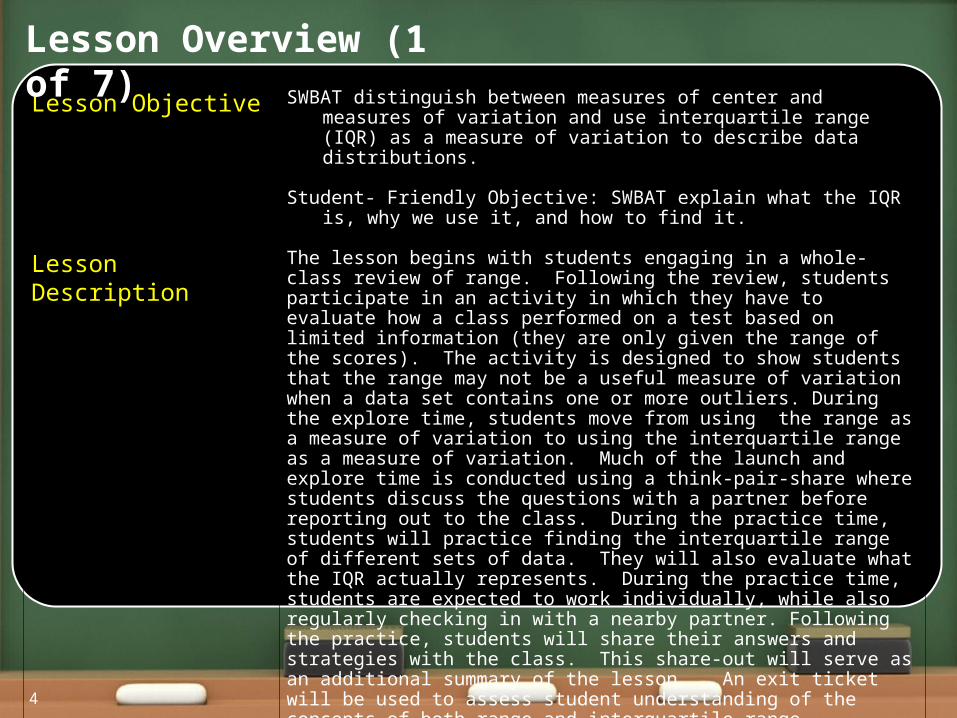
Lesson Objective SWBAT distinguish between measures of center and measures of variation and use interquartile range (IQR) as a measure of variation to describe data distributions.
Student- Friendly Objective: SWBAT explain what the IQR is, why we use it, and how to find it.
Lesson Description The lesson begins with students engaging in a whole-class review of range. Following the review, students participate in an activity in which they have to evaluate how a class performed on a test based on limited information (they are only given the range of the scores). The activity is designed to show students that the range may not be a useful measure of variation when a data set contains one or more outliers. During the explore time, students move from using the range as a measure of variation to using the interquartile range as a measure of variation. Much of the launch and explore time is conducted using a think-pair-share where students discuss the questions with a partner before reporting out to the class. During the practice time, students will practice finding the interquartile range of different sets of data. They will also evaluate what the IQR actually represents. During the practice time, students are expected to work individually, while also regularly checking in with a nearby partner. Following the practice, students will share their answers and strategies with the class. This share-out will serve as an additional summary of the lesson. An exit ticket will be used to assess student understanding of the concepts of both range and interquartile range.
Lesson Overview (1 of 7)
5
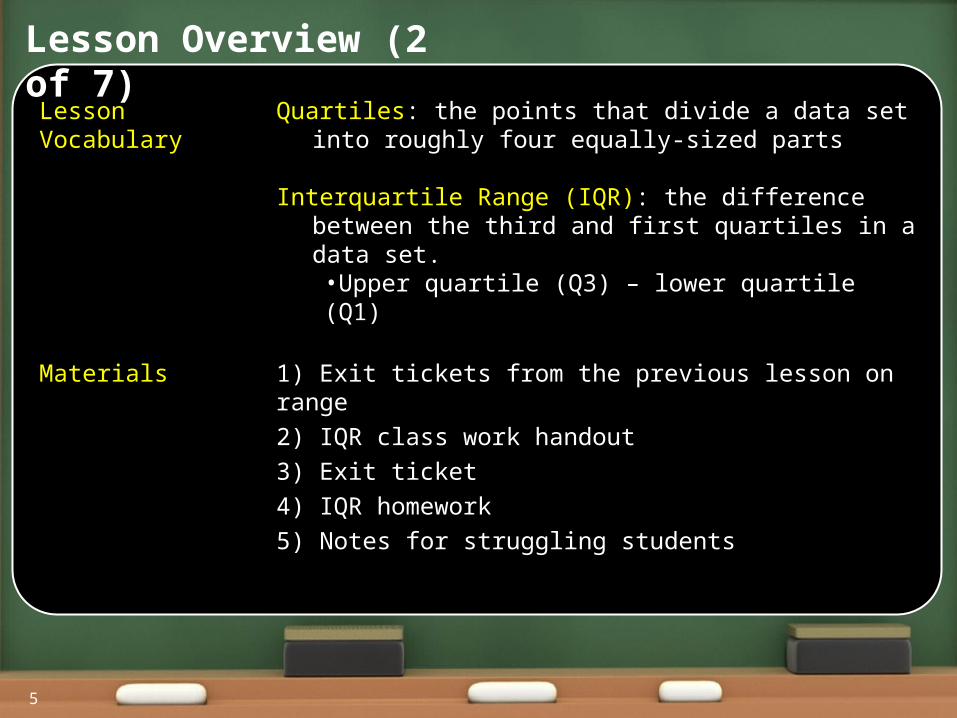
Lesson Vocabulary Quartiles: the points that divide a data set into roughly four equally-sized parts
Interquartile Range (IQR): the difference between the third and first quartiles in a data set.•Upper quartile (Q3) – lower quartile (Q1)
Materials 1) Exit tickets from the previous lesson on range
2) IQR class work handout
3) Exit ticket
4) IQR homework
5) Notes for struggling students
Lesson Overview (2 of 7)
6
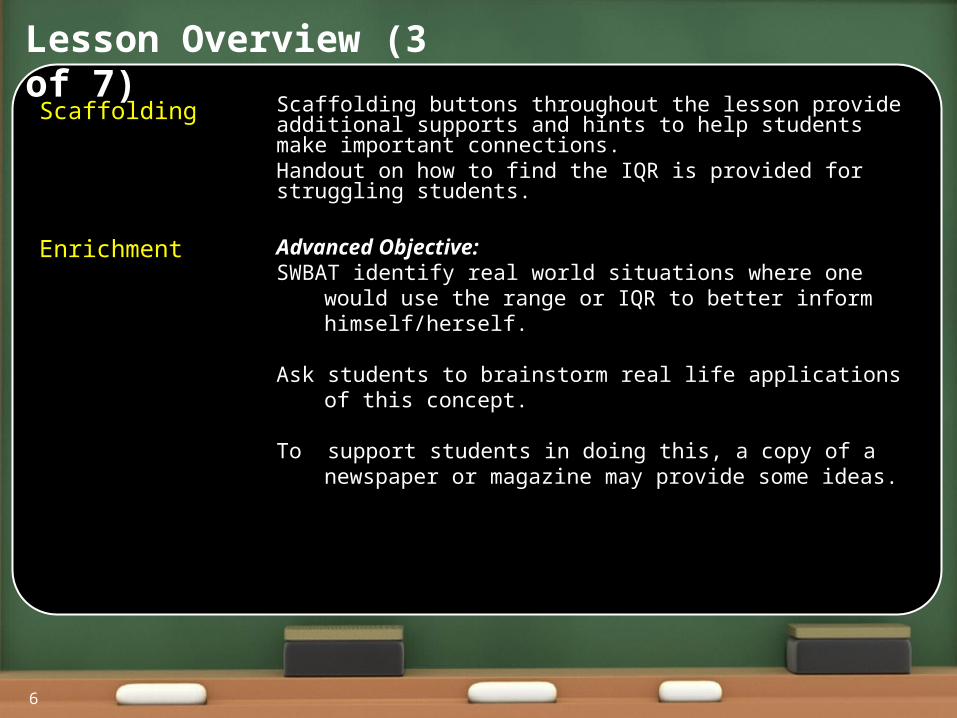
Scaffolding Scaffolding buttons throughout the lesson provide additional supports and hints to help students make important connections.Handout on how to find the IQR is provided for struggling students.
Enrichment Advanced Objective:SWBAT identify real world situations where one would use the range or
IQR to better inform himself/herself.
Ask students to brainstorm real life applications of this concept.
To support students in doing this, a copy of a newspaper or magazine may provide some ideas.
Lesson Overview (3 of 7)
7
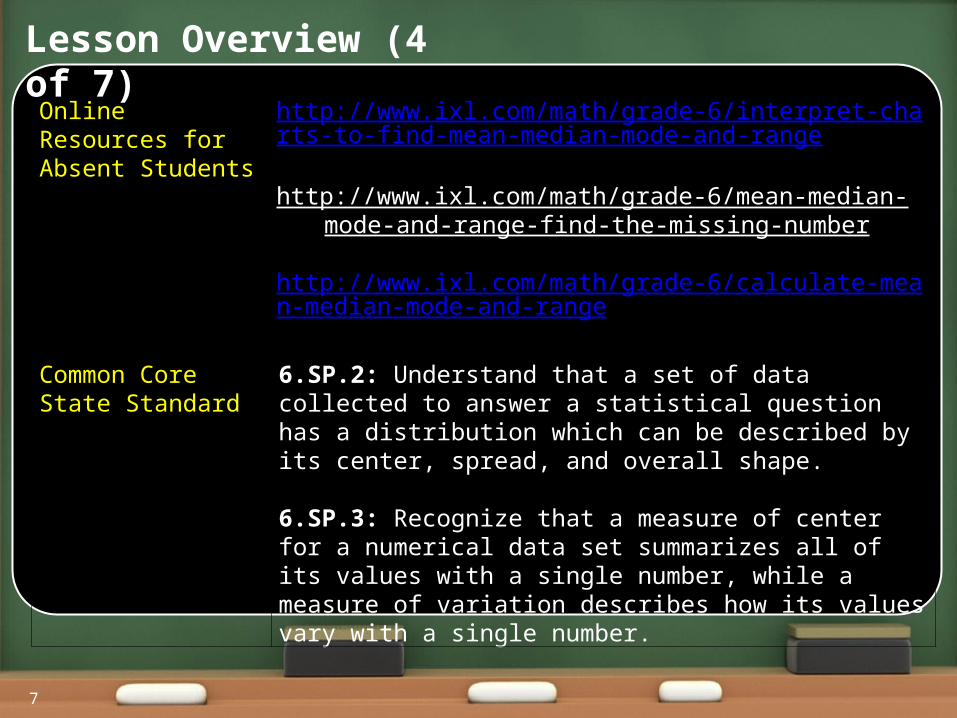
Online Resources for Absent Students
http://www.ixl.com/math/grade-6/interpret-charts-to-find-mean-median-mode-and-range
http://www.ixl.com/math/grade-6/mean-median-mode-and-range-find-the-missing-number
http://www.ixl.com/math/grade-6/calculate-mean-median-mode-and-range
Lesson Overview (4 of 7)
Common Core State Standard
6.SP.2: Understand that a set of data collected to answer a statistical question has a distribution which can be described by its center, spread, and overall shape.
6.SP.3: Recognize that a measure of center for a numerical data set summarizes all of its values with a single number, while a measure of variation describes how its values vary with a single number.
8
Lesson Overview (5 of 7)
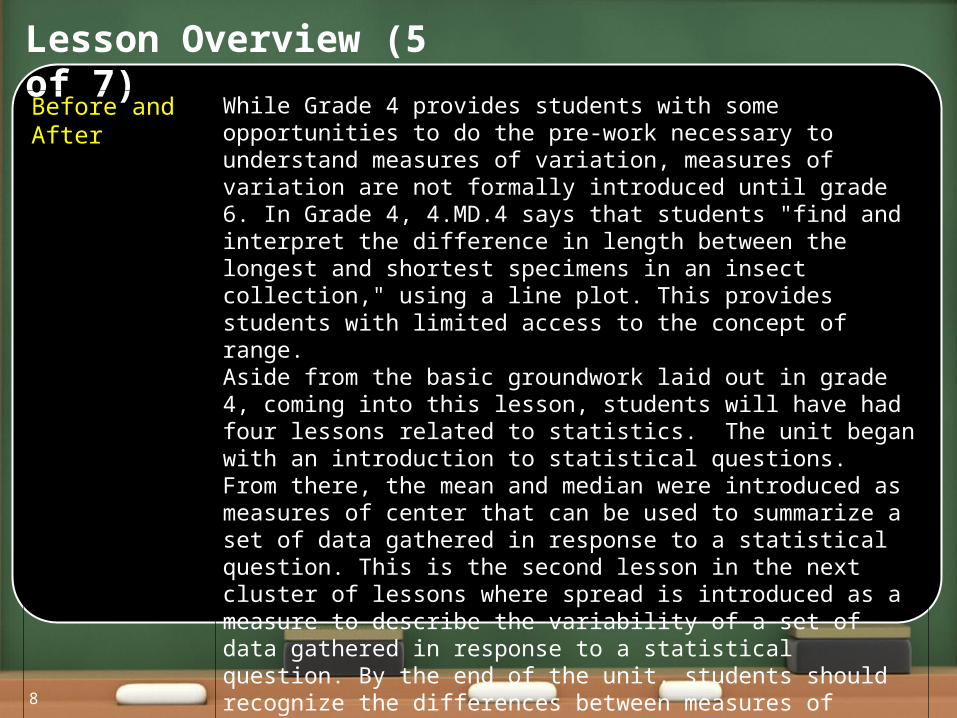
Before and After While Grade 4 provides students with some opportunities to do the pre-work necessary to understand measures of variation, measures of variation are not formally introduced until grade 6. In Grade 4, 4.MD.4 says that students "find and interpret the difference in length between the longest and shortest specimens in an insect collection," using a line plot. This provides students with limited access to the concept of range.Aside from the basic groundwork laid out in grade 4, coming into this lesson, students will have had four lessons related to statistics. The unit began with an introduction to statistical questions. From there, the mean and median were introduced as measures of center that can be used to summarize a set of data gathered in response to a statistical question. This is the second lesson in the next cluster of lessons where spread is introduced as a measure to describe the variability of a set of data gathered in response to a statistical question. By the end of the unit, students should recognize the differences between measures of center and measures of variation and also what they are useful for despite the fact that both are used to describe data sets.
9
Lesson Overview (6 of 7)
Before and AfterContinued
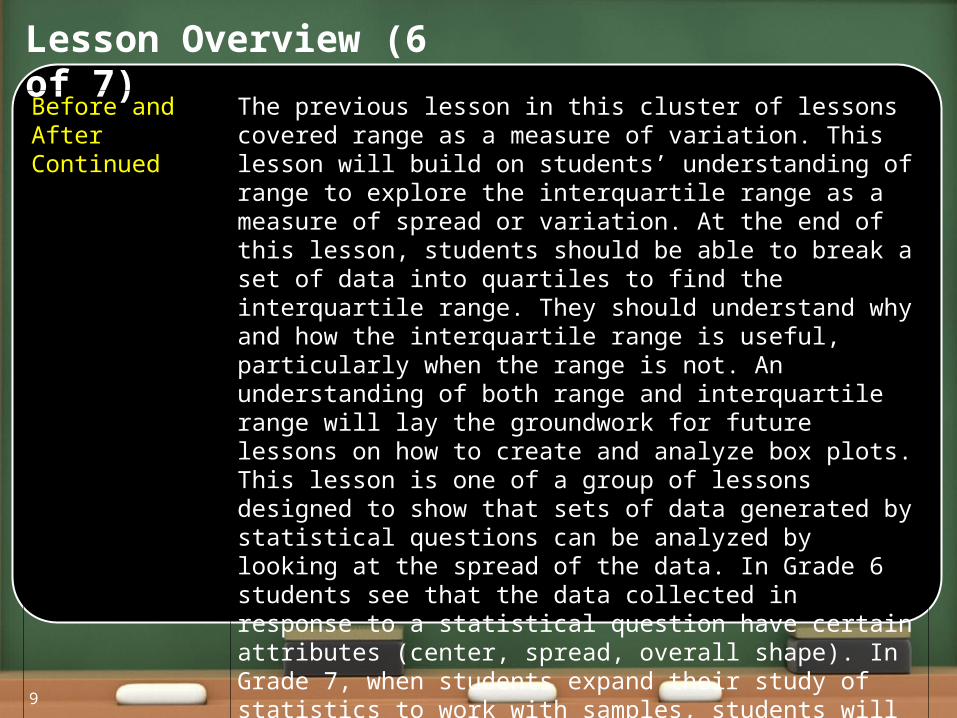
The previous lesson in this cluster of lessons covered range as a measure of variation. This lesson will build on students’ understanding of range to explore the interquartile range as a measure of spread or variation. At the end of this lesson, students should be able to break a set of data into quartiles to find the interquartile range. They should understand why and how the interquartile range is useful, particularly when the range is not. An understanding of both range and interquartile range will lay the groundwork for future lessons on how to create and analyze box plots. This lesson is one of a group of lessons designed to show that sets of data generated by statistical questions can be analyzed by looking at the spread of the data. In Grade 6 students see that the data collected in response to a statistical question have certain attributes (center, spread, overall shape). In Grade 7, when students expand their study of statistics to work with samples, students will see that these attributes relate important information about the sample from which the data were collected.
10
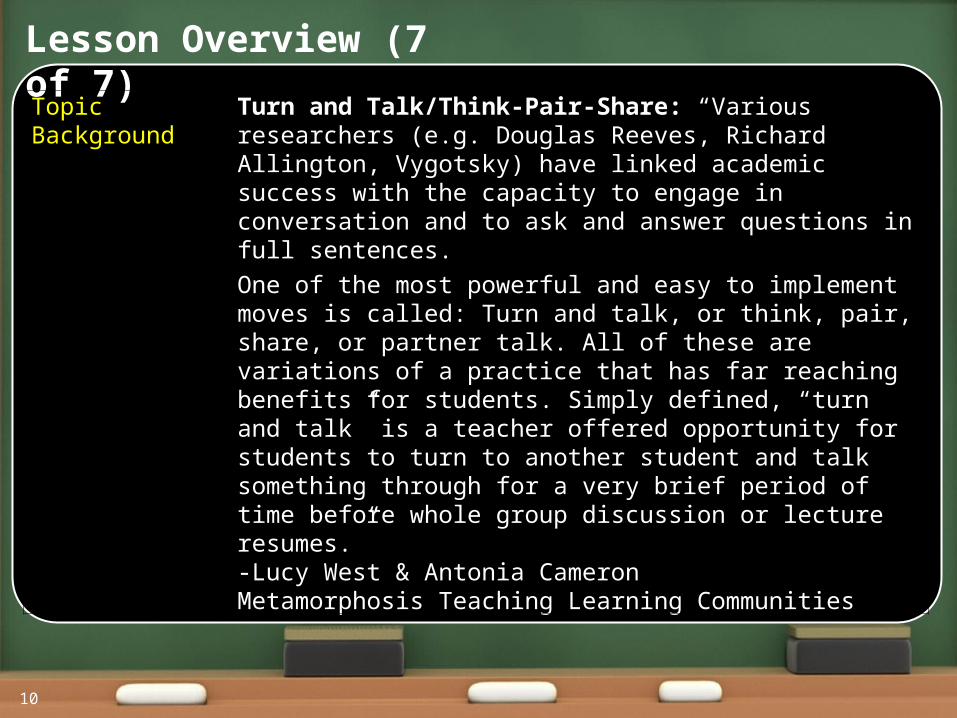
Lesson Overview (7 of 7)
Topic Background Turn and Talk/Think-Pair-Share: “Various researchers (e.g. Douglas Reeves, Richard Allington, Vygotsky) have linked academic success with the capacity to engage in conversation and to ask and answer questions in full sentences.
One of the most powerful and easy to implement moves is called: Turn and talk, or think, pair, share, or partner talk. All of these are variations of a practice that has far reaching benefits for students. Simply defined, “turn and talk” is a teacher offered opportunity for students to turn to another student and talk something through for a very brief period of time before whole group discussion or lecture resumes.”-Lucy West & Antonia CameronMetamorphosis Teaching Learning Communities
Warm Up
11
Agenda
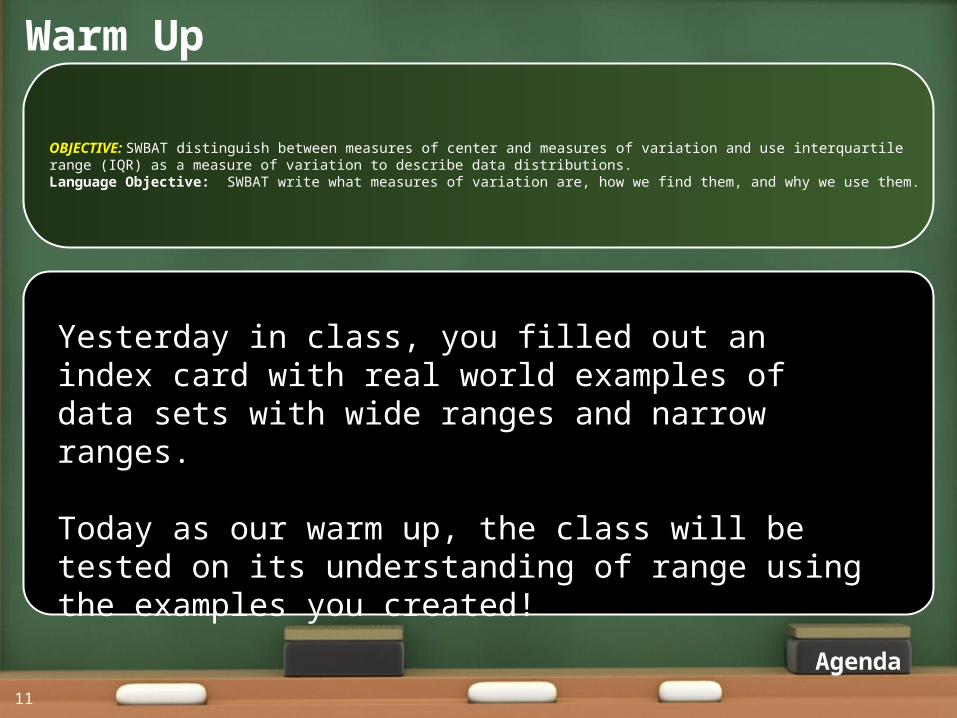
Yesterday in class, you filled out an index card with real world examples of data sets with wide ranges and narrow ranges.
Today as our warm up, the class will be tested on its understanding of range using the examples you created!
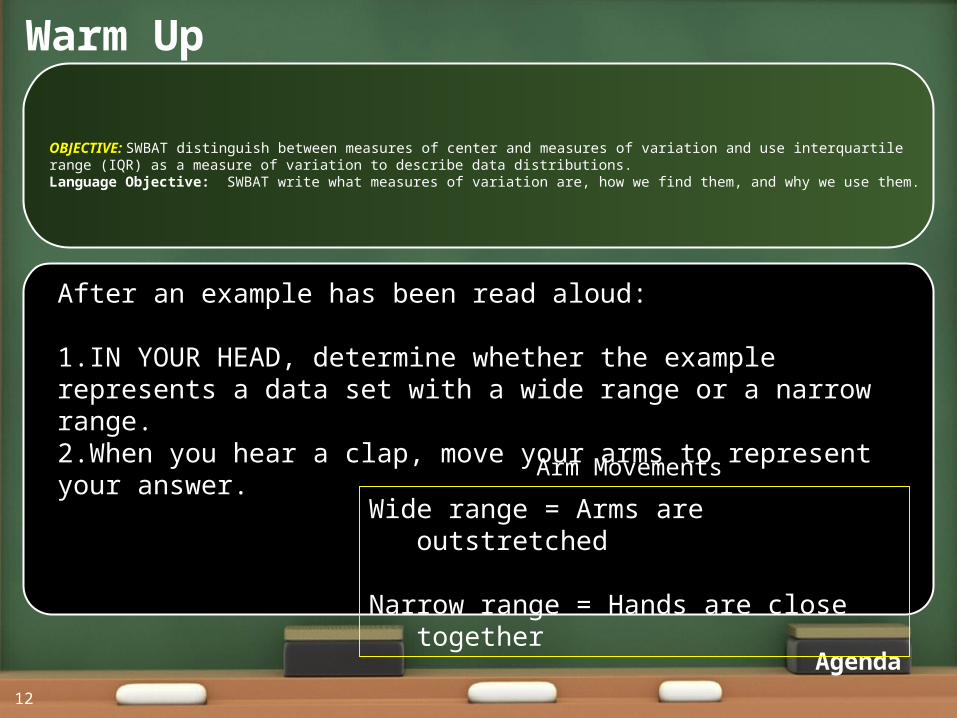
OBJECTIVE: SWBAT distinguish between measures of center and measures of variation and use interquartile range (IQR) as a measure of variation to describe data distributions.Language Objective: SWBAT write what measures of variation are, how we find them, and why we use them.
Warm Up
12
Agenda
After an example has been read aloud:
1.IN YOUR HEAD, determine whether the example represents a data set with a wide range or a narrow range.2.When you hear a clap, move your arms to represent your answer.
Wide range = Arms are outstretched
Narrow range = Hands are close together
OBJECTIVE: SWBAT distinguish between measures of center and measures of variation and use interquartile range (IQR) as a measure of variation to describe data distributions.Language Objective: SWBAT write what measures of variation are, how we find them, and why we use them.
Arm Movements
Agenda:
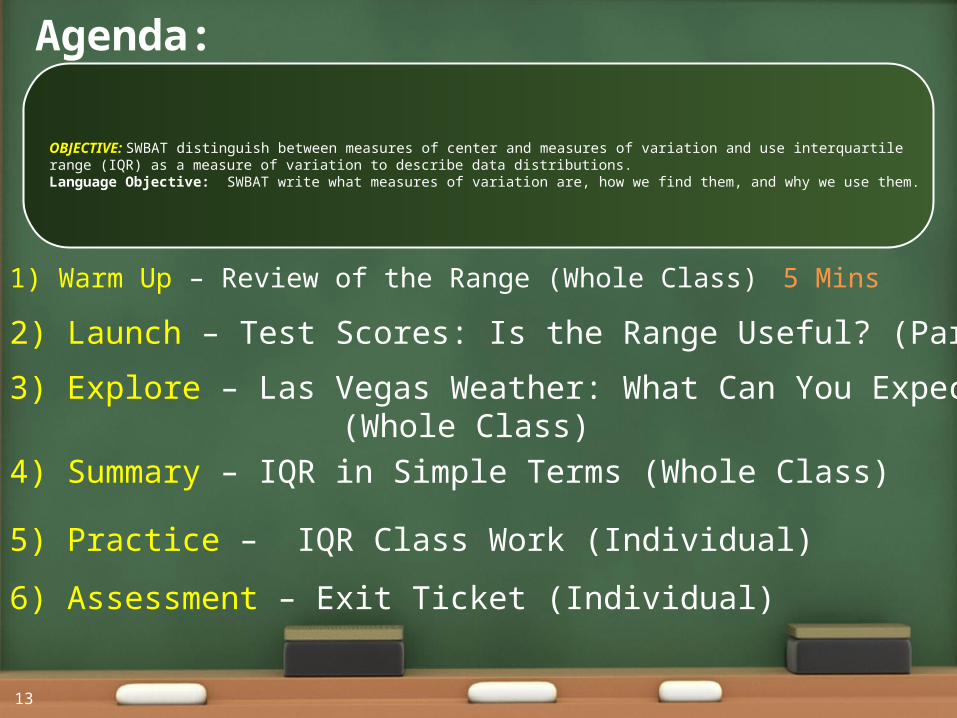
1) Warm Up – Review of the Range (Whole Class) 5 Mins
2) Launch – Test Scores: Is the Range Useful? (Partner) 10 Mins
3) Explore – Las Vegas Weather: What Can You Expect? 20 Mins (Whole Class)
4) Summary – IQR in Simple Terms (Whole Class) 5 Mins
5) Practice – IQR Class Work (Individual) 15 Mins
6) Assessment – Exit Ticket (Individual) 5 Mins
13
OBJECTIVE: SWBAT distinguish between measures of center and measures of variation and use interquartile range (IQR) as a measure of variation to describe data distributions.Language Objective: SWBAT write what measures of variation are, how we find them, and why we use them.
Launch – Review Turn and Talk (30 sec)
number of toppings students like
14
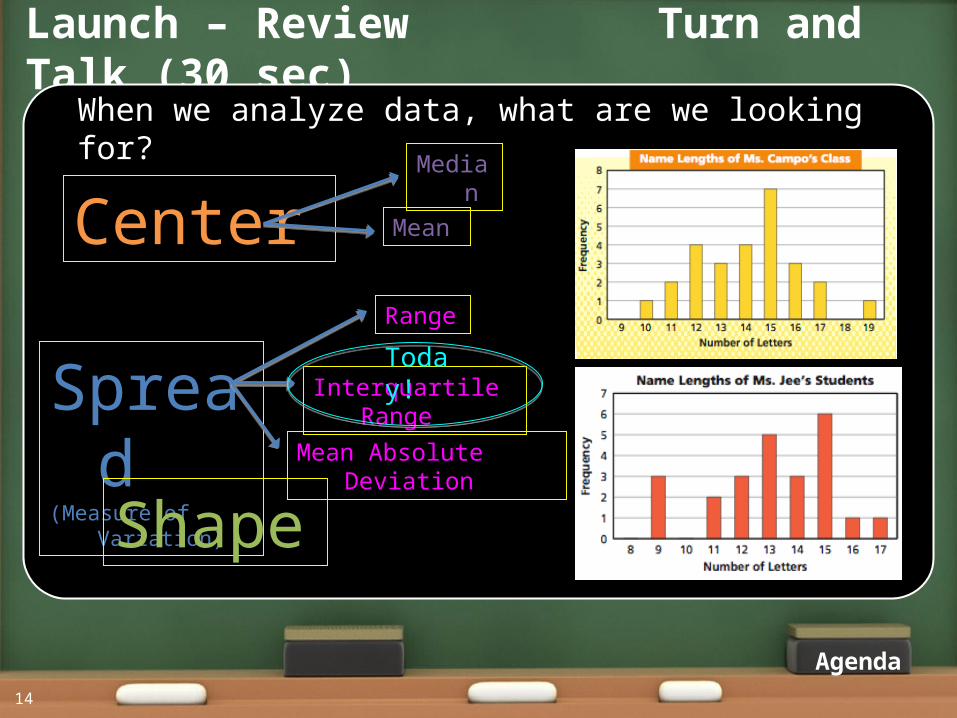
When we analyze data, what are we looking for?
Center
Spread(Measure of Variation)
Shape
Median
Mean
Range
Interquartile Range
Mean Absolute Deviation
Agenda
Today!
Launch Think-Pair-Share
15
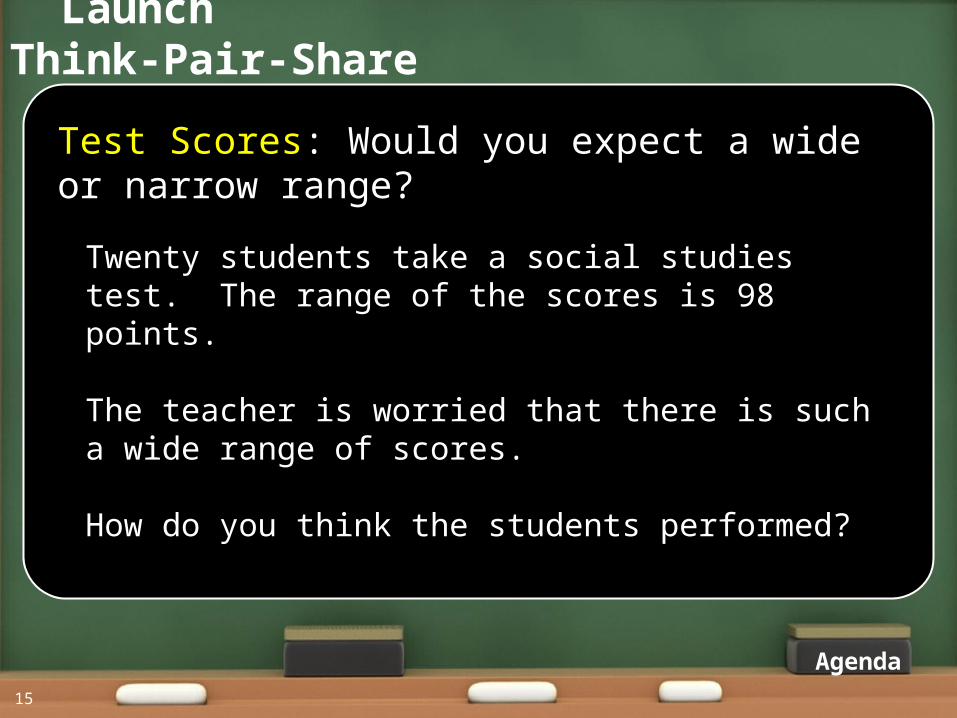
Test Scores: Would you expect a wide or narrow range?
Agenda
Twenty students take a social studies test. The range of the scores is 98 points.
The teacher is worried that there is such a wide range of scores.
How do you think the students performed?
Launch Whole Class
16
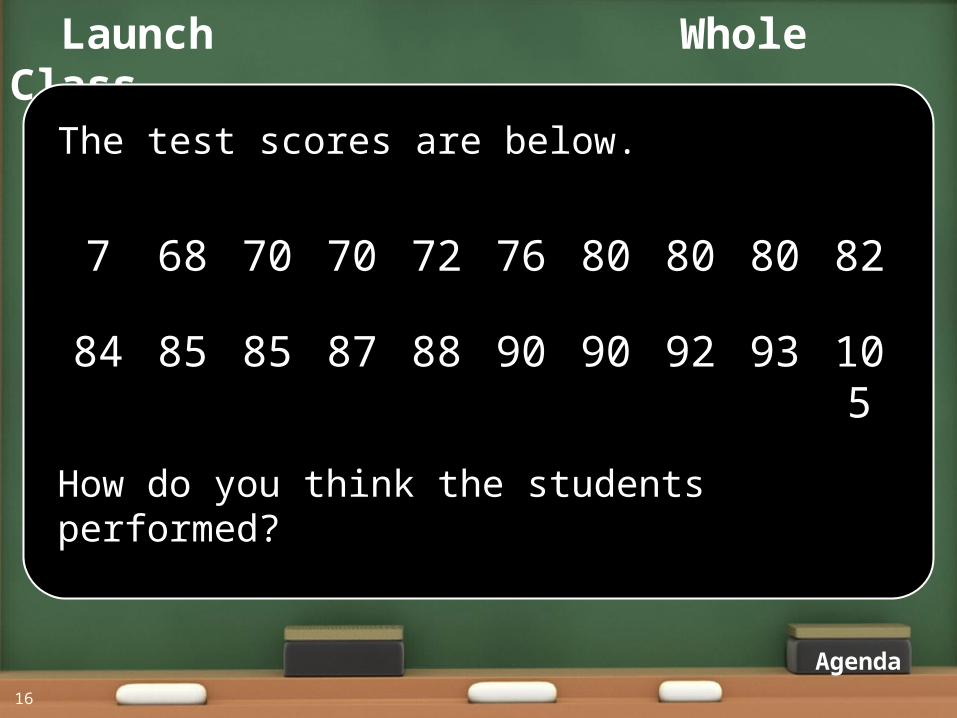
The test scores are below.
Agenda
7 68 70 70 72 76 80 80 80 82
84 85 85 87 88 90 90 92 93 105
How do you think the students performed?
Launch Whole Class
17
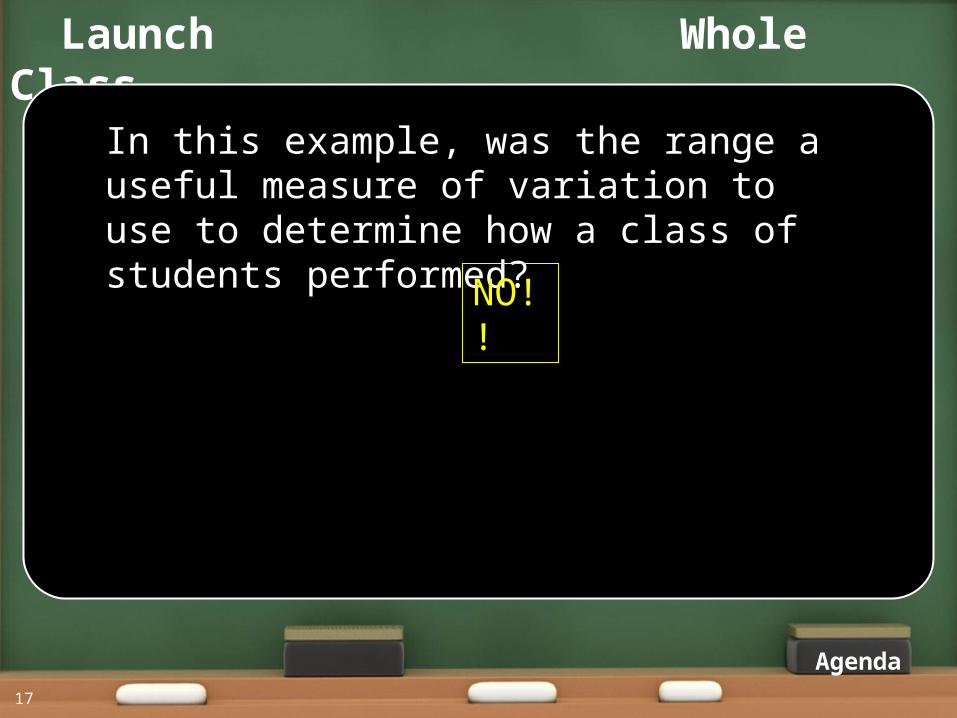
In this example, was the range a useful measure of variation to use to determine how a class of students performed?
Agenda
NO!!
Explore Turn and Talk
18
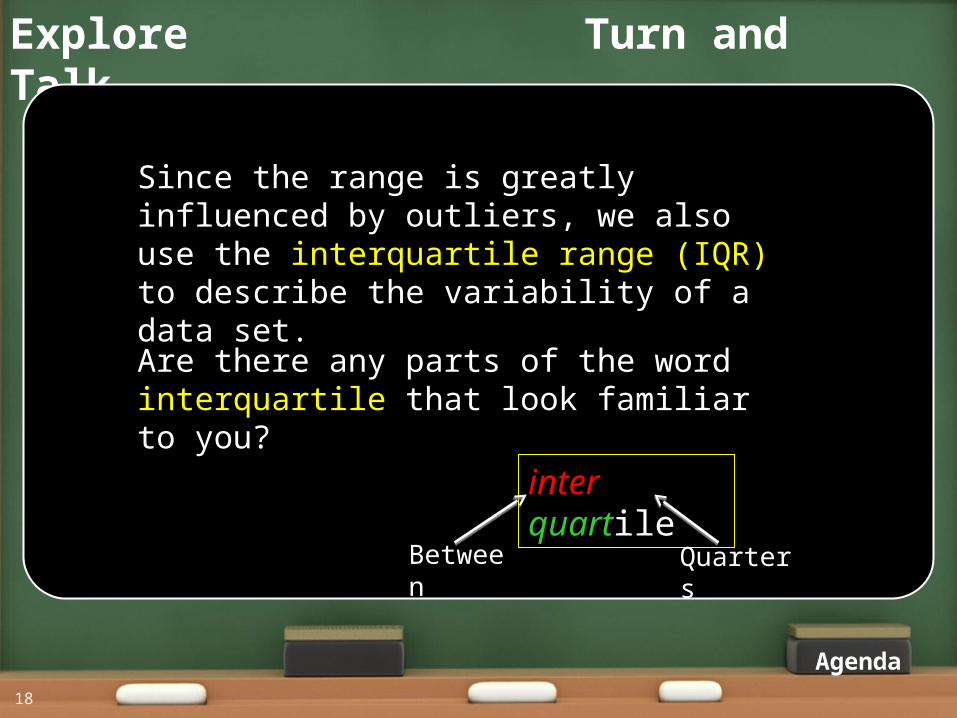
Since the range is greatly influenced by outliers, we also use the interquartile range (IQR) to describe the variability of a data set.
Are there any parts of the word interquartile that look familiar to you?
Agenda
inter quartile
Between Quarters
Explore Notes
19
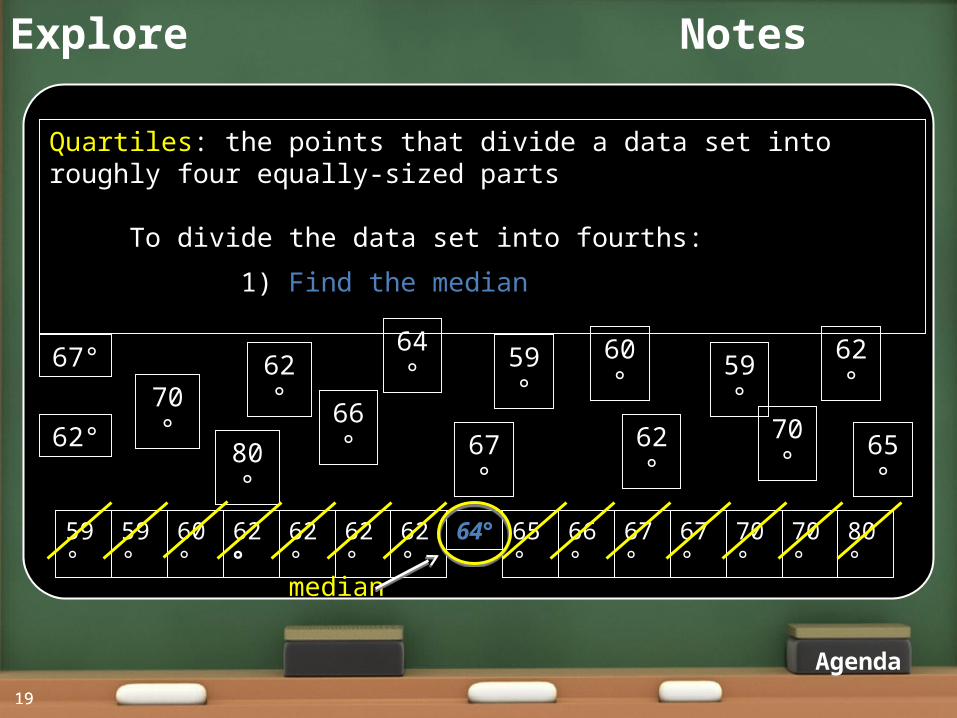
Quartiles: the points that divide a data set into roughly four equally-sized parts
To divide the data set into fourths:
1) Find the median
19
59° 59° 60° 62° 62° 62° 62° 64° 65° 66° 67° 67° 70° 70° 80°
59° 59°60° 62°
62° 62°
62°64°
65°66°
67°
67°
70°70°
80°
Agenda
median
Explore Whole Class
2020
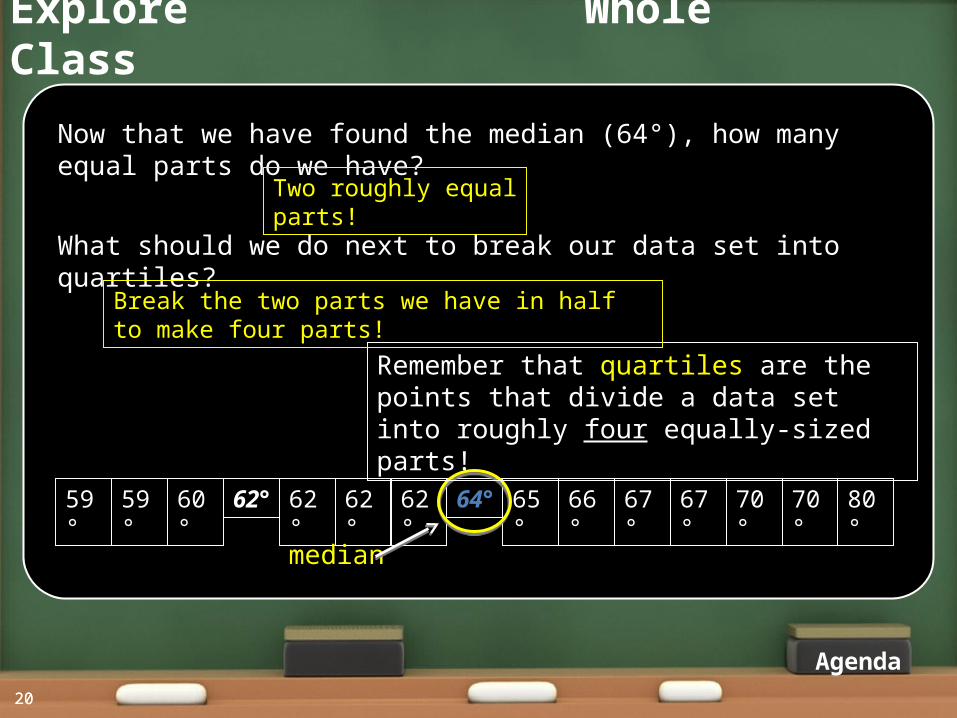
59° 59° 60° 62° 62° 62° 62° 64° 65° 66° 67° 67° 70° 70° 80°
Agenda
Now that we have found the median (64°), how many equal parts do we have?
median
Two roughly equal parts!
What should we do next to break our data set into quartiles?
Remember that quartiles are the points that divide a data set into roughly four equally-sized parts!
Break the two parts we have in half to make four parts!
Explore Notes
2121
59° 59° 60° 62° 62° 62° 62° 64° 65° 66° 67° 67° 70° 70° 80°
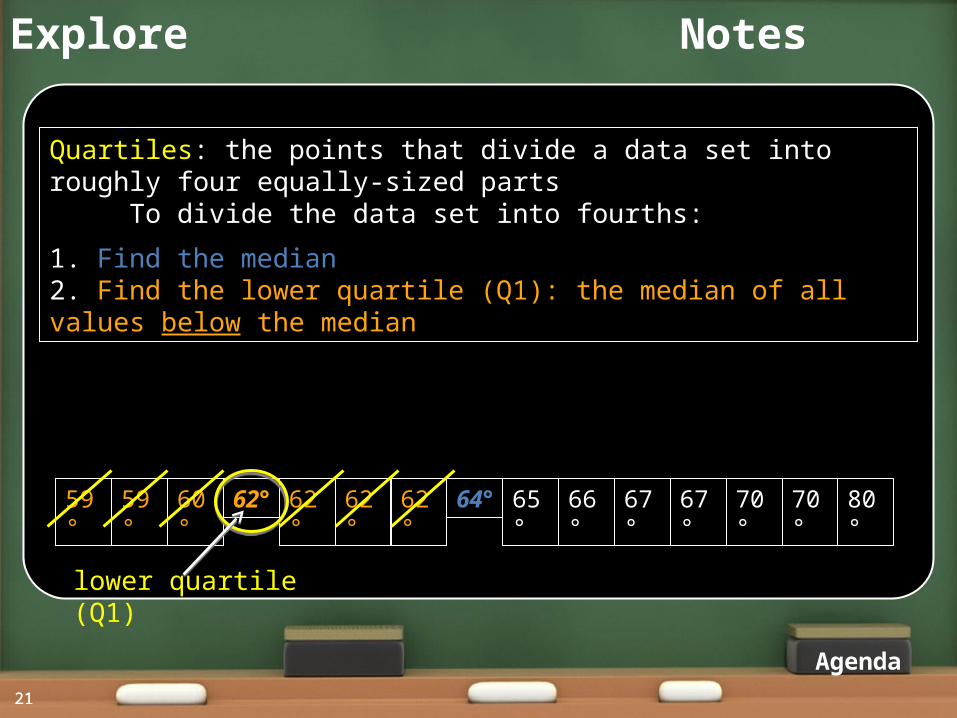
Quartiles: the points that divide a data set into roughly four equally-sized parts To divide the data set into fourths:
1. Find the median2. Find the lower quartile (Q1): the median of all values below the median
Agenda
lower quartile (Q1)
Explore Notes
2222
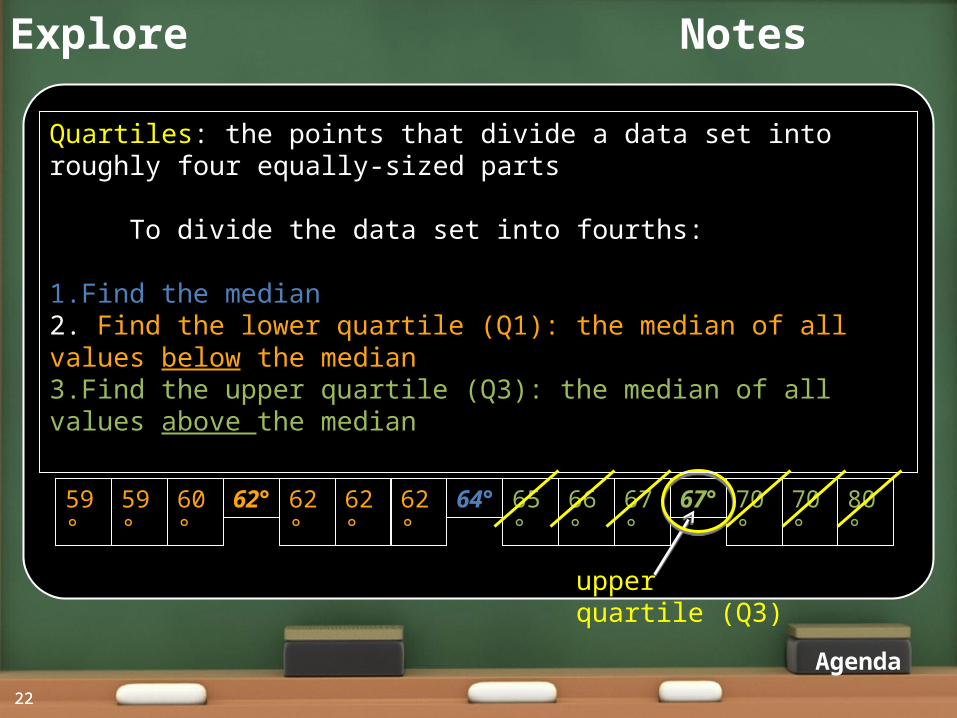
59° 59° 60° 62° 62° 62° 62° 64° 65° 66° 67° 67° 70° 70° 80°
upper quartile (Q3)
Quartiles: the points that divide a data set into roughly four equally-sized parts
To divide the data set into fourths:
1.Find the median2. Find the lower quartile (Q1): the median of all values below the median3.Find the upper quartile (Q3): the median of all values above the median
Agenda
Explore Check Your Work!
2323
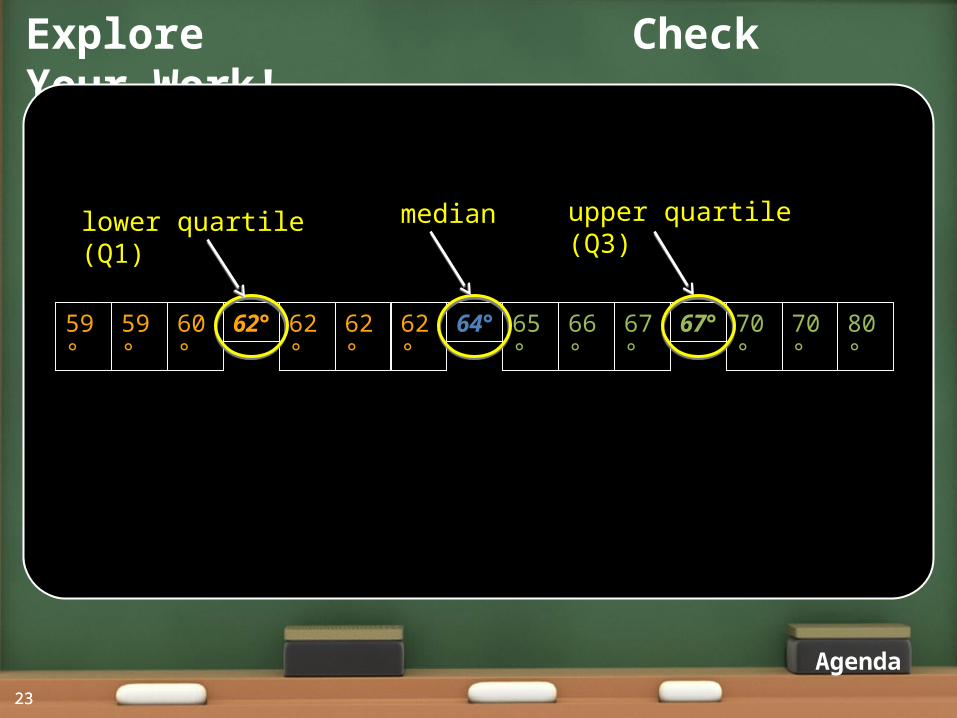
59° 59° 60° 62° 62° 62° 62° 64° 65° 66° 67° 67° 70° 70° 80°
upper quartile (Q3) medianlower quartile (Q1)
Agenda
Explore Independent
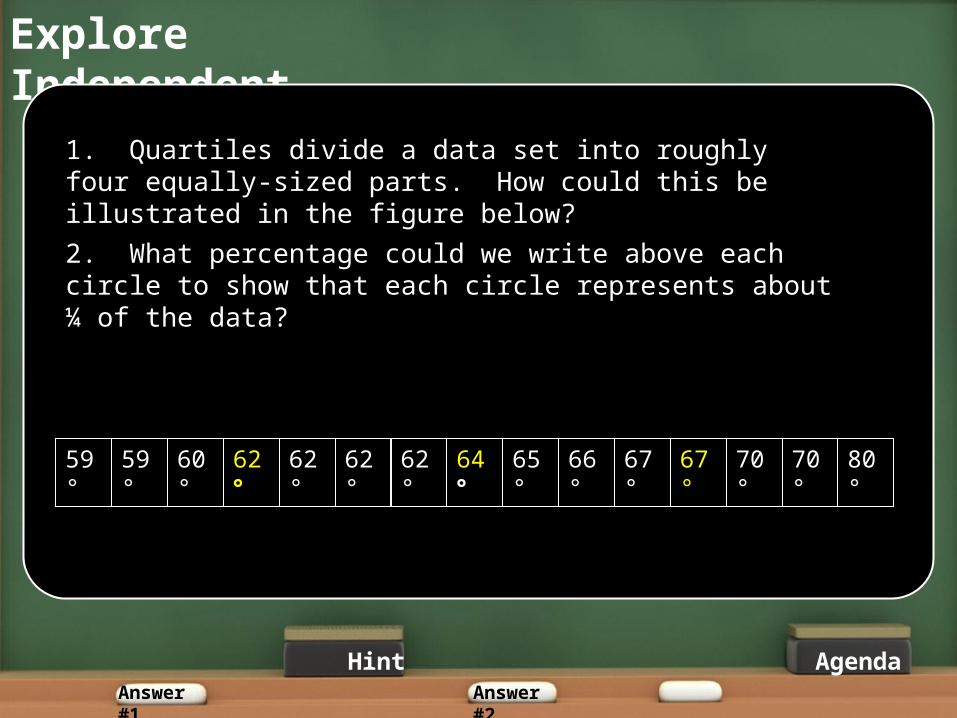
59° 59° 60° 62° 62° 62° 62° 64° 65° 66° 67° 67° 70° 70° 80°
Hint
1. Quartiles divide a data set into roughly four equally-sized parts. How could this be illustrated in the figure below?
2. What percentage could we write above each circle to show that each circle represents about ¼ of the data?
Answer #1 Answer #2
Agenda
Explore Independent
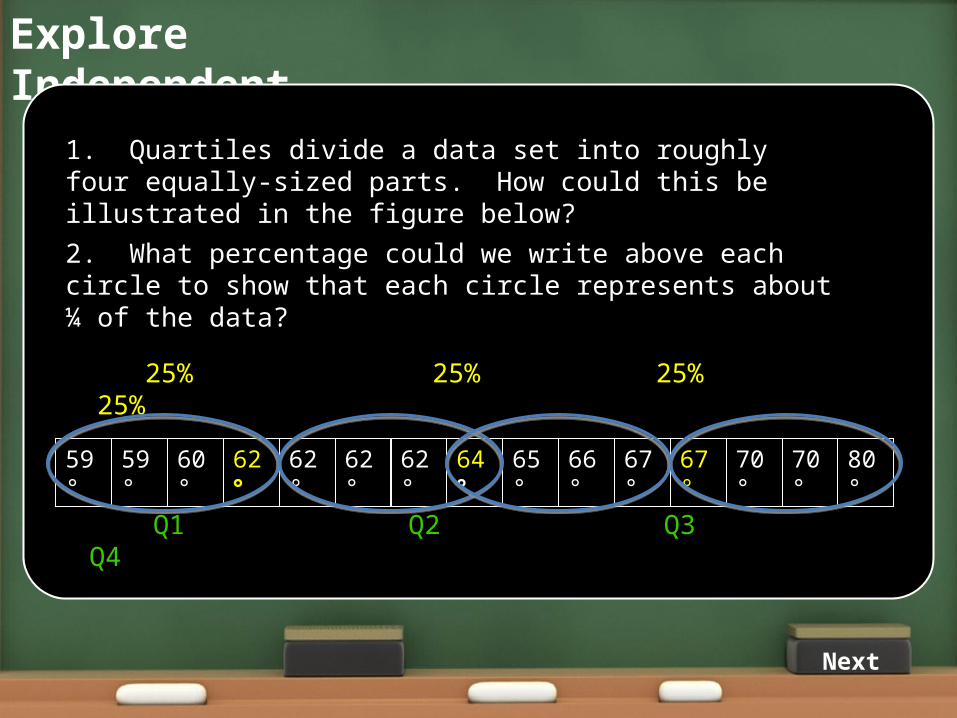
59° 59° 60° 62° 62° 62° 62° 64° 65° 66° 67° 67° 70° 70° 80°
1. Quartiles divide a data set into roughly four equally-sized parts. How could this be illustrated in the figure below?
2. What percentage could we write above each circle to show that each circle represents about ¼ of the data?
25% 25% 25% 25%
Next
Q1 Q2 Q3 Q4
Explore Turn-and-talk
59° 59° 60° 62° 62° 62° 62° 64° 65° 66° 67° 67° 70° 70° 80°
Hint Agenda
Q1 Q2 Q3 Q4
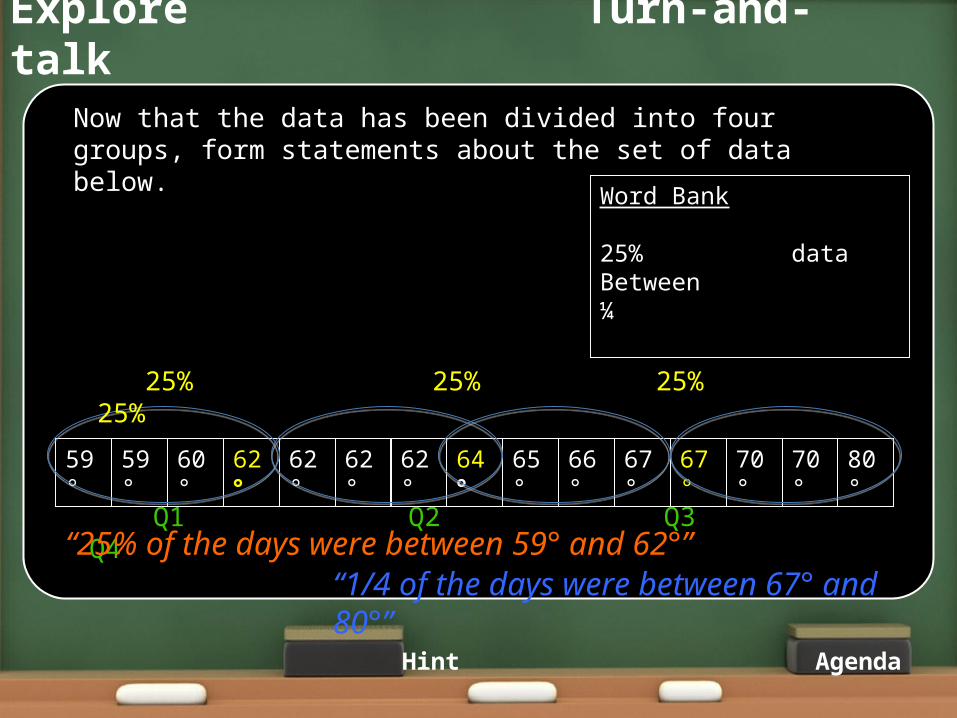
Word Bank
25% dataBetween ¼
Now that the data has been divided into four groups, form statements about the set of data below.
25% 25% 25% 25%
“25% of the days were between 59° and 62°”“1/4 of the days were between 67° and 80°”
Explore Whole Class
59° 59° 60° 62° 62° 62° 62° 64° 65° 66° 67° 67° 70° 70° 80°
Sentence Starters
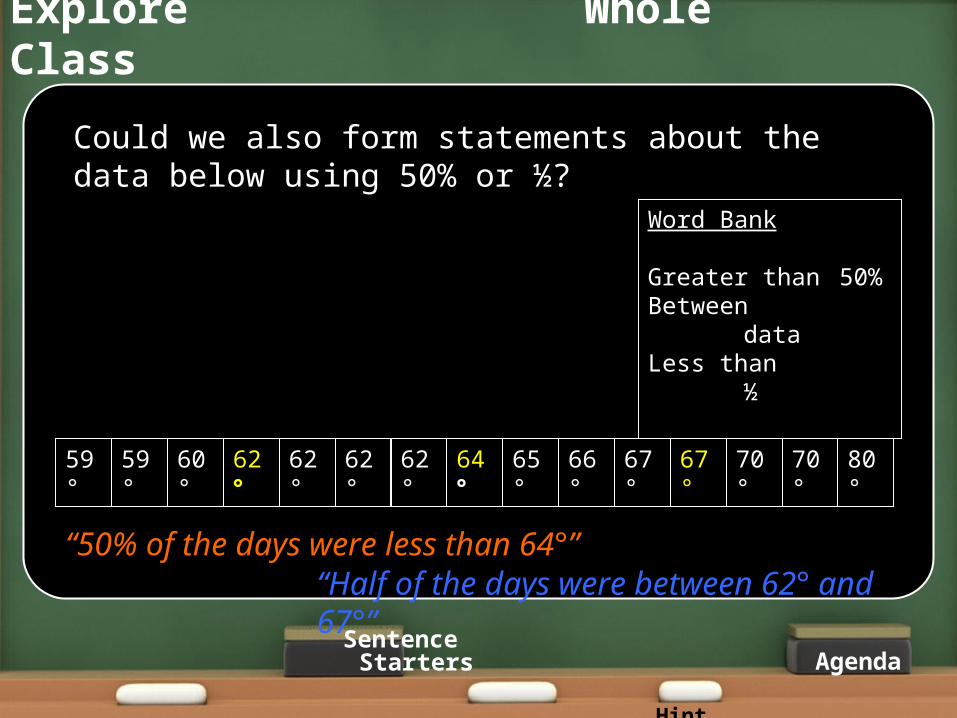
Could we also form statements about the data below using 50% or ½?
HintAgenda
Word Bank
Greater than 50%Between dataLess than ½
“50% of the days were less than 64°”“Half of the days were between 62° and 67°”
Explore Turn and Talk
31
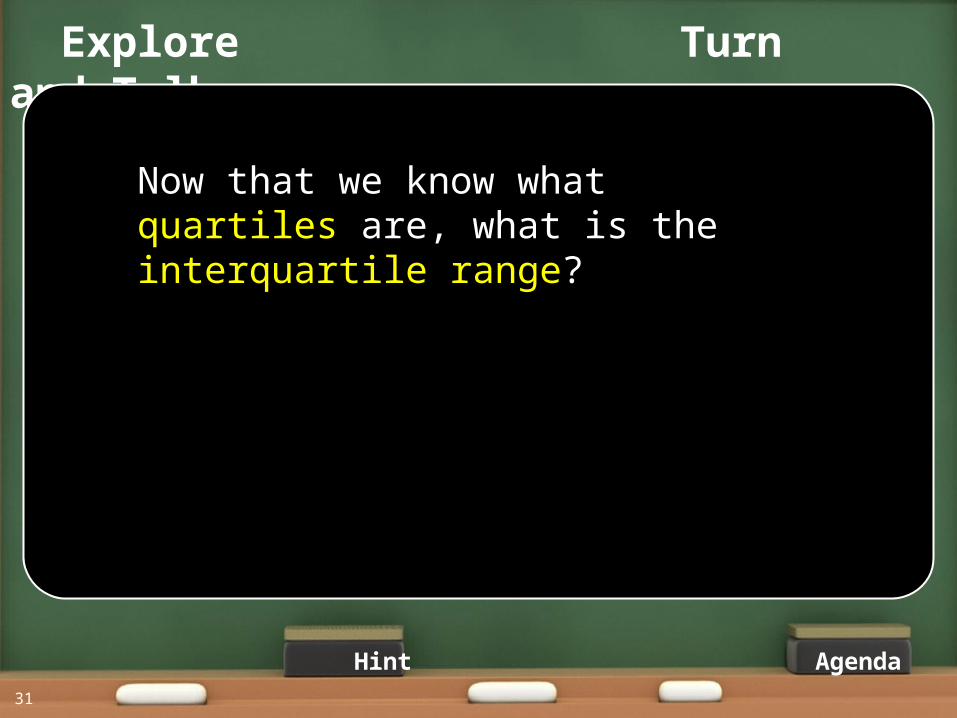
Now that we know what quartiles are, what is the interquartile range?
Hint Agenda
Explore Vocabulary
33
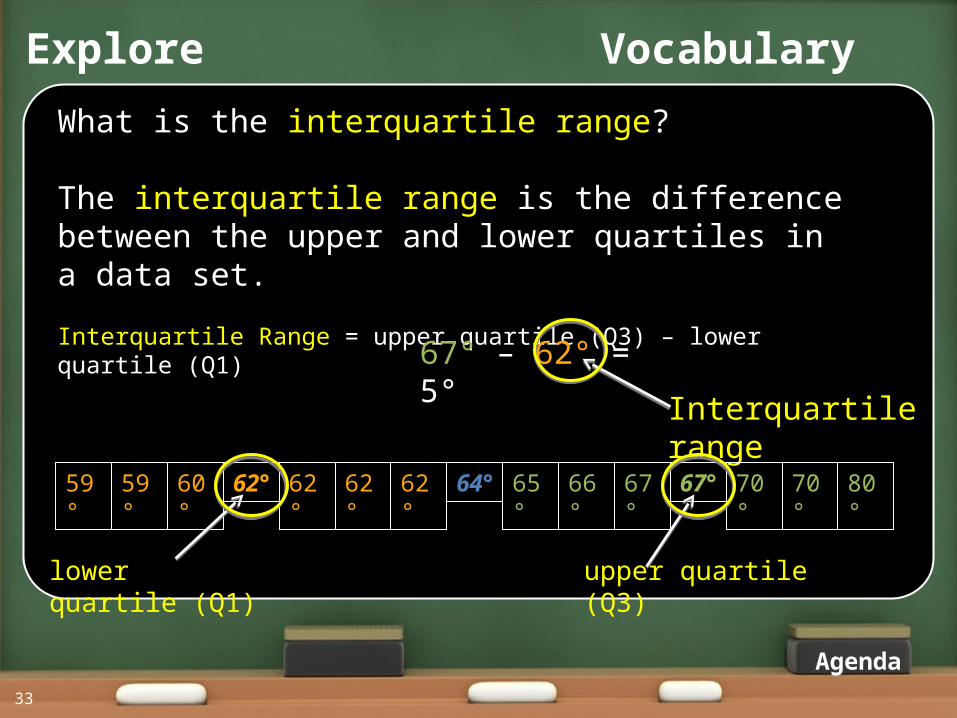
What is the interquartile range?
The interquartile range is the difference between the upper and lower quartiles in a data set.
Interquartile Range = upper quartile (Q3) – lower quartile (Q1)
67° – 62° = 5°
Interquartile range
59° 59° 60° 62° 62° 62° 62° 64° 65° 66° 67° 67° 70° 70° 80°
upper quartile (Q3)lower quartile (Q1)
Agenda
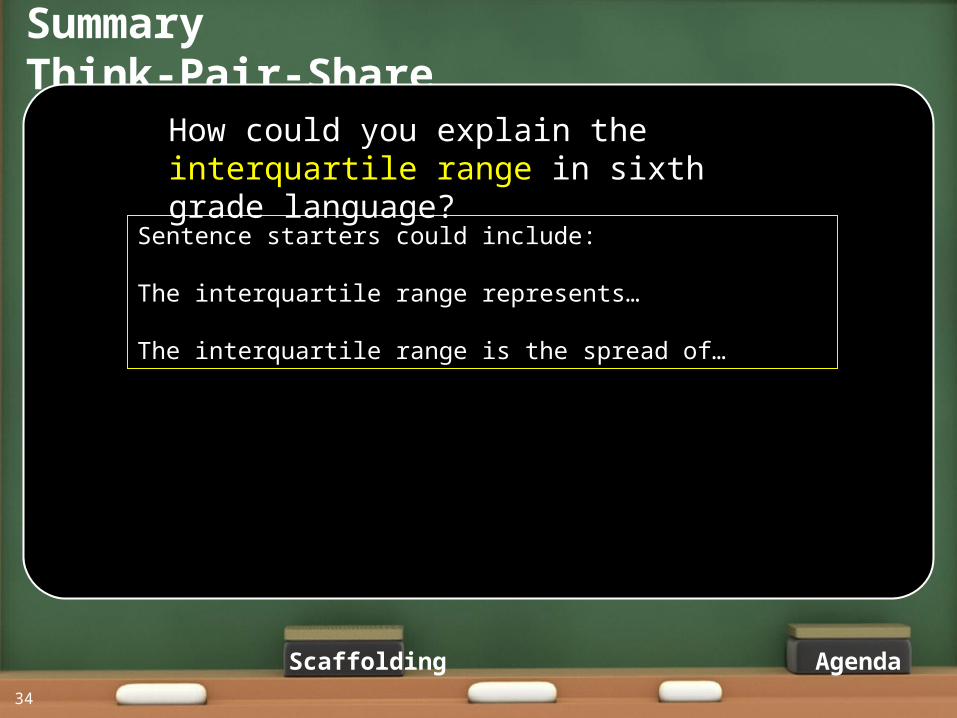
Summary Think-Pair-Share
34
AgendaScaffolding
Sentence starters could include:
The interquartile range represents…
The interquartile range is the spread of…
How could you explain the interquartile range in sixth grade language?
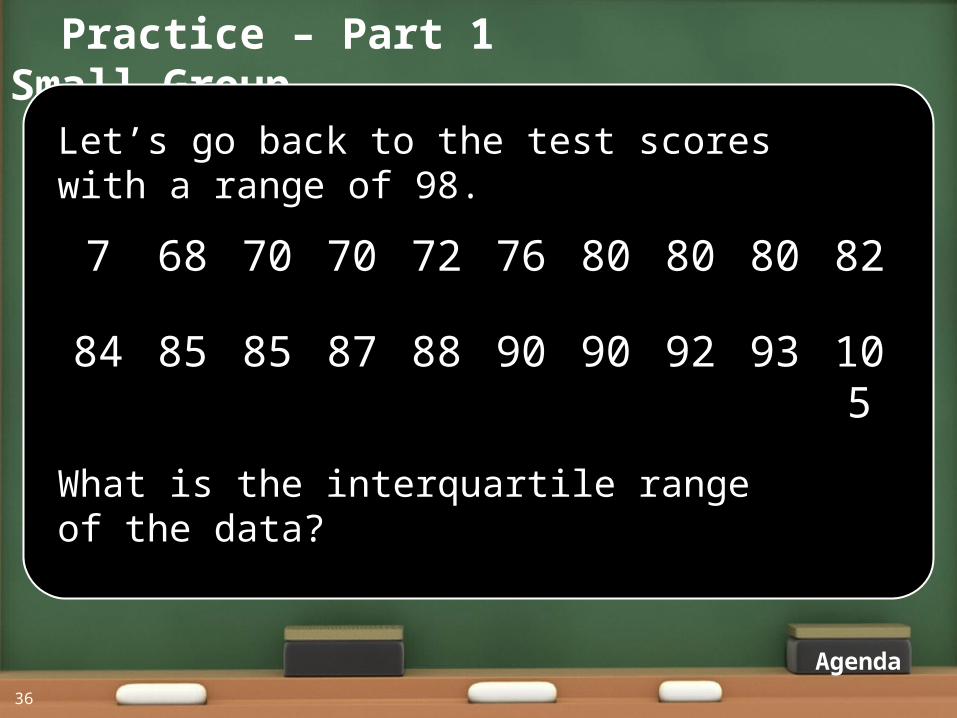
Practice – Part 1 Small Group
36
Let’s go back to the test scores with a range of 98.
Agenda
7 68 70 70 72 76 80 80 80 82
84 85 85 87 88 90 90 92 93 105
What is the interquartile range of the data?
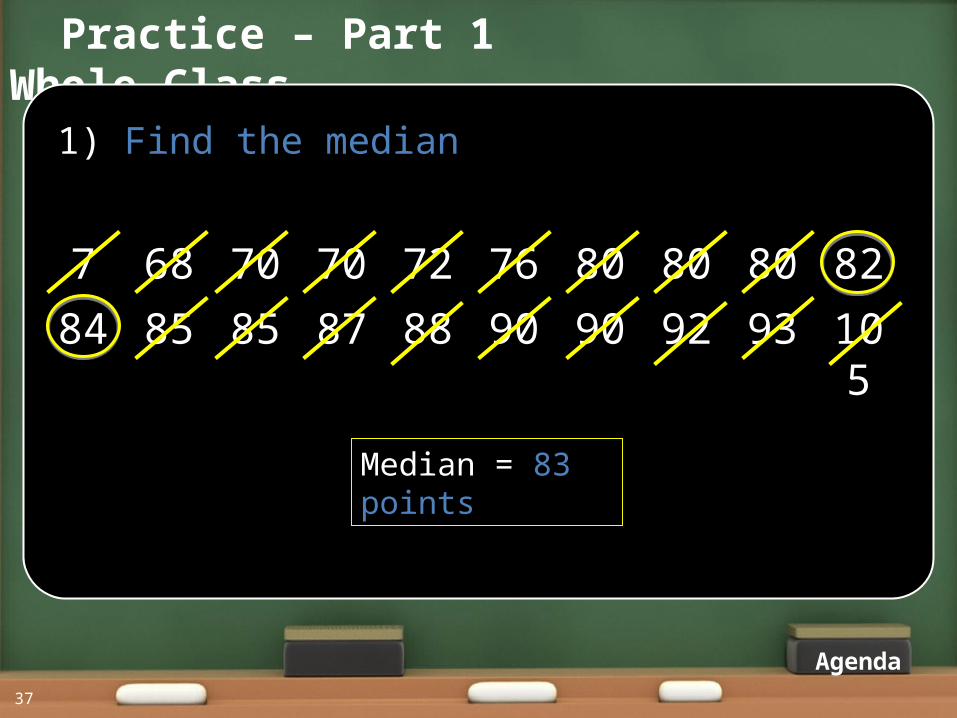
Practice – Part 1 Whole Class
37
1) Find the median
Agenda
7 68 70 70 72 76 80 80 80 82
84 85 85 87 88 90 90 92 93 105
Median = 83 points
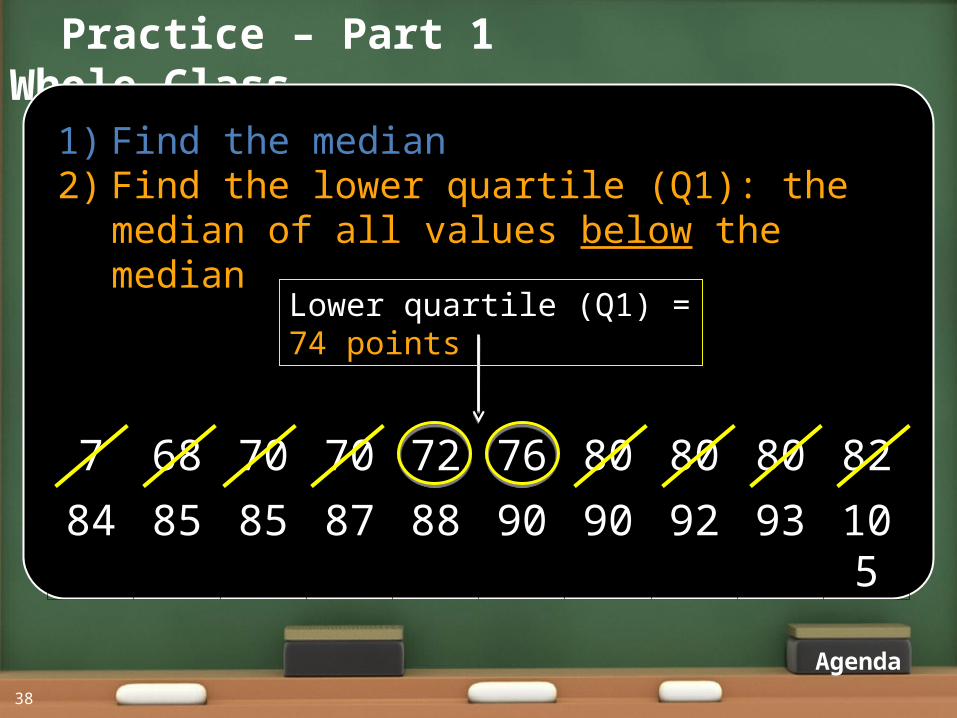
Practice – Part 1 Whole Class
38
1) Find the median2) Find the lower quartile (Q1): the median of all values
below the median
Agenda
7 68 70 70 72 76 80 80 80 82
84 85 85 87 88 90 90 92 93 105
Lower quartile (Q1) = 74 points
Practice – Part 1 Whole Class
39
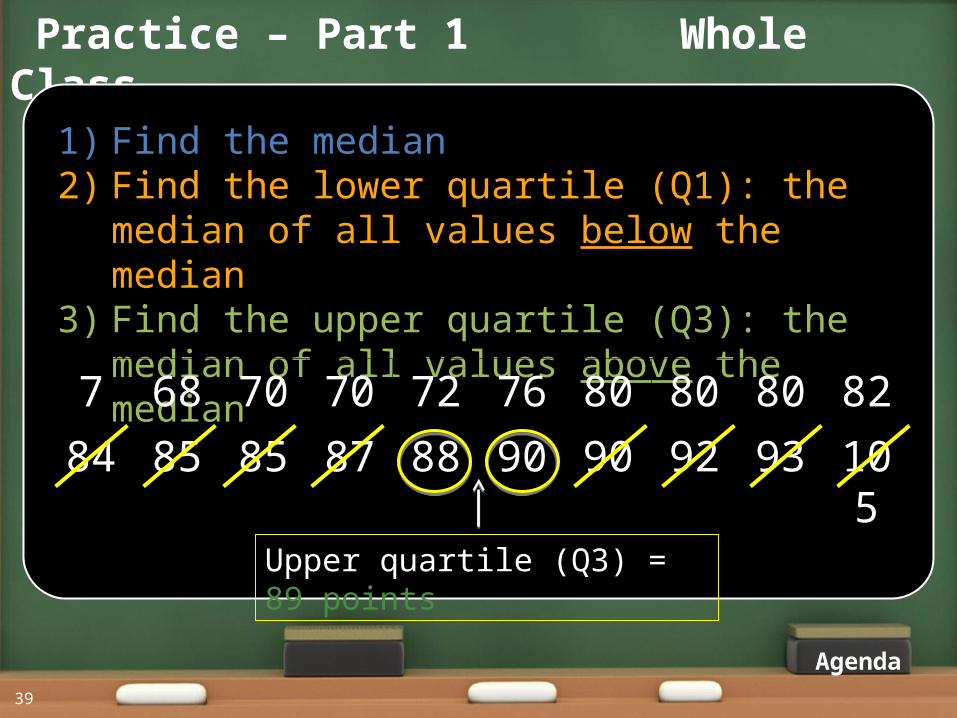
1) Find the median2) Find the lower quartile (Q1): the median of all values
below the median3) Find the upper quartile (Q3): the median of all
values above the median
Agenda
7 68 70 70 72 76 80 80 80 82
84 85 85 87 88 90 90 92 93 105
Upper quartile (Q3) = 89 points
Practice – Part 1 Whole Class
40
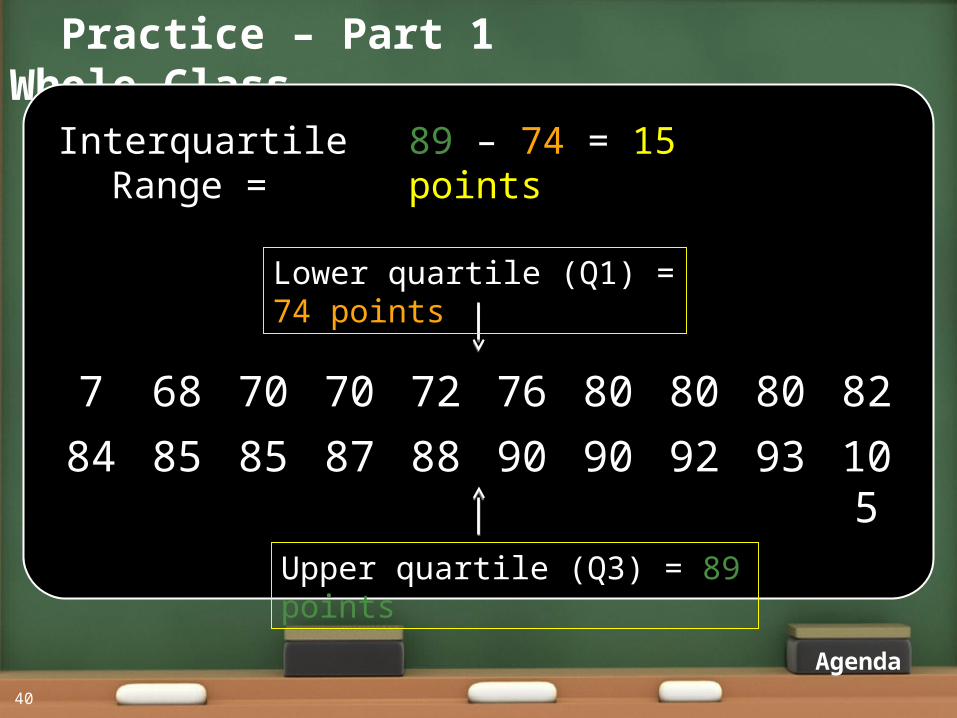
Interquartile Range =
Agenda
7 68 70 70 72 76 80 80 80 82
84 85 85 87 88 90 90 92 93 105
Upper quartile (Q3) = 89 points
Lower quartile (Q1) = 74 points
89 – 74 = 15 points
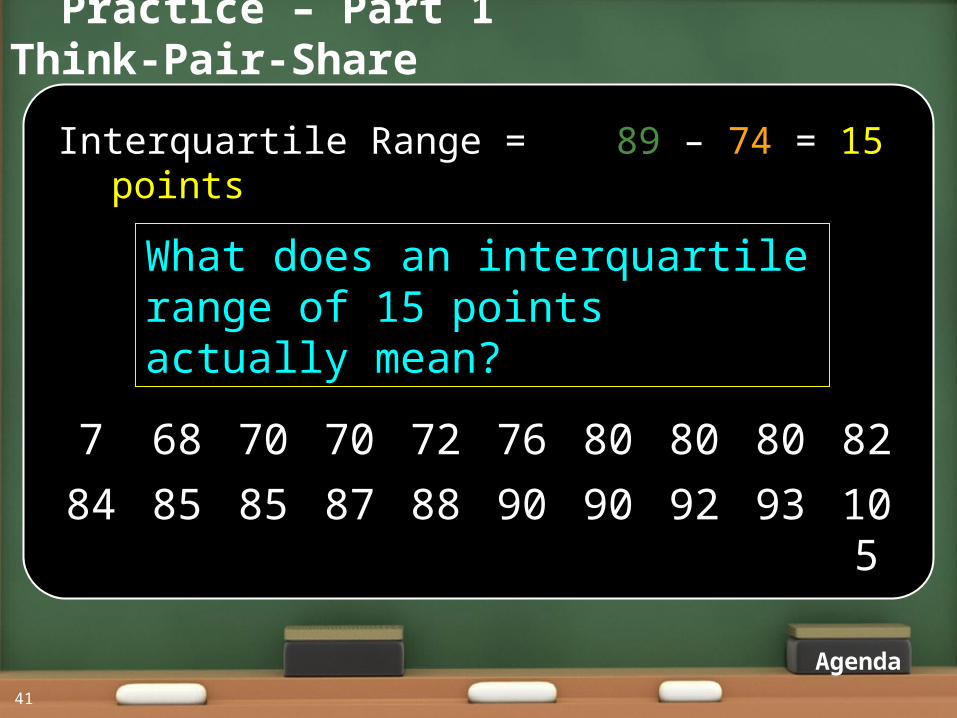
Practice – Part 1 Think-Pair-Share
41
Interquartile Range = 89 – 74 = 15 points
Agenda
7 68 70 70 72 76 80 80 80 82
84 85 85 87 88 90 90 92 93 105
What does an interquartile range of 15 points actually mean?
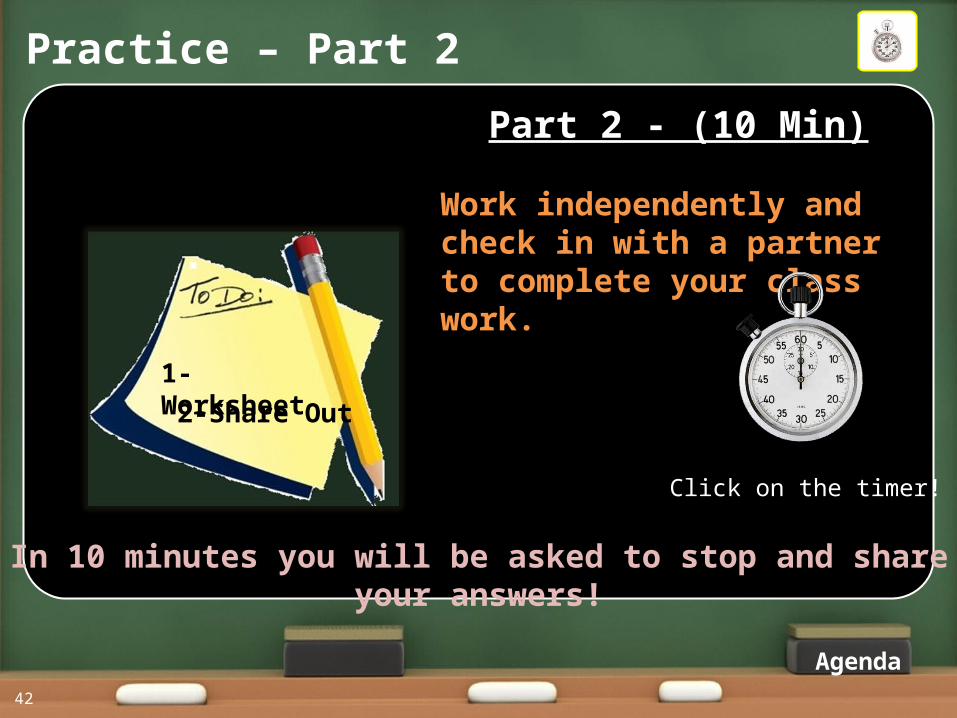
Practice – Part 2
42
Part 2 - (10 Min)
Work independently and check in with a partner to complete your class work.
1-Worksheet2-Share Out
In 10 minutes you will be asked to stop and share your answers!
Click on the timer!
Agenda
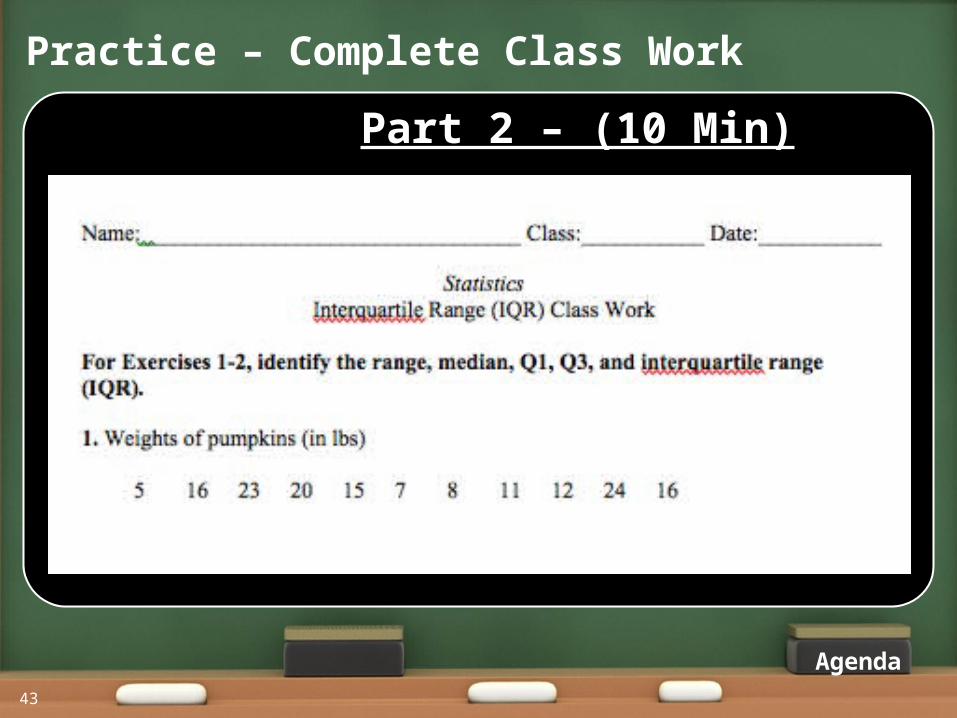
Practice – Complete Class Work
43
Part 2 – (10 Min)
Agenda
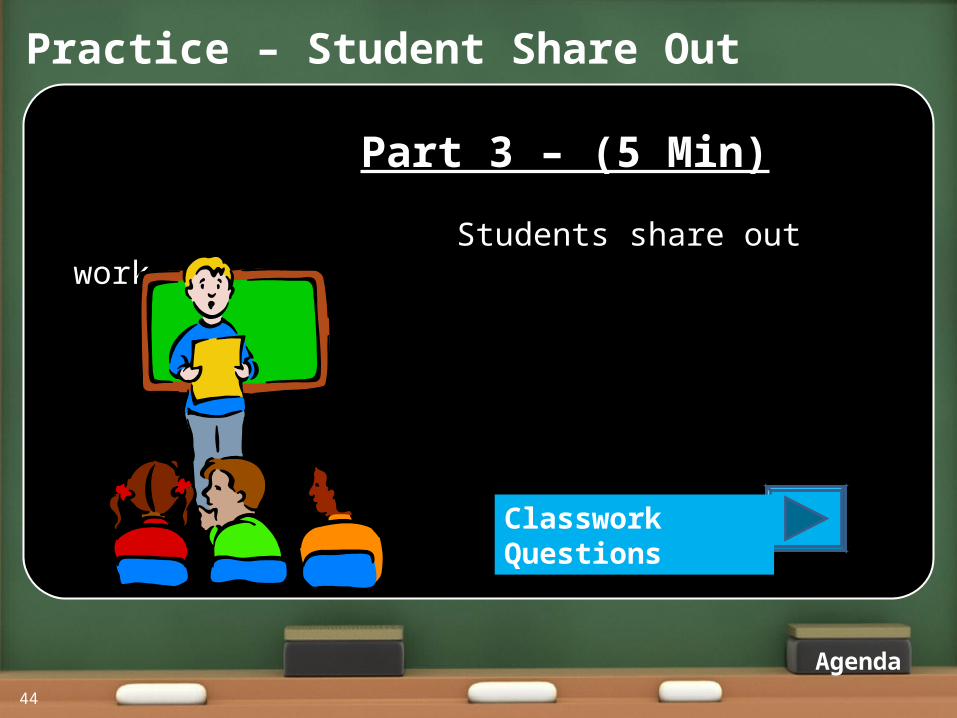
Practice – Student Share Out
44
Part 3 – (5 Min)
Students share out work.
Classwork Questions
Agenda
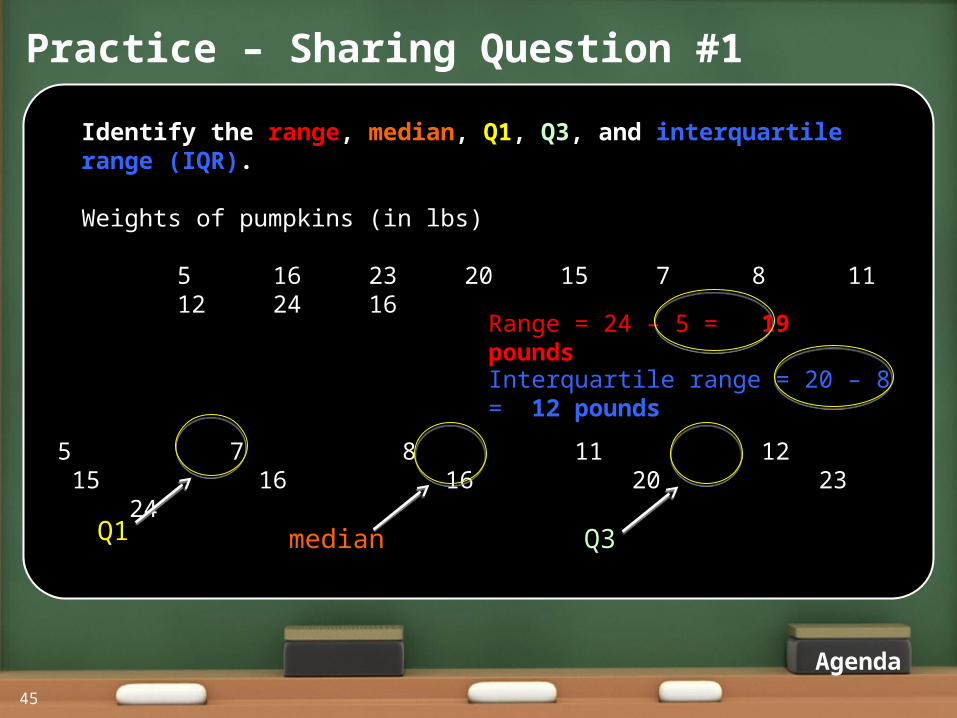
Practice – Sharing Question #1
45
Identify the range, median, Q1, Q3, and interquartile range (IQR). Weights of pumpkins (in lbs)
5 16 23 20 15 7 8 11 12 24 16
5 7 8 11 12 15 16 16 20 23 24
Range = 24 – 5 = 19 pounds
Interquartile range = 20 – 8 = 12 pounds
Agenda
medianQ1 Q3
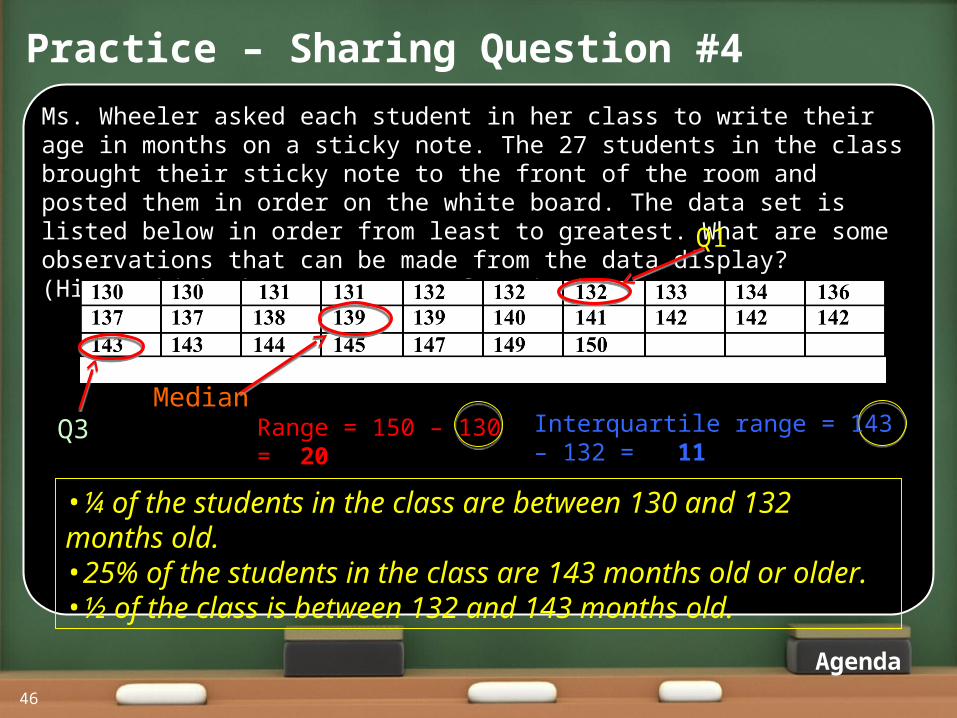
Practice – Sharing Question #4
46
Ms. Wheeler asked each student in her class to write their age in months on a sticky note. The 27 students in the class brought their sticky note to the front of the room and posted them in order on the white board. The data set is listed below in order from least to greatest. What are some observations that can be made from the data display? (Hint: Think about measures of variation)
Median
Q1
Q3 Range = 150 – 130 = 20
•¼ of the students in the class are between 130 and 132 months old.•25% of the students in the class are 143 months old or older.•½ of the class is between 132 and 143 months old.
Interquartile range = 143 – 132 = 11
Agenda
Practice – Sharing Question #5
47
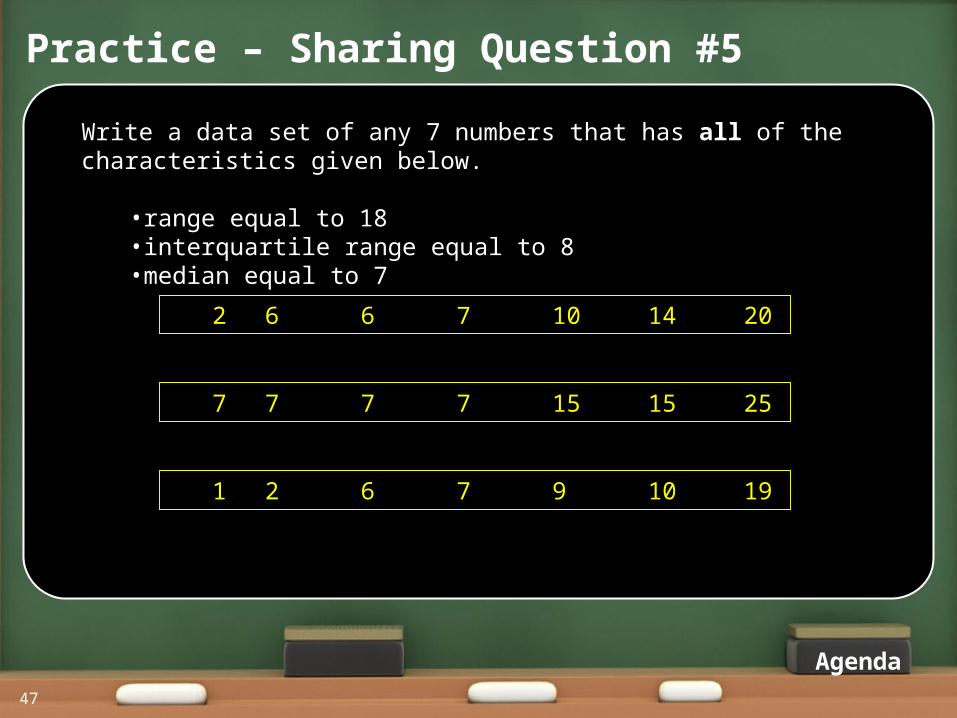
Write a data set of any 7 numbers that has all of the characteristics given below.
•range equal to 18•interquartile range equal to 8•median equal to 7
2 6 6 7 10 14 20
7 7 7 7 15 15 25
1 2 6 7 9 10 19
Agenda
Assessment - Exit Ticket Individual
48
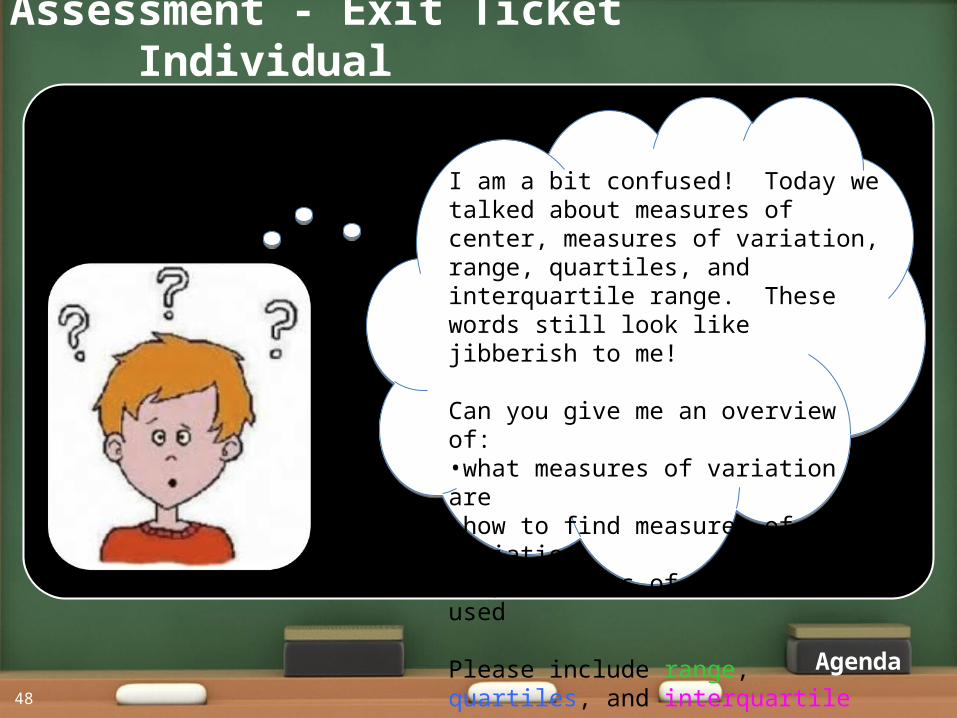
I am a bit confused! Today we talked about measures of center, measures of variation, range, quartiles, and interquartile range. These words still look like jibberish to me!
Can you give me an overview of:•what measures of variation are•how to find measures of variation •why measures of variation are used
Please include range, quartiles, and interquartile range in your explanation.
Agenda
The goal of 21st Century Lessons is simple: We want to assist teachers, particularly in urban and turnaround schools, by bringing together teams of exemplary educators to develop units of high-quality, model lessons. These lessons are intended to:
•Support an increase in student achievement; •Engage teachers and students; •Align to the National Common Core Standards and the Massachusetts curriculum frameworks;•Embed best teaching practices, such as differentiated instruction; •Incorporate high-quality multi-media and design (e.g., PowerPoint); •Be delivered by exemplary teachers for videotaping to be used for professional
development and other teacher training activities; •Be available, along with videos and supporting materials, to teachers free of charge via the
Internet. •Serve as the basis of high-quality, teacher-led professional development, including mentoring between experienced and novice teachers.
21st Century LessonsThe goal…
57
Directors:Kathy Aldred - Co-Chair of the Boston Teachers Union Professional Issues CommitteeTed Chambers - Co-director of 21st Century LessonsTracy Young - Staffing Director of 21st Century LessonsLeslie Ryan Miller - Director of the Boston Public Schools Office of
Teacher Development and AdvancementEmily Berman- Curriculum Director (Social Studies) of 21st Century LessonsCarla Zils – Curriculum Director (Math) of 21st Century LessonsBrian Connor – Technology Coordinator
21st Century Lessons
The people…
58