Embed Size (px)
Citation preview
10/96 Solid Waste Disposal 2.1-1
2.1 Refuse Combustion
Refuse combustion involves the burning of garbage and other nonhazardous solids, commonlycalled municipal solid waste (MSW). Types of combustion devices used to burn refuse include singlechamber units, multiple chamber units, and trench incinerators.
2.1.1 General1-3
As of January 1992, there were over 160 municipal waste combustor (MWC) plants operating inthe United States with capacities greater than 36 megagrams per day (Mg/day) (40 tons per day [tpd]), witha total capacity of approximately 100,000 Mg/day (110,000 tpd of MSW).1 It is projected that by 1997,the total MWC capacity will approach 150,000 Mg/day (165,000 tpd), which represents approximately28 percent of the estimated total amount of MSW generated in the United States by the year 2000.
Federal regulations for MWCs are currently under 3 subparts of 40 CFR Part 60. Subpart Ecovers MWC units that began construction after 1971 and have capacities to combust over 45 Mg/day(50 tpd) of MSW. Subpart Ea establishes new source performance standards (NSPS) for MWC unitswhich began construction or modification after December 20, 1989 and have capacities over 225 Mg/day(250 tpd). An emission guideline (EG) was established under Subpart Ca covering MWC units whichbegan construction or modification prior to December 20, 1989 and have capacities of greater than225 Mg/day (250 tpd). The Subpart Ea and Ca regulations were promulgated on February 11, 1991.
Subpart E includes a standard for particulate matter (PM). Subparts Ca and Ea currently establishstandards for PM, tetra- through octa- chlorinated dibenzo-p-dioxin/chlorinated dibenzofurans(CDD/CDF), hydrogen chloride (HCl), sulfur dioxide (SO2), nitrogen oxides (NOx) (Subpart Ea only), andcarbon monoxide (CO). Additionally, standards for mercury (Hg), lead (Pb), cadmium (Cd), and NOx (forSubpart Ca) are currently being considered for new and existing facilities, as required by Section 129 of theClean Air Act Amendments (CAAA) of 1990.
In addition to requiring revisions of the Subpart Ca and Ea regulations to include these additionalpollutants, Section 129 also requires the EPA to review the standards and guidelines for the pollutantscurrently covered under these subparts. It is likely that the revised regulations will be more stringent. Theregulations are also being expanded to cover new and existing MWC facilities with capacities of225 Mg/day (250 tpd) or less. The revised regulations will likely cover facilities with capacities as low as18 to 45 Mg/day (20 to 50 tpd). These facilities are currently subject only to State regulations.
2.1.1.1 Combustor Technology -There are 3 main classes of technologies used to combust MSW: mass burn, refuse-derived fuel
(RDF), and modular combustors. This section provides a general description of these 3 classes ofcombustors. Section 2.1.2 provides more details regarding design and operation of each combustor class.
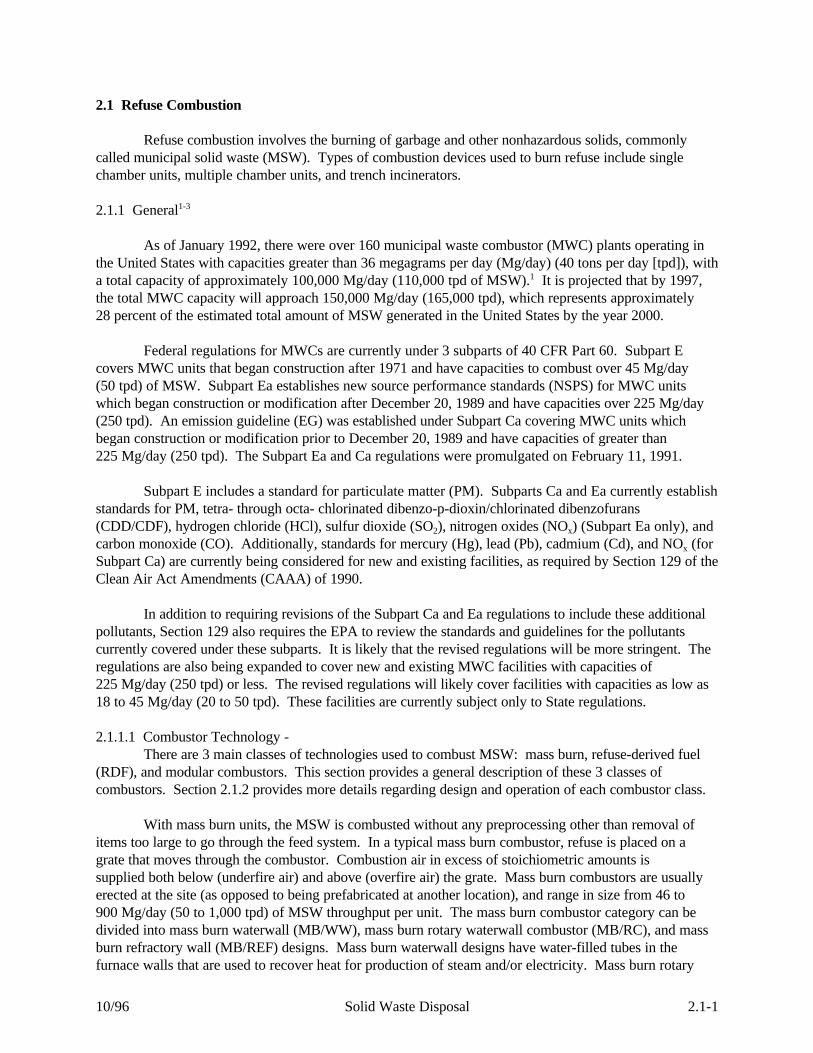
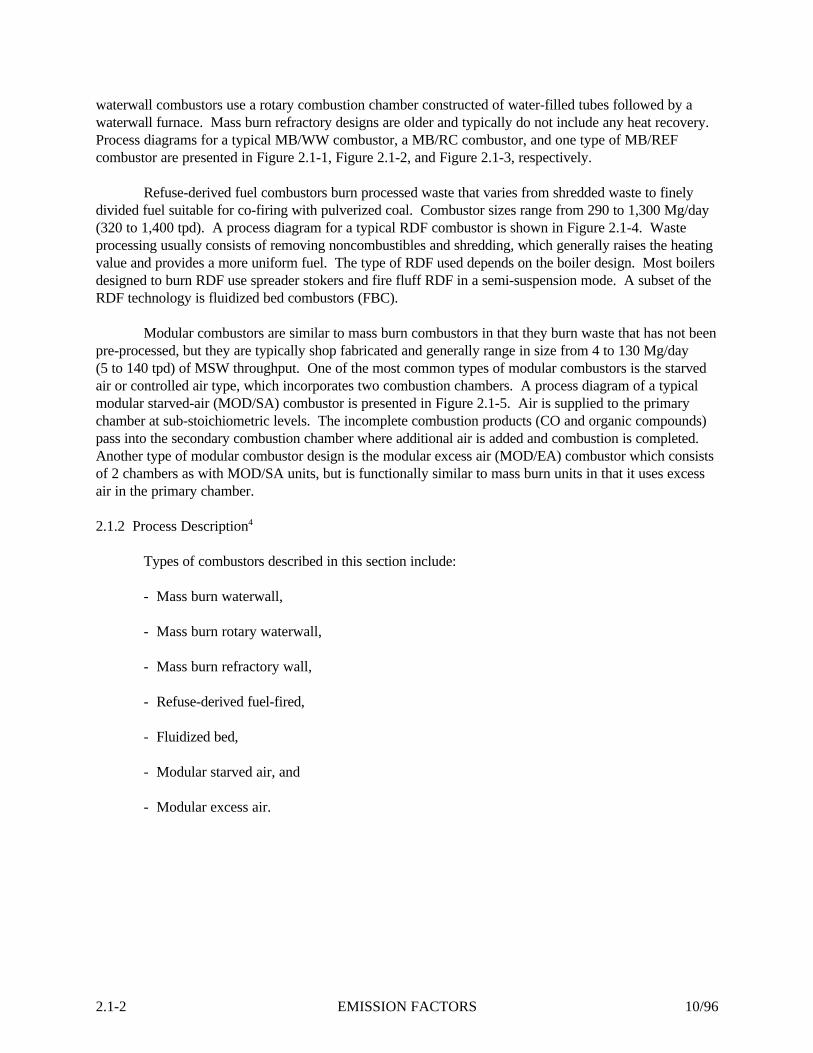
With mass burn units, the MSW is combusted without any preprocessing other than removal ofitems too large to go through the feed system. In a typical mass burn combustor, refuse is placed on agrate that moves through the combustor. Combustion air in excess of stoichiometric amounts is supplied both below (underfire air) and above (overfire air) the grate. Mass burn combustors are usuallyerected at the site (as opposed to being prefabricated at another location), and range in size from 46 to900 Mg/day (50 to 1,000 tpd) of MSW throughput per unit. The mass burn combustor category can bedivided into mass burn waterwall (MB/WW), mass burn rotary waterwall combustor (MB/RC), and massburn refractory wall (MB/REF) designs. Mass burn waterwall designs have water-filled tubes in thefurnace walls that are used to recover heat for production of steam and/or electricity. Mass burn rotary
2.1-2 EMISSION FACTORS 10/96
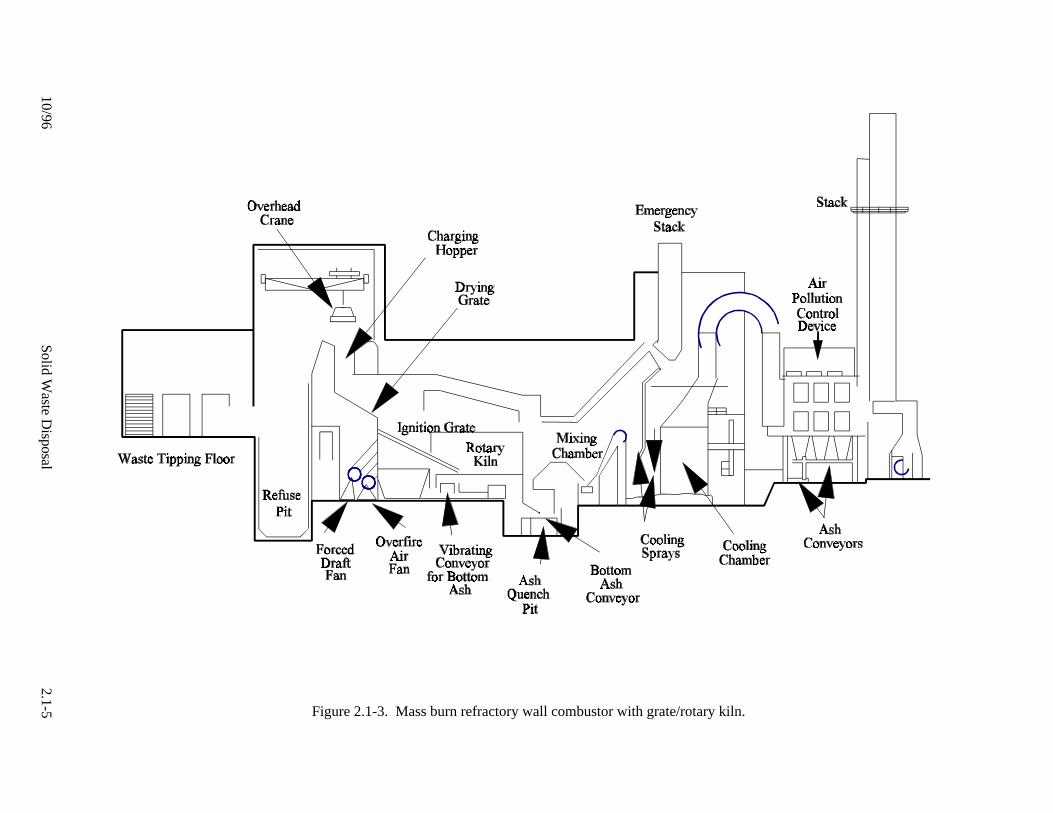
waterwall combustors use a rotary combustion chamber constructed of water-filled tubes followed by awaterwall furnace. Mass burn refractory designs are older and typically do not include any heat recovery. Process diagrams for a typical MB/WW combustor, a MB/RC combustor, and one type of MB/REFcombustor are presented in Figure 2.1-1, Figure 2.1-2, and Figure 2.1-3, respectively.
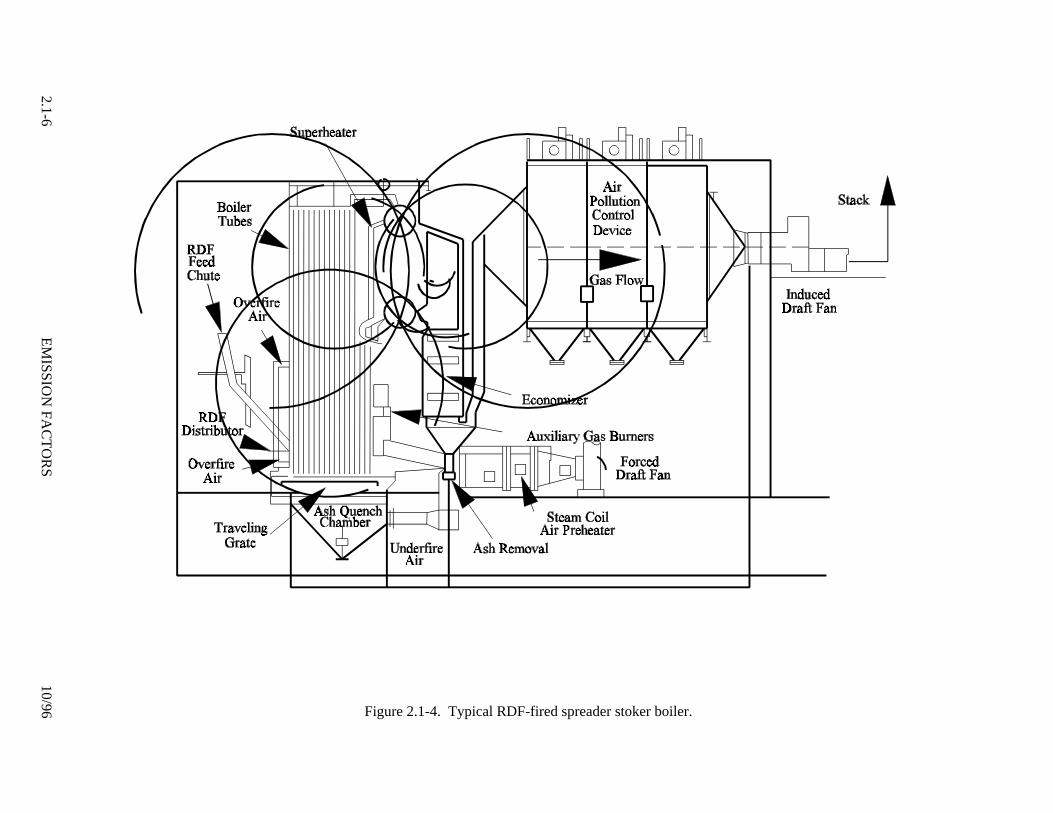
Refuse-derived fuel combustors burn processed waste that varies from shredded waste to finelydivided fuel suitable for co-firing with pulverized coal. Combustor sizes range from 290 to 1,300 Mg/day(320 to 1,400 tpd). A process diagram for a typical RDF combustor is shown in Figure 2.1-4. Wasteprocessing usually consists of removing noncombustibles and shredding, which generally raises the heatingvalue and provides a more uniform fuel. The type of RDF used depends on the boiler design. Most boilersdesigned to burn RDF use spreader stokers and fire fluff RDF in a semi-suspension mode. A subset of theRDF technology is fluidized bed combustors (FBC).
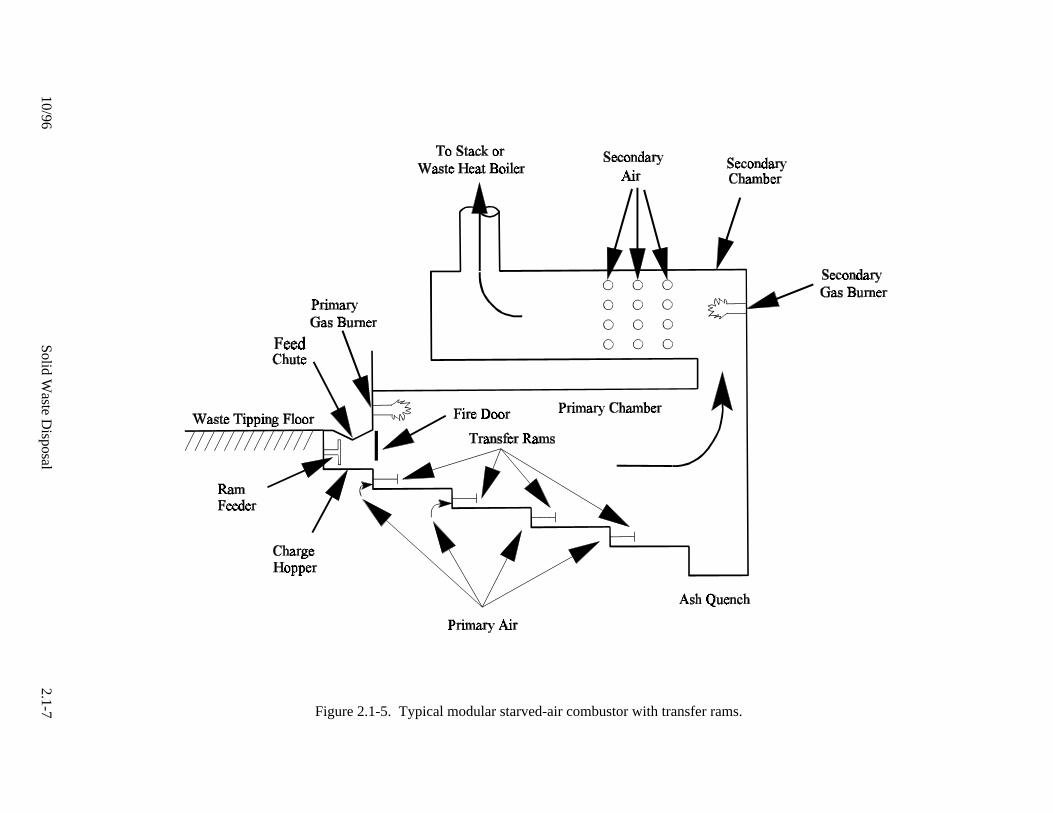
Modular combustors are similar to mass burn combustors in that they burn waste that has not beenpre-processed, but they are typically shop fabricated and generally range in size from 4 to 130 Mg/day(5 to 140 tpd) of MSW throughput. One of the most common types of modular combustors is the starvedair or controlled air type, which incorporates two combustion chambers. A process diagram of a typicalmodular starved-air (MOD/SA) combustor is presented in Figure 2.1-5. Air is supplied to the primarychamber at sub-stoichiometric levels. The incomplete combustion products (CO and organic compounds)pass into the secondary combustion chamber where additional air is added and combustion is completed. Another type of modular combustor design is the modular excess air (MOD/EA) combustor which consistsof 2 chambers as with MOD/SA units, but is functionally similar to mass burn units in that it uses excessair in the primary chamber.
2.1.2 Process Description4
Types of combustors described in this section include:
- Mass burn waterwall,
- Mass burn rotary waterwall,
- Mass burn refractory wall,
- Refuse-derived fuel-fired,
- Fluidized bed,
- Modular starved air, and
- Modular excess air.
10/96Solid W
aste Disposal
2.1-3 Figure 2.1-1. Typical mass burn waterfall combustor.
2.1-4E
MISSIO
N FA
CT
OR
S10/96 Figure 2.1-2. Simplified process flow diagram for a rotary waterwall combustor.
10/96Solid W
aste Disposal
2.1-5 Figure 2.1-3. Mass burn refractory wall combustor with grate/rotary kiln.
2.1-6E
MISSIO
N FA
CT
OR
S10/96 Figure 2.1-4. Typical RDF-fired spreader stoker boiler.
10/96Solid W
aste Disposal
2.1-7 Figure 2.1-5. Typical modular starved-air combustor with transfer rams.
2.1-8 EMISSION FACTORS 10/96
2.1.2.1 Mass Burn Waterwall Combustors -The MB/WW design represents the predominant technology in the existing population of large
MWCs, and it is expected that over 50 percent of new units will be MB/WW designs. In MB/WW units,the combustor walls are constructed of metal tubes that contain circulating pressurized water used torecover heat from the combustion chamber. In the lower actively burning region of the chamber wherecorrosive conditions may exist, the walls are generally lined with castable refractory. Heat is alsorecovered in the convective sections (i. e., superheater, economizer) of the combustor.
With this type of system, unprocessed waste (after removal of large, bulky items) is delivered by anoverhead crane to a feed hopper, which conveys the waste into the combustion chamber. Earlier MB/WWdesigns utilized gravity feeders, but it is now more typical to feed by means of single or dual hydraulicrams.
Nearly all modern MB/WW facilities utilize reciprocating grates or roller grates to move the wastethrough the combustion chamber. The grates typically include 3 sections. On the initial grate section,referred to as the drying grate, the moisture content of the waste is reduced prior to ignition. The secondgrate section, referred to as the burning grate, is where the majority of active burning takes place. Thethird grate section, referred to as the burnout or finishing grate, is where remaining combustibles in thewaste are burned. Smaller units may have only 2 individual grate sections. Bottom ash is discharged fromthe finishing grate into a water-filled ash quench pit or ram discharger. From there, the moist ash isdischarged to a conveyor system and transported to an ash load-out or storage area prior to disposal. Dryash systems have been used in some designs, but their use is not widespread.
Combustion air is added from beneath the grate by way of underfire air plenums. The majority ofMB/WW systems supply underfire air to the individual grate sections through multiple plenums, whichenhance the ability to control burning and heat release from the waste bed. Overfire air is injected throughrows of high-pressure nozzles located in the side walls of the combustor to oxidize fuel-rich gases evolvedfrom the bed and complete the combustion process. Properly designed and operated overfire air systemsare essential for good mixing and burnout of organics in the flue gas. Typically, MB/WW MWCs areoperated with 80 to 100 percent excess air.
The flue gas exits the combustor and passes through additional heat recovery sections to one or more air pollution control devices (APCD). The types of APCDs that may be used are discussed inSection 2.1.4.
2.1.2.2 Mass Burn Rotary Waterwall Combustors -A more unique mass burn design is the MB/RC. Plants of this design range in size from 180 to
2,400 Mg/day (200 to 2,700 tpd), with typically 2 or 3 units per plant. This type of system uses a rotarycombustion chamber. Following pre-sorting of objects too large to fit in the combustor, the waste is ramfed to the inclined rotary combustion chamber, which rotates slowly, causing the waste to advance andtumble as it burns. Underfire air is injected through the waste bed, and overfire air is provided above thewaste bed. Bottom ash is discharged from the rotary combustor to an afterburner grate and then into a wetquench pit. From there, the moist ash is conveyed to an ash load-out or storage area prior to disposal.
Approximately 80 percent of the combustion air is provided along the rotary combustion chamberlength, with most of the air provided in the first half of the chamber. The rest of the combustion air issupplied to the afterburner grate and above the rotary combustor outlet in the boiler. The MB/RC operatesat about 50 percent excess air, compared with 80 to 100 percent for typical MB/WW firing systems. Water flowing through the tubes in the rotary chamber recovers heat from combustion. Additional heatrecovery occurs in the boiler waterwall, superheater, and economizer. From the economizer, the flue gas is
10/96 Solid Waste Disposal 2.1-9
typically routed to APCDs.
2.1.2.3 Mass Burn Refractory Wall Combustors -Prior to 1970 there were numerous MB/REF MWCs in operation. The purpose of these plants
was to achieve waste reduction; energy recovery was generally not incorporated in their design. Most ofthe roughly 25 MB/REF plants that still operate or that were built in the 1970s and 1980s use electrostaticprecipitators (ESPs) to reduce PM emissions, and several have heat recovery boilers. Most MB/REFcombustors have unit sizes of 90 to 270 Mg/day (100 to 300 tpd). It is not expected that additional plantsof this design will be built in the United States.
The MB/REF combustors comprise several designs. One design involves a batch-fed uprightcombustor, which may be cylindrical or rectangular in shape. A second design is based on a rectangularcombustion chamber with a traveling, rocking, or reciprocating grate. This type of combustor iscontinuously fed and operates in an excess air mode. If the waste is moved on a traveling grate, it is notsufficiently aerated as it advances through the combustor. As a result, waste burnout or completecombustion is inhibited by fuel bed thickness, and there is considerable potential for unburned waste to bedischarged into the bottom ash pit. Rocking and reciprocating grate systems stir and aerate the waste bedas it advances through the combustion chamber, thereby improving contact between the waste andcombustion air and increasing the burnout of combustibles. The system generally discharges the ash at theend of the grate to a water quench pit for collection and disposal in a landfill.
Because MB/REF combustors do not contain a heat transfer medium (such as the waterwalls thatare present in modern energy recovery units), they typically operate at higher excess air rates (150 to300 percent) than MB/WW combustors (80 to 100 percent). The higher excess air levels are required toprevent excessive temperatures, which can result in refractory damage, slagging, fouling, and corrosionproblems. One adverse effect of higher excess air levels is the potential for increased carryover of PMfrom the combustion chamber and, ultimately, increased stack emission rates. High PM carryover mayalso contribute to increased CDD/CDF emissions by providing increased surface area for downstreamcatalytic formation to take place. A second problem is the potential for high excess air levels to quench(cool) the combustion reactions, preventing thermal destruction of organic species.
An alternate, newer MB/REF combustor is the Volund design (Figure 2.1-3 presents this MB/REFdesign). This design minimizes some of the problems of other MB/REF systems. A refractory arch isinstalled above the combustion zone to reduce radiant heat losses and improve solids burnout. Therefractory arch also routes part of the rising gases from the drying and combustion grates through a gas by-pass duct to the mixing chamber. There the gas is mixed with gas from the burnout grate or kiln. Bottomash is conveyed to an ash quench pit. Volund MB/REF combustors operate with 80 to 120 percent excessair, which is more in line with excess air levels in the MB/WW designs. As a result, lower CO levels andbetter organics destruction are achievable, as compared to other MB/REF combustors.
2.1.2.4 Refuse-derived Fuel Combustors -Refuse-derived fuel combustors burn MSW that has been processed to varying degrees, from
simple removal of bulky and noncombustible items accompanied by shredding, to extensive processing toproduce a finely divided fuel suitable for co-firing in pulverized coal-fired boilers. Processing MSW toRDF generally raises the heating value of the waste because many of the noncombustible items areremoved.
A set of standards for classifying RDF types has been established by the American Society forTesting and Materials. The type of RDF used is dependent on the boiler design. Boilers that are designedto burn RDF as the primary fuel usually utilize spreader stokers and fire fluff RDF in a semi-suspension
2.1-10 EMISSION FACTORS 10/96
mode. This mode of feeding is accomplished by using an air swept distributor, which allows a portion ofthe RDF to burn in suspension and the remainder to be burned out after falling on a horizontal travelinggrate. The number of RDF distributors in a single unit varies directly with unit capacity. The distributorsare normally adjustable so that the trajectory of the waste feed can be varied. Because the traveling gratemoves from the rear to the front of the furnace, distributor settings are adjusted so that most of the wastelands on the rear two-thirds of the grate. This allows more time for combustion to be completed on thegrate. Bottom ash drops into a water-filled quench chamber. Some traveling grates operate at a singlespeed, but most can be manually adjusted to accommodate variations in burning conditions. Underfire airis normally preheated and introduced beneath the grate by a single plenum. Overfire air is injected throughrows of high-pressure nozzles, providing a zone for mixing and completion of the combustion process. These combustors typically operate at 80 to 100 percent excess air.
Due to the basic design of the semi-suspension feeding systems, PM levels at the inlet to thepollution control device are typically double those of mass burn systems and more than an order ofmagnitude higher than MOD/SA combustors. The higher particulate loadings may contribute to thecatalytic formation of CDD/CDF. However, controlled Hg emissions from these plants are considerablylower than from mass burn plants as a result of the higher levels of carbon present in the PM carryover, asHg adsorbs onto the carbon and can be subsequently captured by the PM control device.
Pulverized coal (PC)-fired boilers can co-fire fluff RDF or powdered RDF. In a PC-fired boilerthat co-fires fluff with pulverized coal, the RDF is introduced into the combustor by air transport injectorsthat are located above or even with the coal nozzles. Due to its high moisture content and large particlesize, RDF requires a longer burnout time than coal. A significant portion of the larger, partially burnedparticles disengage from the gas flow and fall onto stationary drop grates at the bottom of the furnacewhere combustion is completed. Ash that accumulates on the grate is periodically dumped into the ashhopper below the grate. Refuse-derived fuel can also be co-fired with coal in stoker-fired boilers.
2.1.2.5 Fluidized Bed Combustors -In an FBC, fluff or pelletized RDF is combusted on a turbulent bed of noncombustible material
such as limestone, sand, or silica. In its simplest form, an FBC consists of a combustor vessel equippedwith a gas distribution plate and underfire air windbox at the bottom. The combustion bed overlies the gasdistribution plate. The combustion bed is suspended or "fluidized" through the introduction of underfire airat a high flow rate. The RDF may be injected into or above the bed through ports in the combustor wall. Other wastes and supplemental fuel may be blended with the RDF outside the combustor or added into thecombustor through separate openings. Overfire air is used to complete the combustion process.
There are 2 basic types of FBC systems: bubbling bed and circulating bed. With bubbling bedcombustors, most of the fluidized solids are maintained near the bottom of the combustor by usingrelatively low air fluidization velocities. This helps reduce the entrainment of solids from the bed into theflue gas, minimizing recirculation or reinjection of bed particles. In contrast, circulating bed combustorsoperate at relatively high fluidization velocities to promote carryover of solids into the upper section of thecombustor. Combustion occurs in both the bed and upper section of the combustor. By design, a fractionof the bed material is entrained in the combustion gas and enters a
10/96 Solid Waste Disposal 2.1-11
cyclone separator which recycles unburned waste and inert particles to the lower bed. Some of the ash isremoved from the cyclone with the solids from the bed.
Good mixing is inherent in the FBC design. Fluidized bed combustors have very uniform gastemperatures and mass compositions in both the bed and in the upper region of the combustor. This allowsthe FBCs to operate at lower excess air and temperature levels than conventional combustion systems. Waste-fired FBCs typically operate at excess air levels between 30 and 100 percent and at bedtemperatures around 815EC (1,500EF). Low temperatures are necessary for waste-firing FBCs becausehigher temperatures lead to bed agglomeration.
2.1.2.6 Modular Starved-air (Controlled-air) Combustors -In terms of number of facilities, MOD/SA combustors represent a large segment of the existing
MWC population. However, because of their small sizes, they account for only a small percent of the totalcapacity. The basic design of a MOD/SA combustor consists of 2 separate combustion chambers, referredto as the "primary" and "secondary" chambers. Waste is batch-fed to the primary chamber by ahydraulically activated ram. The charging bin is filled by a front end loader or other means. Waste is fedautomatically on a set frequency, with generally 6 to 10 minutes between charges.
Waste is moved through the primary combustion chamber by either hydraulic transfer rams orreciprocating grates. Combustors using transfer rams have individual hearths upon which combustiontakes place. Grate systems generally include 2 separate grate sections. In either case, waste retention timesin the primary chamber are long, lasting up to 12 hours. Bottom ash is usually discharged to a wet quenchpit.
The quantity of air introduced into the primary chamber defines the rate at which waste burns. Combustion air is introduced in the primary chamber at sub-stoichiometric levels, resulting in a flue gasrich in unburned hydrocarbons. The combustion air flow rate to the primary chamber is controlled tomaintain an exhaust gas temperature set point, generally 650 to 980EC (1,200 to 1,800EF), whichcorresponds to about 40 to 60 percent theoretical air.
As the hot, fuel-rich flue gases flow to the secondary chamber, they are mixed with additional airto complete the burning process. Because the temperature of the exhaust gases from the primary chamberis above the autoignition point, completing combustion is simply a matter of introducing air into thefuel-rich gases. The amount of air added to the secondary chamber is controlled to maintain a desired fluegas exit temperature, typically 980 to 1,200EC (1,800 to 2,200EF). Approximately 80 percent of the totalcombustion air is introduced as secondary air. Typical excess air levels vary from 80 to 150 percent.
The walls of both combustion chambers are refractory lined. Early MOD/SA combustors did notinclude energy recovery, but a waste heat boiler is common in newer installations, with 2 or morecombustion modules manifolded to a single boiler. Combustors with energy recovery capabilities alsomaintain dump stacks for use in an emergency, or when the boiler and/or air pollution control equipmentare not in operation.
Most MOD/SA MWCs are equipped with auxiliary fuel burners located in both the primary andsecondary combustion chambers. Auxiliary fuel can be used during startup (many modular units do notoperate continuously) or when problems are experienced maintaining desired combustion temperatures. Ingeneral, the combustion process is self-sustaining through control of air flow and feed rate, so thatcontinuous co-firing of auxiliary fuel is normally not necessary.
The high combustion temperatures and proper mixing of flue gas with air in the secondary
2.1-12 EMISSION FACTORS 10/96
combustion chamber provide good combustion, resulting in relatively low CO and trace organic emissions. Because of the limited amount of combustion air introduced through the primary chamber, gas velocities inthe primary chamber and the amount of entrained PM are low. As a result, PM emissions of air pollutantsfrom MOD/SA MWCs are relatively low. Many existing modular systems do not have air pollutioncontrols. This is especially true of the smaller starved-air facilities. A few of the newer MOD/SA MWCshave acid gas/PM controls.
2.1.2.7 Modular Excess Air Combustors -There are fewer MOD/EA MWCs than MOD/SA MWCs. The design of MOD/EA units is
similar to that of MOD/SA units, including the presence of primary and secondary combustion chambers. Waste is batch-fed to the primary chamber, which is refractory-lined. The waste is moved through theprimary chamber by hydraulic transfer rams, oscillating grates, or a revolving hearth. Bottom ash isdischarged to a wet quench pit. Additional flue gas residence time for fuel/carbon burnout is provided inthe secondary chamber, which is also refractory-lined. Energy is typically recovered in a waste heat boiler. Facilities with multiple combustors may have a tertiary chamber where flue gases from each combustor aremixed prior to entering the energy recovery boiler.
Unlike the MOD/SA combustors but similar to MB/REF units, a MOD/EA combustor typicallyoperates at about 100 percent excess air in the primary chamber, but may vary between 50 and 250 percentexcess air. The MOD/EA combustors also use recirculated flue gas for combustion air to maintain desiredtemperatures in the primary and secondary chambers. Due to higher air velocities, PM emissions fromMOD/EA combustors are higher than those from MOD/SA combustors and are more similar inconcentration to PM emissions from mass burn units. However, NOx emissions from MOD/EAcombustors appear to be lower than from either MOD/SA or mass burn units.
2.1.3 Emissions4-7
Depending on the characteristics of the MSW and combustion conditions in the MWC, thefollowing pollutants can be emitted:
- PM,
- Metals (in solid form on PM, except for Hg),
- Acid gases (HCl, SO2),
- CO,
- NOx, and
- Toxic organics (most notably CDD/CDF).
A brief discussion on each of the pollutants is provided below, along with discussions on controls used toreduce emissions of these pollutants to the atmosphere.
2.1.3.1 Particulate Matter -The amount of PM exiting the furnace of an MWC depends on the waste characteristics, the
physical nature of the combustor design, and the combustor's operation. Under normal combustion conditions, solid fly ash particulates formed from inorganic, noncombustible constituents in MSW arereleased into the flue gas. Most of this particulate is captured by the facility's APCD and are not emitted to
10/96 Solid Waste Disposal 2.1-13
the atmosphere.
Particulate matter can vary greatly in size with diameters ranging from less than 1 micrometer tohundreds of micrometers (µm). Fine particulates, having diameters less than 10µm (known as PM-10), areof increased concern because a greater potential for inhalation and passage into the pulmonary regionexists. Further, acid gases, metals, and toxic organics may preferentially adsorb onto particulates in thissize range. The NSPS and EG for MWCs regulate total PM, while PM-10 is of interest for StateImplementation Plans and when dealing with ambient PM concentrations. In this chapter, "PM" refers tototal PM as measured by EPA Reference Method 5.
The level of PM emissions at the inlet of the APCD will vary according the combustor design, airdistribution, and waste characteristics. For example, facilities that operate with high underfire/overfire airratios or relatively high excess air levels may entrain greater quantities of PM and have high PM levels atthe APCD inlet. For combustors with multiple-pass boilers that change the direction of the flue gas flow,part of the PM may be removed prior to the APCD. Lastly, the physical properties of the waste being fedand the method of feeding influences PM levels in the flue gas. Typically, RDF units have higher PMcarryover from the furnace due to the suspension-feeding of the RDF. However, controlled PM emissionsfrom RDF plants do not vary substantially from other MWCs (i. e., MB/WW), because the PM isefficiently collected in the APCD.
2.1.3.2 Metals -Metals are present in a variety of MSW streams, including paper, newsprint, yard wastes, wood,
batteries, and metal cans. The metals present in MSW are emitted from MWCs in association with PM (e.g., arsenic [As], Cd, chromium [Cr], and Pb) and as vapors, such as Hg. Due to the variability in MSWcomposition, metal concentrations are highly variable and are essentially independent of combustor type. Ifthe vapor pressure of a metal is such that condensation onto particulates in the flue gas is possible, themetal can be effectively removed by the PM control device. With the exception of Hg, most metals havesufficiently low vapor pressures to result in almost all of the metals being condensed. Therefore, removalin the PM control device for these metals is generally greater than 98 percent. Mercury, on the other hand,has a high vapor pressure at typical APCD operating temperatures, and capture by the PM control deviceis highly variable. The level of carbon in the fly ash appears to affect the level of Hg control. A high levelof carbon in the fly ash can enhance Hg adsorption onto particles removed by the PM control device.
2.1.3.3 Acid Gases -The chief acid gases of concern from the combustion of MSW are HCl and SO2. Hydrogen
fluoride (HF), hydrogen bromide (HBr), and sulfur trioxide (SO3) are also generally present, but at muchlower concentrations. Concentrations of HCl and SO2 in MWC flue gases directly relate to the chlorineand sulfur content in the waste. The chlorine and sulfur content vary considerably based on seasonal andlocal waste variations. Emissions of SO2 and HCl from MWCs depend on the chemical form of sulfur andchlorine in the waste, the availability of alkali materials in combustion-generated fly ash that act assorbents, and the type of emission control system used. Acid gas concentrations are considered to beindependent of combustion conditions. The major sources of chlorine in MSW are paper and plastics. Sulfur is contained in many constituents of MSW, such as asphalt shingles, gypsum wallboard, and tires. Because RDF processing does not generally impact the distribution of combustible materials in the wastefuel, HCl and SO2 concentrations for mass burn and RDF units are similar.
2.1.3.4 Carbon Monoxide -Carbon monoxide emissions result when all of the carbon in the waste is not oxidized to carbon
dioxide (CO2). High levels of CO indicate that the combustion gases were not held at a sufficiently high

2.1-14 EMISSION FACTORS 10/96
temperature in the presence of oxygen (O2) for a long enough time to convert CO to CO2. As waste burnsin a fuel bed, it releases CO, hydrogen (H2), and unburned hydrocarbons. Additional air then reacts withthe gases escaping from the fuel bed to convert CO and H2 to CO2 and H2O. Adding too much air to thecombustion zone will lower the local gas temperature and quench (retard) the oxidation reactions. If toolittle air is added, the probability of incomplete mixing increases, allowing greater quantities of unburnedhydrocarbons to escape the furnace. Both of the conditions would result in increased emissions of CO.
Because O2 levels and air distributions vary among combustor types, CO levels also vary amongcombustor types. For example, semi-suspension-fired RDF units generally have higher CO levels thanmass burn units, due to the effects of carryover of incompletely combusted materials into low temperatureportions of the combustor, and, in some cases, due to instabilities that result from fuel feed characteristics.
Carbon monoxide concentration is a good indicator of combustion efficiency, and is an importantcriterion for indicating instabilities and nonuniformities in the combustion process. It is during unstablecombustion conditions that more carbonaceous material is available and higher CDD/CDF and organichazardous air pollutant levels occur. The relationship between emissions of CDD/CDF and CO indicatesthat high levels of CO (several hundred parts per million by volume [ppmv]), corresponding to poorcombustion conditions, frequently correlate with high CDD/CDF emissions. When CO levels are low,however, correlations between CO and CDDs/CDFs are not well defined (due to the fact that manymechanisms may contribute to CDD/CDF formation), but CDD/CDF emissions are generally lower.
2.1.3.5 Nitrogen Oxides -Nitrogen oxides are products of all fuel/air combustion processes. Nitric oxide (NO) is the
primary component of NOx; however, nitrogen dioxide (NO2) and nitrous oxide (N2O) are also formed insmaller amounts. The combination of the compounds is referred to as NOx. Nitrogen oxides are formedduring combustion through (1) oxidation of nitrogen in the waste, and (2) fixation of atmospheric nitrogen. Conversion of nitrogen in the waste occurs at relatively low temperatures (less than 1,090EC [2,000EF]),while fixation of atmospheric nitrogen occurs at higher temperatures. Because of the relatively lowtemperatures at which MWC furnaces operate, 70 to 80 percent of NOx formed in MWCs is associatedwith nitrogen in the waste.
2.1.3.6 Organic Compounds -A variety of organic compounds, including CDDs/CDFs, chlorobenzene (CB), polychlorinated
biphenyls (PCBs), chlorophenols (CPs), and polyaromatic hydrocarbons (PAHs), are present in MSW orcan be formed during the combustion and post-combination processes. Organics in the flue gas can exist inthe vapor phase or can be condensed or absorbed on fine particulates. Control of organics is accomplishedthrough proper design and operation of both the combustor and the APCDs.
Based on potential health effects, CDD/CDF has been a focus of many research and regulatoryactivities. Due to toxicity levels, attention is most often placed on levels of CDDs/CDFs in the tetra-through octa- homolog groups and specific isomers within those groups that have chlorine substituted in the2, 3, 7, and 8 positions. As noted earlier, the NSPS and EG for MWCs regulate the total tetra- throughocta-CDDs/CDFs.
2.1.4 Controls8-10
A wide variety of control technologies are used to control emissions from MWCs. The control ofPM, along with metals that have adsorbed onto the PM, is most frequently accomplished through the use ofan ESP or fabric filter (FF). Although other PM control technologies (e. g., cyclones, electrified gravelbeds, and venturi scrubbers) are available, they are seldom used on existing systems, and it is anticipated
10/96 Solid Waste Disposal 2.1-15
that they will not be frequently used in future MWC systems. The control of acid gas emissions (i. e., SO2
and HCl) is most frequently accomplished through the application of acid gas control technologies such asspray drying or dry sorbent injection, followed by a high-efficiency PM control device. Some facilities usea wet scrubber to control acid gases. It is anticipated that dry systems (spray drying and dry sorbentinjection) will be more widely used than wet scrubbers on future U. S. MWC systems. Each of thesetechnologies is discussed in more detail below.
2.1.4.1 Electrostatic Precipitators -Electrostatic precipitators consist of a series of high-voltage (20 to 100 kilojoules per coulomb [20
to 100 kilovolts]) discharge electrodes and grounded metal plates through which PM-laden flue gas flows. Negatively charged ions formed by this high-voltage field (known as a "corona") attach to PM in the fluegas, causing the charged particles to migrate toward, and be collected on, the grounded plates. The mostcommon types of ESPs used by MWCs are (1) plate wire units in which the discharge electrode is a bottomweighted or rigid wire, and (2) flat plate units which use flat plates rather than wires as the dischargeelectrode.
As a general rule, the greater the amount of collection plate area, the greater the ESP's PMcollection efficiency. Once the charged particles are collected on the grounded plates, the resulting dustlayer is removed from the plates by rapping, washing, or some other method and collected in a hopper. When the dust layer is removed, some of the collected PM becomes re-entrained in the flue gas. To ensuregood PM collection efficiency during plate cleaning and electrical upsets, ESPs have several fields locatedin series along the direction of flue gas flow that can be energized and cleaned independently. Particles re-entrained when the dust layer is removed from one field can be recollected in a downstream field. Becauseof this phenomena, increasing the number of fields generally improves PM removal efficiency.
Small particles generally have lower migration velocities than large particles and are thereforemore difficult to collect. This factor is especially important to MWCs because of the large amount of totalfly ash smaller than 1 µm. As compared to pulverized coal fired combustors, in which only 1 to 3 percentof the fly ash is generally smaller than 1 µm, 20 to 70 percent of the fly ash at the inlet of the PM controldevice for MWCs is reported to be smaller than 1 µm. As a result, effective collection of PM from MWCsrequires greater collection areas and lower flue gas velocities than many other combustion types.
As an approximate indicator of collection efficiency, the specific collection area (SCA) of an ESPis frequently used. The SCA is calculated by dividing the collecting electrode plate area by the flue gasflow rate and is expressed as square meters per 304.8 cubic meters per minute (square feet per 1000 cubicfeet per minute) of flue gas. In general, the higher the SCA, the higher the collection efficiency. MostESPs at newer MWCs have SCAs in the range of 400 to 600. When estimating emissions fromESP-equipped MWCs, the SCA of the ESP should be taken into consideration. Not all ESPs are designedequally and performance of different ESPs will vary.
2.1-16 EMISSION FACTORS 10/96
2.1.4.2 Fabric Filters -Fabric filters are also used for PM and metals control, particularly in combination with acid gas
control and flue gas cooling. Fabric filters (also known as "baghouses") remove PM by passing flue gasthrough a porous fabric that has been sewn into a cylindrical bag. Multiple individual filter bags aremounted in an arranged compartment. A complete FF, in turn, consists of 4 to 16 individual compartmentsthat can be independently operated.
As the flue gas flows through the filter bags, particulate is collected on the filter surface, mainlythrough inertial impaction. The collected particulate builds up on the bag, forming a filter cake. As thethickness of the filter cake increases, the pressure drop across the bag also increases. Once pressure dropacross the bags in a given compartment becomes excessive, that compartment is generally taken off-line,mechanically cleaned, and then placed back on-line.
Fabric filters are generally differentiated by cleaning mechanisms. Two main filter cleaningmechanisms are used: reverse-air and pulse-jet. In a reverse-air FF, flue gas flows through unsupportedfilter bags, leaving the particulate on the inside of the bags. The particulate builds up to form a particulatefilter cake. Once excessive pressure drop across the filter cake is reached, air is blown through the filter inthe opposite direction, the filter bag collapses, and the filter cake falls off and is collected. In a pulse-jetFF, flue gas flows through supported filter bags leaving particulate on the outside of the bags. To removethe particulate filter cake, compressed air is pulsed through the inside of the filter bag, the filter bagexpands and collapses to its pre-pulsed shape, and the filter cake falls off and is collected.
2.1.4.3 Spray Drying -Spray dryers (SD) are the most frequently used acid gas control technology for MWCs in the
United States. When used in combination with an ESP or FF, the system can control CDD/CDF, PM (andmetals), SO2, and HCl emissions from MWCs. Spray dryer/fabric filter systems are more common thanSD/ESP systems and are used mostly on new, large MWCs. In the spray drying process, lime slurry isinjected into the SD through either a rotary atomizer or dual-fluid nozzles. The water in the slurryevaporates to cool the flue gas, and the lime reacts with acid gases to form calcium salts that can beremoved by a PM control device. The SD is designed to provide sufficient contact and residence time toproduce a dry product before leaving the SD adsorber vessel. The residence time in the adsorber vessel istypically 10 to 15 seconds. The particulate leaving the SD contains fly ash plus calcium salts, water, andunreacted hydrated lime.
The key design and operating parameters that significantly affect SD performance are SD outlettemperature and lime-to-acid gas stoichiometric ratio. The SD outlet approach to saturation temperature iscontrolled by the amount of water in the slurry. More effective acid gas removal occurs at lower approachto saturation temperatures, but the temperature must be high enough to ensure the slurry and reactionproducts are adequately dried prior to collection in the PM control device. For MWC flue gas containingsignificant chlorine, a minimum SD outlet temperature of around 115EC (240EF) is required to controlagglomeration of PM and sorbent by calcium chloride. Outlet gas temperature from the SD is usuallyaround 140EC (285EF).
The stoichiometric ratio is the molar ratio of calcium in the lime slurry fed to the SD divided by thetheoretical amount of calcium required to completely react with the inlet HCl and SO2 in the flue gas. At aratio of 1.0, the moles of calcium are equal to the moles of incoming HCl and SO2. However, because ofmass transfer limitations, incomplete mixing, and differing rates of reaction (SO2 reacts more slowly thanHCl), more than the theoretical amount of lime is generally fed to the SD. The stoichiometric ratio used inSD systems varies depending on the level of acid gas reduction required, the temperature of the flue gas atthe SD exit, and the type of PM control device used. Lime is fed in quantities sufficient to react with the
10/96 Solid Waste Disposal 2.1-17
peak acid gas concentrations expected without severely decreasing performance. The lime content in theslurry is generally about 10 percent by weight, but cannot exceed approximately 30 percent by weightwithout clogging of the lime slurry feed system and spray nozzles.
2.1.4.4 Dry Sorbent Injection -This type of technology has been developed primarily to control acid gas emissions. However,
when combined with flue gas cooling and either an ESP or FF, sorbent injection processes may also controlCDD/CDF and PM emissions from MWCs. Two primary subsets of dry sorbent injection technologiesexist. The more widely used of these approaches, referred to as duct sorbent injection (DSI), involvesinjecting dry alkali sorbents into flue gas downstream of the combustor outlet and upstream of the PMcontrol device. The second approach, referred to as furnace sorbent injection (FSI), injects sorbent directlyinto the combustor.
In DSI, powdered sorbent is pneumatically injected into either a separate reaction vessel or asection of flue gas duct located downstream of the combustor economizer or quench tower. Alkali in thesorbent (generally calcium or sodium) reacts with HCl, HF, and SO2 to form alkali salts (e. g., calcium chloride [CaCl2], calcium fluoride [CaF2], and calcium sulfite [CaSO3]). By lowering theacid content of the flue gas, downstream equipment can be operated at reduced temperatures whileminimizing the potential for acid corrosion of equipment. Solid reaction products, fly ash, and unreactedsorbent are collected with either an ESP or FF.
Acid gas removal efficiency with DSI depends on the method of sorbent injection, flue gastemperature, sorbent type and feed rate, and the extent of sorbent mixing with the flue gas. Not all DSIsystems are of the same design, and performance of the systems will vary. Flue gas temperature at thepoint of sorbent injection can range from about 150 to 320EC (300 to 600EF) depending on the sorbentbeing used and the design of the process. Sorbents that have been successfully tested include hydrated lime(Ca[OH]2), soda ash (Na2CO3), and sodium bicarbonate (NaHCO3). Based on published data for hydratedlime, some DSI systems can achieve removal efficiencies comparable to SD systems; however,performance is generally lower.
By combining flue gas cooling with DSI, it may be possible to increase CDD/CDF removalthrough a combination of vapor condensation and adsorption onto the sorbent surface. Cooling may alsobenefit PM control by decreasing the effective flue gas flow rate (i. e., cubic meters per minute) andreducing the resistivity of individual particles.
Furnace sorbent injection involves the injection of powdered alkali sorbent (either lime orlimestone) into the furnace section of a combustor. This can be accomplished by addition of sorbent to theoverfire air, injection through separate ports, or mixing with the waste prior to feeding to the combustor. As with DSI, reaction products, fly ash, and unreacted sorbent are collected using an ESP or FF.
The basic chemistry of FSI is similar to DSI. Both use a reaction of sorbent with acid gases toform alkali salts. However, several key differences exist in these 2 approaches. First, by injecting sorbentdirectly into the furnace (at temperatures of 870 to 1,200EC [1,600 to 2,200EF]) limestone can be calcinedin the combustor to form more reactive lime, thereby allowing use of less expensive limestone as a sorbent. Second, at these temperatures, SO2 and lime react in the combustor, thus providing a mechanism foreffective removal of SO2 at relatively low sorbent feed rates. Third, by injecting sorbent into the furnacerather than into a downstream duct, additional time is available for mixing and reaction between the sorbentand acid gases. Fourth, if a significant portion of the HCl is removed before the flue gas exits thecombustor, it may be possible to reduce the formation of CDD/CDF in latter sections of the flue gasducting. However, HCl and lime do not react with each other at temperatures above 760EC (1,400EF).
2.1-18 EMISSION FACTORS 10/96
This is the flue gas temperature that exists in the convective sections of the combustor. Therefore, HClremoval may be lower than with DSI. Potential disadvantages of FSI include fouling and erosion ofconvective heat transfer surfaces by the injected sorbent.
2.1.4.5 Wet Scrubbers -Many types of wet scrubbers have been used for controlling acid gas emissions from MWCs.
These include spray towers, centrifugal scrubbers, and venturi scrubbers. Wet scrubbing technology hasprimarily been used in Japan and Europe. Currently, it is not anticipated that many new MWCs being builtin the United States will use this type of acid gas control system. Wet scrubbing normally involves passingthe flue gas through an ESP to reduce PM, followed by a 1- or 2-stage absorber system. With single-stagescrubbers, the flue gas reacts with an alkaline scrubber liquid to simultaneously remove HCl and SO2. With two-stage scrubbers, a low-pH water scrubber for HCl removal is installed upstream of the alkalineSO2 scrubber. The alkaline solution, typically containing calcium hydroxide (Ca[OH]2), reacts with theacid gas to form salts, which are generally insoluble and may be removed by sequential clarifying,thickening, and vacuum filtering. The dewatered salts or sludges are then disposed.
2.1.4.6 Nitrogen Oxides Control Techniques -The control of NOx emissions can be accomplished through either combustion controls or add-on
controls. Combustion controls include staged combustion, low excess air (LEA), and flue gas recirculation(FGR). Add-on controls which have been tested on MWCs include selective noncatalytic reduction(SNCR), selective catalytic reduction (SCR), and natural gas reburning.
Combustion controls involve the control of temperature or O2 to reduce NOx formation. WithLEA, less air is supplied, which lowers the supply of O2 that is available to react with N2 in the combustionair. In staged combustion, the amount of underfire air is reduced, which generates a starved-air region. InFGR, cooled flue gas and ambient air are mixed to become the combustion air. This mixing reduces the O2
content of the combustion air supply and lowers combustion temperatures. Due to the lower combustiontemperatures present in MWCs, most NOx is produced from the oxidation of nitrogen present in the fuel. As a result, combustion modifications at MWCs have generally shown small to moderate reductions in NOx
emissions as compared to higher temperature combustion devices (i. e., fossil fuel-fired boilers).
With SNCR, ammonia (NH3) or urea is injected into the furnace along with chemical additives toreduce NOx to N2 without the use of catalysts. Based on analyses of data from U. S. MWCs equipped withSNCR, NOx reductions of 45 percent are achievable.
With SCR, NH3 is injected into the flue gas downstream of the boiler where it mixes with NOx inthe flue gas and passes through a catalyst bed, where NOx is reduced to N2 by a reaction with NH3. Thistechnique has not been applied to U. S. MWCs, but has been used on MWCs in Japan and Germany. Reductions of up to 80 percent have been observed, but problems with catalyst poisoning and deactivationmay reduce performance over time.
Natural gas reburning involves limiting combustion air to produce an LEA zone. Recirculated fluegas and natural gas are then added to this LEA zone to produce a fuel-rich zone that inhibits NOx formationand promotes reduction of NOx to N2. Natural gas reburning has been evaluated on both pilot- andfull-scale applications and achieved NOx reductions of 50 to 60 percent.
2.1.5 Mercury Controls11-14
10/96 Solid Waste Disposal 2.1-19
Unlike other metals, Hg exists in vapor form at typical APCD operating temperatures. As a result,collection of Hg in the APCD is highly variable. Factors that affect Hg control are good PM control, lowtemperatures in the APCD system, and a sufficient level of carbon in the fly ash. Higher levels of carbonin the fly ash enhance Hg adsorption onto the PM, which is removed by the PM control device. To keepthe Hg from volatilizing, it is important to operate the control systems at low temperatures, generally lessthan about 300 to 400EF.
Several mercury control technologies have been used on waste combustors in the United States,Canada, Europe, and Japan. These control technologies include the injection of activated carbon or sodiumsulfide (Na2S) into the flue gas prior to the DSI- or SD-based acid gas control system, or the use ofactivated carbon filters.
With activated carbon injection, Hg is adsorbed onto the carbon particle, which is then captured inthe PM control device. Test programs using activated carbon injection on MWCs in the United States haveshown Hg removal efficiencies of 50 to over 95 percent, depending on the carbon feed rate.
Sodium sulfide injection involves spraying Na2S solution into cooled flue gas prior to the acid gascontrol device. Solid mercuric sulfide is precipitated from the reaction of Na2S and Hg and can becollected in the PM control device. Results from tests on European and Canadian MWCs have shownremoval efficiencies of 50 to over 90 percent. Testings on a U. S. MWC, however, raised questions on theeffectiveness of this technology due to possible oversights in the analytical procedure used in Europe andCanada.
Fixed bed activated carbon filters are another Hg control technology being used in Europe. Withthis technology, the flue gas is passed through a fixed bed of granular activated carbon where the Hg isadsorbed. Segments of the bed are periodically replaced as system pressure drop increases.
2.1.6 Emissions15-121
Tables 2.1-1, 2.1-2, 2.1-3, 2.1-4, 2.1-5, 2.1-6, 2.1-7, 2.1-8, and 2.1-9 present emission factors forMWCs. The tables are for distinct combustor types (i. e., MB/WW, RDF), and include emission factorsfor uncontrolled (prior to any pollution control device) levels and for controlled levels based on variousAPCD types (i. e., ESP, SD/FF). There is a large amount of data available for this source category and, asa result of this, many of the emission factors have high quality ratings. However, for some categories therewere only limited data, and the ratings are low. In these cases, one should refer to the EPA BackgroundInformation Documents (BIDs) developed for the NSPS and EG, which more thoroughly analyze the datathan does AP-42, as well as discuss performance capabilities of the control technologies and expectedemission levels. Also, when using the MWC emission factors, it should be kept in mind that these areaverage values, and emissions from MWCs are greatly affected by the composition of the waste and mayvary for different facilities due to seasonal and regional differences. The AP-42 background report for thissection includes data for individual facilities that represent the range for a combustor/control technologycategory.
2.1-20E
MISSIO
N FA
CT
OR
S10/96
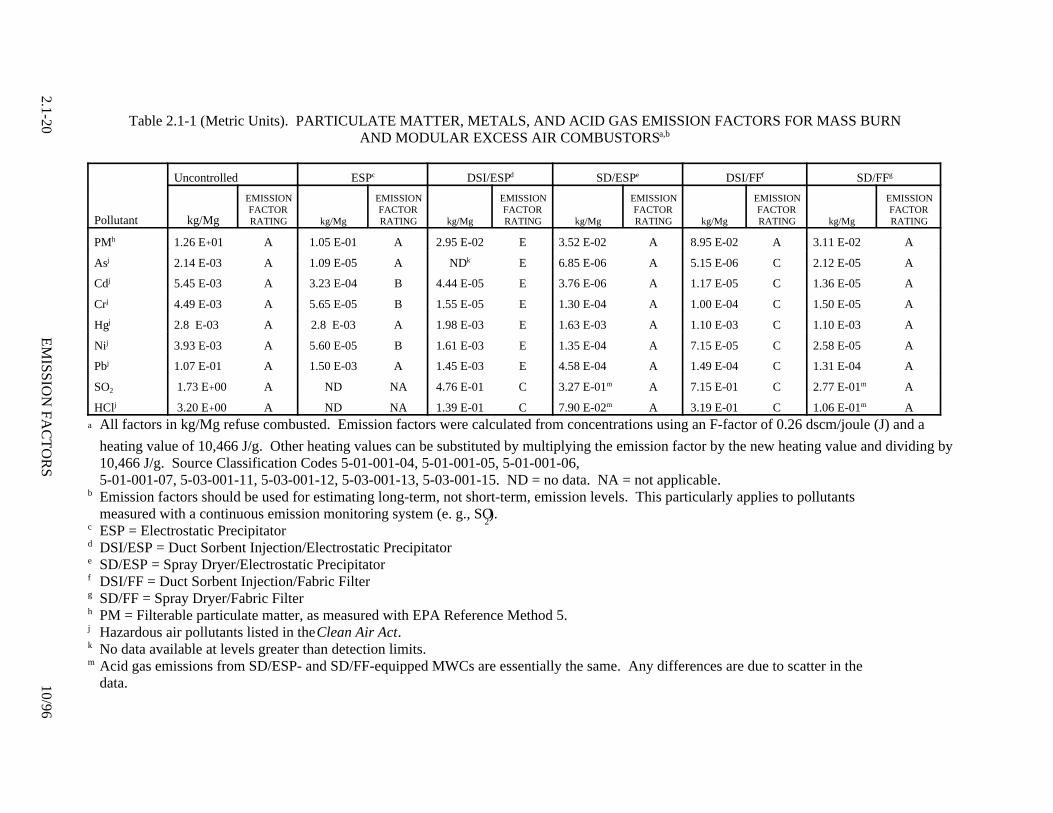
Table 2.1-1 (Metric Units). PARTICULATE MATTER, METALS, AND ACID GAS EMISSION FACTORS FOR MASS BURNAND MODULAR EXCESS AIR COMBUSTORSa,b
Uncontrolled ESPc DSI/ESPd SD/ESPe DSI/FFf SD/FFg
Pollutant kg/Mg
EMISSIONFACTORRATING kg/Mg
EMISSIONFACTORRATING kg/Mg
EMISSIONFACTORRATING kg/Mg
EMISSIONFACTORRATING kg/Mg
EMISSIONFACTORRATING kg/Mg
EMISSIONFACTORRATING
PMh 1.26 E+01 A 1.05 E-01 A 2.95 E-02 E 3.52 E-02 A 8.95 E-02 A 3.11 E-02 A
Asj 2.14 E-03 A 1.09 E-05 A NDk E 6.85 E-06 A 5.15 E-06 C 2.12 E-05 A
Cdj 5.45 E-03 A 3.23 E-04 B 4.44 E-05 E 3.76 E-06 A 1.17 E-05 C 1.36 E-05 A
Crj 4.49 E-03 A 5.65 E-05 B 1.55 E-05 E 1.30 E-04 A 1.00 E-04 C 1.50 E-05 A
Hgj 2.8 E-03 A 2.8 E-03 A 1.98 E-03 E 1.63 E-03 A 1.10 E-03 C 1.10 E-03 A
Nij 3.93 E-03 A 5.60 E-05 B 1.61 E-03 E 1.35 E-04 A 7.15 E-05 C 2.58 E-05 A
Pbj 1.07 E-01 A 1.50 E-03 A 1.45 E-03 E 4.58 E-04 A 1.49 E-04 C 1.31 E-04 A
SO2 1.73 E+00 A ND NA 4.76 E-01 C 3.27 E-01m A 7.15 E-01 C 2.77 E-01m A
HClj 3.20 E+00 A ND NA 1.39 E-01 C 7.90 E-02m A 3.19 E-01 C 1.06 E-01m Aa All factors in kg/Mg refuse combusted. Emission factors were calculated from concentrations using an F-factor of 0.26 dscm/joule (J) and a
heating value of 10,466 J/g. Other heating values can be substituted by multiplying the emission factor by the new heating value and dividing by10,466 J/g. Source Classification Codes 5-01-001-04, 5-01-001-05, 5-01-001-06, 5-01-001-07, 5-03-001-11, 5-03-001-12, 5-03-001-13, 5-03-001-15. ND = no data. NA = not applicable.
b Emission factors should be used for estimating long-term, not short-term, emission levels. This particularly applies to pollutantsmeasured with a continuous emission monitoring system (e. g., SO
2).
c ESP = Electrostatic Precipitatord DSI/ESP = Duct Sorbent Injection/Electrostatic Precipitatore SD/ESP = Spray Dryer/Electrostatic Precipitatorf DSI/FF = Duct Sorbent Injection/Fabric Filterg SD/FF = Spray Dryer/Fabric Filterh PM = Filterable particulate matter, as measured with EPA Reference Method 5.j Hazardous air pollutants listed in the Clean Air Act.k No data available at levels greater than detection limits.m Acid gas emissions from SD/ESP- and SD/FF-equipped MWCs are essentially the same. Any differences are due to scatter in the
data.
10/96Solid W
aste Disposal
2.1-21
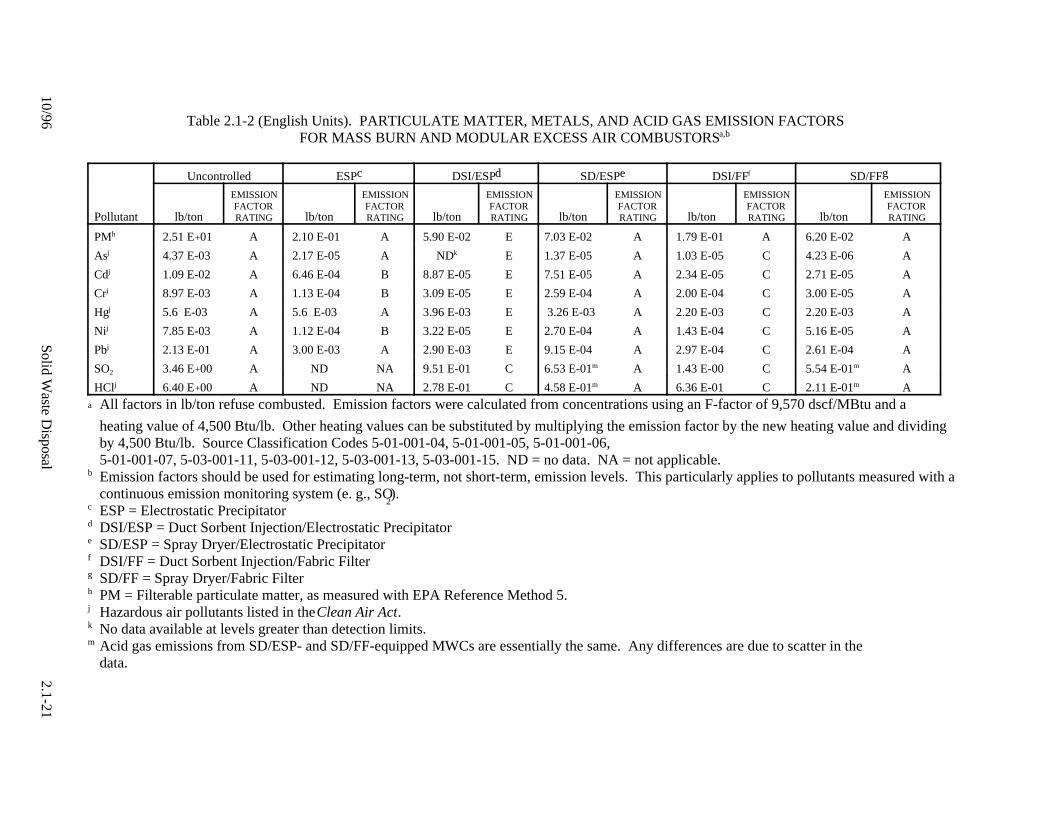
Table 2.1-2 (English Units). PARTICULATE MATTER, METALS, AND ACID GAS EMISSION FACTORSFOR MASS BURN AND MODULAR EXCESS AIR COMBUSTORSa,b
Uncontrolled ESPc DSI/ESPd SD/ESPe DSI/FFf SD/FFg
Pollutant lb/ton
EMISSIONFACTORRATING lb/ton
EMISSIONFACTORRATING lb/ton
EMISSIONFACTORRATING lb/ton
EMISSIONFACTORRATING lb/ton
EMISSIONFACTORRATING lb/ton
EMISSIONFACTORRATING
PMh 2.51 E+01 A 2.10 E-01 A 5.90 E-02 E 7.03 E-02 A 1.79 E-01 A 6.20 E-02 A
Asj 4.37 E-03 A 2.17 E-05 A NDk E 1.37 E-05 A 1.03 E-05 C 4.23 E-06 A
Cdj 1.09 E-02 A 6.46 E-04 B 8.87 E-05 E 7.51 E-05 A 2.34 E-05 C 2.71 E-05 A
Crj 8.97 E-03 A 1.13 E-04 B 3.09 E-05 E 2.59 E-04 A 2.00 E-04 C 3.00 E-05 A
Hgj 5.6 E-03 A 5.6 E-03 A 3.96 E-03 E 3.26 E-03 A 2.20 E-03 C 2.20 E-03 A
Nij 7.85 E-03 A 1.12 E-04 B 3.22 E-05 E 2.70 E-04 A 1.43 E-04 C 5.16 E-05 A
Pbj 2.13 E-01 A 3.00 E-03 A 2.90 E-03 E 9.15 E-04 A 2.97 E-04 C 2.61 E-04 A
SO2 3.46 E+00 A ND NA 9.51 E-01 C 6.53 E-01m A 1.43 E-00 C 5.54 E-01m A
HClj 6.40 E+00 A ND NA 2.78 E-01 C 4.58 E-01m A 6.36 E-01 C 2.11 E-01m Aa All factors in lb/ton refuse combusted. Emission factors were calculated from concentrations using an F-factor of 9,570 dscf/MBtu and a
heating value of 4,500 Btu/lb. Other heating values can be substituted by multiplying the emission factor by the new heating value and dividingby 4,500 Btu/lb. Source Classification Codes 5-01-001-04, 5-01-001-05, 5-01-001-06, 5-01-001-07, 5-03-001-11, 5-03-001-12, 5-03-001-13, 5-03-001-15. ND = no data. NA = not applicable.
b Emission factors should be used for estimating long-term, not short-term, emission levels. This particularly applies to pollutants measured with acontinuous emission monitoring system (e. g., SO
2).
c ESP = Electrostatic Precipitatord DSI/ESP = Duct Sorbent Injection/Electrostatic Precipitatore SD/ESP = Spray Dryer/Electrostatic Precipitatorf DSI/FF = Duct Sorbent Injection/Fabric Filterg SD/FF = Spray Dryer/Fabric Filterh PM = Filterable particulate matter, as measured with EPA Reference Method 5.j Hazardous air pollutants listed in the Clean Air Act.k No data available at levels greater than detection limits.m Acid gas emissions from SD/ESP- and SD/FF-equipped MWCs are essentially the same. Any differences are due to scatter in the
data.
2.1-22E
MISSIO
N FA
CT
OR
S10/96
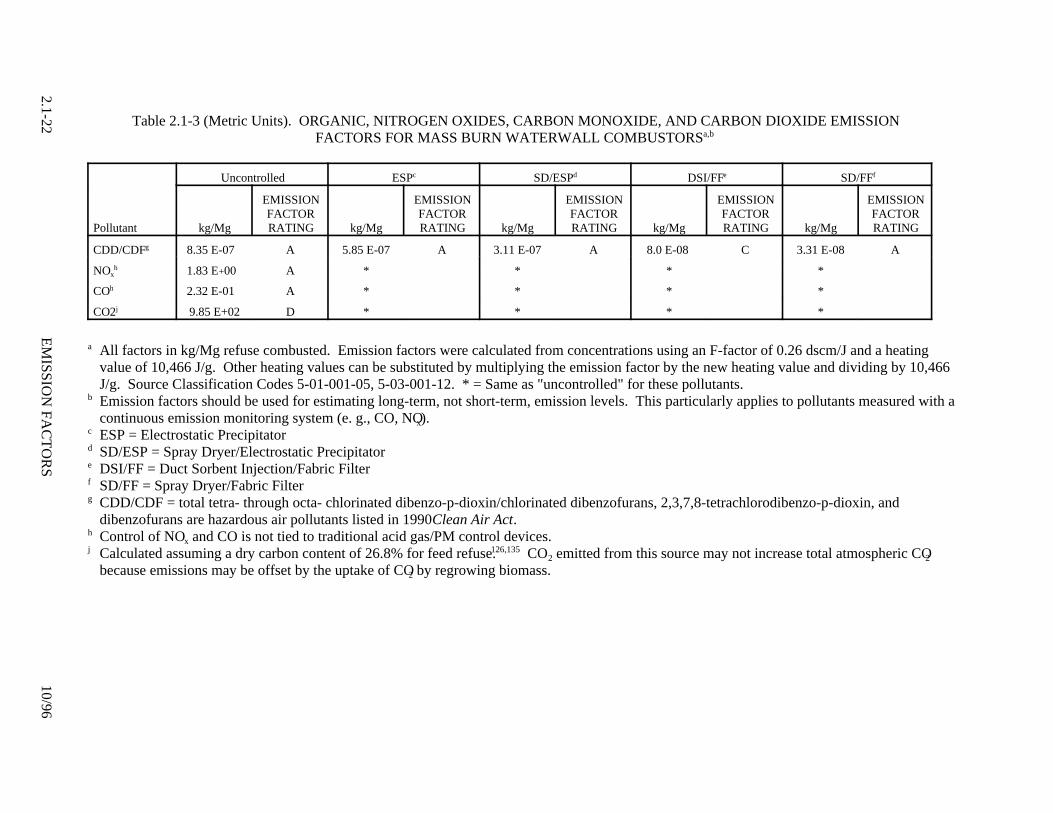
Table 2.1-3 (Metric Units). ORGANIC, NITROGEN OXIDES, CARBON MONOXIDE, AND CARBON DIOXIDE EMISSIONFACTORS FOR MASS BURN WATERWALL COMBUSTORSa,b
Uncontrolled ESPc SD/ESPd DSI/FFe SD/FFf
Pollutant kg/Mg
EMISSIONFACTORRATING kg/Mg
EMISSIONFACTORRATING kg/Mg
EMISSIONFACTORRATING kg/Mg
EMISSIONFACTORRATING kg/Mg
EMISSIONFACTORRATING
CDD/CDFg 8.35 E-07 A 5.85 E-07 A 3.11 E-07 A 8.0 E-08 C 3.31 E-08 A
NOxh 1.83 E+00 A * * * *
COh 2.32 E-01 A * * * *
CO2j 9.85 E+02 D * * * *
a All factors in kg/Mg refuse combusted. Emission factors were calculated from concentrations using an F-factor of 0.26 dscm/J and a heatingvalue of 10,466 J/g. Other heating values can be substituted by multiplying the emission factor by the new heating value and dividing by 10,466J/g. Source Classification Codes 5-01-001-05, 5-03-001-12. * = Same as "uncontrolled" for these pollutants.
b Emission factors should be used for estimating long-term, not short-term, emission levels. This particularly applies to pollutants measured with acontinuous emission monitoring system (e. g., CO, NOx).
c ESP = Electrostatic Precipitatord SD/ESP = Spray Dryer/Electrostatic Precipitatore DSI/FF = Duct Sorbent Injection/Fabric Filterf SD/FF = Spray Dryer/Fabric Filterg CDD/CDF = total tetra- through octa- chlorinated dibenzo-p-dioxin/chlorinated dibenzofurans, 2,3,7,8-tetrachlorodibenzo-p-dioxin, and
dibenzofurans are hazardous air pollutants listed in 1990 Clean Air Act.h Control of NOx and CO is not tied to traditional acid gas/PM control devices. j Calculated assuming a dry carbon content of 26.8% for feed refuse.126,135 CO2 emitted from this source may not increase total atmospheric CO2
because emissions may be offset by the uptake of CO2 by regrowing biomass.
10/96Solid W
aste Disposal
2.1-23
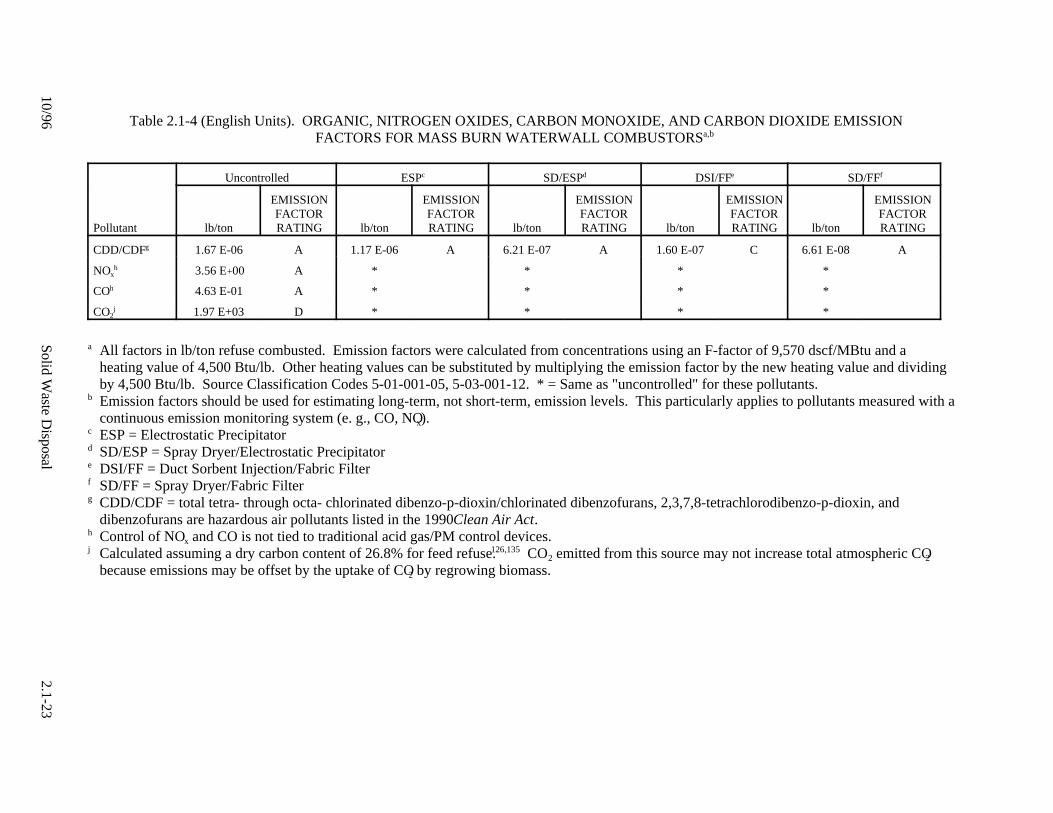
Table 2.1-4 (English Units). ORGANIC, NITROGEN OXIDES, CARBON MONOXIDE, AND CARBON DIOXIDE EMISSIONFACTORS FOR MASS BURN WATERWALL COMBUSTORSa,b
Uncontrolled ESPc SD/ESPd DSI/FFe SD/FFf
Pollutant lb/ton
EMISSIONFACTORRATING lb/ton
EMISSIONFACTORRATING lb/ton
EMISSIONFACTORRATING lb/ton
EMISSIONFACTORRATING lb/ton
EMISSIONFACTORRATING
CDD/CDFg 1.67 E-06 A 1.17 E-06 A 6.21 E-07 A 1.60 E-07 C 6.61 E-08 A
NOxh 3.56 E+00 A * * * *
COh 4.63 E-01 A * * * *
CO2j 1.97 E+03 D * * * *
a All factors in lb/ton refuse combusted. Emission factors were calculated from concentrations using an F-factor of 9,570 dscf/MBtu and aheating value of 4,500 Btu/lb. Other heating values can be substituted by multiplying the emission factor by the new heating value and dividingby 4,500 Btu/lb. Source Classification Codes 5-01-001-05, 5-03-001-12. * = Same as "uncontrolled" for these pollutants.
b Emission factors should be used for estimating long-term, not short-term, emission levels. This particularly applies to pollutants measured with acontinuous emission monitoring system (e. g., CO, NOx).
c ESP = Electrostatic Precipitatord SD/ESP = Spray Dryer/Electrostatic Precipitatore DSI/FF = Duct Sorbent Injection/Fabric Filterf SD/FF = Spray Dryer/Fabric Filterg CDD/CDF = total tetra- through octa- chlorinated dibenzo-p-dioxin/chlorinated dibenzofurans, 2,3,7,8-tetrachlorodibenzo-p-dioxin, and
dibenzofurans are hazardous air pollutants listed in the 1990 Clean Air Act.h Control of NOx and CO is not tied to traditional acid gas/PM control devices. j Calculated assuming a dry carbon content of 26.8% for feed refuse.126,135 CO2 emitted from this source may not increase total atmospheric CO2
because emissions may be offset by the uptake of CO2 by regrowing biomass.
2.1-24E
MISSIO
N FA
CT
OR
S10/96
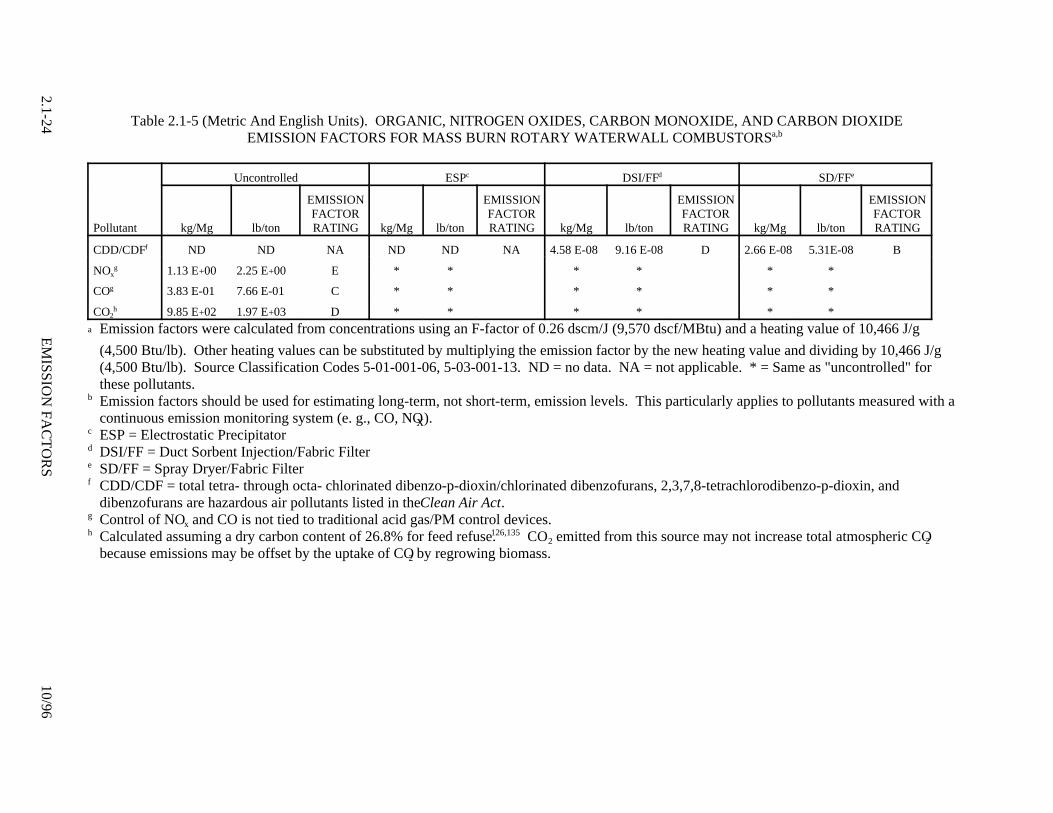
Table 2.1-5 (Metric And English Units). ORGANIC, NITROGEN OXIDES, CARBON MONOXIDE, AND CARBON DIOXIDEEMISSION FACTORS FOR MASS BURN ROTARY WATERWALL COMBUSTORSa,b
Uncontrolled ESPc DSI/FFd SD/FFe
Pollutant kg/Mg lb/ton
EMISSIONFACTORRATING kg/Mg lb/ton
EMISSIONFACTORRATING kg/Mg lb/ton
EMISSIONFACTORRATING kg/Mg lb/ton
EMISSIONFACTORRATING
CDD/CDFf ND ND NA ND ND NA 4.58 E-08 9.16 E-08 D 2.66 E-08 5.31E-08 B
NOxg 1.13 E+00 2.25 E+00 E * * * * * *
COg 3.83 E-01 7.66 E-01 C * * * * * *
CO2h 9.85 E+02 1.97 E+03 D * * * * * *
a Emission factors were calculated from concentrations using an F-factor of 0.26 dscm/J (9,570 dscf/MBtu) and a heating value of 10,466 J/g
(4,500 Btu/lb). Other heating values can be substituted by multiplying the emission factor by the new heating value and dividing by 10,466 J/g(4,500 Btu/lb). Source Classification Codes 5-01-001-06, 5-03-001-13. ND = no data. NA = not applicable. * = Same as "uncontrolled" forthese pollutants.
b Emission factors should be used for estimating long-term, not short-term, emission levels. This particularly applies to pollutants measured with acontinuous emission monitoring system (e. g., CO, NOx).
c ESP = Electrostatic Precipitatord DSI/FF = Duct Sorbent Injection/Fabric Filtere SD/FF = Spray Dryer/Fabric Filterf CDD/CDF = total tetra- through octa- chlorinated dibenzo-p-dioxin/chlorinated dibenzofurans, 2,3,7,8-tetrachlorodibenzo-p-dioxin, and
dibenzofurans are hazardous air pollutants listed in the Clean Air Act.g Control of NOx and CO is not tied to traditional acid gas/PM control devices. h Calculated assuming a dry carbon content of 26.8% for feed refuse.126,135 CO2 emitted from this source may not increase total atmospheric CO2
because emissions may be offset by the uptake of CO2 by regrowing biomass.

10/96Solid W
aste Disposal
2.1-25
Table 2.1-6 (Metric And English Units). ORGANIC, NITROGEN OXIDES, CARBON MONOXIDE, AND CARBON DIOXIDEEMISSION FACTORS FOR MASS BURN REFRACTORY WALL COMBUSTORSa,b
Uncontrolled ESPc DSI/ESPd
Pollutant kg/Mg lb/ton
EMISSIONFACTORRATING kg/Mg lb/ton
EMISSIONFACTORRATING kg/Mg lb/ton
EMISSIONFACTORRATING
CDD/CDFe 7.50 E-06 1.50 E-05 D 3.63 E-05 7.25 E-05 D 2.31 E-07 4.61 E-07 E
NOxf 1.23 E+00 2.46 E+00 A * * * *
COf 6.85 E-01 1.37 E+00 C * * * *
CO2g 9.85 E+02 1.97 E+03 D * * * *
a Emission factors were calculated from concentrations using an F-factor of 0.26 dscm/J (9,570 dscf/MBtu) and a heating value of 10,466 J/g
(4,500 Btu/lb). Other heating values can be substituted by multiplying the emission factor by the new heating value and dividing by 10,466 J/g(4,500 Btu/lb). Source Classification Codes 5-01-001-04, 5-03-001-11. * = Same as "uncontrolled" for these pollutants.
b Emission factors should be used for estimating long-term, not short-term, emission levels. This particularly applies to pollutants measured with acontinuous emission monitoring system (e. g., CO, NOx).
c ESP = Electrostatic Precipitatord DSI/ESP = Duct Sorbent Injection/Electrostatic Precipitatore CDD/CDF = total tetra- through octa- chlorinated dibenzo-p-dioxin/chlorinated dibenzofurans, 2,3,7,8-tetrachlorodibenzo-p-dioxin, and
dibenzofurans are hazardous air pollutants listed in the Clean Air Act.f Control of NOx and CO is not tied to traditional acid gas/PM control devices. g Calculated assuming a dry carbon content of 26.8% for feed refuse.126,135 CO2 emitted from this source may not increase total atmospheric CO2
because emissions may be offset by the uptake of CO2 by regrowing biomass.
2.1-26E
MISSIO
N FA
CT
OR
S10/96
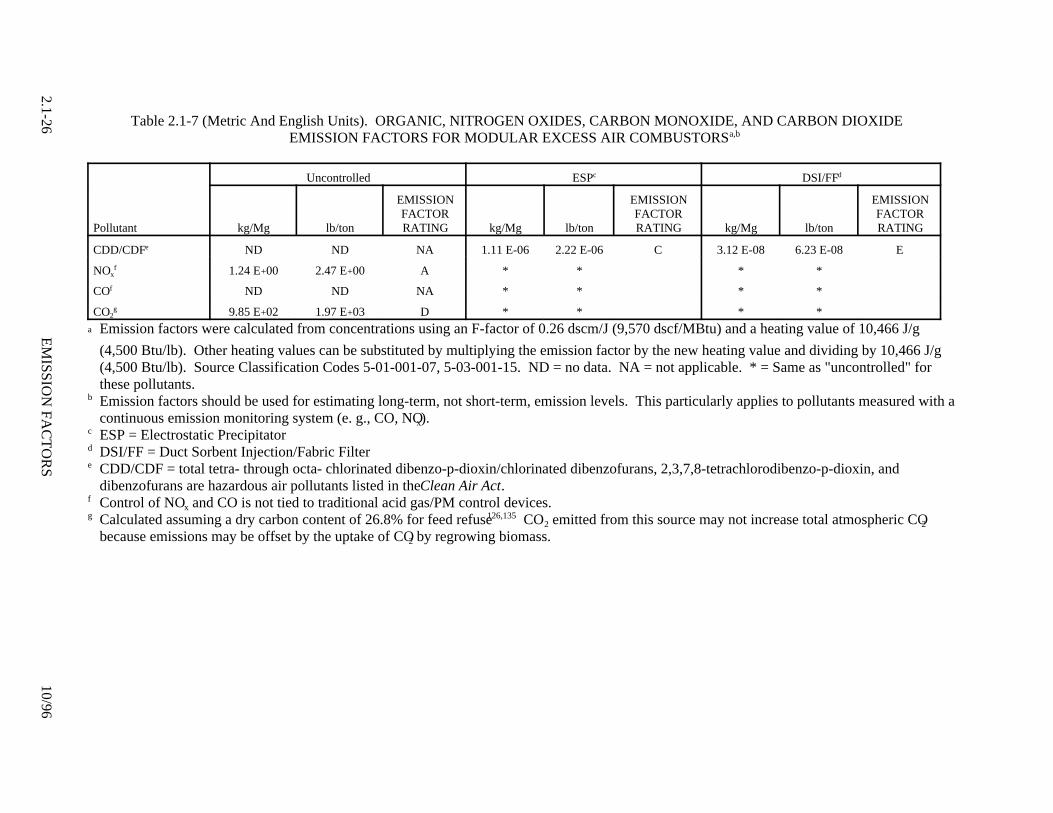
Table 2.1-7 (Metric And English Units). ORGANIC, NITROGEN OXIDES, CARBON MONOXIDE, AND CARBON DIOXIDEEMISSION FACTORS FOR MODULAR EXCESS AIR COMBUSTORSa,b
Uncontrolled ESPc DSI/FFd
Pollutant kg/Mg lb/ton
EMISSIONFACTORRATING kg/Mg lb/ton
EMISSIONFACTORRATING kg/Mg lb/ton
EMISSIONFACTORRATING
CDD/CDFe ND ND NA 1.11 E-06 2.22 E-06 C 3.12 E-08 6.23 E-08 E
NOxf 1.24 E+00 2.47 E+00 A * * * *
COf ND ND NA * * * *
CO2g 9.85 E+02 1.97 E+03 D * * * *
a Emission factors were calculated from concentrations using an F-factor of 0.26 dscm/J (9,570 dscf/MBtu) and a heating value of 10,466 J/g
(4,500 Btu/lb). Other heating values can be substituted by multiplying the emission factor by the new heating value and dividing by 10,466 J/g(4,500 Btu/lb). Source Classification Codes 5-01-001-07, 5-03-001-15. ND = no data. NA = not applicable. * = Same as "uncontrolled" forthese pollutants.
b Emission factors should be used for estimating long-term, not short-term, emission levels. This particularly applies to pollutants measured with acontinuous emission monitoring system (e. g., CO, NOx).
c ESP = Electrostatic Precipitatord DSI/FF = Duct Sorbent Injection/Fabric Filtere CDD/CDF = total tetra- through octa- chlorinated dibenzo-p-dioxin/chlorinated dibenzofurans, 2,3,7,8-tetrachlorodibenzo-p-dioxin, and
dibenzofurans are hazardous air pollutants listed in the Clean Air Act.f Control of NOx and CO is not tied to traditional acid gas/PM control devices. g Calculated assuming a dry carbon content of 26.8% for feed refuse126,135 CO2 emitted from this source may not increase total atmospheric CO2
because emissions may be offset by the uptake of CO2 by regrowing biomass.
10/96Solid W
aste Disposal
2.1-27
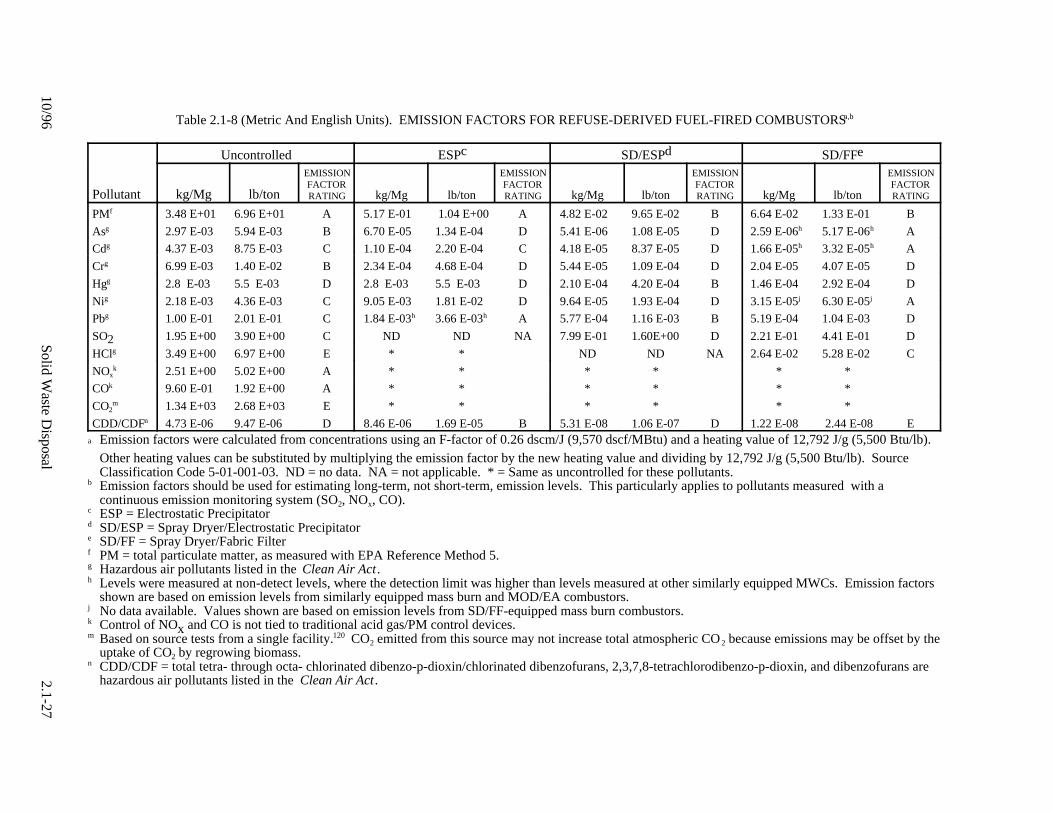
Table 2.1-8 (Metric And English Units). EMISSION FACTORS FOR REFUSE-DERIVED FUEL-FIRED COMBUSTORSa,b
Uncontrolled ESPc SD/ESPd SD/FFe
Pollutant kg/Mg lb/ton
EMISSIONFACTORRATING kg/Mg lb/ton
EMISSIONFACTORRATING kg/Mg lb/ton
EMISSIONFACTORRATING kg/Mg lb/ton
EMISSIONFACTORRATING
PMf 3.48 E+01 6.96 E+01 A 5.17 E-01 1.04 E+00 A 4.82 E-02 9.65 E-02 B 6.64 E-02 1.33 E-01 B
Asg 2.97 E-03 5.94 E-03 B 6.70 E-05 1.34 E-04 D 5.41 E-06 1.08 E-05 D 2.59 E-06h 5.17 E-06h A
Cdg 4.37 E-03 8.75 E-03 C 1.10 E-04 2.20 E-04 C 4.18 E-05 8.37 E-05 D 1.66 E-05h 3.32 E-05h A
Crg 6.99 E-03 1.40 E-02 B 2.34 E-04 4.68 E-04 D 5.44 E-05 1.09 E-04 D 2.04 E-05 4.07 E-05 D
Hgg 2.8 E-03 5.5 E-03 D 2.8 E-03 5.5 E-03 D 2.10 E-04 4.20 E-04 B 1.46 E-04 2.92 E-04 D
Nig 2.18 E-03 4.36 E-03 C 9.05 E-03 1.81 E-02 D 9.64 E-05 1.93 E-04 D 3.15 E-05j 6.30 E-05j A
Pbg 1.00 E-01 2.01 E-01 C 1.84 E-03h 3.66 E-03h A 5.77 E-04 1.16 E-03 B 5.19 E-04 1.04 E-03 D
SO2 1.95 E+00 3.90 E+00 C ND ND NA 7.99 E-01 1.60E+00 D 2.21 E-01 4.41 E-01 D
HClg 3.49 E+00 6.97 E+00 E * * ND ND NA 2.64 E-02 5.28 E-02 C
NOxk 2.51 E+00 5.02 E+00 A * * * * * *
COk 9.60 E-01 1.92 E+00 A * * * * * *
CO2m 1.34 E+03 2.68 E+03 E * * * * * *
CDD/CDFn 4.73 E-06 9.47 E-06 D 8.46 E-06 1.69 E-05 B 5.31 E-08 1.06 E-07 D 1.22 E-08 2.44 E-08 Ea Emission factors were calculated from concentrations using an F-factor of 0.26 dscm/J (9,570 dscf/MBtu) and a heating value of 12,792 J/g (5,500 Btu/lb).
Other heating values can be substituted by multiplying the emission factor by the new heating value and dividing by 12,792 J/g (5,500 Btu/lb). SourceClassification Code 5-01-001-03. ND = no data. NA = not applicable. * = Same as uncontrolled for these pollutants.
b Emission factors should be used for estimating long-term, not short-term, emission levels. This particularly applies to pollutants measured with acontinuous emission monitoring system (SO2, NOx, CO).
c ESP = Electrostatic Precipitatord SD/ESP = Spray Dryer/Electrostatic Precipitatore SD/FF = Spray Dryer/Fabric Filterf PM = total particulate matter, as measured with EPA Reference Method 5.g Hazardous air pollutants listed in the Clean Air Act.h Levels were measured at non-detect levels, where the detection limit was higher than levels measured at other similarly equipped MWCs. Emission factors
shown are based on emission levels from similarly equipped mass burn and MOD/EA combustors.j No data available. Values shown are based on emission levels from SD/FF-equipped mass burn combustors.k Control of NOx and CO is not tied to traditional acid gas/PM control devices. m Based on source tests from a single facility.120 CO2 emitted from this source may not increase total atmospheric CO 2 because emissions may be offset by the
uptake of CO2 by regrowing biomass.n CDD/CDF = total tetra- through octa- chlorinated dibenzo-p-dioxin/chlorinated dibenzofurans, 2,3,7,8-tetrachlorodibenzo-p-dioxin, and dibenzofurans are
hazardous air pollutants listed in the Clean Air Act.
2.1-28 EMISSION FACTORS 10/96
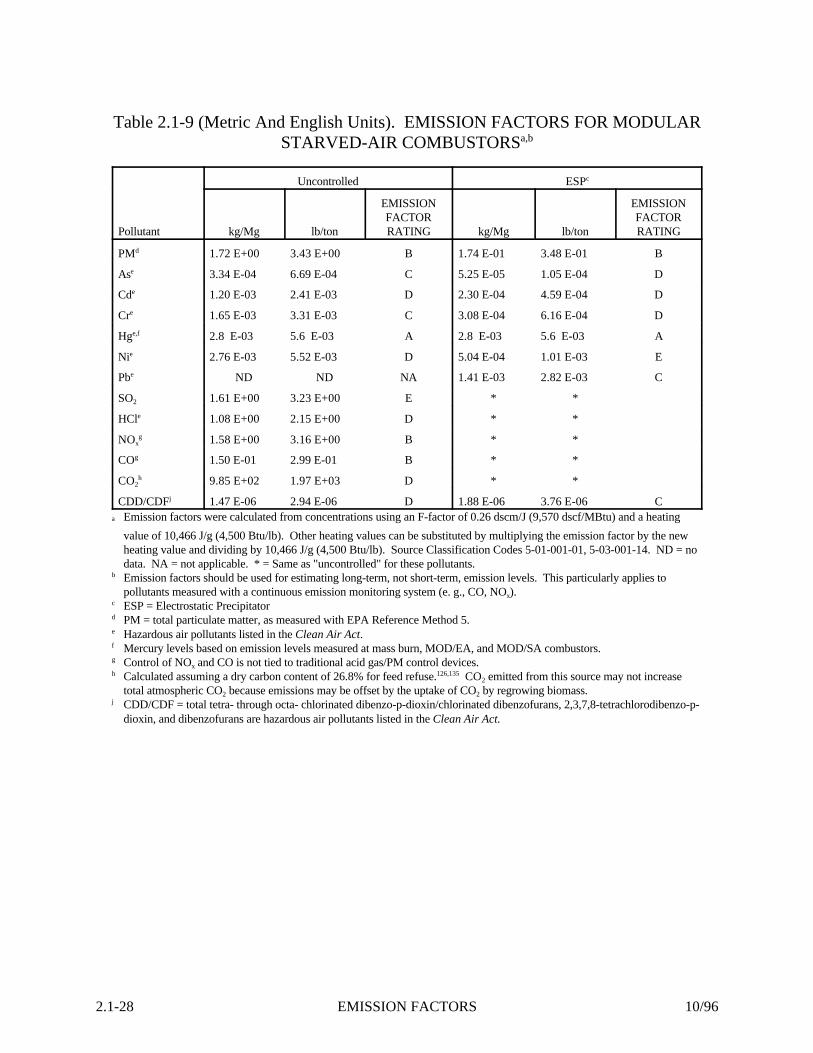
Table 2.1-9 (Metric And English Units). EMISSION FACTORS FOR MODULARSTARVED-AIR COMBUSTORSa,b
Uncontrolled ESPc
Pollutant kg/Mg lb/ton
EMISSIONFACTORRATING kg/Mg lb/ton
EMISSIONFACTORRATING
PMd 1.72 E+00 3.43 E+00 B 1.74 E-01 3.48 E-01 B
Ase 3.34 E-04 6.69 E-04 C 5.25 E-05 1.05 E-04 D
Cde 1.20 E-03 2.41 E-03 D 2.30 E-04 4.59 E-04 D
Cre 1.65 E-03 3.31 E-03 C 3.08 E-04 6.16 E-04 D
Hge,f 2.8 E-03 5.6 E-03 A 2.8 E-03 5.6 E-03 A
Nie 2.76 E-03 5.52 E-03 D 5.04 E-04 1.01 E-03 E
Pbe ND ND NA 1.41 E-03 2.82 E-03 C
SO2 1.61 E+00 3.23 E+00 E * *
HCle 1.08 E+00 2.15 E+00 D * *
NOxg 1.58 E+00 3.16 E+00 B * *
COg 1.50 E-01 2.99 E-01 B * *
CO2h 9.85 E+02 1.97 E+03 D * *
CDD/CDFj 1.47 E-06 2.94 E-06 D 1.88 E-06 3.76 E-06 Ca Emission factors were calculated from concentrations using an F-factor of 0.26 dscm/J (9,570 dscf/MBtu) and a heating
value of 10,466 J/g (4,500 Btu/lb). Other heating values can be substituted by multiplying the emission factor by the newheating value and dividing by 10,466 J/g (4,500 Btu/lb). Source Classification Codes 5-01-001-01, 5-03-001-14. ND = nodata. NA = not applicable. * = Same as "uncontrolled" for these pollutants.
b Emission factors should be used for estimating long-term, not short-term, emission levels. This particularly applies topollutants measured with a continuous emission monitoring system (e. g., CO, NOx).
c ESP = Electrostatic Precipitatord PM = total particulate matter, as measured with EPA Reference Method 5.e Hazardous air pollutants listed in the Clean Air Act.f Mercury levels based on emission levels measured at mass burn, MOD/EA, and MOD/SA combustors.g Control of NOx and CO is not tied to traditional acid gas/PM control devices.h Calculated assuming a dry carbon content of 26.8% for feed refuse.126,135 CO2 emitted from this source may not increase
total atmospheric CO2 because emissions may be offset by the uptake of CO2 by regrowing biomass.j CDD/CDF = total tetra- through octa- chlorinated dibenzo-p-dioxin/chlorinated dibenzofurans, 2,3,7,8-tetrachlorodibenzo-p-
dioxin, and dibenzofurans are hazardous air pollutants listed in the Clean Air Act.
10/96 Solid Waste Disposal 2.1-29
Another point to keep in mind when using emission factors is that certain control technologies,specifically ESPs and DSI systems, are not all designed with equal performance capabilities. The ESP andDSI-based emission factors are based on data from a variety of facilities and represent average emissionlevels for MWCs equipped with these control technologies. To estimate emissions for a specific ESP orDSI system, refer to either the AP-42 background report for this section or the NSPS and EG BIDs toobtain actual emissions data for these facilities. These documents should also be used when conductingrisk assessments, as well as for determining removal efficiencies. Since the AP-42 emission factorsrepresent averages from numerous facilities, the uncontrolled and controlled levels frequently do notcorrespond to simultaneous testing and should not be used to calculate removal efficiencies.
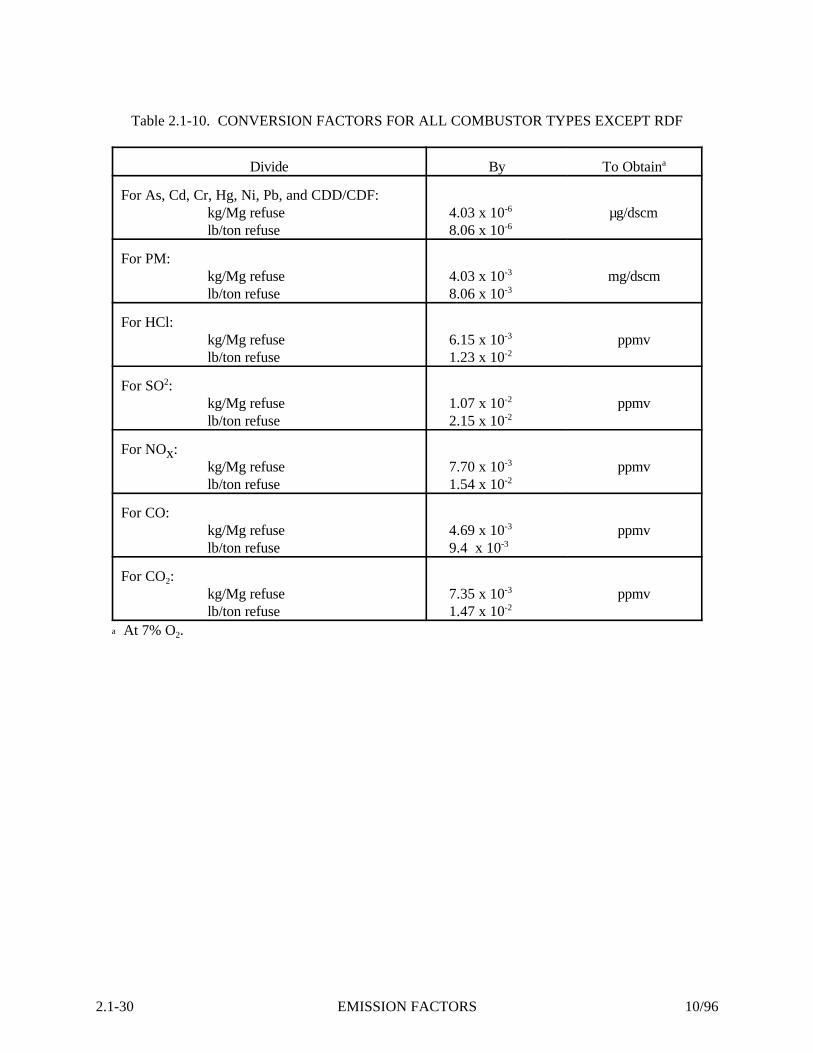
Emission factors for MWCs were calculated from flue gas concentrations using an F-factor of 0.26dry standard cubic meters per joule (dscm/J) (9,570 dry standard cubic feet per million British thermalunits [Btu]) and an assumed heating value of the waste of 10,466 J/g (4,500 Btu per pound [Btu/lb]) for allcombustors except RDF, for which a 12,792 J/g (5,500 Btu/lb) heating value was assumed. These areaverage values for MWCs; however, a particular facility may have a different heating value for the waste. In such a case, the emission factors shown in the tables can be adjusted by multiplying the emission factorby the actual facility heating value and dividing by the assumed heating value (4,500 or 5,500 Btu/lb,depending on the combustor type). Also, conversion factors to obtain concentrations, which can be usedfor developing more specific emission factors or making comparisons to regulatory limits, are provided inTables 2.1-10 and 2.1-11 for all combustor types (except RDF) and RDF combustors, respectively.
Also note that the values shown in the tables for PM are for total PM, and the CDD/CDF datarepresent total tetra- through octa-CDD/CDF. For SO2, NOx, and CO, the data presented in the tablesrepresent long-term averages, and should not be used to estimate short-term emissions. Refer to the EPABIDs which discuss achievable emission levels of SO2, NOx, and CO for different averaging times based onanalysis of continuous emission monitoring data. Lastly, for PM and metals, levels for MB/WW, MB/RC,MB/REF, and MOD/EA were combined to determine the emission factors, since these emissions should bethe same for these types of combustors. For controlled levels, data were combined within each controltechnology type (e. g., SD/FF data, ESP data). For Hg, MOD/SA data were also combined with the massburn and MOD/EA data.
2.1.7 Other Types Of Combustors122-134
2.1.7.1 Industrial/Commercial Combustors - The capacities of these units cover a wide range, generally between 23 and 1,800 kilograms
(50 and 4,000 pounds) per hour. Of either single- or multiple-chamber design, these units are oftenmanually charged and intermittently operated. Some industrial combustors are similar to municipalcombustors in size and design. Emission control systems include gas-fired afterburners, scrubbers, or both. Under Section 129 of the CAAA, these types of combustors will be required to meet emission limits for thesame list of pollutants as for MWCs. The EPA has not yet established these limits.
2.1.7.2 Trench Combustors - Trench combustors, also called air curtain incinerators, forcefully project a curtain of air across a
pit in which open burning occurs. The air curtain is intended to increase combustion efficiency and reducesmoke and PM emissions. Underfire air is also used to increase combustion efficiency.
2.1-30 EMISSION FACTORS 10/96
Table 2.1-10. CONVERSION FACTORS FOR ALL COMBUSTOR TYPES EXCEPT RDF
Divide By To Obtaina
For As, Cd, Cr, Hg, Ni, Pb, and CDD/CDF:kg/Mg refuselb/ton refuse
4.03 x 10⁻⁶
8.06 x 10⁻⁶µg/dscm
For PM:kg/Mg refuselb/ton refuse
4.03 x 10⁻³
8.06 x 10⁻³mg/dscm
For HCl:kg/Mg refuselb/ton refuse
6.15 x 10⁻³
1.23 x 10⁻²ppmv
For SO2:kg/Mg refuselb/ton refuse
1.07 x 10⁻²
2.15 x 10⁻²ppmv
For NOx:kg/Mg refuselb/ton refuse
7.70 x 10⁻³
1.54 x 10⁻²ppmv
For CO:kg/Mg refuselb/ton refuse
4.69 x 10⁻³
9.4 x 10⁻³ppmv
For CO2:kg/Mg refuselb/ton refuse
7.35 x 10⁻³
1.47 x 10⁻²ppmv
a At 7% O2.

10/96 Solid Waste Disposal 2.1-31
Table 2.1-11. CONVERSION FACTORS FOR REFUSE-DERIVED FUEL COMBUSTORS
Divide By To Obtaina
For As, Cd, Cr, Hg, Ni, Pb, and CDD/CDF:kg/Mg refuselb/ton refuse
4.92 x 10⁻⁶
9.85 x 10⁻⁶µg/dscm
For PM:kg/Mg refuselb/ton refuse
4.92 x 10⁻³
9.85 x 10⁻³mg/dscm
For HCl:kg/Mg refuselb/ton refuse
7.5 x 10⁻³
1.5 x 10⁻²ppmv
For SO2:kg/Mg refuselb/ton refuse
1.31 x 10⁻²
2.62 x 10⁻²ppmv
For NOx:kg/Mg refuselb/ton refuse
9.45 x 10⁻³
1.89 x 10⁻²ppmv
For CO:kg/Mg refuselb/ton refuse
5.75 x 10⁻³
1.15 x 10⁻²ppmv
For CO2:kg/Mg refuselb/ton refuse
9.05 x 10⁻³
1.81 x 10⁻²ppmv
a At 7% O2.
2.1-32 EMISSION FACTORS 10/96
Trench combustors can be built either above- or below-ground. They have refractory walls andfloors and are normally 8-feet wide and 10-feet deep. Length varies from 8 to 16 feet. Some units havemesh screens to contain larger particles of fly ash, but other add-on pollution controls are normally notused.
Trench combustors burning wood wastes, yard wastes, and clean lumber are exempt fromSection 129, provided they comply with opacity limitations established by the Administrator. The primaryuse of air curtain incinerators is the disposal of these types of wastes; however, some of these combustorsare used to burn MSW or construction and demolition debris.
In some states, trench combustors are often viewed as a version of open burning and the use ofthese types of units has been discontinued in some States.
2.1.7.3 Domestic Combustors - This category includes combustors marketed for residential use. These types of units are typically
located at apartment complexes, residential buildings, or other multiple family dwellings, and are generallyfound in urban areas. Fairly simple in design, they may have single or multiple refractory-lined chambersand usually are equipped with an auxiliary burner to aid combustion. Due to their small size, these types ofunits are not currently covered by the MWC regulations.
2.1.7.4 Flue-fed Combustors - These units, commonly found in large apartment houses or other multiple family dwellings, are
characterized by the charging method of dropping refuse down the combustor flue and into the combustionchamber. Modified flue-fed incinerators utilize afterburners and draft controls to improve combustionefficiency and reduce emissions. Due to their small size, these types of units are not currently covered bythe MWC regulations.
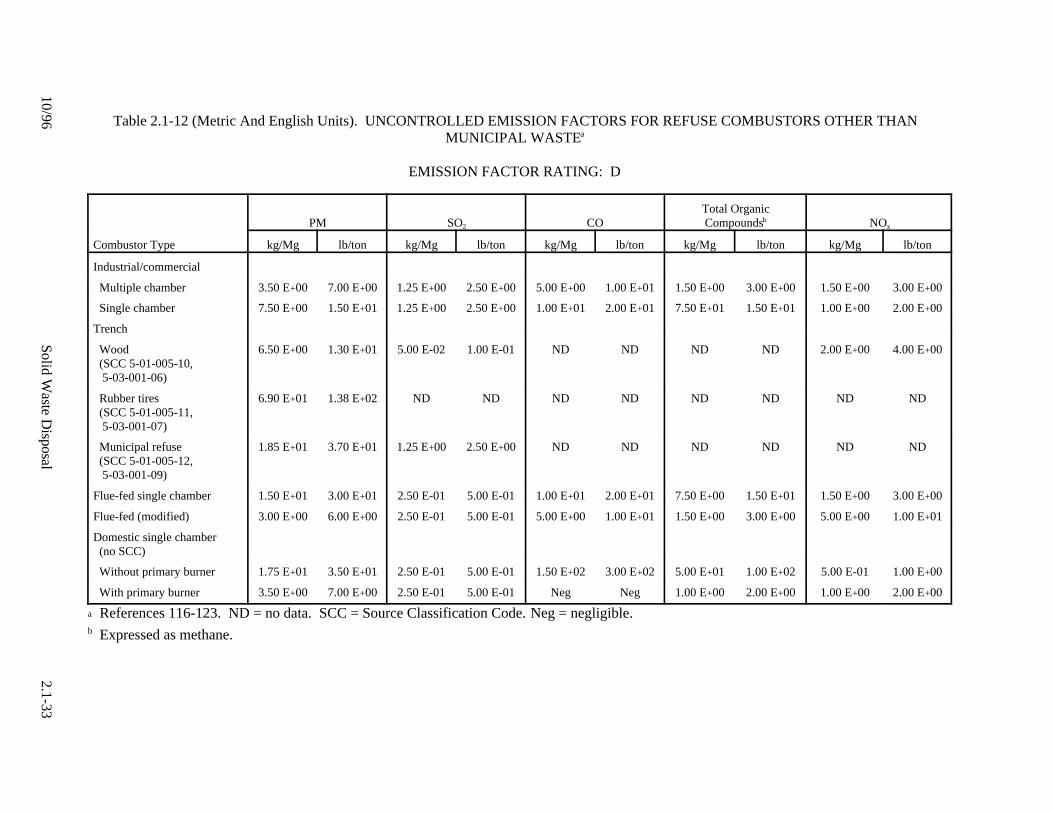
Emission factors for industrial/commercial, trench, domestic, and flue-fed combustors arepresented in Table 2.1-12.
10/96Solid W
aste Disposal
2.1-33
Table 2.1-12 (Metric And English Units). UNCONTROLLED EMISSION FACTORS FOR REFUSE COMBUSTORS OTHER THANMUNICIPAL WASTEa
EMISSION FACTOR RATING: D
PM SO2 COTotal OrganicCompoundsb NOx
Combustor Type kg/Mg lb/ton kg/Mg lb/ton kg/Mg lb/ton kg/Mg lb/ton kg/Mg lb/ton
Industrial/commercial
Multiple chamber 3.50 E+00 7.00 E+00 1.25 E+00 2.50 E+00 5.00 E+00 1.00 E+01 1.50 E+00 3.00 E+00 1.50 E+00 3.00 E+00
Single chamber 7.50 E+00 1.50 E+01 1.25 E+00 2.50 E+00 1.00 E+01 2.00 E+01 7.50 E+01 1.50 E+01 1.00 E+00 2.00 E+00
Trench
Wood (SCC 5-01-005-10, 5-03-001-06)
6.50 E+00 1.30 E+01 5.00 E-02 1.00 E-01 ND ND ND ND 2.00 E+00 4.00 E+00
Rubber tires (SCC 5-01-005-11, 5-03-001-07)
6.90 E+01 1.38 E+02 ND ND ND ND ND ND ND ND
Municipal refuse (SCC 5-01-005-12, 5-03-001-09)
1.85 E+01 3.70 E+01 1.25 E+00 2.50 E+00 ND ND ND ND ND ND
Flue-fed single chamber 1.50 E+01 3.00 E+01 2.50 E-01 5.00 E-01 1.00 E+01 2.00 E+01 7.50 E+00 1.50 E+01 1.50 E+00 3.00 E+00
Flue-fed (modified) 3.00 E+00 6.00 E+00 2.50 E-01 5.00 E-01 5.00 E+00 1.00 E+01 1.50 E+00 3.00 E+00 5.00 E+00 1.00 E+01
Domestic single chamber (no SCC)
Without primary burner 1.75 E+01 3.50 E+01 2.50 E-01 5.00 E-01 1.50 E+02 3.00 E+02 5.00 E+01 1.00 E+02 5.00 E-01 1.00 E+00
With primary burner 3.50 E+00 7.00 E+00 2.50 E-01 5.00 E-01 Neg Neg 1.00 E+00 2.00 E+00 1.00 E+00 2.00 E+00
a References 116-123. ND = no data. SCC = Source Classification Code. Neg = negligible.b Expressed as methane.
2.1-34 EMISSION FACTORS 10/96
References For Section 2.1
1. Written communication from D. A. Fenn and K. L. Nebel, Radian Corporation, Research TrianglePark, NC, to W. H. Stevenson, U. S. Environmental Protection Agency, Research Triangle Park,NC. March 1992.
2. J. Kiser, "The Future Role Of Municipal Waste Combustion", Waste Age, November 1991.
3. September 6, 1991. Meeting Summary: Appendix 1 (Docket No. A-90-45, Item Number II-E-12).
4. Municipal Waste Combustion Study: Combustion Control Of Organic Emissions, EPA/530-SW-87-021c, U. S. Environmental Protection Agency, Washington, DC, June 1987.
5. M. Clark, "Minimizing Emissions From Resource Recovery", Presented at the InternationalWorkshop on Municipal Waste Incineration, Quebec, Canada, October 1-2, 1987.
6. Municipal Waste Combustion Assessment: Combustion Control At Existing Facilities,EPA 600/8-89-058, U. S. Environmental Protection Agency, Research Triangle Park, NC, August1989.
7. Municipal Waste Combustors - Background Information For Proposed Standards: Control OfNOx Emissions, EPA-450/3-89-27d, U. S. Environmental Protection Agency, Research TrianglePark, NC, August 1989.
8. Municipal Waste Combustors - Background Information For Proposed Standards: PostCombustion Technology Performance, U. S. Environmental Protection Agency, August 1989.
9. Municipal Waste Combustion Study - Flue Gas Cleaning Technology, EPA/530-SW-87-021c,U. S. Environmental Protection Agency, Washington, DC, June 1987.
10. R. Bijetina, et al., "Field Evaluation of Methane de-NOx at Olmstead Waste-to-Energy Facility",Presented at the 7th Annual Waste-to-Energy Symposium, Minneapolis, MN, January 28-30,1992.
11. K. L. Nebel and D. M. White, A Summary Of Mercury Emissions And Applicable ControlTechnologies For Municipal Waste Combustors, Research Triangle Park, NC, September, 1991.
12. Emission Test Report: OMSS Field Test On Carbon Injection For Mercury Control,EPA-600/R-92-192, Office of Air Quality Planning and Standards, U. S. Environmental ProtectionAgency, Research Triangle Park, NC, September 1992.
13. J. D. Kilgroe, et al., "Camden Country MWC Carbon Injection Test Results", Presented at theInternational Conference on Waste Combustion, Williamsburg, VA, March 1993.
14. Meeting Summary: Preliminary Mercury Testing Results For The Stanislaus County MunicipalWaste Combustor, U. S. Environmental Protection Agency, Research Triangle Park, NC,November 22, 1991.
10/96 Solid Waste Disposal 2.1-35
15. R. A. Zurlinden, et al., Environmental Test Report, Alexandria/Arlington Resources RecoveryFacility, Units 1, 2, And 3, Report No. 144B, Ogden Martin Systems of Alexandria/Arlington,Inc., Alexandria, VA, March 9, 1988.
16. R. A. Zurlinden, et al., Environmental Test Report, Alexandria/Arlington Resource RecoveryFacility, Units 1, 2, And 3, Report No. 144A (Revised), Ogden Martin Systems ofAlexandria/Arlington, Inc., Alexandria, VA, January 8, 1988.
17. Environmental Test Report, Babylon Resource Recovery Test Facility, Units 1 And 2, OgdenMartin Systems of Babylon, Inc., Ogden Projects, Inc., March 1989.
18. Ogden Projects, Inc. Environmental Test Report, Units 1 And 2, Babylon Resource RecoveryFacility, Ogden Martin Systems for Babylon, Inc., Babylon, NY, February 1990.
19. PEI Associates, Inc. Method Development And Testing For Chromium, No. Refuse-to-EnergyIncinerator, Baltimore RESCO, EMB Report 85-CHM8, EPA Contract No. 68-02-3849, U. S.Environmental Protection Agency, Research Triangle Park, NC, August 1986.
20. Entropy Environmentalists, Inc. Particulate, Sulfur Dioxide, Nitrogen Oxides, Chlorides,Fluorides, And Carbon Monoxide Compliance Testing, Units 1, 2, And 3, Baltimore RESCOCompany, L. P., Southwest Resource Recovery Facility, RUST International, Inc., January 1985.
21. Memorandum. J. Perez, AM/3, State of Wisconsin, to Files. "Review Of Stack Test Performed AtBarron County Incinerator," February 24, 1987.
22. D. S. Beachler, et al., "Bay County, Florida, Waste-To-Energy Facility Air Emission Tests. Westinghouse Electric Corporation", Presented at Municipal Waste Incineration Workshop,Montreal, Canada, October 1987.
23. Municipal Waste Combustion, Multi-Pollutant Study. Emission Test Report. Volume I,Summary Of Results, EPA-600/8-89-064a, Maine Energy Recovery Company, Refuse-DerivedFuel Facility, Biddeford, ME, July 1989.
24. S. Klamm, et al., Emission Testing At An RDF Municipal Waste Combustor, EPA ContractNo. 68-02-4453, U. S. Environmental Protection Agency, NC, May 6, 1988. (Biddeford)
25. Emission Source Test Report -- Preliminary Test Report On Cattaraugus County, New YorkState Department of Environmental Conservation, August 5, 1986.
26. Permit No. 0560-0196 For Foster Wheeler Charleston Resource Recovery, Inc. Municipal SolidWaste Incinerators A & B, Bureau of Air Quality Control, South Carolina Department of Healthand Environmental Control, Charleston, SC, October 1989.
27. Almega Corporation. Unit 1 And Unit 2, EPA Stack Emission Compliance Tests, May 26, 27,And 29, 1987, At The Signal Environmental Systems, Claremont, NH, NH/VT Solid WasteFacility, Prepared for Clark-Kenith, Inc. Atlanta, GA, July 1987.
2.1-36 EMISSION FACTORS 10/96
28. Entropy Environmentalists, Inc. Stationary Source Sampling Report, Signal EnvironmentalSystems, Inc., At The Claremont Facility, Claremont, New Hampshire, Dioxins/Furans EmissionsCompliance Testing, Units 1 And 2, Reference No. 5553-A, Signal Environmental Systems, Inc.,Claremont, NH, October 2, 1987.
29. M. D. McDannel, et al., Air Emissions Tests At Commerce Refuse-To-Energy Facility May 26 -June 5, 1987, County Sanitation Districts of Los Angeles County, Whittier, CA, July 1987.
30. M. D. McDannel and B. L. McDonald, Combustion Optimization Study At The CommerceRefuse-To-Energy Facility. Volume I, ESA 20528-557, County Sanitation Districts ofLos Angeles County, Los Angeles, CA, June 1988.
31. M. D. McDannel et al., Results Of Air Emission Test During The Waste-to-Energy Facility,County Sanitation Districts Of Los Angeles County, Whittier, CA, December 1988. (Commerce)
32. Radian Corporation. Preliminary Data From October - November 1988 Testing At TheMontgomery County South Plant, Dayton, Ohio.
33. Written communication from M. Hartman, Combustion Engineering, to D. White,Radian Corporation, Detroit Compliance Tests, September 1990.
34. Interpoll Laboratories. Results Of The November 3-6, 1987 Performance Test On The No. 2 RDFAnd Sludge Incinerator At The WLSSD Plant In Duluth, Minnesota, Interpoll Report No. 7-2443,April 25, 1988.
35. D. S. Beachler, (Westinghouse Electric Corporation) and ETS, Inc, Dutchess County ResourceRecovery Facility Emission Compliance Test Report, Volumes 1-5, New York Department ofEnvironmental Conservation, June 1989.
36. ETS, Inc. Compliance Test Report For Dutchess County Resource Recovery Facility, May 1989.
37. Written communication and enclosures from W. Harold Snead, City of Galax, VA, toJack R. Farmer, U. S. Environmental Protection Agency, Research Triangle Park, NC,July 14, 1988.
38. Cooper Engineers, Inc., Air Emissions Tests Of Solid Waste Combustion A RotaryCombustion/Boiler System At Gallatin, Tennessee, West County Agency of Contra Costa County,CA, July 1984.
39. B. L. McDonald, et al., Air Emissions Tests At The Hampton Refuse-Fired Stream GeneratingFacility, April 18-24, 1988, Clark-Kenith, Incorporated, Bethesda, MD, June 1988.
40. Radian Corporation for American Ref-Fuel Company of Hempstead, Compliance Test Report ForThe Hempstead Resource Recovery Facility, Westbury, NY, Volume I, December 1989.
41. J. Campbell, Chief, Air Engineering Section, Hillsborough County Environmental ProtectionCommission, to E. L. Martinez, Source Analysis Section/AMTB, U. S. Environmental ProtectionAgency, May 1, 1986.
42. Mitsubishi SCR System for Municipal Refuse Incinerator, Measuring Results At Tokyo-
10/96 Solid Waste Disposal 2.1-37
Hikarigaoka And Iwatsuki, Mitsubishi Heavy Industries, Ltd, July 1987.
43. Entropy Environmentalists, Inc. for Honolulu Resource Recovery Venture, Stationary SourceSampling Final Report, Volume I, Oahu, HI, February 1990.
44. Ogden Projects, Inc., Environmental Test Report, Indianapolis Resource Recovery Facility,Appendix A And Appendix B, Volume I, (Prepared for Ogden Martin Systems of Indianapolis,Inc.), August 1989.
45. D. R. Knisley, et al. (Radian Corporation), Emissions Test Report, Dioxin/Furan EmissionTesting, Refuse Fuels Associates, Lawrence MA, (Prepared for Refuse Fuels Association),Haverhill, MA, June 1987.
46. Entropy Environmentalists, Inc. Stationary Source Sampling Report, Ogden Martin Systems ofHaverhill, Inc., Lawrence, MA Thermal Conversion Facility. Particulate, Dioxins/Furans andNitrogen Oxides Emission Compliance Testing, September 1987.
47. D. D. Ethier, et al. (TRC Environmental Consultants), Air Emission Test Results At TheSoutheast Resource Recovery Facility Unit 1, October - December, 1988, Prepared for DravoCorporation, Long Beach, CA, February 28, 1989.
48. Written communication from from H. G. Rigo, Rigo & Rigo Associates, Inc., to M. Johnston,U. S. Environmental Protection Agency. March 13, 1989. 2 pp. Compliance Test Report UnitNo. 1 -- South East Resource Recovery Facility, Long Beach, CA.
49. M. A. Vancil and C. L. Anderson (Radian Corporation), Summary Report CDD/CDF, Metals,HCl, SO2, NOx, CO And Particulate Testing, Marion County Solid Waste-To-Energy Facility,Inc., Ogden Martin Systems Of Marion, Brooks, Oregon, U. S. Environmental Protection Agency,Research Triangle Park, NC, EMB Report No. 86-MIN-03A, September 1988.
50. C. L. Anderson, et al. (Radian Corporation), Characterization Test Report, Marion County SolidWaste-To-Energy Facility, Inc., Ogden Martin Systems Of Marion, Brooks, Oregon, U. S.Environmental Protection Agency, Research Triangle Park, NC, EMB Report No. 86-MIN-04,September 1988.
51. Letter Report from M. A. Vancil, Radian Corporation, to C. E. Riley, EMB Task Manager, U. S.Environmental Protection Agency. Emission Test Results for the PCDD/PCDF Internal StandardsRecovery Study Field Test: Runs 1, 2, 3, 5, 13, 14. July 24, 1987. (Marion)
52. C. L. Anderson, et al., (Radian Corporation). Shutdown/Startup Test Program Emission TestReport, Marion County Solid Waste-To-Energy Facility, Inc., Ogden Martin Systems Of Marion,Brooks, Oregon, U. S. Environmental Protection Agency, Research Triangle Park, NC, EMBReport No. 87-MIN-4A, September 1988.
53. Clean Air Engineering, Inc., Report On Compliance Testing For Waste Management, Inc. At TheMcKay Bay Refuse-to-Energy Project Located In Tampa, Florida, October 1985.
2.1-38 EMISSION FACTORS 10/96
54. Alliance Technologies Corporation, Field Test Report - NITEP III. Mid-Connecticut Facility,Hartford, Connecticut. Volume II Appendices, Prepared for Environment Canada. June 1989.
55. C. L. Anderson, (Radian Corporation), CDD/CDF, Metals, And Particulate Emissions SummaryReport, Mid-Connecticut Resource Recovery Facility, Hartford, Connecticut,U. S. Environmental Protection Agency, Research Triangle Park, NC, EMB ReportNo. 88-MIN-09A, January 1989.
56. Entropy Environmentalists, Inc., Municipal Waste Combustion Multi-Pollutant Study, SummaryReport, Wheelabrator Millbury, Inc., Millbury, MA, U. S. Environmental Protection Agency,Research Triangle Park, NC, EMB Report No. 88-MIN-07A, February 1989.
57. Entropy Environmentalists, Inc., Emissions Testing Report, Wheelabrator Millbury, Inc. Resource Recovery Facility, Millbury, Massachusetts, Unit Nos. 1 And 2, February 8 through 12,1988, Prepared for Rust International Corporation. Reference No. 5605-B. August 5, 1988.
58. Entropy Environmentalists, Inc., Stationary Source Sampling Report, Wheelabrator Millbury,Inc., Resource Recovery Facility, Millbury, Massachusetts, Mercury Emissions ComplianceTesting, Unit No. 1, May 10 And 11, 1988, Prepared for Rust International Corporation. Reference No. 5892-A, May 18, 1988.
59. Entropy Environmentalists, Inc., Emission Test Report, Municipal Waste Combustion ContinuousEmission Monitoring Program, Wheelabrator Resource Recovery Facility, Millbury,Massachusetts, U. S. Environmental Protection Agency, Research Triangle Park, NC, EmissionTest Report 88-MIN-07C, January 1989.
60. Entropy Environmentalists, Municipal Waste Combustion Multipollutant Study: Emission TestReport - Wheelabrator Millbury, Inc. Millbury, Massachusetts, EMB Report No. 88-MIN-07,July 1988.
61. Entropy Environmentalists, Emission Test Report, Municipal Waste Combustion, ContinuousEmission Monitoring Program, Wheelabrator Resource Recovery Facility, Millbury,Massachusetts, Prepared for the U. S. Environmental Protection Agency, Research Triangle Park,NC. EPA Contract No. 68-02-4336, October 1988.
62. Entropy Environmentalists, Emissions Testing At Wheelabrator Millbury, Inc. ResourceRecovery Facility, Millbury, Massachusetts, Prepared for Rust International Corporation. February 8-12, 1988.
63. Radian Corporation, Site-Specific Test Plan And Quality Assurance Project Plan For TheScreening And Parametric Programs At The Montgomery County Solid Waste ManagementDivision South Incinerator - Unit #3, Prepared for U. S. EPA, OAQPS and ORD, ResearchTriangle Park, NC, November 1988.
64. Written communication and enclosures from John W. Norton, County of Montgomery, OH, to JackR. Farmer, U. S. Environmental Protection Agency, Research Triangle Park, NC. May 31, 1988.
10/96 Solid Waste Disposal 2.1-39
65. J. L. Hahn, et al., (Cooper Engineers) and J. A. Finney, Jr., et al., (Belco Pollution Control Corp.),"Air Emissions Tests Of A Deutsche Babcock Anlagen Dry Scrubber System At The MunichNorth Refuse-Fired Power Plant", Presented at: 78th Annual Meeting of the Pollution ControlAssociation, Detroit, MI, June 1985.
66. Clean Air Engineering, Results Of Diagnostic And Compliance Testing At NSP French IslandGenerating Facility Conducted May 17 - 19, 1989, July 1989.
67. Preliminary Report On Occidental Chemical Corporation EFW. New York State Department OfEnvironmental Conservation, (Niagara Falls), Albany, NY, January 1986.
68. H. J. Hall, Associates, Summary Analysis On Precipitator Tests And Performance Factors,May 13-15, 1986 At Incinerator Units 1, 2 - Occidental Chemical Company, Prepared forOccidental Chemical Company EFW, Niagara Falls, NY, June 25, 1986.
69. C. L. Anderson, et al. (Radian Corporation), Summary Report, CDD/CDF, Metals andParticulate, Uncontrolled And Controlled Emissions, Signal Environmental Systems, Inc., NorthAndover RESCO, North Andover, MA, U. S. Environmental Protection Agency, Research TrianglePark, NC, EMB Report No. 86-MINO2A, March 1988.
70. York Services Corporation, Final Report For A Test Program On The Municipal IncineratorLocated At Northern Aroostook Regional Airport, Frenchville, Maine, Prepared for NorthernAroostook Regional Incinerator Frenchville, ME, January 26, 1987.
71. Radian Corporation, Results From The Analysis Of MSW Incinerator Testing At Oswego County,New York, Prepared for New York State Energy Research and Development Authority, March1988.
72. Radian Corporation, Data Analysis Results For Testing At A Two-Stage Modular MSWCombustor: Oswego County ERF, Fulton, New York, Prepared for New York State's EnergyResearch and Development Authority, Albany, NY, November 1988.
73. A. J. Fossa, et al., Phase I Resource Recovery Facility Emission Characterization Study,Overview Report, (Oneida, Peekskill), New York State Department of EnvironmentalConservation, Albany, NY, May 1987.
74. Radian Corporation, Results From The Analysis Of MSW Incinerator Testing At Peekskill,New York, Prepared for New York State Energy Research and Development Authority,DCN:88-233-012-21, August 1988.
75. Radian Corporation, Results from the Analysis of MSW Incinerator Testing at Peekskill, NewYork (DRAFT), (Prepared for the New York State Energy Research and Development Authority),Albany, NY, March 1988.
76. Ogden Martin Systems of Pennsauken, Inc., Pennsauken Resource Recovery Project, BACTAssessment For Control Of NOx Emissions, Top-Down Technology Consideration, Fairfield, NJ,pp. 11, 13, December 15, 1988.
77. Roy F. Weston, Incorporated, Penobscot Energy Recovery Company Facility, Orrington, Maine,Source Emissions Compliance Test Report Incinerator Units A And B (Penobscot, Maine),
2.1-40 EMISSION FACTORS 10/96
Prepared for GE Company, September 1988.
78. S. Zaitlin, Air Emission License Finding Of Fact And Order, Penobscot Energy RecoveryCompany, Orrington, ME, State of Maine, Department of Environmental Protection, Board ofEnvironmental Protection, February 26, 1986.
79. R. Neulicht, (Midwest Research Institute), Emissions Test Report: City Of PhiladelphiaNorthwest And East Central Municipal Incinerators, Prepared for the U. S. EnvironmentalProtection Agency, Philadelphia, PA, October 31, 1985.
80. Written communication with attachments from Philip Gehring, Plant Manager (Pigeon PointEnergy Generating Facility), to Jack R. Farmer, Director, ESD, OAQPS, U. S. EnvironmentalProtection Agency, June 30, 1988.
81. Entropy Environmentalists, Inc., Stationary Source Sampling Report, Signal RESCO, PinellasCounty Resource Recovery Facility, St. Petersburg, Florida, CARB/DER Emission Testing,Unit 3 Precipitator Inlets and Stack, February and March 1987.
82. Midwest Research Institute, Results Of The Combustion And Emissions Research Project At TheVicon Incinerator Facility In Pittsfield, Massachusetts, Prepared for New York State EnergyResearch and Development Authority, June 1987.
83. Response to Clean Air Act Section 114 Information Questionnaire, Results of Non-CriteriaPollutant Testing Performed at Pope-Douglas Waste to Energy Facility, July 1987, Provided toEPA on May 9, 1988.
84. Engineering Science, Inc., A Report On Air Emission Compliance Testing At The Regional WasteSystems, Inc. Greater Portland Resource Recovery Project, Prepared for Dravo EnergyResources, Inc., Pittsburgh, PA, March 1989.
85. D. E. Woodman, Test Report Emission Tests, Regional Waste Systems, Portland, ME, February1990.
86. Environment Canada, The National Incinerator Testing And Evaluation Program: Two StateCombustion, Report EPS 3/up/1, (Prince Edward Island), September 1985.
87. Statistical Analysis Of Emission Test Data From Fluidized Bed Combustion Boilers At PrinceEdward Island, Canada, U. S. Environmental Protection Agency, Publication No. EPA-450/3-86-015, December 1986.
88. The National Incinerator Testing And Evaluation Program: Air Pollution Control Technology,EPS 3/UP/2, (Quebec City), Environment Canada, Ottawa, September 1986.
89. Lavalin, Inc., National Incinerator Testing And Evaluation Program: The CombustionCharacterization Of Mass Burning Incinerator Technology; Quebec City (DRAFT), (Prepared forEnvironmental Protection Service, Environmental Canada), Ottawa, Canada, September 1987.
90. Environment Canada, NITEP, Environmental Characterization Of Mass Burning IncineratorTechnology at Quebec City. Summary Report, EPS 3/UP/5, June 1988.

2.1-42 EMISSION FACTORS 10/96
91. Interpoll Laboratories, Results Of The March 21 - 26, 1988, Air Emission Compliance Test OnThe No. 2 Boiler At The Red Wing Station, Test IV (High Load), Prepared for Northern StatesPower Company, Minneapolis, MN, Report No. 8-2526, May 10, 1988.
92. Interpoll Laboratories, Results Of The May 24-27, 1988 High Load Compliance Test On Unit 1And Low Load Compliance Test On Unit 2 At The NSP Red Wing Station, Prepared for NorthernStates Power Company, Minneapolis, MN, Report No. 8-2559, July 21, 1988.
93. Cal Recovery Systems, Inc., Final Report, Evaluation Of Municipal Solid Waste Incineration. (Red Wing, Minnesota facility) Submitted To Minnesota Pollution Control Agency, ReportNo. 1130-87-1, January 1987.
94. Eastmount Engineering, Inc., Final Report, Waste-To-Energy Resource Recovery Facility,Compliance Test Program, Volumes II-V, (Prepared for SEMASS Partnership.), March 1990.
95. D. McClanahan, (Fluor Daniel), A. Licata (Dravo), and J. Buschmann (Flakt, Inc.)., "OperatingExperience With Three APC Designs On Municipal Incinerators". Proceedings of theInternational Conference on Municipal Waste Combustion, pp. 7C-19 to 7C-41, (Springfield),April 11-14, 1988.
96. Interpoll Laboratories, Inc., Results Of The June 1988 Air Emission Performance Test On TheMSW Incinerators At The St. Croix Waste To Energy Facility In New Richmond, Wisconsin,Prepared for American Resource Recovery, Waukesha, WI, Report No. 8-2560, September 12,1988.
97. Interpoll Laboratories, Inc, Results Of The June 6, 1988, Scrubber Performance Test At TheSt. Croix Waste To Energy Incineration Facility In New Richmond, Wisconsin, Prepared forInterel Corporation, Englewood, CO, Report No. 8-2560I, September 20, 1988.
98. Interpoll Laboratories, Inc., Results Of The August 23, 1988, Scrubber Performance Test At TheSt. Croix Waste To Energy Incineration Facility In New Richmond, Wisconsin, Prepared forInterel Corporation, Englewood, CO, Report No. 8-2609, September 20, 1988.
99. Interpoll Laboratories, Inc., Results Of The October 1988 Particulate Emission Compliance TestOn The MSW Incinerator At The St. Croix Waste To Energy Facility In New Richmond,Wisconsin, Prepared for American Resource Recovery, Waukesha, WI, Report No. 8-2547,November 3, 1988.
100. Interpoll Laboratories, Inc., Results Of The October 21, 1988, Scrubber Performance Test At TheSt. Croix Waste To Energy Facility In New Richmond, Wisconsin, Prepared for InterelCorporation, Englewood, CO, Report No. 8-2648, December 2, 1988.
101. J. L. Hahn, (Ogden Projects, Inc.), Environmental Test Report, Prepared for Stanislaus WasteEnergy Company Crows Landing, CA, OPI Report No. 177R, April 7, 1989.
102. J. L. Hahn, and D. S. Sofaer, "Air Emissions Test Results From The Stanislaus County, CaliforniaResource Recovery Facility", Presented at the International Conference on Municipal WasteCombustion, Hollywood, FL, pp. 4A-1 to 4A-14, April 11-14, 1989.
10/96 Solid Waste Disposal 2.1-43
103. R. Seelinger, et al. (Ogden Products, Inc.), Environmental Test Report, Walter B. Hall ResourceRecovery Facility, Units 1 And 2, (Prepared for Ogden Martin Systems of Tulsa, Inc.), Tulsa, OK,September 1986.
104. PEI Associates, Inc, Method Development And Testing for Chromium, Municipal RefuseIncinerator, Tuscaloosa Energy Recovery, Tuscaloosa, Alabama, U. S. Environmental ProtectionAgency, Research Triangle Park, NC, EMB Report 85-CHM-9, January 1986.
105. T. Guest and O. Knizek, "Mercury Control At Burnaby's Municipal Waste Incinerator",Proceedings of the 84th Annual Meeting and Exhibition of the Air and Waste ManagementAssociation, Vancouver, British Columbia, Canada, June 16-21, 1991.
106. Trip Report, Burnaby MWC, British Columbia, Canada. White, D., Radian Corporation, May1990.
107. Entropy Environmentalists, Inc. for Babcock & Wilcox Co. North County Regional ResourceRecovery Facility, West Palm Beach, FL, October 1989.
108. P. M. Maly, et al., Results Of The July 1988 Wilmarth Boiler Characterization Tests, GasResearch Institute Topical Report No. GRI-89/0109, June 1988-March 1989.
109. J. L. Hahn, (Cooper Engineers, Inc.), Air Emissions Testing At The Martin GmbH Waste-To-Energy Facility In Wurzburg, West Germany, Prepared for Ogden Martin Systems, Inc., Paramus,NJ, January 1986.
110. Entropy Environmentalists, Inc. for Westinghouse RESD, Metals Emission Testing Results,Conducted At The York County Resource Recovery Facility, February 1991.
111. Entropy Environmentalists, Inc. for Westinghouse RESD, Emissions Testing For: HexavalentChromium, Metals, Particulate. Conducted At The York County Resource Recovery Facility,July 31 - August 4, 1990.
112. Interpoll Laboratories, Results of the July 1987 Emission Performance Tests Of ThePope/Douglas Waste-To-Energy Facility MSW Incinerators In Alexandria, Minnesota, (Preparedfor HDR Techserv, Inc.), Minneapolis, MN, October 1987.
113. D. B. Sussman, Ogden Martin System, Inc., Submittal to Air Docket (LE-131), DocketNo. A-89-08, Category IV-M, Washington, DC, October 1990.
114. F. Ferraro, Wheelabrator Technologies, Inc., Data package to D. M. White, Radian Corporation,February 1991.
115. D. R. Knisley, et al. (Radian Corporation), Emissions Test Report, Dioxin/Furan EmissionTesting, Refuse Fuels Associates, Lawrence, Massachusetts, (Prepared for Refuse FuelsAssociation), Haverhill, MA, June 1987.
116. Entropy Environmentalists, Inc., Stationary Source Sampling Report, Ogden Martin Systems OfHaverhill, Inc., Lawrence, Massachusetts Thermal Conversion Facility. Particulate,Dioxins/Furans And Nitrogen Oxides Emission Compliance Testing, September 1987.
10/96 Solid Waste Disposal 2.1-45
117. A. J. Fossa, et al., Phase I Resource Recovery Facility Emission Characterization Study,Overview Report, New York State Department of Environmental Conservation, Albany, NY, May1987.
118. Telephone communciation between D. DeVan, Oneida ERF, and M. A. Vancil, RadianCorporation. April 4, 1988. Specific collecting area of ESPs.
119. G. M. Higgins, An Evaluation Of Trace Organic Emissions From Refuse Thermal ProcessingFacilities (North Little Rock, Arkansas; Mayport Naval Station, Florida; And Wright PattersonAir Force Base, Ohio), Prepared for U. S. Environmental Protection Agency/Office of Solid Wasteby Systech Corporation, July 1982.
120. R. Kerr, et al., Emission Source Test Report--Sheridan Avenue RDF Plant, Answers (Albany,New York), Division of Air Resources, New York State Department of EnvironmentalConservation, August 1985.
121. U. S. Environmental Protection Agency, Emission Factor Documentation for AP-42 Section 2.1,Refuse Combustion, Research Triangle Park, NC, May 1993.
122. Air Pollutant Emission Factors, APTD-0923, U. S. Environmental Protection Agency, ResearchTriangle Park, NC, April 1970.
123. Control Techniques For Carbon Monoxide Emissions From Stationary Sources, AP-65,U. S. Environmental Protection Agency, Research Triangle Park, NC, March 1970.
124. Air Pollution Engineering Manual, AP-40, U. S. Environmental Protection Agency, ResearchTriangle Park, NC, 1967.
125. J. DeMarco, et al., Incinerator Guidelines 1969, SW. 13TS, U. S. Environmental ProtectionAgency, Research Triangle Park, NC, 1969.
126. Municipal Waste Combustors - Background Information For Proposed Guidelines For ExistingFacilities, U. S. Environmental Protection Agency, Research Triangle Park, NC, EPA-450/3-89-27e, August 1989.
127. Municipal Waste Combustors - Background Information for Proposed Standards: Control OfNOx Emissions U. S. Environmental Protection Agency, Research Triangle Park, NC, EPA-450/3-89-27d, August 1989.
127. J. O. Brukle, et al., "The Effects Of Operating Variables And Refuse Types On Emissions From APilot-scale Trench Incinerator," Proceedings of the 1968 Incinerator Conference, AmericanSociety of Mechanical Engineers, New York, NY, May 1968.
128. W. R. Nessen, Systems Study Of Air Pollution From Municipal Incineration, Arthur D. Little,Inc., Cambridge, MA, March 1970.
130. C. R. Brunner, Handbook Of Incineration Systems, McGraw-Hill, Inc., pp. 10.3-10.4, 1991.
131. Telephone communication between K. Quincey, Radian Corporation, and E. Raulerson, FloridaDepartment of Environmental Regulations, February 16, 1993.
2.1-46 EMISSION FACTORS 10/96
132. Telephone communication between K. Nebel and K. Quincey, Radian Corporation, andM. McDonnold, Simonds Manufacturing, February 16, 1993.
133. Telephone communication between K. Quincey, Radian Corporation, and R. Crochet, CrochetEquipment Company, February 16 and 26, 1993.
134. Telephone communication between K. Quincey, Radian Corporation, and T. Allen, NC Division ofEnvironmental Management, February 16, 1993.
135. John Pacy, Methane Gas In Landfills: Liability Or Asset?, Proceedings of the Fourth NationalCongress of the Waste Management Technology and Resource and Energy Recovery, Co-sponsored by the National Solid Wastes Management Association and U. S. EPA, November 12-14, 1975.