Embed Size (px)
Citation preview

22
2.1 Introduction
This section deals with the development of a simple, sensitive, specific,
spectrophotometric, HPLC and HPTLC methods for the determination of pregabalin in
bulk and pharmaceutical formulation. An extensive literature survey shows that there are
few reports on determining pregabalin contents in pharmaceuticals have been published,
involving spectrophotometric - spectrofluorimetric methods1
and pre column
derivatization method using internal standard 2, 3
. Synthesis and characterization of
pregabalin lactose degradation product was also reported 4. Literature survey further
revealed the availability of the UV method (bulk, formulation, human urine sample) 5
,
Colorimetric methods6, HPLC methods
7-11 and analysis of pregabalin in Human
12-15 and
rat plasma 16
. The development of a gradient RP-HPLC method and validation for the
determination of Pregabalin and its related substances in bulk drug as well as its
pharmaceutical formulations was also addressed in this section. Pregabalin is official in
Pharmacopoeia 17
. However the Pharmacopoeial method and the reported HPLC methods
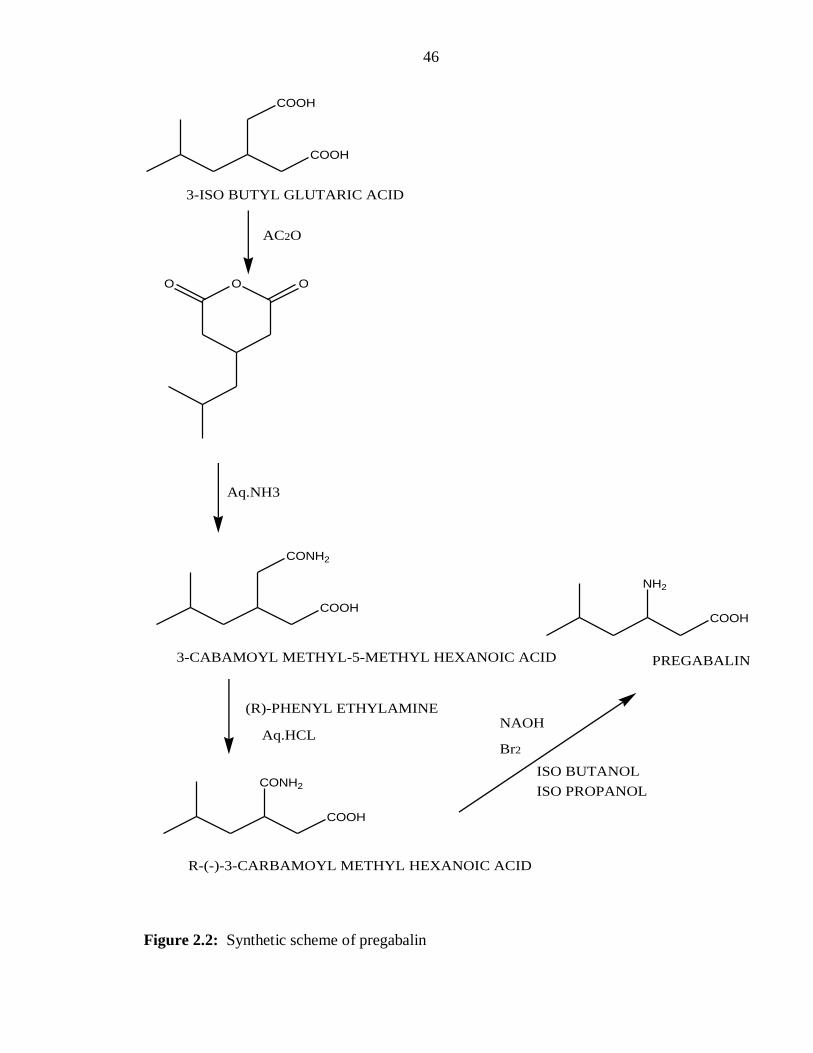
was not able to well resolve all potential impurities that may form during the synthetic
process (Figure 2.2) or carried over from the starting material, so it is felt necessary to
develop a suitable stability-indicating LC method with an objective to resolve all the
potential impurities. A simple and sensitive thin-layer chromatographic method for the
analysis of pregabalin in bulk and its pharmaceutical dosage form was also carried upon.
Since there are no reported HPTLC method found through computer assisted literature
survey, the developed planar- chromatographic method (HPTLC) would serve as a rapid
and reliable method for the determination of pregabalin in bulk and its pharmaceutical
dosage form.

23
2.2. Experimental
2.2.1. UV Method
2.2.1.1. Materials
Pregabalin was obtained from Aurabindo Pharmaceuticals Ltd (Hyderabad, India). It was
used without further purification. Its Pharmaceutical preparation, Lyrica Capsule
(Manufacturer- Pfizer) was purchased from a local drug store; it contained 25mg active
material.
2.2.1.2. Preparation of the standard stock solution
A standard drug solution of pregabalin was prepared by dissolving 100 mg of pregabalin
in 10 mL of double distilled water and this was transferred into a 100 mL volumetric
flask to obtain a stock solution of 1000 µg/mL.
2.2.1.3. Preparation of the working solution
From the above stock solution, 10 mL of the sample was transferred into a 100 mL
volumetric flask and the volume was made up to the mark with distilled water to prepare
a concentration of 100 µg/mL. The solution was further diluted and scanned in the range
of 200-400 nm using distilled water as blank. The wavelength corresponding to the
maximum absorbance (λmax) was found to be 210 nm. This was further utilized to obtain
a calibration curve.
2.2.1.4. Preparation of sample solution
The proposed method was applied to analyze the commercially available pregabalin
capsules. Twenty capsules were weighed and amount of capsule powder equivalent to 10
mg of pregabalin was weighed accurately and transferred to a 100 mL volumetric flask
dissolved in distilled water, then the volume was brought up to 100 mL by using the same
24
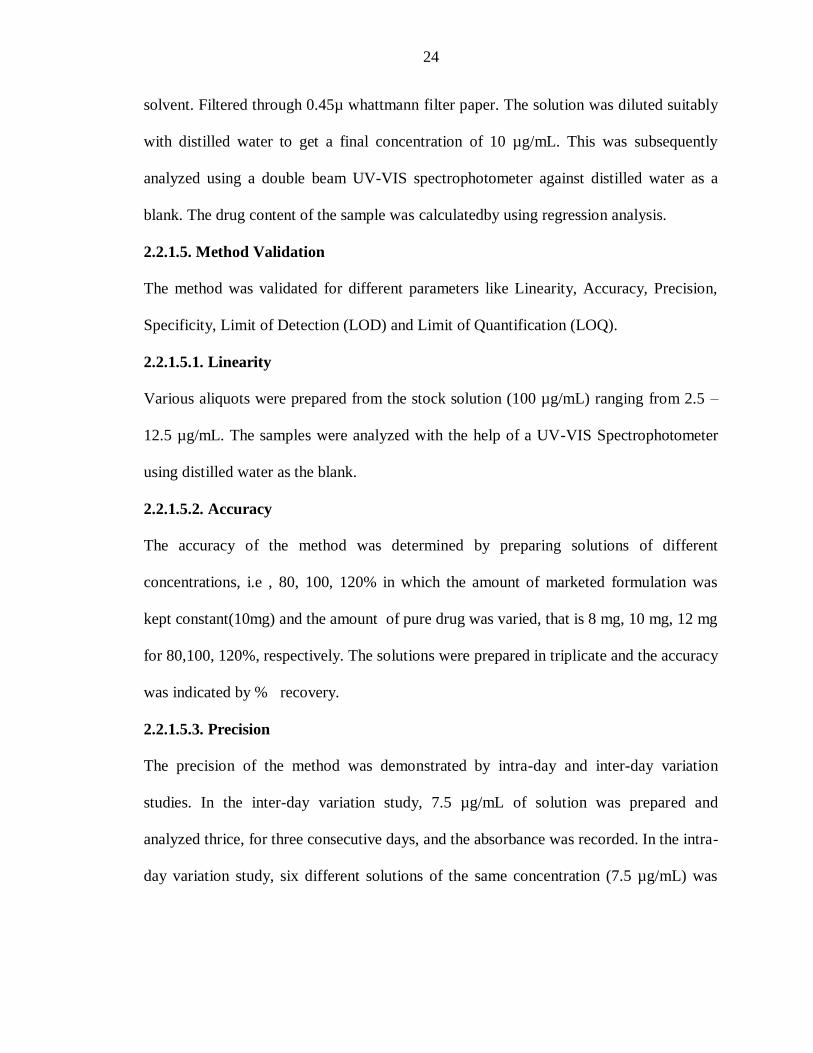
solvent. Filtered through 0.45µ whattmann filter paper. The solution was diluted suitably
with distilled water to get a final concentration of 10 µg/mL. This was subsequently
analyzed using a double beam UV-VIS spectrophotometer against distilled water as a
blank. The drug content of the sample was calculatedby using regression analysis.
2.2.1.5. Method Validation
The method was validated for different parameters like Linearity, Accuracy, Precision,
Specificity, Limit of Detection (LOD) and Limit of Quantification (LOQ).
2.2.1.5.1. Linearity
Various aliquots were prepared from the stock solution (100 µg/mL) ranging from 2.5 –
12.5 µg/mL. The samples were analyzed with the help of a UV-VIS Spectrophotometer
using distilled water as the blank.
2.2.1.5.2. Accuracy
The accuracy of the method was determined by preparing solutions of different
concentrations, i.e , 80, 100, 120% in which the amount of marketed formulation was
kept constant(10mg) and the amount of pure drug was varied, that is 8 mg, 10 mg, 12 mg
for 80,100, 120%, respectively. The solutions were prepared in triplicate and the accuracy
was indicated by % recovery.
2.2.1.5.3. Precision
The precision of the method was demonstrated by intra-day and inter-day variation
studies. In the inter-day variation study, 7.5 µg/mL of solution was prepared and
analyzed thrice, for three consecutive days, and the absorbance was recorded. In the intra-
day variation study, six different solutions of the same concentration (7.5 µg/mL) was
25
prepared and analyzed thrice a day (morning, afternoon, and evening). The results were
indicated by % RSD.
2.2.1.5.4. Limit of Detection & Limit of quantification
The LOD & LOQ were calculated using the formula involving the standard deviation of
response and the slope of the calibration curve. LOD = Cd × Syx / b and LOQ = Cq ×
Syx / b. Where Cd and Cq are the coefficients for LOD and LOQ. Syx is the residual
Variance of the Regression, and b is the Slope. Calculation was performed by using
values of Cd and Cq of 3.3 and 10.
2.2.2. HPLC Method
2.2.2.1. Materials
Reference standard of Pregabalin and its related impurities (Figure 2.3) were procured
from Aurabindo Pharmaceuticals (Hyderabad, India). The potential impurities in
pregabalin are 3-isobutylglutaric acid (Impurity A), (R)-(-)-3-Carbamoylmethyl-
5methylhexanoic acid (Impurity- B), and 4-isobutylpyrrolidin-2-one (Impurity C). The
HPLC grade acetonitrile was purchased from Merck, India. Analytical grade potassium
dihydrogen phosphate, potassium hydroxide and methanol were obtained from S.D. Fine
Chemicals Ltd. (Mumbai, India). High purity water was prepared by using Millipore
Milli-Q plus purification system (Millipore, Bedford, USA).
2.2.2.2. Instrumentation
Waters HPLC equipped with quaternary pump and PDA detector was used. The output
signal was monitored and integrated by waters empower 2 software.
26
2.2.2.3. Chromatographic conditions
The chromatographic column used was Inertsil ODS 3V, 250 x 4.6 mm, 5 µm particles.
Mobile phase consisted of A and B. A was prepared by dissolving 2.72g of potassium
dihydrogen orthophosphate in 1000 mL of water, adjusted the pH of the solution to 5.9 ±
0.05 with dilute potassium hydroxide solution and filtered by using 0.45 µm nylon filter
and prepare a degassed mixture of buffer and methanol in the ratio of 90:10. This is
mobile phase A. Mobile phase B was pure acetonitile. Mobile phase flow rate was set at
1.0 mL min-1
. The applied gradient program is shown in Table 2.6. The temperature of
the column was maintained at 35oC. A wavelength of 210nm was used for the detection
and the injection volume used was 20µL.
2.2.2.4. Standard preparation
Weigh accurately about 25mg of reference standard of pregabalin in 25 mL volumetric
flask. Add about 10 mL of the diluent with intermittent shaking and made up to the mark
by using diluent (water is used as diluent). Pipette 2 mL of this solution in to a 25 mL
volumetric flask and dilute to volume with diluent and mix well. Filter about 2 mL
through 0.45 µm pall pharma lab nylon 66 membrane filters or 0.45 µm Dura pore PVDF
hydrophilic membrane filter.
2.2.2.5. Sample preparation
To determine the pregabalin content in capsules, (Lyrica- Brand Name) which contained
25 mg of pregabalin per capsule was selected. Capsule powder equivalent to 25 mg was
weighed accurately and transferred in to 25 mL standard flask, add 17 mL of diluent,
sonicate for 30 min, then dilute to volume and mix well. Further dilutions were carried
out to obtain same concentration as standard.
27
2.2.2.6. System suitability solution
A study to establish the interference of impurities was conducted. Prepared the impurity
solutions in the concentration of 0.3% of all impurities with respect to standard
preparation. Spiked the standard preparation with impurity blend solution and injected in
to HPLC system.
2.2.2.7. System suitability parameters
Resolution between Impurity -A and pregabalin obtained from the chromatogram from
the system suitability solution should not be less than 2.0. The % RSD for the peak areas
of six replicate injections for pregabalin is not more than 5.0%. Theoretical plates for
pregabalin and its three main impurities should be more than 2000 and the tailing factor
should not be more than 2.0, respectively.
2.2.2.8. Method Validation
2.2.2.8.1. Precision
The precision was carried out by six independent assay determination of pregabalin
against a reference standard and the % R.S.D of the assay was calculated. In the case of
related substances, the precision was checked by spiking the known impurities to
pregabalin reference standard and calculating the % R.S.D of area for each impurity.
Intermediate precision was conducted by different analyst in different days in accordance
with ICH guidelines.
2.2.2.8.2. Limit of detection (LOD) and limit of quantification (LOQ)
The LOD and LOQ for the impurities A, B and C were estimated at a signal-to-noise
ratio of 3:1 and 10:1, respectively. Precision was also carried out at LOQ level by
28
injecting the individual preparations of all the impurities six times and calculating the %
R.S.D of the peak area.
2.2.2.8.3. Linearity
Linearity test solutions for both drug and its related impurities were prepared over the
concentration range of 0.5 µg/mL-1.50µg/mL. The above test was carried for 3
consecutive days. The % R.S.D. value for the slope and the Y-intercept of the calibration
curve was calculated.
2.2.2.8.4. Accuracy
The accuracy test was carried out by spiking experiment. Impurities A, B, and C were
spiked into the drug sample at 50%, 75%, 100%, 125% and 150% of the specified limit
concentration. The experiment was performed in triplicate.
2.2.2.8.5. Specificity
The specificity of the method for pregabalin was determined in presence of its impurities
and its degradation products. Intentional degradation was performed on pregabalin to
provide an indication of the stability indicating property and specificity of the method.
Stress condition study included acid, alkali, oxidative, photolytic and thermal
degradation. Forced degradation studies were performed at an initial concentration of 100
µg/mL. Pregabalin was refluxed with 0.01N HCl at 70oC for 3 hours on mantel followed
by neutralization and adjusting the pH to 7 with 0.01N NaOH for acid degradation. Alkali
degradation was carried out by dissolving pregabalin in 0.01N NaOH on bench top for 3
hours followed by neutralization by adjusting pH to 7 with 0.01N HCl. For oxidative
degradation, pregabalin was refluxed with 1% H2O2 by heating on water bath at 40oC for
1 hour. (2600 Lux/119h & 40 min) was the condition used under photolytic stress. For
29
thermal degradation, samples were exposed to temperature at 105oC for 14 hours. Further
dilution of the above mentioned stress conditioned samples were done to required
concentration with diluent.
2.2.2.8.6. Robustness
Robustness of the method was carried out by deliberately altering the experimental
conditions. The flow rate of the mobile phase was changed by 0.2 units from 1.0 to 0.8
and 1.2 mL min-1
. The effect of column temperature was also studied at 30 and 40oC
instead of 35oC. The effect of pH on resolution of the impurities was studied by varying
the buffer pH by ± 0.1 units from 5.9 to 5.8 and 6.0. The effect of use of a column from a
different batch was also investigated. In all these studies mobile phase composition was
held constant.
2.2.2.9. Solution stability
Solution stability was checked by keeping the test solution spiked with impurities in
tightly capped volumetric flask at temperature 25o ± 2
oC on a laboratory bench for 24
hours. Content of impurities was checked for every 6 hours interval and compared with
freshly prepared solution. Mobile phase stability was also checked out by determining the
content of impurities in sample solution spiked with all the related impurities, which were
prepared freshly at every 6h up to 24h.
2.2.3. HPTLC Method
2.2.3.1. Materials and Reagents
The chemicals and reagents used for the present research work were of AR grade and
procured from S.D. Fine-Chem. (New Delhi, India).
30
2.2.3.2. HPTLC Instrumentation
Chromatography was performed on 10 cm x 10 cm aluminium foil plates precoated with
0.2-mm layers of silica gel 60F254 (E. Merck, Germany). Before use the plates were
prewashed by development with methanol then dried in the current of dry air and
activated at 600C for 5 min. Samples were applied as bands 6 mm wide, 15 mm apart, by
use of a Camag (Switzerland) Linomat 5 equipped with a microlitre syringe. A constant
application rate of 150 nL s-1
was used. Chloroform: methanol (6:6 v/v) used as mobile
phase. Linear ascending development was performed in a twin-trough glass chamber and
saturated with iodine vapour for 30 min at room temperature (RT, 25± 20C) and relative
humidity 60 ± 5%. The development distance was approximately 80 mm. After
development the plates were dried in current of air by use of an air dryer. Densitometric
scanning was performed with camag TLC scanner III in the absorbance reflectance mode
at 290 nm and operated by WINCATS software (V 1.4.3camag) resident in the system.
The source of radiation utilized was deuterium lamp emitting a continuous UV spectrum
between 200-400 nm and concentrations of the compound chromatographed were
determined from the intensity of diffusely reflected light.
2.2.3.3. Calibration Plots of pregabalin
A stock solution containing 1 mg/mL of pregabalin was prepared by dissolving an
accurately weighed 100 mg portion of the drug in methanol in 100 mL volumetric flask
(1000 ng/μL) Different volumes of stock solution (1, 2, 3, 4, 5, 6, 7, 8 and 9 µL) were
spotted on an HPTLC plate in triplicate to obtain concentrations of 1, 2, 3, 4, 5, 6, 7, 8
and 9 μg/spot of pregabalin, respectively. The data of peak area versus drug concentration
were treated by linear least-squares regression to obtain the calibration graphs.

31
2.2.3.4. Method Validation
2.2.3.4.1. Precision
The precision of the method was verified by repeatability and intermediate precision
studies. Repeatability studies were performed by analyzing three different concentrations
(2, 4. 6 (μg/spot) of the drug by six times on the same day. The intermediate precision of
the method was checked by repeating on three different days.
2.2.3.4.2. Robustness
The analytical conditions were deliberately changed, by introducing small changes in
mobile phase composition (±0.1mL), mobile phase volume (±2%), chamber saturation
period (±10%), development distance (±10%), and time from application to development
(0, 10, 15, 20min), time from development to scanning (0, 30, 60, 90 min) were carried
out.
2.2.3.4.3. Limit of detection and Limit of quantification
The method was used to determine the limit of detection (LOD) and limit of
quantification (LOQ). Blank methanol was spotted six times, and the SD (Sb) of the peak
area of the blanks was calculated. The limits were determined from the slope (S) of the
calibration plot and the SD of the response for the blank sample (Sb) by use of the
formula:
LOD = 3.3 x Sb / S and LOQ = 10 x Sb / S
2.2.3.4.4. Accuracy
To check the degree of accuracy of the method, recovery studies were performed in
triplicate by standard addition method at 50, 100 and 150%. Known amount of standard
32
pregabalin was added to pre-analysed samples and were subjected to the proposed
HPTLC method. Six determinations were performed at each level of recovery.
2.2.3.4.5. Specificity
The specificity of the method was determined by comparing the results for the standard
drug and the sample. The peak purity of the sample was assessed by comparing the
spectra at peak start, peak apex, and peak end positions of the spot.
2.2.3.4.6. Forced Degradation studies
Forced degradation studies were performed to prove the stability-indicating property of
the drug to the various stressed conditions. The drug was exposed to different stress
condition similar to the procedure adopted in HPLC method and 5 µL of the sample was
applied on an HPTLC plate and the procedure was carried out as discussed in 3.9.2.
section.
2.2.3.5. Analysis of pregabalin in capsules
To determine the pregabalin content in capsules, twenty capsules were weighed. Capsule
powder equivalent to 100 mg of pregabalin (about 454 mg of pregabalin capsules
powder) was weighed accurately and transferred in to a 100mL volumetric flask,
extracted with methanol, sonicated for 30 min, and diluted to volume with same solvent.
The resulting solution was filtered through a 0.45 µm filter (Millifilter; Milford, MA;
USA). The solution (5 µL, 5 μg/spot of pregabalin) was applied in triplicate on an
HPTLC plate for quantification using the proposed method. The possibility of excipient
interference with the analysis was examined.
33
2.3. Results and Discussions
2.3.1. UV Method
The aqueous pregabalin solution using distilled water as the solvent obeyed beer’s law in
the concentration range of 2.5-12.5 µg/mL (Figure 2.1). The optical characteristics and
the data concerning the proposed method were represented in Table 2.1. The recovery
studies were carried out for the developed method by the addition of standard drug
solution of pregabalin to pre-analyzed solution. The recovery studies were satisfactory
and the percentage of drug recovered (Table 2.2) was in the range of 100.4-101.6%,
which showed that there was no interference from excipients. The precision of the
method expressed as % RSD of intraday and interday validation is given in Table no.2.3,
2.4 & 2.5, respectively. The sensitivity was estimated in terms of limit of quantification
(LOQ), The smallest amounts detected were estimated in terms of limit of detection
(LOD) The results were also shown in Table 2.1. It was successfully applied for
determination of drugs in their formulated pharmaceutical formulations. The drug
content in the capsule formulation was found to be 98.97%, (n=6).
2.3.2. HPLC Method
2.3.2.1. Optimization of chromatographic condition
The objective of the present work is to develop a Liquid chromatographic method for the
determination of related substances in pregabalin API as well as its pharmaceutical
formulations. Different reverse phase stationary phase were employed during method
development and different kind of mobile phase were studied with combination of
acetonitrile. The resolution between impurity B and C was critical also the tailing of the
peak was observed high. To reduce the run time and to bring about the good resolution

34
between the main component and all the potential impurities, several preliminary
chromatographic runs were performed to investigate the suitability for drug content
estimation and cost because of the increasing importance of rapid economic analysis in
pharmaceutical analysis to increase the throughput. Optimization of the gradient program
was done in order to elute all the three impurities and the degradation products. The
separation of all the three impurities from the main peak of the drug was achieved
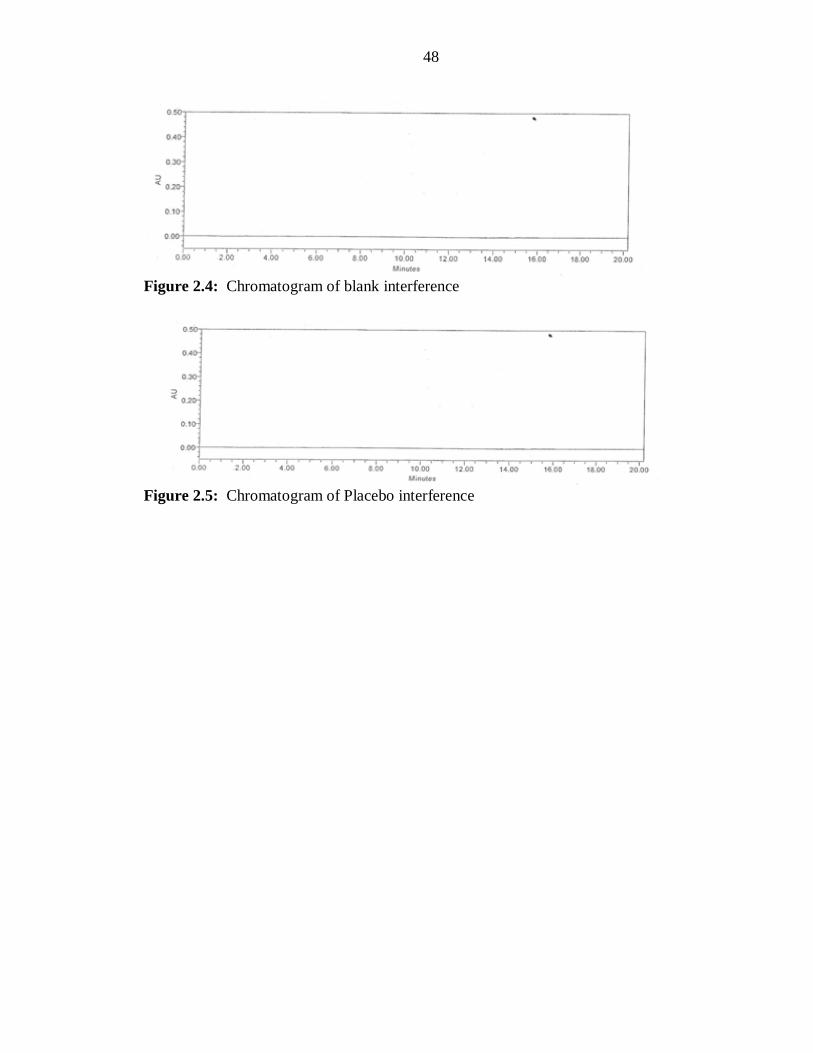
successfully by following the gradient program shown in Table 2.6. Chromatograms of
blank interference as well as placebo interference were also checked for the developed
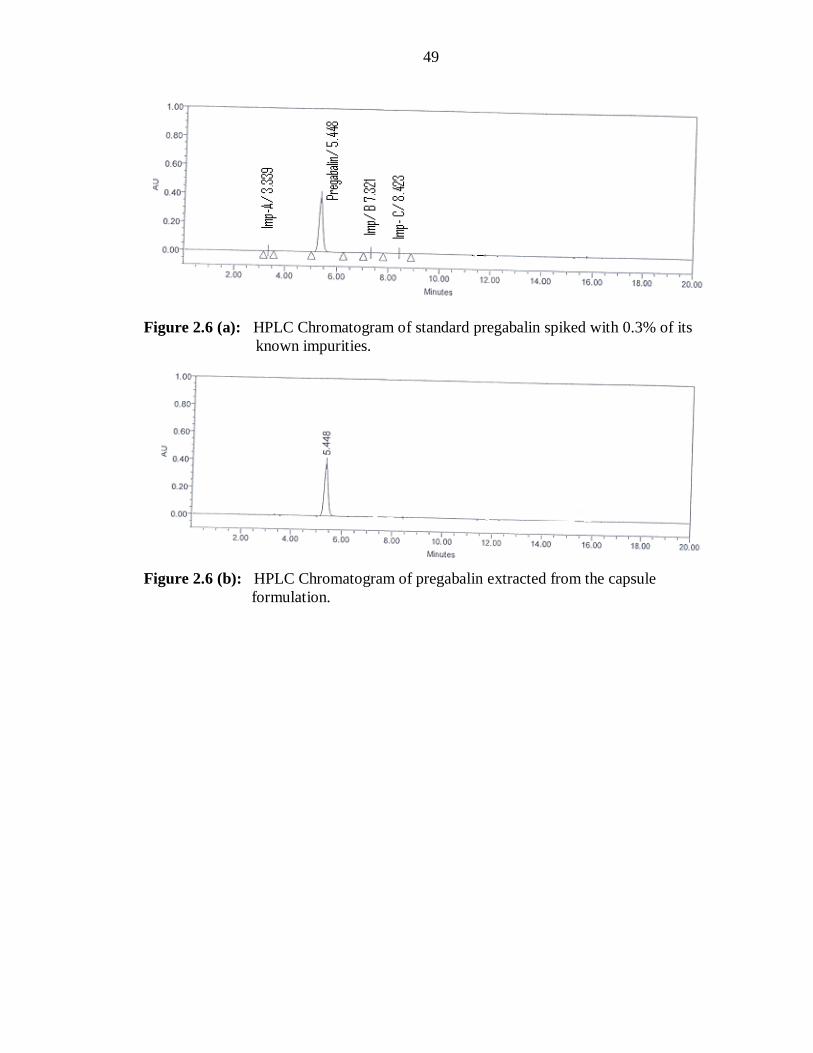
method and it is depicted in Figure 2.4 and 2.5. The typical retention times (RT) of
pregabalin, impurity A, B, and C are about 5.48, 3.33, 7.32 and 8.42 min, respectively
(Figure 2.6a). The relative retention time (RRT), tailing factor and theoretical plates of
pregabalin and its three main impurities are shown in Table 2. 7.
2.3.2.2. Forced degradation studies
Stress degradation studies in acid, alkali, H2O2, photolytic and thermal conditions were
conducted to demonstrate the effective separation of degradants from pregabalin peak.
The drug underwent mild degradation in all the conditions and the degraded peaks
obtained under the forced degradation studies were well resolved from pregabalin peak.
The peak purity of the pregabalin stressed sample chromatograms were evaluated by
Empowers software. In all stress conditions, pregabalin peak purity angle was less than
purity threshold. The results are given under Table 2.8 and Figure 2.7, respectively.
2.3.2.3. Precision
The % RSD of retention time for the drug was observed to be 0.01%, which was well
within the acceptance (of NMT 0.50%) and the % RSD of area of the impurities A, B

35
and C was observed to be 0.217%, 0.342%, and 0.367% which is well within the
acceptance criteria of not more than 10.0%. The % R.S.D. of the assay results obtained in
the intermediate precision was less than 5% which confirms the good precision of the
method.
2.3.2.4. LOD and LOQ
The limit of detection (LOD) and limit of quantification (LOQ) for all impurities are
tabulated in Table 2.9. The precision at LOQ concentrations for all the impurities was
found to be less than 5%.
2.3.2.5. Linearity
Linearity regression analysis demonstrated acceptability of the method. The relation
between impurity concentration (x) and its corresponding peak area rates (Y) was
expressed by the regression equation Y = mx + b. The values of slope and intercept
obtained from calibration curves of Impurity A, B and C are 467.07 x (slope) - 700.5
(intercept), 854.19 x + 999.5 and 547.3 x – 1000, respectively. The correlation coefficient
determined from linear calibration plot for all the three impurities were found to be
greater than 0.999.
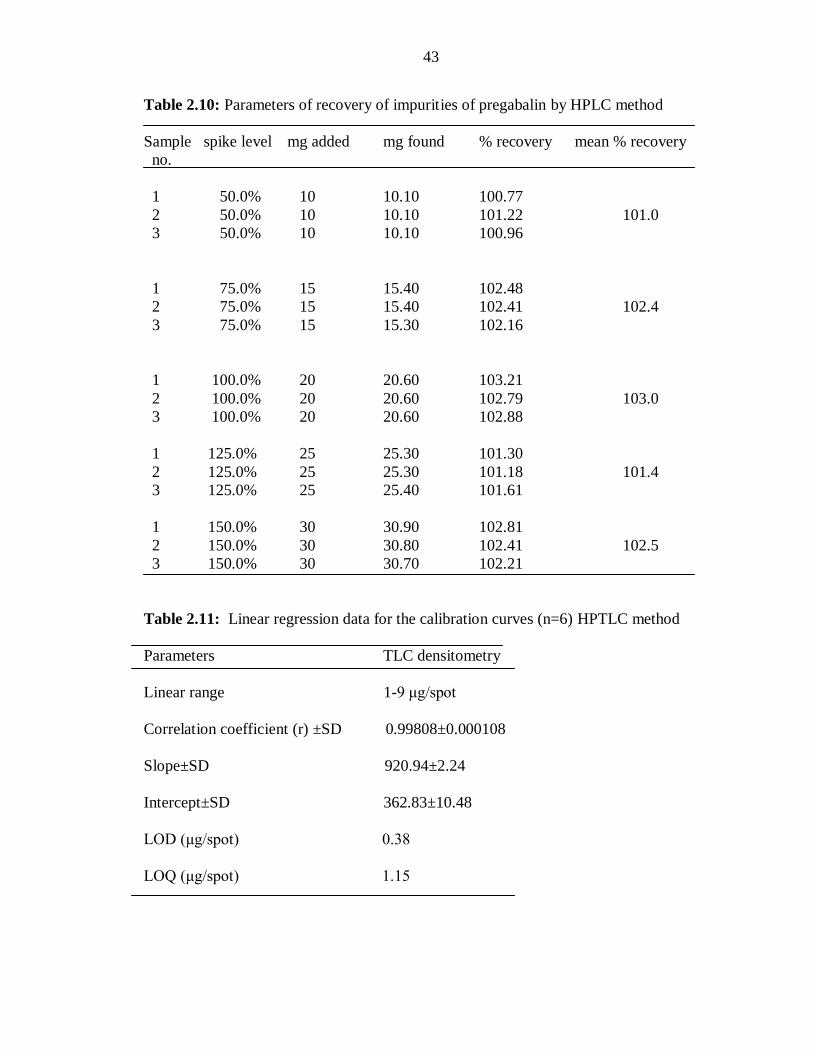
2.3.2.6. Accuracy
Accuracy of the method was demonstrated by recovery studies at three different
concentration levels in triplicate. The analysis was carried out at 50%, 100% and 150% of
specification limit. The mean recoveries of all the impurities were found to be within the
acceptance criteria of 97-103%. The results of the recovery studies are summarized in
Table 2.10.
36
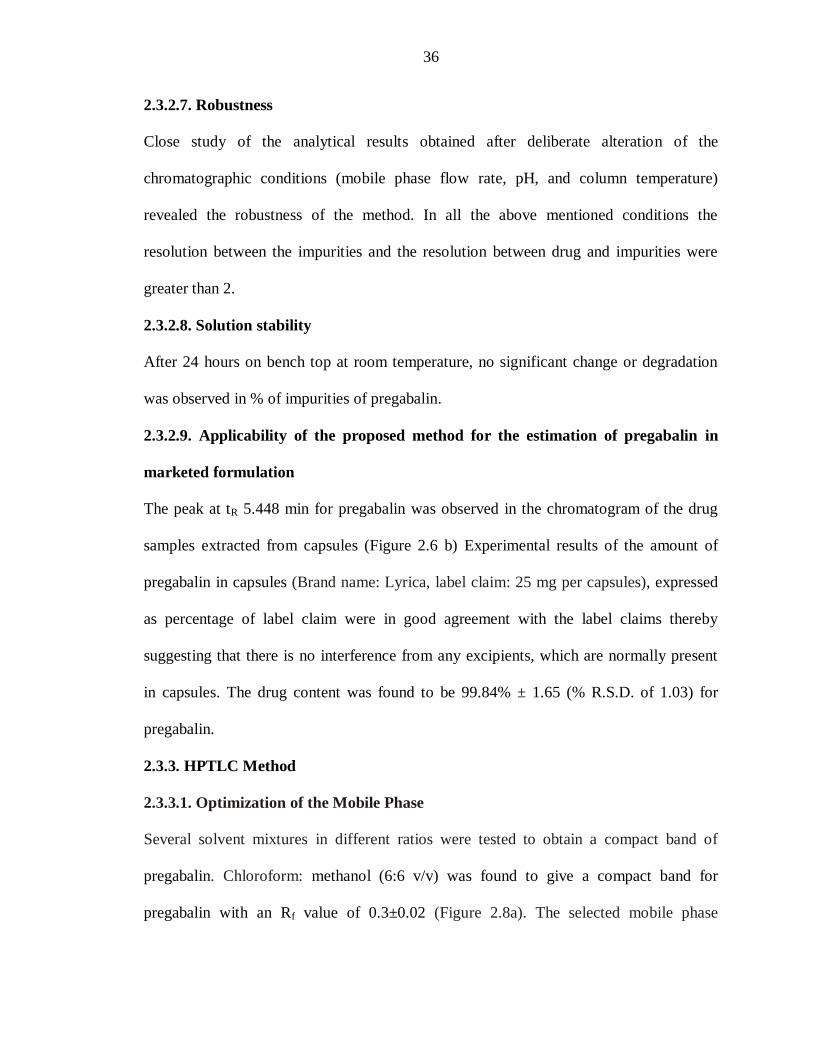
2.3.2.7. Robustness
Close study of the analytical results obtained after deliberate alteration of the
chromatographic conditions (mobile phase flow rate, pH, and column temperature)
revealed the robustness of the method. In all the above mentioned conditions the
resolution between the impurities and the resolution between drug and impurities were
greater than 2.
2.3.2.8. Solution stability
After 24 hours on bench top at room temperature, no significant change or degradation
was observed in % of impurities of pregabalin.
2.3.2.9. Applicability of the proposed method for the estimation of pregabalin in
marketed formulation
The peak at tR 5.448 min for pregabalin was observed in the chromatogram of the drug
samples extracted from capsules (Figure 2.6 b) Experimental results of the amount of
pregabalin in capsules (Brand name: Lyrica, label claim: 25 mg per capsules), expressed
as percentage of label claim were in good agreement with the label claims thereby
suggesting that there is no interference from any excipients, which are normally present
in capsules. The drug content was found to be 99.84% ± 1.65 (% R.S.D. of 1.03) for
pregabalin.
2.3.3. HPTLC Method
2.3.3.1. Optimization of the Mobile Phase
Several solvent mixtures in different ratios were tested to obtain a compact band of
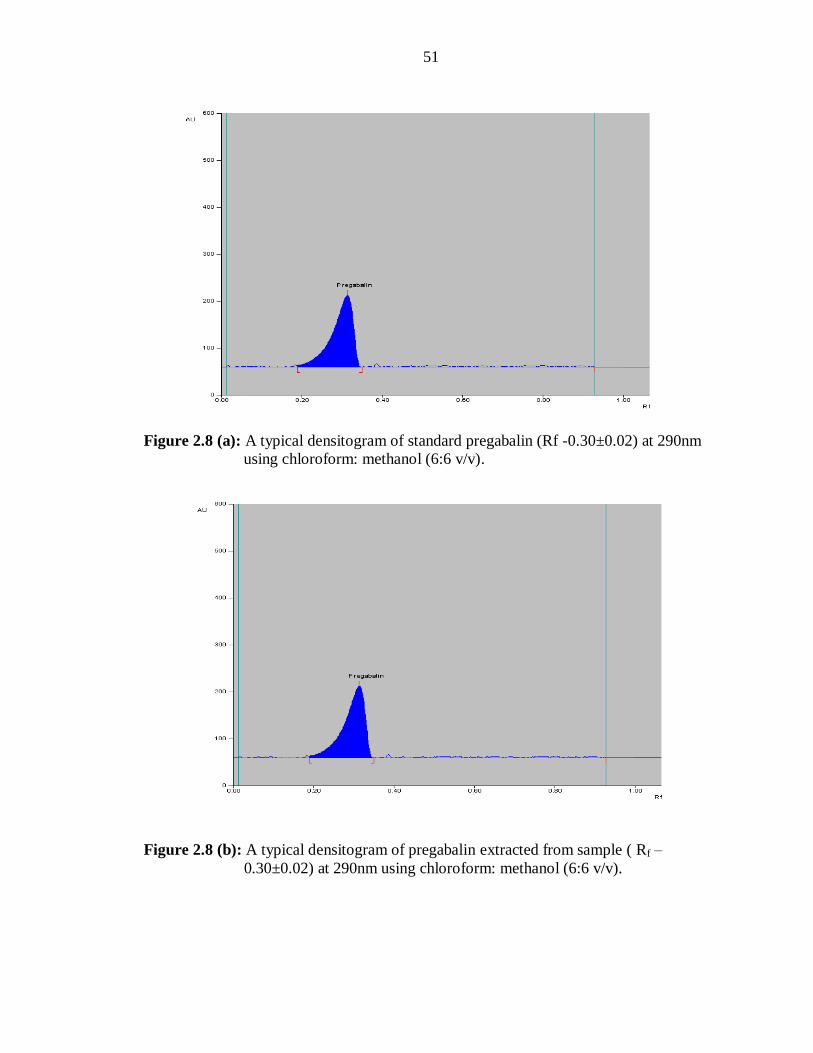
pregabalin. Chloroform: methanol (6:6 v/v) was found to give a compact band for
pregabalin with an Rf value of 0.3±0.02 (Figure 2.8a). The selected mobile phase

37
composition gave a sharp and symmetrical peak which is clearly visible under UV light
saturated with Iodine vapour (Figure 2.11). Thirty minutes was found to be sufficient for
saturation of the development chamber. A 20 mL aliquot of mobile phase was used for a
20 min development over a distance of 80 mm.
2.3.3.2. Calibration Plots of pregabalin
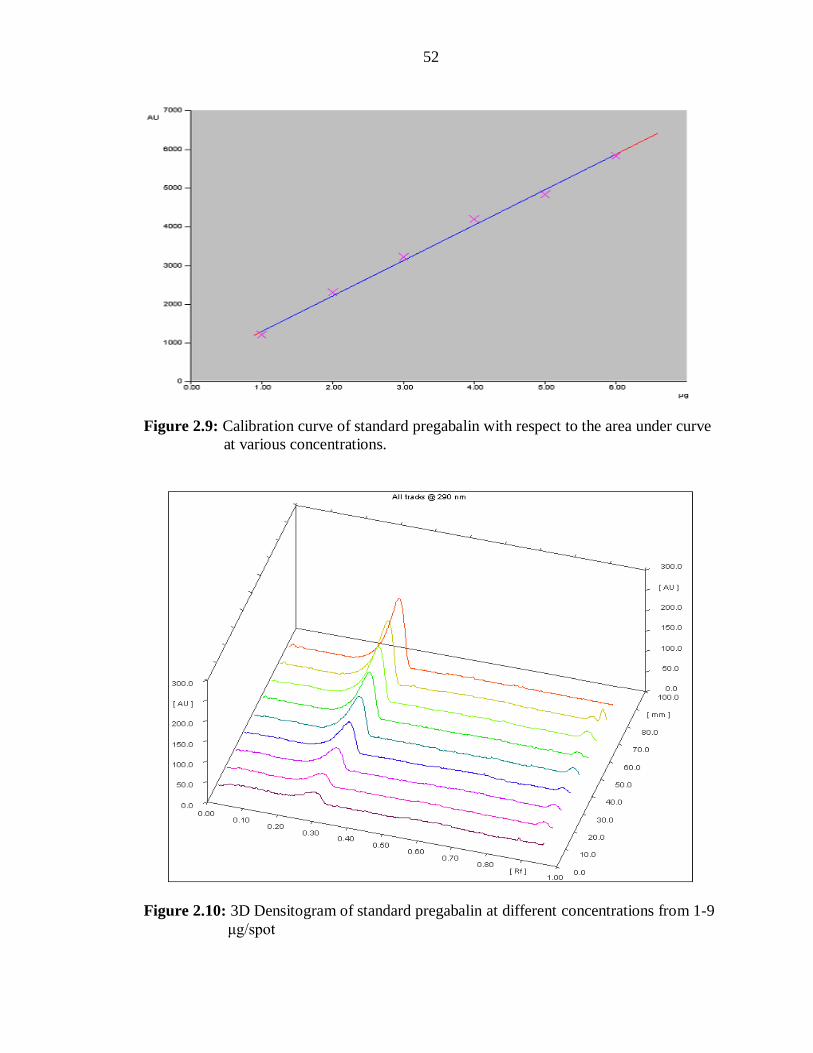
The linear regression analysis data for the calibration plots showed a good linear
relationship (r2 = 0.99808±0.000108) with respect to peak area (Figure 2.9) The mean
values of the slope and intercept were 920.94±2.24 and 362.83±10.48, for densitometric
analysis at 290nm (Table 2.11). The 3D pictorial representation of pregabalin of various
concentrations is depicted in the Figure 2.10.
2.3.3.3. Method Validation18
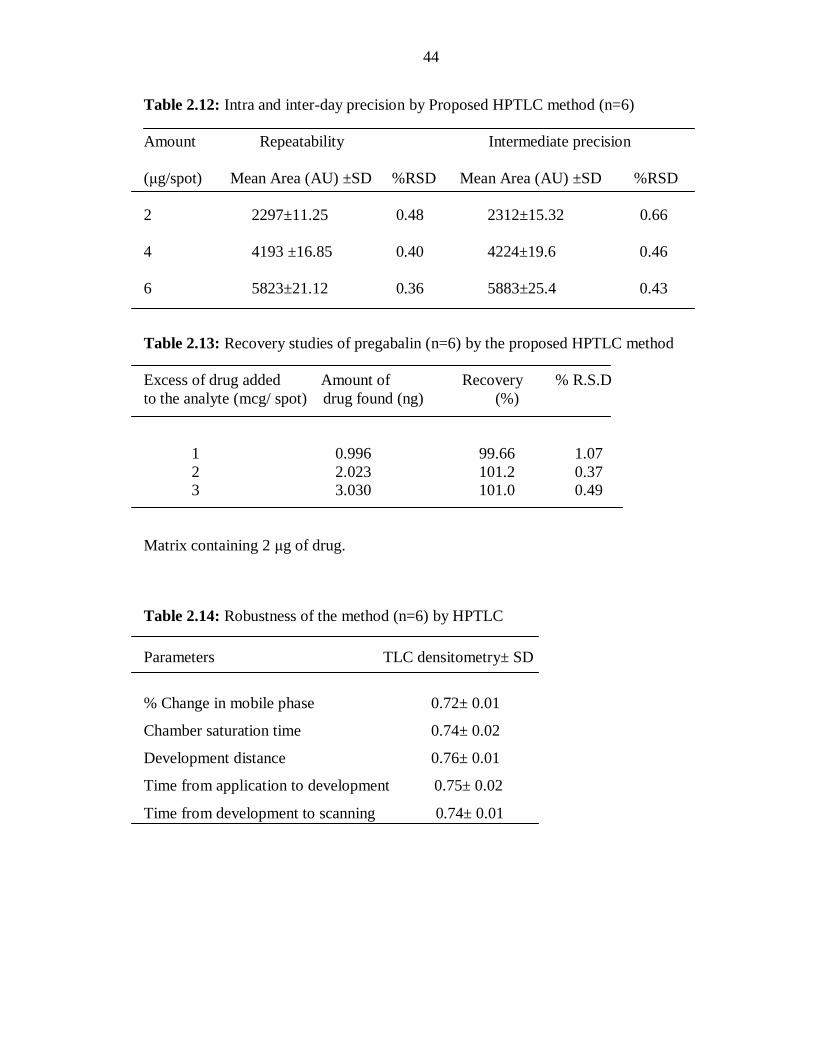
2.3.3.3.1. Precision
The results of the repeatability and intermediate precision experiments are shown in
(Table 2.12). The developed method was found to be precise as the RSD values for
repeatability and intermediate precision studies were <2%, respectively as recommended
by ICH guideline.
2.3.3.3.2. Robustness
The low values of RSD obtained after introducing small, deliberate changes in the mobile
phase composition, mobile phase volume, chamber saturation time, time from application
to development and time from development to scanning in the developed HPTLC method
indicated the robustness of the method (Table 2.14).
38
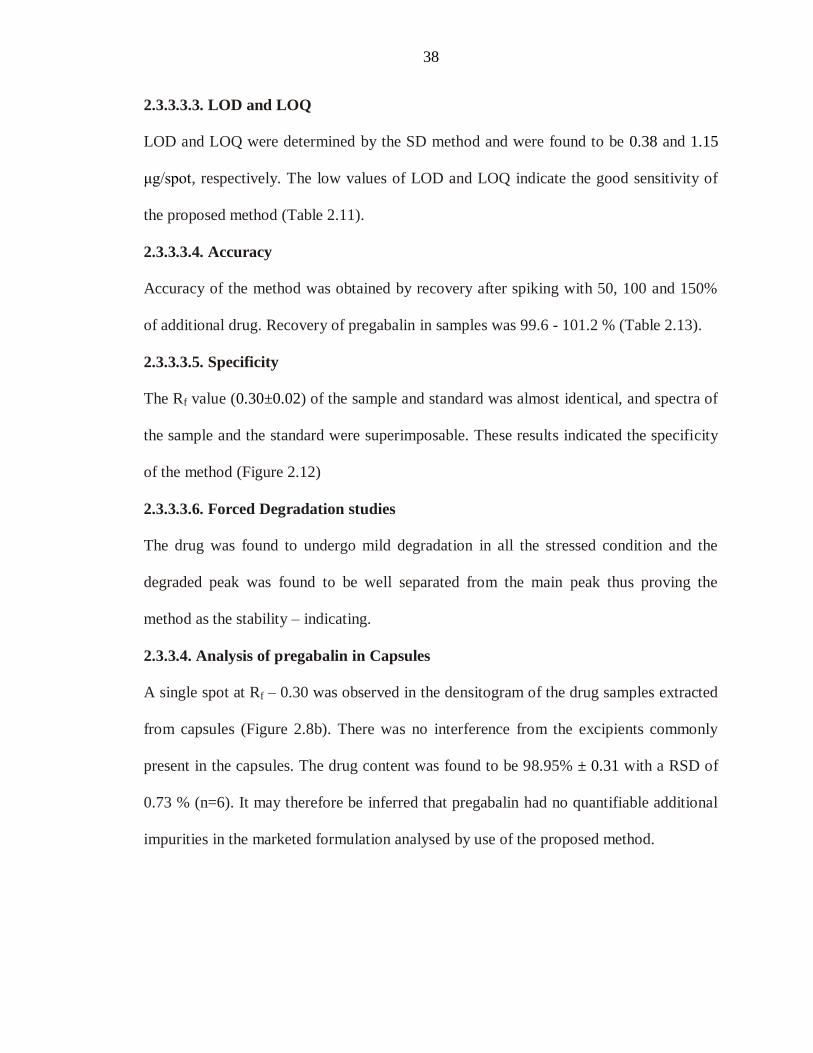
2.3.3.3.3. LOD and LOQ
LOD and LOQ were determined by the SD method and were found to be 0.38 and 1.15
μg/spot, respectively. The low values of LOD and LOQ indicate the good sensitivity of
the proposed method (Table 2.11).
2.3.3.3.4. Accuracy
Accuracy of the method was obtained by recovery after spiking with 50, 100 and 150%
of additional drug. Recovery of pregabalin in samples was 99.6 - 101.2 % (Table 2.13).
2.3.3.3.5. Specificity
The Rf value (0.30±0.02) of the sample and standard was almost identical, and spectra of
the sample and the standard were superimposable. These results indicated the specificity
of the method (Figure 2.12)
2.3.3.3.6. Forced Degradation studies
The drug was found to undergo mild degradation in all the stressed condition and the
degraded peak was found to be well separated from the main peak thus proving the
method as the stability – indicating.
2.3.3.4. Analysis of pregabalin in Capsules
A single spot at Rf – 0.30 was observed in the densitogram of the drug samples extracted
from capsules (Figure 2.8b). There was no interference from the excipients commonly
present in the capsules. The drug content was found to be 98.95% ± 0.31 with a RSD of
0.73 % (n=6). It may therefore be inferred that pregabalin had no quantifiable additional
impurities in the marketed formulation analysed by use of the proposed method.

39
Table 2.1: Validation parameters of pregabalin by UV method
Parameter Result
Absorption maxima λmax (nm) 210 nm
Beer’s law limits (µg/mL) 2.5-12.5 µg/ mL
Standard regression equation Y=bC+a Y=0.0756x-0.0173
Correlation coefficient 0.9971
Sandell’s sensitivity
(mg/cm2/0.001 absorbance unit) 0.013908
Molar absorptivity
(lit.mol-1
cm-1
) 0.312421×10⁵
LOD 0.81 µg/ mL
LOQ 2.4 µg/ mL
Assay(n=6) 98.97
*Y= bC+ a where C is the concentration of pregabalin in µg/mL and Y is the absorbance
at the respective λmax
Table 2.2: Determination of accuracy by the percentage recovery (n=3)
Drug Sample Level of Amount Drug %
concentration addition Added(µg) found Recovery
(µg/mL) (%) (µg/mL) ±SD
10 80 8 18.4682 101.6
± 1.15
Pregabalin 10 100 10 20.271 101.35
± 0.1
10 120 12 22.0888 100.4
± 1.05
40
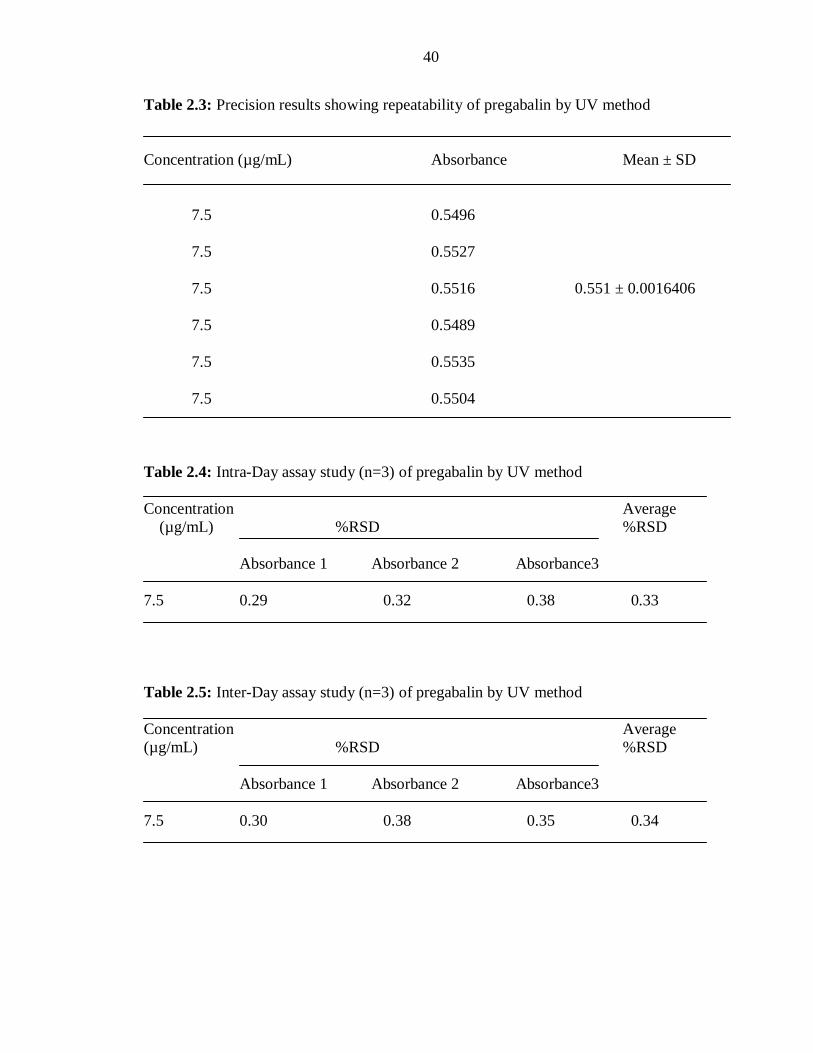
Table 2.3: Precision results showing repeatability of pregabalin by UV method
Concentration (µg/mL) Absorbance Mean ± SD
7.5 0.5496
7.5 0.5527
7.5 0.5516 0.551 ± 0.0016406
7.5 0.5489
7.5 0.5535
7.5 0.5504
Table 2.4: Intra-Day assay study (n=3) of pregabalin by UV method
Concentration Average
(µg/mL) %RSD %RSD
Absorbance 1 Absorbance 2 Absorbance3
7.5 0.29 0.32 0.38 0.33
Table 2.5: Inter-Day assay study (n=3) of pregabalin by UV method
Concentration Average
(µg/mL) %RSD %RSD
Absorbance 1 Absorbance 2 Absorbance3
7.5 0.30 0.38 0.35 0.34
41
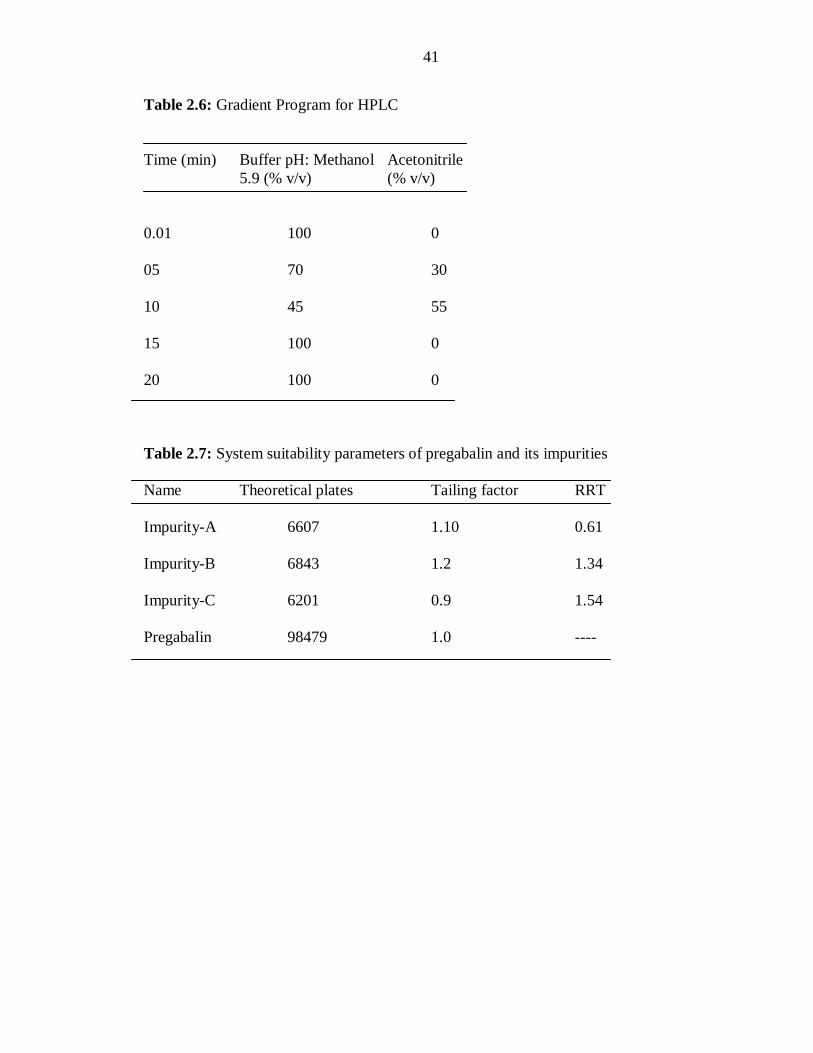
Table 2.6: Gradient Program for HPLC
Time (min) Buffer pH: Methanol Acetonitrile
5.9 (% v/v) (% v/v)
0.01 100 0
05 70 30
10 45 55
15 100 0
20 100 0
Table 2.7: System suitability parameters of pregabalin and its impurities
Name Theoretical plates Tailing factor RRT
Impurity-A 6607 1.10 0.61
Impurity-B 6843 1.2 1.34
Impurity-C 6201 0.9 1.54
Pregabalin 98479 1.0 ----

42
Table 2.8: Results for specificity of the method by HPLC.
Mode of Condition % Assay % Purity Purity Purity
degradation degradation angle threshold flag
w.r.t. control
Acid
degradation 70oC/3h 98.47 0.70 0.031 0.230 NO
Base
degradation 70oC/3h 99.00 0.17 0.035 0.231 NO
Oxidative
degradation 40oC/1h 98.85 0.32 0.031 0.228 NO
Photolytic 2600Lux/
degradation 119h & 98.85 0.32 0.042 0.228 NO
40 min
Thermal
degradation 105oC/14h 98.76 0.41 0.037 0.230 NO
Table 2.9: LODs and LOQs of impurities by signal to noise ratio method.
Impurity Concentration with respect to Concentration with respect
sample at LOD, % to sample at LOQ, %
A 0.006 0.020
B 0.008 0.021
C 0.007 0.020
43
Table 2.10: Parameters of recovery of impurities of pregabalin by HPLC method
Sample spike level mg added mg found % recovery mean % recovery
no.
1 50.0% 10 10.10 100.77
2 50.0% 10 10.10 101.22 101.0
3 50.0% 10 10.10 100.96
1 75.0% 15 15.40 102.48
2 75.0% 15 15.40 102.41 102.4
3 75.0% 15 15.30 102.16
1 100.0% 20 20.60 103.21
2 100.0% 20 20.60 102.79 103.0
3 100.0% 20 20.60 102.88
1 125.0% 25 25.30 101.30
2 125.0% 25 25.30 101.18 101.4
3 125.0% 25 25.40 101.61
1 150.0% 30 30.90 102.81
2 150.0% 30 30.80 102.41 102.5
3 150.0% 30 30.70 102.21
Table 2.11: Linear regression data for the calibration curves (n=6) HPTLC method
Parameters TLC densitometry
Linear range 1-9 μg/spot
Correlation coefficient (r) ±SD 0.99808±0.000108
Slope±SD 920.94±2.24
Intercept±SD
362.83±10.48
LOD (μg/spot) 0.38
LOQ (μg/spot) 1.15
44
Table 2.12: Intra and inter-day precision by Proposed HPTLC method (n=6)
Amount Repeatability Intermediate precision
(μg/spot) Mean Area (AU) ±SD %RSD Mean Area (AU) ±SD %RSD
2 2297±11.25 0.48 2312±15.32 0.66
4 4193 ±16.85 0.40 4224±19.6 0.46
6 5823±21.12 0.36 5883±25.4 0.43
Table 2.13: Recovery studies of pregabalin (n=6) by the proposed HPTLC method
Excess of drug added Amount of Recovery % R.S.D
to the analyte (mcg/ spot) drug found (ng) (%)
1 0.996 99.66 1.07
2 2.023 101.2 0.37
3 3.030 101.0 0.49
Matrix containing 2 μg of drug.
Table 2.14: Robustness of the method (n=6) by HPTLC
Parameters TLC densitometry± SD
% Change in mobile phase 0.72± 0.01
Chamber saturation time 0.74± 0.02
Development distance 0.76± 0.01
Time from application to development 0.75± 0.02
Time from development to scanning 0.74± 0.01

45
Figure 2.1: Calibration curve of pregabalin
46
COOH
COOH
OO O
CONH2
COOH
3-CABAMOYL METHYL-5-METHYL HEXANOIC ACID
(R)-PHENYL ETHYLAMINE
Aq.HCL
CONH2
COOH
R-(-)-3-CARBAMOYL METHYL HEXANOIC ACID
Br2
NAOH
ISO BUTANOL
ISO PROPANOL
NH2
COOH
PREGABALIN
3-ISO BUTYL GLUTARIC ACID
Aq.NH3
AC2O
Figure 2.2: Synthetic scheme of pregabalin

47
Figure 2.3: Chemical structure of pregabalin and its process - related impurities
48
Figure 2.4: Chromatogram of blank interference
Figure 2.5: Chromatogram of Placebo interference
49
Figure 2.6 (a): HPLC Chromatogram of standard pregabalin spiked with 0.3% of its
known impurities.
Figure 2.6 (b): HPLC Chromatogram of pregabalin extracted from the capsule
formulation.

50
Typical chromatogram of Acid stressed sample
Chromatogram of Base stressed sample
Chromatogram of Peroxide stressed sample
Chromatogram of Sunlight stressed sample
Chromatogram of Thermal degradation
Figure 2.7: Typical chromatograms of pregabalin under various stressed condition
51
Figure 2.8 (a): A typical densitogram of standard pregabalin (Rf -0.30±0.02) at 290nm
using chloroform: methanol (6:6 v/v).
Figure 2.8 (b): A typical densitogram of pregabalin extracted from sample ( Rf –
0.30±0.02) at 290nm using chloroform: methanol (6:6 v/v).
52
Figure 2.9: Calibration curve of standard pregabalin with respect to the area under curve
at various concentrations.
Figure 2.10: 3D Densitogram of standard pregabalin at different concentrations from 1-9
μg/spot

53
Figure 2.11: Video image of standard pregabalin saturated with iodine vapour at 290nm.
Figure 2.12: Insitu UV spectra of pregabalin standard and sample.
54
2.4. Correlation of the Results of Pregabalin by Statistical Analysis (Anova Test)
This write up brings about the correlation of the results which was applied for the
estimation of pregabalin by UV, HPLC as well as HPTLC methods. Anova-test was
applied to compare the results for the developed Spectrophotometric and
Chromatographic techniques.
Six different samples taken during in process control of capsule manufacturing were
determined by UV, HPLC and HPTLC. To test differences between the proposed
analytical methods, statistical tests were performed for the level of confidence 95% (p =
0.05). The obtained value of F stat is lower than two tail F crit, which leads to the
conclusion that there is no significant difference between the means. The results of
ANOVA test are given in Tables 2.15.

55
Table 2.15: Comparative results of pregabalin by the developed UV, HPLC and HPTLC
methods by ANOVA-test.
S.No. UV method HPLC method HPTLC method
1 99.23 98.23 98.53
2 99.73 98.27 98.29
3 98.92 97.99 99.98
4 100.12 98.99 100.29
5 99.23 99.21 99.88
6 99.23 98.29 99.77
Groups Count Sum Average Variance
Column 1 6 591.98 98.66333 0.294827
Column 2 6 590.98 99.49667 0.234827
Column 3 6 596.74 99.45667 0.693107
ANOVA
Source of variation SS dF MS Fstat P-value Fcrit
Between groups 3.157511 2 1.578756 3.68232 0.044033 3.873423
Within groups 6.1138 15 0.407587
Total 9.271311 17
Fstat < Fcrit
From the Table 2.15 it was concluded that F-stat < F-critical (i.e F stat value is less than
F critical value) which leads to the conclusion that there is no significant difference
between the proposed methods.
2.5. Conclusions
UV Spectrophotometric method developed for the estimation of pregabalin was found to
be accurate and simple. The developed Liquid chromatographic method for the
determination of related substances in pregabalin was stability indicating. The method
was fully validated according to ICH guidelines. This method can be adopted for the
56
routine quality control department for both the assay and the related substances
determination and also for the stability studies. As there are no reported methods for the
estimation of pregabalin by HPTLC, so it was felt necessary by the author to develop a
simple and precise method for the quantitative analysis of pregabalin in bulk and its
formulation. Thus the proposed UV, HPLC and HPTLC methods are accurate and
reproducible for quantitative analysis of pregabalin in bulk as well as its dosage form.
Statistical tests indicate that the proposed methods reduce the duration of analysis and
appear to be equally suitable for routine determination of pregabalin in pharmaceutical
formulation in quality control laboratories, where economy and time are essential.
57
2.6. REFERENCES
1. Onal A. and Sagirli O. Spectrophotometric, Spectroflourimetric methods for the
determination of pregabalin in bulk and pharmaceutical preparation. Spectrochim
Acta A. 72, 2009, 68-71.
2. Vermeiji T.A. and Edelbroek P.M. Simultaneous high- performance liquid
chromatographic analysis of pregabalin, gabapentin and vigabatin in human serum
by precolumn derivatization with o- phtaldialdehyde and fluorescence detection. J.
Chromatogr B Analyt Technol Biomed Life Sci. 810, 2004, 297-303.
3. Berry D. and Millington C. Analysis of pregabalin at therapeutic concentrations in
human plasma/ serum by reversed- phase HPLC. Ther Drug Monit. 27, 2005, 451-
456.
4. Michael J.L, Timothy R.H, Brian T. and Stephen R.P. Synthesis and
characterization of pregabalin lactose conjugate degradation products. J.Pharm.
Biomed. Anal. 28, 2002, 917-924.
5. Rajinder Singh G, Manirul Haque S.K. and Prem Shanker. Development and
validation of pregabalin in bulk, pharmaceutical formulations and in human urine
samples by UV spectrophotometry. Int J Biomed Sci. 5, 2009, 175-180.
6. Alka bali and Prateek Gaur. A novel method for spectrophotometric determination
of pregabalin in pure and in capsules. Chemistry central journal. 5, 2011, 59.
7. Kasawar G.B. and Farooqui M.N. Development and validation of HPLC method for
the determination of pregabalin in capsules. Indian J.Pharm. Sci. 72, 2010, 517-519.
8. Sarvesh kumar mishra, Guru padhyya B.M. and Surajpal verma. Stability-indicating
RP-HPLC method for determination of pregabalin using ICH guidelines.
International journal of natural product science. 2012, special issue, 1:115.
9. Ravi kiran kaja, Surendranath K.V, Satyanarayana P.V.V and Suresh kumar K. A
Validated stability –indicating LC assay method for pregabalin in bulk drug and
pharmaceutical dosage forms. Trade Science Inc. 7, 2008, 12.
10. Kannapan N, Nayak S.P, Venkatachalam T and Prabhakaran V. Analytical RP-
HPLC method for development and validation of pregabalin and methyl cobalamine
in combined capsule formulation. Journal of applied chemical research. 13, 2010,
85-89.
11. Rajinder Singh G, Manirul Haque S.K. and Sanjeev kumar. A novel method for the
determination of pregabalin in bulk pharmaceutical formulations and human urine
samples. African journal of pharmacy and pharmacology. 3, 2009, 327-334.
12. Uma G, Manimala M, Vasudevan M, Karpagam S and Deecarman. LC-MS-MS
method for the determination of pregabalin in human plasma. International journal
of pharmacy and pharmaceutical sciences. 4, 2012, 10-11.
13. Gaurang R Shah, Chinmoy Ghosh and Bharat T. Thaka. Determination of
pregabalin in human plasma by elecrospray ionization tandem mass- spectroscopy.
Journal of advanced pharmaceutical technology and research. 1:3, 2010, 354-357.
14. Mandel U, Sarkar A.K, Gowda K.V, Agarwal S, Bose A, Bhaumik U, Ghosh D.
and Kumar pal T. Determination of pregabalin in human plasma using LC-MS-MS.
Chromatographia. 67, 2008, 237-243.
58
15. Ki-i-Lojang, Ji- Hyungsel, Sung-Vin Yimz and Kyung Tae Lee. Rapid and simple
method for the determination of pregabalin in human plasma using LC-MS-MS:
Application to bioequivalence study of Daewoong pregabalin capsule to Lyri’ Ca ®
capsule (pregabalin 150mg). Journal of pharmaceutical investigation. 4, 2011, 255-
262.
16. Dzygiel and Fraier. Simultaneous determination of pregabalin, sildenafil and its
active metabolite in rat plasma, utilizing SPE followed by LC-MS-MS.
Chromatographia. 11-12, 2012, 1177-1182.
17. The Indian Pharmacopoeia, 6th ed., The Indian Pharmacopoeia Commission,
Ghaziabad, 2010, 1960-1961.
18. ICH Topic Q2 (R1), Validation of analytical procedures: Methodology, Geneva,
The European Agency for the Evaluation of Medicinal products, September 2005.


![Perioperative Pregabalin & Ketamine as Multimodal …...Source: Lyrica ® (Pregabalin) [Package Insert]. Pfizer Pharmaceuticals LLC. Vega Baja, PR: 2011 Pregabalin Adverse Effects](https://img.pdfslide.us/doc/110x75/5f64d8667e802371ab4d10a5/perioperative-pregabalin-ketamine-as-multimodal-source-lyrica-pregabalin.jpg)