Embed Size (px)
Citation preview
UltraTech Cement Limited ACMIIL �
C O M P A N Y R E P O R T
Ultratech Cement Ltd
AnalystSameer [email protected]: (022) 2858 3401
21 Dec, 2009
B U Y A T D E C L I N E S
We initiate coverage on UltraTech Cement Limited (UltraTech) with a ‘‘BUY AT DECLINES” rating and a price target of INR 860. UltraTech, part of the Aditya Birla group, has a capacity of 23.1 million tonnes per annum. Along with Grasim Industries and UltraTech, the Aditya Birla group accounts for ~20% of India’s cement capacity. UltraTech is largely focused on Southern and Western India. Andhra Pradesh and Gujarat account for ~26% and 35% of the company’s capacity respectively.
UltraTech has leadership position in the Indian cement industry. Moreover, it has started making significant savings in power and fuel, which place it among the low-cost producers of cement. However, we believe weak pricing and higher costs will weigh on the company’s profitability. Thus, we recommend a ‘BUY AT DECLINES’ with a price target of INR 860.
Recommendation rationale
Large capacity expansion and weak demand in target markets: Capacity additions of 30–35 million tonnes are expected in Western and Southern India by FY11. Cement demand in South India is estimated to have grown a meager 4-5% YoY in recent months. Growth in cement demand is critical to sustainability of prices in the face of large capacity additions. The central and state governments would need to step up investments in infrastructure and housing. Given the current scenario, soft-pedaling of projects would have an impact on UltraTech’s sales.
Weak pricing scenario: Cement prices in Southern and Western India fell by ~INR40-50/bag since August 2009 dragged by, weak demand, capacity additions, and the seasonal impact of monsoons. The scenario remains bleak as demand continues to be sluggish. A bulk of the capacity additions is expected to go on stream during H2FY10/H1FY11. All these factors will keep prices depressed. The steepest price correction has happened in Andhra Pradesh, which accounts for only ~6-7% of UltraTech’s sales volumes.
Rising input costs: Raw material, and power and fuel costs are on the rise across industry. The central government recently hiked limestone royalty by 40% to INR 63/tonne while coal prices have started rising, although they remain well below the peaks seen in CY08. Higher input costs will negate the benefit of savings from captive power plants.
Solace from lower power and fuel costs: Benefits from captive power plants are reflecting in FY10, providing a fillip to profitability. Similarly, coal prices are ruling at ~$70-75/tonne vis-à-vis highs of ~$200/tonne in CY08. Coal prices have steadied at current levels.
Swap ratio marginally favorable to Samruddhi shareholders: The swap ratio for merging Samruddhi Cement with UltraTech has been decided at four shares of UltraTech (FV INR 10) for every seven shares of Samruddhi (FV INR 5). The ratio is marginally higher than our estimates of 4:7.2 and in favor of Samruddhi shareholders. The appointed date for the merger is 01 July 2010.
Key Data (INR)
CMP 899
Target Price 860
Key Data
Bloomberg Code UTCM.IN
Reuters Code ULTC.BO
BSE Code 532538
NSE Code ULTRACEMCO
Face Value (INR) 10
Market Cap. (INR mn) 111,917
52 Week High (INR) 917
52 Week Low (INR) 325
Avg. Daily Volume (6m) 76083
Beta 0.5
Shareholding %
Promoters 54.9
Mutual Funds/UTI/Banks 15.7
Foreign Instritutional Investors 5.4
Bodies Corporate 8.5
Individuals 15.1
Others 0.5
Total 100.0
Particulars (INR Mn) FY09 FY10E FY11E
Net sales 63,831 71,924 73,114
Operating Profit 17,064 22,791 20,108
OPM (%) 26.7 31.7 27.5
PAT 9,770 12,041 10,359
PAT (%) 15.3 16.7 14.2
EPS (INR) 78.5 96.7 83.2
UltraTech Cement Limited ACMIIL �
C O M P A N Y R E P O R T
Valuations and recommendation:
The CMP of INR 899, discounts FY11E EPS of INR 83.2 by 10.8x. On an EV/tonne basis, UltraTech is valued at $99 FY11E vis-à-vis peers such as Ambuja Cement, ACC and Shree Cement, which trade in a range of $110-135/tonne. The premium for ACC, Ambuja and Shree Cements over UltraTech is due to their presence in north India, where prices have declined marginally. Compared with replacement cost of ~$110-120/tonne, we believe UltraTech should trade at an EV/tonne of $95, taking into account improving control over power costs and weakening profitability. This translates into a price of INR 858/share, valuing UltraTech at a P/E of 10.3x. We recommend a “BUY AT DECLINES” with a price target of INR 860.
Industry Outlook
Cement demand —primary catalyst lacking in some states
Demand for cement has historically been driven by investment in housing, infrastructure and capital expenditure by the manufacturing sector. The steady share of construction and real estate in GDP at ~14.7-14.8% endorses this. While demand has a correlation to GDP, at the micro level it depends on regional factors such as infrastructure programs, industrial capex, and demand for housing in the respective states. For instance, demand for cement in Andhra Pradesh had grown at 17% CAGR since FY04 due to the thrust on infrastructure and real estate. However, funding issues and elections impacted demand for cement in South India during FY09. Cement demand is estimated to have grown ~4% YoY during Apr-Aug 2009. Fall in demand in Andhra Pradesh is the main reason for the sharp decline in prices in the past two months in south India.
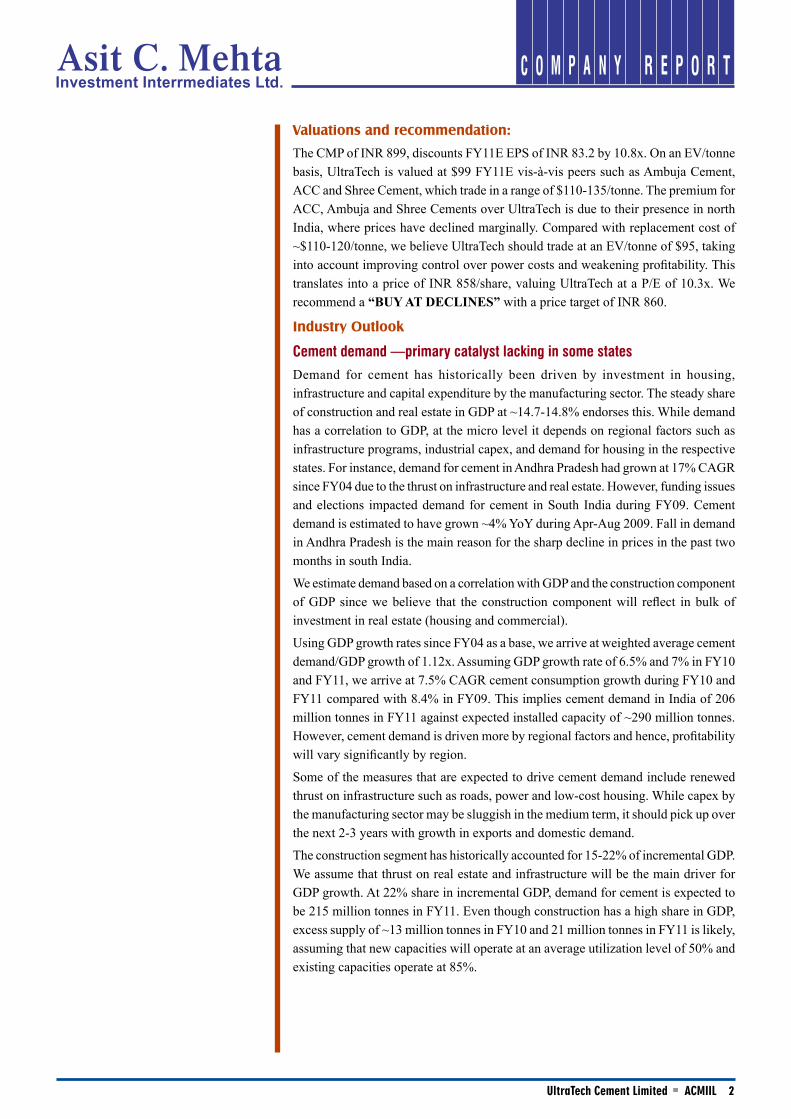
We estimate demand based on a correlation with GDP and the construction component of GDP since we believe that the construction component will reflect in bulk of investment in real estate (housing and commercial).
Using GDP growth rates since FY04 as a base, we arrive at weighted average cement demand/GDP growth of 1.12x. Assuming GDP growth rate of 6.5% and 7% in FY10 and FY11, we arrive at 7.5% CAGR cement consumption growth during FY10 and FY11 compared with 8.4% in FY09. This implies cement demand in India of 206 million tonnes in FY11 against expected installed capacity of ~290 million tonnes. However, cement demand is driven more by regional factors and hence, profitability will vary significantly by region.
Some of the measures that are expected to drive cement demand include renewed thrust on infrastructure such as roads, power and low-cost housing. While capex by the manufacturing sector may be sluggish in the medium term, it should pick up over the next 2-3 years with growth in exports and domestic demand.
The construction segment has historically accounted for 15-22% of incremental GDP. We assume that thrust on real estate and infrastructure will be the main driver for GDP growth. At 22% share in incremental GDP, demand for cement is expected to be 215 million tonnes in FY11. Even though construction has a high share in GDP, excess supply of ~13 million tonnes in FY10 and 21 million tonnes in FY11 is likely, assuming that new capacities will operate at an average utilization level of 50% and existing capacities operate at 85%.
UltraTech Cement Limited ACMIIL �
C O M P A N Y R E P O R T
FY04 FY05 FY06 FY07 FY08 FY09 FY10E FY11E
USING GDP AS BASE
GPD growth (%) 8.5% 7.5% 9.0% 9.6% 9.0% 6.7% 6.5% 7.0%
Cement demand (million mt) 113.9 123.1 135.6 149.0 164.0 177.8 190.7 205.6
Cement consumption growth (%) 5.8% 8.1% 10.1% 9.9% 10.1% 8.4% 7.3% 7.8%
Cement growth/GDP (x) 0.69 1.08 1.13 1.03 1.12 1.25 1.12 1.12
Weighted factor (x) 0.69 2.16 3.38 4.13 5.60 7.52 7.83 8.94
Weighted average factor (x) 1.12 1.12 1.12
USING CONSTRUCTION’S SHARE IN GDP AS BASE
GDP (INR billion) 22,228 23,884 26,128 28,711 31,297 33,393 35,564 38,053
GPD growth (%) 8.5% 7.5% 9.0% 9.6% 9.0% 6.7% 6.5% 7.0%
Construction & real estate (INR billion) 3,414 3,843 4,227 4,620 4,940 5,418 5,965
Construction/RE growth (%) 12.0% 12.6% 10.0% 9.3% 6.9% 9.7% 10.1%
Share of GDP (%) 14.3% 14.7% 14.7% 14.8% 14.8% 15.2% 15.7%
Share of Incremental GDP (%) 22.1% 19.1% 14.9% 15.2% 15.3% 22.0% 22.0%
Real estate (INR billion) 1,686 1,831 2,000 2,171 2,357 2,514
% of GDP 7.58 7.67 7.65 7.56 7.53 7.53
Cement demand (million mt) 113.9 123.1 135.6 149.0 164.0 177.8 195.0 214.7
cement consumption growth (%) 5.8% 8.1% 10.1% 9.9% 10.1% 8.4% 9.7% 10.1%
Cemtn growth/Construction growth (x) 0.7 0.8 1.0 1.1 1.2 1.0 1.0
Weighted factor (x) 0.7 1.6 3.0 4.3 6.1 6.0 7.0
Weighted average (x) 0.76 0.88 0.96 1.04 0.17 0.15
Weights 1 2 3 4 5 6 7
Cement production (million tonnes) 117.4 127.6 141.8 155.7 168.3 181.4 207.8 234.7
Cement Capacity (million tonnes) CMIE 144.3 151.7 157.6 165.9 179.3 219.5 262.0 286.1
Capacity utilisation (%) 81.4% 84.1% 90.0% 93.9% 93.9% 82.7% 79.3% 82.1%
Excess supply/(deficit) (million tonnes) 3.6 4.5 6.2 6.7 4.3 3.6 12.8 20.0
Capacity addition (million tonnes) 7.4 5.9 8.3 13.4 40.2 42.5 24.1
Source: CMIE, NAS, ACMIIL Research
FY11 Cement Demand Scenario
Constrn share (%)\GDP gth (%) 6.5 7.0 7.5 8.0 8.5
15.0 207.5 208.4 209.4 210.3 211.3
18.0 210.0 211.1 212.3 213.4 214.6
20.0 211.6 212.9 214.2 215.5 216.7
22.0 213.3 214.7 216.1 217.5 218.9
24.0 214.9 216.5 218.0 219.6 221.1
Source: ACMIIL Research
Which region is witnessing most addition?
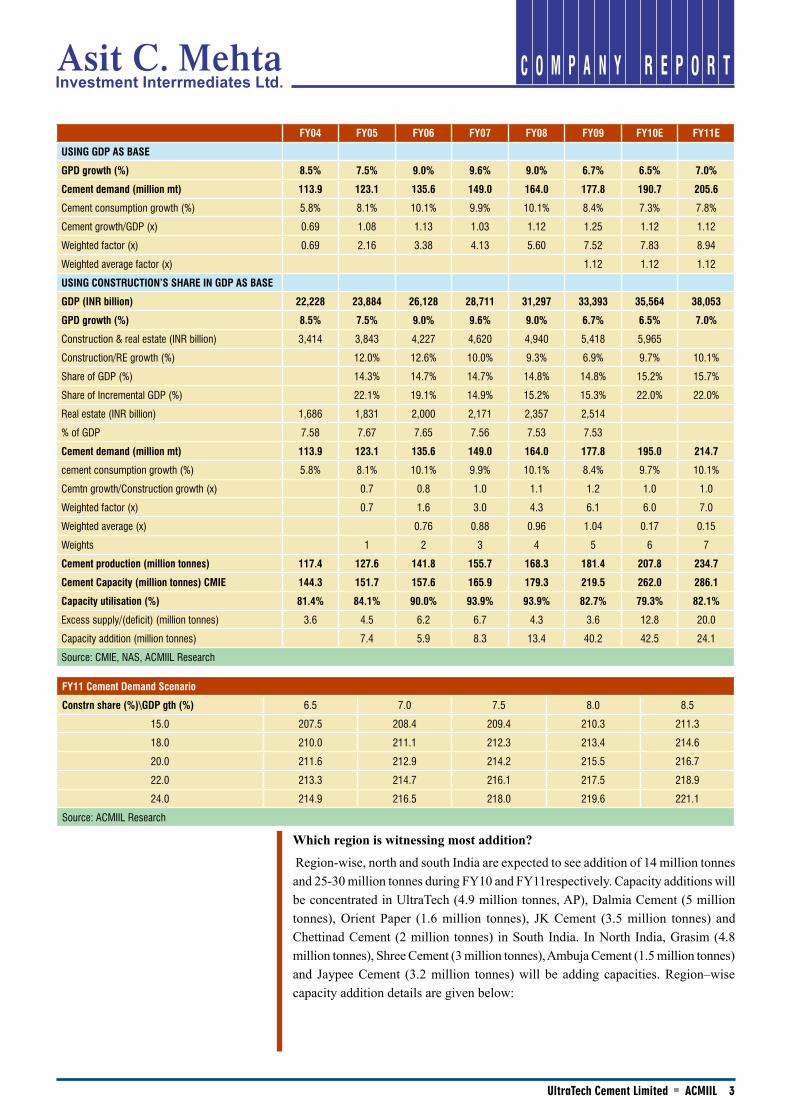
Region-wise, north and south India are expected to see addition of 14 million tonnes and 25-30 million tonnes during FY10 and FY11respectively. Capacity additions will be concentrated in UltraTech (4.9 million tonnes, AP), Dalmia Cement (5 million tonnes), Orient Paper (1.6 million tonnes), JK Cement (3.5 million tonnes) and Chettinad Cement (2 million tonnes) in South India. In North India, Grasim (4.8 million tonnes), Shree Cement (3 million tonnes), Ambuja Cement (1.5 million tonnes) and Jaypee Cement (3.2 million tonnes) will be adding capacities. Region–wise capacity addition details are given below:
UltraTech Cement Limited ACMIIL �
C O M P A N Y R E P O R T
Capacity addition (million tonnes)
FY07 FY08 FY09 FY10E FY11E
North 3.7 12.6 5.3 9.1 4.7
South 2.8 17.0 8.4 20.0 5.2
East 1.0 3.4 1.9 5.1 5.0
West - 2.0 3.6 3.1 4.2
Central 1.3 3.8 - 4.5 5.0
Total 8.8 39.0 19.2 41.7 26.6
Source: ACMIIL Research
Consolidation may not help if push comes to shove
Following Holcim’s stake in ACC and Gujarat Ambuja, 40% of cement capacity is concentrated in the hands of Holcim group and the Aditya Birla group (Grasim and UltraTech). The demerger of Grasim’s cement business will lead to 48.8 million tonnes being concentrated in UltraTech. Other major players include India Cement, Shree Cement, Jaiprakash Associates and Dalmia-OCL. Such consolidation may not arrest the decline in prices if demand fails to pick up meaningfully.
Holcim and AV Birla group collectively account for ~23% of regional capacities in south India to ~68% in west India. Thus, despite such large controlling shares of regional capacities, pricing weakness has persisted to a large extent.
15.5 13.1 11.8 10.0 9.2
19.6 16.5 15.9 13.5 14.8
9.110.8 12.9 19.0 17.6
21.719.3 17.3 14.6 13.5
13.913.4 18.1 20.4 18.9
0.0
25.0
50.0
75.0
100.0
FY07 FY08 FY09 FY10E FY11EACC Ambuja Grasim JK Group Shree
North India cap break up (%)
11.9 9.1 8.1 8.0 8.8
7.2 8.2 6.1 4.8 4.4
6.9 5.1 9.0 8.4 7.7
17.515.4 13.7 12.3 11.4
10.88.1 9.3 9.3 8.6
0.0
20.0
40.0
60.0
80.0
FY07 FY08 FY09 FY10E FY11EACC Grasim Ultratech India Cement Madras Cement
South India Cap break up (%)
17.7 16.7 15.7 16.7 14.7
7.8 10.3 13.3 11.4 10.0
8.0 8.6 8.1 6.96.1
13.3 14.1 13.3 11.410.0
19.5 17.7 16.7 18.220.1
0.0
20.0
40.0
60.0
80.0
FY07 FY08 FY09 FY10E FY11EACC Ambuja Grasim Ultratech Lafarge
East india Cap Break up (%)
24.0 25.7 28.8 26.423.7
6.3 5.9 5.2 4.8 4.3
35.2 33.2 32.0 29.3 26.4
9.1 8.5 7.66.9 6.2
0.0
25.0
50.0
75.0
100.0
FY07 FY08 FY09 FY10E FY11EACC Ambuja Grasim Ultratech Sanghi India
West India Cap Break Up (%)
36.6 30.9 31.7 34.2 34.9
14.7 15.6 16.0 13.5 11.7
12.0 14.9 15.3 16.7 14.6
12.0 13.1 13.5 11.4 9.9
10.0 8.7 8.9 7.5 14.38.7 7.5 7.7 6.5 5.7
0.0
20.0
40.0
60.0
80.0
100.0
FY07 FY08 FY09 FY10E FY11E
Jaypee ACC Grasim Century Tex Prism Cement Birla Corp
Central India Cap Break up (%)
Source: CMIE, ACMIIL Research
UltraTech Cement Limited ACMIIL �
C O M P A N Y R E P O R T
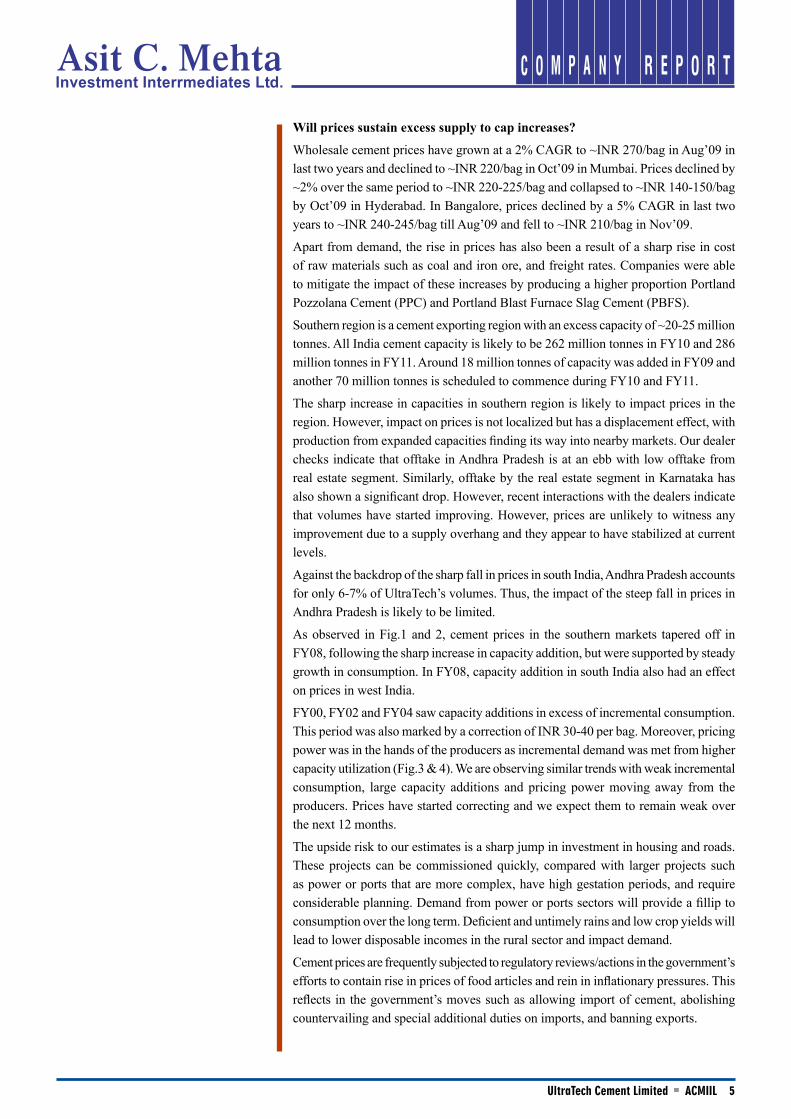
Will prices sustain excess supply to cap increases?
Wholesale cement prices have grown at a 2% CAGR to ~INR 270/bag in Aug’09 in last two years and declined to ~INR 220/bag in Oct’09 in Mumbai. Prices declined by ~2% over the same period to ~INR 220-225/bag and collapsed to ~INR 140-150/bag by Oct’09 in Hyderabad. In Bangalore, prices declined by a 5% CAGR in last two years to ~INR 240-245/bag till Aug’09 and fell to ~INR 210/bag in Nov’09.
Apart from demand, the rise in prices has also been a result of a sharp rise in cost of raw materials such as coal and iron ore, and freight rates. Companies were able to mitigate the impact of these increases by producing a higher proportion Portland Pozzolana Cement (PPC) and Portland Blast Furnace Slag Cement (PBFS).
Southern region is a cement exporting region with an excess capacity of ~20-25 million tonnes. All India cement capacity is likely to be 262 million tonnes in FY10 and 286 million tonnes in FY11. Around 18 million tonnes of capacity was added in FY09 and another 70 million tonnes is scheduled to commence during FY10 and FY11.
The sharp increase in capacities in southern region is likely to impact prices in the region. However, impact on prices is not localized but has a displacement effect, with production from expanded capacities finding its way into nearby markets. Our dealer checks indicate that offtake in Andhra Pradesh is at an ebb with low offtake from real estate segment. Similarly, offtake by the real estate segment in Karnataka has also shown a significant drop. However, recent interactions with the dealers indicate that volumes have started improving. However, prices are unlikely to witness any improvement due to a supply overhang and they appear to have stabilized at current levels.
Against the backdrop of the sharp fall in prices in south India, Andhra Pradesh accounts for only 6-7% of UltraTech’s volumes. Thus, the impact of the steep fall in prices in Andhra Pradesh is likely to be limited.
As observed in Fig.1 and 2, cement prices in the southern markets tapered off in FY08, following the sharp increase in capacity addition, but were supported by steady growth in consumption. In FY08, capacity addition in south India also had an effect on prices in west India.
FY00, FY02 and FY04 saw capacity additions in excess of incremental consumption. This period was also marked by a correction of INR 30-40 per bag. Moreover, pricing power was in the hands of the producers as incremental demand was met from higher capacity utilization (Fig.3 & 4). We are observing similar trends with weak incremental consumption, large capacity additions and pricing power moving away from the producers. Prices have started correcting and we expect them to remain weak over the next 12 months.
The upside risk to our estimates is a sharp jump in investment in housing and roads. These projects can be commissioned quickly, compared with larger projects such as power or ports that are more complex, have high gestation periods, and require considerable planning. Demand from power or ports sectors will provide a fillip to consumption over the long term. Deficient and untimely rains and low crop yields will lead to lower disposable incomes in the rural sector and impact demand.
Cement prices are frequently subjected to regulatory reviews/actions in the government’s efforts to contain rise in prices of food articles and rein in inflationary pressures. This reflects in the government’s moves such as allowing import of cement, abolishing countervailing and special additional duties on imports, and banning exports.
UltraTech Cement Limited ACMIIL �
C O M P A N Y R E P O R T
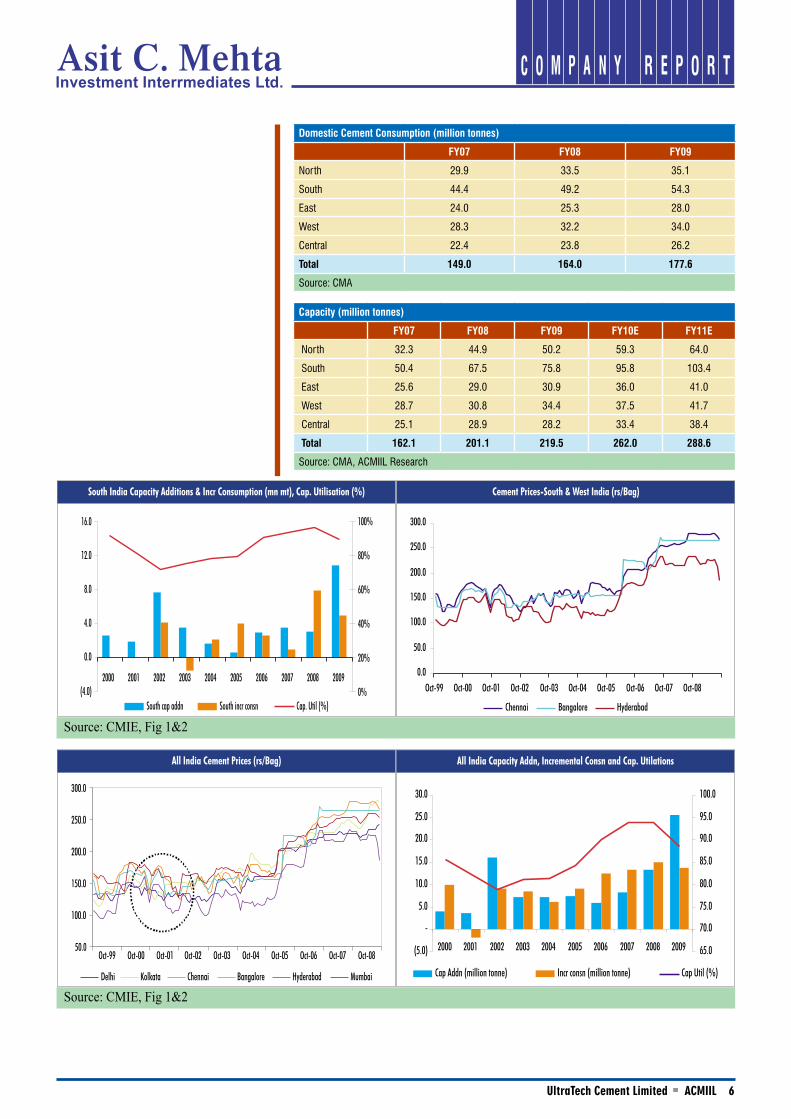
Domestic Cement Consumption (million tonnes)
FY07 FY08 FY09
North 29.9 33.5 35.1
South 44.4 49.2 54.3
East 24.0 25.3 28.0
West 28.3 32.2 34.0
Central 22.4 23.8 26.2
Total 149.0 164.0 177.6
Source: CMA
Capacity (million tonnes)
FY07 FY08 FY09 FY10E FY11E
North 32.3 44.9 50.2 59.3 64.0
South 50.4 67.5 75.8 95.8 103.4
East 25.6 29.0 30.9 36.0 41.0
West 28.7 30.8 34.4 37.5 41.7
Central 25.1 28.9 28.2 33.4 38.4
Total 162.1 201.1 219.5 262.0 288.6
Source: CMA, ACMIIL Research
(4.0)
0.0
4.0
8.0
12.0
16.0
0%
20%
40%
60%
80%
100%
2000 2001 2002 2003 2004 2005 2006 2007 2008 2009
South cap addn South incr consn Cap. Util (%)
South India Capacity Additions & Incr Consumption (mn mt), Cap. Utilisation (%)
0.0
50.0
100.0
150.0
200.0
250.0
300.0
Oct-99 Oct-00 Oct-01 Oct-02 Oct-03 Oct-04 Oct-05 Oct-06 Oct-07 Oct-08
Chennai Bangalore Hyderabad
Cement Prices-South & West India (rs/Bag)
Source: CMIE, Fig 1&2
Source: CMIE, Fig 1&2Delhi Kolkata Chennai Bangalore Hyderabad Mumbai
50.0
100.0
150.0
200.0
250.0
300.0
Oct-99 Oct-00 Oct-01 Oct-02 Oct-03 Oct-04 Oct-05 Oct-06 Oct-07 Oct-08
All India Cement Prices (rs/Bag)
(5.0)
-
5.0
10.0
15.0
20.0
25.0
30.0
2000 2001 2002 2003 2004 2005 2006 2007 2008 2009 65.0
70.0
75.0
80.0
85.0
90.0
95.0
100.0
Cap Addn (million tonne) Incr consn (million tonne) Cap Util (%)
All India Capacity Addn, Incremental Consn and Cap. Utilations
UltraTech Cement Limited ACMIIL �
C O M P A N Y R E P O R T
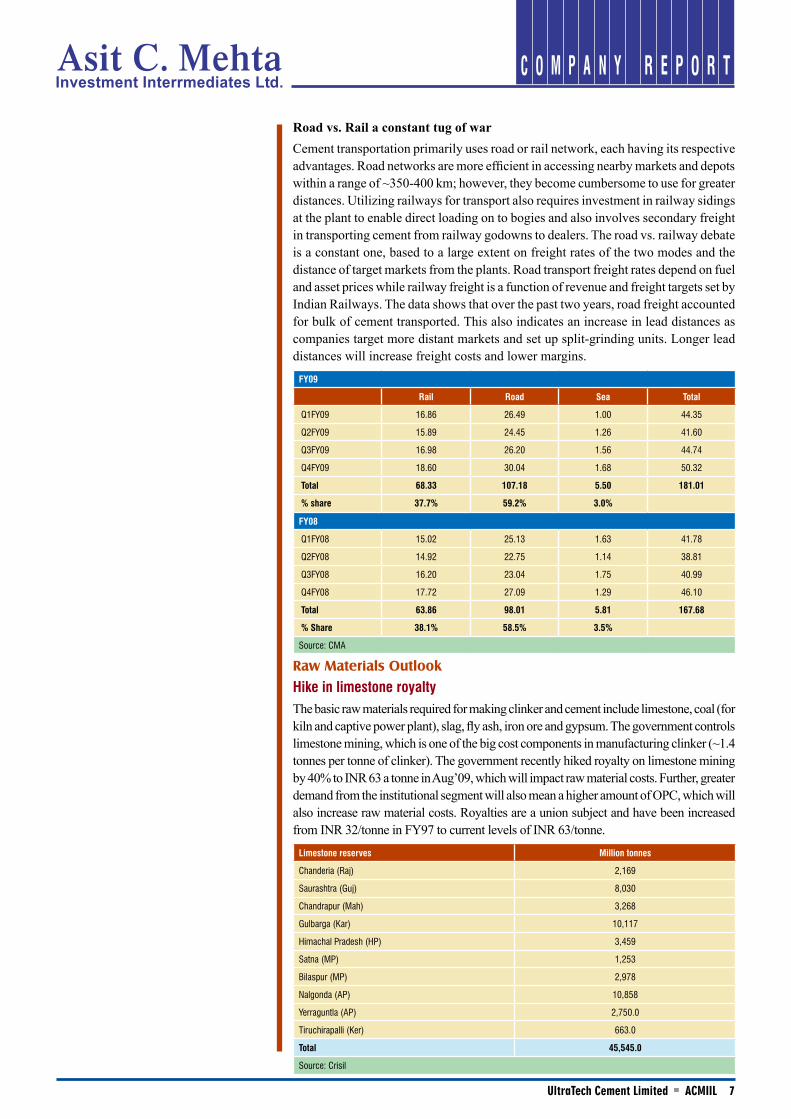
Road vs. Rail a constant tug of warCement transportation primarily uses road or rail network, each having its respective advantages. Road networks are more efficient in accessing nearby markets and depots within a range of ~350-400 km; however, they become cumbersome to use for greater distances. Utilizing railways for transport also requires investment in railway sidings at the plant to enable direct loading on to bogies and also involves secondary freight in transporting cement from railway godowns to dealers. The road vs. railway debate is a constant one, based to a large extent on freight rates of the two modes and the distance of target markets from the plants. Road transport freight rates depend on fuel and asset prices while railway freight is a function of revenue and freight targets set by Indian Railways. The data shows that over the past two years, road freight accounted for bulk of cement transported. This also indicates an increase in lead distances as companies target more distant markets and set up split-grinding units. Longer lead distances will increase freight costs and lower margins.
FY09
Rail Road Sea Total
Q1FY09 16.86 26.49 1.00 44.35
Q2FY09 15.89 24.45 1.26 41.60
Q3FY09 16.98 26.20 1.56 44.74
Q4FY09 18.60 30.04 1.68 50.32
Total 68.33 107.18 5.50 181.01
% share 37.7% 59.2% 3.0%
FY08
Q1FY08 15.02 25.13 1.63 41.78
Q2FY08 14.92 22.75 1.14 38.81
Q3FY08 16.20 23.04 1.75 40.99
Q4FY08 17.72 27.09 1.29 46.10
Total 63.86 98.01 5.81 167.68
% Share 38.1% 58.5% 3.5%
Source: CMA
Raw Materials Outlook
Hike in limestone royaltyThe basic raw materials required for making clinker and cement include limestone, coal (for kiln and captive power plant), slag, fly ash, iron ore and gypsum. The government controls limestone mining, which is one of the big cost components in manufacturing clinker (~1.4 tonnes per tonne of clinker). The government recently hiked royalty on limestone mining by 40% to INR 63 a tonne in Aug’09, which will impact raw material costs. Further, greater demand from the institutional segment will also mean a higher amount of OPC, which will also increase raw material costs. Royalties are a union subject and have been increased from INR 32/tonne in FY97 to current levels of INR 63/tonne.
Limestone reserves Million tonnes
Chanderia (Raj) 2,169
Saurashtra (Guj) 8,030
Chandrapur (Mah) 3,268
Gulbarga (Kar) 10,117
Himachal Pradesh (HP) 3,459
Satna (MP) 1,253
Bilaspur (MP) 2,978
Nalgonda (AP) 10,858
Yerraguntla (AP) 2,750.0
Tiruchirapalli (Ker) 663.0
Total 45,545.0
Source: Crisil
UltraTech Cement Limited ACMIIL �
C O M P A N Y R E P O R T
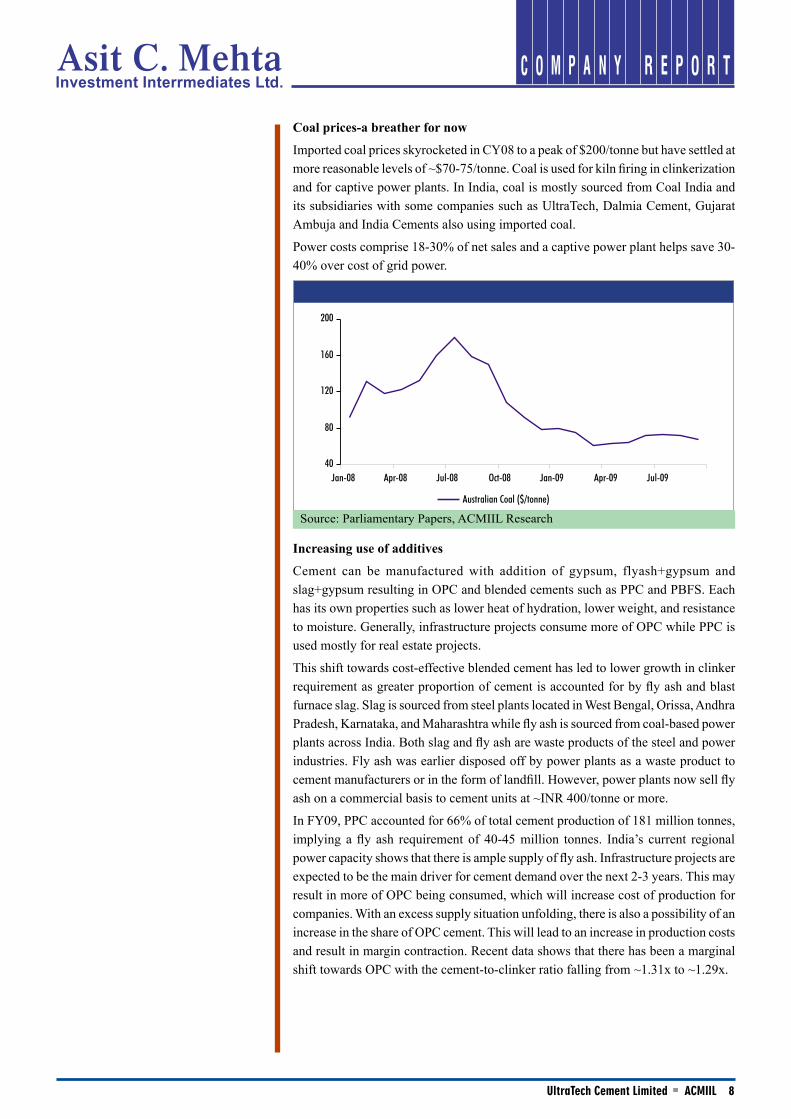
Coal prices-a breather for now
Imported coal prices skyrocketed in CY08 to a peak of $200/tonne but have settled at more reasonable levels of ~$70-75/tonne. Coal is used for kiln firing in clinkerization and for captive power plants. In India, coal is mostly sourced from Coal India and its subsidiaries with some companies such as UltraTech, Dalmia Cement, Gujarat Ambuja and India Cements also using imported coal.
Power costs comprise 18-30% of net sales and a captive power plant helps save 30-40% over cost of grid power.
Increasing use of additives
Cement can be manufactured with addition of gypsum, flyash+gypsum and slag+gypsum resulting in OPC and blended cements such as PPC and PBFS. Each has its own properties such as lower heat of hydration, lower weight, and resistance to moisture. Generally, infrastructure projects consume more of OPC while PPC is used mostly for real estate projects.
This shift towards cost-effective blended cement has led to lower growth in clinker requirement as greater proportion of cement is accounted for by fly ash and blast furnace slag. Slag is sourced from steel plants located in West Bengal, Orissa, Andhra Pradesh, Karnataka, and Maharashtra while fly ash is sourced from coal-based power plants across India. Both slag and fly ash are waste products of the steel and power industries. Fly ash was earlier disposed off by power plants as a waste product to cement manufacturers or in the form of landfill. However, power plants now sell fly ash on a commercial basis to cement units at ~INR 400/tonne or more.
In FY09, PPC accounted for 66% of total cement production of 181 million tonnes, implying a fly ash requirement of 40-45 million tonnes. India’s current regional power capacity shows that there is ample supply of fly ash. Infrastructure projects are expected to be the main driver for cement demand over the next 2-3 years. This may result in more of OPC being consumed, which will increase cost of production for companies. With an excess supply situation unfolding, there is also a possibility of an increase in the share of OPC cement. This will lead to an increase in production costs and result in margin contraction. Recent data shows that there has been a marginal shift towards OPC with the cement-to-clinker ratio falling from ~1.31x to ~1.29x.
40
80
120
160
200
Jan-08 Apr-08 Jul-08 Oct-08 Jan-09 Apr-09 Jul-09
Australian Coal ($/tonne)
Source: Parliamentary Papers, ACMIIL Research
UltraTech Cement Limited ACMIIL �
C O M P A N Y R E P O R T
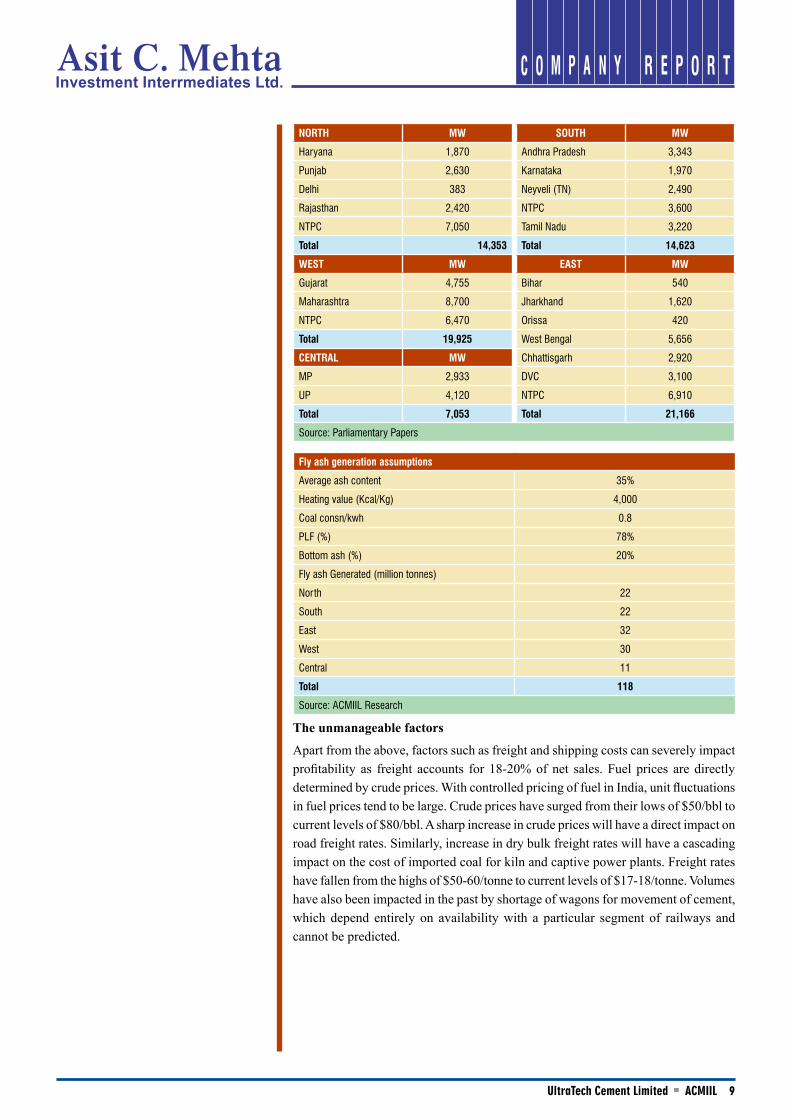
NORTH MW SOUTH MW
Haryana 1,870 Andhra Pradesh 3,343
Punjab 2,630 Karnataka 1,970
Delhi 383 Neyveli (TN) 2,490
Rajasthan 2,420 NTPC 3,600
NTPC 7,050 Tamil Nadu 3,220
Total 14,353 Total 14,623
WEST MW EAST MW
Gujarat 4,755 Bihar 540
Maharashtra 8,700 Jharkhand 1,620
NTPC 6,470 Orissa 420
Total 19,925 West Bengal 5,656
CENTRAL MW Chhattisgarh 2,920
MP 2,933 DVC 3,100
UP 4,120 NTPC 6,910
Total 7,053 Total 21,166
Source: Parliamentary Papers
Fly ash generation assumptions
Average ash content 35%
Heating value (Kcal/Kg) 4,000
Coal consn/kwh 0.8
PLF (%) 78%
Bottom ash (%) 20%
Fly ash Generated (million tonnes)
North 22
South 22
East 32
West 30
Central 11
Total 118
Source: ACMIIL Research
The unmanageable factors
Apart from the above, factors such as freight and shipping costs can severely impact profitability as freight accounts for 18-20% of net sales. Fuel prices are directly determined by crude prices. With controlled pricing of fuel in India, unit fluctuations in fuel prices tend to be large. Crude prices have surged from their lows of $50/bbl to current levels of $80/bbl. A sharp increase in crude prices will have a direct impact on road freight rates. Similarly, increase in dry bulk freight rates will have a cascading impact on the cost of imported coal for kiln and captive power plants. Freight rates have fallen from the highs of $50-60/tonne to current levels of $17-18/tonne. Volumes have also been impacted in the past by shortage of wagons for movement of cement, which depend entirely on availability with a particular segment of railways and cannot be predicted.
UltraTech Cement Limited ACMIIL �0
C O M P A N Y R E P O R T
Ultratech Cement
Background and plant locations
UltraTech was formed following the de-merger of L&T’s cement division in 2003. As a result, UltraTech became a 54.8% subsidiary of Grasim. UltraTech has five composite plants and six grinding units located largely in west and south India. It has grinding units at Ginigera (Kar), Magdalla (Guj), Arakkonam (TN), Jharsuguda (Orissa), Durgapur (WB) and Ratnagiri (Mah), which serve as effective sourcing points for nearby target markets.
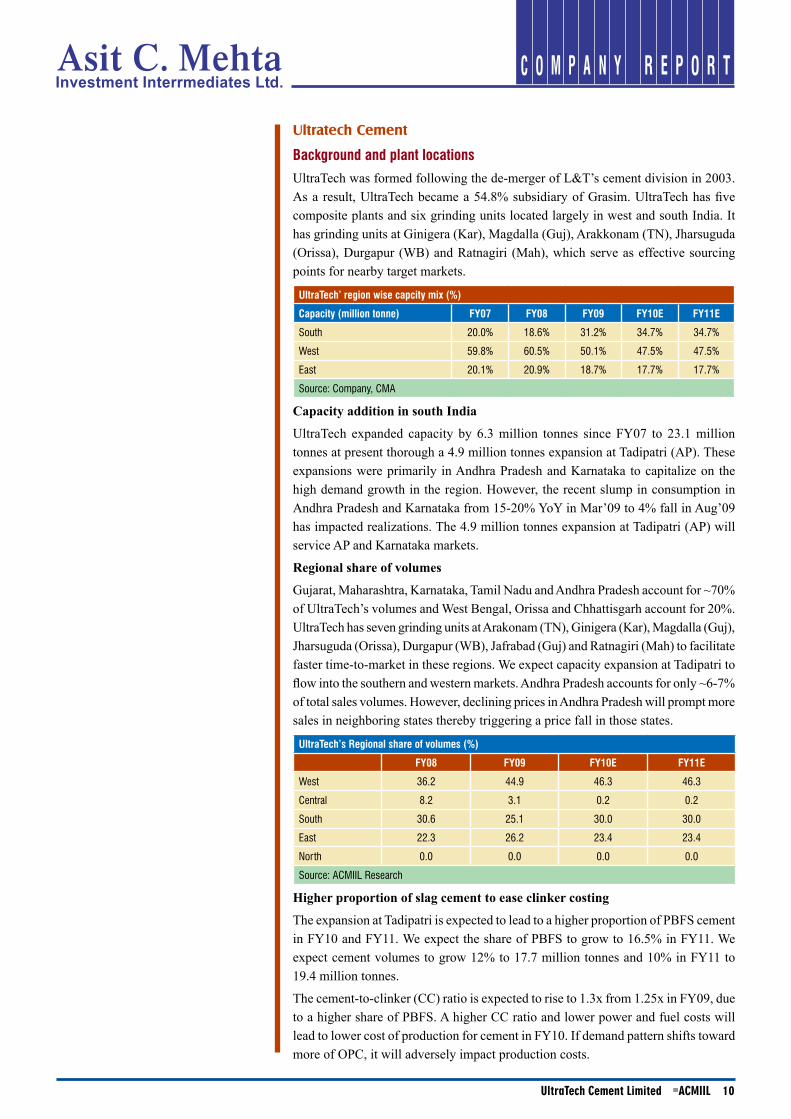
UltraTech’ region wise capcity mix (%)
Capacity (million tonne) FY07 FY08 FY09 FY10E FY11E
South 20.0% 18.6% 31.2% 34.7% 34.7%
West 59.8% 60.5% 50.1% 47.5% 47.5%
East 20.1% 20.9% 18.7% 17.7% 17.7%
Source: Company, CMA
Capacity addition in south India
UltraTech expanded capacity by 6.3 million tonnes since FY07 to 23.1 million tonnes at present thorough a 4.9 million tonnes expansion at Tadipatri (AP). These expansions were primarily in Andhra Pradesh and Karnataka to capitalize on the high demand growth in the region. However, the recent slump in consumption in Andhra Pradesh and Karnataka from 15-20% YoY in Mar’09 to 4% fall in Aug’09 has impacted realizations. The 4.9 million tonnes expansion at Tadipatri (AP) will service AP and Karnataka markets.
Regional share of volumes
Gujarat, Maharashtra, Karnataka, Tamil Nadu and Andhra Pradesh account for ~70% of UltraTech’s volumes and West Bengal, Orissa and Chhattisgarh account for 20%. UltraTech has seven grinding units at Arakonam (TN), Ginigera (Kar), Magdalla (Guj), Jharsuguda (Orissa), Durgapur (WB), Jafrabad (Guj) and Ratnagiri (Mah) to facilitate faster time-to-market in these regions. We expect capacity expansion at Tadipatri to flow into the southern and western markets. Andhra Pradesh accounts for only ~6-7% of total sales volumes. However, declining prices in Andhra Pradesh will prompt more sales in neighboring states thereby triggering a price fall in those states.
UltraTech’s Regional share of volumes (%)
FY08 FY09 FY10E FY11E
West 36.2 44.9 46.3 46.3
Central 8.2 3.1 0.2 0.2
South 30.6 25.1 30.0 30.0
East 22.3 26.2 23.4 23.4
North 0.0 0.0 0.0 0.0
Source: ACMIIL Research
Higher proportion of slag cement to ease clinker costing
The expansion at Tadipatri is expected to lead to a higher proportion of PBFS cement in FY10 and FY11. We expect the share of PBFS to grow to 16.5% in FY11. We expect cement volumes to grow 12% to 17.7 million tonnes and 10% in FY11 to 19.4 million tonnes.
The cement-to-clinker (CC) ratio is expected to rise to 1.3x from 1.25x in FY09, due to a higher share of PBFS. A higher CC ratio and lower power and fuel costs will lead to lower cost of production for cement in FY10. If demand pattern shifts toward more of OPC, it will adversely impact production costs.
UltraTech Cement Limited ACMIIL ��
C O M P A N Y R E P O R T
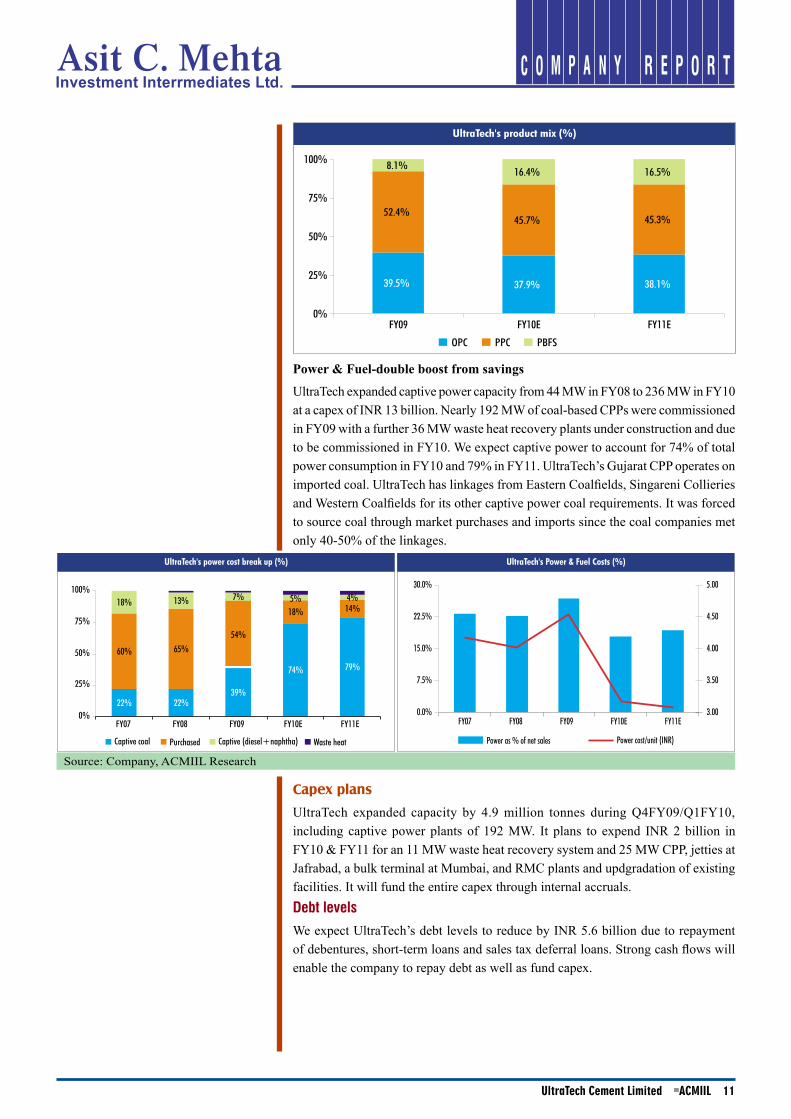
Power & Fuel-double boost from savings
UltraTech expanded captive power capacity from 44 MW in FY08 to 236 MW in FY10 at a capex of INR 13 billion. Nearly 192 MW of coal-based CPPs were commissioned in FY09 with a further 36 MW waste heat recovery plants under construction and due to be commissioned in FY10. We expect captive power to account for 74% of total power consumption in FY10 and 79% in FY11. UltraTech’s Gujarat CPP operates on imported coal. UltraTech has linkages from Eastern Coalfields, Singareni Collieries and Western Coalfields for its other captive power coal requirements. It was forced to source coal through market purchases and imports since the coal companies met only 40-50% of the linkages.
Capex plans
UltraTech expanded capacity by 4.9 million tonnes during Q4FY09/Q1FY10, including captive power plants of 192 MW. It plans to expend INR 2 billion in FY10 & FY11 for an 11 MW waste heat recovery system and 25 MW CPP, jetties at Jafrabad, a bulk terminal at Mumbai, and RMC plants and updgradation of existing facilities. It will fund the entire capex through internal accruals.Debt levels
We expect UltraTech’s debt levels to reduce by INR 5.6 billion due to repayment of debentures, short-term loans and sales tax deferral loans. Strong cash flows will enable the company to repay debt as well as fund capex.
39.5% 37.9% 38.1%
52.4%45.7% 45.3%
8.1% 16.4% 16.5%
0%
25%
50%
75%
100%
FY09 FY10E FY11EOPC PPC PBFS
UltraTech's product mix (%)
Source: Company, ACMIIL Research
22% 22%39%
74% 79%60% 65%
54%
18% 14%18% 13% 7% 5% 4%
0%
25%
50%
75%
100%
FY07 FY08 FY09 FY10E FY11E
Captive coal Purchased Captive (diesel+naphtha) Waste heat
UltraTech's power cost break up (%)
0.0%
7.5%
15.0%
22.5%
30.0%
FY07 FY08 FY09 FY10E FY11E3.00
3.50
4.00
4.50
5.00
Power as % of net sales Power cost/unit (INR)
UltraTech's Power & Fuel Costs (%)
UltraTech Cement Limited ACMIIL ��
C O M P A N Y R E P O R T
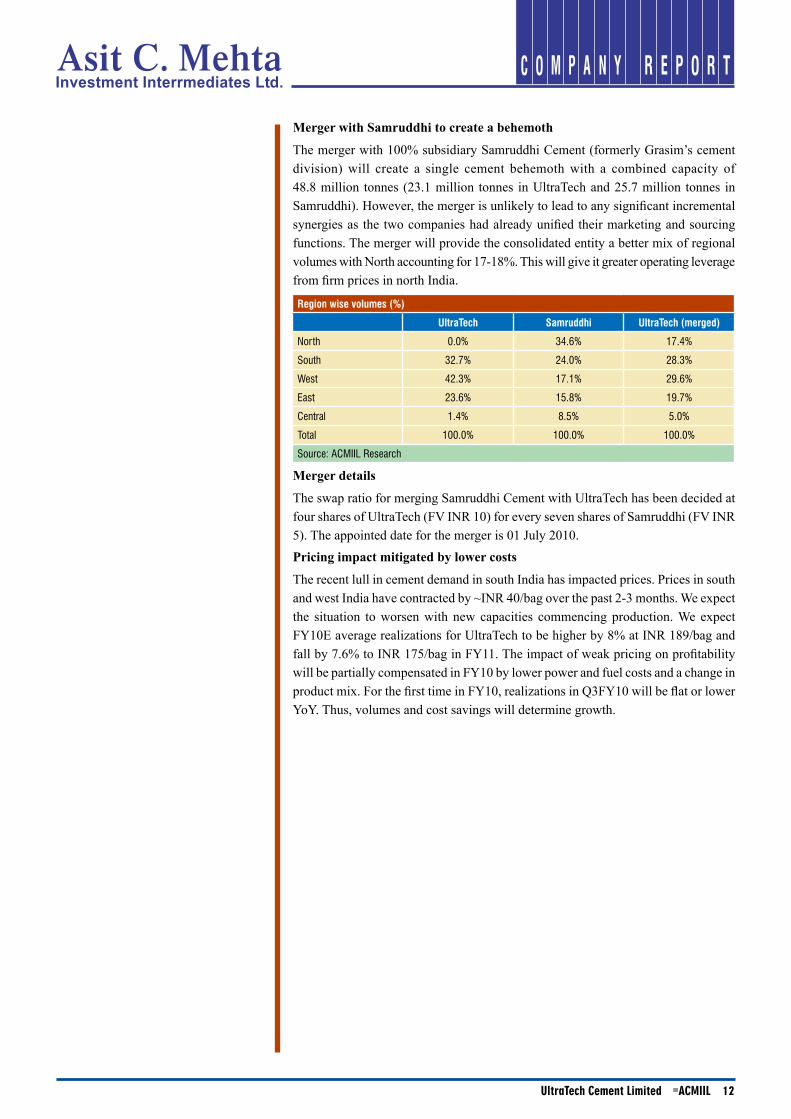
Merger with Samruddhi to create a behemoth
The merger with 100% subsidiary Samruddhi Cement (formerly Grasim’s cement division) will create a single cement behemoth with a combined capacity of 48.8 million tonnes (23.1 million tonnes in UltraTech and 25.7 million tonnes in Samruddhi). However, the merger is unlikely to lead to any significant incremental synergies as the two companies had already unified their marketing and sourcing functions. The merger will provide the consolidated entity a better mix of regional volumes with North accounting for 17-18%. This will give it greater operating leverage from firm prices in north India.
Region wise volumes (%)
UltraTech Samruddhi UltraTech (merged)
North 0.0% 34.6% 17.4%
South 32.7% 24.0% 28.3%
West 42.3% 17.1% 29.6%
East 23.6% 15.8% 19.7%
Central 1.4% 8.5% 5.0%
Total 100.0% 100.0% 100.0%
Source: ACMIIL Research
Merger details
The swap ratio for merging Samruddhi Cement with UltraTech has been decided at four shares of UltraTech (FV INR 10) for every seven shares of Samruddhi (FV INR 5). The appointed date for the merger is 01 July 2010.Pricing impact mitigated by lower costs
The recent lull in cement demand in south India has impacted prices. Prices in south and west India have contracted by ~INR 40/bag over the past 2-3 months. We expect the situation to worsen with new capacities commencing production. We expect FY10E average realizations for UltraTech to be higher by 8% at INR 189/bag and fall by 7.6% to INR 175/bag in FY11. The impact of weak pricing on profitability will be partially compensated in FY10 by lower power and fuel costs and a change in product mix. For the first time in FY10, realizations in Q3FY10 will be flat or lower YoY. Thus, volumes and cost savings will determine growth.
UltraTech Cement Limited ACMIIL ��
C O M P A N Y R E P O R T
Financials
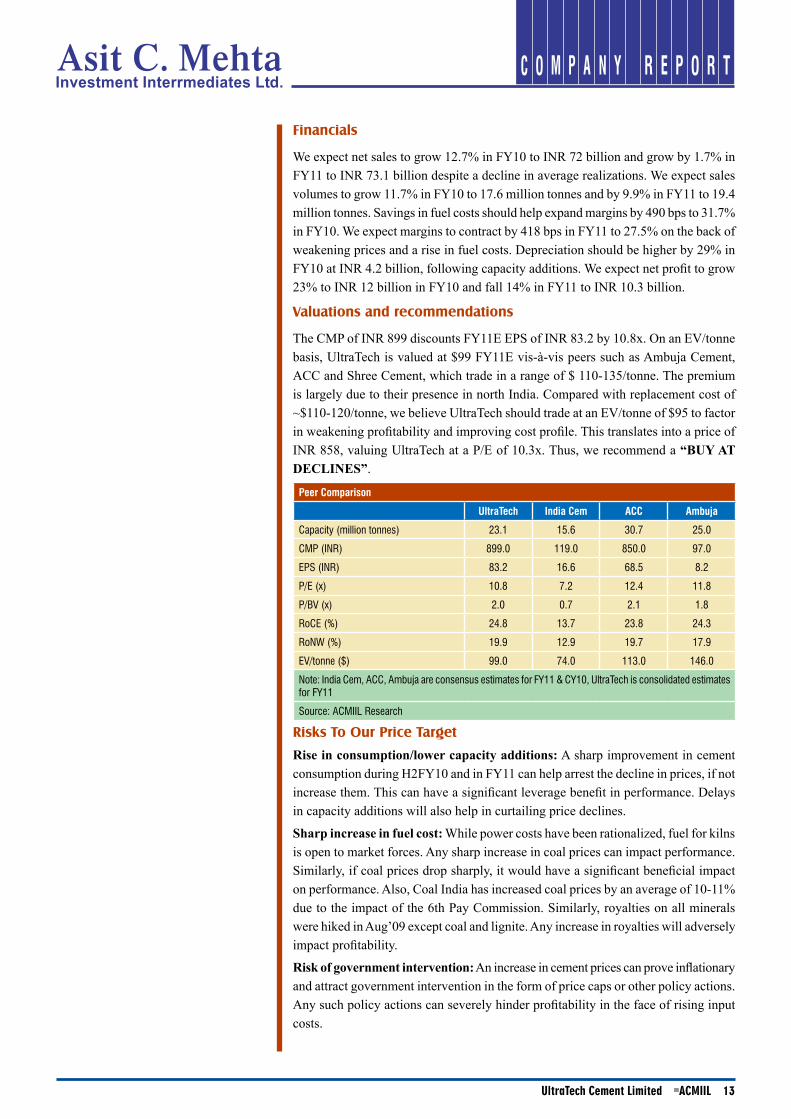
We expect net sales to grow 12.7% in FY10 to INR 72 billion and grow by 1.7% in FY11 to INR 73.1 billion despite a decline in average realizations. We expect sales volumes to grow 11.7% in FY10 to 17.6 million tonnes and by 9.9% in FY11 to 19.4 million tonnes. Savings in fuel costs should help expand margins by 490 bps to 31.7% in FY10. We expect margins to contract by 418 bps in FY11 to 27.5% on the back of weakening prices and a rise in fuel costs. Depreciation should be higher by 29% in FY10 at INR 4.2 billion, following capacity additions. We expect net profit to grow 23% to INR 12 billion in FY10 and fall 14% in FY11 to INR 10.3 billion.
Valuations and recommendations
The CMP of INR 899 discounts FY11E EPS of INR 83.2 by 10.8x. On an EV/tonne basis, UltraTech is valued at $99 FY11E vis-à-vis peers such as Ambuja Cement, ACC and Shree Cement, which trade in a range of $ 110-135/tonne. The premium is largely due to their presence in north India. Compared with replacement cost of ~$110-120/tonne, we believe UltraTech should trade at an EV/tonne of $95 to factor in weakening profitability and improving cost profile. This translates into a price of INR 858, valuing UltraTech at a P/E of 10.3x. Thus, we recommend a “BUY AT DECLINES”.
Peer Comparison
UltraTech India Cem ACC Ambuja
Capacity (million tonnes) 23.1 15.6 30.7 25.0
CMP (INR) 899.0 119.0 850.0 97.0
EPS (INR) 83.2 16.6 68.5 8.2
P/E (x) 10.8 7.2 12.4 11.8
P/BV (x) 2.0 0.7 2.1 1.8
RoCE (%) 24.8 13.7 23.8 24.3
RoNW (%) 19.9 12.9 19.7 17.9
EV/tonne ($) 99.0 74.0 113.0 146.0
Note: India Cem, ACC, Ambuja are consensus estimates for FY11 & CY10, UltraTech is consolidated estimates for FY11
Source: ACMIIL Research
Risks To Our Price Target
Rise in consumption/lower capacity additions: A sharp improvement in cement consumption during H2FY10 and in FY11 can help arrest the decline in prices, if not increase them. This can have a significant leverage benefit in performance. Delays in capacity additions will also help in curtailing price declines.
Sharp increase in fuel cost: While power costs have been rationalized, fuel for kilns is open to market forces. Any sharp increase in coal prices can impact performance. Similarly, if coal prices drop sharply, it would have a significant beneficial impact on performance. Also, Coal India has increased coal prices by an average of 10-11% due to the impact of the 6th Pay Commission. Similarly, royalties on all minerals were hiked in Aug’09 except coal and lignite. Any increase in royalties will adversely impact profitability.
Risk of government intervention: An increase in cement prices can prove inflationary and attract government intervention in the form of price caps or other policy actions. Any such policy actions can severely hinder profitability in the face of rising input costs.
UltraTech Cement Limited ACMIIL ��
C O M P A N Y R E P O R T
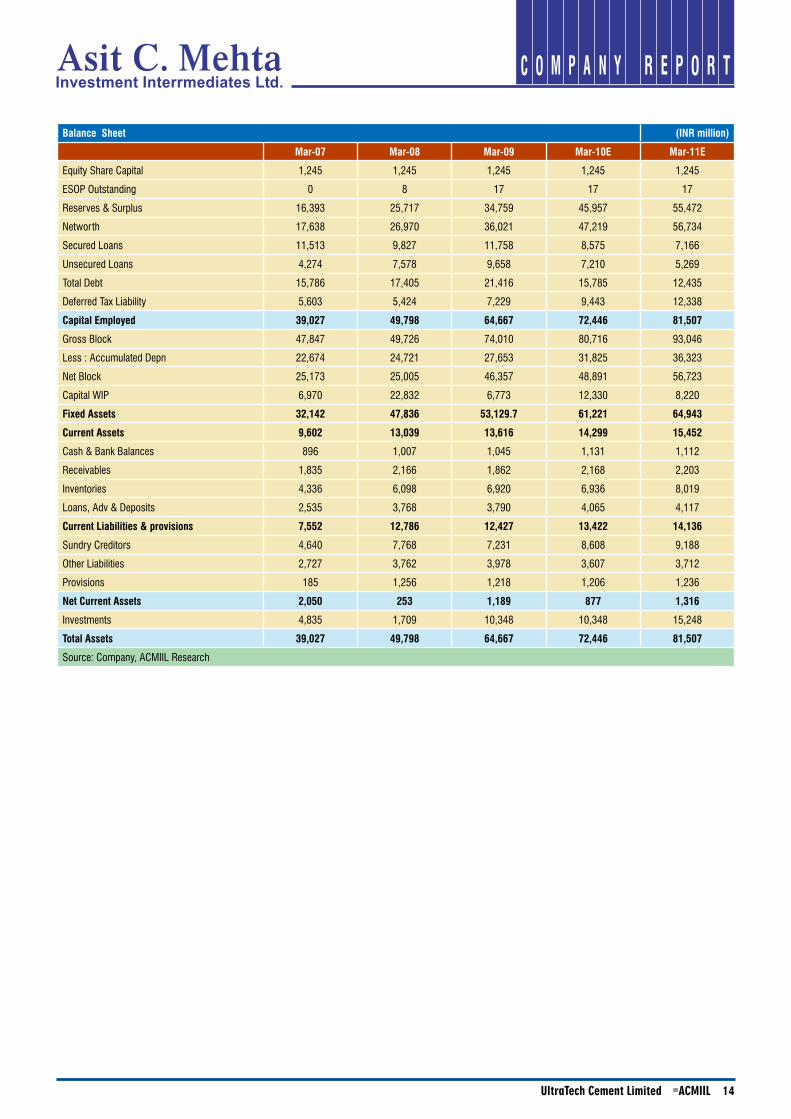
Balance Sheet (INR million)
Mar-07 Mar-08 Mar-09 Mar-10E Mar-11E
Equity Share Capital 1,245 1,245 1,245 1,245 1,245
ESOP Outstanding 0 8 17 17 17
Reserves & Surplus 16,393 25,717 34,759 45,957 55,472
Networth 17,638 26,970 36,021 47,219 56,734
Secured Loans 11,513 9,827 11,758 8,575 7,166
Unsecured Loans 4,274 7,578 9,658 7,210 5,269
Total Debt 15,786 17,405 21,416 15,785 12,435
Deferred Tax Liability 5,603 5,424 7,229 9,443 12,338
Capital Employed 39,027 49,798 64,667 72,446 81,507
Gross Block 47,847 49,726 74,010 80,716 93,046
Less : Accumulated Depn 22,674 24,721 27,653 31,825 36,323
Net Block 25,173 25,005 46,357 48,891 56,723
Capital WIP 6,970 22,832 6,773 12,330 8,220
Fixed Assets 32,142 47,836 53,129.7 61,221 64,943
Current Assets 9,602 13,039 13,616 14,299 15,452
Cash & Bank Balances 896 1,007 1,045 1,131 1,112
Receivables 1,835 2,166 1,862 2,168 2,203
Inventories 4,336 6,098 6,920 6,936 8,019
Loans, Adv & Deposits 2,535 3,768 3,790 4,065 4,117
Current Liabilities & provisions 7,552 12,786 12,427 13,422 14,136
Sundry Creditors 4,640 7,768 7,231 8,608 9,188
Other Liabilities 2,727 3,762 3,978 3,607 3,712
Provisions 185 1,256 1,218 1,206 1,236
Net Current Assets 2,050 253 1,189 877 1,316
Investments 4,835 1,709 10,348 10,348 15,248
Total Assets 39,027 49,798 64,667 72,446 81,507
Source: Company, ACMIIL Research
UltraTech Cement Limited ACMIIL ��
C O M P A N Y R E P O R T
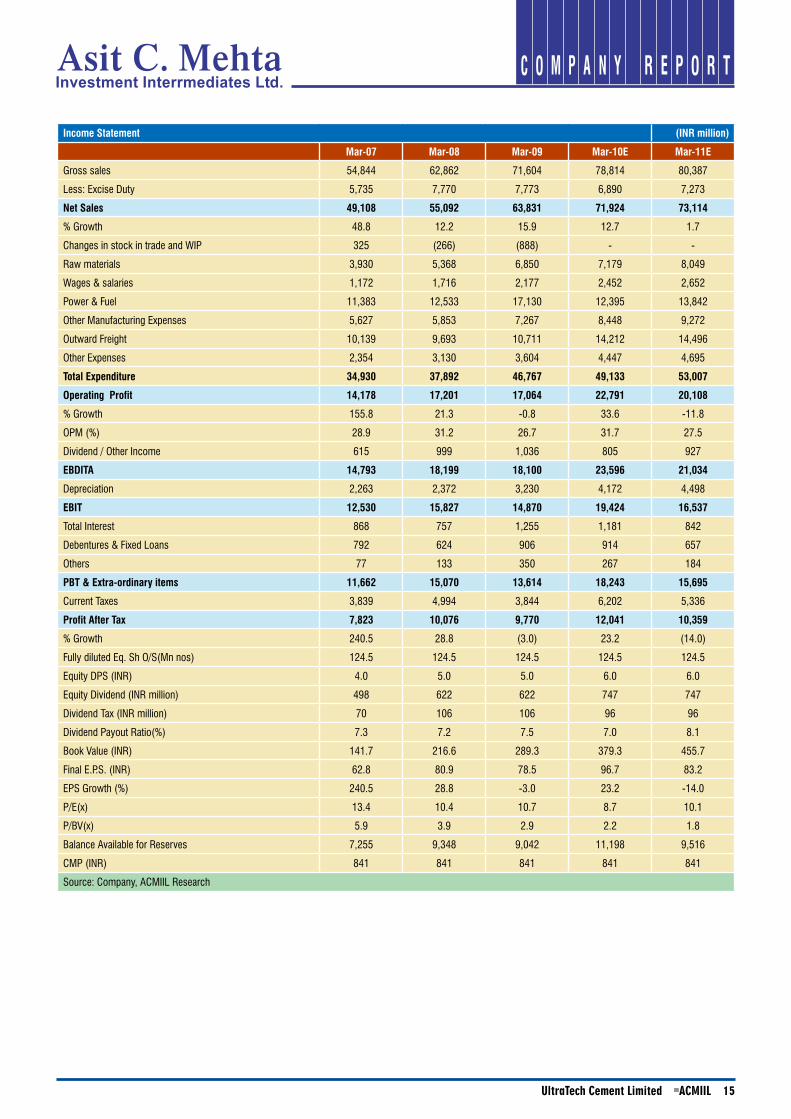
Income Statement (INR million)
Mar-07 Mar-08 Mar-09 Mar-10E Mar-11E
Gross sales 54,844 62,862 71,604 78,814 80,387
Less: Excise Duty 5,735 7,770 7,773 6,890 7,273
Net Sales 49,108 55,092 63,831 71,924 73,114
% Growth 48.8 12.2 15.9 12.7 1.7
Changes in stock in trade and WIP 325 (266) (888) - -
Raw materials 3,930 5,368 6,850 7,179 8,049
Wages & salaries 1,172 1,716 2,177 2,452 2,652
Power & Fuel 11,383 12,533 17,130 12,395 13,842
Other Manufacturing Expenses 5,627 5,853 7,267 8,448 9,272
Outward Freight 10,139 9,693 10,711 14,212 14,496
Other Expenses 2,354 3,130 3,604 4,447 4,695
Total Expenditure 34,930 37,892 46,767 49,133 53,007
Operating Profit 14,178 17,201 17,064 22,791 20,108
% Growth 155.8 21.3 -0.8 33.6 -11.8
OPM (%) 28.9 31.2 26.7 31.7 27.5
Dividend / Other Income 615 999 1,036 805 927
EBDITA 14,793 18,199 18,100 23,596 21,034
Depreciation 2,263 2,372 3,230 4,172 4,498
EBIT 12,530 15,827 14,870 19,424 16,537
Total Interest 868 757 1,255 1,181 842
Debentures & Fixed Loans 792 624 906 914 657
Others 77 133 350 267 184
PBT & Extra-ordinary items 11,662 15,070 13,614 18,243 15,695
Current Taxes 3,839 4,994 3,844 6,202 5,336
Profit After Tax 7,823 10,076 9,770 12,041 10,359
% Growth 240.5 28.8 (3.0) 23.2 (14.0)
Fully diluted Eq. Sh O/S(Mn nos) 124.5 124.5 124.5 124.5 124.5
Equity DPS (INR) 4.0 5.0 5.0 6.0 6.0
Equity Dividend (INR million) 498 622 622 747 747
Dividend Tax (INR million) 70 106 106 96 96
Dividend Payout Ratio(%) 7.3 7.2 7.5 7.0 8.1
Book Value (INR) 141.7 216.6 289.3 379.3 455.7
Final E.P.S. (INR) 62.8 80.9 78.5 96.7 83.2
EPS Growth (%) 240.5 28.8 -3.0 23.2 -14.0
P/E(x) 13.4 10.4 10.7 8.7 10.1
P/BV(x) 5.9 3.9 2.9 2.2 1.8
Balance Available for Reserves 7,255 9,348 9,042 11,198 9,516
CMP (INR) 841 841 841 841 841
Source: Company, ACMIIL Research
UltraTech Cement Limited ACMIIL ��
C O M P A N Y R E P O R T
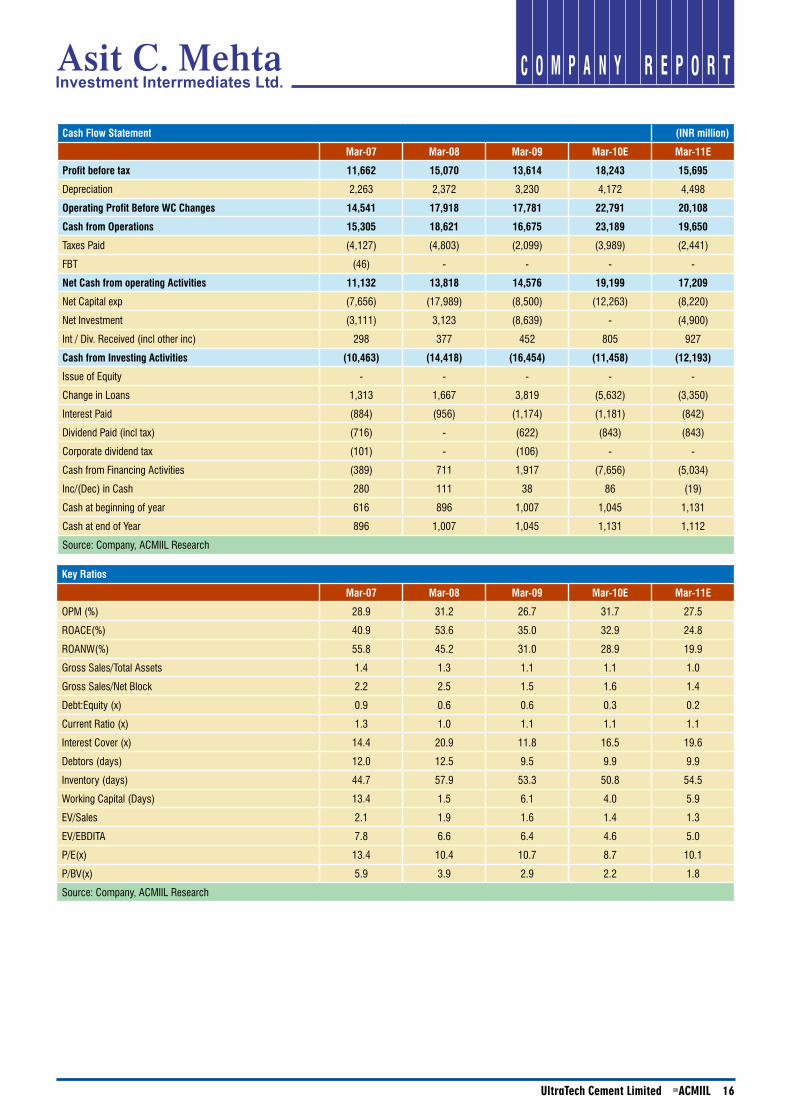
Cash Flow Statement (INR million)
Mar-07 Mar-08 Mar-09 Mar-10E Mar-11E
Profit before tax 11,662 15,070 13,614 18,243 15,695
Depreciation 2,263 2,372 3,230 4,172 4,498
Operating Profit Before WC Changes 14,541 17,918 17,781 22,791 20,108
Cash from Operations 15,305 18,621 16,675 23,189 19,650
Taxes Paid (4,127) (4,803) (2,099) (3,989) (2,441)
FBT (46) - - - -
Net Cash from operating Activities 11,132 13,818 14,576 19,199 17,209
Net Capital exp (7,656) (17,989) (8,500) (12,263) (8,220)
Net Investment (3,111) 3,123 (8,639) - (4,900)
Int / Div. Received (incl other inc) 298 377 452 805 927
Cash from Investing Activities (10,463) (14,418) (16,454) (11,458) (12,193)
Issue of Equity - - - - -
Change in Loans 1,313 1,667 3,819 (5,632) (3,350)
Interest Paid (884) (956) (1,174) (1,181) (842)
Dividend Paid (incl tax) (716) - (622) (843) (843)
Corporate dividend tax (101) - (106) - -
Cash from Financing Activities (389) 711 1,917 (7,656) (5,034)
Inc/(Dec) in Cash 280 111 38 86 (19)
Cash at beginning of year 616 896 1,007 1,045 1,131
Cash at end of Year 896 1,007 1,045 1,131 1,112
Source: Company, ACMIIL Research
Key Ratios
Mar-07 Mar-08 Mar-09 Mar-10E Mar-11E
OPM (%) 28.9 31.2 26.7 31.7 27.5
ROACE(%) 40.9 53.6 35.0 32.9 24.8
ROANW(%) 55.8 45.2 31.0 28.9 19.9
Gross Sales/Total Assets 1.4 1.3 1.1 1.1 1.0
Gross Sales/Net Block 2.2 2.5 1.5 1.6 1.4
Debt:Equity (x) 0.9 0.6 0.6 0.3 0.2
Current Ratio (x) 1.3 1.0 1.1 1.1 1.1
Interest Cover (x) 14.4 20.9 11.8 16.5 19.6
Debtors (days) 12.0 12.5 9.5 9.9 9.9
Inventory (days) 44.7 57.9 53.3 50.8 54.5
Working Capital (Days) 13.4 1.5 6.1 4.0 5.9
EV/Sales 2.1 1.9 1.6 1.4 1.3
EV/EBDITA 7.8 6.6 6.4 4.6 5.0
P/E(x) 13.4 10.4 10.7 8.7 10.1
P/BV(x) 5.9 3.9 2.9 2.2 1.8
Source: Company, ACMIIL Research
UltraTech Cement Limited ACMIIL ��
C O M P A N Y R E P O R T
Disclaimer:
This report is based on information that we consider reliable, but we do not represent that it is accurate or complete and it should not be relied upon such. ACMIIL or
any of its affiliates or employees shall not be in any way responsible for any loss or damage that may arise to any person from any inadvertent error in the information
contained in the report. ACMIIL and/or its affiliates and/or employees may have interests/positions, financial or otherwise in the securities mentioned in this report.
To enhance transparency we have incorporated a Disclosure of Interest Statement in this document. This should however not be treated as endorsement of the views
expressed in the report
Disclosure of Interest UltraTech Cement Limited
1. Analyst ownership of the stock NO
2. Broking Relationship with the company covered NO
3. Investment Banking relationship with the company covered NO
4. Discretionary Portfolio Management Services NO
This document has been prepared by the Research Desk of Asit C Mehta Investment Interrmediates Ltd. and is meant for use of the recipient only and is not for
circulation. This document is not to be reported or copied or made available to others. It should not be considered as an offer to sell or a solicitation to buy any security.
The information contained herein is from sources believed reliable. We do not represent that it is accurate or complete and it should not be relied upon as such. We
may from time to time have positions in and buy and sell securities referred to herein.
Notes:
Institutional Sales:
Ravindra Nath, Tel: +91 22 2858 3400
Kirti Bagri, Tel: +91 22 2858 3731
Himanshu Varia, Tel: +91 22 2858 3732
Email: [email protected]
Institutional Dealing:
Email: [email protected]