Embed Size (px)
Citation preview
Institutional Equities
Initi
atin
g C
over
age
Reuters: MNFL.BO; Bloomberg: MGFL IN
Manappuram Finance
De-risking And Diversification To Drive Earnings Growth Manappuram Finance (MFL) is the second-largest non-banking finance company or NBFC in the under-penetrated organised gold finance market in India. The company has a two-pronged strategy, enabling it to enter into a growth phase. Firstly, it has de-risked its gold loan portfolio from gold price volatility leading to lower auctions and non-performing assets or NPAs. Secondly, it has diversified its portfolio into non-gold products to drive growth and utilise excess capital on its books. With strong assets under management or AUM CAGR of 25%, healthy net interest margin or NIM, operating leverage and contained credit costs, we expect PAT to post a 27% CAGR over FY16-FY18E. We initiate coverage on the stock with a Buy rating and a target price of Rs85, valuing it through a residual income model.
Entering the growth phase: FY16 marked an end to the company’s three-year long consolidation phase. Key factors in the growth of gold loans were stable gold prices, steady loan-to-value or LTV regime, a level-playing field, weak players shifting out and de-focus by banks. We have factored in gold AUM posting a 15% CAGR over FY16-FY18E as against the management’s guidance of 20%.
De-risking gold loan portfolio: The company has borne the brunt on account of volatility in gold prices in the past. As a result, MFL moved to short-term (3-6 months) loan products with a maximum LTV of 75% which has helped the company in bringing down auctions losses significantly. As much as 90% of its gold loan portfolio has already migrated into the short-term category. Interest accrued on loans eased to 3% of loans as against an average of 7% over the past five years. Auctions as well as auction losses have declined significantly.
Diversification into non-gold products: MFL has embarked on a strategy of diversifying into microfinance, home loan, commercial vehicle or CV financing and loan against property or LAP. Non-gold portfolio forms 12% of AUM in FY16 against 4% in FY15. In line with the management’s guidance, we expect non-gold portfolio to increase to 25% of AUM in FY18E.
Robust asset quality: Despite moving to 120-day recognition for NPAs (a year ahead of regulatory requirement) GNPAs eased to 0.9% backed by its strategy of de-risking gold loans. Most of its current GNPAs relate to non-payment of principal, but yet there is payment of interest. Also, the company has provided 35bps for standard assets (a year ahead of regulatory requirement). We have conservatively factored in GNPAs to rise by 30bps to 1.2% by FY18E.
Return ratios to strengthen further: Return ratios have already improved significantly from their trough levels in FY13. With likely strong growth in AUM, stable margins, contained credit costs and operating as well as financial leverage to kick in, we expect RoA/RoE to improve further by 30bps/440bps to strong levels of 3.2%/17.6%, respectively in FY18E.
Valuation and outlook: With the worst-case scenario behind, regulatory environment turning favourable and gold prices stable, MFL is targeting healthy growth going forward. Its de-risking strategy has helped in keeping credit costs at a lower level. Diversification into other segments will enable faster utilisation of excess capital on its balance sheet and avoid any undesirable treatment from the regulator for being a single-product company. Tier I capital in excess of 23% ensures unhindered growth along with no need to raise capital for the next two years. MFL trades at an attractive valuation i.e. P/ABV of 1.6x/1.5x on FY17E/18E financials. We have assigned Buy rating to MFL with a target price of Rs85.
BUY
Sector: NBFC
CMP: Rs58
Target Price: Rs85
Upside: 47%
Hatim Broachwala, CFA
+91-22-3926 8068
Key Data
Current Shares O/S (mn) 841.2
Mkt Cap (Rsbn/US$mn) 48.6/729.6
52 Wk H / L (Rs) 59/20
Daily Vol. (3M NSE Avg.) 4,637,369
Shareholding (%) 4QFY16 3QFY16 2QFY16
Promoter 33.7 32.6 32.3
FII 40.4 40.0 42.9
DII 7.3 8.9 7.7
Others 18.7 18.6 17.1
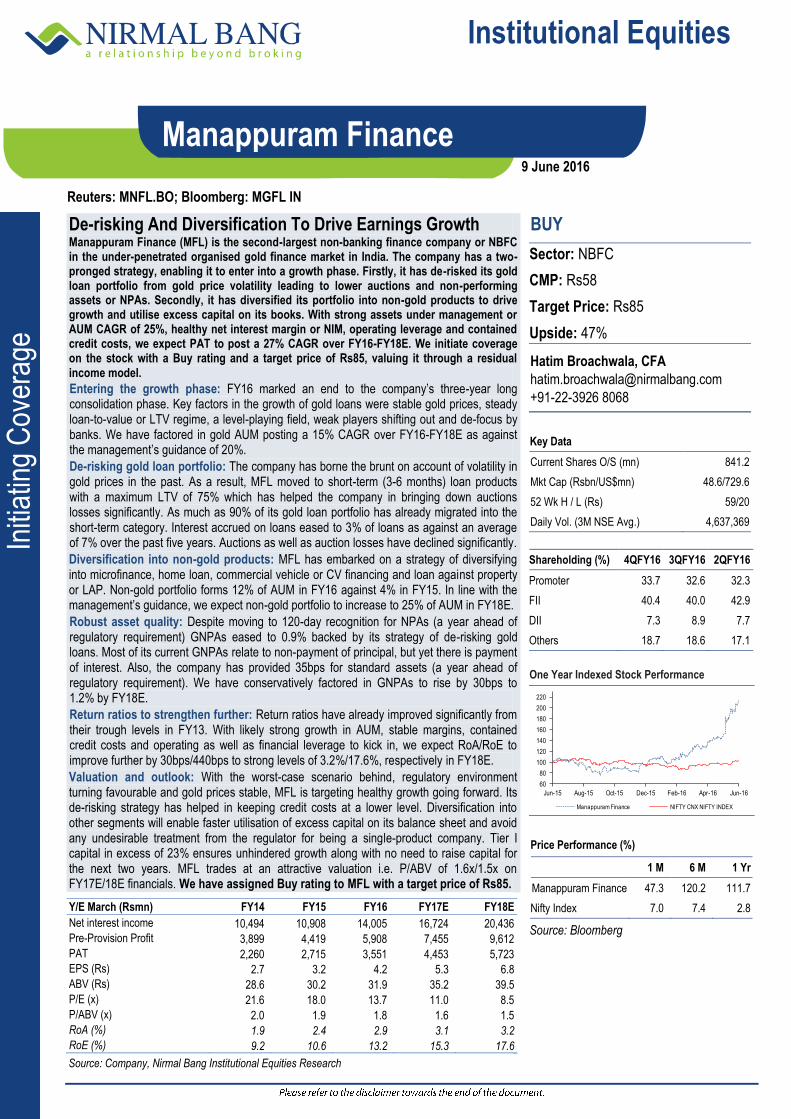
One Year Indexed Stock Performance
Price Performance (%)
1 M 6 M 1 Yr
Manappuram Finance 47.3 120.2 111.7
Nifty Index 7.0 7.4 2.8
Source: Bloomberg
Y/E March (Rsmn) FY14 FY15 FY16 FY17E FY18E
Net interest income 10,494 10,908 14,005 16,724 20,436
Pre-Provision Profit 3,899 4,419 5,908 7,455 9,612
PAT 2,260 2,715 3,551 4,453 5,723
EPS (Rs) 2.7 3.2 4.2 5.3 6.8
ABV (Rs) 28.6 30.2 31.9 35.2 39.5
P/E (x) 21.6 18.0 13.7 11.0 8.5
P/ABV (x) 2.0 1.9 1.8 1.6 1.5
RoA (%) 1.9 2.4 2.9 3.1 3.2
RoE (%) 9.2 10.6 13.2 15.3 17.6
Source: Company, Nirmal Bang Institutional Equities Research
60
80
100
120
140
160
180
200
220
Jun-15 Aug-15 Oct-15 Dec-15 Feb-16 Apr-16 Jun-16
Manappuram Finance NIFTY CNX NIFTY INDEX
9 June 2016

Institutional Equities
Manappuram Finance 2
Valuation and outlook
We expect net interest income (NII) CAGR of 21% over FY16-FY18E, tad lower than AUM growth, as we expect a marginal compression given the diversification into other segments. Operating leverage is expected to kick in as the growth in gold loans is with the same number of branches. Despite conservatively factoring in higher credit costs, we expect PAT CAGR of 27% over FY15-FY18E
We expect RoA/RoE to improve 30bps/440bps by FY18E to a healthy level of 3.2%/17.6%, respectively. It is well capitalised with a CRAR of 24% and Tier-I of 23.5%, provides the ability to grow at the desired rate without the risk of equity dilution for the next two years. MFL trades at an attractive valuation i.e. P/ABV of 1.6x FY17E earnings and 1.5x FY18E numbers. Superior return ratios along with higher growth in AUM deserves higher valuation.
We have assigned Buy rating to the stock with a target price of Rs85, valuing it through a residual income model, implying P/ABV of 2.1x FY18E numbers.
Exhibit 1: MFL better placed on RoA versus P/BV matrix
Source: Bloomberg, Nirmal Bang Institutional Equities Research
Note: MFL – Manappuram Finance, MUTH – Muthoot Finance, SKSM – SKS Microfinance, CAFL – Capital First, BAF – Bajaj Finance, SCUF – Shriram City Union Finance, MMFS – Mahindra & Mahindra Financial Services, LTFH – L&T Finance Holding
Exhibit 2: Valuation catching up with improvement in fundamentals
Source: Bloomberg, Nirmal Bang Institutional Equities Research
MFL
MUTH
SKSM
CAFL
BAF
SCUF
MMFS
LTFH
0.8
1.3
1.8
2.3
2.8
3.3
3.8
4.3
1.0 2.0 3.0 4.0 5.0 6.0
P/B
V -
FY
18
ROA - FY18
MFL MUTH SKSM CAFL BAF SCUF MMFS LTFH
(%)
-
0.5
1.0
1.5
2.0
2.5
3.0
Jun
-10
Oct
-10
Fe
b-1
1
Jun
-11
Oct
-11
Fe
b-1
2
Jun
-12
Oct
-12
Fe
b-1
3
Jun
-13
Oct
-13
Fe
b-1
4
Jun
-14
Oct
-14
Fe
b-1
5
Jun
-15
Oct
-15
Fe
b-1
6
Jun
-16
P/Adj. BVPS Mean +1 SD -1 SD
(x)
Institutional Equities
Manappuram Finance 3
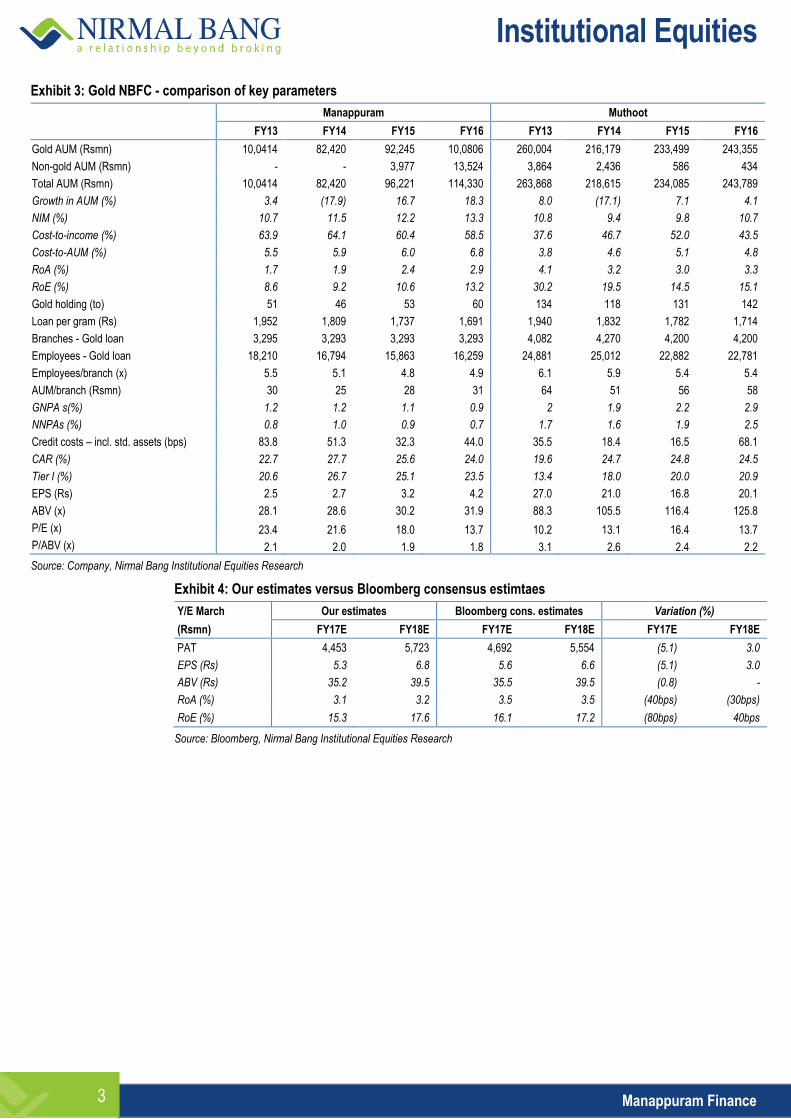
Exhibit 3: Gold NBFC - comparison of key parameters
Manappuram Muthoot
FY13 FY14 FY15 FY16 FY13 FY14 FY15 FY16
Gold AUM (Rsmn) 10,0414 82,420 92,245 10,0806 260,004 216,179 233,499 243,355
Non-gold AUM (Rsmn) - - 3,977 13,524 3,864 2,436 586 434
Total AUM (Rsmn) 10,0414 82,420 96,221 114,330 263,868 218,615 234,085 243,789
Growth in AUM (%) 3.4 (17.9) 16.7 18.3 8.0 (17.1) 7.1 4.1
NIM (%) 10.7 11.5 12.2 13.3 10.8 9.4 9.8 10.7
Cost-to-income (%) 63.9 64.1 60.4 58.5 37.6 46.7 52.0 43.5
Cost-to-AUM (%) 5.5 5.9 6.0 6.8 3.8 4.6 5.1 4.8
RoA (%) 1.7 1.9 2.4 2.9 4.1 3.2 3.0 3.3
RoE (%) 8.6 9.2 10.6 13.2 30.2 19.5 14.5 15.1
Gold holding (to) 51 46 53 60 134 118 131 142
Loan per gram (Rs) 1,952 1,809 1,737 1,691 1,940 1,832 1,782 1,714
Branches - Gold loan 3,295 3,293 3,293 3,293 4,082 4,270 4,200 4,200
Employees - Gold loan 18,210 16,794 15,863 16,259 24,881 25,012 22,882 22,781
Employees/branch (x) 5.5 5.1 4.8 4.9 6.1 5.9 5.4 5.4
AUM/branch (Rsmn) 30 25 28 31 64 51 56 58
GNPA s(%) 1.2 1.2 1.1 0.9 2 1.9 2.2 2.9
NNPAs (%) 0.8 1.0 0.9 0.7 1.7 1.6 1.9 2.5
Credit costs – incl. std. assets (bps) 83.8 51.3 32.3 44.0 35.5 18.4 16.5 68.1
CAR (%) 22.7 27.7 25.6 24.0 19.6 24.7 24.8 24.5
Tier I (%) 20.6 26.7 25.1 23.5 13.4 18.0 20.0 20.9
EPS (Rs) 2.5 2.7 3.2 4.2 27.0 21.0 16.8 20.1
ABV (x) 28.1 28.6 30.2 31.9 88.3 105.5 116.4 125.8
P/E (x) 23.4 21.6 18.0 13.7 10.2 13.1 16.4 13.7
P/ABV (x) 2.1 2.0 1.9 1.8 3.1 2.6 2.4 2.2
Source: Company, Nirmal Bang Institutional Equities Research
Exhibit 4: Our estimates versus Bloomberg consensus estimtaes
Y/E March Our estimates Bloomberg cons. estimates Variation (%)
(Rsmn) FY17E FY18E FY17E FY18E FY17E FY18E
PAT 4,453 5,723 4,692 5,554 (5.1) 3.0
EPS (Rs) 5.3 6.8 5.6 6.6 (5.1) 3.0
ABV (Rs) 35.2 39.5 35.5 39.5 (0.8) -
RoA (%) 3.1 3.2 3.5 3.5 (40bps) (30bps)
RoE (%) 15.3 17.6 16.1 17.2 (80bps) 40bps
Source: Bloomberg, Nirmal Bang Institutional Equities Research
Institutional Equities
Manappuram Finance 4
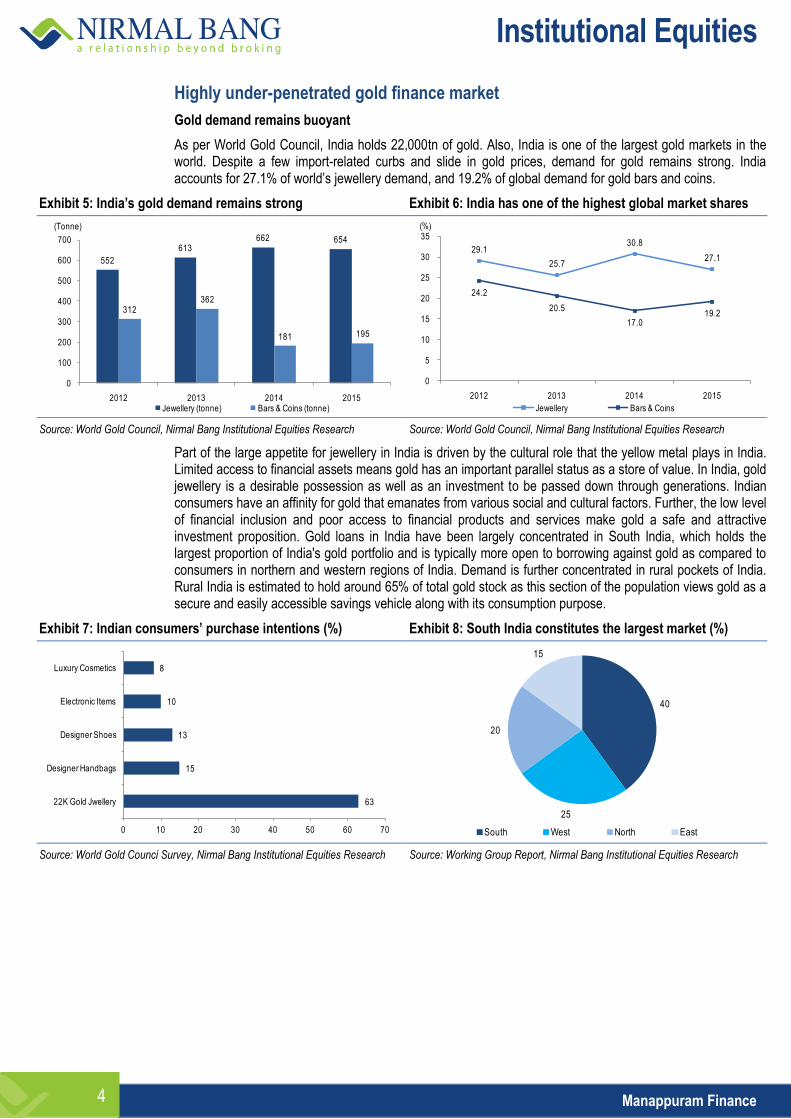
Highly under-penetrated gold finance market
Gold demand remains buoyant
As per World Gold Council, India holds 22,000tn of gold. Also, India is one of the largest gold markets in the world. Despite a few import-related curbs and slide in gold prices, demand for gold remains strong. India accounts for 27.1% of world’s jewellery demand, and 19.2% of global demand for gold bars and coins.
Exhibit 5: India’s gold demand remains strong Exhibit 6: India has one of the highest global market shares
Source: World Gold Council, Nirmal Bang Institutional Equities Research Source: World Gold Council, Nirmal Bang Institutional Equities Research
Part of the large appetite for jewellery in India is driven by the cultural role that the yellow metal plays in India. Limited access to financial assets means gold has an important parallel status as a store of value. In India, gold jewellery is a desirable possession as well as an investment to be passed down through generations. Indian consumers have an affinity for gold that emanates from various social and cultural factors. Further, the low level of financial inclusion and poor access to financial products and services make gold a safe and attractive investment proposition. Gold loans in India have been largely concentrated in South India, which holds the largest proportion of India's gold portfolio and is typically more open to borrowing against gold as compared to consumers in northern and western regions of India. Demand is further concentrated in rural pockets of India. Rural India is estimated to hold around 65% of total gold stock as this section of the population views gold as a secure and easily accessible savings vehicle along with its consumption purpose.
Exhibit 7: Indian consumers’ purchase intentions (%) Exhibit 8: South India constitutes the largest market (%)
Source: World Gold Counci Survey, Nirmal Bang Institutional Equities Research Source: Working Group Report, Nirmal Bang Institutional Equities Research
552
613662 654
312362
181 195
0
100
200
300
400
500
600
700
2012 2013 2014 2015Jewellery (tonne) Bars & Coins (tonne)
(Tonne)
29.1
25.7
30.8
27.1
24.2
20.5
17.019.2
0
5
10
15
20
25
30
35
2012 2013 2014 2015
Jewellery Bars & Coins
(%)
63
15
13
10
8
0 10 20 30 40 50 60 70
22K Gold Jwellery
Designer Handbags
Designer Shoes
Electronic Items
Luxury Cosmetics
40
25
20
15
South West North East
Institutional Equities
Manappuram Finance 5
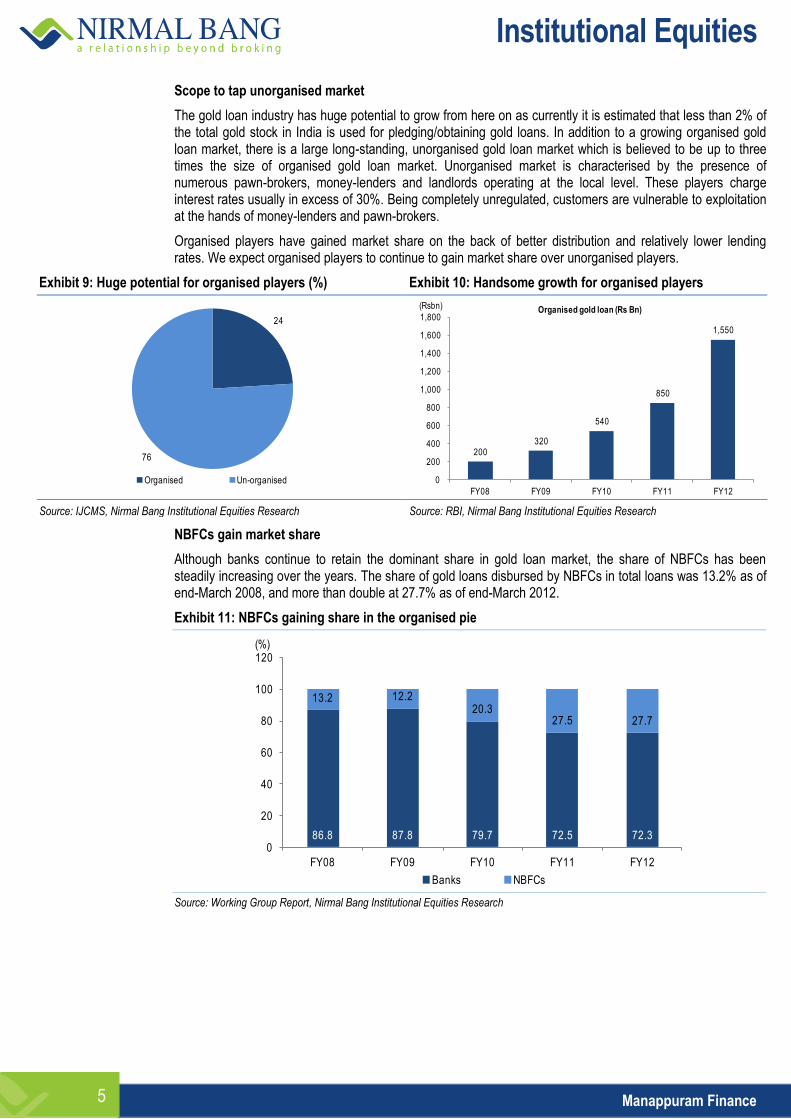
Scope to tap unorganised market
The gold loan industry has huge potential to grow from here on as currently it is estimated that less than 2% of the total gold stock in India is used for pledging/obtaining gold loans. In addition to a growing organised gold loan market, there is a large long-standing, unorganised gold loan market which is believed to be up to three times the size of organised gold loan market. Unorganised market is characterised by the presence of numerous pawn-brokers, money-lenders and landlords operating at the local level. These players charge interest rates usually in excess of 30%. Being completely unregulated, customers are vulnerable to exploitation at the hands of money-lenders and pawn-brokers.
Organised players have gained market share on the back of better distribution and relatively lower lending rates. We expect organised players to continue to gain market share over unorganised players.
Exhibit 9: Huge potential for organised players (%) Exhibit 10: Handsome growth for organised players
Source: IJCMS, Nirmal Bang Institutional Equities Research Source: RBI, Nirmal Bang Institutional Equities Research
NBFCs gain market share
Although banks continue to retain the dominant share in gold loan market, the share of NBFCs has been steadily increasing over the years. The share of gold loans disbursed by NBFCs in total loans was 13.2% as of end-March 2008, and more than double at 27.7% as of end-March 2012.
Exhibit 11: NBFCs gaining share in the organised pie
Source: Working Group Report, Nirmal Bang Institutional Equities Research
24
76
Organised Un-organised
200320
540
850
1,550
0
200
400
600
800
1,000
1,200
1,400
1,600
1,800
FY08 FY09 FY10 FY11 FY12
Organised gold loan (Rs Bn)(Rsbn)
86.8 87.8 79.7 72.5 72.3
13.2 12.220.3
27.5 27.7
0
20
40
60
80
100
120
FY08 FY09 FY10 FY11 FY12
Banks NBFCs
(%)
Institutional Equities
Manappuram Finance 6
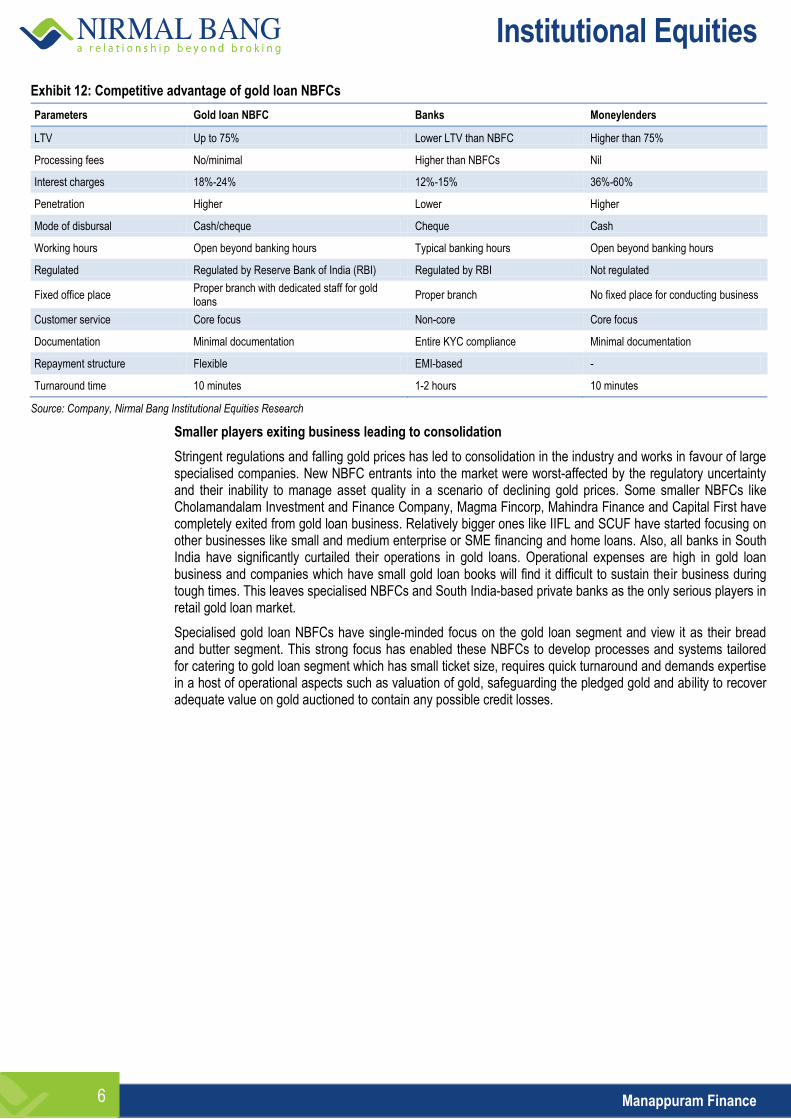
Exhibit 12: Competitive advantage of gold loan NBFCs
Parameters Gold loan NBFC Banks Moneylenders
LTV Up to 75% Lower LTV than NBFC Higher than 75%
Processing fees No/minimal Higher than NBFCs Nil
Interest charges 18%-24% 12%-15% 36%-60%
Penetration Higher Lower Higher
Mode of disbursal Cash/cheque Cheque Cash
Working hours Open beyond banking hours Typical banking hours Open beyond banking hours
Regulated Regulated by Reserve Bank of India (RBI) Regulated by RBI Not regulated
Fixed office place Proper branch with dedicated staff for gold loans
Proper branch No fixed place for conducting business
Customer service Core focus Non-core Core focus
Documentation Minimal documentation Entire KYC compliance Minimal documentation
Repayment structure Flexible EMI-based -
Turnaround time 10 minutes 1-2 hours 10 minutes
Source: Company, Nirmal Bang Institutional Equities Research
Smaller players exiting business leading to consolidation
Stringent regulations and falling gold prices has led to consolidation in the industry and works in favour of large specialised companies. New NBFC entrants into the market were worst-affected by the regulatory uncertainty and their inability to manage asset quality in a scenario of declining gold prices. Some smaller NBFCs like Cholamandalam Investment and Finance Company, Magma Fincorp, Mahindra Finance and Capital First have completely exited from gold loan business. Relatively bigger ones like IIFL and SCUF have started focusing on other businesses like small and medium enterprise or SME financing and home loans. Also, all banks in South India have significantly curtailed their operations in gold loans. Operational expenses are high in gold loan business and companies which have small gold loan books will find it difficult to sustain their business during tough times. This leaves specialised NBFCs and South India-based private banks as the only serious players in retail gold loan market.
Specialised gold loan NBFCs have single-minded focus on the gold loan segment and view it as their bread and butter segment. This strong focus has enabled these NBFCs to develop processes and systems tailored for catering to gold loan segment which has small ticket size, requires quick turnaround and demands expertise in a host of operational aspects such as valuation of gold, safeguarding the pledged gold and ability to recover adequate value on gold auctioned to contain any possible credit losses.
Institutional Equities
Manappuram Finance 7
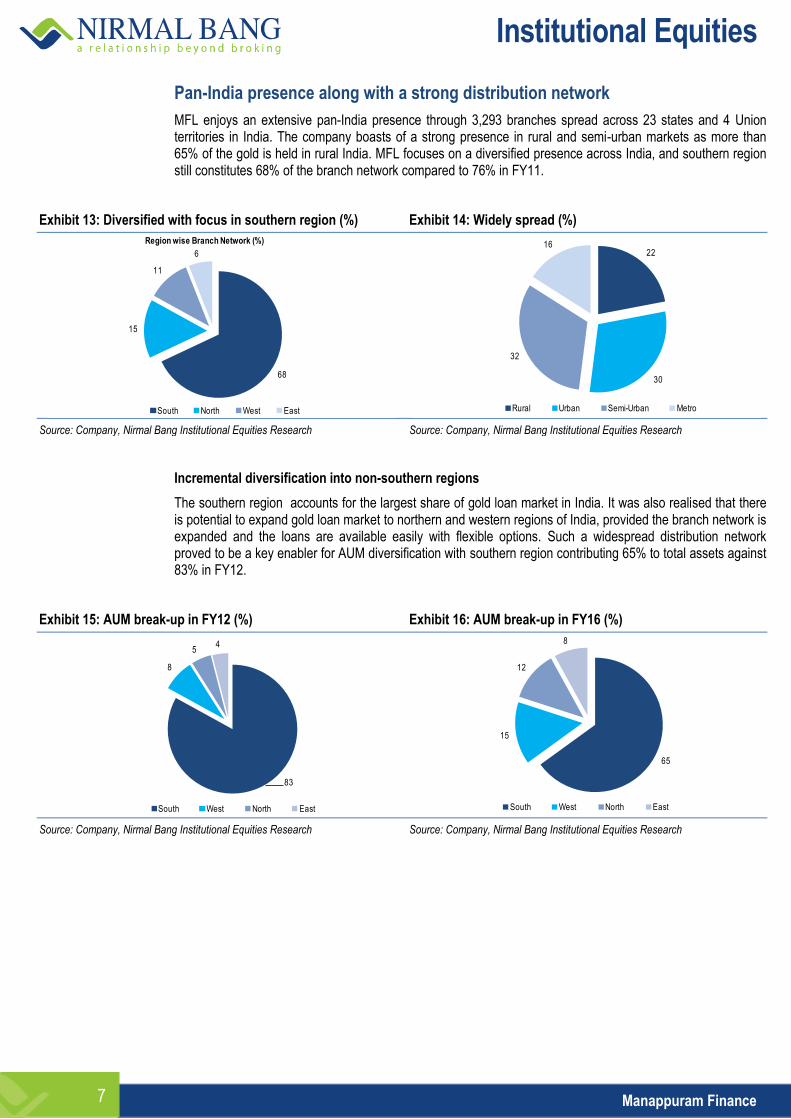
Pan-India presence along with a strong distribution network
MFL enjoys an extensive pan-India presence through 3,293 branches spread across 23 states and 4 Union territories in India. The company boasts of a strong presence in rural and semi-urban markets as more than 65% of the gold is held in rural India. MFL focuses on a diversified presence across India, and southern region still constitutes 68% of the branch network compared to 76% in FY11.
Exhibit 13: Diversified with focus in southern region (%) Exhibit 14: Widely spread (%)
Source: Company, Nirmal Bang Institutional Equities Research Source: Company, Nirmal Bang Institutional Equities Research
Incremental diversification into non-southern regions
The southern region accounts for the largest share of gold loan market in India. It was also realised that there is potential to expand gold loan market to northern and western regions of India, provided the branch network is expanded and the loans are available easily with flexible options. Such a widespread distribution network proved to be a key enabler for AUM diversification with southern region contributing 65% to total assets against 83% in FY12.
Exhibit 15: AUM break-up in FY12 (%) Exhibit 16: AUM break-up in FY16 (%)
Source: Company, Nirmal Bang Institutional Equities Research Source: Company, Nirmal Bang Institutional Equities Research
68
15
11
6
Region wise Branch Network (%)
South North West East
22
30
32
16
Rural Urban Semi-Urban Metro
83
8
54
South West North East
65
15
12
8
South West North East
Institutional Equities
Manappuram Finance 8
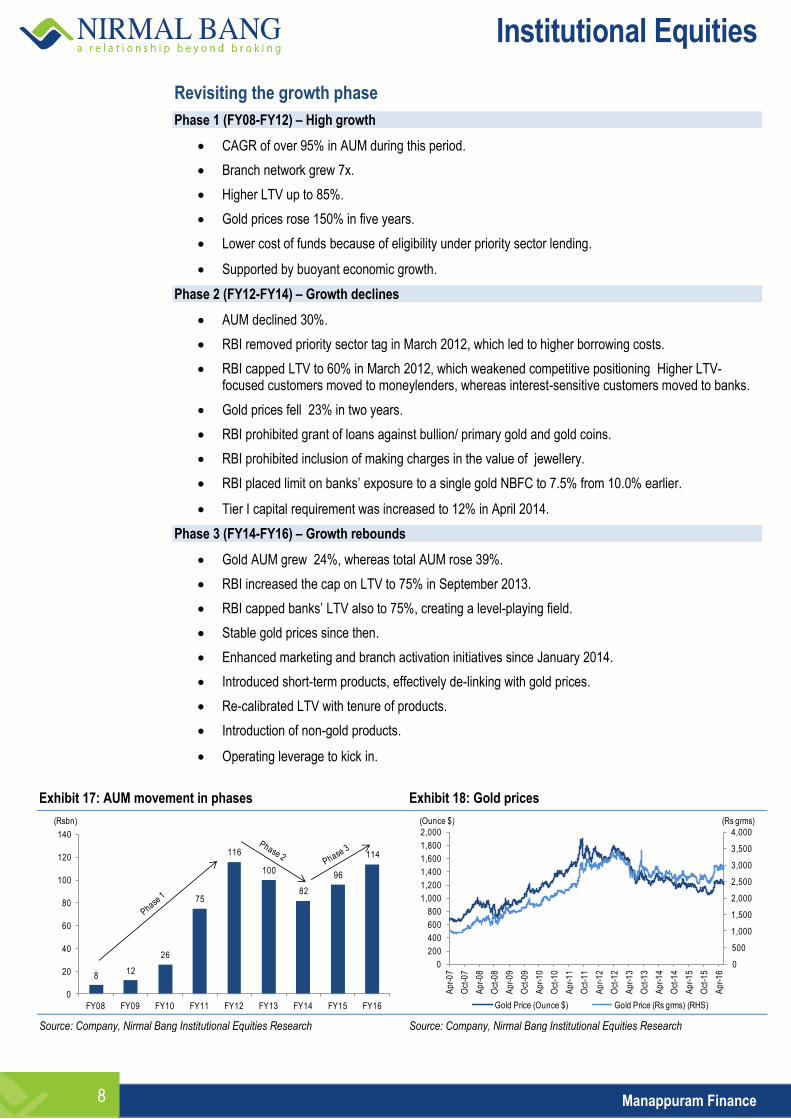
Revisiting the growth phase
Phase 1 (FY08-FY12) – High growth
CAGR of over 95% in AUM during this period.
Branch network grew 7x.
Higher LTV up to 85%.
Gold prices rose 150% in five years.
Lower cost of funds because of eligibility under priority sector lending.
Supported by buoyant economic growth.
Phase 2 (FY12-FY14) – Growth declines
AUM declined 30%.
RBI removed priority sector tag in March 2012, which led to higher borrowing costs.
RBI capped LTV to 60% in March 2012, which weakened competitive positioning Higher LTV-focused customers moved to moneylenders, whereas interest-sensitive customers moved to banks.
Gold prices fell 23% in two years.
RBI prohibited grant of loans against bullion/ primary gold and gold coins.
RBI prohibited inclusion of making charges in the value of jewellery.
RBI placed limit on banks’ exposure to a single gold NBFC to 7.5% from 10.0% earlier.
Tier I capital requirement was increased to 12% in April 2014.
Phase 3 (FY14-FY16) – Growth rebounds
Gold AUM grew 24%, whereas total AUM rose 39%.
RBI increased the cap on LTV to 75% in September 2013.
RBI capped banks’ LTV also to 75%, creating a level-playing field.
Stable gold prices since then.
Enhanced marketing and branch activation initiatives since January 2014.
Introduced short-term products, effectively de-linking with gold prices.
Re-calibrated LTV with tenure of products.
Introduction of non-gold products.
Operating leverage to kick in.
Exhibit 17: AUM movement in phases Exhibit 18: Gold prices
Source: Company, Nirmal Bang Institutional Equities Research Source: Company, Nirmal Bang Institutional Equities Research
812
26
75
116
100
82
96
114
0
20
40
60
80
100
120
140
FY08 FY09 FY10 FY11 FY12 FY13 FY14 FY15 FY16
(Rsbn)
0
500
1,000
1,500
2,000
2,500
3,000
3,500
4,000
0
200
400
600
800
1,000
1,200
1,400
1,600
1,800
2,000
Ap
r-0
7
Oct
-07
Ap
r-0
8
Oct
-08
Ap
r-0
9
Oct
-09
Ap
r-1
0
Oct
-10
Ap
r-1
1
Oct
-11
Ap
r-1
2
Oct
-12
Ap
r-1
3
Oct
-13
Ap
r-1
4
Oct
-14
Ap
r-1
5
Oct
-15
Ap
r-1
6
Gold Price (Ounce $) Gold Price (Rs grms) (RHS)
(Rs grms)(Ounce $)

Institutional Equities
Manappuram Finance 9
AUM posted a CAGR of 25% with kicker from non-gold portfolio
AUM posted a CAGR of 95% over FY08-FY12 backed by rising branch network, higher gold prices and higher LTV. After this, on account of several regulatory restrictions coupled with decline in gold prices, AUM declined 30% over FY12-FY14. Post FY14 with easing regulations creating a level-playing field with banks and stabilisation of gold prices, gold loan portfolio rebounded, posting a 24% growth over FY14-FY16.
Also, the management embarked on a strategy of diversifying into microfinance, home loan, commercial vehicle or CV financing and LAP loans. The key segment contributing to overall growth is microfinance which grew 240% in FY16 and now accounts for 12% of overall AUM against only 4% in FY15.
Overall AUM posted a 18% CAGR in FY14-FY16. With expected CAGR of 15% in gold loans and higher proportion of fast-growing non-gold portfolio, we expect overall AUM CAGR of 25% over FY16-FY18E.
Exhibit 19: Healthy AUM growth Exhibit 20: Number of customers on the rise
Source: Company, Nirmal Bang Institutional Equities Research Source: Company, Nirmal Bang Institutional Equities Research
Despite fall in ticket size, gold loan portfolio rebounded
Even after easing of regulations on LTV and the rise in gold prices, the management was very careful in increasing loan ticket size. Despite this, its gold loan portfolio grew 24% over FY14.
Gold prices have continued to strengthen. Incremental lending is happening at ~Rs2,100 per gram, whereas its current gold loan book is at Rs1,691 per gram. As a result, ticket size is bound to increase and it will support healthy growth in gold loan portfolio. The company has introduced online gold loans for the first time in India, whereby customers have to deposit gold in MFL lockers and can avail a gold loan any time and any where in the world. This initiative should help in revival of gold loan portfolio.
Exhibit 21: Ticket size set to increase Exhibit 22: Gold holdings rebounded sharply
Source: Company, Nirmal Bang Institutional Equities Research Source: Company, Nirmal Bang Institutional Equities Research
116 100 82 96 114 141 177
54.7
3.4
(17.9)
16.7 18.3 23.6
26.0
(30)
(20)
(10)
0
10
20
30
40
50
60
0
20
40
60
80
100
120
140
160
180
200
FY12 FY13 FY14 FY15 FY16 FY17E FY18E
Total AUM (Rsbn) AUM Growth (%) (RHS)
(%)(Rsbn)
0.5
1.2
1.6 1.5 1.5
1.8 1.9
0.5
1.2
1.61.5 1.5
1.8
2.6
0.0
0.5
1.0
1.5
2.0
2.5
3.0
FY10 FY11 FY12 FY13 FY14 FY15 FY16
No of Customers - Gold No of Customers - Total
(mn)
38,582 37,462
31,681 30,44632,463
1,759
1,933
1,790
1,737
1,691
1,550
1,600
1,650
1,700
1,750
1,800
1,850
1,900
1,950
2,000
0
5,000
10,000
15,000
20,000
25,000
30,000
35,000
40,000
45,000
FY12 FY13 FY14 FY15 FY16
Ticket Size Loan per gram (RHS)
(Rs)(Rs)66
51
46
53
60
0
10
20
30
40
50
60
70
FY12 FY13 FY14 FY15 FY16
Gold Holding
(Tonnes)
Institutional Equities
Manappuram Finance 10
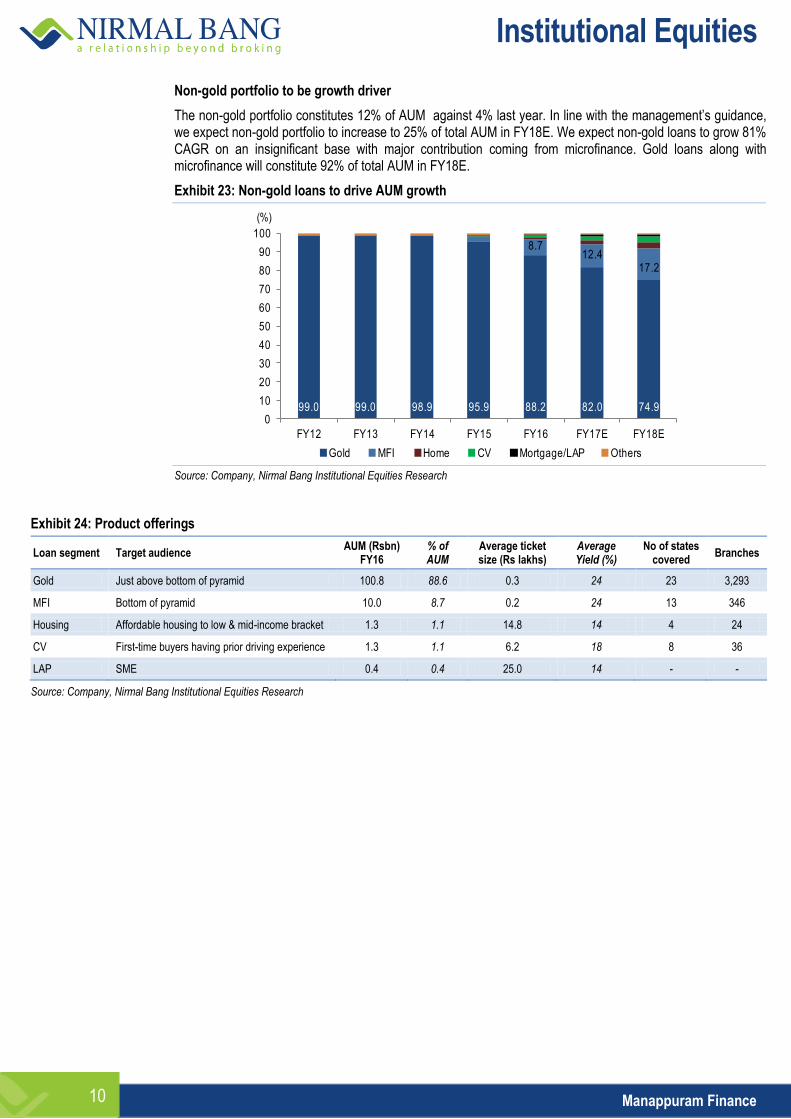
Non-gold portfolio to be growth driver
The non-gold portfolio constitutes 12% of AUM against 4% last year. In line with the management’s guidance, we expect non-gold portfolio to increase to 25% of total AUM in FY18E. We expect non-gold loans to grow 81% CAGR on an insignificant base with major contribution coming from microfinance. Gold loans along with microfinance will constitute 92% of total AUM in FY18E.
Exhibit 23: Non-gold loans to drive AUM growth
Source: Company, Nirmal Bang Institutional Equities Research
Exhibit 24: Product offerings
Loan segment Target audience AUM (Rsbn)
FY16 % of AUM
Average ticket size (Rs lakhs)
Average Yield (%)
No of states covered
Branches
Gold Just above bottom of pyramid 100.8 88.6 0.3 24 23 3,293
MFI Bottom of pyramid 10.0 8.7 0.2 24 13 346
Housing Affordable housing to low & mid-income bracket 1.3 1.1 14.8 14 4 24
CV First-time buyers having prior driving experience 1.3 1.1 6.2 18 8 36
LAP SME 0.4 0.4 25.0 14 - -
Source: Company, Nirmal Bang Institutional Equities Research
99.0 99.0 98.9 95.9 88.2 82.0 74.9
8.712.4
17.2
0
10
20
30
40
50
60
70
80
90
100
FY12 FY13 FY14 FY15 FY16 FY17E FY18E
Gold MFI Home CV Mortgage/LAP Others
(%)
Institutional Equities
Manappuram Finance 11
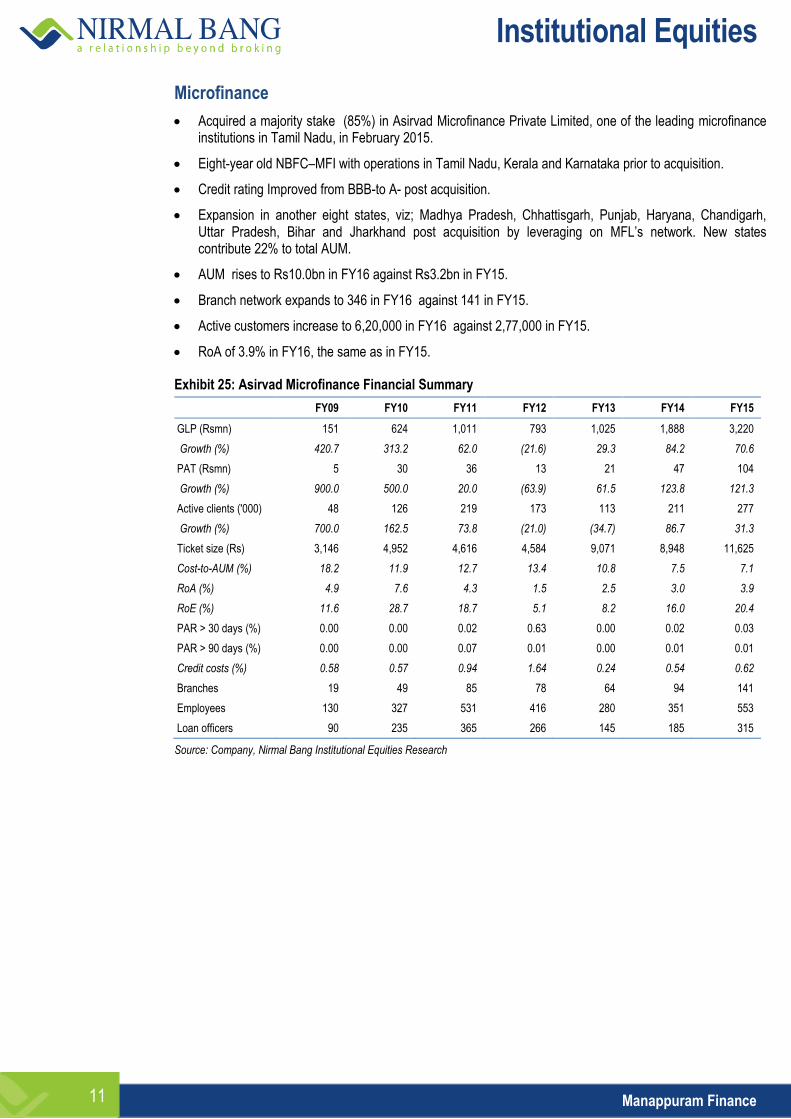
Microfinance
Acquired a majority stake (85%) in Asirvad Microfinance Private Limited, one of the leading microfinance institutions in Tamil Nadu, in February 2015.
Eight-year old NBFC–MFI with operations in Tamil Nadu, Kerala and Karnataka prior to acquisition.
Credit rating Improved from BBB-to A- post acquisition.
Expansion in another eight states, viz; Madhya Pradesh, Chhattisgarh, Punjab, Haryana, Chandigarh, Uttar Pradesh, Bihar and Jharkhand post acquisition by leveraging on MFL’s network. New states contribute 22% to total AUM.
AUM rises to Rs10.0bn in FY16 against Rs3.2bn in FY15.
Branch network expands to 346 in FY16 against 141 in FY15.
Active customers increase to 6,20,000 in FY16 against 2,77,000 in FY15.
RoA of 3.9% in FY16, the same as in FY15.
Exhibit 25: Asirvad Microfinance Financial Summary
FY09 FY10 FY11 FY12 FY13 FY14 FY15
GLP (Rsmn) 151 624 1,011 793 1,025 1,888 3,220
Growth (%) 420.7 313.2 62.0 (21.6) 29.3 84.2 70.6
PAT (Rsmn) 5 30 36 13 21 47 104
Growth (%) 900.0 500.0 20.0 (63.9) 61.5 123.8 121.3
Active clients ('000) 48 126 219 173 113 211 277
Growth (%) 700.0 162.5 73.8 (21.0) (34.7) 86.7 31.3
Ticket size (Rs) 3,146 4,952 4,616 4,584 9,071 8,948 11,625
Cost-to-AUM (%) 18.2 11.9 12.7 13.4 10.8 7.5 7.1
RoA (%) 4.9 7.6 4.3 1.5 2.5 3.0 3.9
RoE (%) 11.6 28.7 18.7 5.1 8.2 16.0 20.4
PAR > 30 days (%) 0.00 0.00 0.02 0.63 0.00 0.02 0.03
PAR > 90 days (%) 0.00 0.00 0.07 0.01 0.00 0.01 0.01
Credit costs (%) 0.58 0.57 0.94 1.64 0.24 0.54 0.62
Branches 19 49 85 78 64 94 141
Employees 130 327 531 416 280 351 553
Loan officers 90 235 365 266 145 185 315
Source: Company, Nirmal Bang Institutional Equities Research
Institutional Equities
Manappuram Finance 12
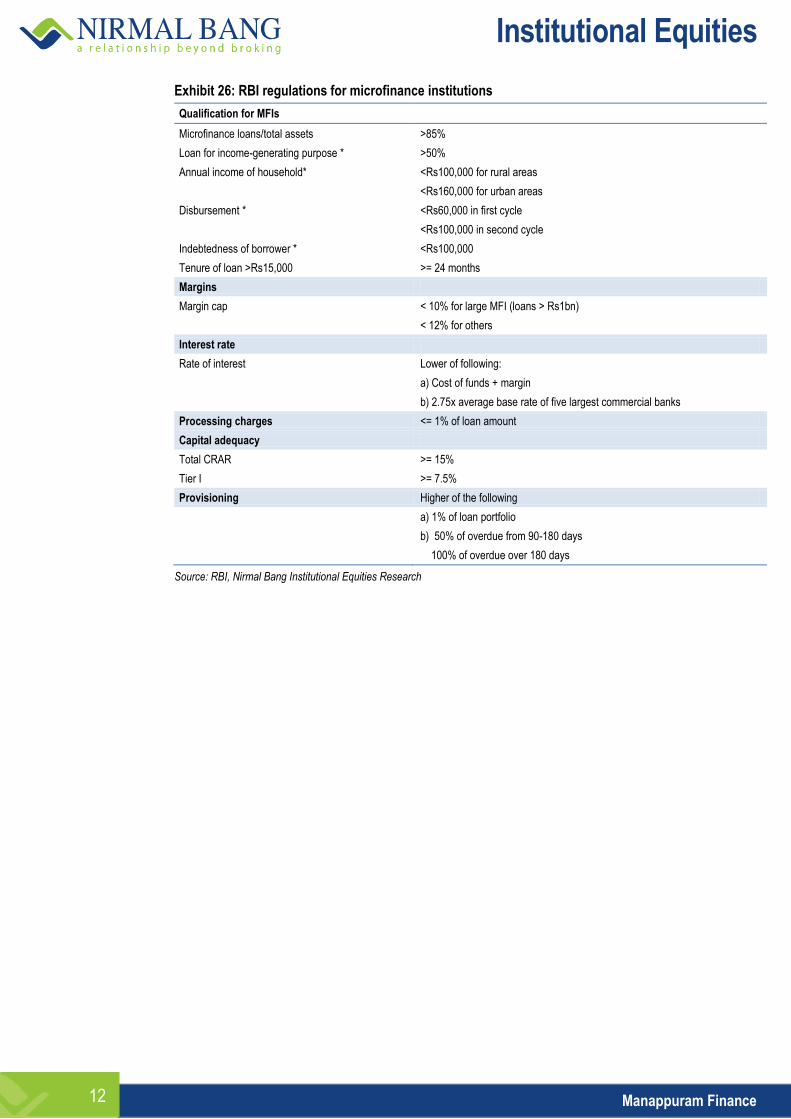
Exhibit 26: RBI regulations for microfinance institutions
Qualification for MFIs
Microfinance loans/total assets >85%
Loan for income-generating purpose * >50%
Annual income of household* <Rs100,000 for rural areas
<Rs160,000 for urban areas
Disbursement * <Rs60,000 in first cycle
<Rs100,000 in second cycle
Indebtedness of borrower * <Rs100,000
Tenure of loan >Rs15,000 >= 24 months
Margins
Margin cap < 10% for large MFI (loans > Rs1bn)
< 12% for others
Interest rate
Rate of interest Lower of following:
a) Cost of funds + margin
b) 2.75x average base rate of five largest commercial banks
Processing charges <= 1% of loan amount
Capital adequacy
Total CRAR >= 15%
Tier I >= 7.5%
Provisioning Higher of the following
a) 1% of loan portfolio
b) 50% of overdue from 90-180 days
100% of overdue over 180 days
Source: RBI, Nirmal Bang Institutional Equities Research
Institutional Equities
Manappuram Finance 13
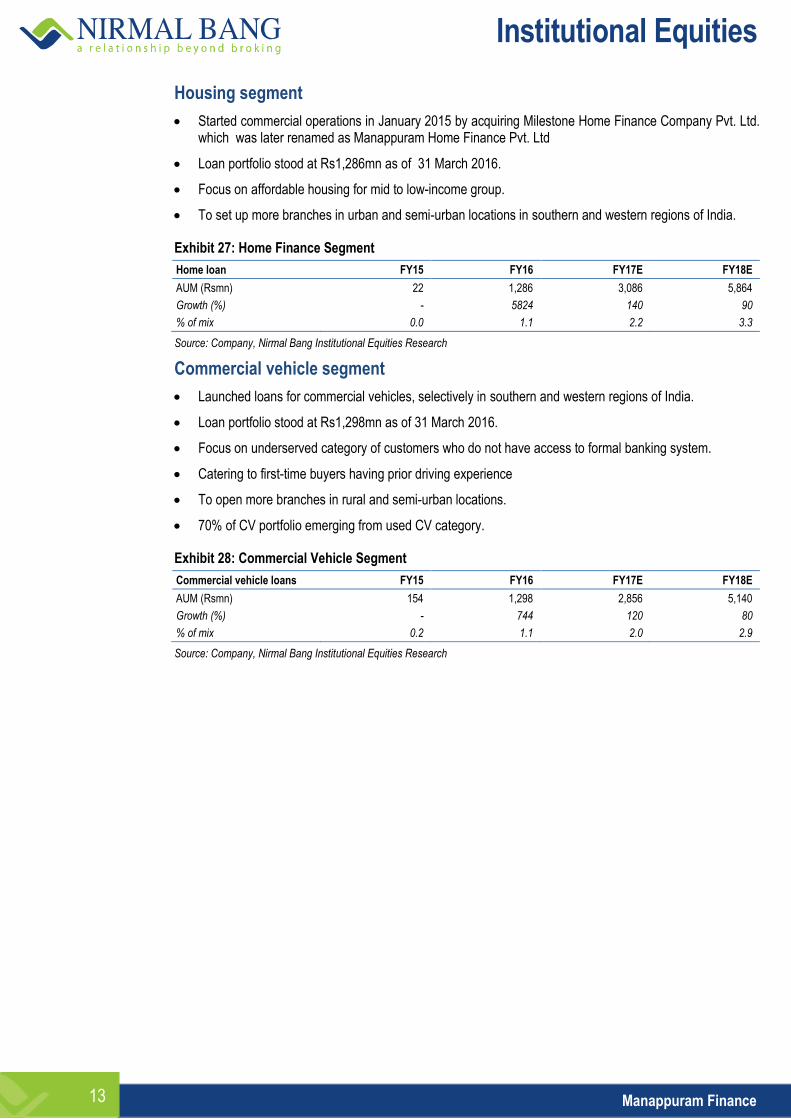
Housing segment
Started commercial operations in January 2015 by acquiring Milestone Home Finance Company Pvt. Ltd. which was later renamed as Manappuram Home Finance Pvt. Ltd
Loan portfolio stood at Rs1,286mn as of 31 March 2016.
Focus on affordable housing for mid to low-income group.
To set up more branches in urban and semi-urban locations in southern and western regions of India.
Exhibit 27: Home Finance Segment
Home loan FY15 FY16 FY17E FY18E
AUM (Rsmn) 22 1,286 3,086 5,864
Growth (%) - 5824 140 90
% of mix 0.0 1.1 2.2 3.3
Source: Company, Nirmal Bang Institutional Equities Research
Commercial vehicle segment
Launched loans for commercial vehicles, selectively in southern and western regions of India.
Loan portfolio stood at Rs1,298mn as of 31 March 2016.
Focus on underserved category of customers who do not have access to formal banking system.
Catering to first-time buyers having prior driving experience
To open more branches in rural and semi-urban locations.
70% of CV portfolio emerging from used CV category.
Exhibit 28: Commercial Vehicle Segment
Commercial vehicle loans FY15 FY16 FY17E FY18E
AUM (Rsmn) 154 1,298 2,856 5,140
Growth (%) - 744 120 80
% of mix 0.2 1.1 2.0 2.9
Source: Company, Nirmal Bang Institutional Equities Research
Institutional Equities
Manappuram Finance 14
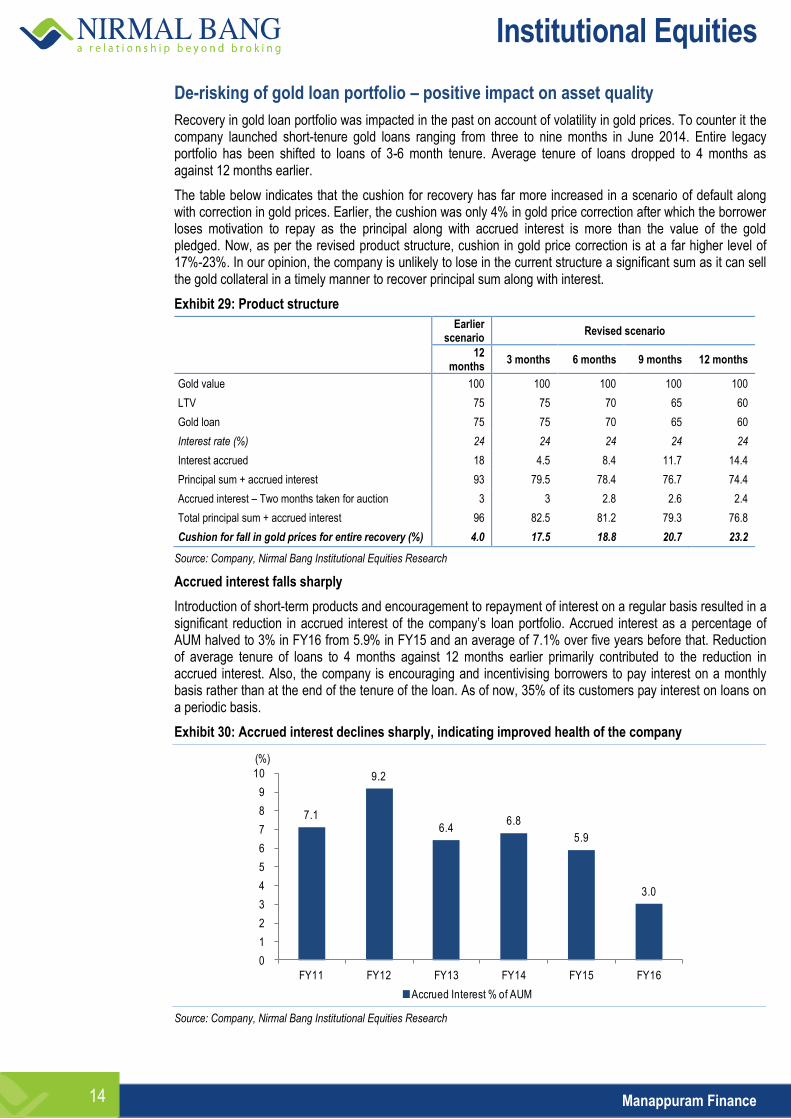
De-risking of gold loan portfolio – positive impact on asset quality
Recovery in gold loan portfolio was impacted in the past on account of volatility in gold prices. To counter it the company launched short-tenure gold loans ranging from three to nine months in June 2014. Entire legacy portfolio has been shifted to loans of 3-6 month tenure. Average tenure of loans dropped to 4 months as against 12 months earlier.
The table below indicates that the cushion for recovery has far more increased in a scenario of default along with correction in gold prices. Earlier, the cushion was only 4% in gold price correction after which the borrower loses motivation to repay as the principal along with accrued interest is more than the value of the gold pledged. Now, as per the revised product structure, cushion in gold price correction is at a far higher level of 17%-23%. In our opinion, the company is unlikely to lose in the current structure a significant sum as it can sell the gold collateral in a timely manner to recover principal sum along with interest.
Exhibit 29: Product structure
Earlier
scenario Revised scenario
12
months 3 months 6 months 9 months 12 months
Gold value 100 100 100 100 100
LTV 75 75 70 65 60
Gold loan 75 75 70 65 60
Interest rate (%) 24 24 24 24 24
Interest accrued 18 4.5 8.4 11.7 14.4
Principal sum + accrued interest 93 79.5 78.4 76.7 74.4
Accrued interest – Two months taken for auction 3 3 2.8 2.6 2.4
Total principal sum + accrued interest 96 82.5 81.2 79.3 76.8
Cushion for fall in gold prices for entire recovery (%) 4.0 17.5 18.8 20.7 23.2
Source: Company, Nirmal Bang Institutional Equities Research
Accrued interest falls sharply
Introduction of short-term products and encouragement to repayment of interest on a regular basis resulted in a significant reduction in accrued interest of the company’s loan portfolio. Accrued interest as a percentage of AUM halved to 3% in FY16 from 5.9% in FY15 and an average of 7.1% over five years before that. Reduction of average tenure of loans to 4 months against 12 months earlier primarily contributed to the reduction in accrued interest. Also, the company is encouraging and incentivising borrowers to pay interest on a monthly basis rather than at the end of the tenure of the loan. As of now, 35% of its customers pay interest on loans on a periodic basis.
Exhibit 30: Accrued interest declines sharply, indicating improved health of the company
Source: Company, Nirmal Bang Institutional Equities Research
7.1
9.2
6.4 6.8
5.9
3.0
0
1
2
3
4
5
6
7
8
9
10
FY11 FY12 FY13 FY14 FY15 FY16
Accrued Interest % of AUM
(%)
Institutional Equities
Manappuram Finance 15
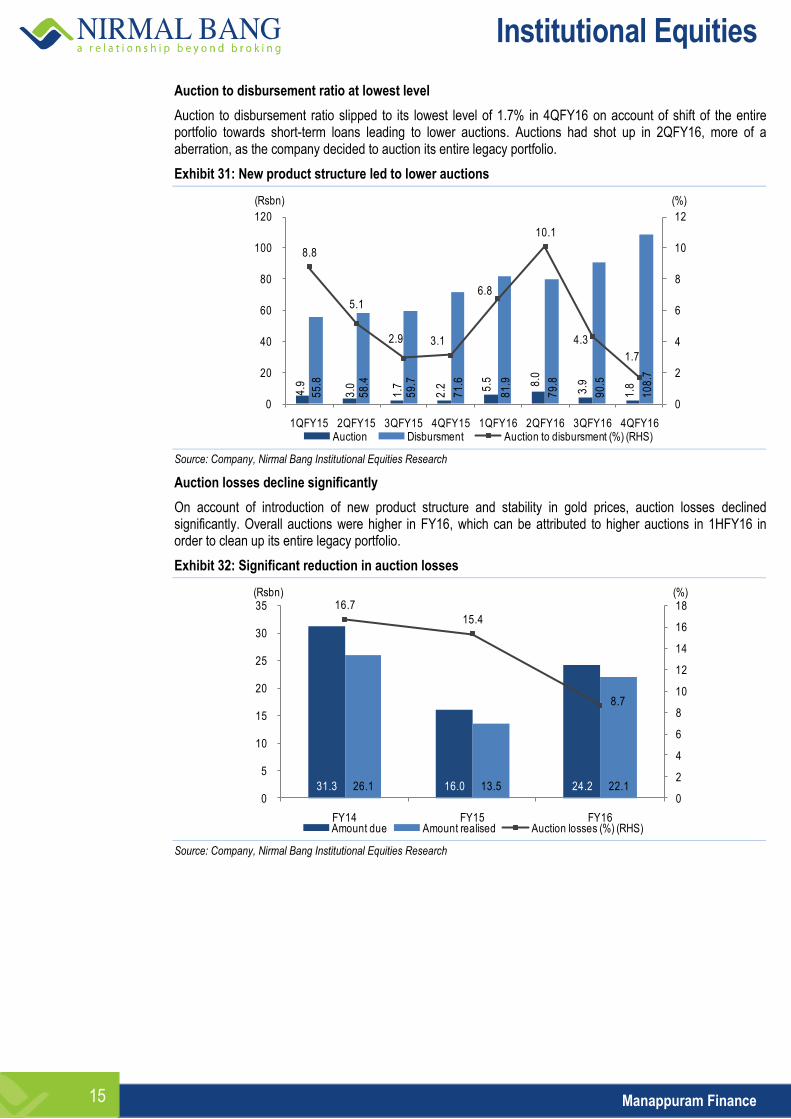
Auction to disbursement ratio at lowest level
Auction to disbursement ratio slipped to its lowest level of 1.7% in 4QFY16 on account of shift of the entire portfolio towards short-term loans leading to lower auctions. Auctions had shot up in 2QFY16, more of a aberration, as the company decided to auction its entire legacy portfolio.
Exhibit 31: New product structure led to lower auctions
Source: Company, Nirmal Bang Institutional Equities Research
Auction losses decline significantly
On account of introduction of new product structure and stability in gold prices, auction losses declined significantly. Overall auctions were higher in FY16, which can be attributed to higher auctions in 1HFY16 in order to clean up its entire legacy portfolio.
Exhibit 32: Significant reduction in auction losses
Source: Company, Nirmal Bang Institutional Equities Research
4.9
3.0
1.7
2.2
5.5
8.0
3.9
1.8
55
.8
58
.4
59
.7
71
.6
81
.9
79
.8
90
.5
10
8.7
8.8
5.1
2.9 3.1
6.8
10.1
4.3
1.7
0
2
4
6
8
10
12
0
20
40
60
80
100
120
1QFY15 2QFY15 3QFY15 4QFY15 1QFY16 2QFY16 3QFY16 4QFY16Auction Disbursment Auction to disbursment (%) (RHS)
(%)(Rsbn)
31.3 16.0 24.2 26.1 13.5 22.1
16.7
15.4
8.7
0
2
4
6
8
10
12
14
16
18
0
5
10
15
20
25
30
35
FY14 FY15 FY16Amount due Amount realised Auction losses (%) (RHS)
(%)(Rsbn)

Institutional Equities
Manappuram Finance 16
Loan duration is on the decline
With the introduction of a new product structure, average loan duration declined sharply. Lower duration does provide us higher comfort as faster churning leads to lower risk of loan delinquency.
Exhibit 33: Loan duration on the decline
Source: Company, Nirmal Bang Institutional Equities Research
Stress test analysis of gold prices
We have done stress testing of gold prices for the past 30 years. We have tried to capture gold price correction in an interval of three months as that is the primary lending bucket for the company currently. We got only four instances of gold price correcting by 15% over a three- month period. This indicates that the probability of loss in the company’s new product structure is quite minimal
Exhibit 34: Maximum fall in gold price in three-month period over the past 30 years
Source: Company, Nirmal Bang Institutional Equities Research
3.7
5.9
4.9 5.0
3.8
0
1
2
3
4
5
6
7
FY12 FY13 FY14 FY15 FY16
Loan Duration (months)
(Months)
(18.2) (23.7) (21.3) (15.8)
(25)
(20)
(15)
(10)
(5)
0
Apr 13 Jun 13 Oct 08 Jan 98(%)
Institutional Equities
Manappuram Finance 17
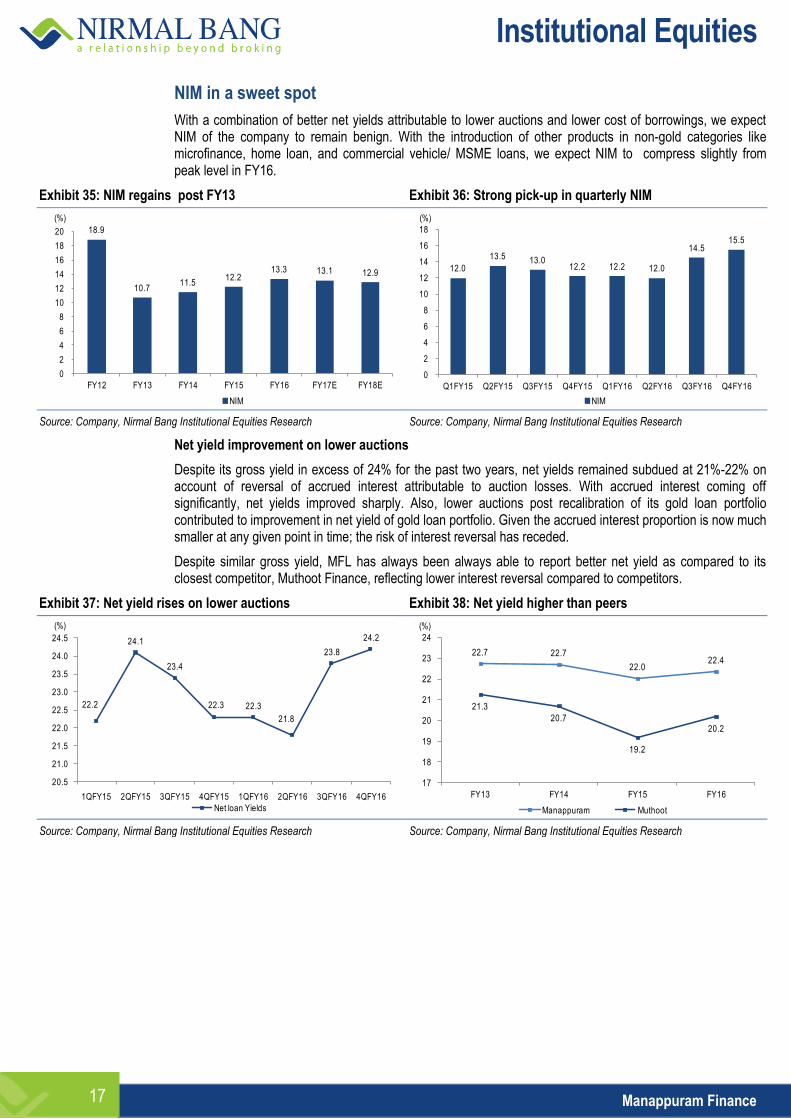
NIM in a sweet spot
With a combination of better net yields attributable to lower auctions and lower cost of borrowings, we expect NIM of the company to remain benign. With the introduction of other products in non-gold categories like microfinance, home loan, and commercial vehicle/ MSME loans, we expect NIM to compress slightly from peak level in FY16.
Exhibit 35: NIM regains post FY13 Exhibit 36: Strong pick-up in quarterly NIM
Source: Company, Nirmal Bang Institutional Equities Research Source: Company, Nirmal Bang Institutional Equities Research
Net yield improvement on lower auctions
Despite its gross yield in excess of 24% for the past two years, net yields remained subdued at 21%-22% on account of reversal of accrued interest attributable to auction losses. With accrued interest coming off significantly, net yields improved sharply. Also, lower auctions post recalibration of its gold loan portfolio contributed to improvement in net yield of gold loan portfolio. Given the accrued interest proportion is now much smaller at any given point in time; the risk of interest reversal has receded.
Despite similar gross yield, MFL has always been always able to report better net yield as compared to its closest competitor, Muthoot Finance, reflecting lower interest reversal compared to competitors.
Exhibit 37: Net yield rises on lower auctions Exhibit 38: Net yield higher than peers
Source: Company, Nirmal Bang Institutional Equities Research Source: Company, Nirmal Bang Institutional Equities Research
18.9
10.7 11.5
12.2 13.3 13.1 12.9
0
2
4
6
8
10
12
14
16
18
20
FY12 FY13 FY14 FY15 FY16 FY17E FY18E
NIM
(%)
12.0
13.5 13.0 12.2 12.2 12.0
14.5 15.5
0
2
4
6
8
10
12
14
16
18
Q1FY15 Q2FY15 Q3FY15 Q4FY15 Q1FY16 Q2FY16 Q3FY16 Q4FY16
NIM
(%)
22.2
24.1
23.4
22.3 22.3
21.8
23.8
24.2
20.5
21.0
21.5
22.0
22.5
23.0
23.5
24.0
24.5
1QFY15 2QFY15 3QFY15 4QFY15 1QFY16 2QFY16 3QFY16 4QFY16
Net loan Yields
(%)
22.7 22.7
22.0 22.4
21.3
20.7
19.2
20.2
17
18
19
20
21
22
23
24
FY13 FY14 FY15 FY16
Manappuram Muthoot
(%)
Institutional Equities
Manappuram Finance 18
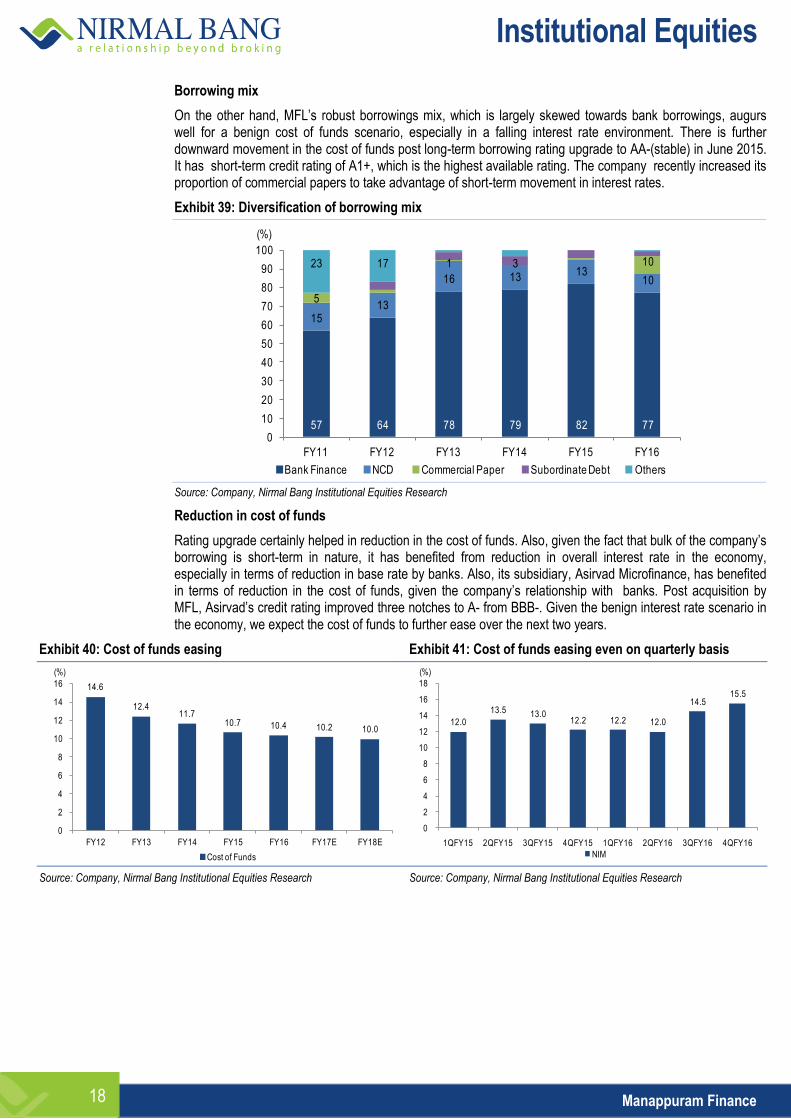
Borrowing mix
On the other hand, MFL’s robust borrowings mix, which is largely skewed towards bank borrowings, augurs well for a benign cost of funds scenario, especially in a falling interest rate environment. There is further downward movement in the cost of funds post long-term borrowing rating upgrade to AA-(stable) in June 2015. It has short-term credit rating of A1+, which is the highest available rating. The company recently increased its proportion of commercial papers to take advantage of short-term movement in interest rates.
Exhibit 39: Diversification of borrowing mix
Source: Company, Nirmal Bang Institutional Equities Research
Reduction in cost of funds
Rating upgrade certainly helped in reduction in the cost of funds. Also, given the fact that bulk of the company’s borrowing is short-term in nature, it has benefited from reduction in overall interest rate in the economy, especially in terms of reduction in base rate by banks. Also, its subsidiary, Asirvad Microfinance, has benefited in terms of reduction in the cost of funds, given the company’s relationship with banks. Post acquisition by MFL, Asirvad’s credit rating improved three notches to A- from BBB-. Given the benign interest rate scenario in the economy, we expect the cost of funds to further ease over the next two years.
Exhibit 40: Cost of funds easing Exhibit 41: Cost of funds easing even on quarterly basis
Source: Company, Nirmal Bang Institutional Equities Research Source: Company, Nirmal Bang Institutional Equities Research
57 64 78 79 82 77
1513
16 1313
10
5
1023 17 1 3
0
10
20
30
40
50
60
70
80
90
100
FY11 FY12 FY13 FY14 FY15 FY16
Bank Finance NCD Commercial Paper Subordinate Debt Others
(%)
14.6
12.4 11.7
10.7 10.4 10.2 10.0
0
2
4
6
8
10
12
14
16
FY12 FY13 FY14 FY15 FY16 FY17E FY18E
Cost of Funds
(%)
12.0
13.5 13.0 12.2 12.2 12.0
14.5 15.5
0
2
4
6
8
10
12
14
16
18
1QFY15 2QFY15 3QFY15 4QFY15 1QFY16 2QFY16 3QFY16 4QFY16
NIM
(%)
Institutional Equities
Manappuram Finance 19
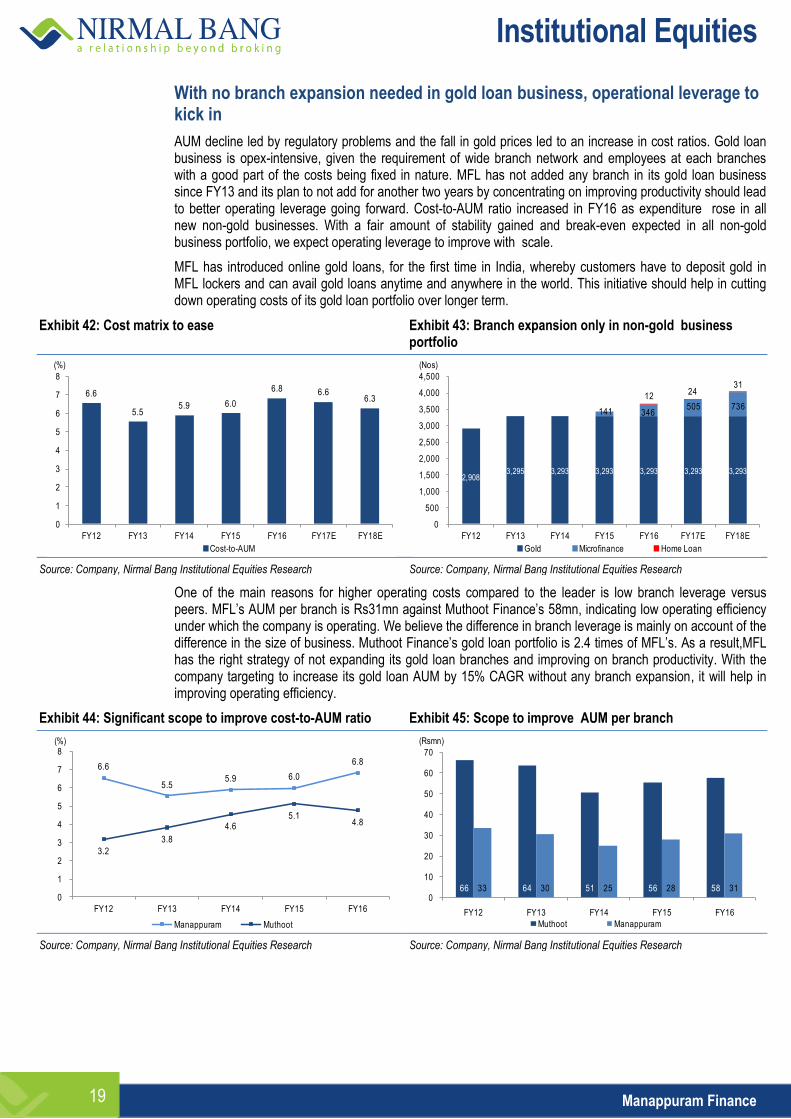
With no branch expansion needed in gold loan business, operational leverage to kick in
AUM decline led by regulatory problems and the fall in gold prices led to an increase in cost ratios. Gold loan business is opex-intensive, given the requirement of wide branch network and employees at each branches with a good part of the costs being fixed in nature. MFL has not added any branch in its gold loan business since FY13 and its plan to not add for another two years by concentrating on improving productivity should lead to better operating leverage going forward. Cost-to-AUM ratio increased in FY16 as expenditure rose in all new non-gold businesses. With a fair amount of stability gained and break-even expected in all non-gold business portfolio, we expect operating leverage to improve with scale.
MFL has introduced online gold loans, for the first time in India, whereby customers have to deposit gold in MFL lockers and can avail gold loans anytime and anywhere in the world. This initiative should help in cutting down operating costs of its gold loan portfolio over longer term.
Exhibit 42: Cost matrix to ease Exhibit 43: Branch expansion only in non-gold business portfolio
Source: Company, Nirmal Bang Institutional Equities Research Source: Company, Nirmal Bang Institutional Equities Research
One of the main reasons for higher operating costs compared to the leader is low branch leverage versus peers. MFL’s AUM per branch is Rs31mn against Muthoot Finance’s 58mn, indicating low operating efficiency under which the company is operating. We believe the difference in branch leverage is mainly on account of the difference in the size of business. Muthoot Finance’s gold loan portfolio is 2.4 times of MFL’s. As a result,MFL has the right strategy of not expanding its gold loan branches and improving on branch productivity. With the company targeting to increase its gold loan AUM by 15% CAGR without any branch expansion, it will help in improving operating efficiency.
Exhibit 44: Significant scope to improve cost-to-AUM ratio Exhibit 45: Scope to improve AUM per branch
Source: Company, Nirmal Bang Institutional Equities Research Source: Company, Nirmal Bang Institutional Equities Research
6.6
5.5 5.9 6.0
6.8 6.6 6.3
0
1
2
3
4
5
6
7
8
FY12 FY13 FY14 FY15 FY16 FY17E FY18E
Cost-to-AUM
(%)
2,9083,295 3,293 3,293 3,293 3,293 3,293
141 346505 736
1224
31
0
500
1,000
1,500
2,000
2,500
3,000
3,500
4,000
4,500
FY12 FY13 FY14 FY15 FY16 FY17E FY18E
Gold Microfinance Home Loan
(Nos)
6.6
5.55.9 6.0
6.8
3.2
3.8
4.65.1
4.8
0
1
2
3
4
5
6
7
8
FY12 FY13 FY14 FY15 FY16
Manappuram Muthoot
(%)
66 64 51 56 58 33 30 25 28 310
10
20
30
40
50
60
70
FY12 FY13 FY14 FY15 FY16
Muthoot Manappuram
(Rsmn)
Institutional Equities
Manappuram Finance 20
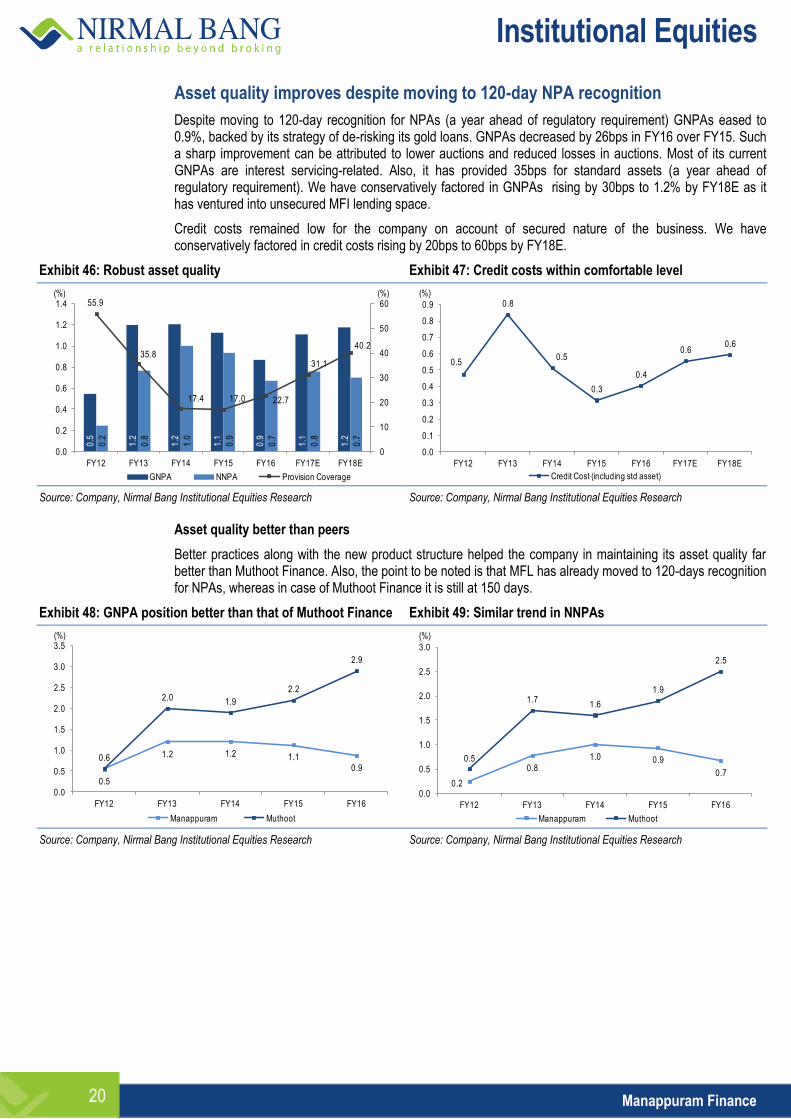
Asset quality improves despite moving to 120-day NPA recognition
Despite moving to 120-day recognition for NPAs (a year ahead of regulatory requirement) GNPAs eased to 0.9%, backed by its strategy of de-risking its gold loans. GNPAs decreased by 26bps in FY16 over FY15. Such a sharp improvement can be attributed to lower auctions and reduced losses in auctions. Most of its current GNPAs are interest servicing-related. Also, it has provided 35bps for standard assets (a year ahead of regulatory requirement). We have conservatively factored in GNPAs rising by 30bps to 1.2% by FY18E as it has ventured into unsecured MFI lending space.
Credit costs remained low for the company on account of secured nature of the business. We have conservatively factored in credit costs rising by 20bps to 60bps by FY18E.
Exhibit 46: Robust asset quality Exhibit 47: Credit costs within comfortable level
Source: Company, Nirmal Bang Institutional Equities Research Source: Company, Nirmal Bang Institutional Equities Research
Asset quality better than peers
Better practices along with the new product structure helped the company in maintaining its asset quality far better than Muthoot Finance. Also, the point to be noted is that MFL has already moved to 120-days recognition for NPAs, whereas in case of Muthoot Finance it is still at 150 days.
Exhibit 48: GNPA position better than that of Muthoot Finance Exhibit 49: Similar trend in NNPAs
Source: Company, Nirmal Bang Institutional Equities Research Source: Company, Nirmal Bang Institutional Equities Research
0.5
1.2
1.2
1.1
0.9
1.1
1.2
0.2
0.8
1.0
0.9
0.7
0.8
0.7
55.9
35.8
17.4 17.0 22.7
31.1
40.2
0
10
20
30
40
50
60
0.0
0.2
0.4
0.6
0.8
1.0
1.2
1.4
FY12 FY13 FY14 FY15 FY16 FY17E FY18E
GNPA NNPA Provision Coverage
(%)(%)
0.5
0.8
0.5
0.3
0.4
0.6 0.6
0.0
0.1
0.2
0.3
0.4
0.5
0.6
0.7
0.8
0.9
FY12 FY13 FY14 FY15 FY16 FY17E FY18E
Credit Cost (including std asset)
(%)
0.5
1.2 1.2 1.1 0.9
0.6
2.0 1.9
2.2
2.9
0.0
0.5
1.0
1.5
2.0
2.5
3.0
3.5
FY12 FY13 FY14 FY15 FY16
Manappuram Muthoot
(%)
0.2
0.8
1.0 0.9
0.7
0.5
1.71.6
1.9
2.5
0.0
0.5
1.0
1.5
2.0
2.5
3.0
FY12 FY13 FY14 FY15 FY16
Manappuram Muthoot
(%)
Institutional Equities
Manappuram Finance 21
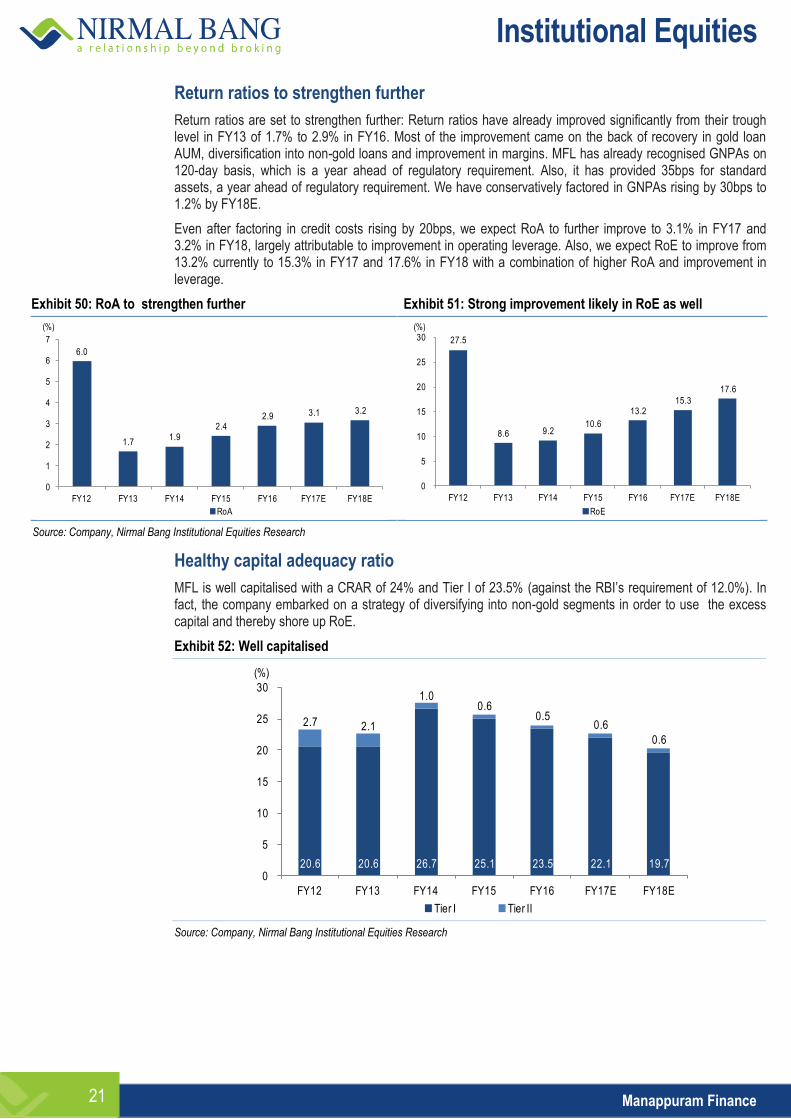
Return ratios to strengthen further
Return ratios are set to strengthen further: Return ratios have already improved significantly from their trough level in FY13 of 1.7% to 2.9% in FY16. Most of the improvement came on the back of recovery in gold loan AUM, diversification into non-gold loans and improvement in margins. MFL has already recognised GNPAs on 120-day basis, which is a year ahead of regulatory requirement. Also, it has provided 35bps for standard assets, a year ahead of regulatory requirement. We have conservatively factored in GNPAs rising by 30bps to 1.2% by FY18E.
Even after factoring in credit costs rising by 20bps, we expect RoA to further improve to 3.1% in FY17 and 3.2% in FY18, largely attributable to improvement in operating leverage. Also, we expect RoE to improve from 13.2% currently to 15.3% in FY17 and 17.6% in FY18 with a combination of higher RoA and improvement in leverage.
Exhibit 50: RoA to strengthen further Exhibit 51: Strong improvement likely in RoE as well
Source: Company, Nirmal Bang Institutional Equities Research
Healthy capital adequacy ratio
MFL is well capitalised with a CRAR of 24% and Tier I of 23.5% (against the RBI’s requirement of 12.0%). In fact, the company embarked on a strategy of diversifying into non-gold segments in order to use the excess capital and thereby shore up RoE.
Exhibit 52: Well capitalised
Source: Company, Nirmal Bang Institutional Equities Research
6.0
1.7 1.9
2.4 2.9 3.1 3.2
0
1
2
3
4
5
6
7
FY12 FY13 FY14 FY15 FY16 FY17E FY18E
RoA
(%)
27.5
8.6 9.2 10.6
13.2 15.3
17.6
0
5
10
15
20
25
30
FY12 FY13 FY14 FY15 FY16 FY17E FY18E
RoE
(%)
20.6 20.6 26.7 25.1 23.5 22.1 19.7
2.7 2.1
1.00.6
0.50.6
0.6
0
5
10
15
20
25
30
FY12 FY13 FY14 FY15 FY16 FY17E FY18E
Tier I Tier II
(%)
Institutional Equities
Manappuram Finance 22
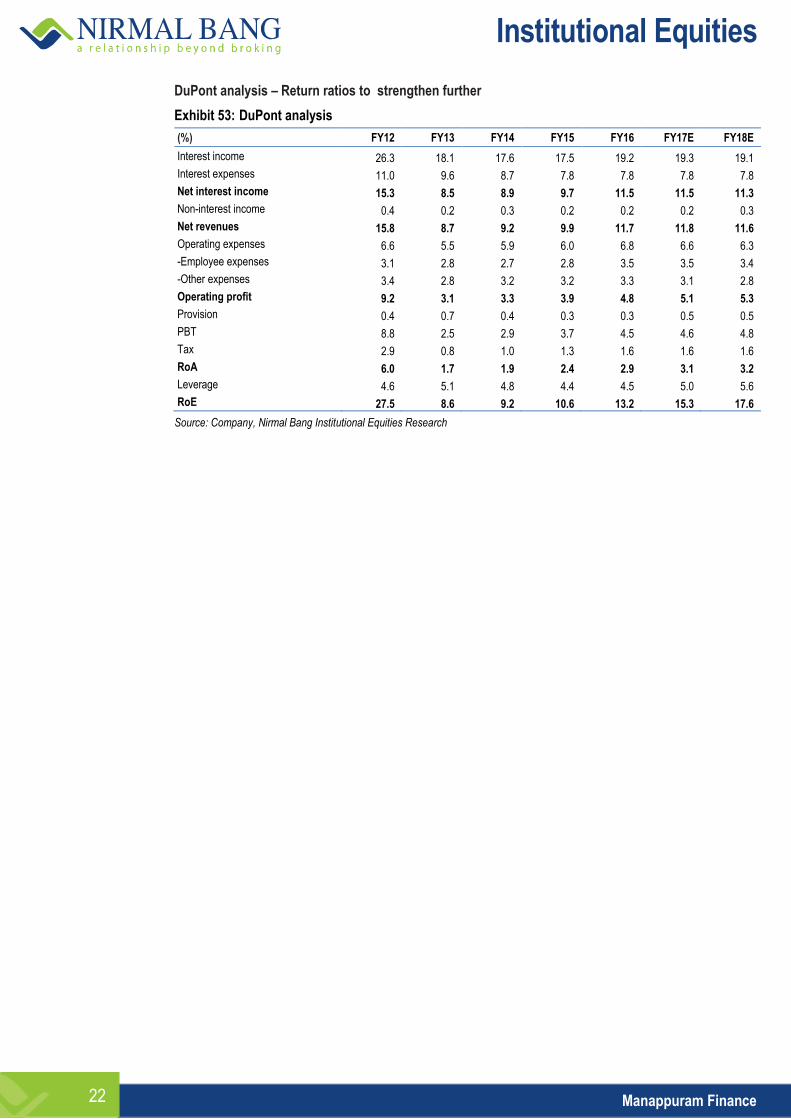
DuPont analysis – Return ratios to strengthen further
Exhibit 53: DuPont analysis
(%) FY12 FY13 FY14 FY15 FY16 FY17E FY18E
Interest income 26.3 18.1 17.6 17.5 19.2 19.3 19.1
Interest expenses 11.0 9.6 8.7 7.8 7.8 7.8 7.8
Net interest income 15.3 8.5 8.9 9.7 11.5 11.5 11.3
Non-interest income 0.4 0.2 0.3 0.2 0.2 0.2 0.3
Net revenues 15.8 8.7 9.2 9.9 11.7 11.8 11.6
Operating expenses 6.6 5.5 5.9 6.0 6.8 6.6 6.3
-Employee expenses 3.1 2.8 2.7 2.8 3.5 3.5 3.4
-Other expenses 3.4 2.8 3.2 3.2 3.3 3.1 2.8
Operating profit 9.2 3.1 3.3 3.9 4.8 5.1 5.3
Provision 0.4 0.7 0.4 0.3 0.3 0.5 0.5
PBT 8.8 2.5 2.9 3.7 4.5 4.6 4.8
Tax 2.9 0.8 1.0 1.3 1.6 1.6 1.6
RoA 6.0 1.7 1.9 2.4 2.9 3.1 3.2
Leverage 4.6 5.1 4.8 4.4 4.5 5.0 5.6
RoE 27.5 8.6 9.2 10.6 13.2 15.3 17.6
Source: Company, Nirmal Bang Institutional Equities Research

Institutional Equities
Manappuram Finance 23
Company background
Manappuram Finance (earlier Manappuram General Finance & Leasing), a non-banking finance company promoted by Manappuram Group, was established in 1992. The company has its headquarters at Valapad in Thrissur district of Kerala. The company went public in August 1995 and has grown substantially since then. It earlier operated as a small financial company/pawn-broker since 1949. Manappuram Finance is India’s second-largest gold-lending NBFC operating in a niche market segment with AUM of around IRs114bn, of which its gold AUM stands at Rs101bn.
The company has, since the past two years, embarked on a strategy to diversify into non-gold loans. It acquired a majority stake (85%) in Asirvad Microfinance Private Limited, one of the leading microfinance institutions in Tamil Nadu, in February 2015. It also acquired Milestone Home Finance Company Pvt. Ltd. which later was renamed as Manappuram Home Finance Pvt. Ltd and started commercial operations in January 2015. The company also started lending for purchase of commercial vehicles and forayed into MSME financing/ LAP.
Exhibit 54: Branch network
States/UT Branches
Tamil Nadu 577
Karnataka 577
Kerala 538
Andhra Pradesh 341
Telanagana 251
Maharashtra 192
Gujarat 108
Uttar Pradesh 92
Madhya Pradesh 87
West Bengal 82
Punjab 74
Orissa 69
Rajasthan 66
Haryana 62
Delhi 59
Chattisgarh 53
Jammu & Kashmir 13
Pondicherry 10
Bihar 9
Goa 8
Assam 8
Andaman 5
Chandigarh 4
Uttarakhand 3
Himachal Pradesh 3
Daman & Diu 1
Jharkhand 1
Total 3,293
Institutional Equities
Manappuram Finance 24
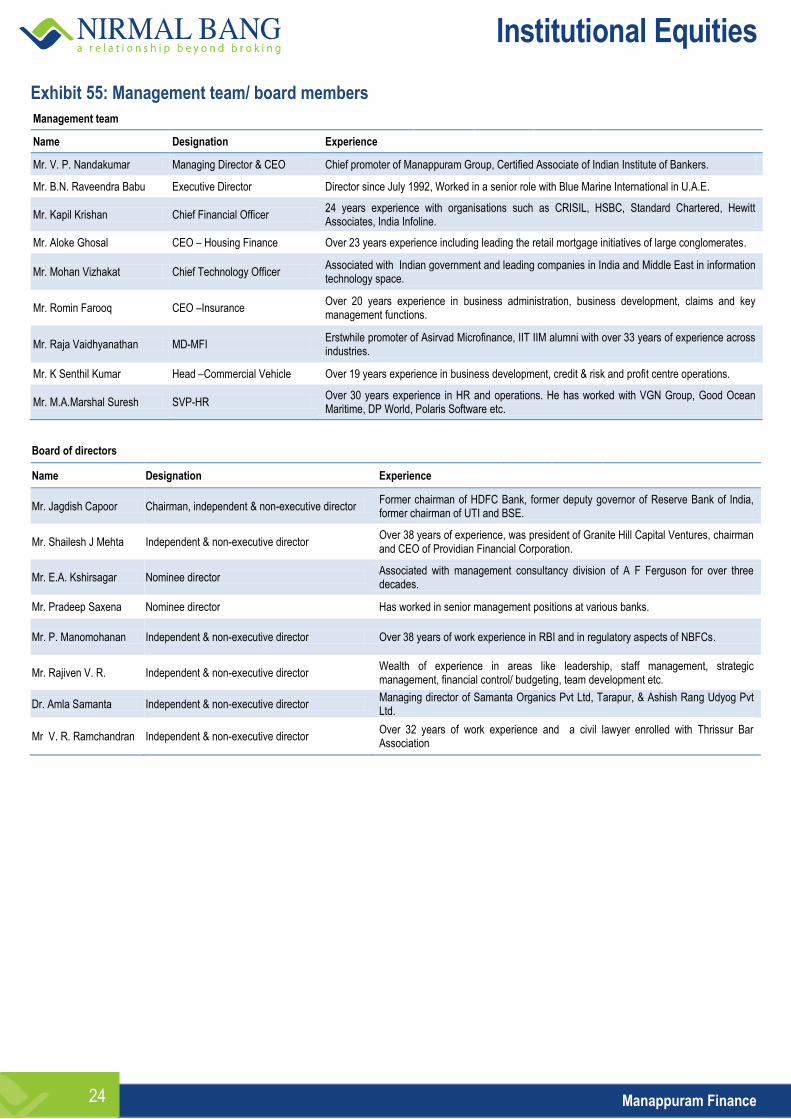
Exhibit 55: Management team/ board members
Management team
Name Designation Experience
Mr. V. P. Nandakumar Managing Director & CEO Chief promoter of Manappuram Group, Certified Associate of Indian Institute of Bankers.
Mr. B.N. Raveendra Babu Executive Director Director since July 1992, Worked in a senior role with Blue Marine International in U.A.E.
Mr. Kapil Krishan Chief Financial Officer 24 years experience with organisations such as CRISIL, HSBC, Standard Chartered, Hewitt Associates, India Infoline.
Mr. Aloke Ghosal CEO – Housing Finance Over 23 years experience including leading the retail mortgage initiatives of large conglomerates.
Mr. Mohan Vizhakat Chief Technology Officer Associated with Indian government and leading companies in India and Middle East in information technology space.
Mr. Romin Farooq CEO –Insurance Over 20 years experience in business administration, business development, claims and key management functions.
Mr. Raja Vaidhyanathan MD-MFI Erstwhile promoter of Asirvad Microfinance, IIT IIM alumni with over 33 years of experience across industries.
Mr. K Senthil Kumar Head –Commercial Vehicle Over 19 years experience in business development, credit & risk and profit centre operations.
Mr. M.A.Marshal Suresh SVP-HR Over 30 years experience in HR and operations. He has worked with VGN Group, Good Ocean Maritime, DP World, Polaris Software etc.
Board of directors
Name Designation Experience
Mr. Jagdish Capoor Chairman, independent & non-executive director Former chairman of HDFC Bank, former deputy governor of Reserve Bank of India, former chairman of UTI and BSE.
Mr. Shailesh J Mehta Independent & non-executive director Over 38 years of experience, was president of Granite Hill Capital Ventures, chairman and CEO of Providian Financial Corporation.
Mr. E.A. Kshirsagar Nominee director Associated with management consultancy division of A F Ferguson for over three decades.
Mr. Pradeep Saxena Nominee director Has worked in senior management positions at various banks.
Mr. P. Manomohanan Independent & non-executive director Over 38 years of work experience in RBI and in regulatory aspects of NBFCs.
Mr. Rajiven V. R. Independent & non-executive director Wealth of experience in areas like leadership, staff management, strategic management, financial control/ budgeting, team development etc.
Dr. Amla Samanta Independent & non-executive director Managing director of Samanta Organics Pvt Ltd, Tarapur, & Ashish Rang Udyog Pvt Ltd.
Mr V. R. Ramchandran Independent & non-executive director Over 32 years of work experience and a civil lawyer enrolled with Thrissur Bar Association
Institutional Equities
Manappuram Finance 25
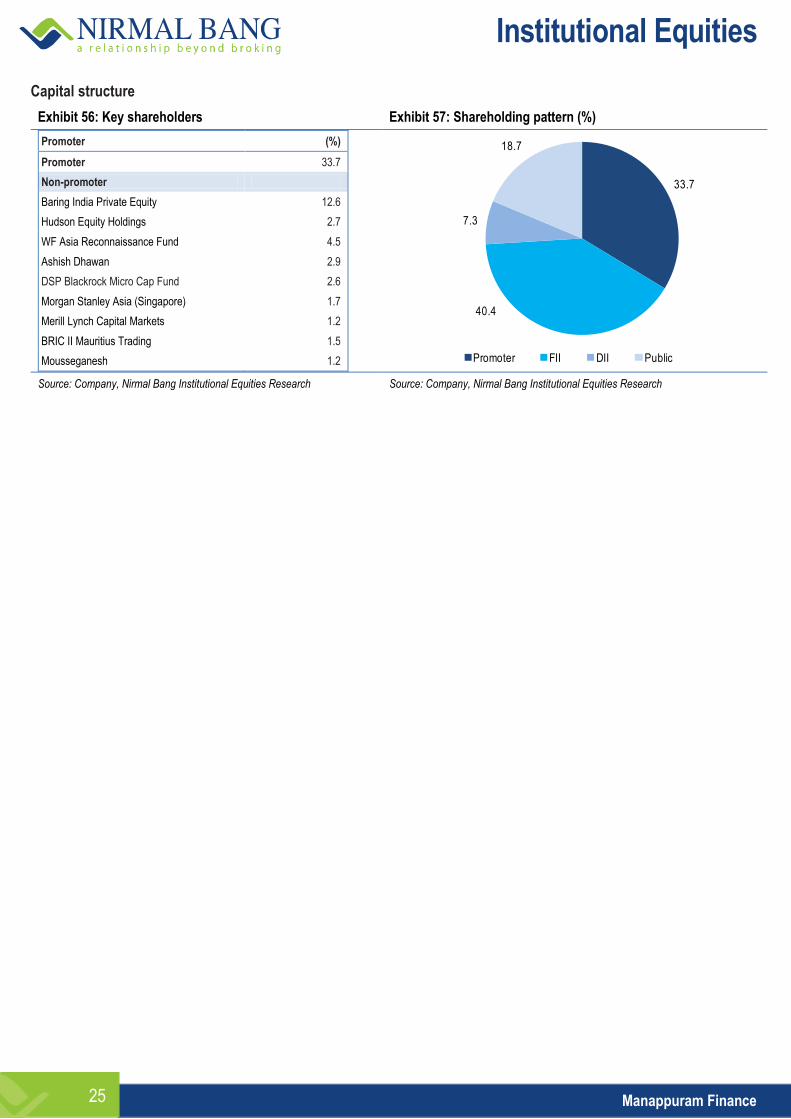
Capital structure
Exhibit 56: Key shareholders Exhibit 57: Shareholding pattern (%)
Promoter (%)
Promoter 33.7
Non-promoter
Baring India Private Equity 12.6
Hudson Equity Holdings 2.7
WF Asia Reconnaissance Fund 4.5
Ashish Dhawan 2.9
DSP Blackrock Micro Cap Fund 2.6
Morgan Stanley Asia (Singapore) 1.7
Merill Lynch Capital Markets 1.2
BRIC II Mauritius Trading 1.5
Mousseganesh 1.2
Source: Company, Nirmal Bang Institutional Equities Research Source: Company, Nirmal Bang Institutional Equities Research
33.7
40.4
7.3
18.7
Promoter FII DII Public
Institutional Equities
Manappuram Finance 26
Key risks
Correction in gold prices
Although MFL has minimised the risk of asset quality stress emerging from extreme volatility in gold prices, demand for gold loans, recovery of non-performing loans or NPLs and consequent returns ratios are still dependent on gold prices. Steep downward movement in gold prices could restrict the growth of gold loans and dampen profitability.
Rapid increase in non-gold financing
The company is targeting rapid growth in all non-gold loan business. Although it has appointed separate heads for all the verticals, such a sharp growth can pose a risk if a particular business is expanded without understanding inherent risk.
Loan slippage from microfinance segment
Although currently NPAs in microfinance segment are insignificant, delinquency can increase sharply in microfinance segment as such lending is entirely unsecured.
Employee management
Gold finance as well as microfinance is manpower-intensive business. The company has a current employee base of ~18,700 and it is a challenge to manage them
Changes in regulation
Gold finance business got impacted on account of stringent regulations of RBI. MFL got some relief in September 2013. If regulations are further tightened by the RBI, it can be a source of risk.
Institutional Equities
Manappuram Finance 27
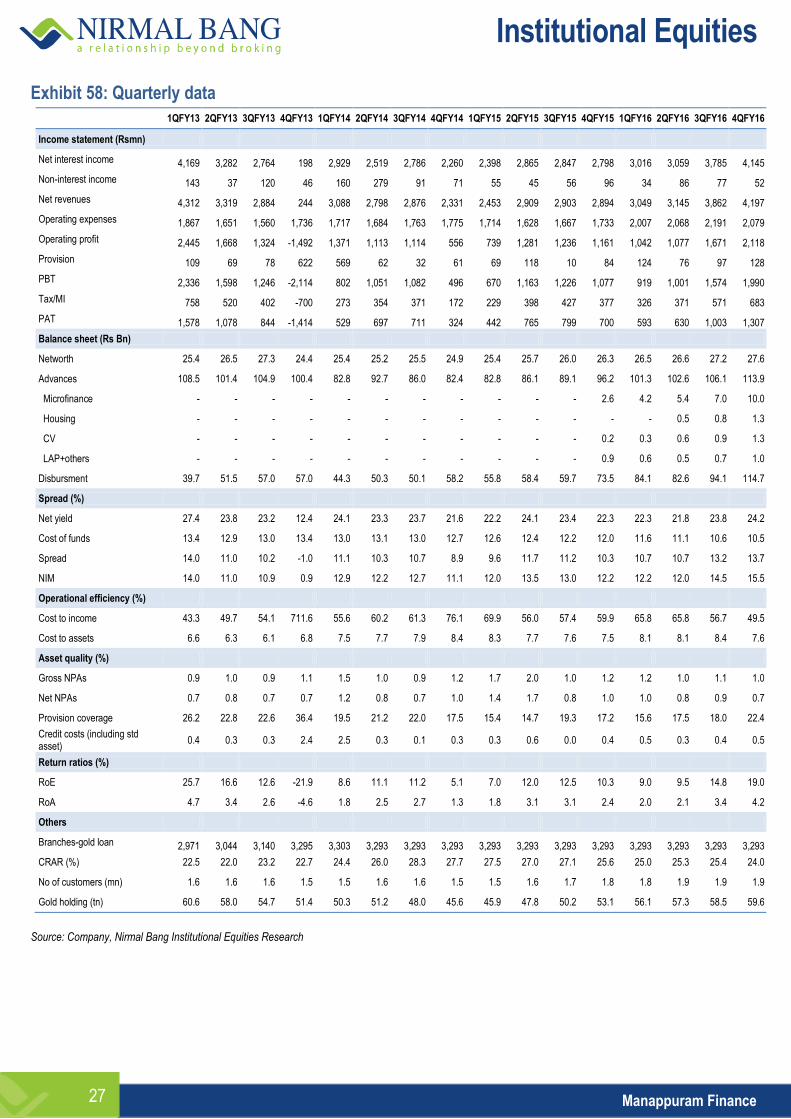
Exhibit 58: Quarterly data
1QFY13 2QFY13 3QFY13 4QFY13 1QFY14 2QFY14 3QFY14 4QFY14 1QFY15 2QFY15 3QFY15 4QFY15 1QFY16 2QFY16 3QFY16 4QFY16
Income statement (Rsmn)
Net interest income 4,169 3,282 2,764 198 2,929 2,519 2,786 2,260 2,398 2,865 2,847 2,798 3,016 3,059 3,785 4,145
Non-interest income 143 37 120 46 160 279 91 71 55 45 56 96 34 86 77 52
Net revenues 4,312 3,319 2,884 244 3,088 2,798 2,876 2,331 2,453 2,909 2,903 2,894 3,049 3,145 3,862 4,197
Operating expenses 1,867 1,651 1,560 1,736 1,717 1,684 1,763 1,775 1,714 1,628 1,667 1,733 2,007 2,068 2,191 2,079
Operating profit 2,445 1,668 1,324 -1,492 1,371 1,113 1,114 556 739 1,281 1,236 1,161 1,042 1,077 1,671 2,118
Provision 109 69 78 622 569 62 32 61 69 118 10 84 124 76 97 128
PBT 2,336 1,598 1,246 -2,114 802 1,051 1,082 496 670 1,163 1,226 1,077 919 1,001 1,574 1,990
Tax/MI 758 520 402 -700 273 354 371 172 229 398 427 377 326 371 571 683
PAT 1,578 1,078 844 -1,414 529 697 711 324 442 765 799 700 593 630 1,003 1,307
Balance sheet (Rs Bn)
Networth 25.4 26.5 27.3 24.4 25.4 25.2 25.5 24.9 25.4 25.7 26.0 26.3 26.5 26.6 27.2 27.6
Advances 108.5 101.4 104.9 100.4 82.8 92.7 86.0 82.4 82.8 86.1 89.1 96.2 101.3 102.6 106.1 113.9
Microfinance - - - - - - - - - - - 2.6 4.2 5.4 7.0 10.0
Housing - - - - - - - - - - - - - 0.5 0.8 1.3
CV - - - - - - - - - - - 0.2 0.3 0.6 0.9 1.3
LAP+others - - - - - - - - - - - 0.9 0.6 0.5 0.7 1.0
Disbursment 39.7 51.5 57.0 57.0 44.3 50.3 50.1 58.2 55.8 58.4 59.7 73.5 84.1 82.6 94.1 114.7
Spread (%)
Net yield 27.4 23.8 23.2 12.4 24.1 23.3 23.7 21.6 22.2 24.1 23.4 22.3 22.3 21.8 23.8 24.2
Cost of funds 13.4 12.9 13.0 13.4 13.0 13.1 13.0 12.7 12.6 12.4 12.2 12.0 11.6 11.1 10.6 10.5
Spread 14.0 11.0 10.2 -1.0 11.1 10.3 10.7 8.9 9.6 11.7 11.2 10.3 10.7 10.7 13.2 13.7
NIM 14.0 11.0 10.9 0.9 12.9 12.2 12.7 11.1 12.0 13.5 13.0 12.2 12.2 12.0 14.5 15.5
Operational efficiency (%)
Cost to income 43.3 49.7 54.1 711.6 55.6 60.2 61.3 76.1 69.9 56.0 57.4 59.9 65.8 65.8 56.7 49.5
Cost to assets 6.6 6.3 6.1 6.8 7.5 7.7 7.9 8.4 8.3 7.7 7.6 7.5 8.1 8.1 8.4 7.6
Asset quality (%)
Gross NPAs 0.9 1.0 0.9 1.1 1.5 1.0 0.9 1.2 1.7 2.0 1.0 1.2 1.2 1.0 1.1 1.0
Net NPAs 0.7 0.8 0.7 0.7 1.2 0.8 0.7 1.0 1.4 1.7 0.8 1.0 1.0 0.8 0.9 0.7
Provision coverage 26.2 22.8 22.6 36.4 19.5 21.2 22.0 17.5 15.4 14.7 19.3 17.2 15.6 17.5 18.0 22.4
Credit costs (including std asset)
0.4 0.3 0.3 2.4 2.5 0.3 0.1 0.3 0.3 0.6 0.0 0.4 0.5 0.3 0.4 0.5
Return ratios (%)
RoE 25.7 16.6 12.6 -21.9 8.6 11.1 11.2 5.1 7.0 12.0 12.5 10.3 9.0 9.5 14.8 19.0
RoA 4.7 3.4 2.6 -4.6 1.8 2.5 2.7 1.3 1.8 3.1 3.1 2.4 2.0 2.1 3.4 4.2
Others
Branches-gold loan 2,971 3,044 3,140 3,295 3,303 3,293 3,293 3,293 3,293 3,293 3,293 3,293 3,293 3,293 3,293 3,293
CRAR (%) 22.5 22.0 23.2 22.7 24.4 26.0 28.3 27.7 27.5 27.0 27.1 25.6 25.0 25.3 25.4 24.0
No of customers (mn) 1.6 1.6 1.6 1.5 1.5 1.6 1.6 1.5 1.5 1.6 1.7 1.8 1.8 1.9 1.9 1.9
Gold holding (tn) 60.6 58.0 54.7 51.4 50.3 51.2 48.0 45.6 45.9 47.8 50.2 53.1 56.1 57.3 58.5 59.6
Source: Company, Nirmal Bang Institutional Equities Research

Institutional Equities
Manappuram Finance 28
Financials
Exhibit 59: Income statement
Y/E March (Rsmn) FY14 FY15 FY16 FY17E FY18E
Interest income 20,760 19,682 23,489 27,995 34,488
Interest expenses 10,266 8,774 9,485 11,271 14,052
Net interest income 10,494 10,908 14,005 16,724 20,436
Non-interest income 359 252 249 355 531
Net revenues 10,852 11,160 14,253 17,079 20,967
Operating expenses 6,953 6,741 8,345 9,624 11,355
-Employee expenses 3,235 3,145 4,327 5,084 6,225
-Other expenses 3,718 3,596 4,018 4,540 5,130
Operating profit 3,899 4,419 5,908 7,455 9,612
Provisions 469 282 425 708 941
PBT 3,430 4,137 5,484 6,747 8,671
Tax 1,170 1,422 1,933 2,294 2,948
PAT 2,260 2,715 3,551 4,453 5,723
Source: Company, Nirmal Bang Institutional Equities Research
Exhibit 61: Balance sheet
Y/E March (Rsmn) FY14 FY15 FY16 FY17E FY18E
Share capital 1,682 1,682 1,682 1,682 1,682
Reserves & surplus 23,235 24,646 25,898 28,957 32,769
Networth 24,917 26,328 27,580 30,639 34,451
Borrowings 77,954 86,320 96,379 125,002 156,524
Other liability & provisions 5,513 3,515 4,220 5,996 8,228
Total liabilities 108,385 116,163 128,391 161,905 199,581
Fixed Assets 2,019 1,737 1,948 2,338 2,688
Investments 7,956 2,169 490 490 490
Loans 82,420 96,221 113,853 140,722 177,283
Cash 8,445 7,926 6,045 9,851 10,637
Other assets 7,546 8,110 6,055 8,505 8,483
Total assets 108,385 116,163 128,391 161,905 199,581
Source: Company, Nirmal Bang Institutional Equities Research
Exhibit 60: Key ratios
Y/E March (Rsmn) FY14 FY15 FY16 FY17E FY18E
Growth (%)
Net interest income -0.7 4.0 28.4 19.4 22.2
Operating profit 0.1 13.3 33.7 26.2 28.9
Profit after tax 8.4 20.1 30.8 25.4 28.5
Business (%)
Growth in advances -17.9 16.7 18.3 23.6 26.0
Spreads (%)
Yield on loans 22.7 22.0 22.4 22.0 21.7
Cost of borrowings 11.7 10.7 10.4 10.2 10.0
Spread 11.0 11.4 12.0 11.8 11.7
NIM 11.5 12.2 13.3 13.1 12.9
Operational efficiency (%)
Cost to income 64.1 60.4 58.5 56.4 54.2
Cost to assets 5.9 6.0 6.8 6.6 6.3
Productivity (Rsmn)
AUM per branch 25.0 27.9 31.1 36.8 43.5
AUM per employee 4.9 5.9 6.1 7.4 8.7
Employee per branch 5.1 4.7 5.1 5.0 5.0
CRAR (%)
Tier I 26.7 25.1 23.5 22.1 19.7
Tier II 1.0 0.6 0.5 0.6 0.6
Total 27.7 25.6 24.0 22.7 20.3
Asset quality (%)
Gross NPAs 1.2 1.1 0.9 1.1 1.2
Net NPAs 1.0 0.9 0.7 0.8 0.7
Provision coverage 17.4 17.0 22.7 31.1 40.2
Credit costs (including std. assets) 0.5 0.3 0.4 0.6 0.6
Return ratios (%)
RoE 9.2 10.6 13.2 15.3 17.6
RoA 1.9 2.4 2.9 3.1 3.2
Per share (%)
EPS 2.7 3.2 4.2 5.3 6.8
BV 29.6 31.3 32.8 36.4 41.0
ABV 28.6 30.2 31.9 35.2 39.5
Valuation (x)
P/E 21.6 18.0 13.7 11.0 8.5
P/BV 2.0 1.9 1.8 1.6 1.4
P/ABV 2.0 1.9 1.8 1.6 1.5
Source: Company, Nirmal Bang Institutional Equities Research
Institutional Equities
Manappuram Finance 29
Disclaimer
Stock Ratings Absolute Returns
BUY > 15%
ACCUMULATE -5% to15%
SELL < -5%
This report is published by Nirmal Bang’s Institutional Equities Research desk. Nirmal Bang group has other business units with independent research teams separated by Chinese walls, and therefore may, at times, have different or contrary views on stocks and markets. Reports based on technical and derivative analysis may not match with reports based on a company's fundamental analysis. This report is for the personal information of the authorised recipient and is not for public distribution. This should not be reproduced or redistributed to any other person or in any form. This report is for the general information for the clients of Nirmal Bang Equities Pvt. Ltd., a division of Nirmal Bang, and should not be construed as an offer or solicitation of an offer to buy/sell any securities.
We have exercised due diligence in checking the correctness and authenticity of the information contained herein, so far as it relates to current and historical information, but do not guarantee its accuracy or completeness. The opinions expressed are our current opinions as of the date appearing in the material and may be subject to change from time to time without notice.
Nirmal Bang or any persons connected with it do not accept any liability arising from the use of this document or the information contained therein. The recipients of this material should rely on their own judgment and take their own professional advice before acting on this information. Nirmal Bang or any of its connected persons including its directors or subsidiaries or associates or employees or agents shall not be in any way responsible for any loss or damage that may arise to any person/s from any inadvertent error in the information contained, views and opinions expressed in this publication.
Nirmal Bang Equities Private Limited (hereinafter referred to as “NBEPL”) is a registered Member of National Stock Exchange of India Limited, Bombay Stock Exchange Limited. NBEPL has registered with SEBI as a Research Entity in terms of SEBI (Research Analyst) Regulations, 2014. (Registration No: INH000001436 -19.08.2015 to 18.08.2020).
NBEPL or its associates including its relatives/analyst do not hold any financial interest/beneficial ownership of more than 1% in the company covered by Analyst.
NBEPL or its associates/analyst has not received any compensation from the company covered by Analyst during the past twelve months. NBEPL /analyst has not served as an officer, director or employee of company covered by Analyst and has not been engaged in market-making activity of the company covered by Analyst.
The views expressed are based solely on information available publicly and believed to be true. Investors are advised to independently evaluate the market conditions/risks involved before making any investment decision.
Access all our reports on Bloomberg, Thomson Reuters and Factset.
Team Details:
Name Email Id Direct Line
Rahul Arora CEO [email protected] -
Girish Pai Head of Research [email protected] +91 22 3926 8017 / 18
Dealing
Ravi Jagtiani Dealing Desk [email protected] +91 22 3926 8230, +91 22 6636 8833
Pradeep Kasat Dealing Desk [email protected] +91 22 3926 8100/8101, +91 22 6636 8831
Michael Pillai Dealing Desk [email protected] +91 22 3926 8102/8103, +91 22 6636 8830
Umesh Bharadia Dealing Desk [email protected] +91-22-39268226
Nirmal Bang Equities Pvt. Ltd.
Correspondence Address
B-2, 301/302, Marathon Innova,
Nr. Peninsula Corporate Park,
Lower Parel (W), Mumbai-400013.
Board No. : 91 22 3926 8000/1; Fax. : 022 3926 8010