Embed Size (px)
Citation preview
1750 Massachusetts Avenue, NW | Washington, DC 20036-1903 USA | +1.202.328.9000 | www.piie.com
WORKING PAPER
21-11 How COVID-19 Medical Supply Shortages Led to Extraordinary Trade and Industrial PolicyChad P. Bown
July 2021
Chad P. Bown is Reginald Jones Senior Fellow at the Peterson Institute for International Economics.
Author’s Note: A revised version of this paper will be published in the Asian Economic Policy Review. For helpful discussions, I thank Tom Bollyky, Lucian Cernat, Hal Hill, Soumaya Keynes, Cassey Lee, Jong-Wha Lee, Liza Lin, Sam Lowe, Hiroshi Mukunoki, Marcus Noland, John Polowczyk, Prashant Yadav, Shujiro Urata, and the journal’s editors. Hexuan Li and Eva Zhang provided data and research assistance. Melina Kolb, William Melancon, and Oliver Ward assisted with graphics. All remaining errors are my own.
ABSTRACTEarly in the COVID-19 pandemic, a global shortage of hospital gowns, gloves, surgical masks, and respirators caused policymakers around the world to panic. This paper examines international trade in this personal protective equipment (PPE) during the crisis, with a focus on China, the European Union, and the United States. As the pandemic first hit, China increased imports and decreased exports of PPE, removing considerable quantities of supplies from global markets. For the European Union and United States, the decrease in their imports from China was not immediately replaced by increased trade from other foreign suppliers. Early shortages led to EU and US export controls on their own, domestically produced PPE and other extraordinary policy actions, including a US effort to reserve for itself supplies manufactured in China by a US-headquartered multinational. By April 2020 China’s exports had mostly resumed, and over the rest of the year its export volumes of some products surged, more than doubling compared to pre-pandemic levels. But China’s export prices also skyrocketed and remained elevated through 2020, reflecting severe and continued shortages. This paper documents these facts. It also explores these and other government actions, such as US trade war tariffs and the emergence of US industrial policy in the form of over $1 billion of subsidies to build out its domestic PPE supply chain, as well as potential lessons for future pandemic preparedness and international policy cooperation.
JEL code: F13 Keywords: personal protective equipment, COVID-19, tariffs, export restrictions, supply chains, industrial policy
2 WP 21-11 | JULY 2021
1. INTRODUCTION
The early days of the COVID-19 pandemic brought fear and panic to the world for many reasons. A global shortage of basic personal protective equipment (PPE) was an important one. Nowhere to be found were hospital gowns and gloves, surgical masks and respirators, goggles and face shields. Healthcare workers needed them in higher volume to take care of the unending surge of sick patients. But suddenly so did many others whose jobs put them in close proximity to coworkers, customers, or vulnerable populations at long-term care facilities, prisons, grocery stores, meat-packing plants, schools, and elsewhere.
For policymakers in the United States and Europe, the PPE shortage of early 2020 was stupefying. Even a year later, in February 2021, newly inaugurated US president Joseph R. Biden Jr. reminded Americans of “the shortages in PPE during this pandemic—that meant we didn’t have the masks; we didn’t have gowns or gloves to protect our frontline health workers.… That should never have…happened.”
Trade, especially with China, has been accused of being a major source of the problem. Policymakers have launched investigations into how things went so wrong, demanding change as a result. For example, shortly after assuming office in January 2021, Biden issued an Executive Order, saying, “this will never happen again in the United States, period. We shouldn’t have to rely on a foreign country—especially one that doesn’t share our interests or our values—in order to protect and provide for our people during a national emergency.”1
This paper clarifies what is known about trade in PPE products during the pandemic for China, the European Union, and the United States. It also explores a series of extraordinary policies affecting PPE during the pandemic, including trade war tariffs, export controls, directives that multinational corporations prioritize American sales from their foreign subsidiaries, and new US industrial policy—including over $1 billion of subsidies to expand capacity along its domestic PPE supply chain. The paper describes implications for post-pandemic policy and international cooperation, and explains where additional data collection and research efforts are needed.
2. BACKGROUND ON PPE PRODUCTION AND TRADE
Personal protective equipment includes a range of items.2 The focus here is on surgical masks and respirators as well as “protective garments”—a broad category that includes hazmat suits, as well as some hospital gowns. The analysis
1 “Remarks by President Biden at Signing of an Executive Order on Supply Chains,” White House, February 24, 2021 (https://www.whitehouse.gov/briefing-room/speeches-remarks/2021/02/24/remarks-by-president-biden-at-signing-of-an-executive-order-on-supply-chains/, accessed on June 23, 2021).
2 See, for example, USITC (2020), Baldwin and Evenett (2020), Evenett (2020), Evenett et al. (2021), Espitia, Rocha, and Ruta (2020), Gereffi (2020), Hoekman, Fiorini, and Yildirim (2020), Leibovici and Santacreu (2020), and Miroudot (2020).
This paper clarifies what is known about trade in PPE products during the pandemic for China, the European Union, and the United States.
3 WP 21-11 | JULY 2021
also touches on hospital gloves, as well as goggles, face shields, and medical shoe coverings.3
On the demand side, consumption of PPE can be characterized by large positive externalities. The social benefit of wearing PPE during the pandemic was much larger than the (substantial) private benefit, given both the devastating health effects of the disease and its transmissibility via airborne particles. For example, one back-of-the-envelope estimate indicated that the social value of each cloth mask worn by the American public was $3,000–$6,000, whereas each N95 respirator worn by a hospital worker could “easily be more than a million dollars” (Abaluck et al. 2020). The divergence between private and social benefits is one motivation for policy intervention.
On the supply side, the United States and European Union had pre-pandemic domestic manufacturing for some items, but product-level production data are not yet publicly available to clarify how much. However, the existence of some local production can be inferred from a variety of sources.
For the European Union, intra-EU trade (e.g., France exporting PPE to Italy) is possible only with domestic production. Furthermore, in a March 2020 policy announcement (described below), the European Commission (2020a) stated that “production of personal protective equipment such as mouth protection masks in the Union is currently concentrated in a limited number of Member States, namely the Czech Republic, France, Germany, and Poland.”
Another source of production information is company announcements; 3M and Honeywell, for example, reported expansions to their N95 respirator manufacturing product lines during the pandemic (3M 2020a, Honeywell 2020). A US International Trade Commission investigation in mid-2020 also described anecdotal evidence from industry interviews (USITC 2020).
For some products, however, there was apparently little pre-pandemic domestic production, at least in the United States. John Polowczyk, who led the US government’s PPE Supply Chain Task Force from March 15 through November 2020, said “we made about 500 million nitrile gloves in America, pre-pandemic. [During the pandemic] we were using 1.8 billion a week. 500 million a year for manufacturing is not like you just get to put on another shift and make more gloves.”4
Changes in the US domestic regulatory environment were also likely to have impacted PPE availability. For example, one agency (the National Institute for Occupational Safety and Health, NIOSH) regulated the N95 respirator for industrial use and another (the Food and Drug Administration, FDA) regulated it for medical use. Before the pandemic, more than 95 percent of American N95
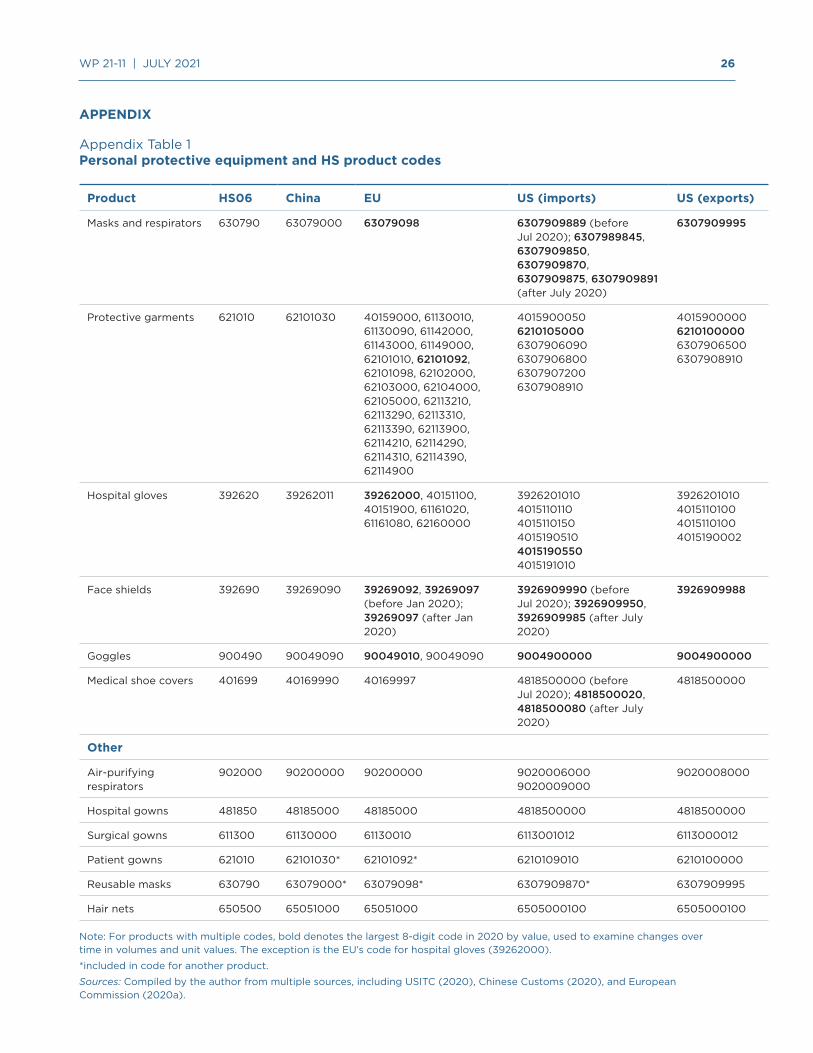
3 This PPE characterization is a by-product of trade statistics classification prior to the pandemic. For example, surgical masks and N95 respirators are different products that fell into the same code and were thus inseparable from the perspective of trade. A similar explanation holds for different types of protective garments. As one policy response, the United States created new product codes for N95 respirators, surgical masks, and face shields in July 2020 and for surgical gowns in January 2021. Appendix table 1 provides precise product classifications.
4 The interview with Polowczyk is in Bown and Keynes (forthcoming).
For some products, however, there was apparently little pre-pandemic domestic production, at least in the United States.
4 WP 21-11 | JULY 2021
respirator use was in industrial rather than medical settings, to protect workers from dust, chemicals, or other hazardous airborne particles (USITC 2020, p. 89). (This use likely declined periodically throughout 2020, when lockdowns emerged.) In March 2020, the FDA facilitated product availability by authorizing emergency use of NIOSH-approved N95 respirators in medical settings.
However tempting, it is impossible at this stage to definitively attribute changes in trade flows during the pandemic to policy changes. That is because multiple determinants of domestic supply and demand—and thus imports and exports—were changing alongside many of the policy changes described next. As an example, for a net exporting country of PPE, increased demand for PPE because of a domestic coronavirus outbreak and decreased supply due to an industrial lockdown would each have the same impact—reducing export volumes—as a newly imposed export-restricting policy. Alternatively, relaxing the stringency of the regulatory environment might increase both domestic and foreign supply of N95 respirators, but without knowing which was bigger, such a change would have an uncertain net effect on imports. In addition to trade data and an economic model, a rigorous assessment requires extremely detailed data on the domestic production and consumption of PPE before and during the pandemic, and these data are not yet publicly available at the level of disaggregation needed.
The following sections present stylized facts on PPE trade flows in light of several major policy actions, although even that effort is confounded by measurement challenges. For example, the most precisely defined pre-pandemic PPE product classifications often also included unrelated items in the tariff schedule. (In examining changes over time, the assumption is that there was little pandemic-related change in demand for or supply of those other items.) Furthermore, volumes are often measured in weight (e.g., kilograms), not more familiar units often referenced by policymakers, such as number of masks.
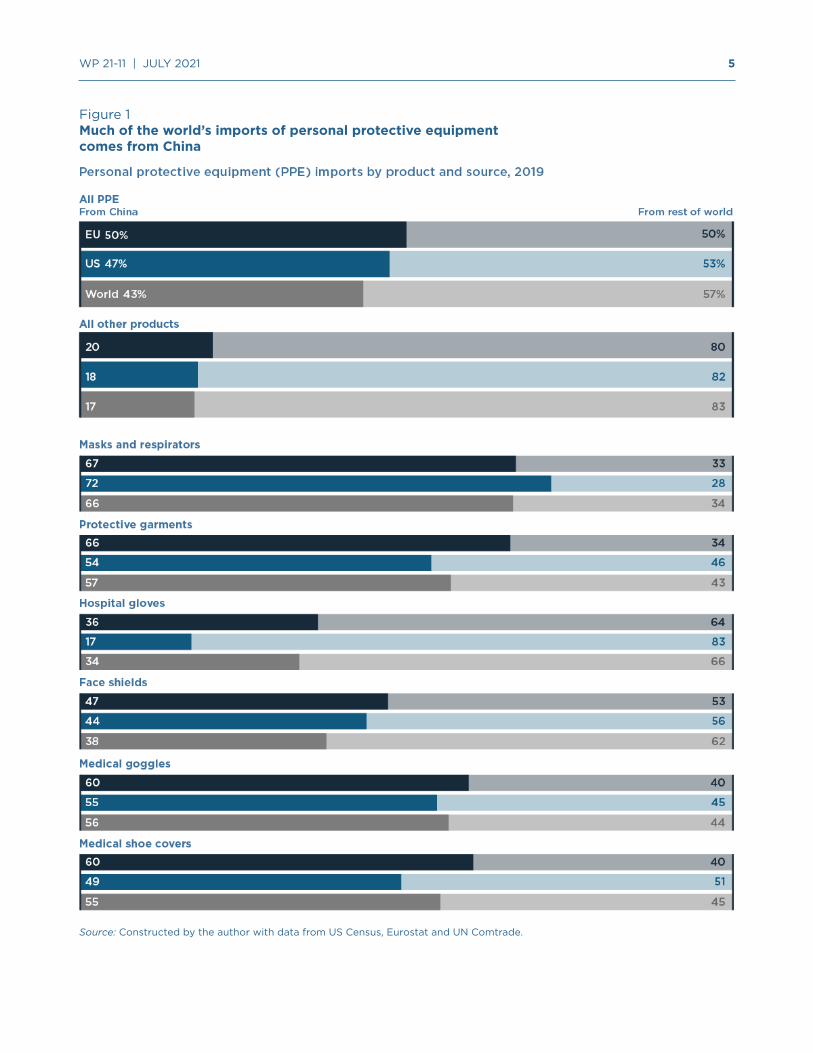
Before the pandemic, China was the top exporter of most of the products considered in this analysis (figure 1). The exception was hospital gloves (Malaysia). The United States and European Union applied relatively low most favored nation (MFN) import tariffs on these products.5
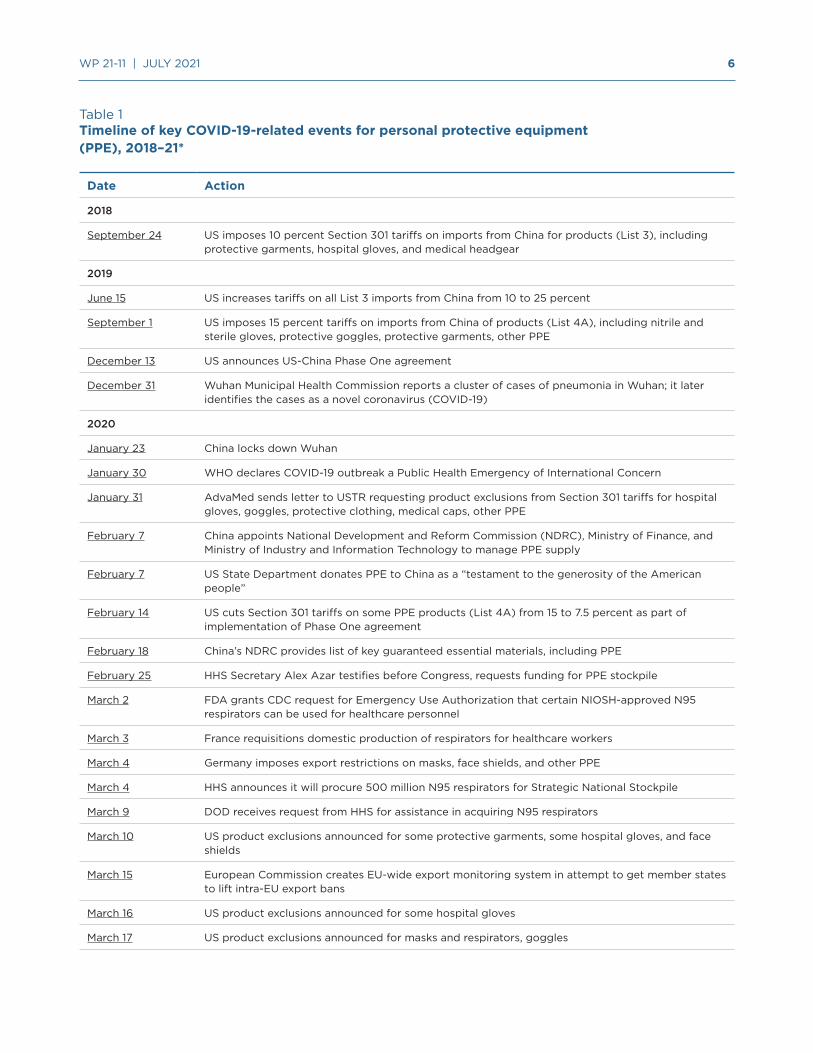
Table 1 summarizes the timeline of events discussed in the next three sections.
5 Depending on the product, applied MFN tariffs ranged from 0 to 7 percent for the US and 1.7 to 12 percent for the EU.
However tempting, it is impossible at this stage to definitively attribute changes in trade flows during the pandemic to policy changes.
5 WP 21-11 | JULY 2021
Figure 1Much of the world’s imports of personal protective equipment comes from China
Source: Constructed by the author with data from US Census, Eurostat and UN Comtrade.
6 WP 21-11 | JULY 2021
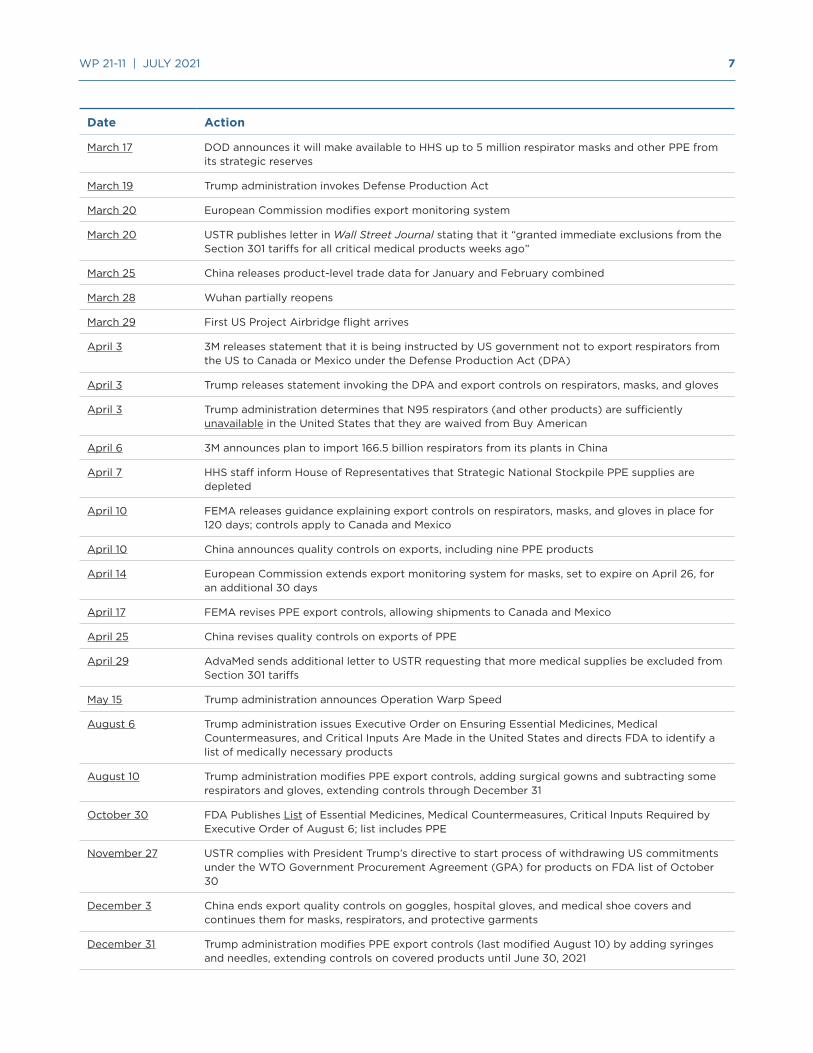
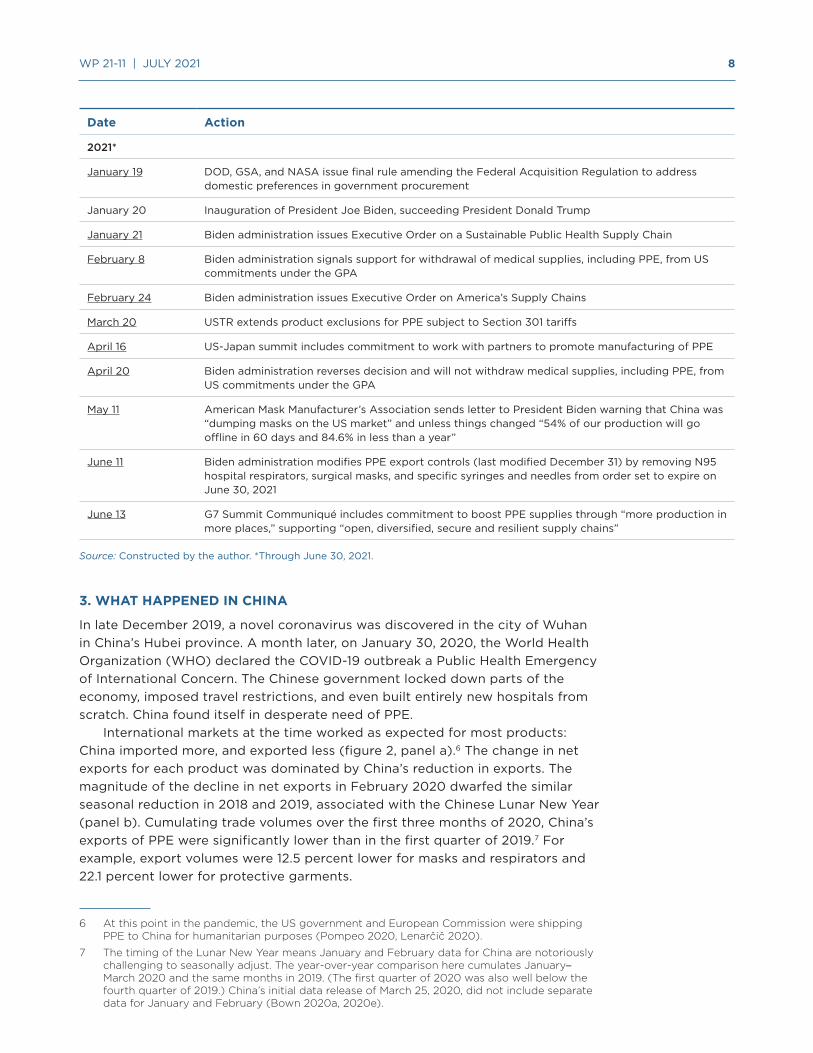
Table 1Timeline of key COVID-19-related events for personal protective equipment (PPE), 2018–21*
Date Action
2018
September 24 US imposes 10 percent Section 301 tariffs on imports from China for products (List 3), including protective garments, hospital gloves, and medical headgear
2019
June 15 US increases tariffs on all List 3 imports from China from 10 to 25 percent
September 1 US imposes 15 percent tariffs on imports from China of products (List 4A), including nitrile and sterile gloves, protective goggles, protective garments, other PPE
December 13 US announces US-China Phase One agreement
December 31 Wuhan Municipal Health Commission reports a cluster of cases of pneumonia in Wuhan; it later identifies the cases as a novel coronavirus (COVID-19)
2020
January 23 China locks down Wuhan
January 30 WHO declares COVID-19 outbreak a Public Health Emergency of International Concern
January 31 AdvaMed sends letter to USTR requesting product exclusions from Section 301 tariffs for hospital gloves, goggles, protective clothing, medical caps, other PPE
February 7 China appoints National Development and Reform Commission (NDRC), Ministry of Finance, and Ministry of Industry and Information Technology to manage PPE supply
February 7 US State Department donates PPE to China as a “testament to the generosity of the American people”
February 14 US cuts Section 301 tariffs on some PPE products (List 4A) from 15 to 7.5 percent as part of implementation of Phase One agreement
February 18 China’s NDRC provides list of key guaranteed essential materials, including PPE
February 25 HHS Secretary Alex Azar testifies before Congress, requests funding for PPE stockpile
March 2 FDA grants CDC request for Emergency Use Authorization that certain NIOSH-approved N95 respirators can be used for healthcare personnel
March 3 France requisitions domestic production of respirators for healthcare workers
March 4 Germany imposes export restrictions on masks, face shields, and other PPE
March 4 HHS announces it will procure 500 million N95 respirators for Strategic National Stockpile
March 9 DOD receives request from HHS for assistance in acquiring N95 respirators
March 10 US product exclusions announced for some protective garments, some hospital gloves, and face shields
March 15 European Commission creates EU-wide export monitoring system in attempt to get member states to lift intra-EU export bans
March 16 US product exclusions announced for some hospital gloves
March 17 US product exclusions announced for masks and respirators, goggles
7 WP 21-11 | JULY 2021
Date Action
March 17 DOD announces it will make available to HHS up to 5 million respirator masks and other PPE from its strategic reserves
March 19 Trump administration invokes Defense Production Act
March 20 European Commission modifies export monitoring system
March 20 USTR publishes letter in Wall Street Journal stating that it “granted immediate exclusions from the Section 301 tariffs for all critical medical products weeks ago”
March 25 China releases product-level trade data for January and February combined
March 28 Wuhan partially reopens
March 29 First US Project Airbridge flight arrives
April 3 3M releases statement that it is being instructed by US government not to export respirators from the US to Canada or Mexico under the Defense Production Act (DPA)
April 3 Trump releases statement invoking the DPA and export controls on respirators, masks, and gloves
April 3 Trump administration determines that N95 respirators (and other products) are sufficiently unavailable in the United States that they are waived from Buy American
April 6 3M announces plan to import 166.5 billion respirators from its plants in China
April 7 HHS staff inform House of Representatives that Strategic National Stockpile PPE supplies are depleted
April 10 FEMA releases guidance explaining export controls on respirators, masks, and gloves in place for 120 days; controls apply to Canada and Mexico
April 10 China announces quality controls on exports, including nine PPE products
April 14 European Commission extends export monitoring system for masks, set to expire on April 26, for an additional 30 days
April 17 FEMA revises PPE export controls, allowing shipments to Canada and Mexico
April 25 China revises quality controls on exports of PPE
April 29 AdvaMed sends additional letter to USTR requesting that more medical supplies be excluded from Section 301 tariffs
May 15 Trump administration announces Operation Warp Speed
August 6 Trump administration issues Executive Order on Ensuring Essential Medicines, Medical Countermeasures, and Critical Inputs Are Made in the United States and directs FDA to identify a list of medically necessary products
August 10 Trump administration modifies PPE export controls, adding surgical gowns and subtracting some respirators and gloves, extending controls through December 31
October 30 FDA Publishes List of Essential Medicines, Medical Countermeasures, Critical Inputs Required by Executive Order of August 6; list includes PPE
November 27 USTR complies with President Trump’s directive to start process of withdrawing US commitments under the WTO Government Procurement Agreement (GPA) for products on FDA list of October 30
December 3 China ends export quality controls on goggles, hospital gloves, and medical shoe covers and continues them for masks, respirators, and protective garments
December 31 Trump administration modifies PPE export controls (last modified August 10) by adding syringes and needles, extending controls on covered products until June 30, 2021
8 WP 21-11 | JULY 2021
Date Action
2021*
January 19 DOD, GSA, and NASA issue final rule amending the Federal Acquisition Regulation to address domestic preferences in government procurement
January 20 Inauguration of President Joe Biden, succeeding President Donald Trump
January 21 Biden administration issues Executive Order on a Sustainable Public Health Supply Chain
February 8 Biden administration signals support for withdrawal of medical supplies, including PPE, from US commitments under the GPA
February 24 Biden administration issues Executive Order on America’s Supply Chains
March 20 USTR extends product exclusions for PPE subject to Section 301 tariffs
April 16 US-Japan summit includes commitment to work with partners to promote manufacturing of PPE
April 20 Biden administration reverses decision and will not withdraw medical supplies, including PPE, from US commitments under the GPA
May 11 American Mask Manufacturer’s Association sends letter to President Biden warning that China was “dumping masks on the US market” and unless things changed “54% of our production will go offline in 60 days and 84.6% in less than a year”
June 11 Biden administration modifies PPE export controls (last modified December 31) by removing N95 hospital respirators, surgical masks, and specific syringes and needles from order set to expire on June 30, 2021
June 13 G7 Summit Communiqué includes commitment to boost PPE supplies through “more production in more places,” supporting “open, diversified, secure and resilient supply chains”
Source: Constructed by the author. *Through June 30, 2021.
3. WHAT HAPPENED IN CHINA
In late December 2019, a novel coronavirus was discovered in the city of Wuhan in China’s Hubei province. A month later, on January 30, 2020, the World Health Organization (WHO) declared the COVID-19 outbreak a Public Health Emergency of International Concern. The Chinese government locked down parts of the economy, imposed travel restrictions, and even built entirely new hospitals from scratch. China found itself in desperate need of PPE.
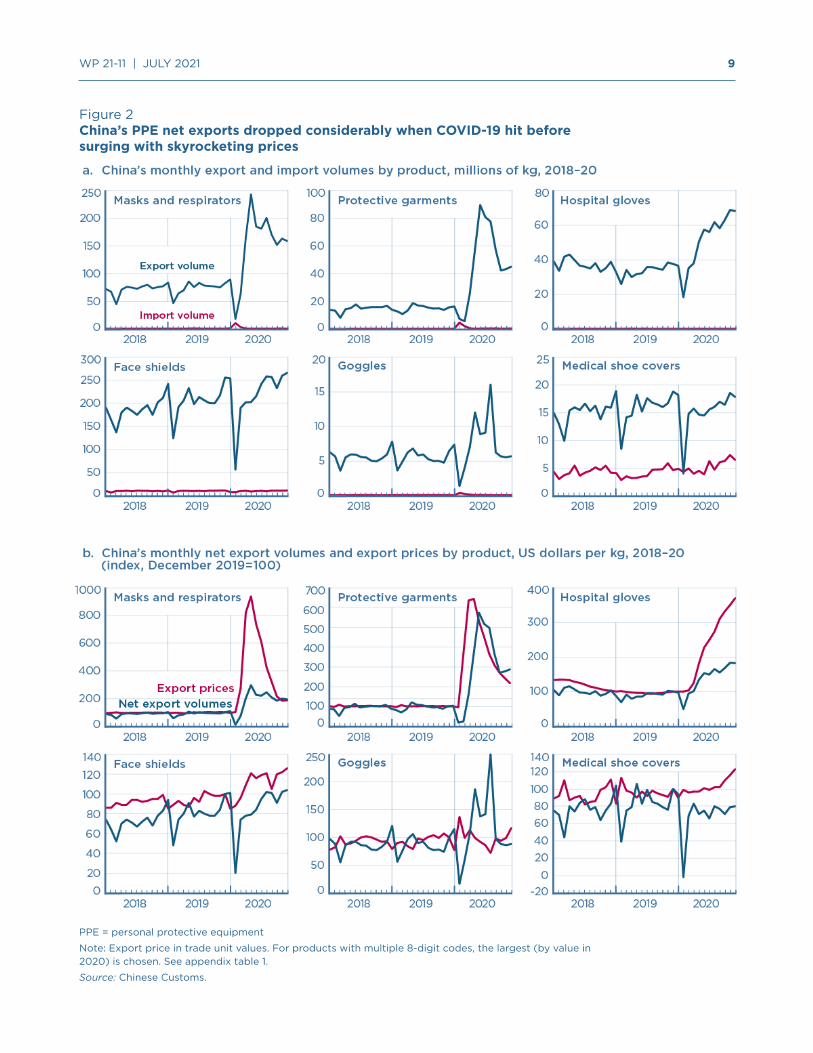
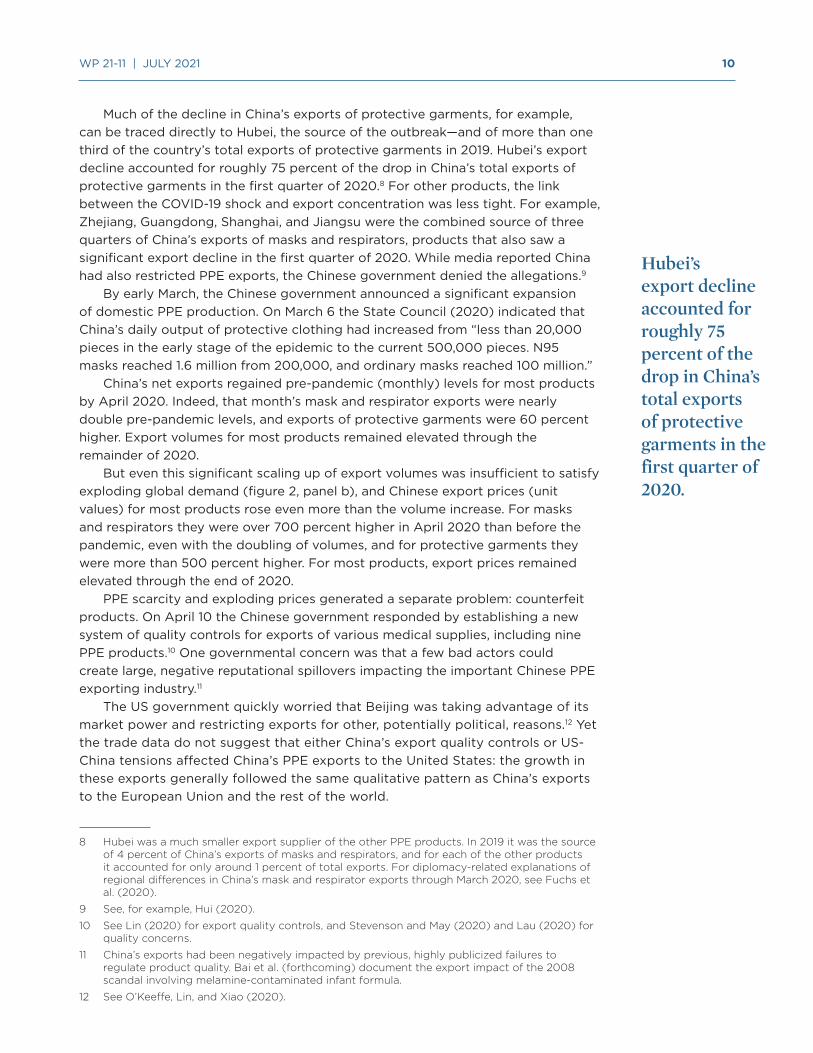
International markets at the time worked as expected for most products: China imported more, and exported less (figure 2, panel a).6 The change in net exports for each product was dominated by China’s reduction in exports. The magnitude of the decline in net exports in February 2020 dwarfed the similar seasonal reduction in 2018 and 2019, associated with the Chinese Lunar New Year (panel b). Cumulating trade volumes over the first three months of 2020, China’s exports of PPE were significantly lower than in the first quarter of 2019.7 For example, export volumes were 12.5 percent lower for masks and respirators and 22.1 percent lower for protective garments.
6 At this point in the pandemic, the US government and European Commission were shipping PPE to China for humanitarian purposes (Pompeo 2020, Lenarčič 2020).
7 The timing of the Lunar New Year means January and February data for China are notoriously challenging to seasonally adjust. The year-over-year comparison here cumulates January–March 2020 and the same months in 2019. (The first quarter of 2020 was also well below the fourth quarter of 2019.) China’s initial data release of March 25, 2020, did not include separate data for January and February (Bown 2020a, 2020e).
9 WP 21-11 | JULY 2021
Figure 2China’s PPE net exports dropped considerably when COVID-19 hit before surging with skyrocketing prices
PPE = personal protective equipment
Note: Export price in trade unit values. For products with multiple 8-digit codes, the largest (by value in 2020) is chosen. See appendix table 1.
Source: Chinese Customs.
10 WP 21-11 | JULY 2021
Much of the decline in China’s exports of protective garments, for example, can be traced directly to Hubei, the source of the outbreak—and of more than one third of the country’s total exports of protective garments in 2019. Hubei’s export decline accounted for roughly 75 percent of the drop in China’s total exports of protective garments in the first quarter of 2020.8 For other products, the link between the COVID-19 shock and export concentration was less tight. For example, Zhejiang, Guangdong, Shanghai, and Jiangsu were the combined source of three quarters of China’s exports of masks and respirators, products that also saw a significant export decline in the first quarter of 2020. While media reported China had also restricted PPE exports, the Chinese government denied the allegations.9
By early March, the Chinese government announced a significant expansion of domestic PPE production. On March 6 the State Council (2020) indicated that China’s daily output of protective clothing had increased from “less than 20,000 pieces in the early stage of the epidemic to the current 500,000 pieces. N95 masks reached 1.6 million from 200,000, and ordinary masks reached 100 million.”
China’s net exports regained pre-pandemic (monthly) levels for most products by April 2020. Indeed, that month’s mask and respirator exports were nearly double pre-pandemic levels, and exports of protective garments were 60 percent higher. Export volumes for most products remained elevated through the remainder of 2020.
But even this significant scaling up of export volumes was insufficient to satisfy exploding global demand (figure 2, panel b), and Chinese export prices (unit values) for most products rose even more than the volume increase. For masks and respirators they were over 700 percent higher in April 2020 than before the pandemic, even with the doubling of volumes, and for protective garments they were more than 500 percent higher. For most products, export prices remained elevated through the end of 2020.
PPE scarcity and exploding prices generated a separate problem: counterfeit products. On April 10 the Chinese government responded by establishing a new system of quality controls for exports of various medical supplies, including nine PPE products.10 One governmental concern was that a few bad actors could create large, negative reputational spillovers impacting the important Chinese PPE exporting industry.11
The US government quickly worried that Beijing was taking advantage of its market power and restricting exports for other, potentially political, reasons.12 Yet the trade data do not suggest that either China’s export quality controls or US-China tensions affected China’s PPE exports to the United States: the growth in these exports generally followed the same qualitative pattern as China’s exports to the European Union and the rest of the world.
8 Hubei was a much smaller export supplier of the other PPE products. In 2019 it was the source of 4 percent of China’s exports of masks and respirators, and for each of the other products it accounted for only around 1 percent of total exports. For diplomacy-related explanations of regional differences in China’s mask and respirator exports through March 2020, see Fuchs et al. (2020).
9 See, for example, Hui (2020).
10 See Lin (2020) for export quality controls, and Stevenson and May (2020) and Lau (2020) for quality concerns.
11 China’s exports had been negatively impacted by previous, highly publicized failures to regulate product quality. Bai et al. (forthcoming) document the export impact of the 2008 scandal involving melamine-contaminated infant formula.
12 See O’Keeffe, Lin, and Xiao (2020).
Hubei’s export decline accounted for roughly 75 percent of the drop in China’s total exports of protective garments in the first quarter of 2020.
11 WP 21-11 | JULY 2021
Table 2China’s exports of PPE in 2019 and 2020, by product and destination
Trade values (billions USD)
In 2019 In 2020
Product Total …to EU …to US Total …to EU …to US
Masks and respirators 5.4 1.0 2.2 53.8 17.3 14.8
Protective garments 0.9 0.3 0.4 10.8 2.6 2.7
Hospital gloves 1.0 0.1 0.5 3.9 0.6 2.0
Face shields 13.3 2.1 3.5 16.8 2.4 4.4
Goggles 1.4 0.3 0.4 1.9 0.4 0.5
Medical shoe covers 0.9 0.1 0.2 1.0 0.1 0.2
Total 22.9 3.9 7.1 88.1 23.4 24.6
Trade volumes, year-over-year percent change (volume)*
In January–March 2020 In April–December 2020 In 2020
Product Total …to EU …to US Total …to EU …to US Total …to EU …to US
Masks and respirators -12.5 -11.4 -18.3 130.0 183.1 77.9 99.1 140.4 58.0
Protective garments -22.1 -22.9 -30.6 271.7 179.4 184.4 210.0 138.3 137.6
Hospital gloves -3.0 -15.5 -5.4 68.0 171.8 59.9 51.7 120.7 46.0
Face shields -10.2 -19.3 -10.0 10.7 3.5 19.4 6.0 -2.4 12.6
Goggles -22.0 -24.5 -15.0 48.7 33.5 58.4 31.6 18.9 38.1
Medical shoe covers -10.9 -4.4 -10.7 -2.7 3.3 3.7 -4.5 1.7 0.7
Trade prices (unit values), percent changes in Chinese export price*
In April 2020 vs. December 2019
At peak in 2020 vs. December 2019
In December 2020 vs. December 2019
Product Total …to EU …to US Total …to EU …to US Total …to EU …to US
Masks and respirators 720.8 1,251.7 542.1 838.0 1,251.7 778.1 85.6 149.3 51.3
Protective garments 536.2 698.8 256.7 543.6 698.8 394.2 116.7 124.4 110.5
Hospital gloves 24.8 66.9 15.5 270.4 262.0 279.5 270.4 262.0 279.5
Face shields 9.2 18.5 5.8 26.4 32.4 22.3 26.4 27.2 19.3
Goggles 12.6 57.3 -15.1 36.7 57.3 13.0 16.8 -0.4 5.5
Medical shoe covers -3.4 -6.4 -0.3 23.3 41.5 35.4 23.3 37.9 28.3
Notes: Values defined using all HS08 codes for that product. Totals may not sum due to rounding. *Volumes and prices (unit values) rely on only the top HS08 code by value in 2020. Percent changes in volume data are year over year for the relevant period. Price changes are month over month as indicated in the table.
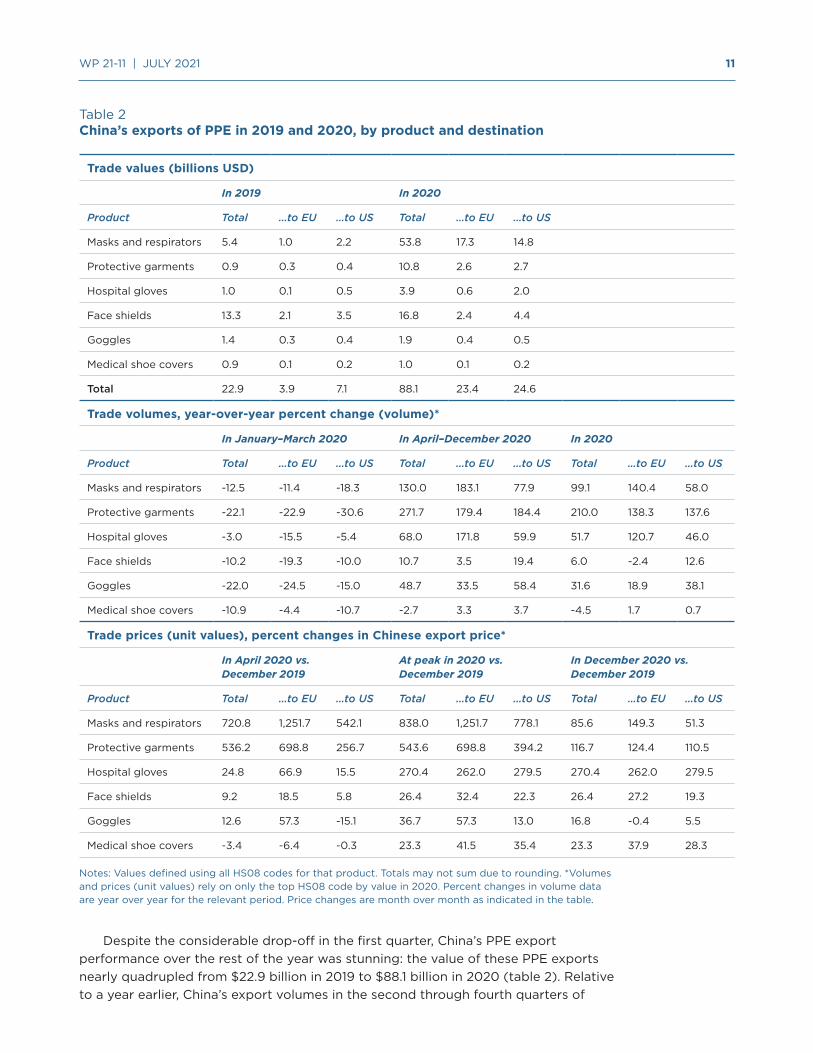
Despite the considerable drop-off in the first quarter, China’s PPE export performance over the rest of the year was stunning: the value of these PPE exports nearly quadrupled from $22.9 billion in 2019 to $88.1 billion in 2020 (table 2). Relative to a year earlier, China’s export volumes in the second through fourth quarters of
12 WP 21-11 | JULY 2021
2020 were 130 percent higher for masks and respirators and 272 percent higher for protective garments. As terrible as things were early in 2020 when China’s decline in net exports left many countries exposed, China’s increasing exports over the rest of 2020 likely helped medical workers around the world save many lives.
4. WHAT HAPPENED IN EUROPE
As the pandemic spread globally in early 2020, conditions in Europe began to deteriorate. In February Italy experienced a spike in cases; Spain and other European countries also suffered, and policymakers panicked. On March 3 France requisitioned PPE for its health workers, and on March 4 Germany banned PPE exports. The French and German curbs applied even to exports destined for other EU member states, including Italy, which went into lockdown on March 9.
The export bans were also problematic because the countries imposing them were home to some of the European Union’s largest PPE production facilities. On March 15 the European Commission stepped in with a similarly unprecedented imposition of EU-wide export controls on PPE, in an attempt to get EU member states to free up shipments with each other.13
Despite Europe’s increasing needs, China’s PPE exports to the European Union declined in the first quarter of 2020, ending up 4–25 percent lower, depending on the product, relative to the same period in 2019 (table 2). Even when China’s export volumes recovered to pre-pandemic levels starting in April, prices skyrocketed, revealing the severity of the shortage. Compared to December 2019, China’s prices of exports to the European Union in April 2020 were 1,250 percent higher for masks and respirators and 700 percent higher for protective garments.
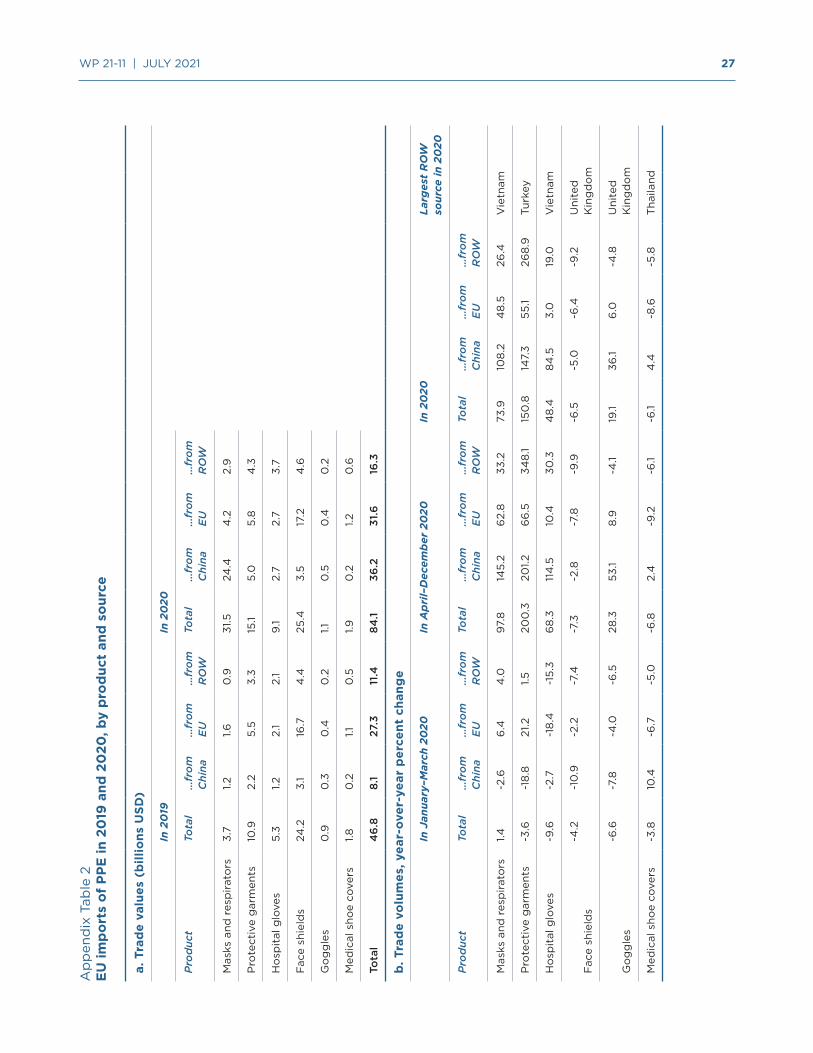
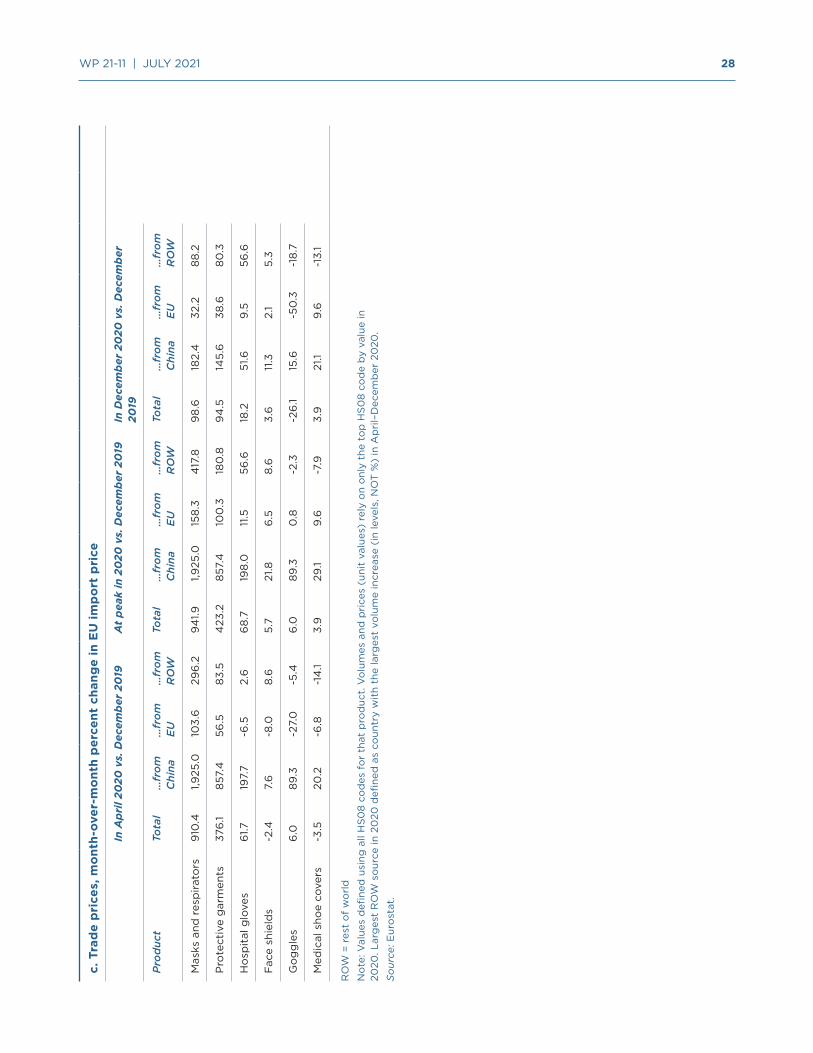
For some products, Europe was not able to substitute imports from alternative suppliers.14 For protective garments, for example, the decline in import volumes from China in the first quarter was accompanied by only a slight increase in intra-EU shipments, and imports from the rest of the world were flat. Imports of hospital gloves declined from all sources. In April imports of most products began to accel-erate, with the largest increases in imports from China, which continued over the last three quarters of 2020. EU import prices on most PPE also rose sharply, first from China and then from other sources. However, for most products, the price increase of imports from China was much higher than for imports from the rest of the world.
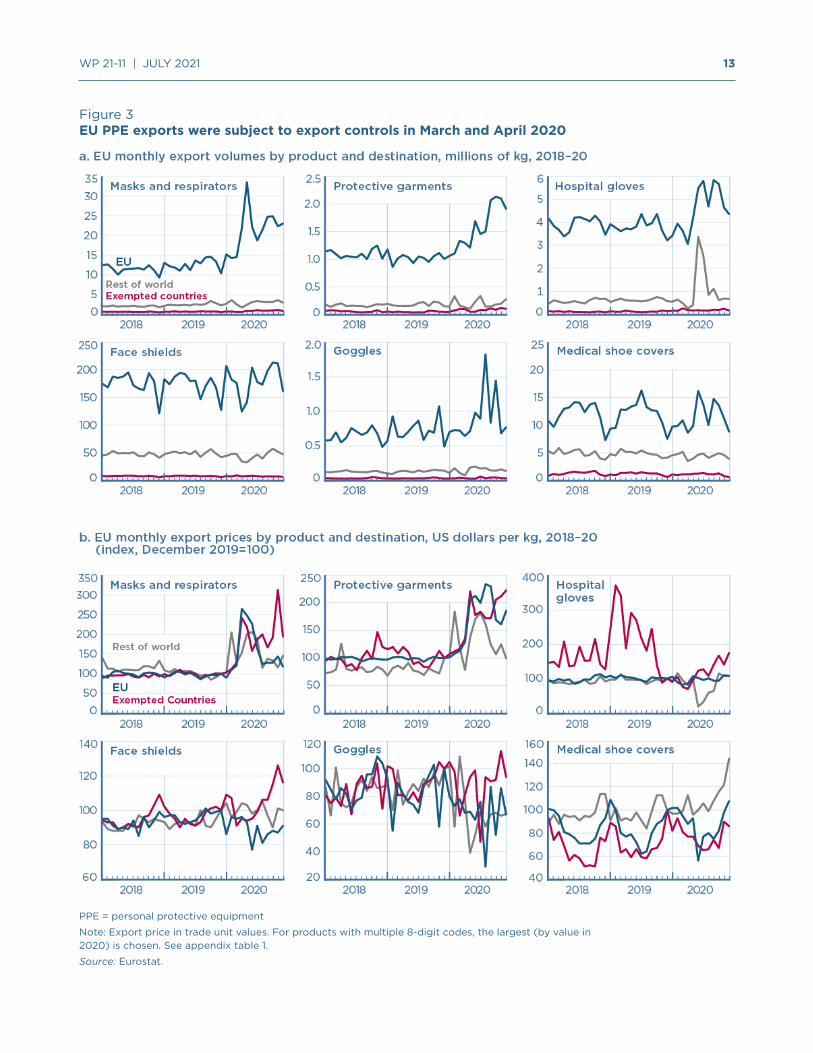
The products that the European Commission subjected to export controls on March 15 tell a mixed story. For many products, extra-EU export sales fell in March and April 2020, the period during which most of the export controls were in effect (figure 3). However, it is difficult to disentangle how much of the export reduction resulted from EU policy, since other factors were changing at the same time. Internal EU demand for PPE was increasing, imports from China had fallen, and intra-EU exports for some products (e.g., masks and respirators, protective garments) were increasing. Furthermore, domestic production may have been affected—at some points by lockdowns, at others by capacity expansion. The fact that exports did not surge after the EU export control regime expired suggests that low export volumes may not have been the result of policy but were dominated by these other factors, although it is impossible to say without more detailed production and consumption data.
13 See, for example, Keynes (2020), Bown (2020b), and European Commission (2020a,b).
14 Appendix table 2 provides more detail on EU import prices and alternative sources of imports for each product during this period.
Despite Europe’s increasing needs, China’s PPE exports to the European Union declined in the first quarter of 2020...
13 WP 21-11 | JULY 2021
Figure 3EU PPE exports were subject to export controls in March and April 2020
PPE = personal protective equipment
Note: Export price in trade unit values. For products with multiple 8-digit codes, the largest (by value in 2020) is chosen. See appendix table 1.
Source: Eurostat.
14 WP 21-11 | JULY 2021
Though the price of some EU PPE exports increased considerably (figure 3, panel b), the price increase for masks and respirators as well as protective garments was not nearly as high as for Chinese exports (see again figure 2 and table 2). This raises the question of whether the EU export monitoring system allocated PPE—in short supply globally—through a mechanism that was less responsive to price.
5. WHAT HAPPENED IN THE UNITED STATES
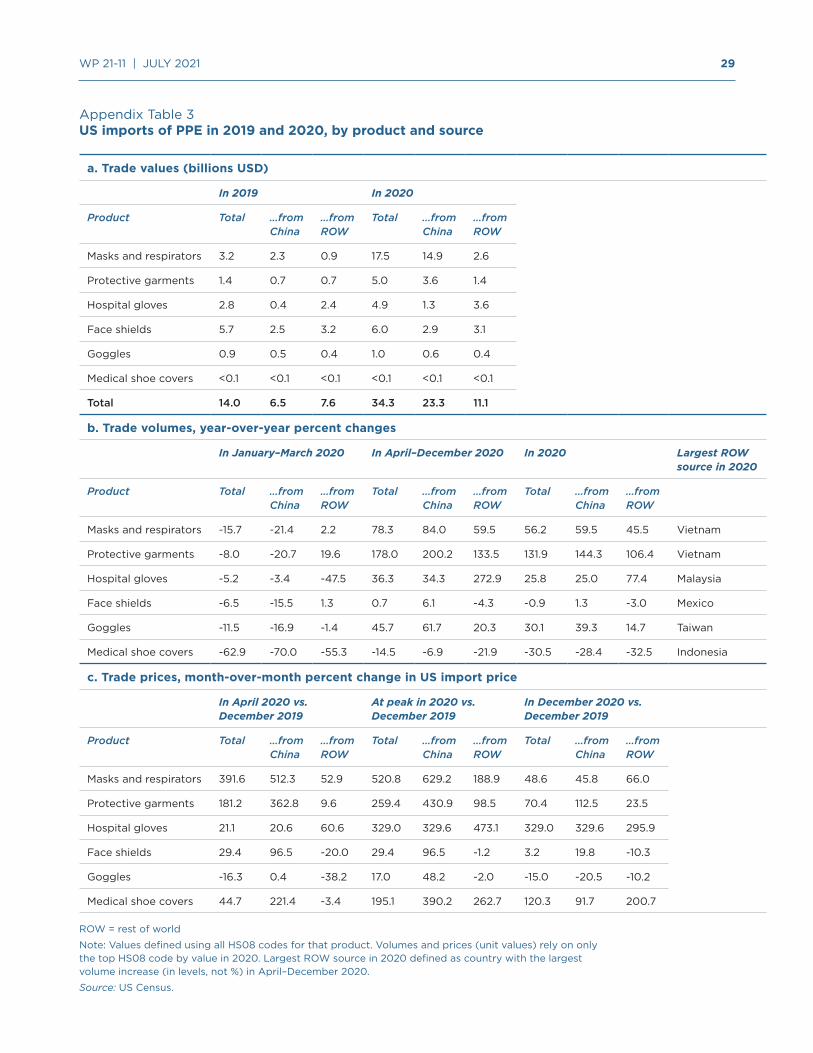
The pandemic similarly hit the United States hard, beginning most famously in New York City, which declared a state of emergency on March 12. By early April, the Strategic National Stockpile for PPE, administered by the US Department of Health and Human Services (HHS), was essentially depleted. 15 China’s exports to the United States largely mimicked the European experience, declining in the first quarter of 2020 by 5–31 percent year over year, depending on the product (table 2). The decrease in US imports from China was not accompanied by a comparable increase in imports from elsewhere.16
Chinese exports to the United States also regained pre-pandemic levels by April and then increased considerably. Chinese export prices also skyrocketed, remaining high for much of the rest of 2020, reflecting continued shortages. China was the source of most of the increase in US import volumes in the second through fourth quarters of 2020 for most products. Imports of masks and respirators, as well as hospital gloves, also began arriving in significantly increased quantities from Vietnam and Malaysia, respectively.
The volume of China’s PPE exports to the United States in 2020 was somewhat remarkable, given that the US government sent mixed messages about whether it wanted imports of Chinese medical supplies. The Federal Emergency Management Agency (FEMA) created Project AirBridge to ship planeloads of PPE directly into the United States, beginning in late March, including from China. But statements from White House official Peter Navarro and Secretary of State Mike Pompeo, as well as President Trump’s continued public references to the “Chinese virus,” threatened to imperil the bilateral relationship during much of 2020. In addition, there were the US trade war tariffs.
5.1 Section 301 tariffs and US pandemic preparedness
The US administration began a trade war with China in 2018 that ultimately resulted in new US tariffs covering $335 billion, or two thirds, of its goods imports from China. This included new tariffs on billions of dollars of imported medical equipment, despite warnings from experts that the duties could affect American preparedness for a future pandemic. When COVID-19 arrived, AdvaMed, an industry association, sent the Office of the US Trade Representative (USTR) a letter on January 31 urging removal of the trade war tariffs on desperately needed medical supplies, including PPE. The administration
15 The Strategic National Stockpile is supposed to supplement state and local medical supplies during public health emergencies, acting as a buffer when immediate supplies are insufficient (HHS 2020).
16 Appendix table 3 provides more detail on US import prices and alternative sources of imports for each product during this period.
China’s exports to the United States largely mimicked the European experience, declining in the first quarter of 2020 by 5–31 percent...
15 WP 21-11 | JULY 2021
stubbornly took many weeks to decide; for example, USTR did not grant temporary exclusions for masks and respirators until March 17.17
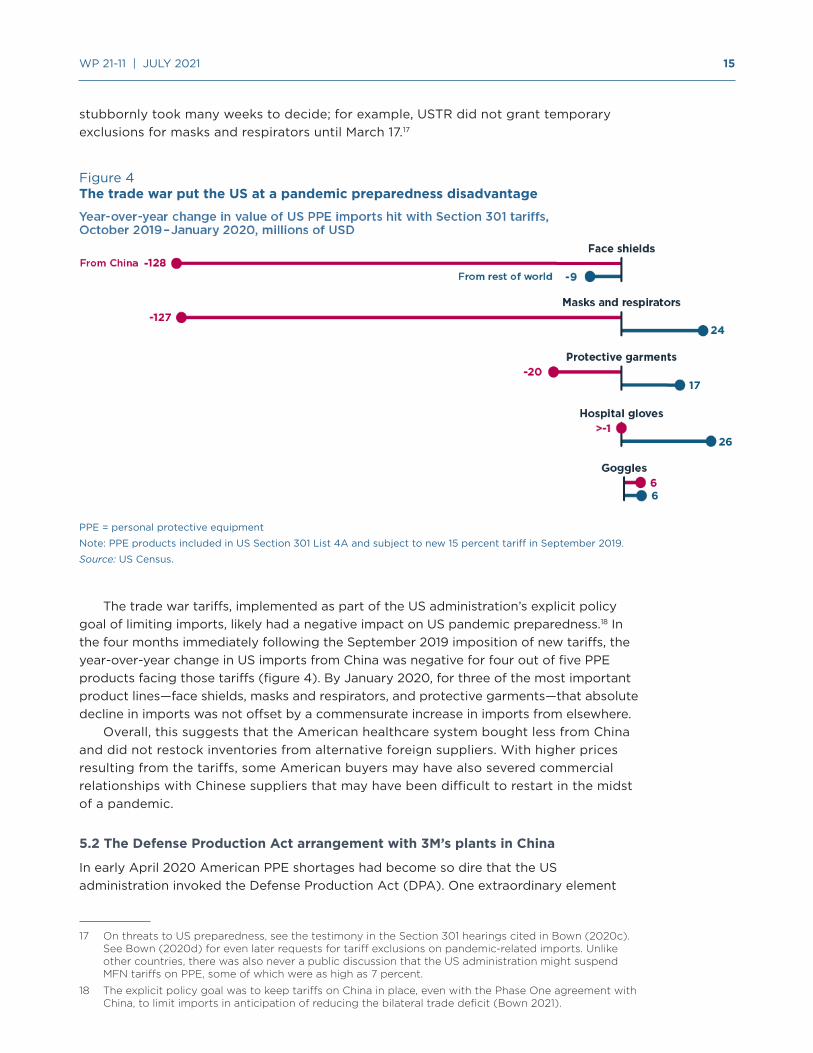
Figure 4The trade war put the US at a pandemic preparedness disadvantage
PPE = personal protective equipment
Note: PPE products included in US Section 301 List 4A and subject to new 15 percent tariff in September 2019.
Source: US Census.
The trade war tariffs, implemented as part of the US administration’s explicit policy goal of limiting imports, likely had a negative impact on US pandemic preparedness.18 In the four months immediately following the September 2019 imposition of new tariffs, the year-over-year change in US imports from China was negative for four out of five PPE products facing those tariffs (figure 4). By January 2020, for three of the most important product lines—face shields, masks and respirators, and protective garments—that absolute decline in imports was not offset by a commensurate increase in imports from elsewhere.
Overall, this suggests that the American healthcare system bought less from China and did not restock inventories from alternative foreign suppliers. With higher prices resulting from the tariffs, some American buyers may have also severed commercial relationships with Chinese suppliers that may have been difficult to restart in the midst of a pandemic.
5.2 The Defense Production Act arrangement with 3M’s plants in China
In early April 2020 American PPE shortages had become so dire that the US administration invoked the Defense Production Act (DPA). One extraordinary element
17 On threats to US preparedness, see the testimony in the Section 301 hearings cited in Bown (2020c). See Bown (2020d) for even later requests for tariff exclusions on pandemic-related imports. Unlike other countries, there was also never a public discussion that the US administration might suspend MFN tariffs on PPE, some of which were as high as 7 percent.
18 The explicit policy goal was to keep tariffs on China in place, even with the Phase One agreement with China, to limit imports in anticipation of reducing the bilateral trade deficit (Bown 2021).
16 WP 21-11 | JULY 2021
was its instruction to 3M to import 166.5 million respirators over April, May, and June from its plants in China. The US-headquartered multinational reported fulfilling the obligation by July.19
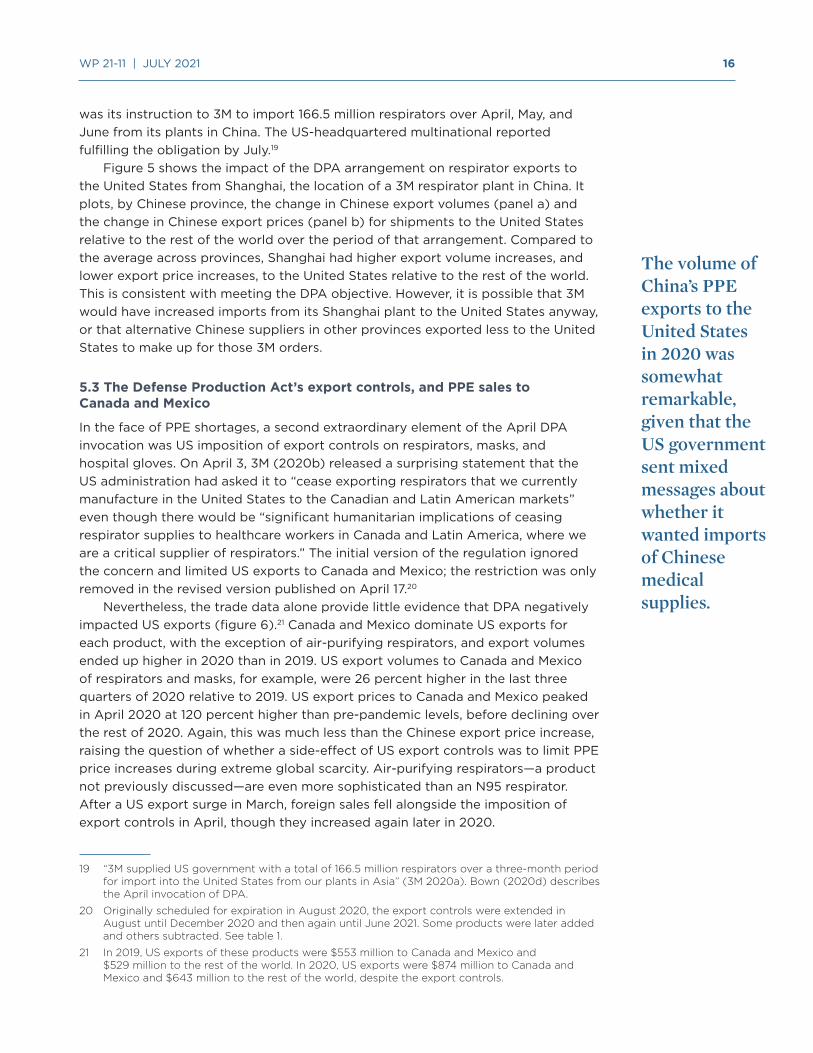
Figure 5 shows the impact of the DPA arrangement on respirator exports to the United States from Shanghai, the location of a 3M respirator plant in China. It plots, by Chinese province, the change in Chinese export volumes (panel a) and the change in Chinese export prices (panel b) for shipments to the United States relative to the rest of the world over the period of that arrangement. Compared to the average across provinces, Shanghai had higher export volume increases, and lower export price increases, to the United States relative to the rest of the world. This is consistent with meeting the DPA objective. However, it is possible that 3M would have increased imports from its Shanghai plant to the United States anyway, or that alternative Chinese suppliers in other provinces exported less to the United States to make up for those 3M orders.
5.3 The Defense Production Act’s export controls, and PPE sales to Canada and Mexico
In the face of PPE shortages, a second extraordinary element of the April DPA invocation was US imposition of export controls on respirators, masks, and hospital gloves. On April 3, 3M (2020b) released a surprising statement that the US administration had asked it to “cease exporting respirators that we currently manufacture in the United States to the Canadian and Latin American markets” even though there would be “significant humanitarian implications of ceasing respirator supplies to healthcare workers in Canada and Latin America, where we are a critical supplier of respirators.” The initial version of the regulation ignored the concern and limited US exports to Canada and Mexico; the restriction was only removed in the revised version published on April 17.20
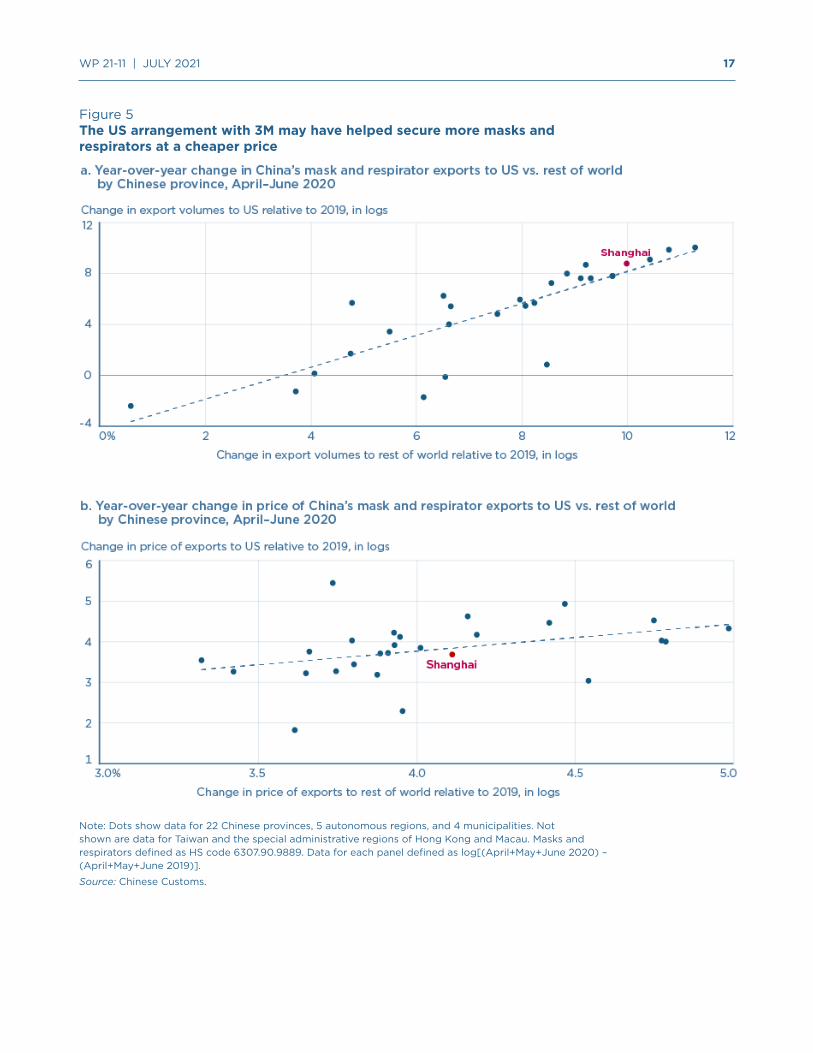
Nevertheless, the trade data alone provide little evidence that DPA negatively impacted US exports (figure 6).21 Canada and Mexico dominate US exports for each product, with the exception of air-purifying respirators, and export volumes ended up higher in 2020 than in 2019. US export volumes to Canada and Mexico of respirators and masks, for example, were 26 percent higher in the last three quarters of 2020 relative to 2019. US export prices to Canada and Mexico peaked in April 2020 at 120 percent higher than pre-pandemic levels, before declining over the rest of 2020. Again, this was much less than the Chinese export price increase, raising the question of whether a side-effect of US export controls was to limit PPE price increases during extreme global scarcity. Air-purifying respirators—a product not previously discussed—are even more sophisticated than an N95 respirator. After a US export surge in March, foreign sales fell alongside the imposition of export controls in April, though they increased again later in 2020.
19 “3M supplied US government with a total of 166.5 million respirators over a three-month period for import into the United States from our plants in Asia” (3M 2020a). Bown (2020d) describes the April invocation of DPA.
20 Originally scheduled for expiration in August 2020, the export controls were extended in August until December 2020 and then again until June 2021. Some products were later added and others subtracted. See table 1.
21 In 2019, US exports of these products were $553 million to Canada and Mexico and $529 million to the rest of the world. In 2020, US exports were $874 million to Canada and Mexico and $643 million to the rest of the world, despite the export controls.
The volume of China’s PPE exports to the United States in 2020 was somewhat remarkable, given that the US government sent mixed messages about whether it wanted imports of Chinese medical supplies.
17 WP 21-11 | JULY 2021
Figure 5The US arrangement with 3M may have helped secure more masks and respirators at a cheaper price
Note: Dots show data for 22 Chinese provinces, 5 autonomous regions, and 4 municipalities. Not shown are data for Taiwan and the special administrative regions of Hong Kong and Macau. Masks and respirators defined as HS code 6307.90.9889. Data for each panel defined as log[(April+May+June 2020) – (April+May+June 2019)].
Source: Chinese Customs.
18 WP 21-11 | JULY 2021
Figure 6US PPE exports were subject to export controls starting in April 2020
PPE = personal protective equipment
Note: Export price in trade unit values. Data for air-purifying respirators starts in July 2019.
Source: US Census.
While US exports of these products were higher overall in 2020 relative to 2019, it remains unknown how much higher they would have been without the controls. Estimating the policy’s impact must account for the likely increases in both domestic (US) demand as well as foreign import demand; these would have competing effects on US export volumes, independent of the export control policy. The capacity expansion of the US industry (described next) would also increase export volumes, ceteris paribus.
Nevertheless, Canada responded by implementing industrial policy to reduce at least some of its future PPE import dependence on the United States. In August 2020, the governments of Canada and the province of Ontario announced subsidies for a 3M plant to manufacture N95 respirators domestically (Ontario 2020).
5.4 US industrial policy in support of its domestic PPE supply chain
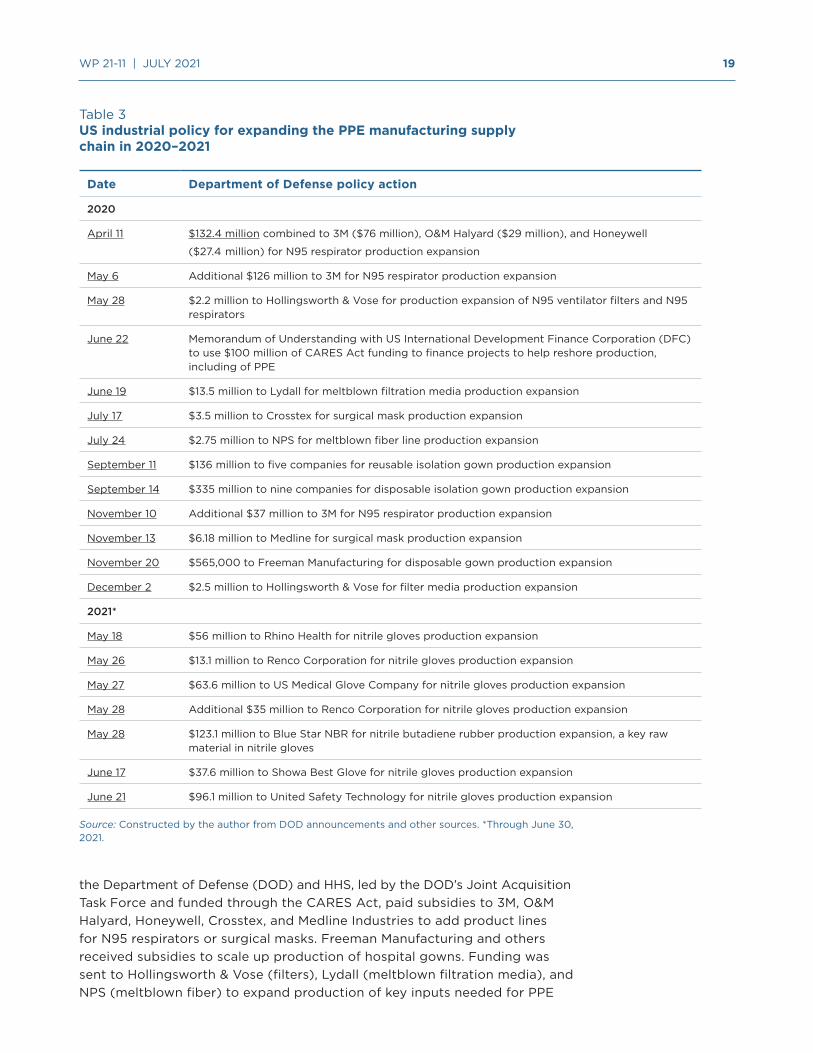
The US government eventually deployed industrial policy, in the form of $1.2 billion of subsidies over the next year, to directly expand domestic PPE production capacity. It started by subsidizing domestic facilities producing N95 respirators, beginning in mid-April 2020 (table 3). Overall, it made nearly $800 million of publicly funded investments in American PPE production capacity expansion, as well as for inputs along the PPE supply chain, in 2020. Collaboration between
19 WP 21-11 | JULY 2021
Table 3US industrial policy for expanding the PPE manufacturing supply chain in 2020–2021
Date Department of Defense policy action
2020
April 11 $132.4 million combined to 3M ($76 million), O&M Halyard ($29 million), and Honeywell
($27.4 million) for N95 respirator production expansion
May 6 Additional $126 million to 3M for N95 respirator production expansion
May 28 $2.2 million to Hollingsworth & Vose for production expansion of N95 ventilator filters and N95 respirators
June 22 Memorandum of Understanding with US International Development Finance Corporation (DFC) to use $100 million of CARES Act funding to finance projects to help reshore production, including of PPE
June 19 $13.5 million to Lydall for meltblown filtration media production expansion
July 17 $3.5 million to Crosstex for surgical mask production expansion
July 24 $2.75 million to NPS for meltblown fiber line production expansion
September 11 $136 million to five companies for reusable isolation gown production expansion
September 14 $335 million to nine companies for disposable isolation gown production expansion
November 10 Additional $37 million to 3M for N95 respirator production expansion
November 13 $6.18 million to Medline for surgical mask production expansion
November 20 $565,000 to Freeman Manufacturing for disposable gown production expansion
December 2 $2.5 million to Hollingsworth & Vose for filter media production expansion
2021*
May 18 $56 million to Rhino Health for nitrile gloves production expansion
May 26 $13.1 million to Renco Corporation for nitrile gloves production expansion
May 27 $63.6 million to US Medical Glove Company for nitrile gloves production expansion
May 28 Additional $35 million to Renco Corporation for nitrile gloves production expansion
May 28 $123.1 million to Blue Star NBR for nitrile butadiene rubber production expansion, a key raw material in nitrile gloves
June 17 $37.6 million to Showa Best Glove for nitrile gloves production expansion
June 21 $96.1 million to United Safety Technology for nitrile gloves production expansion
Source: Constructed by the author from DOD announcements and other sources. *Through June 30, 2021.
the Department of Defense (DOD) and HHS, led by the DOD’s Joint Acquisition Task Force and funded through the CARES Act, paid subsidies to 3M, O&M Halyard, Honeywell, Crosstex, and Medline Industries to add product lines for N95 respirators or surgical masks. Freeman Manufacturing and others received subsidies to scale up production of hospital gowns. Funding was sent to Hollingsworth & Vose (filters), Lydall (meltblown filtration media), and NPS (meltblown fiber) to expand production of key inputs needed for PPE
20 WP 21-11 | JULY 2021
manufacturers of those surgical masks, respirators, and hospital gowns. Then, in May and June of 2021, the US government spent over $400 million on a half dozen companies to expand capacity—including for key raw material inputs—for nitrile glove production.
Late in 2020 the Trump administration also began a series of actions to potentially withdraw PPE from US commitments under the WTO’s Government Procurement Agreement (GPA). Like import tariffs, this would force consumption of locally produced PPE—even if more costly relative to imports. After initially signaling potential support for the policy, the Biden administration reversed course in April 2021, possibly because it would have resulted in trading partner retaliation by withdrawing their own commitments under the GPA, hurting US exporters in other sectors.
In summary, the US policy actions to rebuild or expand the domestic PPE manufacturing sector were unlikely to have affected product availability until late 2020 at the earliest, with the exception of N95 respirator capacity expansion. Nevertheless, the subsidization combined with the demand shock induced entry by American firms and changed the domestic industry landscape. However, a few months into 2021 prices had normalized sufficiently that some new entrants were starting to organize to request import protection. In May, for example, the American Mask Manufacturer’s Association (2021), representing 26 small businesses, wrote to President Biden alleging that China was now “dumping masks on the US market at well below actual costs” and that if this practice continued “54% of our production will go offline in 60 days and 84.6% in less than a year.”
US pandemic policy, as well as changing economic conditions, impacted industry structure in ways that also raised important questions for future preparedness policy.
6. POLICY IMPLICATIONS
In the face of a global pandemic that created a surge in demand for PPE, an optimal policy mix for a major industrial economy should have involved three components: (1) Incentivize the domestic industry to add capacity and surge production as quickly as possible; and for the period during which surge capacity is ramping up and not yet available, rely on the combination of (2) previously stockpiled PPE and (3) imports. For the United States, COVID-19 revealed problems with all three parts of that strategy.
6.1 Production problems and policy
Why did the US government’s industrial policy response take so long?22 US government subsidies for PPE capacity expansion began to roll out only in April 2020; most were not announced until the second half of the year, and some not until mid-2021. Yet private companies saw the changing conditions earlier—3M, for example, announced capacity expansions beginning in January 2020. Even by February, other parts of the US government recognized PPE shortages —see, for example, the Congressional testimony of HHS Secretary Alex Azar.23
22 This section draws in part from interviews with John Polowczyk (Bown and Keynes 2021).
23 See CSPAN (2020).
The US government eventually deployed industrial policy, in the form of $1.2 billion of subsidies over the next year, to directly expand domestic PPE production capacity.
21 WP 21-11 | JULY 2021
One explanation is that the government lacked basic information about domestic PPE production. Policymakers cannot target subsidies for PPE manufacturing companies that can’t be found. Missing information included how much and where domestic capacity existed prior to the pandemic, how quickly production could be expanded, and what resources (and other critical inputs in the supply chain) would be needed to make that happen.
Second, for some specific products, there may have been too little domestic production capacity altogether. “You can’t surge zero,” quipped John Polowczyk, in reference to America’s apparent de minimis production of hospital gloves at the outset of the pandemic. This is plausible, but more data and analysis are needed to determine for what products that was such a constraint.
To better support policy going forward, the United States must collect and maintain up-to-date, detailed data on domestic production and capacity for PPE. The relevant industries will need to be subjected to periodic “war games” or “stress tests” to ensure that policy can incentivize a sufficiently quick expansion to surge capacity levels in a future emergency.
6.2 Stockpile problems and policy
Buyers, distributors, and governments collectively held too little inventory in reserve in case of emergency, as was made evident by the early pandemic depletion of the HHS Strategic National Stockpile. The further lack of inventory held by the private sector was, in part, likely the result of cost pressure.24 A more robust system of preparedness may require regulators to ensure that hospitals, medical distributors, and states—in addition to the federal government—maintain more inventory. Because holding inventories is costly, and profit incentives pressure that part of the supply chain to become more lean, there is a role for regulation.
A separate question involves determining the socially optimal size of stockpiles to manage and for regulators to help oversee. That determination requires detailed projections on demand as well as information on the state of domestic production capacity (as discussed above) and how quickly it can be scaled up under differing pandemic scenarios. One scenario involves a health threat concentrated in the United States: imports would be available, but immediate domestic production might not. In other scenarios, only foreign supplies are unavailable, or both—or neither—sources are available. The global and rolling COVID-19 lockdowns over 2020 and 2021 highlight the importance of geographically diversified production within the United States as well as internationally. Relying solely on domestic production would be excessively risky, as would relying on imports primarily from one source.
24 A separate problem involves how the limited PPE stockpiles (and federal acquisitions) were allocated within the United States—i.e., according to emerging public health demands (i.e., “hotpots”) versus some other formula, such as the share of the national population. While unaddressed here, see HCOR (2020).
To better support policy going forward, the United States must collect and maintain up-to-date, detailed data on domestic production and capacity for PPE.
22 WP 21-11 | JULY 2021
6.3 Import problems and policy
Imports were a critical source of PPE during COVID-19, and should arguably remain an important component of future supply diversification. At the same time, although more data and detailed analysis are needed, imports may have contributed to multiple problems that emerged during the pandemic.
While PPE imports from China over the latter part of 2020 undoubtedly saved American lives, the lack of available imports in February and March likely cost lives. The problem might be characterized as a perfect storm of events. The pandemic arose in Hubei, the largest exporting province in the largest exporting country of the protective garments needed globally by hospital workers. The fact that those Chinese supplies were taken off the global market just when the rest of the world needed them shows that excessive concentration of production is a legitimate worry for American—and global—public health preparedness.
The United States and its trading partners must have a more diversified portfolio of foreign production for PPE. Achieving that objective may require new policy incentives—and forms of international coordination—if strong economic forces of agglomeration work to concentrate production geographically or in favor of the status quo.
Perhaps more so for the United States than other countries, international diversification must be a priority. Trade can be a tool for preparedness only if there is trust between the importer and the exporter—i.e., confidence that when times get tough for health or economic reasons, trade lanes will remain open. There is now precious little trust between the United States and China as geopolitical tensions between the two countries remain elevated.
For certain products, imports over the years may have also contributed to insufficient domestic production to enable the government to surge capacity expansion during an emergency. A permanent policy intervention may be needed if optimal pandemic responsiveness requires a larger minimum domestic industry size than would be sustainable under normal market conditions and free trade, due to a positive externality. Policymakers will find tariffs attractive—and tariffs may emerge if better policies are not developed. (A group like the American Mask Manufacturer’s Association, for example, could petition bureaucrats to impose antidumping duties.) However, while import protection does help stimulate domestic production, it also raises prices for consumers (e.g., in the healthcare system, which is already costly in the United States and many other countries). A more efficient policy to target an externality and achieve a sufficient minimal level of domestic production would be a subsidy.
Overall, the United States should ensure a diverse portfolio of imports of PPE for pandemic preparedness. Foreign sources of production must be transparent and, ideally, imports should come from countries with which the United States has a relationship of trust, to be sure that the source country will share supplies when times are challenging. The pandemic revealed that not many countries always fit the transparency and trust criteria, including the United States.
Because holding inventories is costly, and profit incentives pressure that part of the supply chain to become more lean, there is a role for regulation.
23 WP 21-11 | JULY 2021
7. CONCLUSION AND INTERNATIONAL POLICY COOPERATION
The PPE shortages and use of extraordinary trade and industrial policy during the COVID-19 pandemic revealed significant failures in preparedness. Trade played a mixed role.
The experience has triggered considerable rethinking of international cooperation for trade in such medical supplies. Indeed, the new US president’s early 2021 meetings with leaders from Japan and the Group of Seven (G7) countries led to joint statements and communiqués prioritizing PPE supply chain resilience as well as greater geographic diversification of production. Achieving those objectives will require different incentives and forms of international trade policy cooperation than were in place before the pandemic.
A new framework is also needed to define the proactive international policy coordination required at the first signs of the next emergency. A cooperative response of countries jointly and transparently triggering surge production capacity for PPE would do much to prevent a repeat of 2020—waiting too long, followed by knee-jerk export restrictions.
Finally, the analysis here has focused on major economies with the capacity to push for and sustain domestic PPE industries. That will not be a feasible strategy for many smaller countries with markets that cannot achieve viable economies of scale. For them, challenges in trade and stockpile management will persist. Yet even these countries can learn important lessons from the US experience, including the need for visibility in trading partners’ domestic production capacity and export product availability. Transparency is essential for any country seeking to maintain preparedness for public health emergencies.
REFERENCES
Abaluck, Jason, Judith Chevalier, Nicholas A. Christakis, Howard Forman, Edward H. Kaplan, Albert Ko, and Sten H. Vermund. 2020. The Case for Universal Cloth Mask Adoption and Policies to Increase Supply of Medical Masks for Health Workers. Yale University Working Paper, April 1.
American Mask Manufacturer’s Association. 2021. The majority of U.S. Mask Manufacturing will go offline in 60 days; 2,647 jobs already lost. Letter to President Joe Biden, May 11.
Bai, Jie, Ludovica Gazze, and Yukun Wang. 2021. Collective Reputation in Trade: Evidence from the Chinese Dairy Industry. The Review of Economics and Statistics, forthcoming.
Baldwin, Richard, and Simon Evenett, eds. 2020. COVID-19 and Trade Policy: Why Turning Inward Won’t Work. London: CEPR Press.
Bown, Chad P. 2021. The US-China Trade War and Phase One Agreement. Journal of Policy Modeling, forthcoming.
Bown, Chad P. 2020a. COVID-19: China’s exports of medical supplies provide a ray of hope. PIIE Trade and Investment Policy Watch, March 26.
Bown, Chad P. 2020b. EU limits on medical gear exports put poor countries and Europeans at risk. PIIE Trade and Investment Policy Watch, March 19.
Bown, Chad P. 2020c. Trump’s trade policy is hampering the US fight against COVID-19. PIIE Trade and Investment Policy Watch, March 13.
Bown, Chad P. 2020d. COVID-19: Trump’s curbs on exports of medical gear put Americans and others at risk. PIIE Trade and Investment Policy Watch, April 9.
Overall, the United States should ensure a diverse portfolio of imports of PPE for pandemic preparedness.
24 WP 21-11 | JULY 2021
Bown, Chad P. 2020e. China should export more medical gear to battle COVID-19. PIIE Trade and Investment Policy Watch, May 5.
Bown, Chad P., and Soumaya Keynes. 2021. How America responded to its PPE shortage. Trade Talks, Podcast episode, forthcoming.
Chinese Customs. 2020. Announcement No. 53 (2020) of the General Administration of Customs. April 10.
CSPAN. 2020. Health and Human Services Fiscal Year 2021 Budget Request. Washington, February 25.
Espitia, Alvaro, Nadia Rocha, and Michele Ruta. 2020. A pandemic trade deal: Trade and policy cooperation on medical goods. In Revitalising Multilateralism: Pragmatic Ideas for the New WTO Director-General (189-201), ed. Richard E. Baldwin and Simon J. Evenett. London: CEPR Press.
European Commission. 2020a. Commission Implementing Regulation (EU) 2020/402 of 14 March 2020 making the exportation of certain products subject to the production of an export authorization, Official Journal of the European Union, L 077I, March 15. Brussels.
European Commission. 2020b. Commission publishes guidance on export requirements for personal protective equipment, March 20. Brussels.
Evenett, Simon. 2020. Chinese whispers: COVID-19, global supply chains in essential goods, and public policy. Journal of International Business Policy 3, no. 3: 408–29.
Evenett, Simon, Matteo Fiorini, Johannes Fritz, Bernard Hoekman, Piotr Lukaszuk, Nadia Rocha, Michele Ruta, Filippo Santi, and Anirudh Shingal. 2021. Trade Policy Responses to the COVID-19 pandemic crisis: Evidence from a New Dataset. The World Economy, forthcoming.
Fuchs, Andreas, Lennart Kaplan, Krisztina Kis-Katos, Sebastian S. Schmidt, Felix Turbanisch, and Feicheng Wang. 2020. Mask Wars: China’s Exports of Medical Goods in Times of COVID-19. Covid Economics, Issue 42, August 19. London: Centre for Economic Policy Research.
Gereffi, Gary. 2020. What does the COVID-19 pandemic teach us about global value chains? The case of medical supplies. Journal of International Business Policy 3, no. 3: 287–301.
HCOR (House Committee on Oversight and Reform). 2020. New Document Shows Inadequate Distribution of Personal Protective Equipment and Critical Medical Supplies to States. Press Release, April 8, Washington.
HHS (US Department of Health and Human Services). 2020. Strategic National Stockpile, Washington.
Hoekman, Bernard, Matteo Fiorini, and Aydin Yildirim. 2020. COVID-19: Export controls and international cooperation. In COVID-19 and Trade Policy: Why Turning Inward Won’t Work, ed. Richard Baldwin and Simon Evenett. London: CEPR Press.
Honeywell. 2020. Honeywell Expands Face Mask Production in Europe with New Manufacturing Line in the United Kingdom. Press release, May 13.
Hui, Wang. 2020. China denies banning export of face masks. CGTN, March 5.
Leibovici, Fernando, and Ana Maria Santacreu. 2020. International Trade of Essential Goods During a Pandemic. Federal Reserve Bank of St. Louis Working Paper 2020-010, May.
Lenarčič, Janez. 2020. Statement by Commissioner for Crisis Management on EU support to China for the Coronavirus outbreak. February 1.
Lin, Liza. 2020. China Tightens Customs Checks for Medical Equipment Exports. Wall Street Journal, April 10.
25 WP 21-11 | JULY 2021
Keynes, Soumaya. 2020. New trade barriers could hamper the supply of masks and medicines. The Economist, March 11.
Lau, Stuart. 2020. Netherlands recalls 600,000 face masks from China due to low quality. South China Morning Post, March 29.
Miroudot, Sébastien. 2020. Resilience versus robustness in global value chains: Some policy implications. In COVID-19 and Trade Policy: Why Turning Inward Won’t Work, ed. Richard Baldwin and Simon Evenett. London: CEPR Press.
O’Keeffe, Kate, Liza Lin, and Eva Xiao. 2020. China’s Export Restrictions Strand Medical Goods US Needs to Fight Coronavirus, State Department Says. Wall Street Journal, April 16.
Ontario. 2020. Ontario Partners with Federal Government and 3M Canada on New N95 Respirator Manufacturing Facility. News release, Office of the Premier, August 21.
Pompeo, Michael R. 2020. The United States Announces Assistance to Combat the Novel Coronavirus. Press statement, Secretary of State, February 7.
State Council. 2020. The State Council Information Office held a press conference on the progress of the prevention, control and treatment of the new crown pneumonia epidemic, March 6. Beijing.
Stevenson, Alexandra, and Tiffany May. 2020. China Pushes to Churn Out Coronavirus Gear, but Struggles to Police It. New York Times, March 27.
3M. 2020a. Explore the steps we have taken to support the world’s response to the COVID-19 pandemic. Entry for July 2020.
3M. 2020b. 3M Response to Defense Production Act Order. Press release, April 3.
USITC (United States International Trade Commission). 2020. COVID-19 Related Goods: The U.S. Industry, Market, Trade, and Supply Chain Challenges. Publication Number: 5145, Investigation Number: 332-580, December. Washington.
26 WP 21-11 | JULY 2021
APPENDIX
Appendix Table 1Personal protective equipment and HS product codes
Product HS06 China EU US (imports) US (exports)
Masks and respirators 630790 63079000 63079098 6307909889 (before Jul 2020); 6307989845, 6307909850, 6307909870, 6307909875, 6307909891 (after July 2020)
6307909995
Protective garments 621010 62101030 40159000, 61130010, 61130090, 61142000, 61143000, 61149000, 62101010, 62101092, 62101098, 62102000, 62103000, 62104000, 62105000, 62113210, 62113290, 62113310, 62113390, 62113900, 62114210, 62114290, 62114310, 62114390, 62114900
401590005062101050006307906090630790680063079072006307908910
4015900000621010000063079065006307908910
Hospital gloves 392620 39262011 39262000, 40151100, 40151900, 61161020, 61161080, 62160000
392620101040151101104015110150401519051040151905504015191010
3926201010401511010040151101004015190002
Face shields 392690 39269090 39269092, 39269097 (before Jan 2020); 39269097 (after Jan 2020)
3926909990 (before Jul 2020); 3926909950, 3926909985 (after July 2020)
3926909988
Goggles 900490 90049090 90049010, 90049090 9004900000 9004900000
Medical shoe covers 401699 40169990 40169997 4818500000 (before Jul 2020); 4818500020, 4818500080 (after July 2020)
4818500000
Other
Air-purifying respirators
902000 90200000 90200000 90200060009020009000
9020008000
Hospital gowns 481850 48185000 48185000 4818500000 4818500000
Surgical gowns 611300 61130000 61130010 6113001012 6113000012
Patient gowns 621010 62101030* 62101092* 6210109010 6210100000
Reusable masks 630790 63079000* 63079098* 6307909870* 6307909995
Hair nets 650500 65051000 65051000 6505000100 6505000100
Note: For products with multiple codes, bold denotes the largest 8-digit code in 2020 by value, used to examine changes over time in volumes and unit values. The exception is the EU’s code for hospital gloves (39262000).
*included in code for another product.
Sources: Compiled by the author from multiple sources, including USITC (2020), Chinese Customs (2020), and European Commission (2020a).
27 WP 21-11 | JULY 2021
Ap
pen
dix
Tab
le 2
EU
imp
ort
s o
f P
PE
in 2
019
and
20
20, b
y p
rod
uct
and
so
urce
a. T
rad
e va
lues
(b
illio
ns U
SD)
In 2
019
In 2
020
Pro
duc
tTo
tal
…fr
om
C
hina
…fr
om
E
U…
fro
m
RO
WTo
tal
…fr
om
C
hina
…fr
om
E
U…
fro
m
RO
W
Mas
ks a
nd r
esp
irat
ors
3.7
1.21.6
0.9
31.5
24.4
4.2
2.9
Pro
tect
ive
gar
men
ts10
.92.
25.
53.
315
.15.
05.
84
.3
Ho
spit
al g
love
s5.
31.2
2.1
2.1
9.1
2.7
2.7
3.7
Fac
e sh
ield
s24
.23.
116
.74
.425
.43.
517
.24
.6
Go
gg
les
0.9
0.3
0.4
0.2
1.10
.50
.40
.2
Med
ical
sho
e co
vers
1.80
.21.1
0.5
1.90
.21.2
0.6
Tota
l4
6.8
8.1
27.3
11.4
84.1
36.2
31.6
16.3
b. T
rad
e vo
lum
es, y
ear-
over
-yea
r p
erce
nt c
hang
e
In J
anua
ry–M
arch
20
20In
Ap
ril–
Dec
emb
er 2
020
In 2
020
Larg
est
RO
W
sour
ce in
20
20
Pro
duc
tTo
tal
…fr
om
C
hina
…fr
om
E
U…
fro
m
RO
WTo
tal
…fr
om
C
hina
…fr
om
E
U…
fro
m
RO
WTo
tal
…fr
om
C
hina
…fr
om
E
U…
fro
m
RO
W
Mas
ks a
nd r
esp
irat
ors
1.4-2
.66
.44
.09
7.8
145.
26
2.8
33.2
73.9
108
.24
8.5
26.4
Vie
tnam
Pro
tect
ive
gar
men
ts-3
.6-1
8.8
21.2
1.520
0.3
201.2
66
.534
8.1
150
.814
7.3
55.1
268
.9Tu
rkey
Ho
spit
al g
love
s-9
.6-2
.7-1
8.4
-15.
36
8.3
114
.510
.430
.34
8.4
84
.53.
019
.0V
ietn
am
Fac
e sh
ield
s-4
.2-1
0.9
-2.2
-7.4
-7.3
-2.8
-7.8
-9.9
-6.5
-5.0
-6.4
-9.2
Uni
ted
K
ing
do
m
Go
gg
les
-6.6
-7.8
-4.0
-6.5
28.3
53.1
8.9
-4.1
19.1
36.1
6.0
-4.8
Uni
ted
K
ing
do
m
Med
ical
sho
e co
vers
-3.8
10.4
-6.7
-5.0
-6.8
2.4
-9.2
-6.1
-6.1
4.4
-8.6
-5.8
Tha
iland
28 WP 21-11 | JULY 2021
c. T
rad
e p
rice
s, m
ont
h-ov
er-m
ont
h p
erce
nt c
hang
e in
EU
imp
ort
pri
ce
In A
pri
l 20
20 v
s. D
ecem
ber
20
19A
t p
eak
in 2
020
vs.
Dec
emb
er 2
019
In D
ecem
ber
20
20 v
s. D
ecem
ber
20
19
Pro
duc
tTo
tal
…fr
om
C
hina
…fr
om
E
U…
fro
m
RO
WTo
tal
…fr
om
C
hina
…fr
om
E
U…
fro
m
RO
WTo
tal
…fr
om
C
hina
…fr
om
E
U…
fro
m
RO
W
Mas
ks a
nd r
esp
irat
ors
910
.41,9
25.0
103.
629
6.2
94
1.91,9
25.0
158
.34
17.8
98
.618
2.4
32.2
88
.2
Pro
tect
ive
gar
men
ts37
6.1
857
.456
.58
3.5
423
.28
57.4
100
.318
0.8
94
.514
5.6
38.6
80
.3
Ho
spit
al g
love
s6
1.719
7.7
-6.5
2.6
68
.719
8.0
11.5
56.6
18.2
51.6
9.5
56.6
Fac
e sh
ield
s-2
.47.
6-8
.08
.65.
721
.86
.58
.63.
611
.32.
15.
3
Go
gg
les
6.0
89
.3-2
7.0
-5.4
6.0
89
.30
.8-2
.3-2
6.1
15.6
-50
.3-1
8.7
Med
ical
sho
e co
vers
-3.5
20.2
-6.8
-14
.13.
929
.19
.6-7
.93.
921
.19
.6-1
3.1
RO
W =
res
t o
f w
orl
d
No
te: V
alue
s d
efin
ed u
sing
all
HS
08
co
des
fo
r th
at p
rod
uct.
Vo
lum
es a
nd p
rice
s (u
nit
valu
es)
rely
on
onl
y th
e to
p H
S0
8 c
od
e b
y va
lue
in
2020
. Lar
ges
t R
OW
so
urce
in 2
020
def
ined
as
coun
try
wit
h th
e la
rges
t vo
lum
e in
crea
se (
in le
vels
, NO
T %
) in
Ap
ril–
Dec
emb
er 2
020
.
So
urce
: Eur
ost
at.
29 WP 21-11 | JULY 2021
Appendix Table 3US imports of PPE in 2019 and 2020, by product and source
a. Trade values (billions USD)
In 2019 In 2020
Product Total …from China
…from ROW
Total …from China
…from ROW
Masks and respirators 3.2 2.3 0.9 17.5 14.9 2.6
Protective garments 1.4 0.7 0.7 5.0 3.6 1.4
Hospital gloves 2.8 0.4 2.4 4.9 1.3 3.6
Face shields 5.7 2.5 3.2 6.0 2.9 3.1
Goggles 0.9 0.5 0.4 1.0 0.6 0.4
Medical shoe covers <0.1 <0.1 <0.1 <0.1 <0.1 <0.1
Total 14.0 6.5 7.6 34.3 23.3 11.1
b. Trade volumes, year-over-year percent changes
In January–March 2020 In April–December 2020 In 2020 Largest ROW source in 2020
Product Total …from China
…from ROW
Total …from China
…from ROW
Total …from China
…from ROW
Masks and respirators -15.7 -21.4 2.2 78.3 84.0 59.5 56.2 59.5 45.5 Vietnam
Protective garments -8.0 -20.7 19.6 178.0 200.2 133.5 131.9 144.3 106.4 Vietnam
Hospital gloves -5.2 -3.4 -47.5 36.3 34.3 272.9 25.8 25.0 77.4 Malaysia
Face shields -6.5 -15.5 1.3 0.7 6.1 -4.3 -0.9 1.3 -3.0 Mexico
Goggles -11.5 -16.9 -1.4 45.7 61.7 20.3 30.1 39.3 14.7 Taiwan
Medical shoe covers -62.9 -70.0 -55.3 -14.5 -6.9 -21.9 -30.5 -28.4 -32.5 Indonesia
c. Trade prices, month-over-month percent change in US import price
In April 2020 vs. December 2019
At peak in 2020 vs. December 2019
In December 2020 vs. December 2019
Product Total …from China
…from ROW
Total …from China
…from ROW
Total …from China
…from ROW
Masks and respirators 391.6 512.3 52.9 520.8 629.2 188.9 48.6 45.8 66.0
Protective garments 181.2 362.8 9.6 259.4 430.9 98.5 70.4 112.5 23.5
Hospital gloves 21.1 20.6 60.6 329.0 329.6 473.1 329.0 329.6 295.9
Face shields 29.4 96.5 -20.0 29.4 96.5 -1.2 3.2 19.8 -10.3
Goggles -16.3 0.4 -38.2 17.0 48.2 -2.0 -15.0 -20.5 -10.2
Medical shoe covers 44.7 221.4 -3.4 195.1 390.2 262.7 120.3 91.7 200.7
ROW = rest of world
Note: Values defined using all HS08 codes for that product. Volumes and prices (unit values) rely on only the top HS08 code by value in 2020. Largest ROW source in 2020 defined as country with the largest volume increase (in levels, not %) in April–December 2020.
Source: US Census.
© 2021 Peterson Institute for International Economics. All rights reserved.
This publication has been subjected to a prepublication peer review intended to ensure analytical quality. The views expressed are those of the author. This publication is part of the overall program of the Peterson Institute for International Economics, as endorsed by its Board of Directors, but it does not necessarily reflect the views of individual members of the Board or of the Institute’s staff or management.
The Peterson Institute for International Economics is a private nonpartisan, nonprofit institution for rigorous, intellectually open, and indepth study and discussion of international economic policy. Its purpose is to identify and analyze important issues to make globalization beneficial and sustainable for the people of the United States and the world, and then to develop and communicate practical new approaches for dealing with them. Its work is funded by a highly diverse group of philanthropic foundations, private corporations, and interested individuals, as well as income on its capital fund. About 35 percent of the Institute’s resources in its latest fiscal year were provided by contributors from outside the United States.
A list of all financial supporters is posted at https://piie.com/sites/default/files/supporters.pdf.