Embed Size (px)
Citation preview
Advances in Geotechnical Engineering, THE SKEMPTON CONFERENCE (ICE), Mar. 2004, Thomas Telford, London, Vol. 2, pp. 881-897. Reappraising historical coincidences that radically misled slope destabilization analyses of homogeneous earth dams V.F.B. de Mello*, E.S. Larocca, R. Quintanilha and E.de B. Meireles Gist of the message Failure and limit equilibrium are obviously the primordial concern: but problems in the desired comparisons arise from all quarters in the case of destabilizations of upstream (US) slopes of earth dams. All Prediction vs. Performance Challenges, basic to professional practice, assume that data are reasonably unquestionable, the project clearly defined, and the end-purpose of avoiding failure established and checkable: the comparisons arise within the intermediate steps of hypotheses and computations. In the present case, in order to establish the strength equation, authoritatively confirmed as Mohr-Coulomb by Bishop (1966, 1971) [5, 6], resort was made to strain-control tests, whereas it is known that in many conditions, among the worst, beyond a certain shear stress the behaviour becomes stress-controlled. Flownets can be accepted as adequately definable, under statistics of averages: they can also be maximized, in accordance with good professional practice. The principal problem is that the mental model of the end-purpose, avoidance of failure under reservoir depletions, was defined unrealistically, and as such persists because of the impossibility of checking performance under such conditions. The historic critical condition was imagined to be one of (instantaneous) Rapid Draw Down (RDD) to full depth: this is unrealistic, of small hazard, and negligible risk. Moreover, the historic milestone set by Bishop’s Thesis (1952) [1], and his subsequent widely accepted and respected SIMPLIFIED METHOD of “The use of the slip circle in the stability analysis of slopes” (1955) [2] neglected to position and emphasize the filter-drainage (really a short Down Stream (DS) horizontal base layer). Further, Bishop’s theoretical approach neglected the influence of pore pressure vectors set up by seepage. As a result the behavioural differences between seepage and compressibility pore pressures became confusingly superposed. Truly typical operational conditions make the repetitive partial SLOW Draw Down (SDD) the really unfavourable slope destabilizing case. The coincidences of erstwhile lack of computational power (though rapidly and exponentially improved) and the lack of re-examination of the starting pragmatic posit (Terzaghi 1936) [26] have sequentially passed along, from partnership to partnership, some dominant “corrupted genes” in earth dam US slope stability calculations. Introduction Prediction vs. Performance challenges in geotechnical engineering have exposed surprising errors, often systemic, and inevitably also erratic. Failures of real dams also have continued to occur, although with some noticeable changes in the respective statistics of causes and types. However dismaying all such surprises may be, it has been emphasized [9] that civil- * Principal, and participating Engineers of VICTOR F. B. DE MELLO & ASSOCIATES, S/C Ltd., Civil-Geotechnical Consultants, Sao Paulo, Brazil.

De Mello, Page 2
RANDOM
* ADDED DETAILS TRIAL CRITICAL
SLIDING STRETCHES
A - UNAFFECTED BY MAX. FLOWNET
B - UPLIFT ELIMINATED
A
B
*
geotechnical engineering does not pursue and acquire experience at predicting exactly what performance is to be confirmed, but rather the professional aim of predicting REASONABLY what should not be allowed to happen. This second posture, typical of professional practice, leads to the priority obligation of minimizing HAZARDS (probabilities of the event) of FAILURES, though really bound to minimizing the RISKS (compounded probabilities of the destructive consequences of the given HAZARD). The paradigm of geotechnical projects enticing serious reflection is the “homogeneous compacted earth dam” even when idealized as liberated from all foundation, geomorphological and geostructural variables [9]. It is of course essential to recognize that geotechnical aspects constitute but a part of the multidisciplinary art of global dam engineering. Nevertheless it behoves the geotechnical engineer to constantly reexamine “practices”, “precedents” [10], “judgements” and “experience” [22] mostly formulated over 40 years ago. Fig. 1 summarises the dominant concern tackled in the senior author’s Rankine Lecture 1977 [9] and later simplified by Viotti [29]. Although the compacted homogeneous earth dam with inclined filter curtain was chosen as the most relevant model for significant specifically geotechnical problems, the priority hurdle at the time of delivering the Lecture was to tackle the issues of probabilistic design which required separating a vast amount of chaff from the wheat. The objective was to repudiate the greatest of all possible embankment dam aberrations, which regrettably judgement and experience had not rejected or avoided, in some contemporary dams of great note. The Lecture focussed in simple terms on the problem of foundation seepage and uplift, by the introduction of the semi-impervious internal blanket down to a judicious distance under the downstream shoulder.
Fig. 1. Emborcação Dam, “Rankine Lecture Design”: successful performance. [29] Having exposed many of the “geometrically transmitted” practices and precedents which amount to serious misjudgments, the senior author [9] did not address the topic of slope stability analyses. He did however comment on the strangeness of the typical US/DS slopes being of the order of 1:3 and 1:2.5 respectively. Irrespective of the critical destabilizing conditions used for the analyses, this ratio starkly exposes the apparent neglect of the huge difference of risks for DS vs. US slope failures. It is clearly absurd to accommodate the two design requirements merely by differentiated factors of safety F of 1.5 and 1.2, (e.g. Meyerhof [18]) apparently plucked from thin air, especially when reasonable probabilistic error bands are not narrower than ± 15 to 20%. (e.g. [17]).
De Mello, Page 3
The original Figure 1 has been beneficially simplified [29] so as to emphasize the following important aims: (1) by excluding from the DS sliding surface any incremental destabilizing actions, either at the top (stretch A) or at the foundation uplift (stretch B) in conditions of extreme full reservoir flownets, the very question of calculating comparative or sequential F values disappears, because the end-of-construction stability is monitored and proven, and thenceforth is only benefited by compressions and ageing; (2) with a well-depressed full reservoir flownet, the core and core-filter interface are in compression - a favourable condition; (3) the highly undefinable probabilistic foundation uplifts are thoroughly filter-drained. Thus, in this paper, pertinent embankment stability analyses, controlled by statistics of averages, are focussed on the sequence of critical geotechnical conditions bearing on the US volumes, of core (and shoulder, if used) without degrading the priority factor of lengths, costs and risks of the three hydraulic circuits of 1) cofferdams and diversion; 2) operative flows; 3) spillway. Having had sole responsibility for a number of singular dams in which he had used cumbersome graphostatics, the senior author has been enticed into a study of the current status of slope stability analysis by the widespread and blind use of currently available computer programs. The case of dams is chosen on purpose, for many reasons, including the fundamental sequential principles of soil behaviour as influenced by stress-strain-time history. It has become apparent that, starting from one early dominant simplifying dogma for seepages, a series of curious coincidences has led to the incorporation of some “corrupted genes” in all the theories and programs without exception. Moreover, all validations have been “in house” by mutual second-order comparisons, without redressing the dominant simplifying assumption. It is of interest and relevance to note that the early geotechnical challenges concentrated much on drawing flownets and so helped retain a widespread erstwhile practice of merely using the DS toe or short filter-drainage blankets, thereby subjecting the entire DS zone to maximum reservoir seepage flownet. Thus, notwithstanding the growth of earth core–dumped rockfill sections by dam engineering, in geotechnique the introduction of so favourably dominant a feature as the near-central filter curtain was much retarded [8], and earth dam practice failed to optimize the most controlling feature1. Thus, in marked contrast to Wright et al’s 1973 [32] conclusions of “a strong indication that these methods give the ‘right answer’” (p. 785) and “it may be concluded that none of these procedures involves large errors” (p. 790), the senior author emphasized [9, p. 333] that “although we conclude that various methods of analysis give nearly identical results, the respective certainty is only of equivalence of various computations within a presumed model, and not of equivalence of the model to reality”. Soft and hard loads, disturbing or restoring? The historic trail that leaves all the slope equilibrium theories and ensuing calculations “genetically polluted” to a surprising degree arises through a sequence of Terzaghi 1936 and 1943 [26], [27], Taylor 1948 [25], Bishop (1952, 1955), Janbu (1954) etc…, limitations in prevailing computer hardware, and uncritical acceptance of certain geotechnical concepts laid down by highly respected father figures. However, as a mark of respect to the profession, it is necessary to emphasize the relevance (at the time of the post-war intense theoretical and professional effervescence) of the first most authoritative book for geotechnical practice authored by Terzaghi-Peck 1948 [28]. 1 It was jestingly quoted as analogous to designing a reinforced concrete beam and then assuming the reinforcing bars inexistent.

De Mello, Page 4
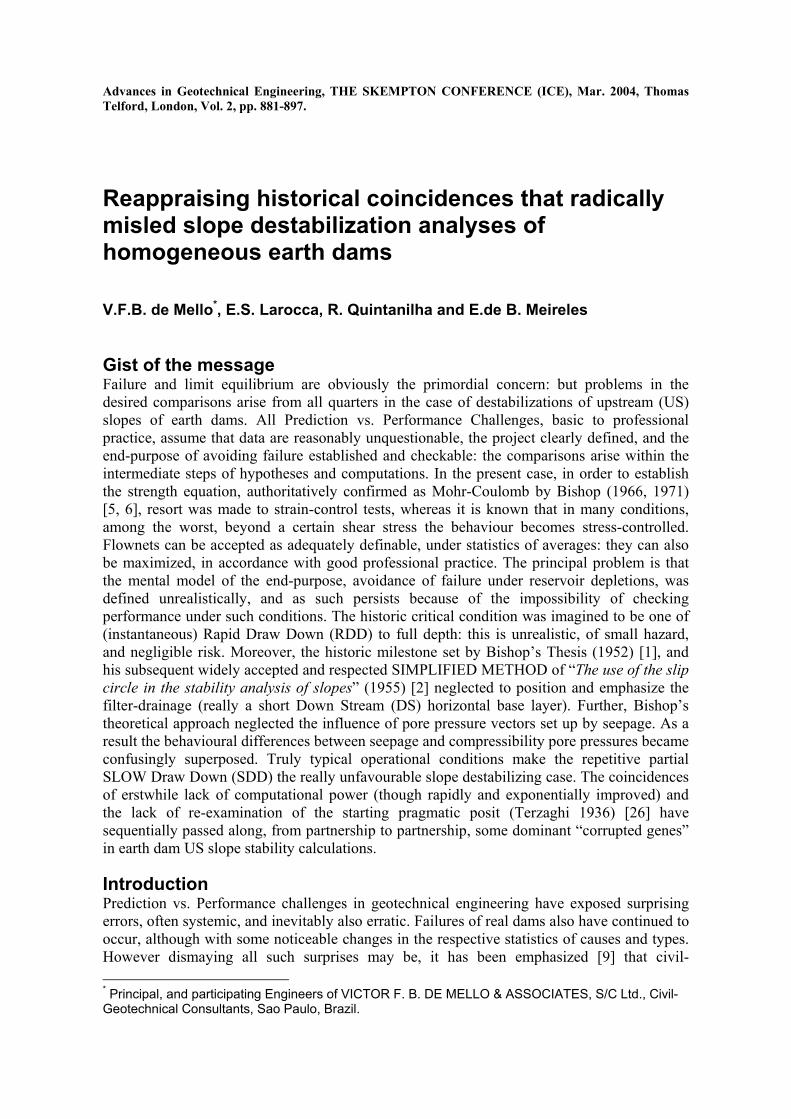
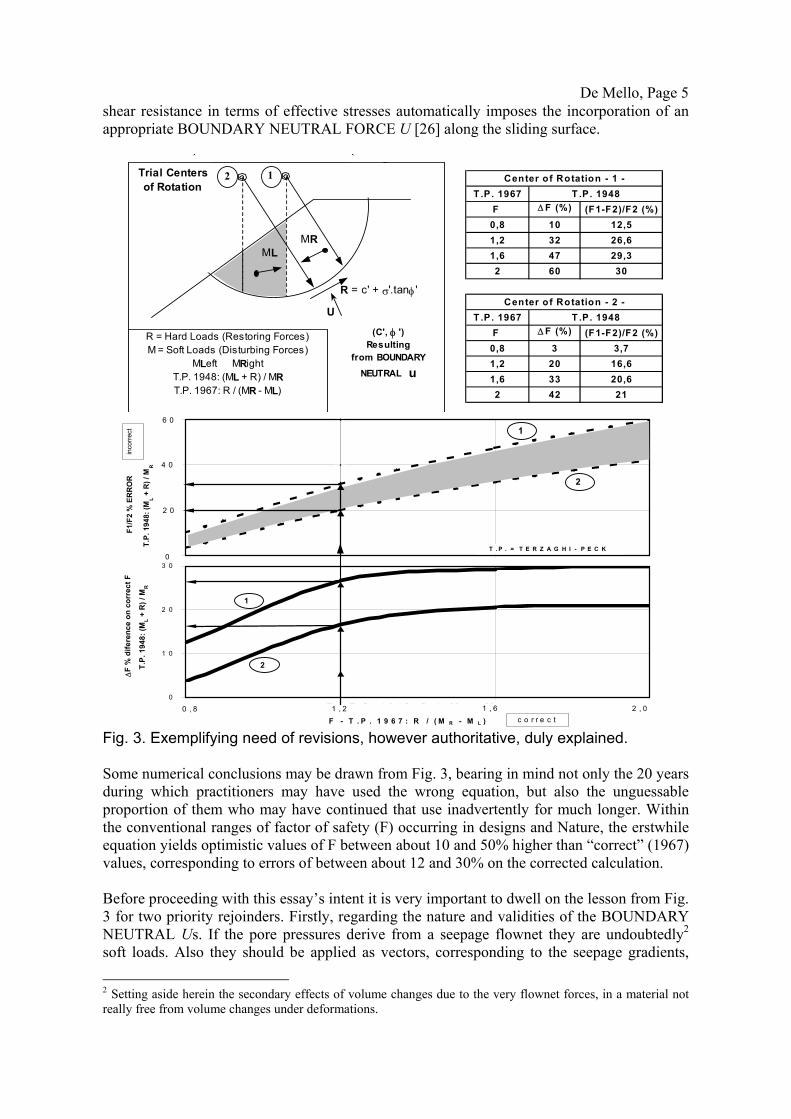
Fig. 2. Fundamental schematic indication of Terzaghi’s 1936 postulation. [26] NOTE 1. Terzaghi (1943) continues to concentrate on seepage flownet destabilizations both for a pervious embankment under rainfall infiltration (pg. 254 – ‘6) and for the rapid drawdown (RDD) of the US slope of an earth dam (pg. 341) consistently using the BOUNDARY NEUTRAL U SIMPLIFICATION. NOTE 2. Taylor (1946) also concentrated on “The basic seepage force relationship” (p. 201, Fig. 9.20) extending (p. 203) “The consideration for a small element may easily be extended to a large mass by a SUMMATION OF FORCES for all the elements of volume which make up the mass”. “Summation of forces” should have been corrected to “Summation of EQUILIBRIA CONDITIONS” (author’s rejoinder). The preface of the revised edition of Terzaghi and Peck (1967) [28] mentions the significant incorporation of revisions, but neither mentions nor broaches the important conceptual difference between page 182, Fig. 7.8, Eq. 31.2 and page 239, Fig. 35.5 and the unnumbered equation above eq. 35.4. Moreover, the crucial point at which the revision is introduced is neither pointed out nor are its important conceptual implications emphasized. The distinction between soft and hard forces, which originated with Rock Mechanics with regard to gravity dams on fractured rock foundations, is of utmost consequence: soft loads are constant in magnitude and independent of deformations, while hard forces are entirely dependent on deformations. Bishop 1952 ([1], p.40) notes a distinction between two kinds of u but, in lieu of soft forces, denotes them “pore pressure independent of the state of stress in the soil”. In the example presented in Fig. 3 the soft forces are those of gravity, and thus represented by the opposing Moments of the weights to the right and to the left of the center of rotation. For the Restoring Moment, the 1948 edition had mixed the soft Moment ML and the hard Moment due to R (the shear resistance along the sliding circle), which requires some deformation for mobilization. Incidentally, it should be noted that the decision to use the
SEEPAGEDESTABILIZATIONS
cf. ALSO TAYLOR 1948
C
De Mello, Page 5
shear resistance in terms of effective stresses automatically imposes the incorporation of an appropriate BOUNDARY NEUTRAL FORCE U [26] along the sliding surface.
Fig. 3. Exemplifying need of revisions, however authoritative, duly explained. Some numerical conclusions may be drawn from Fig. 3, bearing in mind not only the 20 years during which practitioners may have used the wrong equation, but also the unguessable proportion of them who may have continued that use inadvertently for much longer. Within the conventional ranges of factor of safety (F) occurring in designs and Nature, the erstwhile equation yields optimistic values of F between about 10 and 50% higher than “correct” (1967) values, corresponding to errors of between about 12 and 30% on the corrected calculation.
Before proceeding with this essay’s intent it is very important to dwell on the lesson from Fig. 3 for two priority rejoinders. Firstly, regarding the nature and validities of the BOUNDARY NEUTRAL Us. If the pore pressures derive from a seepage flownet they are undoubtedly2 soft loads. Also they should be applied as vectors, corresponding to the seepage gradients,
2 Setting aside herein the secondary effects of volume changes due to the very flownet forces, in a material not really free from volume changes under deformations.
0 , 2 0 , 4 0 , 6 0 , 8 F - T . P . 1 9 6 7 : R / ( M R - M L ) c o r r e c t
0 , 8 1 , 2 1 , 6 2 , 00
1 0
2 0
3 0
F T P 1 9 6 7 R / ( M M )
∆F
% d
ifere
nce
on c
orre
ct F
T.P.
194
8: (M
L + R
) / M
R 1
2
∆F
% d
ifere
nce
on c
orre
ct F
T.P.
194
8: (M
L + R
) / M
R
0 , 2
0 , 4
0 , 6
0 , 8
F1/
F2 %
ER
RO
R
T.P.
194
8: (M
L + R
) / M
R
inco
rrect
T . P . = T E R Z A G H I - P E C K
6 0
2 0
4 0
0
1
2
T .P. 1967F ∆ F (%) (F1-F2)/F2 (%)
0,8 10 12,51,2 32 26,61,6 47 29,32 60 30
T .P. 1967F ∆ F (%) (F1-F2)/F2 (%)
0,8 3 3,71,2 20 16,61,6 33 20,62 42 21
Center of Rotation - 1 -
Center of Rotation - 2 -
T .P. 1948
T .P. 1948
R = c' + σ'.tanφ '
R = Hard Loads (Restoring Forces)M = Soft Loads (Disturbing Forces)
MLeft MRightT.P. 1948: (ML + R) / MRT.P. 1967: R / (MR - ML)
MRML
Trial Centers of Rotation
(C', φ ')Resulting
from BOUNDARYNEUTRAL u
U
12
De Mello, Page 6
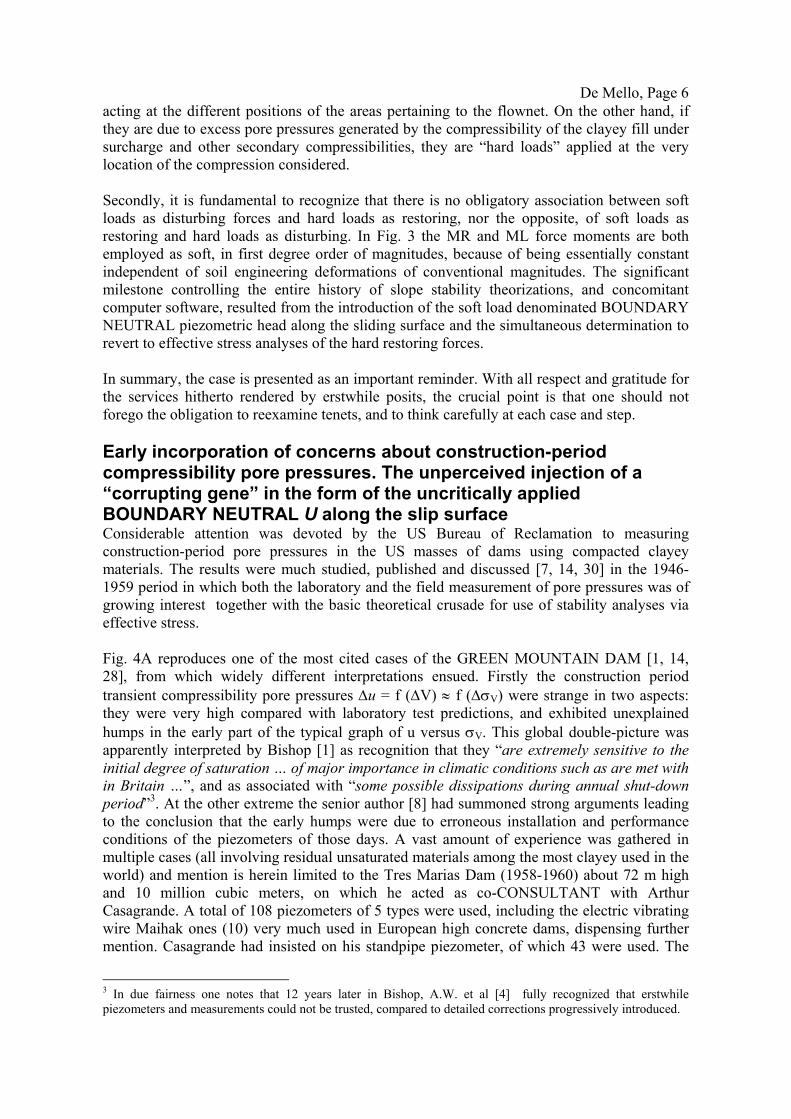
acting at the different positions of the areas pertaining to the flownet. On the other hand, if they are due to excess pore pressures generated by the compressibility of the clayey fill under surcharge and other secondary compressibilities, they are “hard loads” applied at the very location of the compression considered. Secondly, it is fundamental to recognize that there is no obligatory association between soft loads as disturbing forces and hard loads as restoring, nor the opposite, of soft loads as restoring and hard loads as disturbing. In Fig. 3 the MR and ML force moments are both employed as soft, in first degree order of magnitudes, because of being essentially constant independent of soil engineering deformations of conventional magnitudes. The significant milestone controlling the entire history of slope stability theorizations, and concomitant computer software, resulted from the introduction of the soft load denominated BOUNDARY NEUTRAL piezometric head along the sliding surface and the simultaneous determination to revert to effective stress analyses of the hard restoring forces. In summary, the case is presented as an important reminder. With all respect and gratitude for the services hitherto rendered by erstwhile posits, the crucial point is that one should not forego the obligation to reexamine tenets, and to think carefully at each case and step. Early incorporation of concerns about construction-period compressibility pore pressures. The unperceived injection of a “corrupting gene” in the form of the uncritically applied BOUNDARY NEUTRAL U along the slip surface Considerable attention was devoted by the US Bureau of Reclamation to measuring construction-period pore pressures in the US masses of dams using compacted clayey materials. The results were much studied, published and discussed [7, 14, 30] in the 1946-1959 period in which both the laboratory and the field measurement of pore pressures was of growing interest together with the basic theoretical crusade for use of stability analyses via effective stress. Fig. 4A reproduces one of the most cited cases of the GREEN MOUNTAIN DAM [1, 14, 28], from which widely different interpretations ensued. Firstly the construction period transient compressibility pore pressures ∆u = f (∆V) ≈ f (∆σV) were strange in two aspects: they were very high compared with laboratory test predictions, and exhibited unexplained humps in the early part of the typical graph of u versus σV. This global double-picture was apparently interpreted by Bishop [1] as recognition that they “are extremely sensitive to the initial degree of saturation … of major importance in climatic conditions such as are met with in Britain …”, and as associated with “some possible dissipations during annual shut-down period”3. At the other extreme the senior author [8] had summoned strong arguments leading to the conclusion that the early humps were due to erroneous installation and performance conditions of the piezometers of those days. A vast amount of experience was gathered in multiple cases (all involving residual unsaturated materials among the most clayey used in the world) and mention is herein limited to the Tres Marias Dam (1958-1960) about 72 m high and 10 million cubic meters, on which he acted as co-CONSULTANT with Arthur Casagrande. A total of 108 piezometers of 5 types were used, including the electric vibrating wire Maihak ones (10) very much used in European high concrete dams, dispensing further mention. Casagrande had insisted on his standpipe piezometer, of which 43 were used. The
3 In due fairness one notes that 12 years later in Bishop, A.W. et al [4] fully recognized that erstwhile piezometers and measurements could not be trusted, compared to detailed corrections progressively introduced.
De Mello, Page 7
three other types were of the closed circuit cell type, 12 denominated “London” as supplied by Soil Mechanics Ltd., 2 of the USBR type, and 39 of an experimental type denominated GEOTECNICA4. Comparing with reservoir inflow and outflow hydrograms the senior author remonstrated against the standpipe, especially considering the compaction precompressions and resulting early great incompressibility [11]. The humps were interpreted as completely erroneous, easily attributable to injecting water into the soil in the immediate vicinity of the cells: the circulation of deairing water generally used about 100 and 0 psi at the two ends, and the relatively crude check mostly used was to compare volumes injected and retrieved. Figs. 4B and 4C thus gave, for typical Brazilian conditions, a very different interpretation to that understandably adopted by Bishop in orienting his subsequent slope stability reasonings. No further mention is herein made of sequential analyses of dams except that logical professional practice aims at minimizing the construction-period stability because of low hazard and risk. There are noticeable advantages accruing from subsequent consolidation, both gravitational and from reservoir filling pressures and from flownets for chosen filter curtains: subsequent behaviour improves due to the unload-reload deformabilities.5 Due to space limitations one jumps directly to the full reservoir flownet and subsequent behaviour. In Fig. 4A (insert) one notes the significantly varying strains Є% around the potential slip surface, which vary between 0.5 and 2.5% but are idealized as constant. The pore pressure ratio ru = u/σv is also assumed to be constant but the measured values show controversially high values between points 1 and 3, with the remainder varying somewhat. The hypothesis that the onset of failure would take place along a continuous sliding surface [1] actually shows up as a zone, analogous to that shown by Scott [22]: it might invite a quest into the consequent range of probabilities of F values. Possibly the principal quest during rapid filling might involve comparing immediate losses of surface stability (sloughing by loss of suctions), versus the usual procedure of considering the stabilizing contribution of the inward seepage gradients (i.e. the “advance of wetting front” which is in need of much updating). The exploration of many such variations of hypotheses and parameters suggest themselves, but must be curtailed in this instance. For example, reliable suction measurements date back only about a dozen years. One point is herein chosen for special mention because it appears to have had a coincidental but very important influence on the subsequent “partnerships” and transmission of two principal “corrupting conceptual genes”. One refers to the discussions and objections on Bishop’s presentation [2], European Conference on Stability of Earth Slopes, Sept. 1954. The objections centered on Bishop’s decision to use a Factor for Reducing the strength and Restoring Force ([2], p 7) such that the “procedure … consists of finding by trial and error the slip surface for which the Disturbing and Restoring forces are in (AT LIMIT?) equilibrium for the smallest decrease in strength”. It was remonstrated that disturbing actions involved increases of stresses, but not decreases in strength.6 On the one hand it can be seen
4 As visualized by the senior Author for minimizing the errors attributed to the others, the porous stone was substituted by a saturated porous wood disk, and a film of mercury put on top of it within the cell was visualized for separating the double circuit of flowing deairing water from being injected down into the soil. 5 Incidentally, if upon adding the upper fill trapezoid any least signs of possible destabilization are sensed the correct engineering decision is to swallow prestige and rapidly remove the added meters. Action and reaction are neither instantaneous nor totally equivalent, and the best remedy is always to remove the action. The common non-geotechnical recourse, under psychological impulse, is to hasten adding a toe berm, which fails to provide the desired reaction without deformations, generally incompatibly larger. 6 One has to refrain from expatiations that extended for years.
De Mello, Page 8
FIG 7 MOST CLAYEY MATERIAL AND BEST CONSTR. u RECORDS
1 2 3 4 5 6
1(kg/cm²)
FIG. 4B
FIG 6 CRITICAL CONDITIONS ON PORE PRESSURES
1. PARANOÁ DAM 1958-59, BRASÍLIA2. COCOROBO DAM 19673. ÁGUAS CLARAS DAM 19694. TRÊS MARIAS DAM CONSTRUCTION u reference slope 1:2 DS reference slope 1:3 US
(1963)
108 piezometers
FIG. 4C
0
12
3 45
67
8
9
10
USBR GREEN MOUNTAIN DAM
feet
FIG. 4A
0
0 ,5
1
1 ,5
2
2 ,5
0 1 2 3 4 5 6 7 8 9 1 0P O I N T S M A R K E D O N S L I D IN G S U R F A C E .
ε ( % )
r u
[14]
[8]
[8]
Fig. 4. End-of-construction EOC pressures seen under different regional factors. that the problem can be reduced to a simple arithmetical relationship. Taking the usual difference ∆ = R-D, with F = 1.00 for R = D, the conventional F = R + ∆/D and Bishop’s

De Mello, Page 9
[3]
F’ = R/D-∆ yield the direct tabulation:
∆ = R-D 0.1 0.2 0.3 0.4 0.5
Conventional F 1.1 1.2 1.3 1.4 1.5
Bishop’s F’ 1.11 1.25 1.43 1.67 2
On the other hand the postulate arose from an historic partnership with Scandinavia (Bjerrum & Bishop etc…) because indeed slides are there seen to occur by loss of strength. The very influential milestones set by Bishop [1], [2], are suggestive of cutting four Gordian knots: (1) of numerical solutions leading to software, sparing cumbersome calculations, and destined to grow to absolute dominance to the point of diverting attention; (2) of strong academic preference for effective stress analyses, emphasizing “a necessary requirement of sound practice to install pore-pressure gauges in all important earth dams” ([1], p. 65); (3) of building upon the posit of “checking in cases where the factor of safety is known to be unity. This is probably the most impressive test of all” ([1], p. 11); (4) of permitting (apparently unnoticed) the indiscriminate mixing of BOUNDARY NEUTRALS, the erroneous seepage ones, and the unquestionably correct ones from deformations at the sliding surface. Several back-analyses were undertaken, and proved to be the victorious artillery at the milestone ASCE Boulder Conference (1960) battle for favouring effective stress analyses [3], and accepting the dichotomy F ≥ 1.3 - stable; F ≈ 1.0 - failure. Fig. 5 taken from [3] Fig. 5. Data supporting failures at F ≡ 1.00 (effect. stress., & strength reduction). [3] summarizes a single example. The senior Author has consistently rejected these tenets, positing failure not at F ≡ 1.00 exactly, but as due to the disturbing action causing ∆F passing through 1. On the one hand piezometers give erratic point values that greatly increase difficulties of interpreting spatial variabilities easily leading to deterministic wishful thinking.

De Mello, Page 10
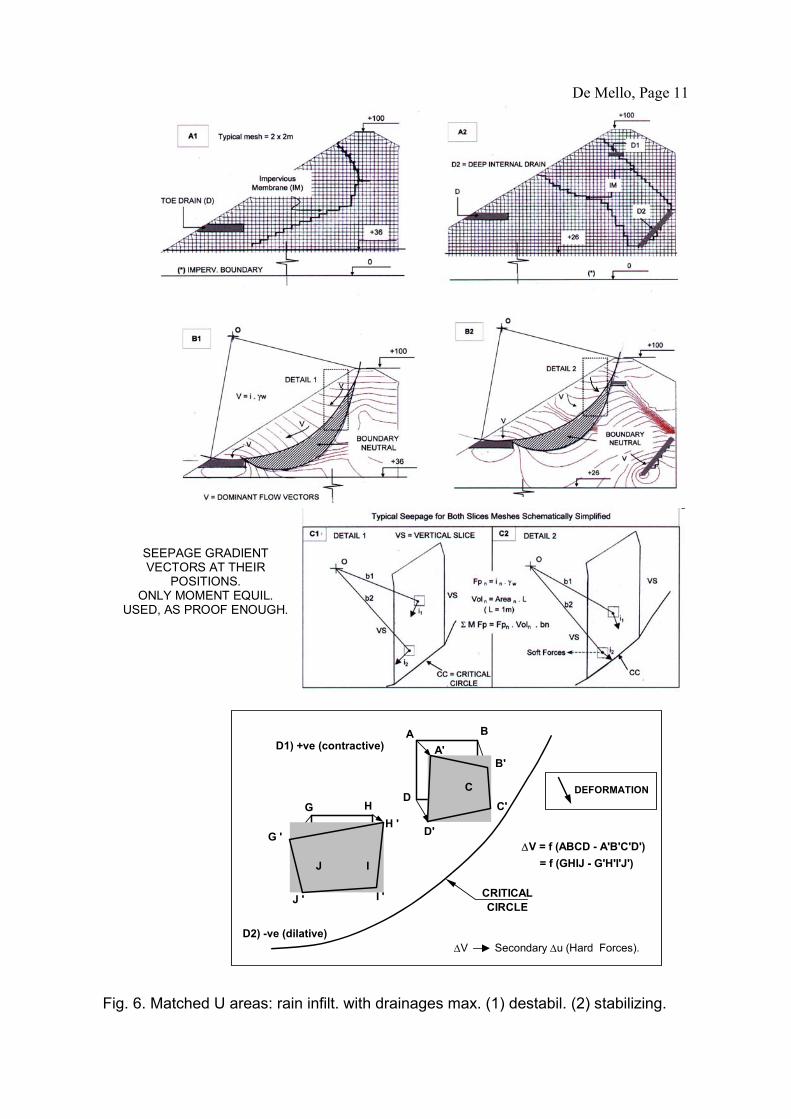
Moreover in any backanalysis of a failure there are delays of mobilizations and investigations. Above all, in many a soil (as in a majority of careful laboratory triaxial tests) and corresponding field case, the crucial information should be of u at the sliding surface during the sliding - a remote hope. THE BOUNDARY NEUTRAL simplification is demonstrated as fundamentally wrong in principle Early practice on drainage for stabilization of slopes employed principally small mined tunnels excavated below and behind the toe of the menaced slope (cf. Fig. 6 (A2)). Such practice belonged to the typical construction methods and risk avoidances of the time. In the early 1950s the “Hydrauger” was developed for subhorizontal drilling of drainage holes from the toe of the slope. Many important details of this innovative practice can be cited on problems and solutions, uses and misuses, separating beneficial from damaging cases. Suffice it to mention that the most common consequence has been that the drainage has been drawn to the toe and most geotechnical practitioners find themselves satisfied in that they have aptly applied drainage (i.e. increased flows to the toe) for the desired stabilization7. The objective of this section is to demonstrate how wrong the Boundary Neutral approach can be when seepage vectors are at play in different positions, directions, and magnitudes within the destabilizable mass. Free rainfall infiltration along the surface is a routine destabilizing condition for natural slopes, and is also often taken as a worst case maximized hypothesis for earth dams prior to DD. Figs. 6, A1 and A2, show the upper part of the mesh used for FLAC analyses of an embankment dam, firstly of the flownets, and subsequently of the soil deformations. Boundary conditions and internal flownet controlling features are shown. For case A1 these features were arranged to achieve a maximized destabilizing flownet draining to the toe. A hypothetical impervious membrane embedded in the soil mass was used in order to maximize the gradients towards the toe within the hypothetical critical sliding circle. Outside of this internal membrane the flownet developed normally with a horizontal impermeable boundary at elev. 0 (i.e. 36m below the horizontal cutoff) and a vertical impermeable boundary to the right. The computed boundary neutral u diagram is shown in Fig. 6, B1. For the second case (Fig. 6, A2) the same toe drain was maintained, but with oddly disposed internal free-drains (D1 and D2) and two impervious internal membranes (or imposed equivalent flowlines, because no drop of water crosses a flowline). The purpose of this second case was two-fold: firstly, to match on the same critical sliding circle exactly the same boundary neutral diagram as for case A1; secondly, to achieve that goal by maximizing the stabilizing flownet, forcing the seepage vectors to move to the right to minimize the Disturbing Forces, and/or for establishing vectors normal to the critical surface, thereby maximizing the Restoring Forces by the friction resistance component. After several trial and error hand-drawn flownets had been tried so as to achieve the same boundary neutral as case A1 (but with a set of maximized stabilizing seepage forces draining inwards and downward), the FLAC analysis was used for confirmation. The final stage of the study was to carry out comparative stability computations employing only Moment Equilibrium with vertical slices and neglecting the side forces, or more 7 How often it is forgotten that field work prefers good weather, and subsequent monitoring even proves favourable. But engineering imposes defending from maximized critical episodes.
De Mello, Page 11
SEEPAGE GRADIENTVECTORS AT THEIR
POSITIONS.ONLY MOMENT EQUIL.
USED, AS PROOF ENOUGH.
AA'
B'
C'
D'
B
DC
D1) +ve (contractive)
D2) -ve (dilative)
∆V = f (ABCD - A'B'C'D')
DEFORMATION
CRITICALCIRCLE
= f (GHIJ - G'H'I'J')
∆V Secondary ∆u (Hard Forces).
G
G '
I 'J '
H
J
H '
I
Fig. 6. Matched U areas: rain infilt. with drainages max. (1) destabil. (2) stabilizing.
De Mello, Page 12
appropriately, the side force differences8. The soil parameters used were γnat = 19 kN/m3, E = 30000 kPa, µ = 0.3, and s = 65 + σ’tan27o (kPa) , all of reasonable orders of magnitude. All numerical results would change as these parameters change, but the crucial demonstrative calculations are unchangeable. There is absolutely no generalized equivalence of the two calculation methods and unquestionably it is the mass effective stress forces (at their respective centers of gravity) that determine behaviours, both of deformabilities, and of ultimate “failure” deformability. The following table gives the results of the stability comparisons. It is evident that there are big differences between the Factors of` Safety given by the traditional Boundary Neutral approach and those given by the use of effective forces.
CASE F by Boundary Neutral F by Effective Forces A1B1 1.43 1.01 A2B2 1.43 1.95
The moment stabilities by effective stress forces were computed for the entire mass, but for illustration of procedures only single slices and their subdivisions are shown in B1, B2, and C1, C2. The FLAC output gave the data for direct deduction of the gradients for each 2x2m mesh element but in order to reduce the extremely laborious calculations to reasonable proportions, subsequent computations were simplified, grouping about 5 to 30 adjacent elements of similarly directed vectors, for obtaining the resultants for each disturbing and restoring moment for the final integrations (cf. Figs. 6, C1 and C2). For finalizing the summary of the data provided by the FLAC runs and their subsequent uses, reference is made to Figs. 6, D1 and D2. The data of the deformation and strain vectors generated by the flownets are computed at the corners of each element. The initial dimensions of the starting trapezoids, following the generation of a geostatic soil mass, are given by ABCD and GHIJ. A’B’C’D’ and G’H’I’J’ are the final trapezoids, which will be of direct interest for deducing changes of volumes due to the respective flownets. The drawings are schematic. The deduced changes of stress corresponding to ∆us generated by the ∆Vs and ∆εs% would give rise to hard forces. These secondary effects due to deformations are generally and presently neglected . Such volume changes can be considered under two extreme hypotheses: firstly, if they become immediately effective by means of internal or external drainage; secondly, as long-term tendencies due to consolidation or swelling with their associated transient pore pressures. In principle, conditions can be either contractive, generating positive excess u, or dilative, generating suctions. Designing for reservoir drawdowns Stabilization measures for the US slope during reservoir filling have already been mentioned briefly. Many pertinent quests of geotechnique lie open to dam engineering. For brevity only one is mentioned here. Professional practice has often condemned or restricted, by intuition, a “very rapid filling” - never with a justifying explanation. One must remind geotechnicians that besides slope stabilities there are also problems of differential deformations in the same section, and corrections are also needed to early tenets regarding rate effects. In a good
8 As aptly explained by Bishop [1, pg. 48] in the use of his equation “we are not neglecting the forces between the slices ... All that is implied is that their effect on the magnitude of the resultant restoring moment may be neglected, under certain circumstances” :and in necessary restriction of cumbersome second-order calculations, one reasoned that the said differential effects could be rendered smaller upon narrowing the widths of the slices, arbitrary anyway. It is noted emphatically that the boundary neutral forces are present in the verticals also, but perceptibly inconsequential. All such available variations are easy and second-order.
De Mello, Page 13
majority of dams the rate of rise of level can only be controlled in the upper stretch of operative depletions, and there, only in the frequently unfavourable direction of slowing the rise. Intuitively one could presume that unknown differential deformations might be greatest with a very fast rise in the bottom, followed by a major slowdown at the top. However, skipping these intermediate steps, we shall consider the PERMANENT full RESERVOIR (PR)flownet as established9. It is from such a condition that traditional geotechnical analysis has been used to study the destabilizing condition classically considered to be the most critical for the US slope. This has given rise to the “practice” of the flattened US slopes. The subject of rapid (“instantaneous”) drawdown10 RDD (full depth) was a crucial concern in the 1950’s, and has dominated design practices and precedents without further queries or studies. Is it possible to submit the problem to the “proof positive test” [22]? Not unless there is an overtopping failure after very many years of operation. It so happens that the senior author was taken to inspect (within hours) two such cases having vertical near-center filter curtains and both very carefully design-constructed: not a stone of the hand-placed riprap had budged. Moreover inspections along countless kilometers of loose weak residual soils of the abutments and reservoir rims kindled queries which led to reanalyzing the past, contesting it fully, and interpreting an important historic key to the confusing equivalence and mixing adopted between seepage BOUNDARY pore pressures assumed for practical simplification, and non-seepage pore pressures rightly generated along the sliding surface. The traditional approach to the problems of RDD appears to be associated with historic and regional coincidences brought into dominance for conventional earth dam geotechnique by Bishop [1, 2]. His posits of the time were mentioned above as having mixed the correct use dictated by ∆V→∆u deformabilities, with the incorrect use11 in cases of seepage destabilizations. This has led to the persistent unquestioned and uncontested use of the BOUNDARY U in US stability analyses. Concomitantly a noticeable contribution to such persistence arose from the (a) progressive sanctioning by “partnerships” of authoritative father figures and (b) the coincidence of the comparative importance inserted by the historic efforts at optimized computer use in the early days of such methods [16, 31]. Bishop’s analyses were exemplified as conditioned by regional factors and practices, of very flat slopes, high compressibilites, and merely a DS filter-drainage blanket between foundation and fill. But these analytical approaches have been extended indiscriminately to application in much more generalized situations. It is therefore necessary to summarize the principles upon which his methods are based. Understandably influenced by the contemporary forefront developments for calculating ∆u values via the A, B and B coefficients [21], Bishop determined the pertinent sliding surface pore pressures from σv values taken from the geometries of the fill and submergence water level. He discussed in detail the differing volume deformabilities of particulate soil structure versus pore fluid in compacted soil conditions of high Sr% both for submerged slopes and for the full reservoir permanent flownet. All such ∆us would be “hard loads” and rightly applicable where the ∆Vs are produced along the sliding surface12. 9 Bypassing considerations on how very long it should take, highly variable, of course. 10 On closer distantly retroactive reassessment of the RDD test on Alcova Dam (USBR) as analysed by Bishop [1, pg. 97] one is induced to set it aside as fraught with queries as per updated techniques and theories. The subject of RDD has not been pursued over the past 35 years, roughly. 11 In due respect, note that regarding Terzaghi’s [26] simplification, Bishop [1, pg. 51] did not fail to note “It is difficult to justify it logically… As an empirical method it has the merit of being slightly simpler…” 12 One sets aside all questions regarding difficulties in defining appropriate parameters in practice.
De Mello, Page 14
Finally also, following professional principles of maximizing disturbing actions, the assumption of saturation Sr = 100% was employed. The final step used is the one that raises a query because it starts from the pre-DD flownet as a base, but continues to calculate the ensuing Us and ∆us by the geometries, leaving no place for adopting possible post-DD incipient flownets. Thus, due to this virtual denial of flownets, one loses recourse to filter-drainage curtains or blankets as the principal features for optimizations of the section. It is recalled herewith that by classical geotechnique in a saturated soil, irrespective of the permeabilities, upon changing the flownet’s boundary conditions there is an “instantaneous” tendency for the incompressible fluid to respond to the change13, therefore, to the difference from the prior to the posterior pore pressures. One reflects that at any rate this classical rheological tenet is not less pervading in geotechnique than the smaller difficult practical inroads achieved by the A, B, B coefficients. Dependent on permeabilities, the retarding applies to the consequent flows under the altered gradients: thereupon follow the contractive or dilative changes of volumes, as dictated by the ∆u → ∆V relations. In summary, the aim should be to return to the understanding that the fundamental weapons of design are (1) control of seepage vectors by well situated behaviourally deterministic filter-drainage curtains, blankets and galleries, and (2) minimizing post-construction unfavourable deformabilities, in either direction, contractive or dilative, by having the ∆σ → ∆V→∆u changes occur in the pre-compressed load-unload range (as represented by compaction). Fig. 7 relates to upper depletions and not the full DD depletion which has near-zero hazard. Using the pre- and post-DD flownets, the latter one and the difference adopted as “tendencies to change” merely for seepage vectors, one sees that acceptable F and ∆F values are obtainable under RDD. Therefore it should not impair the slope’s stability (and opens the way to design optimizations). However, in Fig. 7B one sees that these trigger ∆σs lead to dilative or contractive tendencies to deformations along stretches of the potential sliding surface. Given the time for dissipations and redistributions of the excess pore pressures, the dilations lead to strength reductions, and the inevitable repetitions may over the years lead to failure. It is thus posited that the consistent conjunction of design hypotheses make the slow DD case more vulnerable. This can be submitted to the “proof positive test”. Concluding comments and secondary effects In dam design, every practice has to be interpreted historically in the light of the dominant challenges of the time and of the current state of knowledge brought to the immediate problem by various parties and “partnerships”14. Some cases of “apparent partnerships” transmitting the “genes” could be such as Bishop-Bjerrum, Little and Price leading to Morgenstern-Price, Morgenstern-Fredlund, Fredlund-Krahn, etc.., with cases such as Sarma, Spencer, Bell, etc.. appearing as side-runners. An example of “gene” transmission arises from the fact that after Little and Price’s [16] publishing the computer solution, the Morgenstern-Price work [19] led to the well known stability charts. Both the Harvard – Janbu, and the Taylor (M.I.T.) – successors, tended to subdue queries. One noticeable fact is that individual contributors persisted along the same line for decades, and that none of the State-of-the-Art reports delved into significant collateral hypotheses. The focus on the rigid-plastic solutions of Structural Engineering tended to concentrate much attention on completing the equilibrium 13 It has been debated and contested, but pertains undeniable, with an incompressible pore fluid (cf. e.g. Taylor [25, p. 158, 190]). 14 As herein subjectively interpreted through much more extensive studies, and with all respect for, and excuses to, the recognized forefront contributors, colleagues in our joint trek.

De Mello, Page 15
CC
O+100VECTOR
0
F1
+50
Moment Stability Calculated by Resultant
Vectors cf. FIG. 6 (C1, C2)
+100
0
DRAIN (D)
+94
CC
O
PR NET
E1
0
+100
+64
(R or S) DD
O DETAIL E2
CC
+64
D
EOC - End Of ConstructionPR - Permanent ReservoirSDD - Slow DrawDownCC - Critical Circle
F1 EOC 1,672 PR 2,6 2 - 1 + 0,933 (R or S)DD 1,1 3 - 2 - 1,5
TABLE of Fs and ∆Fs
∆F
O
+36
+100
∆V (PR - SDD)
DILATIVECONTRACTIVE
INCREASE DILATIVE
Fig. 7A. Flownets, Vectors, Fs for PR and shallow (R or S) DD slide. Fig. 7B. Stretches on sliding circle subject to dilative or contractive ∆Vs under DD flownet from PR reservoir. unknowns in classical stability analysis. This led to some rather incredible hypotheses such as that all the mass is simultaneously at failure, independent of stress levels, and with the same strains. The convenience of such solutions has led to difficulties in raising the suspicions of geotechnicians that soil masses do not know that they are supposed to behave according to
De Mello, Page 16
mathematically deterministic rigid-plasticity-theory equations15. It is herein submitted that there is very much of importance to be fondly queried and revised in the erstwhile simplifications and errors of pure geotechnique. The computer has diverted a great proportion of attention from real-life field geotechnics - paper is easily generated and imprinted, and checking “proof positive” for mental models is simpler. Even under idealized homogeneities, let us consider the simplest of persisting historical views regarding secondary volume change effects. In a first case the starting seepage gradient vectors of flownets are rightly applied as instant forces for the statics of stability, because they are calculated as occurring in incompressible, undeformable materials constituting the soil mass. Deformations are however the reigning principle. In the second case the excess porepressures are generated by real compressions. The changes of restoring forces are only made effective insofar as the effective stress decreases produce corresponding volume changes. In coarse “sandy materials” such volumetric expansive deformations tend to be negligible and instant. However, in “clayey” materials the loss of strength, and hence stability restoring force, only becomes effective along the sliding surface in the time necessary for the corresponding swelling. In the frequent quandaries of choice, we should relinquish the prop of simple fixed rules, and choose judiciously the prudent posture of calculating and forecasting under the two plausible alternates. Have such primordial problems been reconsidered in updated academic knowledge? Are they not seductive for exhilarating professional quests? Acknowledgements The senior Author expresses his gratitude to Prof. John Burland for the 28 years of brotherly communion , herewith capped by his kindness in reviewing and editing the text: and his yearning to contribute to this Symposium because of the irrepressible need to avow his indebtedness to the British colleagues of BGS, IMPCOL, ICE, BRS/BRE and others, through 55 years of his distant career, under the closely felt unparalleled leadership of such an inspiring personality as Sir Alec W. Skempton, ... above it afar, just Skem to us all. References [1] BISHOP, A.W. (1952), “Stability of Earth Dams”, London Univ., Ph.D. Thesis. [2] BISHOP, A.W. (1955), “Use of the Slip Circle in Stability Analysis of Slopes”, I Tec. Sess.: Gen.
Theory of Stability of Slopes, Geotechnique, Vol. V, No. 1, pp. 7-17. [3] BISHOP, A.W., BJERRUM, L. (1960) “Relevance of the Triaxial Test to the Stability Problems” Res.
Conf. on Shear Strength Cohesive Soils, Colorado, ASCE, pp. 437-501. [4] BISHOP, A.W. et al. (1964) “Developments in the Measurement and Interpretation of Pore Pressure in
Earth Dams”, 8th ICOLD, II, pp. 47-72; and Disc. V, p. 318. [5] BISHOP, A.W. (1966), “The Strength of Soil as Engineering Materials”, Rankine Lecture,
Géotechnique, Vol. 16, No. 2, pp. 91-126. [6] BISHOP, A.W. (1971), “Shear Strength Parameters for Undisturbed and Remoulded Soils Specimens”,
Proc. Roscoe Memorial Symposium, Cambridge Univ., pp. 3-58. [7] DAEHN, W.W., HILF, J.W. (1951), “Implication of Pore Pressure in Design and Construction of
Rolled Earth Dams”, 4th ICOLD – New Delhi, Vol. I, pp.259-283. [8] DE MELLO, V.F.B. (1975), “Lessons from Unsuspected, Real and Fictitious Problems in Earth Dams
in Brazil”, 6th AFR. CSMFE, Durban, Vol. II, pp. 285-304. [9] DE MELLO, V.F.B. (1977), “Reflections on Design Decisions of Practical Significance to
Embankment Dams”, Rankine, Géotechnique 27 (3), pp. 279-355. [10] DE MELLO, V.F.B. (1980), “Practice, Precedents, Principles, Problems, and Prudence in Embankment
Dam Engineering” Proc. Int. Symp. Problems and Practice of Dam Eng’g, Bangkok, Balkema, pp. 3-17.
15 One refrains from listing the illuminating further quests and solutions along variational calculus, probability search for critical sliding surfaces, kinematic compatibilities (more likely to increase significance in post-failure deformations) upper and lower bound LIMIT ANALYSIS THEOREMS, etc.
De Mello, Page 17
[11] DE MELLO, V.F.B. (1987), “Ground Engineer’s Reference Book”, Chpt. 44/1 – 44/41, Ed. F.G. Bell, Butterworths.
[12] DUNCAN, J.M. (1996), “State of the Art: Limit Equilibrium and Finite-Element Analysis of Slopes”, Journal ASCE 12 (7), pp. 577-596.
[13] FREDLUND, D.G. and KRAHN J. (1977), “Comparison of Slope Stability Methods of Analysis”, Canadian Geot. Jr., 14 (3), pp. 429-439.
[14] GOULD, J. P. (1959), “Construction Pore Pressures Observed in Rolled Earth Dam”, Tech. Mem. 650, U.S. Bureau of Reclamation, Denver-Colorado.
[15] JANBU, N. (1954), “Stability Analysis of Slopes with Dimensionless Parameters”, Harvard S.M. Series No. 46; also ECSMFE, Vol. 3, pp. 43-49.
[16] LITTLE, A. L., PRICE, V. E. (1958), “The Use of an Electronic Computer for Slope Stability Analysis”, Geotechnique , 8 (3), pp. 113-120.
[17] LUMB, P. (1966) “The Variability of Natural Soils”, Can. Geot. Jr., 3 (2), pp. 74-97. [18] MEYERHOF, G.G. (1984), “Safety Factors and Limit States Analysis in Geotechnical Engineering”,
Can. Geot. Jr., 21 (1), pp. 1-7. [19] MORGENSTERN, N. R., PRICE, V. E. (1965), “The Analysis of Stability of General Slip Surfaces”,
Geotechnique , 15 (1), pp. 79-93. [20] SARMA, S. K. (1972), “A Note on the Stability Analysis of Earth Dams”, Geotechnique XXII, Vol. 1,
pp. 164-166. [21] SKEMPTON A.W., BISHOP, A.W. (1954), “The Pore-Pressure Coefficients A and B”, Geotechnique,
Vol. IV, pp. 143-152. [22] SCOTT, R.F. (1987), “Failure”, Rankine Lecture, Geotechnique, 37 (1), pp. 423-466. [23] SPENCER, E. (1967), “A Method of Analysis of the Stability of Embankments Assuming Parallel
Inter-Slice Forces”, Geotechnique, 17 (1), pp. 11-26. [24] TAVENAS, F. et al. (1980) “Remarks on the Validity of Stability Analysis”, Can. Geot. Jr., l7 (1), pp.
61-73. [25] TAYLOR, D. W. (1948), “Fundamentals of Soil Mechanics”, John Wiley & Sons Inc. – New York, pp.
104-204, pp. 406-479. [26] TERZAGHI, K. V. (1936), “Critical Height and Factor of Safety of Slopes Against Sliding”, First
ICSMFE, Cambridge, Vol. I, G-6, pp.156-161. [27] TERZAGHI, K.V (1943), “Theoretical Soil Mechanics”, Wiley. [28] TERZAGHI, K.V., PECK, R.B. (1948) “Soil Mechanics in Engineering Practice”, Wiley: 2nd Ed.,
Revised, 1967. [29] VIOTTI, C.B. (1989), “Emborcação Dam: a “Rankine Lecture Design” Successful Performance”, DE
MELLO TRIBUTE VOL., pp. 517-527, Ed. EDGARD BLUCHER Ltd., Sao Paulo. [30] WALKER, F.C., DAEHN, W.W. (1948), “Ten years of pore pressure measurements” 2nd ICSMFE, Vol.
3, pp. 245-250. [31] WHITMAN, R.V., BAILEY, W.A. (1967), “Use of Computers for Slope Stability Analysis”, Journal
ASCE, 93 (4), pp. 475-498. [32] WRIGHT, S.G. et al (1973), "Accuracy of Equilibrium Slope Stability Analysis”, Journal ASCE, 99
(10), pp. 783-791.


![REAPPRAISING THE REAL ENTITY THEORY OF THE …...REAPPRAISING THE REAL ENTITY THEORY OF THE CORPORATION A s one commentator wrote in 1989, "[c]ritics and advocates agree that a revolution,](https://img.pdfslide.us/doc/110x75/60ea50d1ce0a1f35a5357c31/reappraising-the-real-entity-theory-of-the-reappraising-the-real-entity-theory.jpg)