Embed Size (px)
Citation preview
IntroductionThis report discusses the modeling results for one of seven study cases included in the 20-year analysis. The results discussed within the report include comparisons to the 2032 Reference Case. The basis for this and all other 20-year studies is the 2032 Reference Case Report. Thus, it is highly recommended that readers begin with the 2032 Reference Case Report as it contains explanations of modeling methodologies, limitations and cross-cutting results, which are pertinent to, but not repeated, within this document.
TEPPC uses a scenario-based approach to manage the uncertainties inherent in long-term transmission planning, where capital investments are large, infrastructure lead times are long, and the industry is at the mercy of future economic conditions that are impossible to predict. A key advantage of creating scenarios to identify strategic choices for transmission expansion planning is that they are “plausible” futures that consider a broad range of drivers. Rather than being strictly hypothetical, they describe a set of economic, social, technological and societal circumstances that could reasonably come to pass. Although it is not possible to predict the future, scenario development allows planners to identify strategic choices that planners, developers, regulators and advocates may reasonably need to make in the future.
The following briefly describes Scenario 2 - Focus on Clean Energy:
“This is a world in which the economic gloom from the 2008-2010 recession turns around because of effective economic policies and a technological rebound that shows the power of innovation to restructure markets and industries. Initially tough, but ultimately correct, policy changes address the damage done to financial markets from the credit crisis and lead to a properly functioning financial industry that invests in real assets. Some of those real assets are rebuilding and retooling a cleaner, smarter, more energy efficient and flexible energy infrastructure as new environmental policies encourage investment that will support long-term competitive advantages for the nation and states in the Western Interconnection.
Positive developments in the global economy, including growth in trade and further economic expansion in developing nations, benefit the U.S. overall. After an adjustment period, new policies address concerns about climate change and the costs of economic externalities. Investment surges into technological innovations in the energy market and other industries, creating a greener and more solid long-term foundation for job growth. However, there is a zigzag nature to this greening change as policies to protect the jobs in, and the economic power of, the fossil fuel industry are also enacted with care in addressing emerging environmental policies. Innovative products shape a more efficient,
Page 1 of 31
Scenario 2Focus on Clean Energy
September 19, 2013

2032 Scenario 2 – “Focus on Clean Energy”
interconnected and intelligent business environment. Companies in the power industry are also revising their business models to compete with new entrants and provide new information-intensive services using smart-grid approaches.
With some periods of policy adjustment and adaptation, the Western Interconnection, home to many of the emerging industries shaping the world, leads the transformation to a more environmentally responsible marketplace and enters a new period of long-term growth.
This is a story of persistent, long-term change toward a greener and more sustainable power system. However, the path there has some challenges with financial adjustments within the power industry and periods of internally inconsistent national energy policies.”
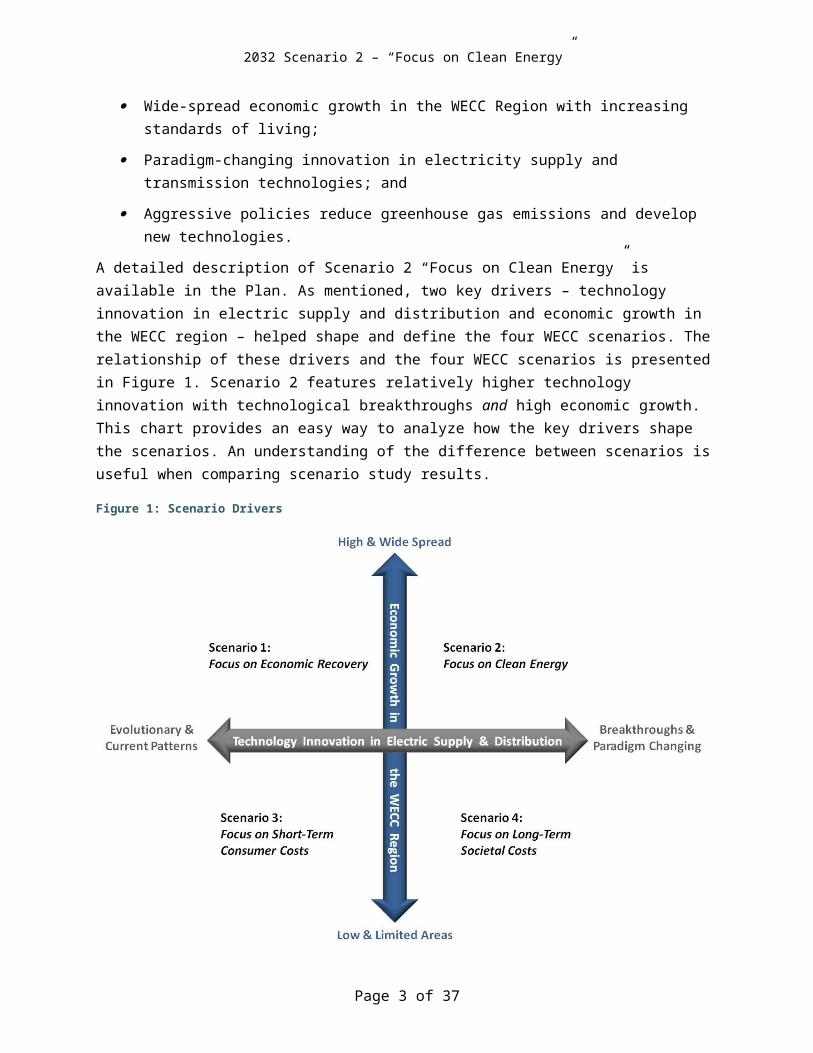
In summary, Scenario 2 depicts a future “Focused on Clean Energy” with the following key characteristics:
Wide-spread economic growth in the WECC Region with increasing standards of living;
Paradigm-changing innovation in electricity supply and transmission technologies; and
Aggressive policies reduce greenhouse gas emissions and develop new technologies.
A detailed description of Scenario 2 “Focus on Clean Energy” is available in the Plan. As mentioned, two key drivers – technology innovation in electric supply and distribution and economic growth in the WECC region – helped shape and define the four WECC scenarios. The relationship of these drivers and the four WECC scenarios is presented in Figure 1. Scenario 2 features relatively higher technology innovation with technological breakthroughs and high economic growth. This chart provides an easy way to analyze how the key drivers shape the scenarios. An understanding of the difference between scenarios is useful when comparing scenario study results.
Page 2 of 31
2032 Scenario 2 – “Focus on Clean Energy”
Figure 1: Scenario Drivers
Key QuestionsScenario 2 hopes to answer some key stakeholder questions, including the following:
What transmission is added by the Long-term Planning Tool (LTPT) in the 2022-2032 timeframe?
What is the generation build-out associated with this transmission? How did study assumptions impact CO2 emissions? How do the aforementioned results compare with the 2032 Reference Case and the
other WECC scenarios?
Study LimitationsIn the next planning cycle, WECC can build upon its early success with the LTPT and the 20-year study methodology by making improvements to the model to enhance the tool’s ability to address stakeholder study requests. A number of limitations and areas for enhancement have been identified and are described in the 2032 Reference Case report.
A more extensive list of model limitations is provided in the Tools and Models section, where the LTPT model is explained in detail.
Page 3 of 31
2032 Scenario 2 – “Focus on Clean Energy”
Input AssumptionsAll 2032 study cases are constructed from the 2032 Reference Case, as a starting point. As such, a number of the assumptions used to construct the 2032 Reference Case are carried through to each subsequent study. This is especially true with regard to detailed modeling assumptions – these rarely change from study to study. Generally, only assumptions about load levels, generator and transmission technology costs, and fuel pricing change for a particular 20-year study. Full 2032 Reference Case assumption are available in the Tools and Models, Data and Assumptions, and 2032 Reference Case reports.
The following is a description of the assumptions specific to Scenario 2, however, the assumptions described here may be an addition or alternative to those assumptions used in the 2032 Reference Case.
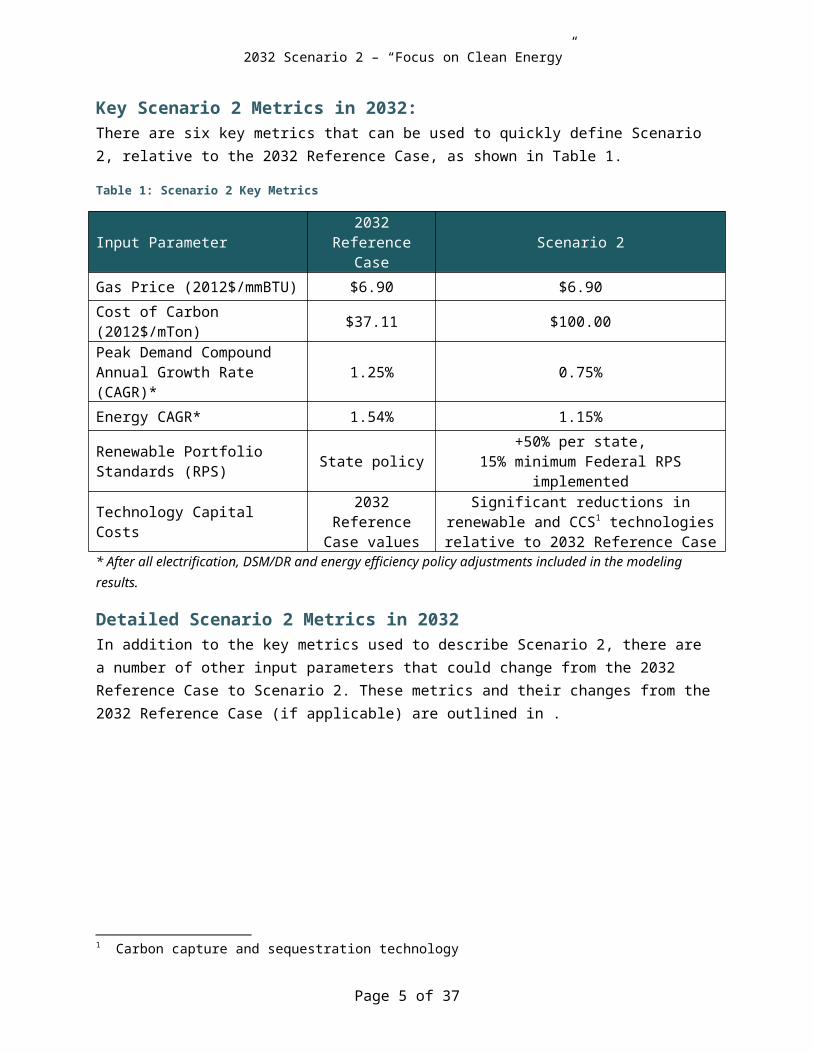
Key Scenario 2 Metrics in 2032:There are six key metrics that can be used to quickly define Scenario 2, relative to the 2032 Reference Case, as shown in Table 1.
Table 1: Scenario 2 Key Metrics
Input Parameter 2032 Reference Case Scenario 2
Gas Price (2012$/mmBTU) $6.90 $6.90
Cost of Carbon (2012$/mTon) $37.11 $100.00Peak Demand Compound Annual Growth Rate (CAGR)* 1.25% 0.75%
Energy CAGR* 1.54% 1.15%Renewable Portfolio Standards (RPS) State policy +50% per state,
15% minimum Federal RPS implemented
Technology Capital Costs 2032 Reference Case values
Significant reductions in renewable and CCS1 technologies relative to 2032
Reference Case* After all electrification, DSM/DR and energy efficiency policy adjustments included in the modeling results.
Detailed Scenario 2 Metrics in 2032In addition to the key metrics used to describe Scenario 2, there are a number of other input parameters that could change from the 2032 Reference Case to Scenario 2. These metrics and their changes from the 2032 Reference Case (if applicable) are outlined in .
1 Carbon capture and sequestration technology
Page 4 of 31
2032 Scenario 2 – “Focus on Clean Energy”
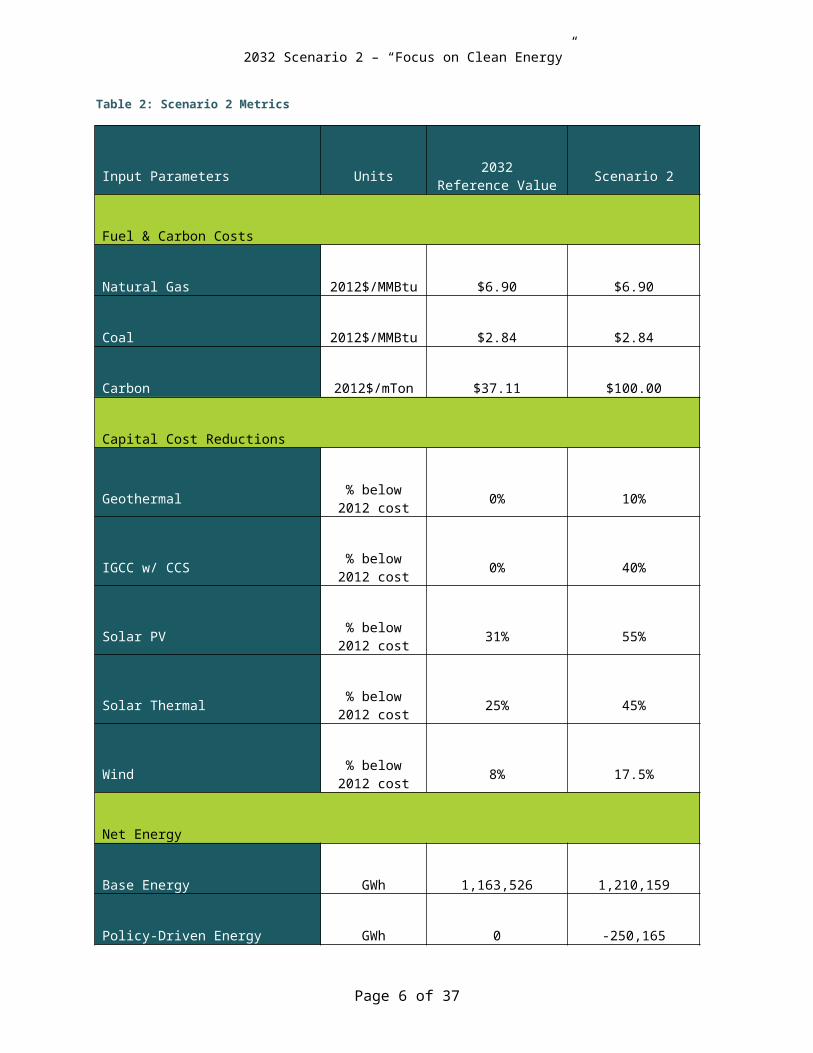
Table 2: Scenario 2 Metrics
Page 5 of 31
2032 Scenario 2 – “Focus on Clean Energy”
Input Parameters Units 2032Reference Value Scenario 2
Fuel & Carbon Costs
Natural Gas 2012$/MMBtu $6.90 $6.90
Coal 2012$/MMBtu $2.84 $2.84
Carbon 2012$/mTon $37.11 $100.00
Capital Cost Reductions
Geothermal % below 2012 cost 0% 10%
IGCC w/ CCS % below 2012 cost 0% 40%
Solar PV % below 2012 cost 31% 55%
Solar Thermal % below 2012 cost 25% 45%
Wind % below 2012 cost 8% 17.5%
Net Energy
Base Energy GWh 1,163,526 1,210,159
Policy-Driven Energy Reductions GWh 0 -250,165
Policy-Driven Electrification GWh 0 +160,000
WECC Net Energy GWh 1,163,526 1,119,994
Page 6 of 31

2032 Scenario 2 – “Focus on Clean Energy”
Input Parameters Units 2032Reference Value Scenario 2
Implied Growth Rate, Unadjusted Load %/yr 1.54% 1.93%
Implied Growth Rate, Adjusted Load %/yr 1.54% 1.15%
Coincident Peak Demand
Base Demand MW 198,715 206,685
Policy-Driven Demand Reductions MW -3,780 -48,553
Policy-Driven Electrification MW 0 +27,327
WECC Coincident Peak MW 194,935 185,458
Implied Growth Rate, Unadjusted Load %/yr 1.45% 1.85%
Implied Growth Rate, Adjusted Load %/yr
1.25% 0.75%
Renewable Goals
State RPS % of Load Energy Current state policies
Current state policies, increased
by 50%
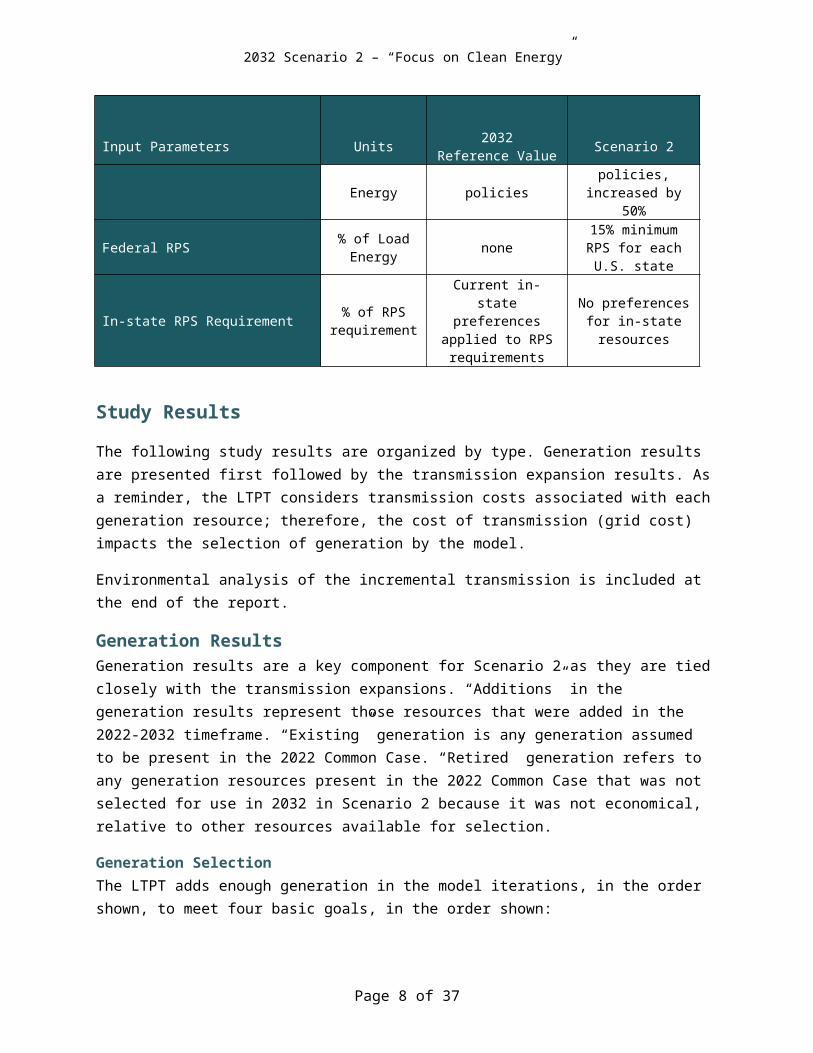
Federal RPS % of Load Energy none 15% minimum RPS
for each U.S. state
In-state RPS Requirement % of RPS requirement
Current in-state preferences applied to RPS requirements
No preferences for in-state resources
Page 7 of 31
2032 Scenario 2 – “Focus on Clean Energy”
Study Results
The following study results are organized by type. Generation results are presented first followed by the transmission expansion results. As a reminder, the LTPT considers transmission costs associated with each generation resource; therefore, the cost of transmission (grid cost) impacts the selection of generation by the model.
Environmental analysis of the incremental transmission is included at the end of the report.
Generation ResultsGeneration results are a key component for Scenario 2 as they are tied closely with the transmission expansions. “Additions” in the generation results represent those resources that were added in the 2022-2032 timeframe. “Existing” generation is any generation assumed to be present in the 2022 Common Case. “Retired” generation refers to any generation resources present in the 2022 Common Case that was not selected for use in 2032 in Scenario 2 because it was not economical, relative to other resources available for selection.
Generation Selection The LTPT adds enough generation in the model iterations, in the order shown, to meet four basic goals, in the order shown:
Local policy goals – for most study cases, including the 2032 Reference Case, this is generally distributed generation (DG) set asides specified in state RPS policies;
Generic policy goals – generally state RPS requirements;
System energy goals – annual energy required by the system. The model will add resources in addition to those already selected for policy goals until this goal is met;
System peak goal – to ensure the system has enough resources to meet the system peak being analyzed.
The LTPT selects resources for the model based on the levelized cost of energy (LCOE) for each of these goals system wide (i.e., resource deliverability is not considered in resource selections).
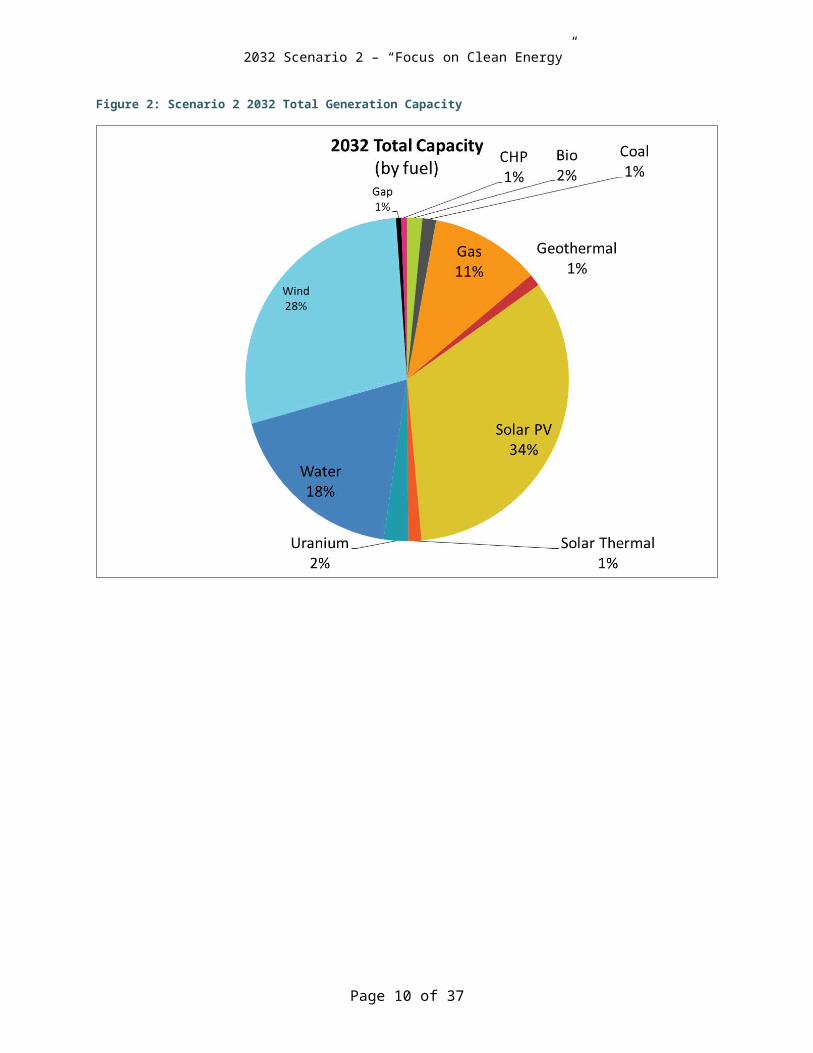
Total Capacity and AdditionsDue to breakthroughs in energy efficiency and demand response technologies, Scenario 2 assumed a lower energy requirement and peak demand than in the 2032 Reference Case. However, due to the “retirement” of existing 2022 generation, more resource capacity was added by the model in Scenario 2, as compared to the 2032 Reference Case. The final resource capacity in 2032 for Scenario 2 was ~397,000 MW. The Scenario 2 breakdown of the 2032 total generation capacity by resource type is provided in Figure 2.The majority of this capacity comes from wind and solar resources that combine to 63 percent of the total capacity in the Western Interconnection. Notably, there were very few dispatchable resources such as coal, gas and hydro in this future. This is largely attributed to the high CO2 price of $100 per metric ton criterion of the study, which caused a large amount of existing gas and coal generation to be displaced by new renewable generation additions, primarily solar and wind..
Page 8 of 31

2032 Scenario 2 – “Focus on Clean Energy”
Note that Figure 2 introduces the term “gap resources,” which are gas resources used in Alberta to serve load.
Figure 2: Scenario 2 2032 Total Generation Capacity
Page 9 of 31
2032 Scenario 2 – “Focus on Clean Energy”
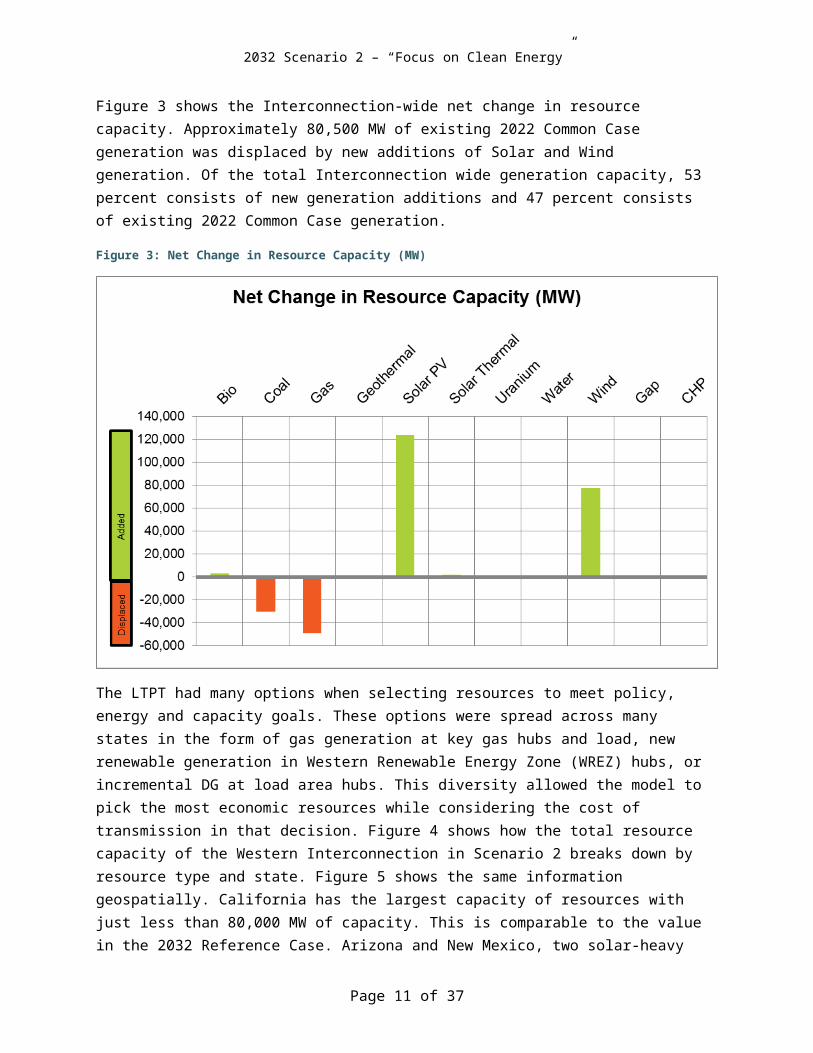
Figure 3 shows the Interconnection-wide net change in resource capacity. Approximately 80,500 MW of existing 2022 Common Case generation was displaced by new additions of Solar and Wind generation. Of the total Interconnection wide generation capacity, 53 percent consists of new generation additions and 47 percent consists of existing 2022 Common Case generation.
Figure 3: Net Change in Resource Capacity (MW)
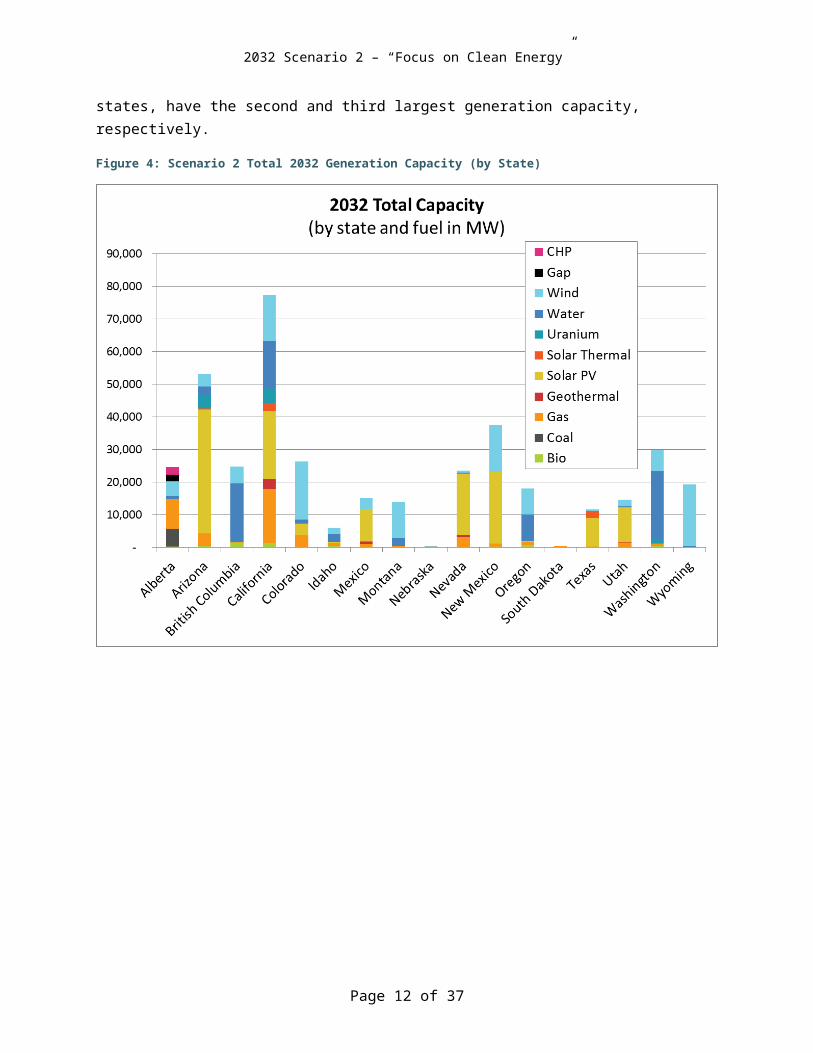
The LTPT had many options when selecting resources to meet policy, energy and capacity goals. These options were spread across many states in the form of gas generation at key gas hubs and load, new renewable generation in Western Renewable Energy Zone (WREZ) hubs, or incremental DG at load area hubs. This diversity allowed the model to pick the most economic resources while considering the cost of transmission in that decision. Figure 4 shows how the total resource capacity of the Western Interconnection in Scenario 2 breaks down by resource type and state. Figure 5 shows the same information geospatially. California has the largest capacity of resources with just less than 80,000 MW of capacity. This is comparable to the value in the 2032 Reference Case. Arizona and New Mexico, two solar-heavy states, have the second and third largest generation capacity, respectively.
Page 10 of 31
2032 Scenario 2 – “Focus on Clean Energy”
Figure 4: Scenario 2 Total 2032 Generation Capacity (by State)
Page 11 of 31
2032 Scenario 2 – “Focus on Clean Energy”
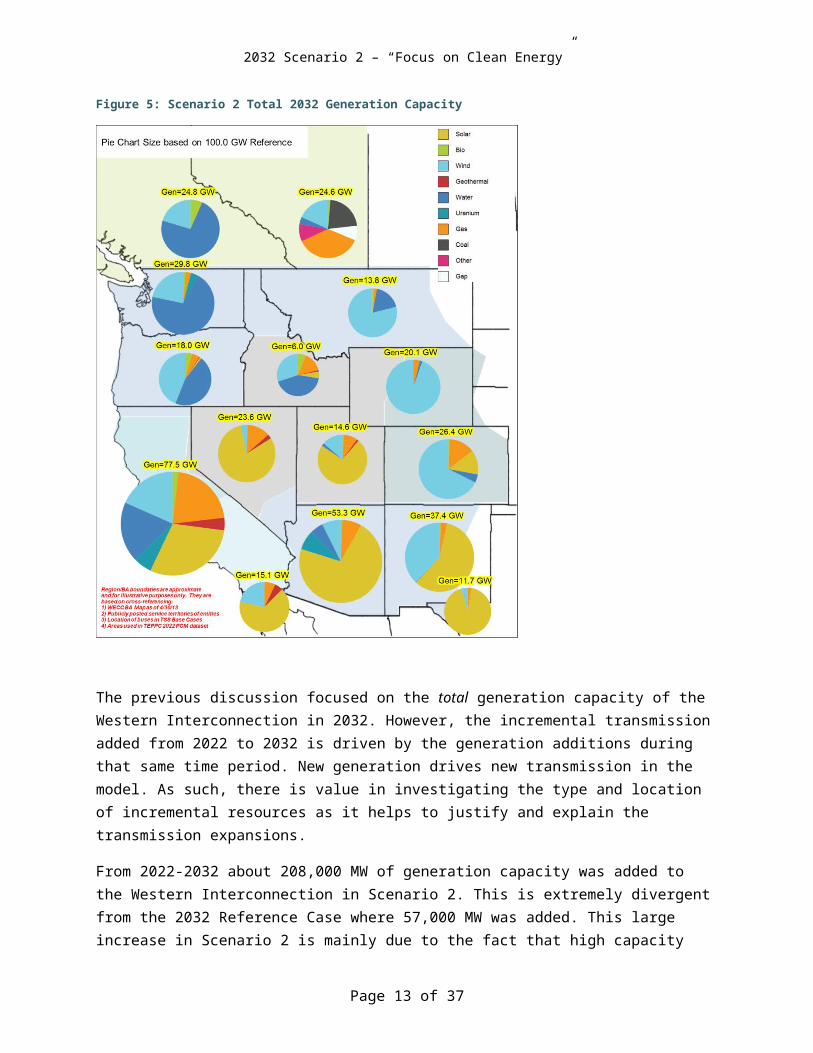
Figure 5: Scenario 2 Total 2032 Generation Capacity
The previous discussion focused on the total generation capacity of the Western Interconnection in 2032. However, the incremental transmission added from 2022 to 2032 is driven by the generation additions during that same time period. New generation drives new transmission in the model. As such, there is value in investigating the type and location of incremental resources as it helps to justify and explain the transmission expansions.
From 2022-2032 about 208,000 MW of generation capacity was added to the Western Interconnection in Scenario 2. This is extremely divergent from the 2032 Reference Case where 57,000 MW was added. This large increase in Scenario 2 is mainly due to the fact that high capacity factor energy resources such as coal and gas generation were not utilized by the model due to the high carbon price ($100/mTon), as previously described. Since this existing generation was no longer economic and was effectively retired, the model had no choice but to select large amounts of new alternative resources – mainly wind and solar. The added
Page 12 of 31
2032 Scenario 2 – “Focus on Clean Energy”
resources are broken down by resource type in Figure 6. Note that only wind and solar were added – no new gas-fired generation was selected during the 2022-2032 timeframe.
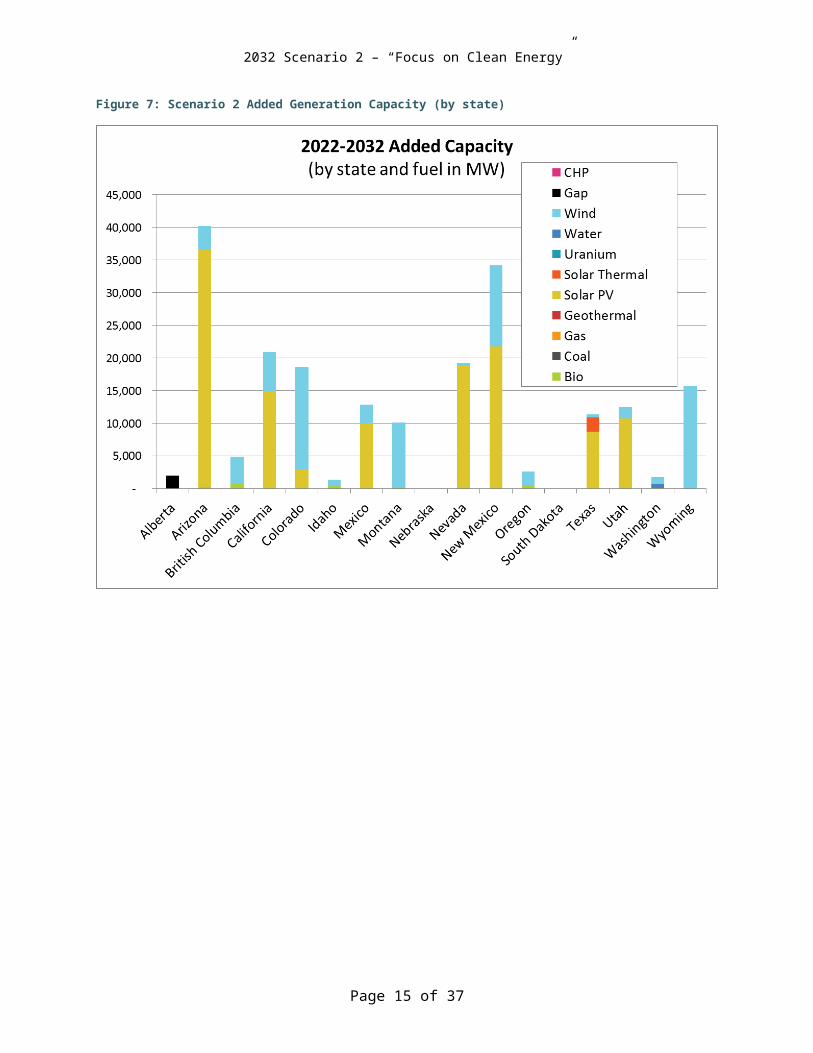
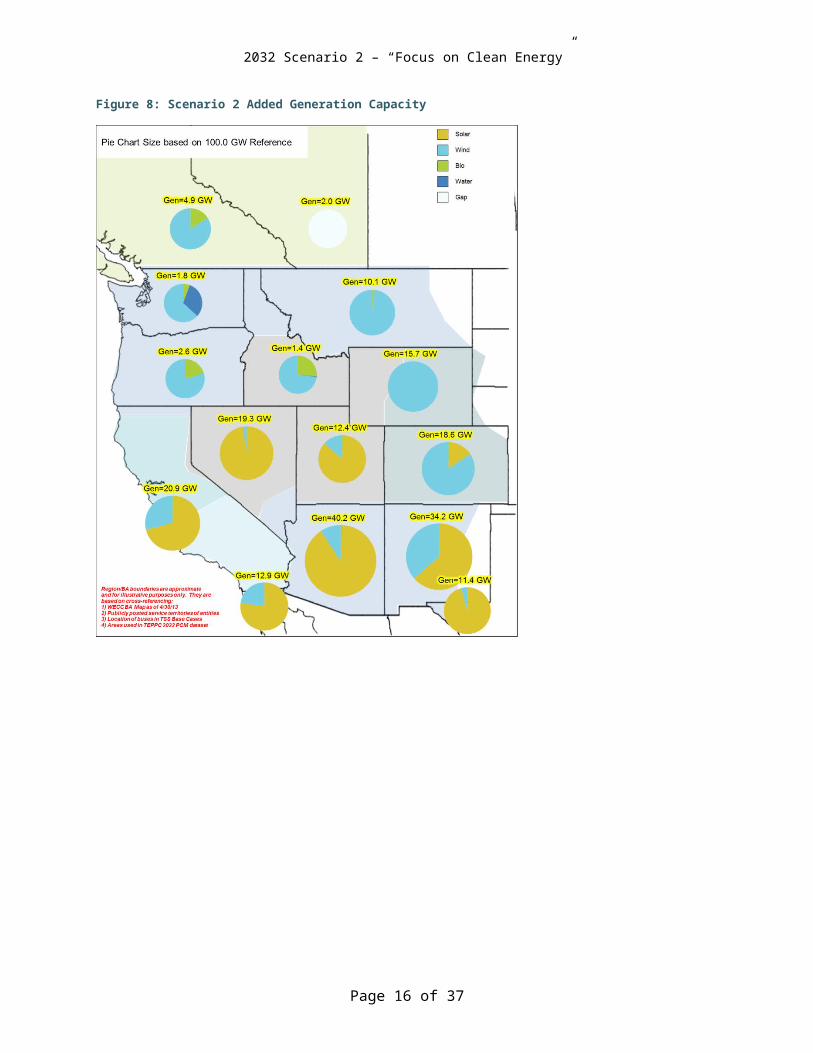
The incremental resources are further broken down by state and resource type in Figure 7. Figure 8 shows the same information geospatially. The majority of solar resources were added in Arizona, New Mexico and Nevada. Most of the wind resources were added in Wyoming, Colorado, Montana and New Mexico.
Figure 6: Scenario 2 Added Generation Capacity
Page 13 of 31

2032 Scenario 2 – “Focus on Clean Energy”
Figure 7: Scenario 2 Added Generation Capacity (by state)
Page 14 of 31
2032 Scenario 2 – “Focus on Clean Energy”
Figure 8: Scenario 2 Added Generation Capacity
Page 15 of 31
2032 Scenario 2 – “Focus on Clean Energy”
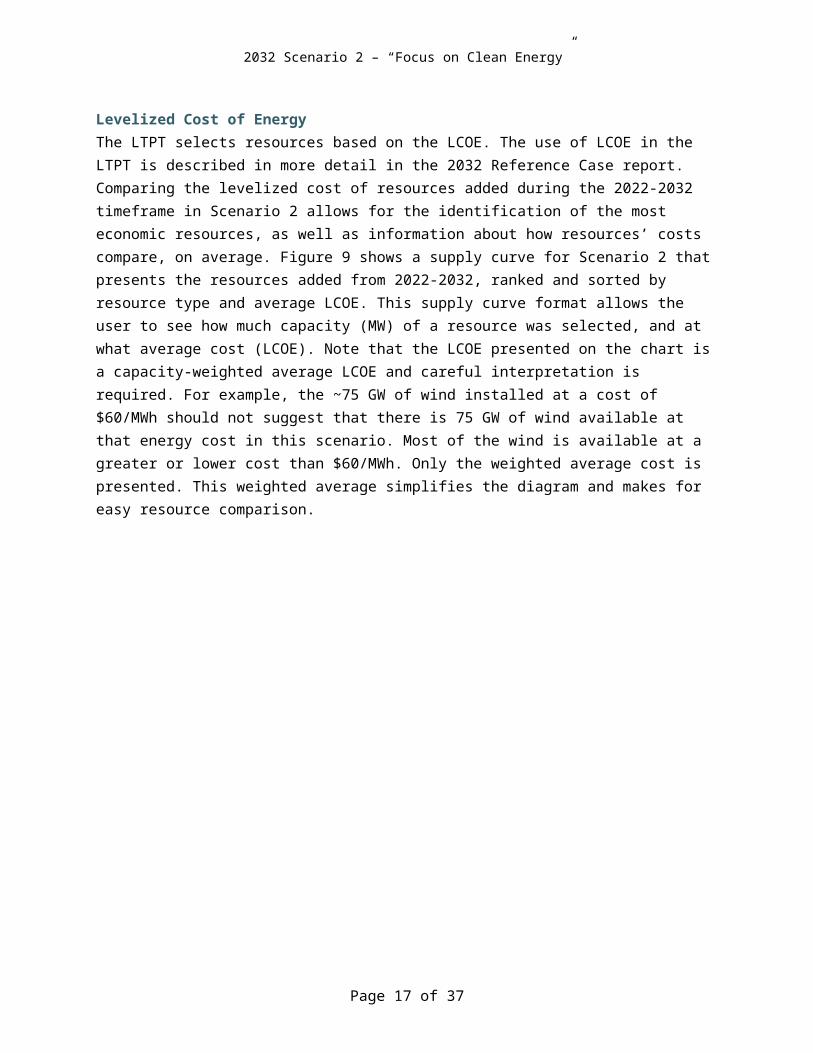
Levelized Cost of EnergyThe LTPT selects resources based on the LCOE. The use of LCOE in the LTPT is described in more detail in the 2032 Reference Case report. Comparing the levelized cost of resources added during the 2022-2032 timeframe in Scenario 2 allows for the identification of the most economic resources, as well as information about how resources’ costs compare, on average. Figure 9 shows a supply curve for Scenario 2 that presents the resources added from 2022-2032, ranked and sorted by resource type and average LCOE. This supply curve format allows the user to see how much capacity (MW) of a resource was selected, and at what average cost (LCOE). Note that the LCOE presented on the chart is a capacity-weighted average LCOE and careful interpretation is required. For example, the ~75 GW of wind installed at a cost of $60/MWh should not suggest that there is 75 GW of wind available at that energy cost in this scenario. Most of the wind is available at a greater or lower cost than $60/MWh. Only the weighted average cost is presented. This weighted average simplifies the diagram and makes for easy resource comparison.
Figure 9: 2022-2032 Resource Additions LCOE Supply Curve (2012 dollars)
Page 16 of 31
2032 Scenario 2 – “Focus on Clean Energy”
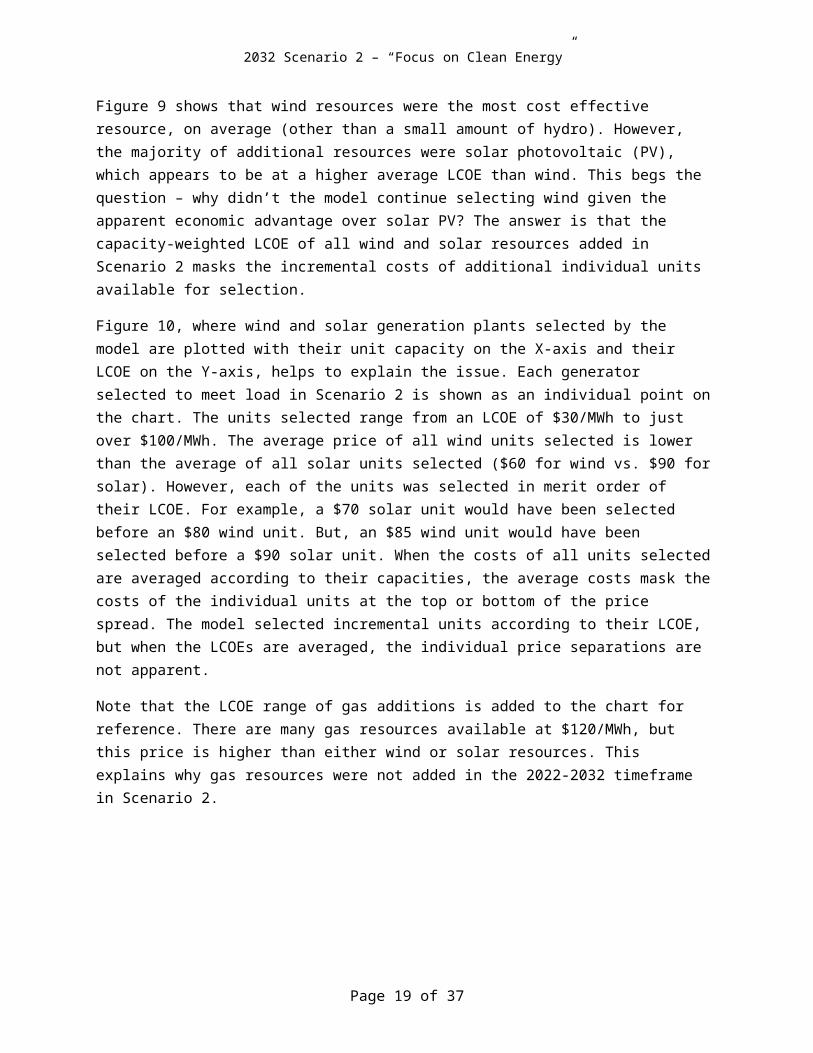
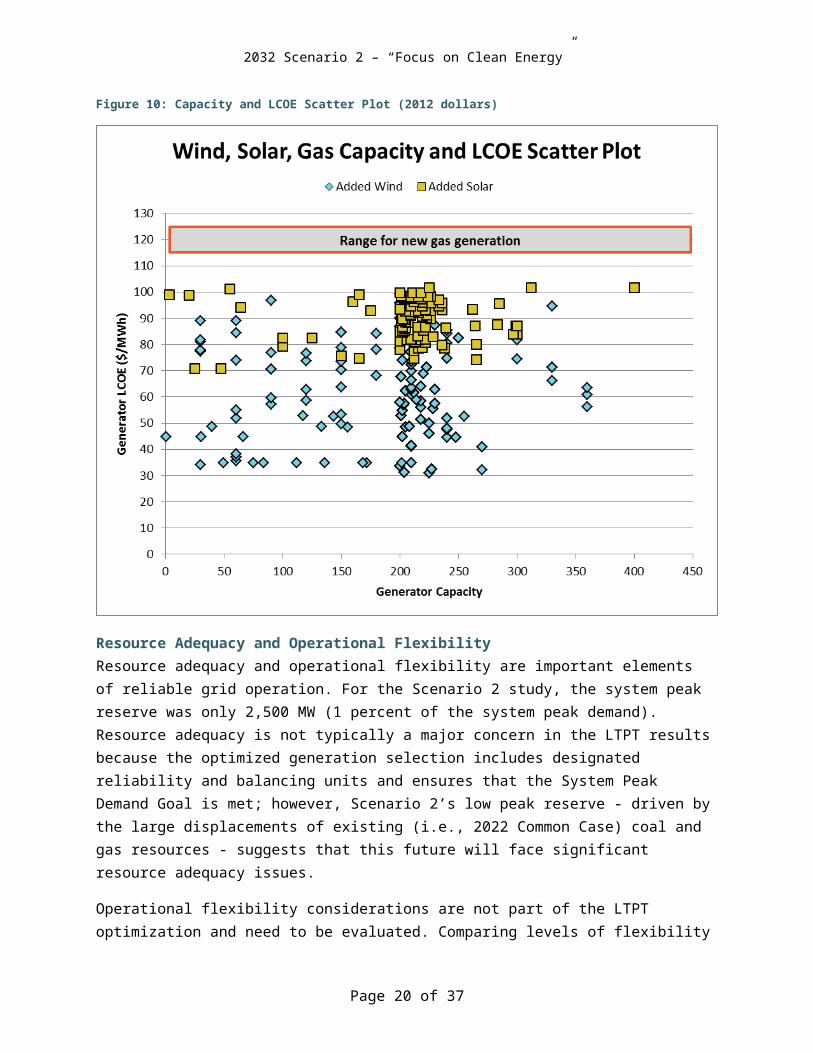
Figure 9 shows that wind resources were the most cost effective resource, on average (other than a small amount of hydro). However, the majority of additional resources were solar photovoltaic (PV), which appears to be at a higher average LCOE than wind. This begs the question – why didn’t the model continue selecting wind given the apparent economic advantage over solar PV? The answer is that the capacity-weighted LCOE of all wind and solar resources added in Scenario 2 masks the incremental costs of additional individual units available for selection.
Figure 10, where wind and solar generation plants selected by the model are plotted with their unit capacity on the X-axis and their LCOE on the Y-axis, helps to explain the issue. Each generator selected to meet load in Scenario 2 is shown as an individual point on the chart. The units selected range from an LCOE of $30/MWh to just over $100/MWh. The average price of all wind units selected is lower than the average of all solar units selected ($60 for wind vs. $90 for solar). However, each of the units was selected in merit order of their LCOE. For example, a $70 solar unit would have been selected before an $80 wind unit. But, an $85 wind unit would have been selected before a $90 solar unit. When the costs of all units selected are averaged according to their capacities, the average costs mask the costs of the individual units at the top or bottom of the price spread. The model selected incremental units according to their LCOE, but when the LCOEs are averaged, the individual price separations are not apparent.
Note that the LCOE range of gas additions is added to the chart for reference. There are many gas resources available at $120/MWh, but this price is higher than either wind or solar resources. This explains why gas resources were not added in the 2022-2032 timeframe in Scenario 2.
Page 17 of 31
2032 Scenario 2 – “Focus on Clean Energy”
Figure 10: Capacity and LCOE Scatter Plot (2012 dollars)
Resource Adequacy and Operational FlexibilityResource adequacy and operational flexibility are important elements of reliable grid operation. For the Scenario 2 study, the system peak reserve was only 2,500 MW (1 percent of the system peak demand). Resource adequacy is not typically a major concern in the LTPT results because the optimized generation selection includes designated reliability and balancing units and ensures that the System Peak Demand Goal is met; however, Scenario 2’s low peak reserve - driven by the large displacements of existing (i.e., 2022 Common Case) coal and gas resources - suggests that this future will face significant resource adequacy issues.
Operational flexibility considerations are not part of the LTPT optimization and need to be evaluated. Comparing levels of flexibility from study case results with levels from a system known to be reliable (i.e., today’s grid) enables the identification of potential future operational challenges and areas for additional evaluation. To make this comparison, TEPPC developed the Flexible Resource Indicator, the calculation for which is shown below. A detailed description of the Flexible Resource Indicator and its use in the 20-year analysis can be found in the 2032 Reference Case report.
Page 18 of 31
2032 Scenario 2 – “Focus on Clean Energy”
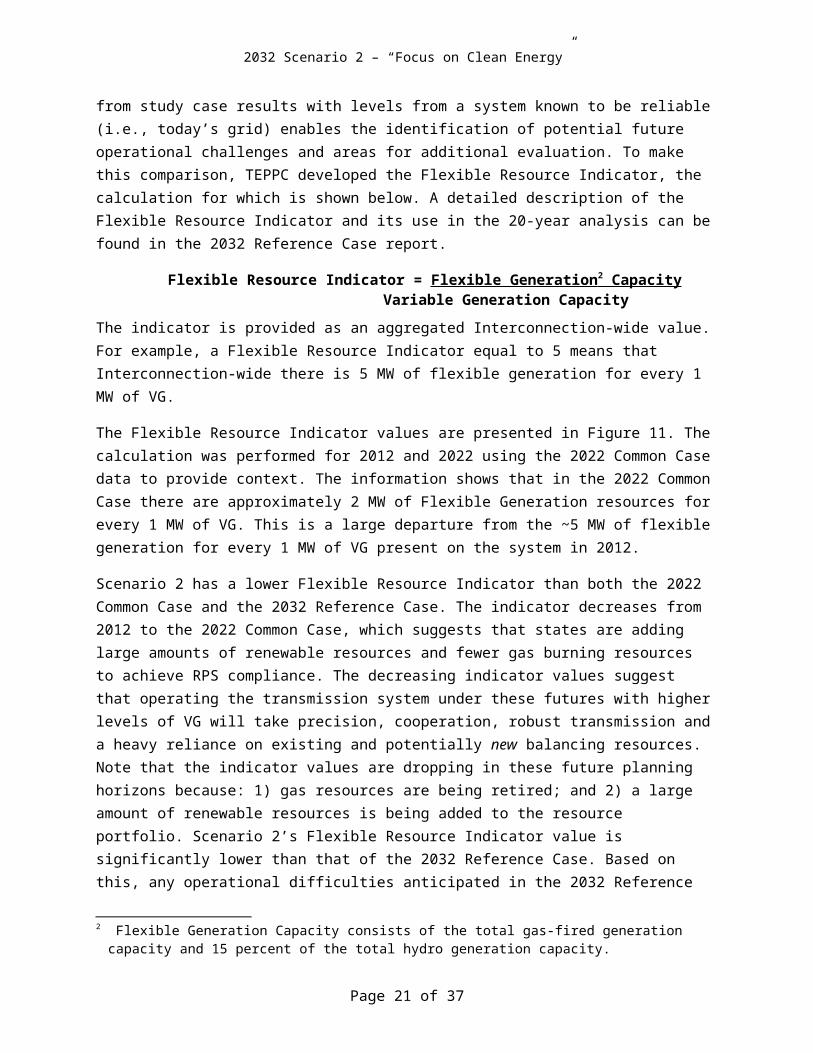
Flexible Resource Indicator = Flexible Generation 2 Capacity Variable Generation Capacity
The indicator is provided as an aggregated Interconnection-wide value. For example, a Flexible Resource Indicator equal to 5 means that Interconnection-wide there is 5 MW of flexible generation for every 1 MW of VG.
The Flexible Resource Indicator values are presented in Figure 11. The calculation was performed for 2012 and 2022 using the 2022 Common Case data to provide context. The information shows that in the 2022 Common Case there are approximately 2 MW of Flexible Generation resources for every 1 MW of VG. This is a large departure from the ~5 MW of flexible generation for every 1 MW of VG present on the system in 2012.
Scenario 2 has a lower Flexible Resource Indicator than both the 2022 Common Case and the 2032 Reference Case. The indicator decreases from 2012 to the 2022 Common Case, which suggests that states are adding large amounts of renewable resources and fewer gas burning resources to achieve RPS compliance. The decreasing indicator values suggest that operating the transmission system under these futures with higher levels of VG will take precision, cooperation, robust transmission and a heavy reliance on existing and potentially new balancing resources. Note that the indicator values are dropping in these future planning horizons because: 1) gas resources are being retired; and 2) a large amount of renewable resources is being added to the resource portfolio. Scenario 2’s Flexible Resource Indicator value is significantly lower than that of the 2032 Reference Case. Based on this, any operational difficulties anticipated in the 2032 Reference Case future will likely be exacerbated in the Scenario 2 future given how few gas balancing resources there are as compared to the amount of VG.
Figure 11: Flexible Resource Indicator
2 Flexible Generation Capacity consists of the total gas-fired generation capacity and 15 percent of the total hydro generation capacity.
Page 19 of 31
2032 Scenario 2 – “Focus on Clean Energy”
The complementary nature of wind and solar is not considered in the Flexible Resource Indicator. The indicator is designed to point out operational complexities that may arise with large penetrations of VG. The indicator is also useful in identifying futures that look similar to the grid today, or those futures that may look and operate substantially differently. A more detailed and thorough analysis is required to evaluate the plausibility of operating these types of high-VG systems. The indicator’s value is by no means conclusive or prohibitive of these futures.
Transmission ResultsWhen reviewing the transmission results, recall that these are modeling results based on the input parameters. The results can inform choices about transmission expansion, but many factors contribute to ultimate decisions about building or not building any specific transmission expansion. As mentioned previously, all of the transmission results are AC expansions. The LTPT has the capability to evaluate and choose DC expansions; however, these were not fully explored due to time restrictions.
The LTPT consistently showed expansions near the California Bay Area and between the Washington load areas. These are due to the high concentration and close proximity of load areas in these portions of the Western Interconnection. The focus of the LTPT studies is on transmission connections between load areas in the Western Interconnection, thus assumptions were made about transmission reinforcements within TEPPC load areas and between close proximity load areas - refer to the Tools and Models report for more detail on the LTPT modeling and limitations. The flows between load areas can depend on the reinforcement internal to load areas, especially when load areas are in close proximity and they are all reinforced internally. Such is the case with the California Bay Area and between the Washington load areas. These portions of the Western Interconnection are very sensitive to transmission and generation dispatch changes, whether they are regional or internal to load areas. In future LTPT models, it may be better to aggregate load areas that are in close proximity so that the focus remains on Interconnection-wide planning.
The results for Scenario 2 are a good illustration of how great the difference in energy futures may depend on how the Scenario criteria are crafted – the criteria for Scenario 2 include a high carbon cost ($100/mTon) and solar cost breakthroughs (lower capital investment cost). This causes a very large amount of existing thermal generation to be displaced by a large amount of new renewable generation, particularly that of solar. The diversity and potential of renewable resources are captured within the LTPT model by geospatial and temporal data obtained by the National Renewable Energy Laboratory (NREL), which is aggregated and represented at WREZ hubs. The existing transmission grid is built around existing thermal generation resources, thus, an extensive transmission expansion is required when large amounts of existing thermal generation are displaced by large amounts of new renewable generation. Within the LTPT, existing generation resources are modeled close to load centers whereas new renewable generation resources are modeled at WREZ hubs that are typically remote from load centers. The result is tha the majority of the large expansions are needed to distribute the large renewable injections at the remote WREZ hubs to the load hubs. In particular, an extensive transmission expansion emanating from the Southwest portion of the Western Interconnection is driven by a large amount of solar generation additions in the Southwest for this Scenario.
Page 20 of 31
2032 Scenario 2 – “Focus on Clean Energy”
Figure 12 presents the expansions that were added in all of the system condition transmission expansions. Any project that was added by the transmission model in any one of the four system conditions is shown on the map. There were some expansions that only appeared in one system conditions, while there were others that were added regardless of the system condition analyzed. The Scenario 2 expansion was extremely large and encompassed almost the entire Western Interconnection and are driven primarily by the large additions of wind and solar generation. Solar drives the expansion in the Southwest while wind is the key driver in the eastern portion of the Western Interconnection. The results for Scenario 2 are a good illustration of how great the difference in energy futures may depend on how the Scenario criteria are crafted - the criteria for Scenario 2 include a high carbon cost ($100/mTon) and solar cost breakthroughs (lower capital investment cost), which causes a very large amount of existing thermal generation to be displaced by a large amount of new renewable generation, particularly that of solar. The diversity and potential of renewable resources are captured within the LTPT model by geospatial and temporal data obtained by the National Renewable Energy Laboratory (NREL), which is aggregated and represented at WREZ hubs. The existing transmission grid is built around existing thermal generation resources, thus an extensive transmission expansion is required when large amounts of existing thermal generation are displaced by large amounts of new renewable generation. Within the LTPT, existing generation resources are modeled close to load centers whereas new renewable generation resources are modeled at WREZ hubs which are typically remote from load centers. The result is that the majority of the large expansions are needed to distribute the large renewable injections at the remote WREZ hubs to the load hubs. In particular, an extensive transmission expansion emanating from the Southwest portion of the Western Interconnection is driven by a large amount of solar generation additions in the Southwest for this Scenario.
Page 21 of 31
2032 Scenario 2 – “Focus on Clean Energy”
Figure 12: Scenario 2 All Expansions
Page 22 of 31
2032 Scenario 2 – “Focus on Clean Energy”
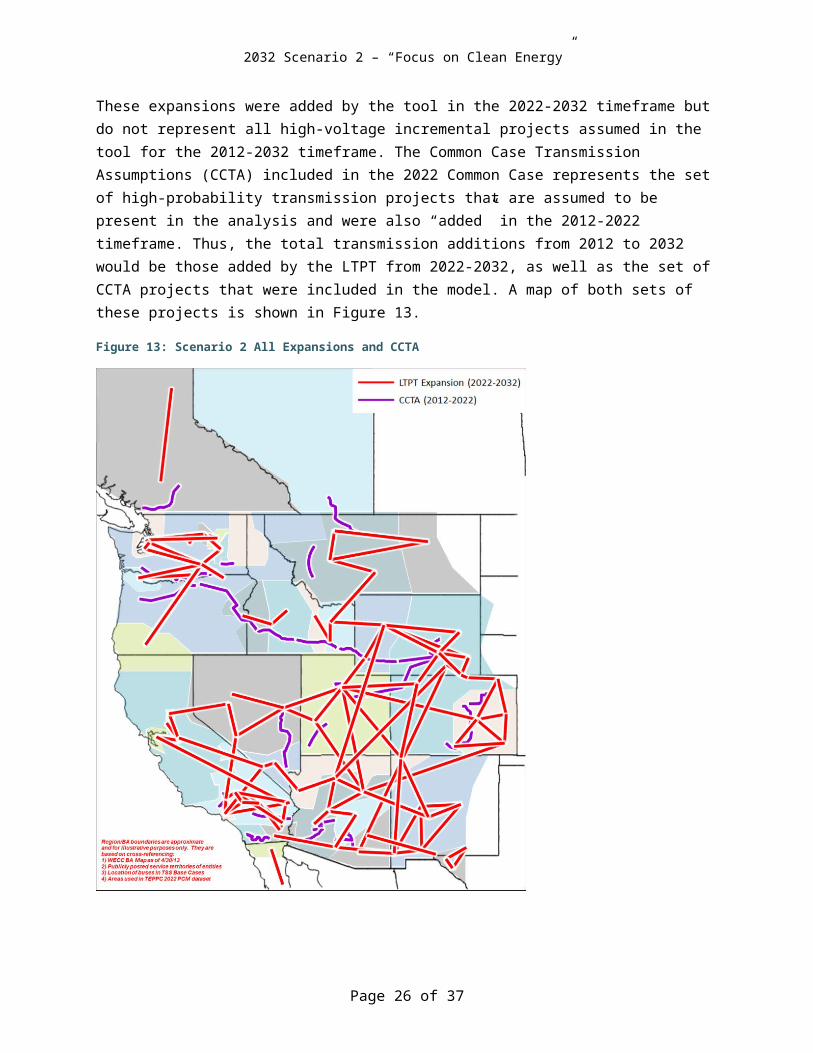
These expansions were added by the tool in the 2022-2032 timeframe but do not represent all high-voltage incremental projects assumed in the tool for the 2012-2032 timeframe. The Common Case Transmission Assumptions (CCTA) included in the 2022 Common Case represents the set of high-probability transmission projects that are assumed to be present in the analysis and were also “added” in the 2012-2022 timeframe. Thus, the total transmission additions from 2012 to 2032 would be those added by the LTPT from 2022-2032, as well as the set of CCTA projects that were included in the model. A map of both sets of these projects is shown in Figure 13.
Figure 13: Scenario 2 All Expansions and CCTA
Page 23 of 31

2032 Scenario 2 – “Focus on Clean Energy”
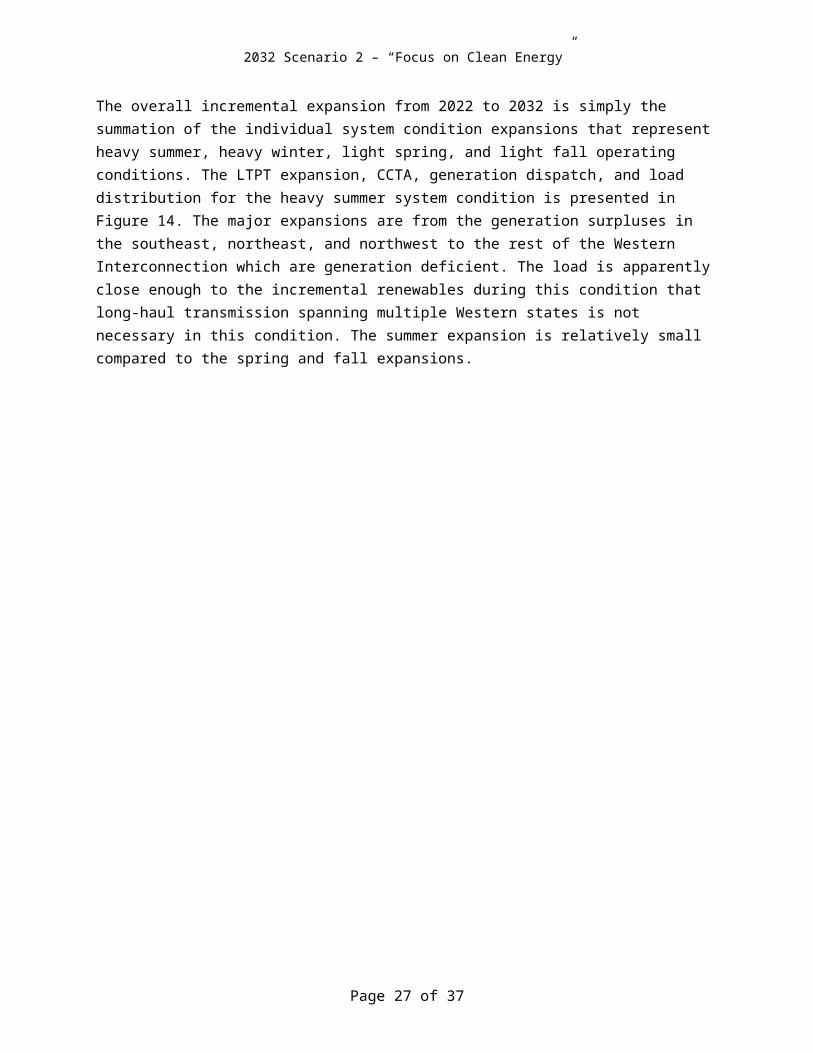
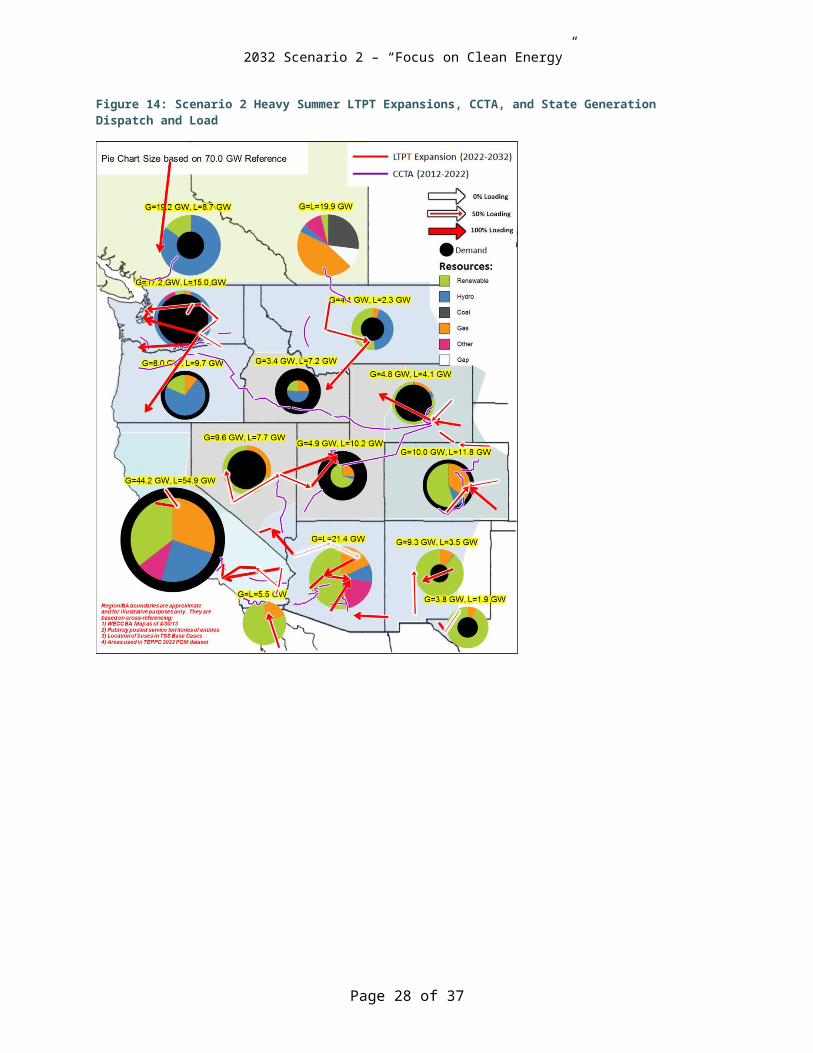
The overall incremental expansion from 2022 to 2032 is simply the summation of the individual system condition expansions that represent heavy summer, heavy winter, light spring, and light fall operating conditions. The LTPT expansion, CCTA, generation dispatch, and load distribution for the heavy summer system condition is presented in Figure 14. The major expansions are from the generation surpluses in the southeast, northeast, and northwest to the rest of the Western Interconnection which are generation deficient. The load is apparently close enough to the incremental renewables during this condition that long-haul transmission spanning multiple Western states is not necessary in this condition. The summer expansion is relatively small compared to the spring and fall expansions.
Figure 14: Scenario 2 Heavy Summer LTPT Expansions, CCTA, and State Generation Dispatch and Load
Page 24 of 31

2032 Scenario 2 – “Focus on Clean Energy”
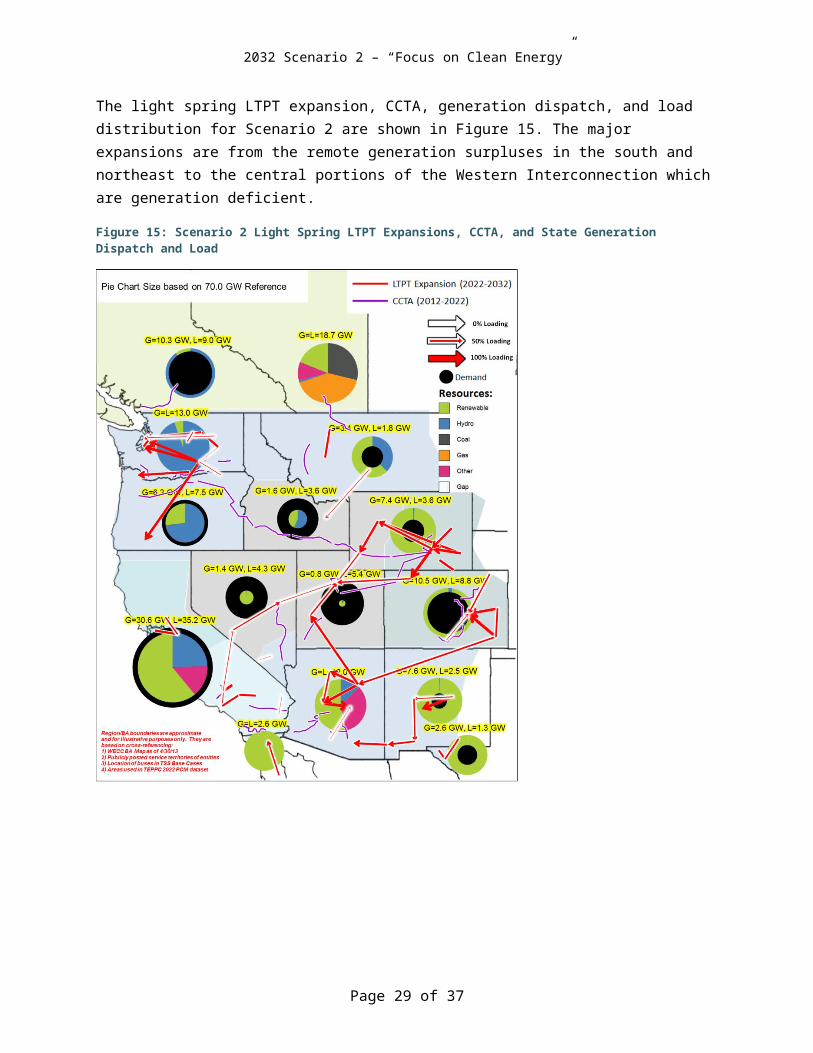
The light spring LTPT expansion, CCTA, generation dispatch, and load distribution for Scenario 2 are shown in Figure 15. The major expansions are from the remote generation surpluses in the south and northeast to the central portions of the Western Interconnection which are generation deficient.
Figure 15: Scenario 2 Light Spring LTPT Expansions, CCTA, and State Generation Dispatch and Load
Page 25 of 31
2032 Scenario 2 – “Focus on Clean Energy”
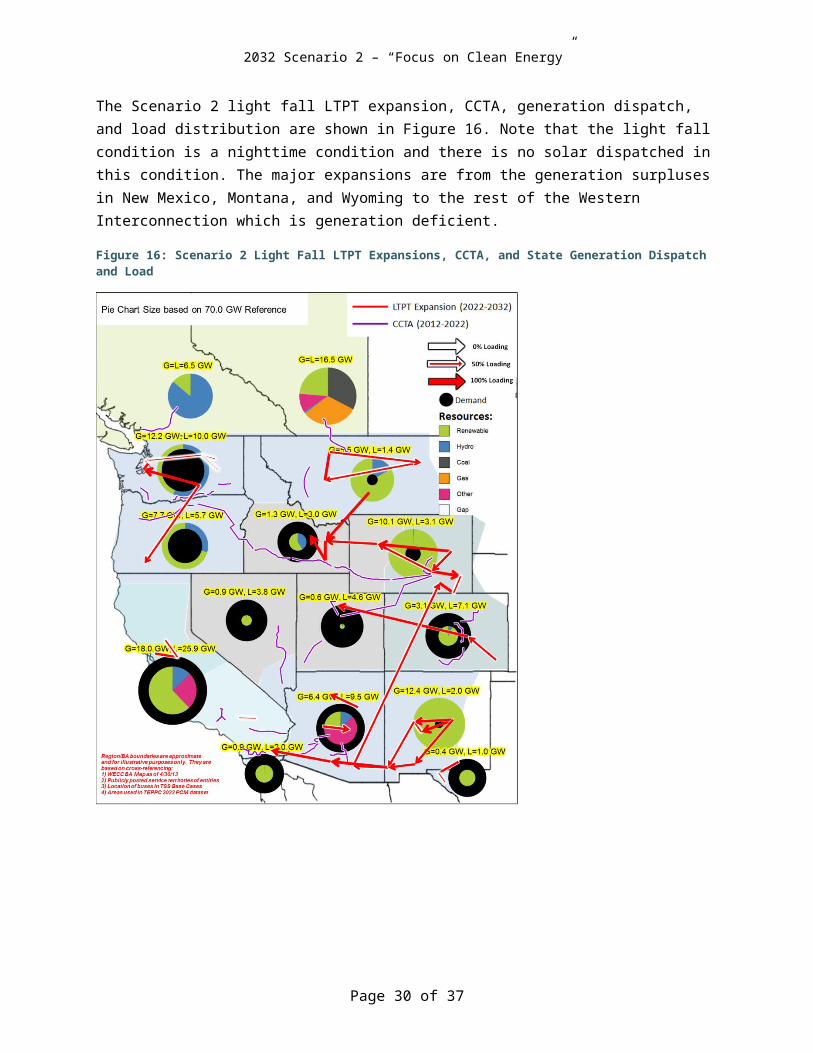
The Scenario 2 light fall LTPT expansion, CCTA, generation dispatch, and load distribution are shown in Figure 16. Note that the light fall condition is a nighttime condition and there is no solar dispatched in this condition. The major expansions are from the generation surpluses in New Mexico, Montana, and Wyoming to the rest of the Western Interconnection which is generation deficient.
Figure 16: Scenario 2 Light Fall LTPT Expansions, CCTA, and State Generation Dispatch and Load
Page 26 of 31
2032 Scenario 2 – “Focus on Clean Energy”
The Scenario 2 heavy winter LTPT expansion, CCTA, generation dispatch, and load distribution shown in Figure 17 are larger than both the spring and fall conditions, which was unexpected but explainable. During this system condition loads in the south are typically very light, and the large amount of resources in Arizona and New Mexico exceed their local load requirements. As such, the major expansions are from the generation surpluses in the southern states to the central and northern portions of the Western Interconnection which are generation deficient.
Figure 17: Scenario 2 Heavy Winter Expansion
Page 27 of 31
2032 Scenario 2 – “Focus on Clean Energy”
There are several expansions that were added in more than one of the system condition expansions. From the high-level planning perspective, these expansions may represent the most critical additions since they are needed under a broad array of conditions in this future, which would likely result in a higher asset utilization as compared to an expansion which occurred in a single system condition. These “recurrent” expansions are shown in Figure 18 and were added in three or four of the four system condition expansions. The expansions in the eastern portion of the Western Interconnection are most notable as their inclusion as recurrent expansions is driven by the large additions of wind and solar in Wyoming, Colorado, New Mexico and Arizona.
Figure 18: Recurrent Expansions
Page 28 of 31
2032 Scenario 2 – “Focus on Clean Energy”
Costs and Carbon EmissionFigure 19 shows the capital cost and the weighted average LCOE for the 2032 Reference Case and each of the four WECC scenarios. Compared to the 2032 Reference Case, Scenario 2 had an extremely large generation capital cost and transmission investment. The weighted average LCOE in Scenario 2 was about $5/MWh higher than in the 2032 Reference Case.
Figure 19: Capital Cost and LCOE Results (2012 dollars)
Page 29 of 31
2032 Scenario 2 – “Focus on Clean Energy”
The resource portfolio and the assumed dispatch of these resources also results in varying levels of CO2 output, as shown in Figure 20. Scenario 2 has drastically less CO2 output than the 2032 Reference Case. This is due in part to the large amount of incremental wind and solar selected in Scenario 2 versus the wind and gas burning resources selected in the 2032 Reference Case. Furthermore, Scenario 2 had a high carbon price that resulted in the displacement of a large amount of gas and coal generation by solar and wind generation additions, which resulted in a large CO2 reduction. The CO2 output from the 2022 Common Case is provided as a point of comparison. Scenario 2 resulted in a resource portfolio that produced 79 percent less CO2 than the 2022 Common Case.
Figure 20: CO2 Production
Page 30 of 31

2032 Scenario 2 – “Focus on Clean Energy”
Study SummaryThe following findings summarize the key results from Scenario 2 “Focus on Clean Energy”:
Wind and solar resource additions caused large transmission expansionThe majority of the system conditions resulted in a large transmission build-out for Scenario 2, primarily emanating from the Southwest where a large amount of new solar was added. The large expansions associated with Scenario 2 is not unexpected given the displacement of a large amount of existing (i.e., 2022 Common Case) gas and coal resources by new wind and solar resources - especially solar - given the assumptions in Scenario 2. The existing transmission infrastructure is built to support the delivery of existing resources to load centers. Such a large geographic displacement of existing resources will obviously result in the need for a large transmission expansions, especially when much of the new resources are geographically concentrated in one location (e.g., new solar in the Southwest portion of the Western Interconnect).
$100 per metric ton (2012 dollars) carbon price and capital cost reductions drive resource selectionLarge amounts of wind and solar resources were selected in the 2022-2032 timeframe. The combination of higher carbon price and breakthroughs in renewables that reduced their capital costs resulted in the displacement of existing (i.e., 2022 Common Case) gas and coal resources by new renewable resources - mainly solar and wind.
Resource adequacy and flexibility issues may existScenario 2 has very low Flexible Resource Indicator and summer peak reserve values. These low values are driven by the large displacement of existing (i.e., 2022 Common Case) gas and coal resources and leaves the Scenario 2 future with some potential resource adequacy and flexibility concerns with regard to the system’s ability to meet peak demand and balance variable generation output.
Levelized cost of energy (LCOE) and capital costs were highScenario 2 has the highest capital cost of all the WECC scenarios. Despite the increased capital costs, the study has an average LCOE close to, albeit higher than the 2032 Reference Case. The focus on clean energy in this future was successful because the modeling resulted in significant reductions of CO2 emissions.
Page 31 of 31