Embed Size (px)
Citation preview

DevourAll Group plc
Valuation & Discovery Document
Kennedy Jarvis| Sam Colvin| Nick Thompson
March 30th, 2021
2021 YOUniversity Deal Challenge

I. Executive Summary
II. Industry Overview & SWOT Analysis
III. Pre-COVID Valuation
IV. Post-COVID Valuation
V. Appendix
Table of Contents
2
Executive Summary
• Quick service and casual dining restaurant, café, and pub operator chain based in the UK with international presence seeking valuation Pre- and Post-COVID-19 pandemic
Situation Overview
• Analysis of the impact of the COVID-19 pandemic on US and UK macro environment and restaurant industry, including look at vaccine rollout and restaurant reopening projections
COVID-19 Pandemic
• Analysis of Pre- and Post-COVID valuation utilizing discounted cash flow, trading comps, and precedent transaction analysis
DevourAll Valuation
3

Industry Overview & SWOT Analysis

Industry OverviewCompany Overview
Dining Locations (2019A)
Historical Revenue and EBITDA Margins
547578 572 563
85716.9% 16.7%
14.2%13.7%
13.2%
0.0%
2.0%
4.0%
6.0%
8.0%
10.0%
12.0%
14.0%
16.0%
18.0%
20.0%
0
100
200
300
400
500
600
700
800
900
1000
2015A 2016A 2017A 2018A 2019A
EB
ITD
A M
arg
in (
%)
Rev
enu
e (£
m)
Revenue EBITDA Margin
History
• Billy’s Restaurant – one of the largest full-service Spanish restaurants in the UK
• Henry’s Grill & Bar – popular sports-bar style restaurant in the United States
• Smith’s Steakhouse – Scottish steakhouse famous for fresh meats of all kinds
• Cecilia’s Bistro – French bistro featuring traditional French cuisine, wine, and drinks
• Other brands – Café Rosé, Cheeky Chicken, Salad Monster, and MunchMunch
Restaurant Portfolio
• DevourAll Group plc (“DevourAll” or the “Company”) is a quick service and casual dining restaurant, pub, and café business that operates in the UK, United States, and Europe
• The Company was founded in 1991 and is headquartered in London, United Kingdom
• Restaurant portfolio features a wide range of cuisine suitable for all occasions
362
118
39
UK US Europe5

Company OverviewAcquisition of Billy’s Restaurant
Acquisition Overview Financial Impact of Acquisition (£m)
• On September 14, 2018, DevourAll completed its acquisition of Billy’s Restaurant
• The acquisition is expected to provide a growth platform in the casual dining space and is expected to contribute to the Company’s future revenue growth and margin expansion
Pro Forma Post-COVID Outlook
• Tangible book value as a percentage of total assets decreased from 42.9% in 2017 to -14.3% in 2019
• Furthermore, D&A as a percentage of revenue decreased from 6.0% in 2018 to 4.7% in 2019, which implies the majority of intangible assets acquired during the transaction was goodwill
• Increasing debt by 10x and decreasing the TBV/TA ratio is not advantageous for the current or future possible distress scenarios
• We advise the company to write-down a significant portion of the goodwill
Restaurant Count in the UK
254 257
105
2018A 2019A
DevourAll Billy's
1 Excluding organic growth from DevourAll 6

Industry OverviewFood Service
Food Service
➢ DevourAll operates in the quick service and casual dining sectors of the food service industry
• The global food service market reached £2.68 trillion in revenue during 2018, and is expected to reach £3.09 trillion by 2024 (3.6% CAGR 2020-2024) 1
• Accounting for 2.05% of the global food service revenue in 2019, the United Kingdom generated £53 billion in revenue 1
• Quick service accounts for 61.07% of the global restaurant market while casual dining only accounts for 19.77% 2
1 Statista 2 QSR
Restaurants and Bars
Beyond Restaurants
Full ServiceBars and Taverns
Limited Service
Casual Dining
Fine Dining
Travel and Leisure
Retail Hosts
Super-markets
Convenience Stores
Fast Casual
Quick Service
Industry Structure
7

Industry OverviewGrowth Drivers
• During 2019, the unemployment rate was near all time lows at 3.5% across the United States and 3.85% within the United Kingdom 1
• Restaurants have been a benefactor of the healthy labor market due to the consequential rise in disposable income, some of which has been spent on casual dining
• Pre-COVID consumer spending on food away from home increased 3.81% annually from 2016-2019 1
• Global consumer spending increases on average by 1% each year. In China and the US, this number is closer to 2% 1
• In 2018, the average consumer spent nearly half of his or her food dollars on food away from home 2
• The US has the highest disposable income per capita at $53,123 in 2019 3
Pre-COVID Post-COVID
Pre-COVID labor markets increased consumer disposable income, but post-pandemic, companies are focusing on consumer convenience and smaller footprints to drive free cash flow
1 Bureau of Labor Statistics 2 Restaurant Business 3 Statista 4 MarketWatch 5 Deloitte
Healthy Labor Market Consumer Convenience
Smaller Restaurant Footprints
• Consumers are demanding fast, convenient, and cost-effective food with delivery sales doubling over quarantine 4
• 42% of restaurants added delivery services during the lockdown and 31% have said that they plan to invest heavily in these services 2
• Quick-service restaurant footprints are shrinking as digital orders command a greater share of the available space and are a growing share of their revenue 5
• Companies are decreasing restaurant locations to lower overhead costs and increase margins 5
• Restaurant leases can reach up to 10-15% of total revenue which cuts into narrow profit margins
8

Industry OverviewUnited Kingdom
2020 Update Change in Sales from Pre-COVID 1
Volume of Total Food and Drink Purchased by Consumers 2
• Since Boris Johnson first issued a COVID-19 warning in March 2020, restaurants in the UK have seen a revenue decline of over 56%
• Industry estimates for permanent closures vary widely, from 10-30% of total sites
• Pre-COVID, the casual dining market was oversupplied, with branded restaurant count increasing 27% between 2013-2018. COVID has driven a sharp increase in restaurant closures, allowing for a market reset
(70%)
(60%)
(50%)
(40%)
(30%)
(20%)
(10%)
0%
Jul-20 Aug-20 Sep-20
Pubs and pub restaurants Restaurants Bars
Vo
lum
e (B
illi
on
Kg
s/L
ts/
pa
cks)
Yo
Y %
Ch
ang
e
(10%)
0%
10%
20%
30%
40%
50%
0
0.2
0.4
0.6
0.8
1
1.2
Jan-20 Feb-20 Mar-20 Apr-20 May-20 Jun-20 Jul-20
YoY Change Volume
Lockdown
1 Statista 2 gov.uk 9

Industry OverviewUnited Kingdom
2021 Outlook
Share of Re-Opened Food Venues in the UK as of August 2020 by Region 2
• In a survey by McKinsey, 33% of UK consumers cited dining at an indoor restaurant as a top 3 activity they are eager to get back to Post-COVID
• During August, the “Eat Out to Help Out” scheme subsidized restaurants and pubs to discount 50% off meals to boost the industry. 84,000 restaurants took part, and £522m was claimed through the program
• Despite the temporary boost, government-imposed trading restrictions and seasonal weather conditions will put pressure on the industry's recovery prospects throughout the upcoming winter
• Looking ahead, many market participants expect that restaurant sales will reach 75-85% of 2019 levels by the end of 2021
1 OpenTable 2 Statista
71%
72%
75%
76%
77%
77%
77%
78%
79%
80%
Scotland
Wales
Lancashire
Yorkshire
London
South & South East
Central
East
South West
North East
YoY Change in Seated Diners 1
(100%)
(50%)
0%
50%
100%
150%
200%
250%
Feb-20 Mar-20 Apr-20 May-20 Jun-20 Jul-20 Aug-20 Sep-20
10
Industry OverviewUnited States
2020 Update Total U.S. Restaurant Sales 1
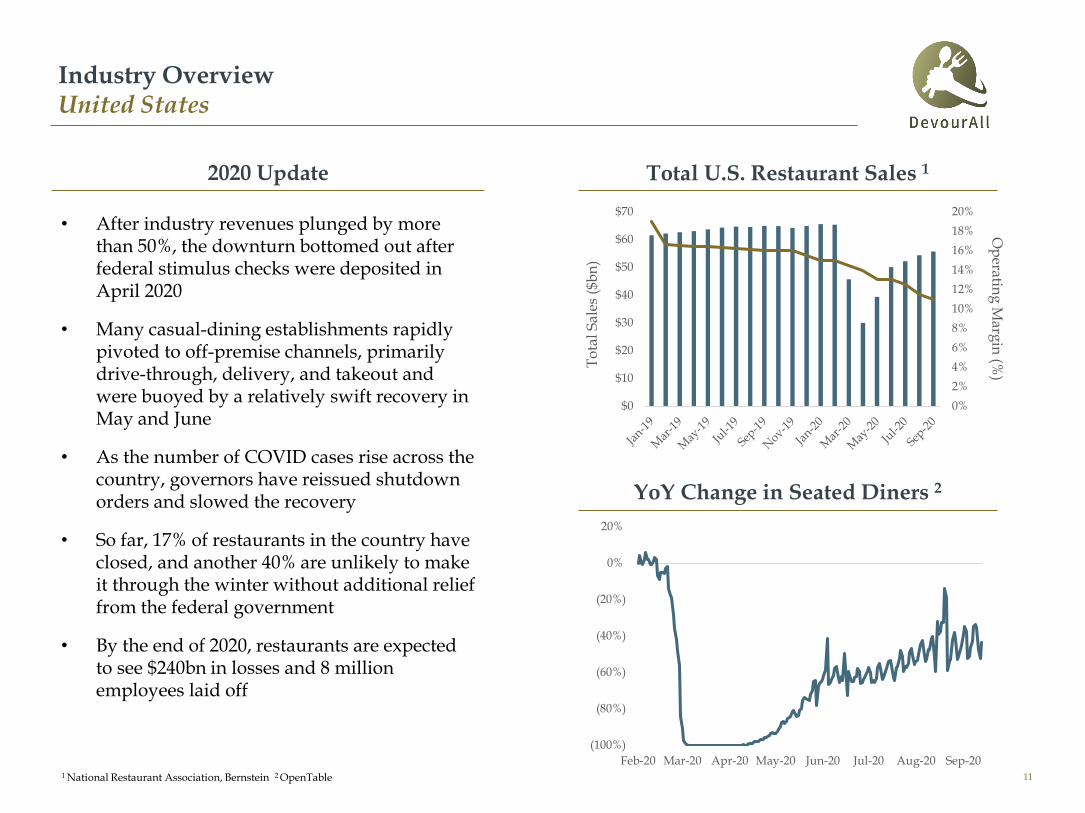
• After industry revenues plunged by more than 50%, the downturn bottomed out after federal stimulus checks were deposited in April 2020
• Many casual-dining establishments rapidly pivoted to off-premise channels, primarily drive-through, delivery, and takeout and were buoyed by a relatively swift recovery in May and June
• As the number of COVID cases rise across the country, governors have reissued shutdown orders and slowed the recovery
• So far, 17% of restaurants in the country have closed, and another 40% are unlikely to make it through the winter without additional relief from the federal government
• By the end of 2020, restaurants are expected to see $240bn in losses and 8 million employees laid off
0%
2%
4%
6%
8%
10%
12%
14%
16%
18%
20%
$0
$10
$20
$30
$40
$50
$60
$70
To
tal
Sal
es (
$bn
)
Op
erating
Marg
in (%
)
1 National Restaurant Association, Bernstein 2 OpenTable
YoY Change in Seated Diners 2
(100%)
(80%)
(60%)
(40%)
(20%)
0%
20%
Feb-20 Mar-20 Apr-20 May-20 Jun-20 Jul-20 Aug-20 Sep-20
11

Industry OverviewUnited States
2021 Outlook Monthly Restaurant Sales by Scenario 2
• In several states, the prospects for a full reopening look dim as local authorities could extend dining restrictions before the vaccine is fully available to the public
• However, the brief recovery in May supports the idea that restaurants will likely benefit from pent-up demand from higher income consumers
• In a recent survey, respondents indicated they are most looking forward to visiting casual dining chains post-pandemic 1
• Across the industry, chains will likely benefit from widespread closures of independents
• A growing number of restaurant groups nationwide are beginning to pursue legal action to overturn COVID-related dining restrictions
1 Stifel 2 McKinsey, National Restaurant Association
% C
han
ge
fro
m 2
019
(60%)
(50%)
(40%)
(30%)
(20%)
(10%)
0%
10%
Bull Case
Base Case
Bear Case
• Local physical-distancing restrictions are periodically introduced until the vaccine roll-out in the summer
• Stimulus bill fails to provide sufficient relief to restaurants as cases climbs and further shutdowns occur until the widespread roll-out of the vaccine
• Virus is contained until summer, and the vaccine roll-out unlocks pent-up demand from consumers
12

Industry OverviewVaccine Rollout
2020 Update
• Medical officials expect vaccine doses to be available for mass distribution starting in Q3 2021
• Under normal circumstances, a new vaccine for a new virus takes years to develop, but the schedule has been condensed to an unprecedented 12–18-month timeframe
Vaccine Schedule
Distribution
Approval
Manufacturing
Building Factories
Phase 3
Phase 2
Phase 1 Trials
Pre-Clinical
Academic Research
Jan-20 Apr-20 Jul-20 Oct-20 Feb-21 May-21 Aug-21
Overlap phases
Expedite research
Vaccine
1 Statista
New COVID Cases 1
0
20,000
40,000
60,000
80,000
100,000
Mar-20 Apr-20 May-20 Jun-20 Jul-20 Aug-20 Sep-20
US Europe
13

Industry OverviewSWOT Analysis
Strengths
• A diverse portfolio of brands serves a wide customer base and provides stability in an ever-changing consumer taste and preference environment
• 500+ restaurants in UK, US, and Europe provides flexibility for targeted ROI and closing non-profitable locations
• The acquisition of Billy’s restaurant creates a commanding market share position for the company in the UK’s growing Spanish food segment
• Consumer preference trends are shifting to favor the quick service and casual dining segment since customers are spending less time on premise
Weaknesses
Opportunities
• A declining total revenue and “like-for-like” revenue with increasing labor and food costs leads to a poor EBITDA margin
• The Company’s restaurants do not appeal to the health and wellness food segment of the market, which is growing at a rapid pace
• Difficult to monitor quality across international geographic locations
• Invest in delivery kitchen market and corresponding technology that connects website, app, online ordering, and inventory management
• Increase beverage options with higher margins – exploring local ordinances on drink delivery options
• Use technology for pandemic and post-pandemic optimization: touch free table-side tablet, app that includes occupancy indicators and discounts
for off-peak dining, driving max occupancy across operating hours
• Pandemic hit independent, high-end restaurants the hardest and will leave growth opportunity for multi-property companies with econ. of scale
• Consumer movement toward organic and farm-to-table healthy items (could emphasize with healthy options menu)
Threats
• Pandemic will continue to put significant financial stress on the Company and relevant supply chains, timing of full re-openings unknown
• Property cost in the United Kingdom is growing faster year over year which increases the difficulty of expanding locations across the country
• Meal kits and at-home cooking are growing segments of the market that will compete directly with the Company
14

Industry OverviewSWOT Analysis: Strength of Multi Chain Operators
Multi Chain vs. Independent Operators
• COVID-19 is accelerating the pace of consolidation among businesses. Chains will benefit from widespread closures among independents
• “Independent operators lack the marketing power to drive traffic and the monetary buffer to get through difficult times” 1
• During the recession, 87% of consumers said they would not dine at an independent eatery. 1
These preferences drive consumers to chain restaurants like DevourAll
• Due to the pandemic, 60% of the temporary restaurant closures reported on Yelp are now permanent
• DevourAll should benefit from a surge in post-vaccine demand, a result of fiscal stimulus and fewer competitors in the marketplace
• A Bank of America study found that spending at independent restaurants lagged large chains by about 20% 4
US Food Service Market Share 3
49.80% 51.10% 54.30% 56.90%
50.20% 48.90% 45.70% 43.10%
2007 2008 2019 2020P
Chained CFS Independent CFS
• During the Great Financial Crisis of ’08-’09, the same store sales decline was ~7%, but at the current 2020 rate, the SSS decline will annualize at nearly 20%, or roughly 3x the rate of GFC 3
• It can be reasoned that store closures could also be a multiple of the GFC
• Conservatively, a 2x multiple would land chain operators with a commanding 56%+ total market share
1 Los Angeles Times 2 Yelp 3 Euromonitor, Bernstein Analysis 4 CNBC 15
Industry OverviewSWOT Analysis: Opportunities in Food Delivery Services
Food Delivery
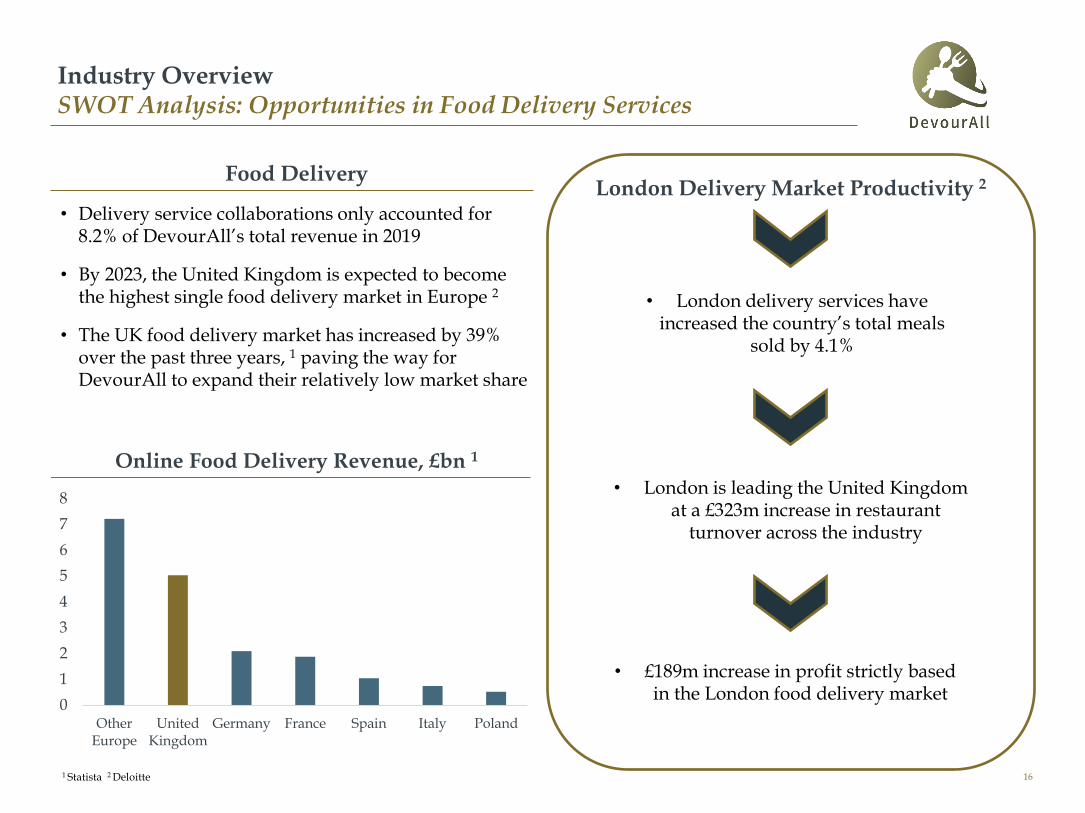
• Delivery service collaborations only accounted for 8.2% of DevourAll’s total revenue in 2019
• By 2023, the United Kingdom is expected to become the highest single food delivery market in Europe 2
• The UK food delivery market has increased by 39% over the past three years, 1 paving the way for DevourAll to expand their relatively low market share
0
1
2
3
4
5
6
7
8
OtherEurope
UnitedKingdom
Germany France Spain Italy Poland
Online Food Delivery Revenue, £bn 1
1 Statista 2 Deloitte
London Delivery Market Productivity 2
• London is leading the United Kingdom at a £323m increase in restaurant
turnover across the industry
• £189m increase in profit strictly based in the London food delivery market
• London delivery services have increased the country’s total meals
sold by 4.1%
16

Industry OverviewSWOT Analysis: Weaknesses
• DevourAll’s EBITDA margin is decreasing faster than the industry average due to a steady rise in COGS
• Over the past five years, there has been a 3.2% increase in COGS as a % of revenue, which has lowered DevourAll’s margins
Oversaturation of UK Market Rising Cost of Goods Sold
0%
2%
4%
6%
8%
10%
12%
14%
16%
18%
2014 2015 2016 2017 2018 2019
China U.S. U.K.
0%
5%
10%
15%
20%
2015 2016 2017 2018 2019
DevourAll Public Comps1 Statista 2 M&B, Greggs, TRG, Marston’s, J D Wetherspoon
• The UK has over 90,000 restaurants total, with leading chains operating close to 2,000 locations each. 1 DevourAll only has 362 locations in the UK
• 90%+ of locations owned by DevourAll’strading comps operate in the UK
• Oversaturation has led to a decline in restaurant revenue growth rate within the UK
Restaurant Industry Revenue Growth Rate 1 EBITDA Margin 2
17

Industry OverviewDelivery Kitchens Case Study
Delivery kitchens are revolutionizing the restaurant industry by capitalizing on an increase in delivery/takeout demand and lowering costs
• These kitchens are centralized licensed commercial food production facilities where 1-2 dozen restaurants rent space to operate delivery services 1
• Delivery kitchens are high-tech and take advantage of delivery apps such as UberEats, Grubhub, or Doordash while collecting and analyzing data to customize food production and delivery experience 1
• As restaurant dining continues to slow, delivery kitchens are increasingly utilized to supplement revenue through established staff, storage, supply chain, and kitchen space
Overview
Single Brand Kitchen
Co-Working Kitchen
Multi-Brand Kitchen
Operator Managed 2
Aggregator Managed
• Typically involve 1-2 kitchens
• 10-15 menu items are the norm
• Multiple brands from same company
• Different cuisines are created from same kitchen
• Large kitchen infrastructure already in place
• Different restaurants rent space
• Large working space managed by online food aggregators delegating different brands’ orders
• Kitchen operator runs operations and fills orders of existing restaurant brands on their behalf
1 Food Corridor 2 TRT 18

Traditional Food Delivery
Modern Food Delivery
Traditional Restaurants
Delivery Kitchen
Kitchen as a Service 1
Virtual Restaurants
Hybrids
Customer orders from restaurant
Restaurant receives and prepares order
Restaurant transports order from restaurant to
customer
Order is delivered to customer and payment
is received by restaurant
Customer orders and pays ahead
through delivery app
Kitchen receives order through
delivery app and prepares order
Order picked up and transported to
customer
Gig worker confirms customer and delivers order
Delivery app notifies customer
and requests rating and feedback
1 Balmoral Advisors
Industry OverviewDelivery Kitchens Case Study
19

Emerging Trends
• Venture capital investment activity in delivery kitchen businesses has risen over the past five years, with deal values increasing at least 2.4x each year since 2016 1
• VC funds have recognized the increased stability of food delivery, investing £1.24bn in the first quarter of 2019 alone 1
• Digital and online delivery was gaining momentum before the pandemic, but COVID-19 has increased the rate at which this market share increases
0%
5%
10%
15%
20%
25%
2020 2021 2022 2023 2024 2025
Current Estimates Pre-COVID Estimates
Online Delivery’s Total Share of Market 2
1 Balmoral Advisors 2 Morgan Stanley 3 Conversion as of close date
CompanyClose Date
Deal Size (£m) 3
Stage Lead Investor Location
19 – Mar £785Late-Stage
VCSoftBank U.S.
19 – Jan £538Early-Stage
VCN/A U.S.
18 – Nov £283Early-Stage
VCGrishin Robotics,
SoftBankU.S.
19 – Aug £95 Series DEvolvence Capital,
Sistema Asia CapitalIndia
15 – May £71 Series CACME Capital, Menlo
VenturesU.S.
20 – Feb £47 Series BKnollwood, Luma
CapitalUAE
19 – Feb £39 Series C Tiger Management China
17 – Sep £37 Series B SGH Capital U.S.
15 – Apr £36 Series BGreylock Partners,
Social CapitalU.S.
19 – Sep £31 Series B GV, RXR Realty U.S.
Largest Delivery Kitchen Deals of 2020 1
Industry OverviewDelivery Kitchens Case Study
20

Pre-COVID Valuation

Pre-COVID ValuationPublic Trading Comparables
2019 EV/EBITDA 1
Mean: 9.5x
Median: 10.1x
7.8x 7.9x
10.1x10.8x 11.0x
221 As of 12/31/2019
DevourAll Group Trading Comparables Analysis (£ millions)
Market Total Enterprise Net Debt / Gross % %
Company Cap Value FY19 EBITDA Margin Equity Debt 2019A 2020P 2021P 2019A 2020P 2021P
Mitchells & Butlers plc 1,643 3,262 3.9x 72.0% 50.4% 49.6% 7.8x 7.3x 6.4x 11.5x 9.8x 8.1x
Greggs plc 2,323 2,507 0.8x 64.7% 92.64% 7.36% 10.8x 8.1x 6.3x 26.7x 21.9x 19.2x
JD Wetherspoon 1,618 2,355 3.5x 9.9% 68.7% 31.3% 11.0x 10.6x 9.8x 22.2x 20.2x 18.8x
Marston's plc 826 2,227 6.3x 0.0% 37.1% 62.9% 10.1x 9.7x 9.1x (46.7)x 39.3x 17.2x
Restaurant Group plc 785 1,079 2.1x 13.3% 72.8% 27.2% 7.9x 5.9x 4.7x (19.4)x 112.2x 41.3x
Median £1,618 £2,355 3.5x 13.3% 68.7% 31.3% 10.1x 8.1x 6.4x 11.5x 21.9x 18.8x
Mean £1,439 £2,286 3.3x 32.0% 64.3% 35.7% 9.5x 8.3x 7.2x (1.1)x 40.7x 20.9x
Enterprise Value / EBITDA Price / Earnings

Pre-COVID ValuationPrecedent Transactions
8.7x 9.2x 9.8x 10.0x
11.4x 12.5x
15.0x
Date Announced Acquirer Target EV / LTM EBITDA Transaction Value (£m)Target LTM EBITDA
(£m)
October 2018 8.7x 559 64.3
January 2015 9.2x 250 27.2
November 2014 9.8x 304 31.0
July 2014 10.0x 900 90.0
July 2019 11.4x 2,970 260.5
September 2016 12.5x 120 9.6
May 2018 15.0x 1,500 100.0
Mean 10.9x
Median 10.0x
23
Pre-COVID ValuationPre-COVID Income Statement
Income Statement Assumptions
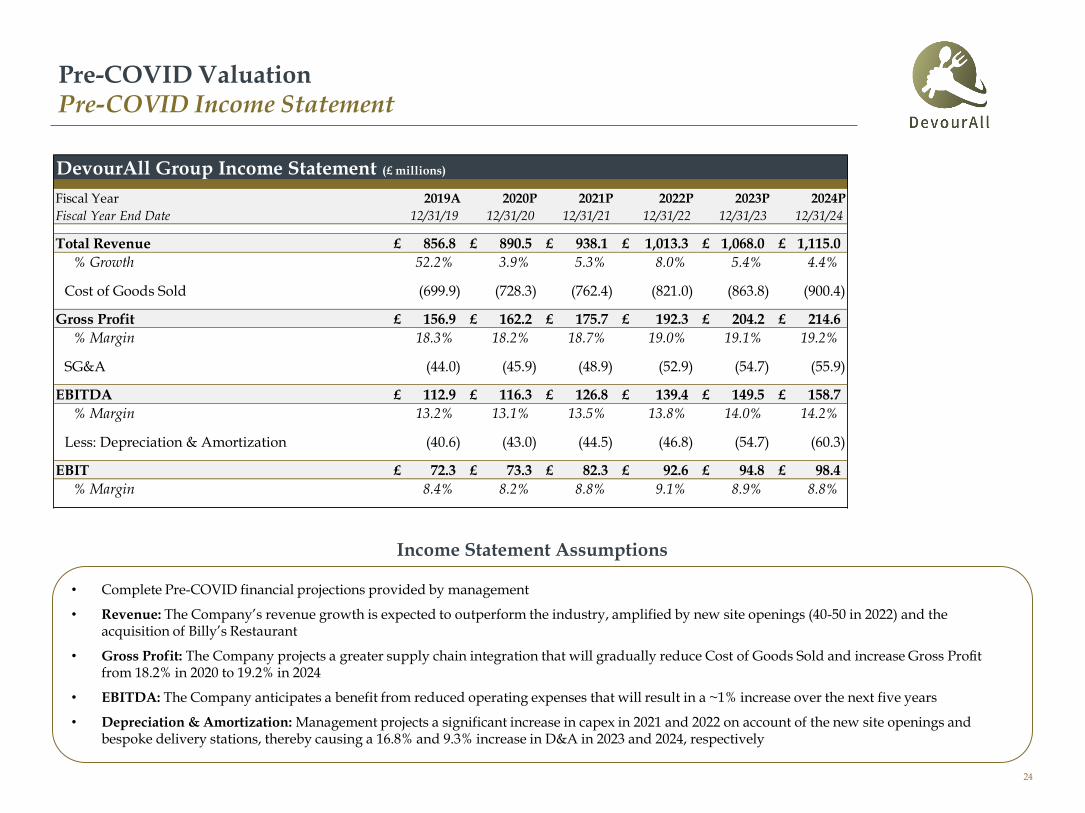
• Complete Pre-COVID financial projections provided by management
• Revenue: The Company’s revenue growth is expected to outperform the industry, amplified by new site openings (40-50 in 2022) and the acquisition of Billy’s Restaurant
• Gross Profit: The Company projects a greater supply chain integration that will gradually reduce Cost of Goods Sold and increase Gross Profit from 18.2% in 2020 to 19.2% in 2024
• EBITDA: The Company anticipates a benefit from reduced operating expenses that will result in a ~1% increase over the next five years
• Depreciation & Amortization: Management projects a significant increase in capex in 2021 and 2022 on account of the new site openings and bespoke delivery stations, thereby causing a 16.8% and 9.3% increase in D&A in 2023 and 2024, respectively
DevourAll Group Income Statement (£ millions)
Fiscal Year 2019A 2020P 2021P 2022P 2023P 2024P
Fiscal Year End Date 12/31/19 12/31/20 12/31/21 12/31/22 12/31/23 12/31/24
Total Revenue 856.8£ 890.5£ 938.1£ 1,013.3£ 1,068.0£ 1,115.0£
% Growth 52.2% 3.9% 5.3% 8.0% 5.4% 4.4%
Cost of Goods Sold (699.9) (728.3) (762.4) (821.0) (863.8) (900.4)
Gross Profit 156.9£ 162.2£ 175.7£ 192.3£ 204.2£ 214.6£
% Margin 18.3% 18.2% 18.7% 19.0% 19.1% 19.2%
SG&A (44.0) (45.9) (48.9) (52.9) (54.7) (55.9)
EBITDA 112.9£ 116.3£ 126.8£ 139.4£ 149.5£ 158.7£
% Margin 13.2% 13.1% 13.5% 13.8% 14.0% 14.2%
Less: Depreciation & Amortization (40.6) (43.0) (44.5) (46.8) (54.7) (60.3)
EBIT 72.3£ 73.3£ 82.3£ 92.6£ 94.8£ 98.4£
% Margin 8.4% 8.2% 8.8% 9.1% 8.9% 8.8%
24

Pre-COVID ValuationPre-COVID Analysis
DCF Assumptions
• Tax Rate: The main corporate tax rate for companies (excluding ring fence profits) confirmed for the year beginning April 1, 2019
• Net Changes in Working Capital:NWC assumed to hold steady at 14% (2019A level) of sales throughout the projection period
• Capital Expenditures: Capex is expected to increase to 8.0% and 9.9% as a % of revenue in 2021 and 2022, respectively on account of the new site openings and bespoke delivery stations
• Mid-Year Discounting: We assume that cash flows are generated evenly throughout the time period, which more accurately reflects the nature of the business than an end of period assumption
• Long-term Growth Rate: Assumed DevourAll will grow in perpetuity at the rate of inflation and utilized the Bank of England’s target of 2% inflation
25
DevourAll Group Pre-COVID Discounted Cash Flow Analysis (£ millions)
Free Cash Flow Build-Up
Fiscal Year 2020P 2021P 2022P 2023P 2024P
Fiscal Year End Date 12/31/20 12/31/21 12/31/22 12/31/23 12/30/24
EBITDA 116.3 126.8 139.4 149.5 158.7
EBIT 73.3 82.3 92.6 94.8 98.4
Tax Rate 19% 19% 19% 19% 19%
EBIAT (NOPAT) 59.4£ 66.7£ 75.0£ 76.8£ 79.7£
+Depreciation & Amortization 43.0 44.5 46.8 54.7 60.3
- Increases in Net Working Capital 4.4 6.7 10.5 7.7 6.6
Unlevered CFO 106.7£ 117.8£ 132.3£ 139.1£ 146.6£
-Capital Expenditures (60.9) (75.0) (100.2) (63.4) (62.1)
Unlevered Free Cash Flow 45.8£ 42.8£ 32.1£ 75.7£ 84.5£
% Growth 37.0% (6.6%) (25.0%) 135.7% 11.5%
Discount period 0.50 1.50 2.50 3.50 4.50
Discount factor 0.96 0.89 0.83 0.77 0.72
Present value of Unlevered FCF 44.2£ 38.3£ 26.7£ 58.5£ 60.6£
Perpetuity Approach
FCF in Last Forecast Period 84.5
FCFt+1 86.2
Long term growth rate (g) 2.0%
Terminal value 1,518.1
Present value of terminal value 1,088.3
Present value of stage 1 cash flows 228.3
Enterprise value 1,316.6
Implied TV exit EBITDA multiple 9.6x
Analysis as of 12/31/2019
Implied Equity Value
Perpetuity EBITDA
Enterprise value 1,316.6 1,335.6
Less: Net debt (227.7) (227.7)
Equity value 1,088.9 1,107.9

Pre-COVID ValuationWACC & Capital Structure Assumptions
1 Slides 43-44 2 gov.uk 3 Slide 49WACC as of 12/31/2019
WACC Assumptions
WACC Analysis for DevourAll Group
Debt / Debt / Adj. 2 Year Unlevered Beta
Tickers Company Equity Total Cap. Beta 2-Year
MAB.L Mitchells & Butlers plc 98.5% 49.6% 0.746 0.415
GRG.L Greggs plc 7.9% 7.4% 0.620 0.583
JDW.L JD Wetherspoon 45.6% 31.3% 0.879 0.652
MARS.L Marston's plc 169.6% 62.9% 0.631 0.234
RTN.L Restaurant Group plc 37.4% 27.2% 0.753 0.548
Mean 71.8% 35.7% 0.73 0.49
Median 45.6% 31.3% 0.75 0.55
• Beta: Average of comparable companies’ Bloomberg Adjusted Two-Year Beta (regressed against Bloomberg European 500)
• Capital Weights: Average of comparable companies’ debt/equity ratio which implies the debt to capital ratio
• Cost of Debt: Estimated using firm’s synthetic bond rating 1
• Assumed Tax Rate: Marginal UK corporate tax rate for year starting April 1, 2019 2
• Risk Free Rate: Normalized to UK 3.00% per Duff & Phelps as of December 31, 2019
• UK Equity Risk Premium: As of December 31, 2019, per Damodaran research
• Size Premium: Per 7th decile Duff & Phelps size premium 3
WACC Calculations Pre-COVID
Capital Weights
% Debt 41.8%
% Equity 58.2%
Cost of Debt
Pre-Tax Cost of Debt 6.51%
Assumed Tax Rate 19.0%
After-Tax Cost of Debt 5.27%
Cost of Equity
Risk Free Rate 3.00%
Unlevered Beta 0.55
Debt / Equity 71.8%
Relevered Beta 0.867
Equity Risk Premium 5.69%
Size Premium 1.47%
Cost of Equity 9.40%
WACC 7.7%
26

Pre-COVID ValuationValuation Summary
Valuation Methodology Commentary
Precedent Transactions 1
£1,150
£900
£1,000
£1,400
£1,150
£1,250
Trading Comparables 2
Intrinsic Analysis 3
2019 EBITDA: £113mMultiple: 9.0x – 11.0x
2019 EBITDA: £113mMultiple: 8.0x – 10.0x
WACC: 7.7%Perpetuity Growth Rate: 1.75% - 2.25%
• Analysis consisted of 7 transactions with dates ranging from 2014 to 2019
• Median EBITDA multiple of 10.9x and mean EBITDA multiple of 10.0x
Preliminary Valuation £1,000m - £1,300m
• Analysis consisted of 5 publicly traded peers
• Median 2019 EBITDA multiple of 10.1x and mean EBITDA multiple of 9.5x
• Assumed a perpetuity growth rate between 1.75% - 2.25% - implies an Exit EBITDA multiple between 8.5x – 10.5x
1 Slide 23 2 Slide 22 3 Slide 25 27
Post-COVID Valuation

Post-COVID ValuationPublic Trading Comparables
Mean: 13.0x
Median: 13.8x
2021P EV/EBITDA
8.3x
10.5x
13.8x 14.3x
18.0x
DevourAll Group Trading Comparables Analysis (£ Millions)
2019A 2021P 2022P
Market Enterprise EBITDA EV / 19' - 21' EV / EBITDA EV / 21' - 23' EV / EBITDA EV / EV /
Company Cap Value Margin EBITDA Rev CAGR Revenue Margin EBITDA Rev CAGR Revenue Margin EBITDA Revenue
Mitchells & Butlers 580 2,726 18.6% 6.5x (9.7%) 1.2x 18.0% 8.3x 10.1% 1.5x 19.9% 6.4x 1.3x
Greggs 1,705 1,861 19.8% 8.0x (5.1%) 1.6x 16.8% 10.5x 10.9% 1.8x 19.0% 8.3x 1.6x
Marston's 253 1,954 18.8% 8.9x (23.8%) 1.7x 20.7% 13.8x 4.9% 2.9x 24.1% 11.2x 2.7x
JD Wetherspoon 1,074 2,445 11.7% 11.5x (7.7%) 1.3x 11.0% 14.3x 10.2% 1.6x 13.0% 10.2x 1.3x
Restaurant Group 341 1,479 12.7% 10.8x (19.7%) 1.4x 11.9% 18.0x 10.9% 2.1x 13.8% 13.8x 1.9x
Median £580 £1,954 18.6% 8.9x (9.7%) 1.4x 16.8% 13.8x 10.2% 1.8x 19.0% 10.2x 1.6x
Mean £791 £2,093 16.3% 9.1x (13.2%) 1.4x 15.7% 13.0x 9.4% 2.0x 18.0% 10.0x 1.8x29

Post-COVID ValuationValuation Approach
• The cumulative probability of distress is derived from the company’s synthetic bond rating
• In accordance with the explicit forecast period in the DCF, we are concerned with the 5-year cumulative probability of distress
• The value of the firm is then derived from an expected value formula that weights the value from each scenario according to its associated probability
Going Concern
• In this scenario, DevourAll is not expected to enter into voluntary/involuntary restructuring. Over time, the Company will return to profitability, conservative leverage levels, and growth
• Operating projections under the going concern scenario are based off management guidance
• As the Company recovers from the adverse effects of the pandemic, we expect the capital structure and cost of capital to change significantly. Therefore, we have calculated a cost of capital for each year of the explicit forecast period of the DCF
• In this scenario, the Company is not expected to survive the COVID pandemic, but rather to enter administration and cease to exist through the event of a distress sale
• We have chosen to estimate the proceeds from a distress sale as a percentage of book value of non-cash assets
• The percentage of book value of non-cash assets is derived from precedent distressed restaurant M&A transactions in the post-COVID era. Precedent transactions are predominately U.S.-based due to the availability of public information
Distress
Our approach to intrinsic valuation of DevourAll is to separate two possible scenarios for the Company. We believe that it is imperative to recognize the possibility of DevourAll entering unnavigable distress during this pandemic.
Firm Value = Going Concern Value * (1 – Probability of Distress) + Distress Sale Value * Probability of Distress
Cumulative Probability of Distress 1
Rating 5 years 10 years
B+ 19.25% 28.25%
B 27.50% 36.80%
B- 31.10% 42.12%
CCC 46.26% 59.02%
CC 54.15% 66.60%
C+ 65.15% 75.16%
C 72.15% 81.03%
C- 80.00% 87.16%
1 Altman, E.I. 20Source: Dealing with Distress In Valuation (Damodaran)
30

Post-COVID ValuationProbability of Distress
• Similar to our cost of debt analysis, we estimate a cumulative probability of distress for the business by assuming a synthetic credit rating for DevourAll
• The synthetic credit rating is derived from an implied interest coverage ratio. Interest expense is not available in the historical financials but is estimated using Pre-COVID pre-tax cost of debt
• The implied interest coverage ratio of 0.8x in 2020 translates to a synthetic credit rating of CC 1
• Incorporating a synthetic CC rating, the Company has a cumulative probability of distress over the next 5 years of 54.15%
Cumulative Probability of Distress 2
1 Slide 43 2 Altman, E.I. 20 Source: Dealing with Distress In Valuation (Damodaran)
Rating 5 years 10 years
AAA 0.04% 0.07%
AA 0.44% 0.51%
A+ 0.47% 0.57%
A 0.20% 0.66%
A- 3.00% 5.00%
BBB 6.44% 7.54%
BB 11.90% 19.63%
B+ 19.25% 28.25%
B 27.50% 36.80%
B- 31.10% 42.12%
CCC 46.26% 59.02%
CC 54.15% 66.60%
C+ 65.15% 75.16%
C 72.15% 81.03%
C- 80.00% 87.16%
Synthetic Credit Rating
Interest Coverage Ratio Credit Rating Spread
0.00-0.49 D2/D 15.12%
0.50-0.79 C2/C 11.34%
0.80-1.249 Ca2/CC 8.64%
1.25-1.49 Caa/CCC 8.20%
In order to evaluate the probability of a distress scenario for the Company, we must apply a synthetic credit rating to the business via an implied interest coverage ratio.
31

Post-COVID ValuationDistress Sale Value
Precedent Distressed Transactions
• The distressed sale proceeds ratio is applied to the book value of non-cash assets
• In addition, due to the expected goodwill impairment associated with the Billy’s Restaurant acquisition the book value of non-cash needs to exclude the expected write-down
Asset Value Adjustments
• Precedent distressed transactions imply that DevourAll could expect to receive proceeds from a sale process during administration that amount to approximately 65% of adjusted book value of non-cash assets
Distress Sale Value
Distress Sale Value
Adj. Book Value of Non-Cash Assets 509.0
Distress Sale Proceeds Ratio 65.0%
Distress Sale Value 330.9
32
Adj. Book Value of Non-Cash Assets 1
Book Value of Assets 827.3
Cash and Cash Equivalents (82.6)
Book Value of Non-Cash Assets 744.7
Expected Goodwill Impairment (235.7)
Adj. Book Value of Non-Cash Assets 509.0
Date Announced Acquirer TargetDistress Sale Value
($m)Book Value of Non-Cash
Assets ($m)Proceeds as a Percent of
Book Value of Assets
September 2020 816 1,064 76.7%
May 2020 48 142 33.8%
September 2020 3 32 9.4%
June 2020 3 105 2.8%
Weighted Average 2 64.8%
PQ New York
1 2020P balance sheet data per management guidance2 Weighting based on target’s book value of non-cash assets

DevourAll Group Post-COVID Discounted Cash Flow Analysis
Free Cash Flow Build
Fiscal Year 2020P 2021P 2022P 2023P 2024P
Fiscal Year End Date 12/31/20 12/31/21 12/31/22 12/31/23 12/30/24
EBITDA 12.4 36.3 58.1 82.5 89.6
EBIT (25.0) 6.4 31.9 54.4 59.7
Tax Rate 0% 0% 14% 19% 19%
NOL -- 15.0 8.6 -- --
EBIAT (NOPAT) (25.0)£ 6.4£ 27.5£ 44.1£ 48.4£
+Depreciation & Amortization 35.3 29.9 26.3 28.1 29.9
- Increases in Net Working Capital 20.2 (7.2) (14.4) (19.2) (3.6)
Unlevered CFO 30.5£ 29.0£ 39.3£ 53.0£ 74.6£
-Capital Expenditures (25.2) (27.2) (29.2) (31.2) (33.2)
Unlevered Free Cash Flow 5.3£ 1.8£ 10.1£ 21.8£ 41.4£
% Growth (77.9%) (65.0%) 451.0% 115.0% 90.0%
Discount period 0.13 0.75 1.75 2.75 3.75
Beta 2.25 1.91 1.56 1.21 0.87 0.87
Cost of Equity 20.3% 17.6% 14.9% 12.1% 9.4% 9.4%
Pre-Tax Cost of Debt 11.1% 10.0% 8.8% 7.7% 6.5% 6.5%
After-Tax Cost of Debt 11.1% 10.0% 7.6% 6.2% 5.3% 5.3%
Debt Ratio 75.1% 66.8% 58.5% 50.1% 41.8% 41.8%
Cost of Capital 13.4% 12.5% 10.6% 9.2% 7.7% 7.7%
Discount factor 0.98 0.92 0.84 0.79 0.76
Present value of Unlevered FCF 5.2£ 1.7£ 8.5£ 17.1£ 31.4£
Post-COVID ValuationIntrinsic Going Concern Valuation Summary
DCF Assumptions
• Net Operating Loss: Per gov.uk, an allowance of up to £5m, plus 50% of remaining trading profits after deduction of the allowance
• Net Changes in Working Capital: Ref. slide 45
• Mid-Year Discounting: We assume that cash flows are generated evenly throughout the time period, which more accurately reflects the nature of the business than an end of period assumption
• Dynamic Cost of Capital During Explicit Forecast Period: Assuming DevourAll remains a going concern, the adverse effects of COVID on the Company’s cost of capital are temporary. We reflect that the cost of capital steps down from post-COVID levels to pre-COVID levels (2020P to 2024P)
• Goodwill Impairment: The goodwill impairment associated with the Billy’s Restaurant acquisition is added back to cash flow
• After-Tax Cost of Debt Reflects Effective Tax Rate: The benefits of interest deductibility are only as impactful as the effective tax rate for the associated year
33
1
1 Illustrates WACC normalizing to Pre-COVID levels in perpetuity
Perpetuity Approach
FCF in Last Forecast Period 41.4
FCFt+1 42.3
Long term growth rate (g) 2.0%
Terminal value 744.7
Present value of terminal value 564.3
Present value of stage 1 cash flows 63.9
Enterprise value 628.2
Implied TV exit EBITDA multiple 8.3x

Post-COVID ValuationIntrinsic Valuation Summary
• The implied interest coverage ratio of 0.8x in 2020 translates to a synthetic credit rating of CC 3
• Incorporating a synthetic CC rating, the Company has a cumulative probability of distress over the next 5 years of 54.15% 4
• The probability of distress and going concern valuation assumptions will be sensitized in the valuation conclusion to provide a range for intrinsic valuation of the firm
Going Concern
• We expect the Company will grow in perpetuity at the rate of inflation and utilized the Bank of England’s target of 2% inflation to estimate DevourAll’s long-term growth rate
• Precedent distressed transactions imply that DevourAll could expect to receive proceeds from a sale process during administration that amount to approximately 65% of book value of non-cash assets
Distress
Firm Value = Going Concern Value * (1 – Probability of Distress) + Distress Sale Value * Probability of Distress
1 Slide 33 2 Slide 32 3 Slide 43 4 Slide 31Source: Dealing with Distress In Valuation (Damodaran)
34
Going Concern Perpetuity Approach 1
FCF in Last Forecast Period 41.4
Long term growth rate (g) 2.0%
Present value of terminal value 564.3
Present value of stage 1 cash flows 63.9
Going Concern Value 628.2
Implied TV exit EBITDA multiple 8.3x
Distress Sale Value 2
Adj. Book Value of Non-Cash Assets 509.0
Distress Sale Proceeds Ratio 65.0%
Distress Sale Value 330.9
Firm ValueGoing Concern
Probability of Distress:
£467.2 75.0% 65.0% 54.2% 45.0% 35.0%
45.0% 328.8 368.7 412.1 448.6 488.5
55.0% 367.0 401.8 439.6 471.5 506.3
65.0% 405.2 434.9 467.2 494.4 524.1
75.0% 443.4 468.0 494.7 517.3 541.9
85.0% 481.5 501.1 522.3 540.2 559.7
Distressed Sale
Proceeds Ratio:
WACC:
£628.2 5.7% 6.7% 7.7% 8.7% 9.7%
1.0% 791.4 642.6 539.1 463.2 405.3
1.5% 882.5 701.6 580.1 493.1 428.0
2.0% 998.3 773.1 628.2 527.5 453.6
2.5% 1,150.6 861.9 685.7 567.4 482.7
3.0% 1,359.8 974.7 755.5 614.4 516.2
Long-term
Growth Rate:

Post-COVID ValuationPrecedent Transactions Valuation Summary
• We assume that the Company reaches normalized EBITDA in 2024 and that transactions multiples will return to Pre-COVID levels by that time. Therefore, we will assume the business is sold in 2024 at Pre-COVID transaction multiples
• For us to assume that the company is sold in 2024, we also must consider the cumulative probability of distress as mentioned in the intrinsic valuation. The firm value using precedent transactions must use the weighted probability scenario formula.
• In order to calculate the going concern valuation, we will apply the Pre-COVID multiple to 2024 EBITDA that is discounted back to present
• We believe this approach to precedent transactions is the only logical option given that the Company will not reach normalized operating EBITDA levels until later in the projection period
Going Concern
Firm Value = Going Concern Value * (1 – Probability of Distress) + Distress Sale Value * Probability of Distress
1 Slide 23Source: Dealing with Distress In Valuation (Damodaran)
Precedent Transactions Methodology Inherent Challenges
• Several challenges arise when approaching the Company from a precedent transactions valuation perspective in the Post-COVID era
• It relies on assumptions regarding discount rates, operating projections and cumulative probability of distress
35
Going Concern Precedent Transactions Approach (£ millions)
2024P EBITDA 89.6
2024 Cost of Capital 7.7%
PV of 2024P EBITDA 65.4
EV/EBITDA Multiple 1 10.0x
Going Concern Value 653.7
Firm ValueGoing Concern
WACC:
£653.7 5.7% 6.7% 7.7% 8.7% 9.7%
7.0x 495.5 476.1 457.6 440.0 423.2
8.5x 601.7 578.1 555.7 534.3 513.9
10.0x 707.9 680.2 653.7 628.5 604.5
11.5x 814.1 782.2 751.8 722.8 695.2
13.0x 920.3 884.2 849.8 817.1 785.9
Exit Multiple:
Probability of Distress:
£478.9 75.0% 65.0% 54.2% 45.0% 35.0%
45.0% 335.2 377.7 423.8 462.6 505.1
55.0% 373.4 410.8 451.3 485.5 522.9
65.0% 411.6 443.9 478.9 508.4 540.7
75.0% 449.7 476.9 506.4 531.3 558.5
85.0% 487.9 510.0 534.0 554.2 576.3
Distressed Sale
Proceeds Ratio:

Post-COVID Valuation Goodwill Impairment: Habit Restaurants Case Study
Impairment Triggering Event Transaction Comparison
• While goodwill is normally tested annually for impairment, if it is determined that economic circumstances caused a “triggering event,” an interim test may be necessary
• A triggering event can be caused by deterioration in economic conditions, industry or market conditions, declining financial performance or other entity-specific events
• YUM! management determined that the COVID-19 pandemic had an immediate detrimental impact on the financial performance of Habit and, therefore, qualified it as a triggering event
Source: Evergreen Advisors
March 2020 September 2018
$219m £472m
$120m63%
£236m50%
Transaction Date
Goodwill
Goodwill Impairment
Billy’s
Transaction Overview
• On March 18, 2020, before the impacts of COVID-19 were known, YUM! Brands, an international owner and operator of restaurant chains (including KFC, Pizza Hut, Taco Bell, and WingStreet), acquired The Habit Restaurants, Inc. for ~$408m in cash
• At the time of the transaction, Habit operated 245 directly-owned restaurants and 31 franchised restaurants in the US and China
• YUM! recorded $219m in goodwill and $98m in brand/trademark value as a result of the transaction (based on third-party valuation)
• Within the same filing, YUM! disclosed that virtually all Habit’s restaurants were impacted by COVID-19 and, as a result, recorded an interim impairment of $139m, indicating a 63% write-off of goodwill less than two weeks after the transaction closed
• This case is particularly pertinent to DevourAll’s acquisition of Billy’s Restaurant in terms of the unfortunate timing and the fact that a significant portion of the deal value is represented by intangible assets
3636

Post-COVID ValuationWACC & Capital Structure Assumptions
WACC Assumptions
WACC Analysis for DevourAll Group
Debt / Debt / Adj. 2 Year Unlevered Beta
Tickers Company Equity Total Cap. Beta 2-Year
MAB.L Mitchells & Butlers 370.0% 78.7% 1.643 0.350
JDW.L JD Wetherspoon 127.8% 56.1% 1.333 0.585
MARS.L Marston's 671.5% 87.0% 1.812 0.235
GRG.L Greggs 9.2% 8.4% 1.190 1.125
RTN.L Restaurant Group 333.6% 76.9% 2.428 0.560
Mean 302.4% 61.4% 1.68 0.57
Median 333.6% 76.9% 1.64 0.56
1 Slide 31 2 Slide 49WACC as of 9/30/2020
• Beta: Average of comparable companies’ Bloomberg Adjusted Two-Year Beta (regressed against Bloomberg European 500)
• Capital Weights: Average of comparable companies’ debt/equity ratio which implied the debt to capital ratio
• Cost of Debt: Estimated using firm’s implied bond rating 1
• Assumed Tax Rate: DevourAll’s effective tax rate for 2020P is projected to be 0% due to net operating loss
• Risk Free Rate: Normalized to UK 2.5% per Duff & Phelps as of 6/30/20
• U.K. Equity Risk Premium: As of September 30, 2020, per Damodaran research
• Size Premium: Per 9th decile Duff and Phelps size premium 2
WACC Calculations Post-COVID
Capital Weights
% Debt 75.1%
% Equity 24.9%
Cost of Debt
Pre-Tax Cost of Debt 11.14%
Assumed Tax Rate 0.0%
After-Tax Cost of Debt 11.14%
Cost of Equity
Risk Free Rate 2.50%
Unlevered Beta 0.56
Debt / Equity 302.4%
Relevered Beta 2.253
Equity Risk Premium 6.92%
Size Premium 2.22%
Cost of Equity 20.31%
WACC 13.4%
37

Post-COVID ValuationValuation Summary
Valuation Methodology Commentary
Precedent Transactions 1
Trading Comparables 2
Intrinsic Analysis 3
2024 EBITDA: £89mPV of 2024 EBITDA: £65mMultiple: 9.0x – 11.0x
2021 EBITDA: £36mForward Multiple: 12.0x – 14.0x
Perpetuity Growth Rate: 1.75% - 2.25%Cumulative Probability of Distress: 45% - 65%
• 9.0x – 11.0x multiple applied to PV of 2024 EBITDA
• Utilized a weighted probability scenario of going concern or success
• Challenges associated with this approach grant it less consideration with regards to final valuation
£430
£436
£440
£500
£508
£520
Preliminary Valuation £435m - £505m
• Analysis consisted of 5 publicly traded peers
• Median 2021 forward EBITDA multiple of 13.8x and mean 2021 forward EBITDA multiple of 13.0x
• Utilized the 2021 forward multiple since EBTIDA margins of peers return to Pre-COVID levels at that time
• Utilized a weighted probability scenario of going concern or success
• Proceeds from a distress sale amounted to £330.9m, which is calculated by applying a distress sale ratio of 65% to adjusted book value of non-cash assets
• Dynamic cost of capital throughout the explicit forecast period that converges over time with Pre-COVID levels
1 Slide 35 2 Slide 29 3 Slide 34 38
Situation AnalysisConclusion
• Pre-COVID, DevourAll should be valued at £1,000-1,300m based on a discounted cash flow, precedent transaction, and trading comps methodology
Pre-COVID Valuation
• Post-COVID, DevourAll should be valued at £435-505m based on a discounted cash flow, precedent transaction, and trading comps methodology with adjustments for distress
Post-COVID
• Moving forward, the Company should monitor the COVID-19 macro environment and continue with their phased plan to reopen stores and open new sites post-pandemic, beginning 2022
Next Steps
39

Appendix

AppendixPre-COVID Analysis: Growth Rates and Margins
Growth Rates and MarginsFiscal Year 2019A 2020P 2021P 2022P 2023P 2024P
Fiscal Year End Date 12/31/19 12/31/20 12/31/21 12/31/22 12/31/23 12/31/24
Revenue Metrics
Total Revenue Growth 52.2% 3.9% 5.3% 8.0% 5.4% 4.4%
Revenue per Site (£ millions) 1.65 1.68 1.72 1.74 1.81 1.87
Cost Metrics
COGS as a % of Revenue (81.7%) (81.8%) (81.3%) (81.0%) (80.9%) (80.8%)
Gross Margin 18.3% 18.2% 18.7% 19.0% 19.1% 19.2%
SG&A as a % of Total Revenue (5.1%) (5.2%) (5.2%) (5.2%) (5.1%) (5.0%)
EBITDA Margin 13.2% 13.1% 13.5% 13.8% 14.0% 14.2%
EBIT Margin 8.4% 8.2% 8.8% 9.1% 8.9% 8.8%
Restaurant Metrics
UK Restaurant Count 362 367 375 393 398 401
% Growth 42.5% 1.4% 2.2% 4.8% 1.3% 0.8%
% Total 69.7% 69.1% 68.7% 67.4% 67.3% 67.2%
US Restaurant Count 118 121 126 136 139 140
% Growth 9.3% 2.5% 4.1% 7.9% 2.2% 0.7%
% Total 22.7% 22.8% 23.1% 23.3% 23.5% 23.5%
Europe Restaurant Count 39 43 45 54 54 56
% Growth 5.4% 10.3% 4.7% 20.0% -- 3.7%
% Total 7.5% 8.1% 8.2% 9.3% 9.1% 9.4%
Total Number of Restaurants 519 531 546 583 591 597
% Growth 30.1% 2.3% 2.8% 6.8% 1.4% 1.0%
Additional Information
Capital Expenditures 55.7£ 60.9£ 75.0£ 100.2£ 63.4£ 62.1£
Capital Expenditures as a % of Revenue 6.5% 6.8% 8.0% 9.9% 5.9% 5.6%
Depreciation & Amortization 40.6£ 43.0£ 44.5£ 46.8£ 54.7£ 60.3£
Depreciation & Amortization as a % of Capex 72.9% 70.6% 59.3% 46.7% 86.3% 97.1%
Growth Trends
Cost of Goods Sold 53.5% 4.1% 4.7% 7.7% 5.2% 4.2%
SG&A 47.7% 4.3% 6.5% 8.2% 3.4% 2.2%
Total Costs 53.1% 4.1% 4.8% 7.7% 5.1% 4.1%
EBITDA 46.8% 3.0% 9.0% 9.9% 7.2% 6.2%
EBIT 67.4% 1.4% 12.3% 12.5% 2.4% 3.8%41

AppendixPost-COVID Analysis: Growth Rates and Margins
Growth Rates and MarginsFiscal Year 2019A 2020P 2021P 2022P 2023P 2024P
Fiscal Year End Date 12/31/19 12/31/20 12/31/21 12/31/22 12/31/23 12/31/24
Revenue Metrics
Total Revenue Growth 52.2% (54.5%) 42.9% 6.0% 6.0% 6.0%
Revenue per Site (£ millions) 1.65 1.04 1.49 1.54 1.59 1.64
Cost Metrics
COGS as a % of Revenue (81.7%) (79.9%) (87.6%) (84.6%) (81.7%) (81.0%)
Gross Margin 18.3% 20.1% 12.4% 15.4% 18.3% 19.0%
SG&A as a % of Total Revenue (5.1%) (16.9%) (5.9%) (5.5%) (5.1%) (5.5%)
EBITDA Margin 13.2% 3.2% 6.5% 9.8% 13.2% 13.5%
EBIT Margin 8.4% (6.4%) (41.2%) 5.4% 8.7% 9.0%
Restaurant Metrics
UK Restaurant Count 362 262 262 269 275 282
% Growth 42.5% (27.6%) -- 2.5% 2.5% 2.5%
% Total 69.7% 69.9% 69.9% 69.9% 69.9% 69.9%
US Restaurant Count 118 85 85 87 89 92
% Growth 9.3% (28.0%) -- 2.5% 2.5% 2.5%
% Total 22.7% 22.7% 22.7% 22.7% 22.7% 22.7%
Europe Restaurant Count 39 28 28 29 29 30
% Growth 5.4% (28.2%) -- 2.5% 2.5% 2.5%
% Total 7.5% 7.5% 7.5% 7.5% 7.5% 7.5%
Total Number of Restaurants 519 375 375 384 394 404
% Growth 30.1% (27.7%) -- 2.5% 2.5% 2.5%
Additional Information
Capital Expenditures 55.7£ 25.2£ 27.2£ 29.2£ 31.2£ 33.2£
Capital Expenditures as a % of Revenue 6.5% 6.5% 4.9% 4.9% 5.0% 5.0%
Depreciation & Amortization 40.6£ 35.3£ 29.9£ 26.3£ 28.1£ 29.9£
Depreciation & Amortization as a % of Capex 72.9% 140.0% 110.0% 90.0% 90.0% 90.0%
Growth Trends
Cost of Goods Sold 53.5% (55.5%) 56.7% 2.4% 2.3% 5.1%
SG&A 47.7% 50.1% (50.3%) (0.9%) (1.4%) 13.8%
Total Costs 53.1% (49.3%) 38.0% 2.2% 2.1% 5.6%
EBITDA 46.8% (89.0%) 192.9% 60.3% 41.9% 8.6%
EBIT 67.4% (134.6%) 817.4% (113.9%) 70.8% 9.7%42

AppendixCost of Debt Analysis
Credit Default Risk Spread 1
1 NYU Stern, for firms with a market cap of <£5bn 2 Spread over normalized risk-free rate of 3% 3 Standard & Poor’s 4 S&P Global Market Intelligence
Synthetic Rating Rationale
Public US Restaurants’ Credit Rating 4
• Several assumptions must be made since historical interest expense nor capital lease information is given
• We estimate that DevourAll would be able to raise debt at a cost similar to B1/B+ rated companies Pre-COVID and Ca2/CC Post-COVID
• A rating of B+ indicates a company is more vulnerable to non-repayment than “BB”, as it is non-investment grade, however the obligor currently retains the ability to repay commitments on the obligation 3
• A rating of CC indicates a high vulnerability to non-repayment. As is the case with B+ as well, adverse business, financial, or economic conditions are likely to severely impair the company’s capacity to make repayment 3
• In addition to these qualitative measures, a study of comparable restaurant chains creditworthiness was studied Pre-COVID to estimate the Company’s cost of debt
0
2
4
6
8
10
12
14
16
August 7, 2020 Sector peak on April 3, 2020 February 28, 2020
Pre-COVID Post-COVID
Interest Coverage
Ratio
Credit
RatingSpread
2
0.00-0.49 D2/D 15.12%
0.50-0.79 C2/C 11.34%
0.80-1.249 Ca2/CC 8.64%
1.25-1.49 Caa/CCC 8.20%
1.5-1.99 B3/B- 5.15%
2.00-2.49 B2/B 4.21%
2.50-2.99 B1/B+ 3.51%
3.00-3.49 Ba2/BB 2.40%
3.50-3.99 Ba1/BB+ 2.00%
4.00-4.49 Baa2/BBB 1.56%
4.5-5.99 A3/A- 1.22%
6.00-7.49 A2/A 1.08%
7.50-9.49 A1/A+ 0.98%
9.50-12.49 Aa2/AA 0.78%
12.5+ Aaa/AAA 0.63%
43

AppendixCost of Debt Analysis
Company2019 Interest Coverage
(EBITDA/Interest Expense)Implied 2019 Credit Rating
2.8x B+
18.6x AAA
5.8x A-
2.1x B
5.2x A-
DevourAll Estimated
Pre-COVID Credit
Rating
B+
• Synthetic credit rating of B+ derived from peer group coverage ratio is used for Pre-COVID cost of debt and Post-COVID implied interest expense
• Since Billy’s Restaurant acquisition occurred Pre-COVID, assumed incremental debt from acquisition (~92% of total post-acquisition debt balance) was financed at Pre-COVID cost
44

AppendixPost-COVID NWC Assumptions
DCF Assumptions
• The following net working capital assumptions incorporate the Company’s business model, current level of distress, and expected return to normalcy in 2021 (90% of Pre-COVID sales per site)
• Receivables: £5m reduction in 2020 per management guidance. Operations normalize in 2021, but remain at elevated days sales outstanding levels due to more credit card sales and less cash sales in a Post-COVID world
• Inventory: £3.4m reduction in 2020 per management guidance. Inventory turnover begins to normalize in 2021 and conform to Pre-COVID levels
• Prepaid Expenses: Decreases in 2020 as the distressed firm attempts to avoid pre-payment for services/assets.
• Trade Accounts Payable: £10m increase in 2020 per management guidance. Days payable outstanding gradually reverts to Pre-COVID levels
• Accrued Expenses: Increase as a % of sales in 2020 and gradually revert to Pre-COVID levels throughout the remainder of the projection period
Net Working Capital Analysis (£ millions)
Fiscal Year 2020P 2021P 2022P 2023P 2024P
Fiscal Year End Date 12/31/20 12/31/21 12/31/22 12/31/23 12/31/24
Change in Current Assets Excl. Cash (13.1) 10.8 (0.7) 2.2 2.5
Change in Current Liabilities 7.1 3.6 (15.1) (17.0) (1.1)
Change in Net Working Capital (20.2)£ 7.2£ 14.4£ 19.2£ 3.6£
Current AssetsReceivables
Beginning of Period 17.4 12.4 18.3 19.4 20.6Change (5.0) 5.9 1.1 1.2 1.2End of Period 12.4 18.3 19.4 20.6 21.8Days Sales Outstanding 14.0 12.0 12.0 12.0 12.0
InventoryBeginning of Period 7.4 4.0 6.1 5.9 5.7Change (3.4) 2.1 (0.2) (0.2) (0.0)End of Period 4.0 6.1 5.9 5.7 5.7Inventory Turnover 54.6 80.0 85.0 90.0 95.0
Prepaid Expenses & OtherBeginning of Period 24.2 19.5 22.3 20.7 21.9Change (4.7) 2.8 (1.6) 1.2 1.3End of Period 19.5 22.3 20.7 21.9 23.2Prepaid Expenses as a % of Sales 5% 4% 4% 4% 4%
Current LiabilitiesTrade Accounts Payable
Beginning of Period 52.2 62.2 60.2 54.8 49.1Change 10.0 (2.0) (5.4) (5.7) (4.9)End of Period 62.2 60.2 54.8 49.1 44.2Days Payable Outstanding 67.0 45.0 40.0 35.0 30.0
Accrued ExpensesBeginning of Period 80.9 78.0 83.6 73.8 62.6Change (2.9) 5.6 (9.7) (11.2) 3.8End of Period 78.0 83.6 73.8 62.6 66.4Accrued Expenses as % of Sales 20% 15% 13% 10% 10%
45

AppendixPost-COVID Income Statement
Revenue & Cost Assumptions
• Revenue: The Company’s revenue growth is expected to decline by 54.5% in 2020
• Gross Profit: Gross profit is expected to slash in half in 2020 as compared to Pre-COVID levels
• EBITDA: The Company anticipates EBITDA Margin to decrease by 10% in 2020, then return to 2019 levels in three years
• Depreciation & Amortization: Assumed mid-year 2020 sale of 25% of sites sold at book value, leaving D&A as a % of Capex at 12.5% and 25% of 2019 levels in 2020 and 2021, respectively
• Restructuring Expense: The Company underwent a restructuring in 2020 that led to site closures and an expense of £2.1 mm
• Goodwill Impairment: Assume goodwill from acquisition of Billy’s Restaurant is written down by 50% in 2021
• Implied Interest Expense: Utilized Pre-COVID pre-tax cost of debt and multiplied by average debt balance for the year to back into implied interest expense
• Loss on Disposal: Assumed exit of 144 sites at 50% book value
• Net Operating Loss: Per gov.uk, an allowance of up to £5m, plus 50% of remaining trading profits
Revenue & Cost Assumptions, continued
46
DevourAll Group Income Statement (£ millions)
Fiscal Year 2019A 2020P 2021P 2022P 2023P 2024P
Fiscal Year End Date 12/31/19 12/31/20 12/31/21 12/31/22 12/31/23 12/31/24
Total Revenue 856.8£ 389.8£ 557.2£ 590.7£ 626.1£ 663.8£
% Growth 52.2% (54.5%) 42.9% 6.0% 6.0% 6.0%
Less: Cost of Goods Sold (699.9) (311.4) (488.1) (500.0) (511.6) (537.7)
Gross Profit 156.9£ 78.5£ 69.1£ 90.7£ 114.6£ 126.1£
% Margin 18.3% 20.1% 12.4% 15.4% 18.3% 19.0%
Less: SG&A (44.0) (66.1) (32.8) (32.5) (32.1) (36.5)
EBITDA 112.9£ 12.4£ 36.3£ 58.1£ 82.5£ 89.6£
% Margin 13.2% 3.2% 6.5% 9.8% 13.2% 13.5%
Less: Depreciation & Amortization (40.6) (35.3) (29.9) (26.3) (28.1) (29.9)
Less: Restructuring Expense -- (2.1) -- -- -- --
EBIT 72.3£ (25.0)£ 6.4£ 31.9£ 54.4£ 59.7£
% Margin 8.4% (6.4%) 1.1% 5.4% 8.7% 9.0%
Less: Implied Interest Expense (17.8) (17.8) (15.9) (14.2) (12.9)
Less: Loss on Disposal (43.3) -- -- -- --
EBT (86.1)£ (11.5)£ 16.0£ 40.2£ 46.8£
NOL -- 45.5 53.8 37.8 --
Effective Tax Rate -- -- -- 1.2% 19.0%
Taxes -- -- -- (0.5) (8.9)
Less: Goodwill Impairment -- (235.7) -- -- --
Net Income (86.1)£ (247.2)£ 16.0£ 40.7£ 55.7£

AppendixPost-COVID Balance Sheet
• Cash: Increase in cash balance due to restructuring sale of 144 sites
• Receivables: The Company expects a decrease of £5.0m in receivables in 2020
• Inventory: Management projects a £3.4m decrease in inventory in 2020
• Intangibles and Goodwill:Reflects 50% goodwill impairment
Assets
• Trade Accounts Payable:The Company anticipates the closing balance of receivables to increase £10.0m in 2020
• Long-term Debt: Reflects the Company’s £30m increase in working capital facility in 2020, then gradual paydown with residual cash
Liabilities
47
DevourAll Group Balance Sheet (£ millions)
Fiscal Year 2018A 2019A 2020P 2021P 2022P 2023P 2024P
Fiscal Year End Date 12/31/18 12/31/19 12/31/20 12/31/21 12/31/22 12/31/23 12/31/24
Current Assets
Cash 52.6 39.7 100.4 54.4 23.1 21.5 50.3
Receivables 18.2 17.4 12.4 18.3 19.4 20.6 21.8
Inventory 6.9 7.4 4.0 6.1 5.9 5.7 5.7
Prepaid Expenses & Other 25.0 24.2 19.5 22.3 20.7 21.9 23.2
Total Current Assets 102.7 88.7 136.3 101.1 69.1 69.7 101.0
Non-current Assets
Land, Buildings, & Equipment 296.7 311.8 215.2 212.5 215.4 218.5 221.8
Intangibles & Goodwill 494.7 492.5 492.5 256.8 256.8 256.8 256.8
Other Assets 1.1 1.1 1.1 1.1 1.1 1.1 1.1
Total Noncurrent Assets 792.5 805.4 708.8 470.4 473.3 476.4 479.7
Total Assets 895.2£ 894.1£ 845.1£ 571.5£ 542.4£ 546.1£ 580.7£
Current Liabilities
Trade Accounts Payable 62.9 52.2 62.2 60.2 54.8 49.1 44.2
Accrued Expenses 91.0 80.9 78.0 83.6 73.8 62.6 66.4
Short-term Debt 0.2 8.8 8.8 8.8 8.8 8.8 8.8
Other Current Liabilities 26.5 36.2 36.2 36.2 36.2 36.2 36.2
Total Current Liabilities 180.6 178.1 185.2 188.7 173.6 156.7 155.6
Non-current Liabilities
Long-term Debt 283.0 258.6 288.6 258.6 228.6 208.6 188.6
Capital Leases 1.9 9.5 9.5 9.5 9.5 9.5 9.5
Other Liabilities 110.6 83.1 83.1 83.1 83.1 83.1 83.1
Total Non-current Liabilities 395.5 351.2 381.2 351.2 321.2 301.2 281.2
Total Liabilities 576.1£ 529.3£ 566.4£ 539.9£ 494.8£ 457.9£ 436.8£
Equity 319.1 364.7 278.6 31.5 47.5 88.2 143.9
Total Liabilities & Equity 895.2£ 894.0£ 845.0£ 571.4£ 542.3£ 546.0£ 580.6£

AppendixPost-COVID Statement of Cash Flows
48
DevourAll Group Cash Flow Statement (£ millions)
Fiscal Year 2020P 2021P 2022P 2023P 2024P
Fiscal Year End Date 12/31/20 12/31/21 12/31/22 12/31/23 12/31/24
Net Income (86.1) (247.2) 16.0 40.7 55.7
D&A 35.3 29.9 26.3 28.1 29.9
Non-Cash Loss on Disposal 43.3 -- -- -- --
Goodwill Impairment -- 235.7 -- -- --
Changes in NWC 20.2 (7.2) (14.4) (19.2) (3.6)
Cash Flow from Operations 12.6£ 11.2£ 27.9£ 49.6£ 81.9£
Capex (25.2) (27.2) (29.2) (31.2) (33.2)
Disposal of Fixed Assets 43.3 -- -- -- --
Cash Flow from Investing 18.1£ (27.2)£ (29.2)£ (31.2)£ (33.2)£
Issuance (Repayment) of Debt 30.0 (30.0) (30.0) (20.0) (20.0)
Cash Flow from Financing 30.0£ (30.0)£ (30.0)£ (20.0)£ (20.0)£
Change in Cash 60.7£ (46.0)£ (31.3)£ (1.6)£ 28.8£

AppendixSize & Tax Rate Assumptions
Size Premium Deciles
Market Cap (£mm) Size Premium in Excess
Smallest Largest of CAPM
1 - Largest 31,090 1,061,355 -0.28%
2 13,143 30,543 0.50%
3 6,619 13,100 0.73%
4 4,313 6,615 0.79%
5 2,689 4,311 1.10%
6 1,670 2,686 1.34%
7 994 1,668 1.47%
8 516 994 1.59%
9 230 516 2.22%
10 - Smallest 2 230 4.99%
Decile
• Pre-COVID Tax Rate: Used Corporation Tax main rate of 19% that was set at the Summer Budget 2015 for the year beginning April 1, 2019 for Pre-COVID cost of debt and EBIAT calculations 1
• Post-COVID Tax Rate: Used effective tax rate of 0% in 2020-2021P and 14% in 2022P due to NOL for Post-COVID EBIAT and cost of debt calculations, normalizing back to 19% Corporation Tax main rate in 2023P and beyond
Tax Rate Assumptions
Implied a Pre-COVID size premium of the 7th decile using intrinsic valuation output of equity value of ~ £1,050m
Implied a Post-COVID size premium of the 9th decile using intrinsic valuation output of equity value range of ~ £480m
1 gov.uk 49

AppendixProfitability Comparison (% of Revenue)
Pre-COVID
Post-COVID
13% 14% 14% 14% 14%
5% 5% 5% 5% 5%
79% 78% 75% 77% 77%
2020 2021 2022 2023 2024
3%7% 10% 13% 14%
17% 6% 6% 5% 6%
80%88% 85% 82% 81%
2020 2021 2022 2023 2024
EBITDA SG&A COGS 50

AppendixPublic Trading Comparables
Financial information as of 12/31/19 51
Company Headquarters EV (£m)Revenue (£m)
% EBITDA MarginSelect Brands Additional Comments
Birmingham, UK £3,262£2,237
18.60%
Sizzling Pubs, O'Neill's,
Vintage Inns, Harvester, All
Bar One
One of the largest operators of
restaurants, bars, and pubs in the UK
Newcastle-Upon-Tyne, UK £2,507£1,167
19.80%Greggs
A bakery and sandwhich shop with over
2,000 locations in the UK
Watford, UK £2,355£1,818
11.70%
Wetherspoon, Lloyd's No. 1
Bars, Wetherspoon Hotels
An operator of over 800 pubs in the UK
and Ireland and a growing number of
Wetherspoon hotels
Wolverhampton, UK £2,227£1,173
18.80%
Marston's Brewery,
Marston's Inns
A British brewery, pub, and hotel
operator with over 1,500 locations in
England and Wales
London, UK £1,079£1,073
12.90%
Wagamama, Chiquito,
Coast to Coast, Brunning
and Price
A British operator of over 350
restaurants in pubs across the UK and
US