Embed Size (px)
Citation preview

2021 Sector Report
HEALTHCARE INDUSTRYSector: healthcare services and facilities
Agenda
1. Introduction Page 3
2. Healthcare services and facilities sector Page 4
3. Valuation and M&A activity Page 10
4. Introduction to IMAP and relevant expertise Page 36
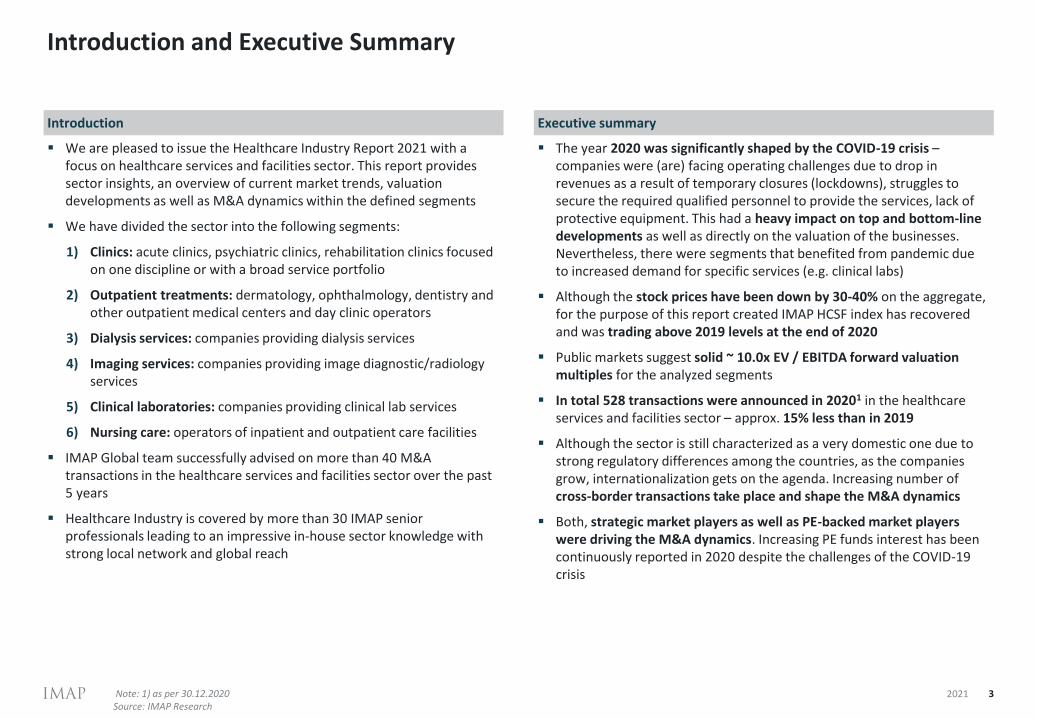
Introduction and Executive Summary
32021
▪ We are pleased to issue the Healthcare Industry Report 2021 with a focus on healthcare services and facilities sector. This report provides sector insights, an overview of current market trends, valuation developments as well as M&A dynamics within the defined segments
▪ We have divided the sector into the following segments:
1) Clinics: acute clinics, psychiatric clinics, rehabilitation clinics focused on one discipline or with a broad service portfolio
2) Outpatient treatments: dermatology, ophthalmology, dentistry and other outpatient medical centers and day clinic operators
3) Dialysis services: companies providing dialysis services
4) Imaging services: companies providing image diagnostic/radiology services
5) Clinical laboratories: companies providing clinical lab services
6) Nursing care: operators of inpatient and outpatient care facilities
▪ IMAP Global team successfully advised on more than 40 M&A transactions in the healthcare services and facilities sector over the past 5 years
▪ Healthcare Industry is covered by more than 30 IMAP senior professionals leading to an impressive in-house sector knowledge with strong local network and global reach
▪ The year 2020 was significantly shaped by the COVID-19 crisis –companies were (are) facing operating challenges due to drop in revenues as a result of temporary closures (lockdowns), struggles to secure the required qualified personnel to provide the services, lack of protective equipment. This had a heavy impact on top and bottom-line developments as well as directly on the valuation of the businesses. Nevertheless, there were segments that benefited from pandemic due to increased demand for specific services (e.g. clinical labs)
▪ Although the stock prices have been down by 30-40% on the aggregate, for the purpose of this report created IMAP HCSF index has recovered and was trading above 2019 levels at the end of 2020
▪ Public markets suggest solid ~ 10.0x EV / EBITDA forward valuation multiples for the analyzed segments
▪ In total 528 transactions were announced in 20201 in the healthcare services and facilities sector – approx. 15% less than in 2019
▪ Although the sector is still characterized as a very domestic one due to strong regulatory differences among the countries, as the companies grow, internationalization gets on the agenda. Increasing number of cross-border transactions take place and shape the M&A dynamics
▪ Both, strategic market players as well as PE-backed market players were driving the M&A dynamics. Increasing PE funds interest has been continuously reported in 2020 despite the challenges of the COVID-19 crisis
Introduction Executive summary
Note: 1) as per 30.12.2020Source: IMAP Research
Agenda
1. Introduction Page 3
2. Healthcare services and facilities market Page 4
3. Valuation and M&A activity Page 10
4. Introduction to IMAP and relevant expertise Page 36
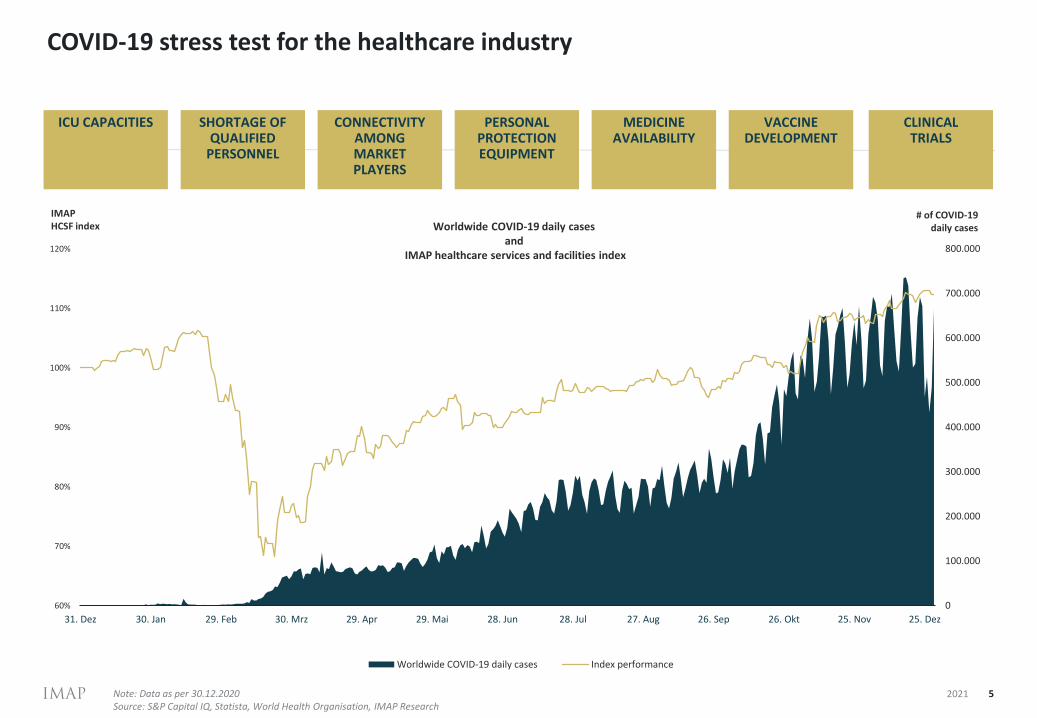
COVID-19 stress test for the healthcare industry
52021
0
100.000
200.000
300.000
400.000
500.000
600.000
700.000
800.000
60%
70%
80%
90%
100%
110%
120%
31. Dez 30. Jan 29. Feb 30. Mrz 29. Apr 29. Mai 28. Jun 28. Jul 27. Aug 26. Sep 26. Okt 25. Nov 25. Dez
Worldwide COVID-19 daily cases Index performance
Worldwide COVID-19 daily cases and
IMAP healthcare services and facilities index
# of COVID-19daily cases
IMAP HCSF index
ICU CAPACITIES SHORTAGE OF QUALIFIED
PERSONNEL
PERSONAL PROTECTION EQUIPMENT
VACCINE DEVELOPMENT
CLINICAL TRIALS
MEDICINE AVAILABILITY
CONNECTIVITY AMONG MARKET PLAYERS
Note: Data as per 30.12.2020Source: S&P Capital IQ, Statista, World Health Organisation, IMAP Research
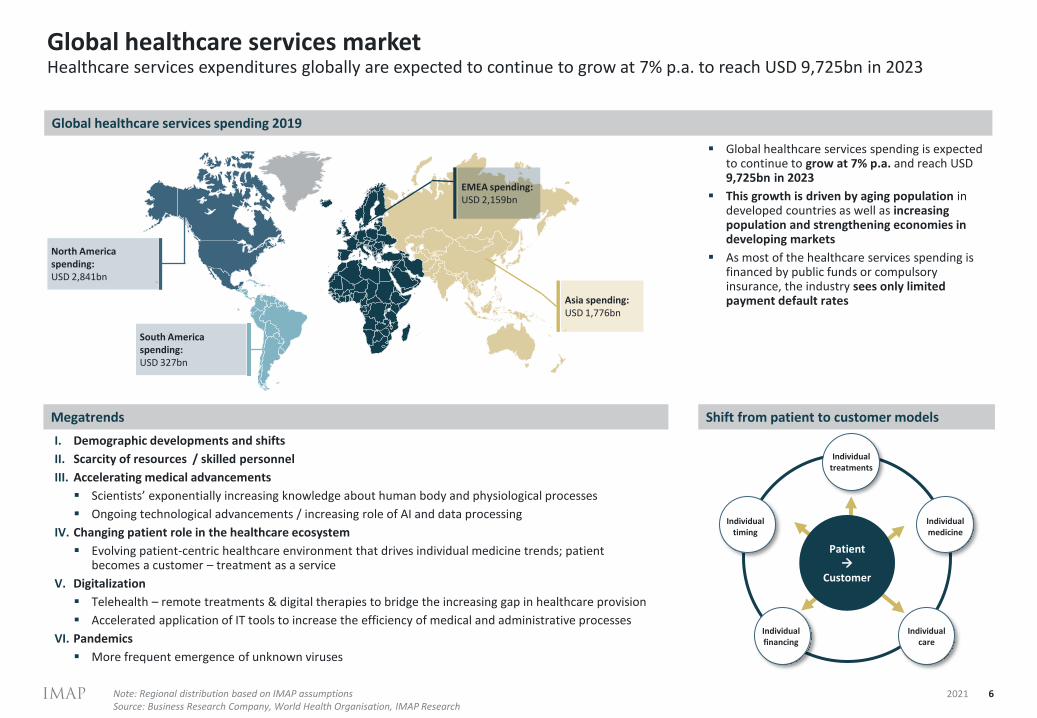
Global healthcare services marketHealthcare services expenditures globally are expected to continue to grow at 7% p.a. to reach USD 9,725bn in 2023
Note: Regional distribution based on IMAP assumptionsSource: Business Research Company, World Health Organisation, IMAP Research
Shift from patient to customer models Megatrends
Individual care
Individual treatments
Individual medicine
Individual financing
Individual timing
EMEA spending: USD 2,159bn
Asia spending: USD 1,776bn
North Americaspending: USD 2,841bn
Global healthcare services spending 2019
▪ Global healthcare services spending is expected to continue to grow at 7% p.a. and reach USD 9,725bn in 2023
▪ This growth is driven by aging population in developed countries as well as increasing population and strengthening economies in developing markets
▪ As most of the healthcare services spending is financed by public funds or compulsory insurance, the industry sees only limited payment default rates
I. Demographic developments and shifts
II. Scarcity of resources / skilled personnel
III. Accelerating medical advancements
▪ Scientists’ exponentially increasing knowledge about human body and physiological processes
▪ Ongoing technological advancements / increasing role of AI and data processing
IV. Changing patient role in the healthcare ecosystem
▪ Evolving patient-centric healthcare environment that drives individual medicine trends; patient becomes a customer – treatment as a service
V. Digitalization
▪ Telehealth – remote treatments & digital therapies to bridge the increasing gap in healthcare provision
▪ Accelerated application of IT tools to increase the efficiency of medical and administrative processes
VI. Pandemics
▪ More frequent emergence of unknown viruses
South Americaspending: USD 327bn
Patient→
Customer
62021
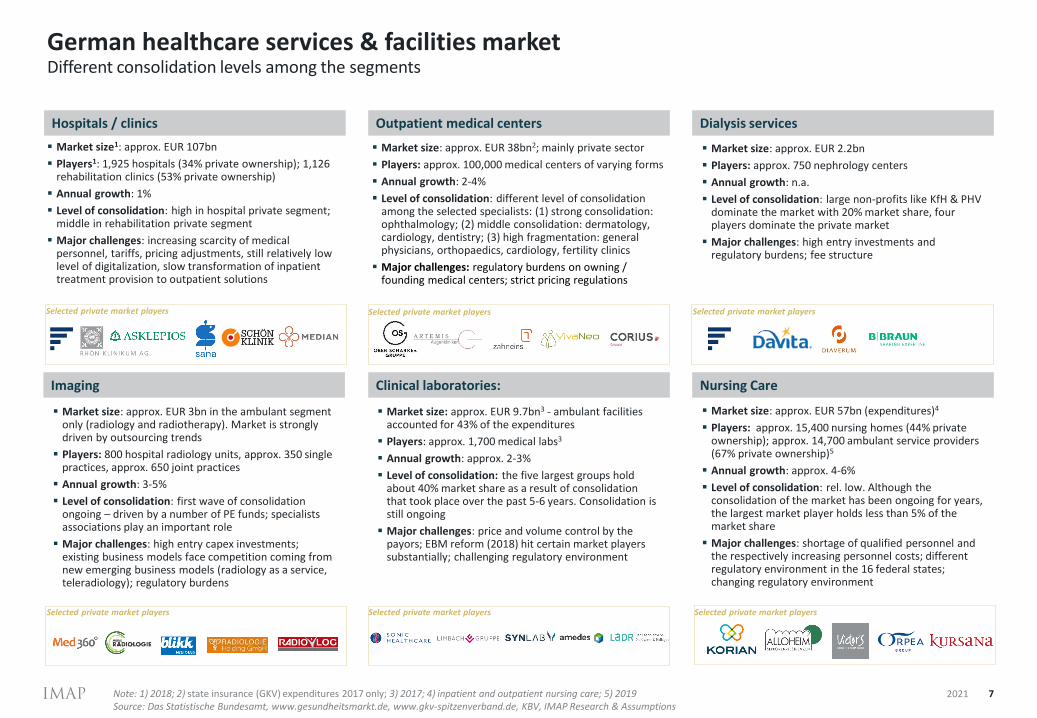
German healthcare services & facilities market
7
Different consolidation levels among the segments
Hospitals / clinics Outpatient medical centers Dialysis services
Note: 1) 2018; 2) state insurance (GKV) expenditures 2017 only; 3) 2017; 4) inpatient and outpatient nursing care; 5) 2019Source: Das Statistische Bundesamt, www.gesundheitsmarkt.de, www.gkv-spitzenverband.de, KBV, IMAP Research & Assumptions
Imaging Clinical laboratories: Nursing Care
▪ Market size1: approx. EUR 107bn
▪ Players1: 1,925 hospitals (34% private ownership); 1,126 rehabilitation clinics (53% private ownership)
▪ Annual growth: 1%
▪ Level of consolidation: high in hospital private segment; middle in rehabilitation private segment
▪ Major challenges: increasing scarcity of medical personnel, tariffs, pricing adjustments, still relatively low level of digitalization, slow transformation of inpatient treatment provision to outpatient solutions
▪ Market size: approx. EUR 38bn2; mainly private sector
▪ Players: approx. 100,000 medical centers of varying forms
▪ Annual growth: 2-4%
▪ Level of consolidation: different level of consolidation among the selected specialists: (1) strong consolidation: ophthalmology; (2) middle consolidation: dermatology, cardiology, dentistry; (3) high fragmentation: general physicians, orthopaedics, cardiology, fertility clinics
▪ Major challenges: regulatory burdens on owning / founding medical centers; strict pricing regulations
▪ Market size: approx. EUR 3bn in the ambulant segment only (radiology and radiotherapy). Market is strongly driven by outsourcing trends
▪ Players: 800 hospital radiology units, approx. 350 single practices, approx. 650 joint practices
▪ Annual growth: 3-5%
▪ Level of consolidation: first wave of consolidation ongoing – driven by a number of PE funds; specialists associations play an important role
▪ Major challenges: high entry capex investments; existing business models face competition coming from new emerging business models (radiology as a service, teleradiology); regulatory burdens
▪ Market size: approx. EUR 9.7bn3 - ambulant facilities accounted for 43% of the expenditures
▪ Players: approx. 1,700 medical labs3
▪ Annual growth: approx. 2-3%
▪ Level of consolidation: the five largest groups hold about 40% market share as a result of consolidation that took place over the past 5-6 years. Consolidation is still ongoing
▪ Major challenges: price and volume control by the payors; EBM reform (2018) hit certain market players substantially; challenging regulatory environment
Selected private market players Selected private market players Selected private market players
Selected private market players Selected private market players Selected private market players
▪ Market size: approx. EUR 57bn (expenditures)4
▪ Players: approx. 15,400 nursing homes (44% private ownership); approx. 14,700 ambulant service providers (67% private ownership)5
▪ Annual growth: approx. 4-6%
▪ Level of consolidation: rel. low. Although the consolidation of the market has been ongoing for years, the largest market player holds less than 5% of the market share
▪ Major challenges: shortage of qualified personnel and the respectively increasing personnel costs; different regulatory environment in the 16 federal states; changing regulatory environment
▪ Market size: approx. EUR 2.2bn
▪ Players: approx. 750 nephrology centers
▪ Annual growth: n.a.
▪ Level of consolidation: large non-profits like KfH & PHV dominate the market with 20% market share, four players dominate the private market
▪ Major challenges: high entry investments and regulatory burdens; fee structure
2021
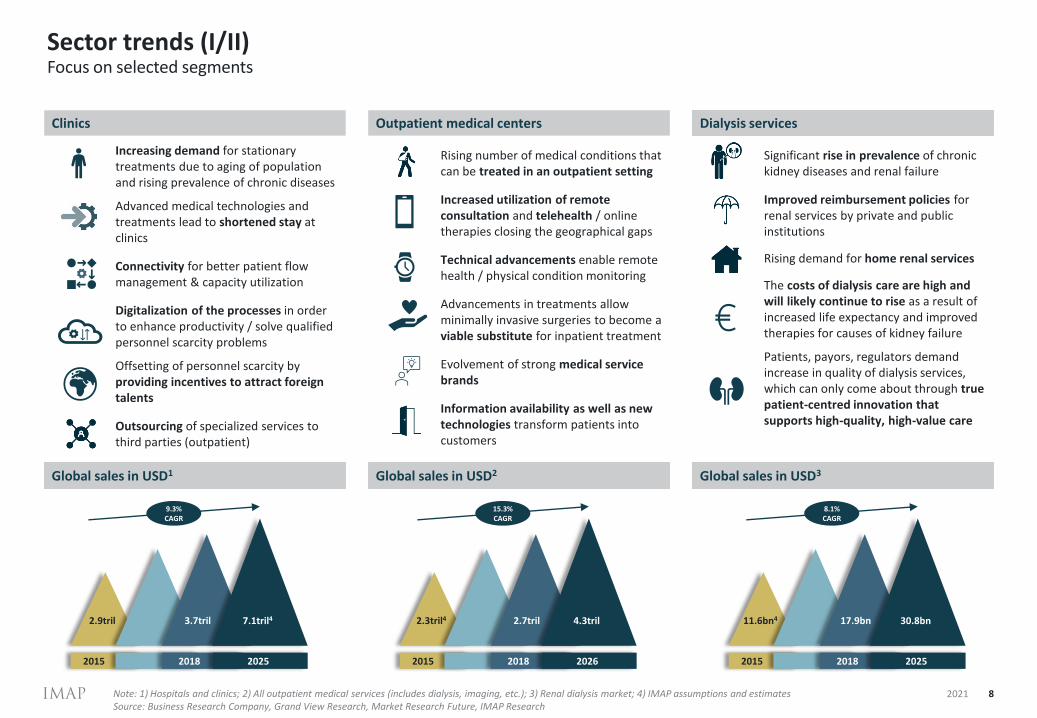
Sector trends (I/II)
8
Focus on selected segments
Clinics Outpatient medical centers Dialysis services
Global sales in USD1 Global sales in USD2 Global sales in USD3
Increasing demand for stationary treatments due to aging of population and rising prevalence of chronic diseases
Advanced medical technologies and treatments lead to shortened stay at clinics
Connectivity for better patient flow management & capacity utilization
Digitalization of the processes in order to enhance productivity / solve qualified personnel scarcity problems
Offsetting of personnel scarcity by providing incentives to attract foreign talents
Outsourcing of specialized services to third parties (outpatient)
Rising number of medical conditions that can be treated in an outpatient setting
Increased utilization of remote consultation and telehealth / online therapies closing the geographical gaps
Technical advancements enable remote health / physical condition monitoring
Advancements in treatments allow minimally invasive surgeries to become a viable substitute for inpatient treatment
Evolvement of strong medical service brands
Information availability as well as new technologies transform patients into customers
Significant rise in prevalence of chronic kidney diseases and renal failure
Improved reimbursement policies for renal services by private and public institutions
Rising demand for home renal services
The costs of dialysis care are high and will likely continue to rise as a result of increased life expectancy and improved therapies for causes of kidney failure
Patients, payors, regulators demand increase in quality of dialysis services, which can only come about through true patient-centred innovation that supports high-quality, high-value care
Note: 1) Hospitals and clinics; 2) All outpatient medical services (includes dialysis, imaging, etc.); 3) Renal dialysis market; 4) IMAP assumptions and estimatesSource: Business Research Company, Grand View Research, Market Research Future, IMAP Research
2021
2015 2018 2025
2.9tril 3.7tril 7.1tril4
9.3% CAGR
2015 2018 2026
2.3tril4 2.7tril 4.3tril
15.3% CAGR
2015 2018 2025
11.6bn4 17.9bn 30.8bn
8.1% CAGR
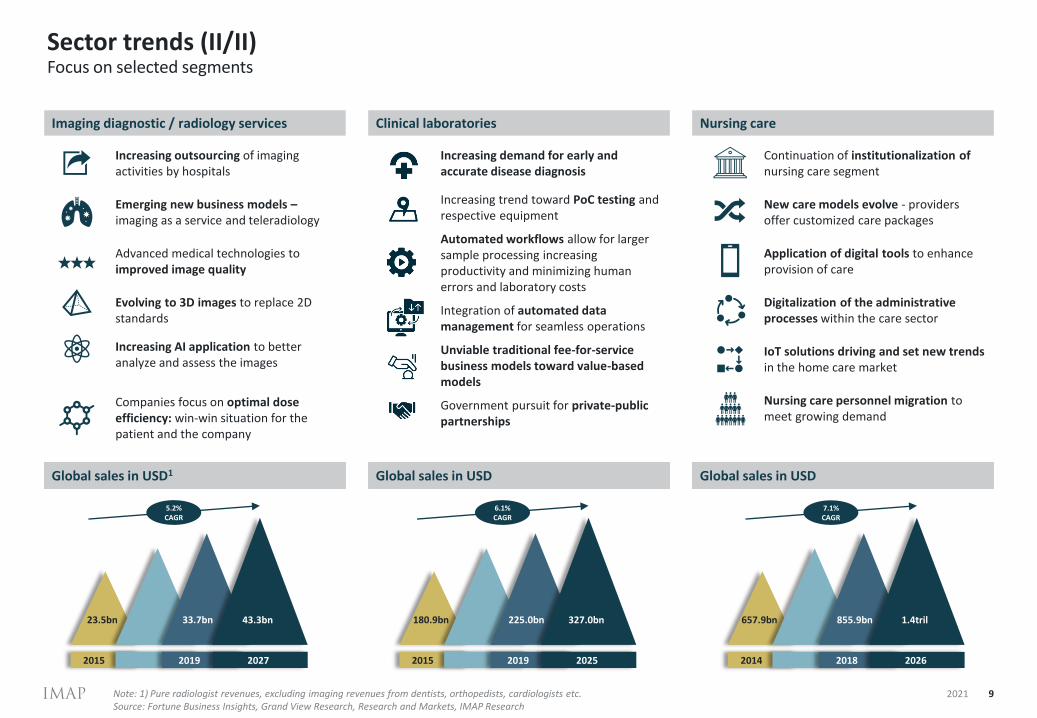
Sector trends (II/II)
9
Focus on selected segments
Imaging diagnostic / radiology services Clinical laboratories Nursing care
Global sales in USD1 Global sales in USD Global sales in USD
Increasing outsourcing of imaging activities by hospitals
Emerging new business models –imaging as a service and teleradiology
Advanced medical technologies to improved image quality
Evolving to 3D images to replace 2D standards
Increasing AI application to better analyze and assess the images
Companies focus on optimal dose efficiency: win-win situation for the patient and the company
Increasing demand for early and accurate disease diagnosis
Increasing trend toward PoC testing and respective equipment
Automated workflows allow for larger sample processing increasing productivity and minimizing human errors and laboratory costs
Integration of automated data management for seamless operations
Unviable traditional fee-for-service business models toward value-based models
Government pursuit for private-public partnerships
Continuation of institutionalization ofnursing care segment
New care models evolve - providers offer customized care packages
Application of digital tools to enhance provision of care
Digitalization of the administrative processes within the care sector
IoT solutions driving and set new trends in the home care market
Nursing care personnel migration to meet growing demand
Note: 1) Pure radiologist revenues, excluding imaging revenues from dentists, orthopedists, cardiologists etc.Source: Fortune Business Insights, Grand View Research, Research and Markets, IMAP Research
2021
2015 2019 2027
23.5bn 33.7bn 43.3bn
5.2% CAGR
2015 2019 2025
180.9bn 225.0bn 327.0bn
6.1% CAGR
657.9bn 855.9bn 1.4tril
7.1% CAGR
2014 2018 2026
Agenda
1. Introduction Page 3
2. Healthcare services and facilities market Page 4
3. Valuation and M&A activity Page 10
4. Introduction to IMAP and relevant expertise Page 36
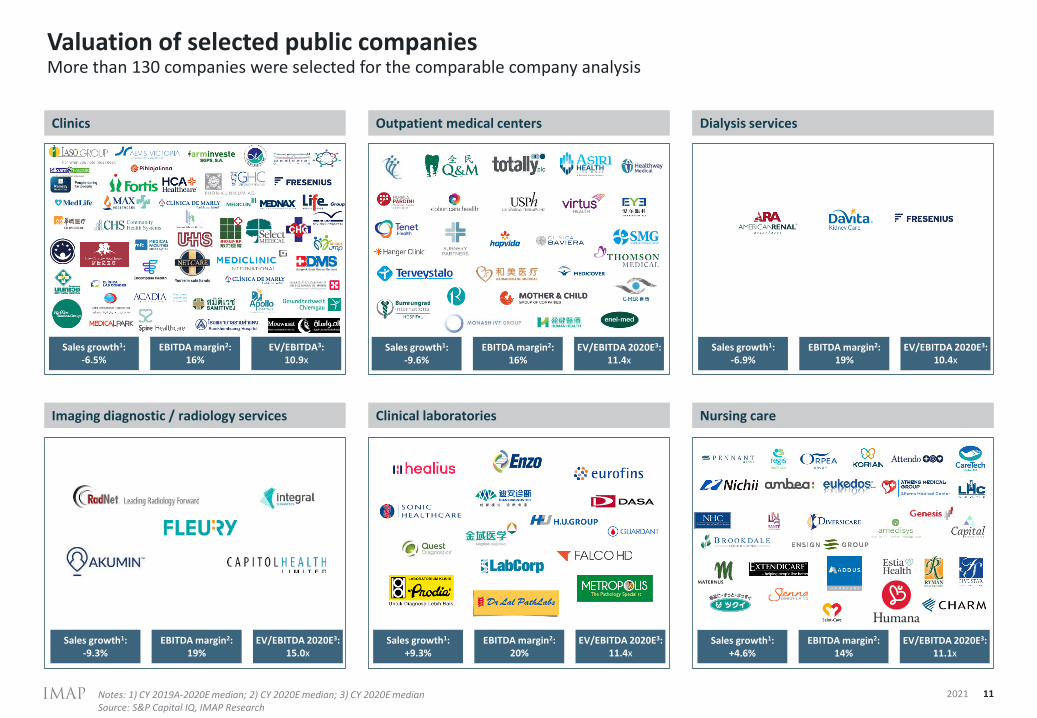
Valuation of selected public companies
11
More than 130 companies were selected for the comparable company analysis
Clinics Outpatient medical centers Dialysis services
Imaging diagnostic / radiology services Clinical laboratories Nursing care
Notes: 1) CY 2019A-2020E median; 2) CY 2020E median; 3) CY 2020E medianSource: S&P Capital IQ, IMAP Research
2021
EV/EBITDA3:10.9x
EBITDA margin2:16%
Sales growth1:-6.5%
EV/EBITDA 2020E3:11.4x
EBITDA margin2:20%
Sales growth1:+9.3%
EV/EBITDA 2020E3:11.4x
EBITDA margin2:16%
Sales growth1:-9.6%
EV/EBITDA 2020E3:10.4x
EBITDA margin2:19%
Sales growth1:-6.9%
EV/EBITDA 2020E3:15.0x
EBITDA margin2:19%
Sales growth1:-9.3%
EV/EBITDA 2020E3:11.1x
EBITDA margin2:14%
Sales growth1:+4.6%
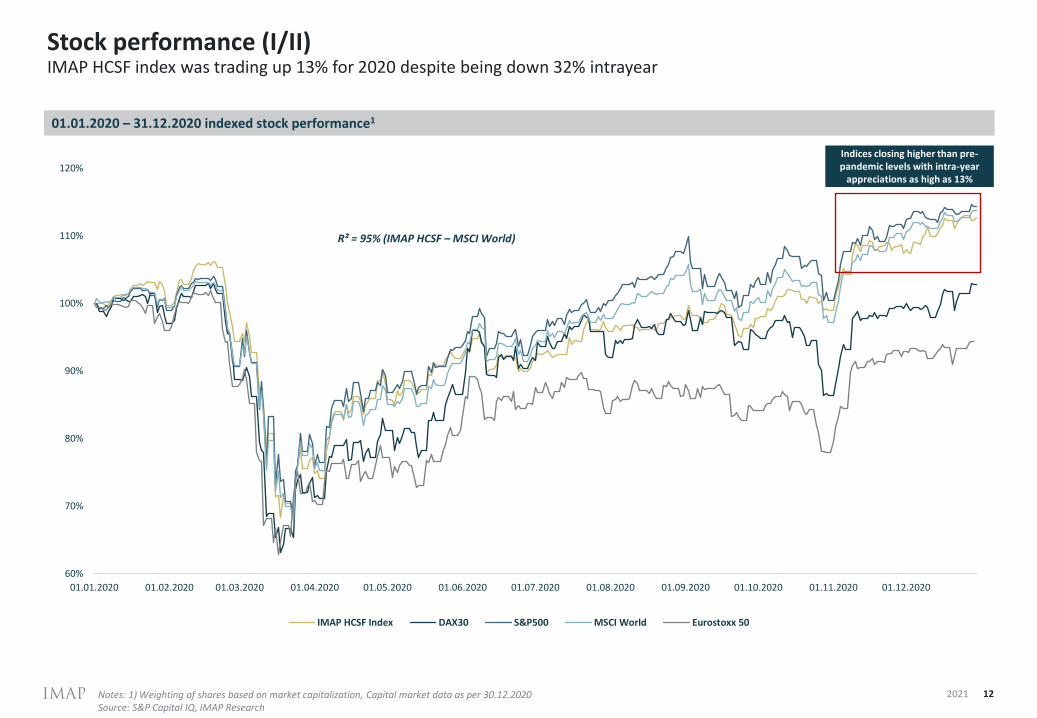
Stock performance (I/II)
12
01.01.2020 – 31.12.2020 indexed stock performance1
IMAP HCSF index was trading up 13% for 2020 despite being down 32% intrayear
Notes: 1) Weighting of shares based on market capitalization, Capital market data as per 30.12.2020Source: S&P Capital IQ, IMAP Research
2021
60%
70%
80%
90%
100%
110%
120%
01.01.2020 01.02.2020 01.03.2020 01.04.2020 01.05.2020 01.06.2020 01.07.2020 01.08.2020 01.09.2020 01.10.2020 01.11.2020 01.12.2020
IMAP HCSF Index DAX30 S&P500 MSCI World Eurostoxx 50
Indices closing higher than pre-pandemic levels with intra-year
appreciations as high as 13%
R² = 95% (IMAP HCSF – MSCI World)
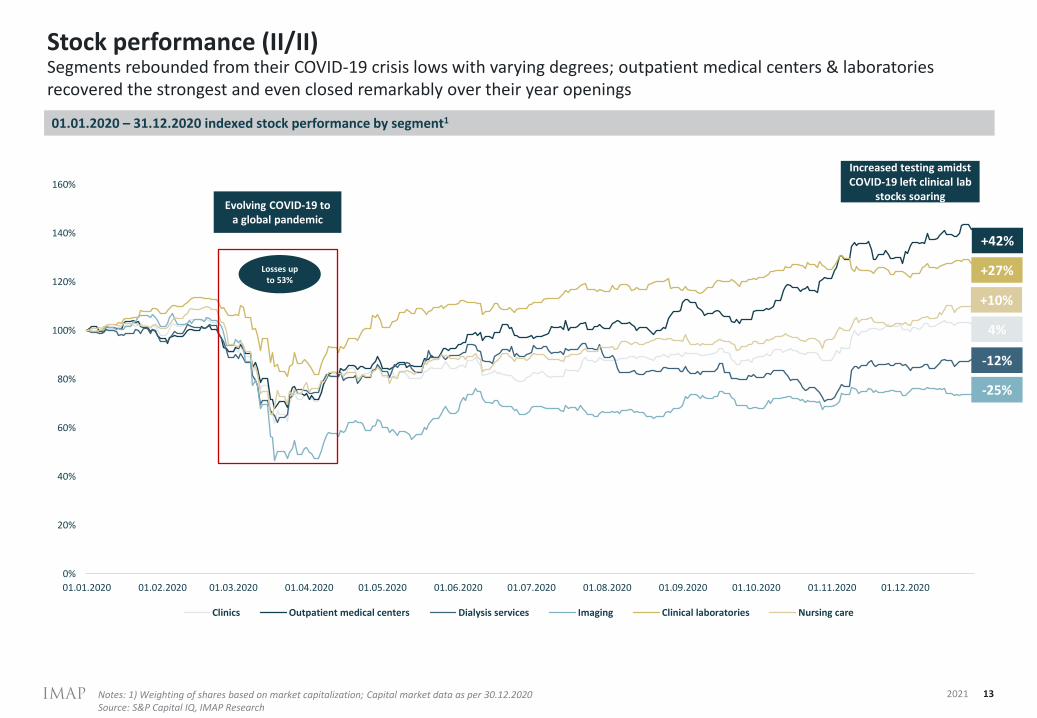
Stock performance (II/II)
13
01.01.2020 – 31.12.2020 indexed stock performance by segment1
Segments rebounded from their COVID-19 crisis lows with varying degrees; outpatient medical centers & laboratories recovered the strongest and even closed remarkably over their year openings
Notes: 1) Weighting of shares based on market capitalization; Capital market data as per 30.12.2020Source: S&P Capital IQ, IMAP Research
2021
0%
20%
40%
60%
80%
100%
120%
140%
160%
01.01.2020 01.02.2020 01.03.2020 01.04.2020 01.05.2020 01.06.2020 01.07.2020 01.08.2020 01.09.2020 01.10.2020 01.11.2020 01.12.2020
Clinics Outpatient medical centers Dialysis services Imaging Clinical laboratories Nursing care
Losses upto 53%
Evolving COVID-19 toa global pandemic
Increased testing amidstCOVID-19 left clinical lab
stocks soaring
4%
+27%
+42%
-12%
-25%
+10%
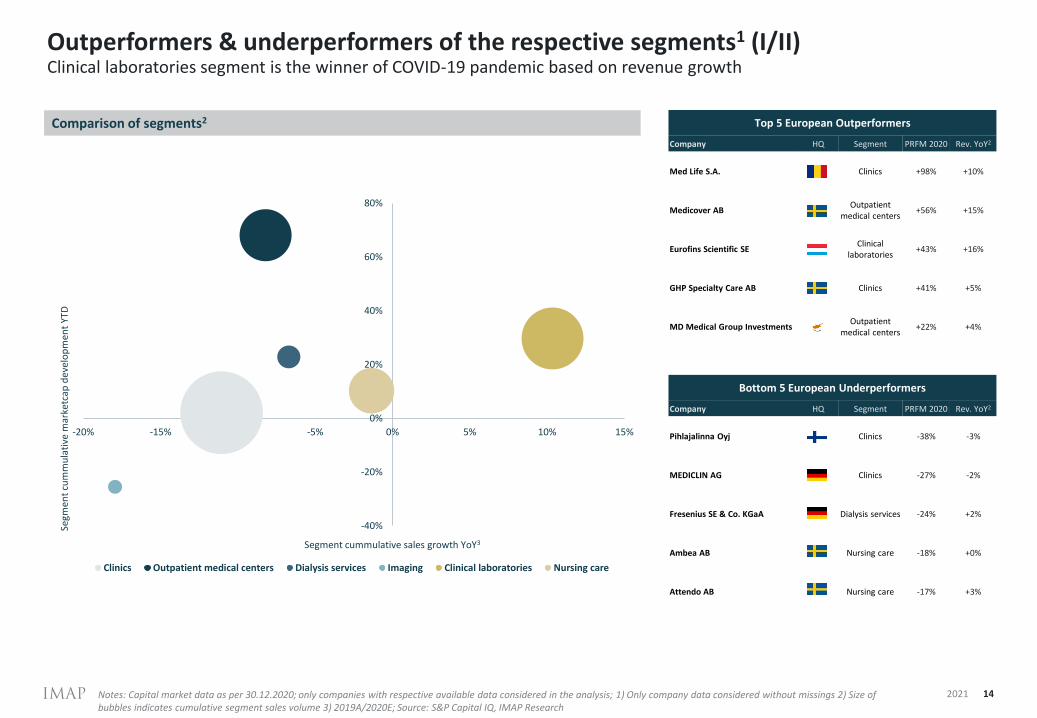
Bottom 5 European Underperformers
Company HQ Segment PRFM 2020 Rev. YoY2
Pihlajalinna Oyj Clinics -38% -3%
MEDICLIN AG Clinics -27% -2%
Fresenius SE & Co. KGaA Dialysis services -24% +2%
Ambea AB Nursing care -18% +0%
Attendo AB Nursing care -17% +3%
Outperformers & underperformers of the respective segments1 (I/II)
14
Clinical laboratories segment is the winner of COVID-19 pandemic based on revenue growth
-40%
-20%
0%
20%
40%
60%
80%
-20% -15% -10% -5% 0% 5% 10% 15%
Segm
ent
cum
mu
lati
vem
arke
tcap
dev
elo
pm
ent
YTD
Segment cummulative sales growth YoY3
Clinics Outpatient medical centers Dialysis services Imaging Clinical laboratories Nursing care
Top 5 European Outperformers
Company HQ Segment PRFM 2020 Rev. YoY2
Med Life S.A. Clinics +98% +10%
Medicover ABOutpatient
medical centers+56% +15%
Eurofins Scientific SEClinical
laboratories+43% +16%
GHP Specialty Care AB Clinics +41% +5%
MD Medical Group Investments Outpatient
medical centers+22% +4%
Comparison of segments2
Notes: Capital market data as per 30.12.2020; only companies with respective available data considered in the analysis; 1) Only company data considered without missings 2) Size of bubbles indicates cumulative segment sales volume 3) 2019A/2020E; Source: S&P Capital IQ, IMAP Research
2021
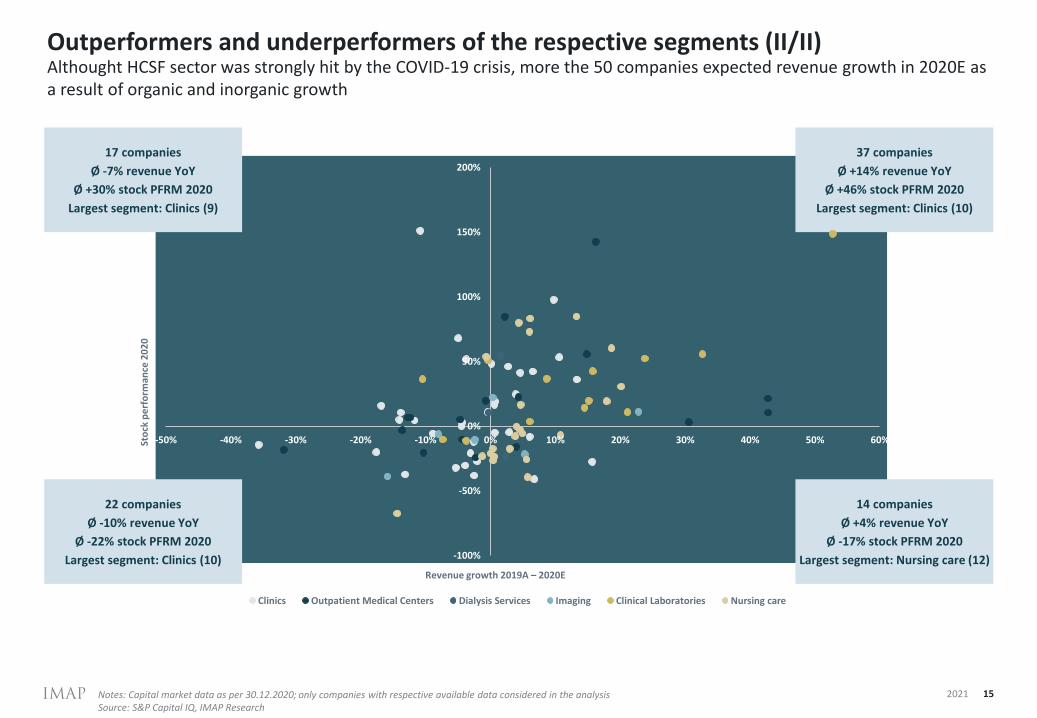
17 companies
Ø -7% revenue YoY
Ø +30% stock PFRM 2020
Largest segment: Clinics (9)
Outperformers and underperformers of the respective segments (II/II)
15
Althought HCSF sector was strongly hit by the COVID-19 crisis, more the 50 companies expected revenue growth in 2020E asa result of organic and inorganic growth
22 companies
Ø -10% revenue YoY
Ø -22% stock PFRM 2020
Largest segment: Clinics (10)
2021Notes: Capital market data as per 30.12.2020; only companies with respective available data considered in the analysisSource: S&P Capital IQ, IMAP Research
37 companies
Ø +14% revenue YoY
Ø +46% stock PFRM 2020
Largest segment: Clinics (10)
14 companies
Ø +4% revenue YoY
Ø -17% stock PFRM 2020
Largest segment: Nursing care (12)-100%
-50%
0%
50%
100%
150%
200%
-50% -40% -30% -20% -10% 0% 10% 20% 30% 40% 50% 60%Sto
ck p
erf
orm
ance
20
20
Revenue growth 2019A – 2020E
Clinics Outpatient Medical Centers Dialysis Services Imaging Clinical Laboratories Nursing care
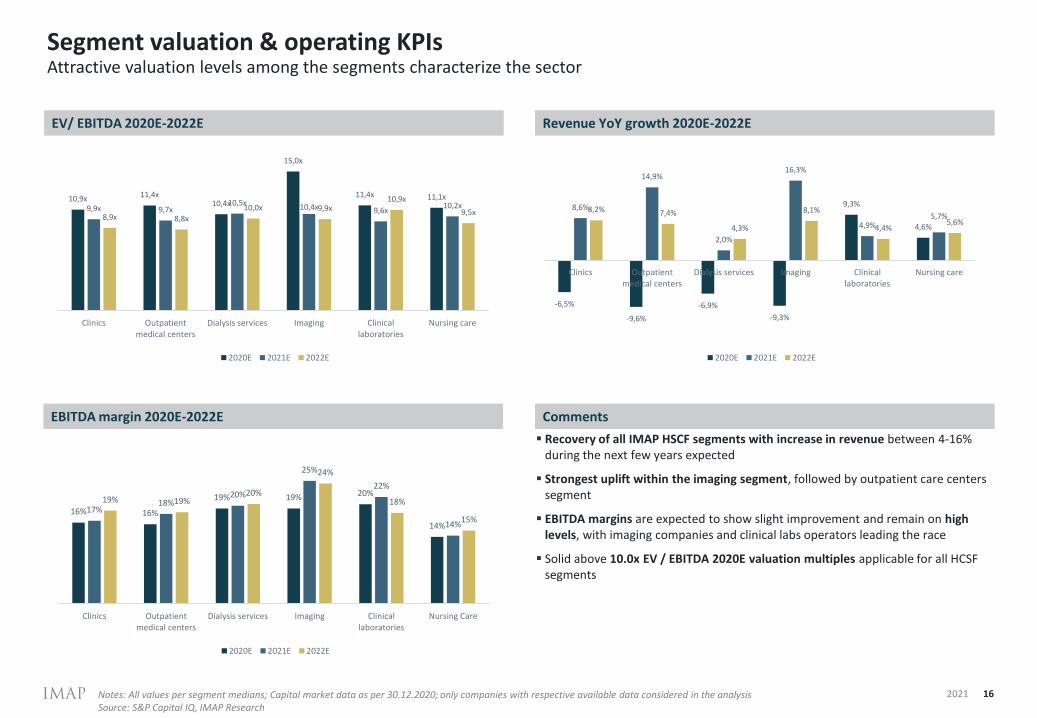
Segment valuation & operating KPIs
16
Attractive valuation levels among the segments characterize the sector
EV/ EBITDA 2020E-2022E Revenue YoY growth 2020E-2022E
EBITDA margin 2020E-2022E Comments
2021
10,9x 11,4x10,4x
15,0x
11,4x 11,1x
9,9x 9,7x10,5x
10,4x 9,6x10,2x
8,9x 8,8x
10,0x 9,9x10,9x
9,5x
Clinics Outpatientmedical centers
Dialysis services Imaging Clinicallaboratories
Nursing care
2020E 2021E 2022E
-6,5%
-9,6%
-6,9%
-9,3%
9,3%
4,6%
8,6%
14,9%
2,0%
16,3%
4,9%5,7%
8,2% 7,4%
4,3%
8,1%
4,4%5,6%
Clinics Outpatientmedical centers
Dialysis services Imaging Clinicallaboratories
Nursing care
2020E 2021E 2022E
16% 16%
19% 19% 20%
14%
17%18%
20%
25%
22%
14%
19% 19%20%
24%
18%
15%
Clinics Outpatientmedical centers
Dialysis services Imaging Clinicallaboratories
Nursing Care
2020E 2021E 2022E
Notes: All values per segment medians; Capital market data as per 30.12.2020; only companies with respective available data considered in the analysisSource: S&P Capital IQ, IMAP Research
▪ Recovery of all IMAP HSCF segments with increase in revenue between 4-16% during the next few years expected
▪ Strongest uplift within the imaging segment, followed by outpatient care centers segment
▪ EBITDA margins are expected to show slight improvement and remain on high levels, with imaging companies and clinical labs operators leading the race
▪ Solid above 10.0x EV / EBITDA 2020E valuation multiples applicable for all HCSF segments
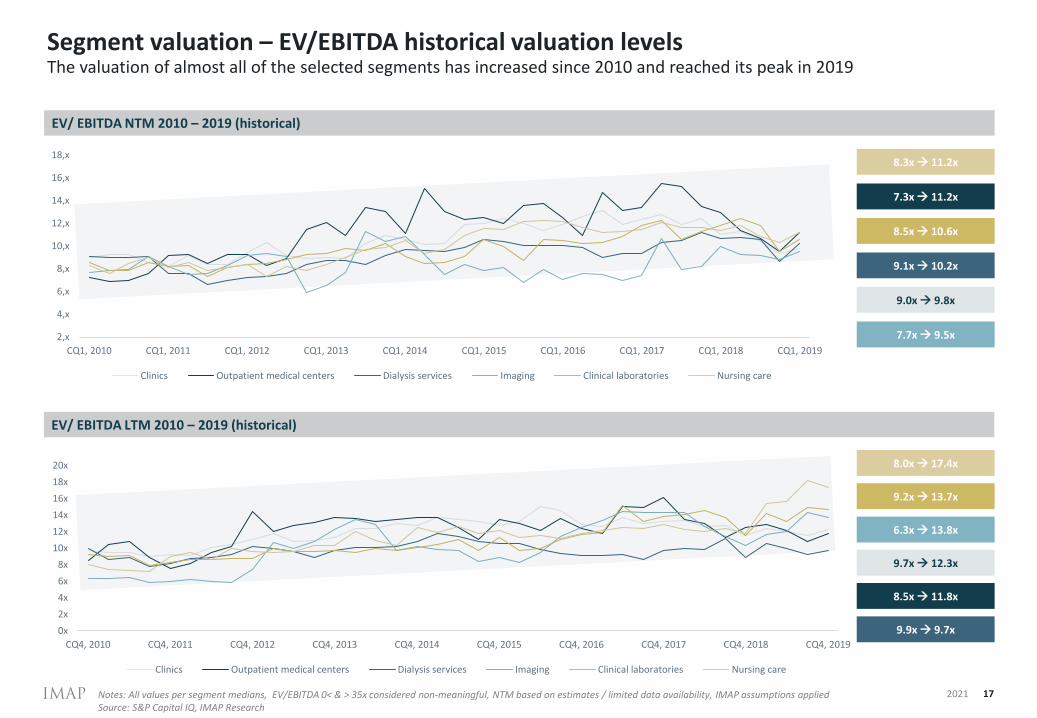
Segment valuation – EV/EBITDA historical valuation levelsThe valuation of almost all of the selected segments has increased since 2010 and reached its peak in 2019
EV/ EBITDA LTM 2010 – 2019 (historical)
2021 17Notes: All values per segment medians, EV/EBITDA 0< & > 35x considered non-meaningful, NTM based on estimates / limited data availability, IMAP assumptions appliedSource: S&P Capital IQ, IMAP Research
9.7x → 12.3x
8.0x → 17.4x
8.5x → 11.8x
9.9x → 9.7x
6.3x → 13.8x
9.2x → 13.7x
EV/ EBITDA NTM 2010 – 2019 (historical)
9.0x → 9.8x
8.5x → 10.6x
7.3x → 11.2x
9.1x → 10.2x
7.7x → 9.5x
8.3x → 11.2x
2,x
4,x
6,x
8,x
10,x
12,x
14,x
16,x
18,x
CQ1, 2010 CQ1, 2011 CQ1, 2012 CQ1, 2013 CQ1, 2014 CQ1, 2015 CQ1, 2016 CQ1, 2017 CQ1, 2018 CQ1, 2019
Clinics Outpatient medical centers Dialysis services Imaging Clinical laboratories Nursing care
0x
2x
4x
6x
8x
10x
12x
14x
16x
18x
20x
CQ4, 2010 CQ4, 2011 CQ4, 2012 CQ4, 2013 CQ4, 2014 CQ4, 2015 CQ4, 2016 CQ4, 2017 CQ4, 2018 CQ4, 2019
Clinics Outpatient medical centers Dialysis services Imaging Clinical laboratories Nursing care
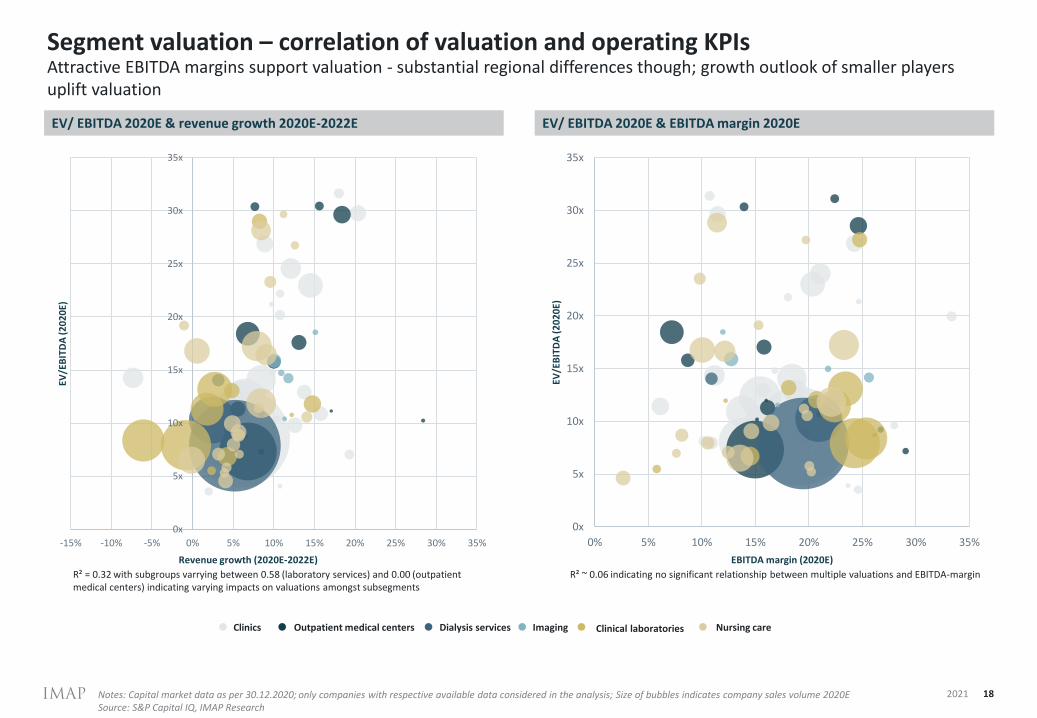
Segment valuation – correlation of valuation and operating KPIs
18
Attractive EBITDA margins support valuation - substantial regional differences though; growth outlook of smaller players uplift valuation
2021
Clinical laboratoriesClinics Dialysis services Imaging Nursing careOutpatient medical centers
EV/ EBITDA 2020E & EBITDA margin 2020E
R² = 0.32 with subgroups varrying between 0.58 (laboratory services) and 0.00 (outpatientmedical centers) indicating varying impacts on valuations amongst subsegments
R² ~ 0.06 indicating no significant relationship between multiple valuations and EBITDA-margin
Notes: Capital market data as per 30.12.2020; only companies with respective available data considered in the analysis; Size of bubbles indicates company sales volume 2020ESource: S&P Capital IQ, IMAP Research
EV/ EBITDA 2020E & revenue growth 2020E-2022E
0x
5x
10x
15x
20x
25x
30x
35x
-15% -10% -5% 0% 5% 10% 15% 20% 25% 30% 35%
EV/E
BIT
DA
(20
20
E)
Revenue growth (2020E-2022E)
0x
5x
10x
15x
20x
25x
30x
35x
0% 5% 10% 15% 20% 25% 30% 35%EV
/EB
ITD
A (2
02
0E)
EBITDA margin (2020E)
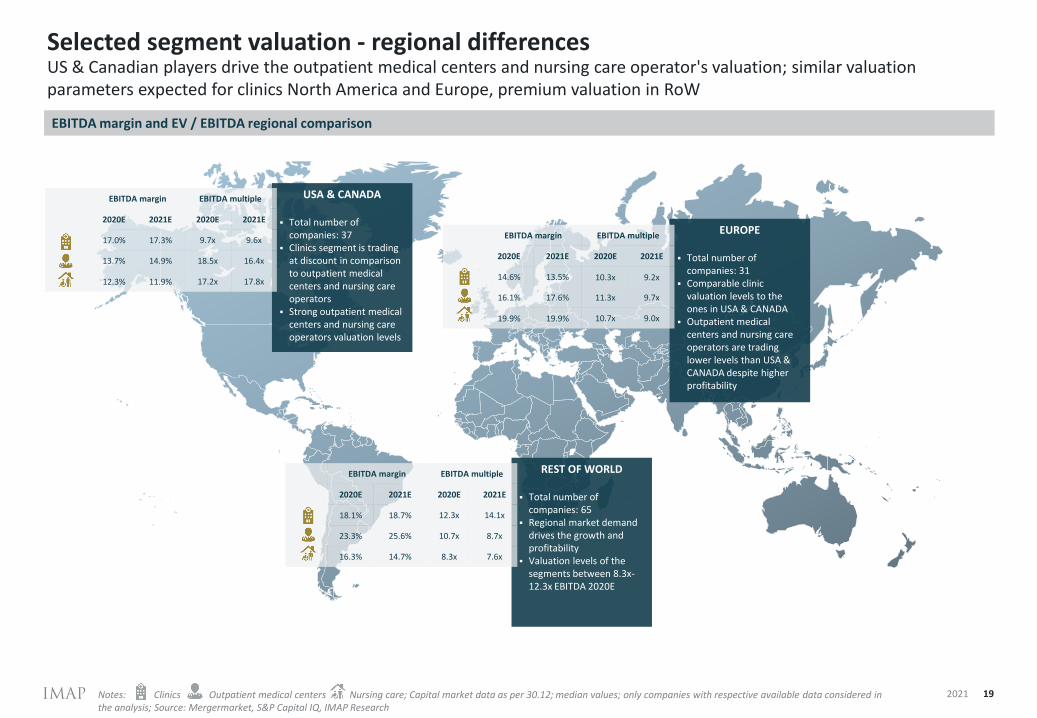
Selected segment valuation - regional differencesUS & Canadian players drive the outpatient medical centers and nursing care operator's valuation; similar valuation parameters expected for clinics North America and Europe, premium valuation in RoW
192021
EBITDA margin and EV / EBITDA regional comparison
EUROPE
▪ Total number of companies: 31
▪ Comparable clinic valuation levels to the ones in USA & CANADA
▪ Outpatient medical centers and nursing care operators are trading lower levels than USA & CANADA despite higher profitability
REST OF WORLD
▪ Total number of companies: 65
▪ Regional market demand drives the growth and profitability
▪ Valuation levels of the segments between 8.3x-12.3x EBITDA 2020E
USA & CANADA
▪ Total number of companies: 37
▪ Clinics segment is trading at discount in comparison to outpatient medical centers and nursing care operators
▪ Strong outpatient medical centers and nursing care operators valuation levels
EBITDA margin EBITDA multiple
2020E 2021E 2020E 2021E
14.6% 13.5% 10.3x 9.2x
16.1% 17.6% 11.3x 9.7x
19.9% 19.9% 10.7x 9.0x
EBITDA margin EBITDA multiple
2020E 2021E 2020E 2021E
18.1% 18.7% 12.3x 14.1x
23.3% 25.6% 10.7x 8.7x
16.3% 14.7% 8.3x 7.6x
EBITDA margin EBITDA multiple
2020E 2021E 2020E 2021E
17.0% 17.3% 9.7x 9.6x
13.7% 14.9% 18.5x 16.4x
12.3% 11.9% 17.2x 17.8x
Notes: Clinics Outpatient medical centers Nursing care; Capital market data as per 30.12; median values; only companies with respective available data considered in the analysis; Source: Mergermarket, S&P Capital IQ, IMAP Research
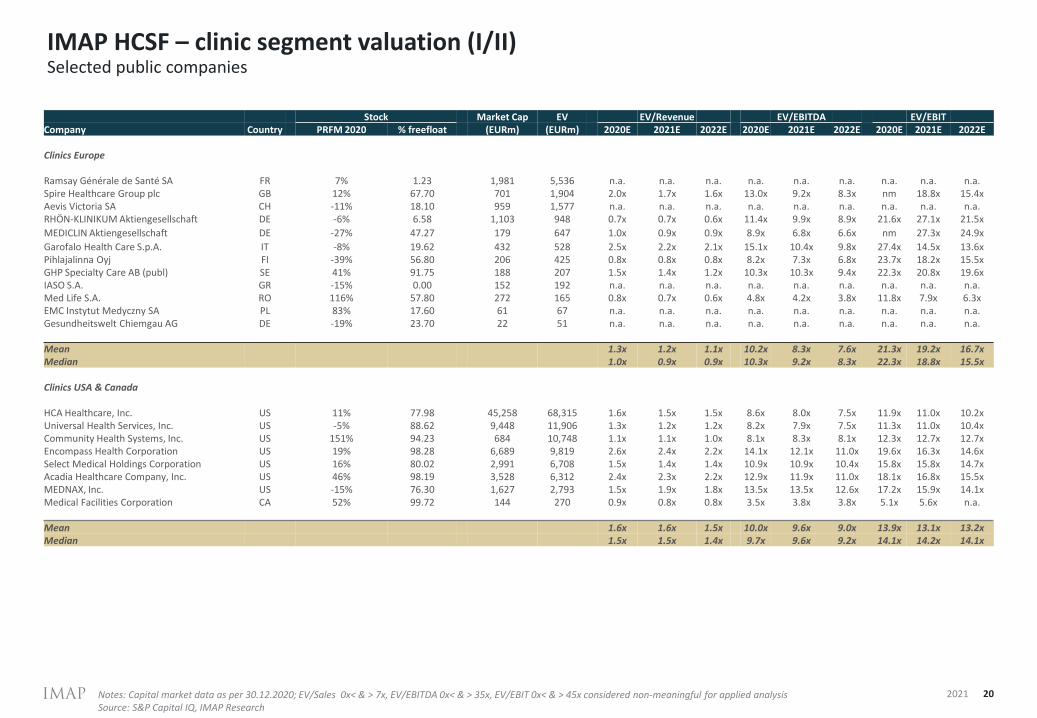
IMAP HCSF – clinic segment valuation (I/II)
20
Selected public companies
Notes: Capital market data as per 30.12.2020; EV/Sales 0x< & > 7x, EV/EBITDA 0x< & > 35x, EV/EBIT 0x< & > 45x considered non-meaningful for applied analysis Source: S&P Capital IQ, IMAP Research
2021
Stock Market Cap EV EV/Revenue EV/EBITDA EV/EBITCompany Country PRFM 2020 % freefloat (EURm) (EURm) 2020E 2021E 2022E 2020E 2021E 2022E 2020E 2021E 2022E
Clinics Europe
Ramsay Générale de Santé SA FR 7% 1.23 1,981 5,536 n.a. n.a. n.a. n.a. n.a. n.a. n.a. n.a. n.a.Spire Healthcare Group plc GB 12% 67.70 701 1,904 2.0x 1.7x 1.6x 13.0x 9.2x 8.3x nm 18.8x 15.4xAevis Victoria SA CH -11% 18.10 959 1,577 n.a. n.a. n.a. n.a. n.a. n.a. n.a. n.a. n.a.RHÖN-KLINIKUM Aktiengesellschaft DE -6% 6.58 1,103 948 0.7x 0.7x 0.6x 11.4x 9.9x 8.9x 21.6x 27.1x 21.5x
MEDICLIN Aktiengesellschaft DE -27% 47.27 179 647 1.0x 0.9x 0.9x 8.9x 6.8x 6.6x nm 27.3x 24.9x
Garofalo Health Care S.p.A. IT -8% 19.62 432 528 2.5x 2.2x 2.1x 15.1x 10.4x 9.8x 27.4x 14.5x 13.6xPihlajalinna Oyj FI -39% 56.80 206 425 0.8x 0.8x 0.8x 8.2x 7.3x 6.8x 23.7x 18.2x 15.5xGHP Specialty Care AB (publ) SE 41% 91.75 188 207 1.5x 1.4x 1.2x 10.3x 10.3x 9.4x 22.3x 20.8x 19.6xIASO S.A. GR -15% 0.00 152 192 n.a. n.a. n.a. n.a. n.a. n.a. n.a. n.a. n.a.Med Life S.A. RO 116% 57.80 272 165 0.8x 0.7x 0.6x 4.8x 4.2x 3.8x 11.8x 7.9x 6.3xEMC Instytut Medyczny SA PL 83% 17.60 61 67 n.a. n.a. n.a. n.a. n.a. n.a. n.a. n.a. n.a.Gesundheitswelt Chiemgau AG DE -19% 23.70 22 51 n.a. n.a. n.a. n.a. n.a. n.a. n.a. n.a. n.a.
Mean 1.3x 1.2x 1.1x 10.2x 8.3x 7.6x 21.3x 19.2x 16.7xMedian 1.0x 0.9x 0.9x 10.3x 9.2x 8.3x 22.3x 18.8x 15.5x
Clinics USA & Canada
HCA Healthcare, Inc. US 11% 77.98 45,258 68,315 1.6x 1.5x 1.5x 8.6x 8.0x 7.5x 11.9x 11.0x 10.2xUniversal Health Services, Inc. US -5% 88.62 9,448 11,906 1.3x 1.2x 1.2x 8.2x 7.9x 7.5x 11.3x 11.0x 10.4xCommunity Health Systems, Inc. US 151% 94.23 684 10,748 1.1x 1.1x 1.0x 8.1x 8.3x 8.1x 12.3x 12.7x 12.7xEncompass Health Corporation US 19% 98.28 6,689 9,819 2.6x 2.4x 2.2x 14.1x 12.1x 11.0x 19.6x 16.3x 14.6xSelect Medical Holdings Corporation US 16% 80.02 2,991 6,708 1.5x 1.4x 1.4x 10.9x 10.9x 10.4x 15.8x 15.8x 14.7xAcadia Healthcare Company, Inc. US 46% 98.19 3,528 6,312 2.4x 2.3x 2.2x 12.9x 11.9x 11.0x 18.1x 16.8x 15.5xMEDNAX, Inc. US -15% 76.30 1,627 2,793 1.5x 1.9x 1.8x 13.5x 13.5x 12.6x 17.2x 15.9x 14.1xMedical Facilities Corporation CA 52% 99.72 144 270 0.9x 0.8x 0.8x 3.5x 3.8x 3.8x 5.1x 5.6x n.a.
Mean 1.6x 1.6x 1.5x 10.0x 9.6x 9.0x 13.9x 13.1x 13.2xMedian 1.5x 1.5x 1.4x 9.7x 9.6x 9.2x 14.1x 14.2x 14.1x
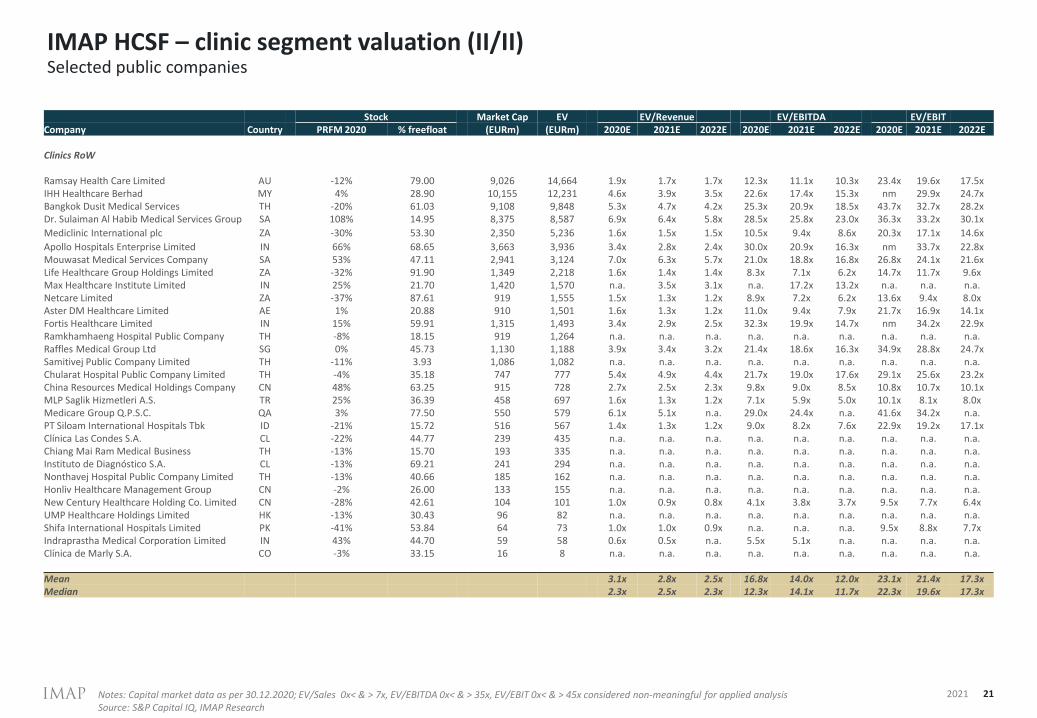
IMAP HCSF – clinic segment valuation (II/II)
21
Selected public companies
2021
Stock Market Cap EV EV/Revenue EV/EBITDA EV/EBITCompany Country PRFM 2020 % freefloat (EURm) (EURm) 2020E 2021E 2022E 2020E 2021E 2022E 2020E 2021E 2022E
Clinics RoW
Ramsay Health Care Limited AU -12% 79.00 9,026 14,664 1.9x 1.7x 1.7x 12.3x 11.1x 10.3x 23.4x 19.6x 17.5xIHH Healthcare Berhad MY 4% 28.90 10,155 12,231 4.6x 3.9x 3.5x 22.6x 17.4x 15.3x nm 29.9x 24.7xBangkok Dusit Medical Services TH -20% 61.03 9,108 9,848 5.3x 4.7x 4.2x 25.3x 20.9x 18.5x 43.7x 32.7x 28.2xDr. Sulaiman Al Habib Medical Services Group SA 108% 14.95 8,375 8,587 6.9x 6.4x 5.8x 28.5x 25.8x 23.0x 36.3x 33.2x 30.1x
Mediclinic International plc ZA -30% 53.30 2,350 5,236 1.6x 1.5x 1.5x 10.5x 9.4x 8.6x 20.3x 17.1x 14.6x
Apollo Hospitals Enterprise Limited IN 66% 68.65 3,663 3,936 3.4x 2.8x 2.4x 30.0x 20.9x 16.3x nm 33.7x 22.8xMouwasat Medical Services Company SA 53% 47.11 2,941 3,124 7.0x 6.3x 5.7x 21.0x 18.8x 16.8x 26.8x 24.1x 21.6xLife Healthcare Group Holdings Limited ZA -32% 91.90 1,349 2,218 1.6x 1.4x 1.4x 8.3x 7.1x 6.2x 14.7x 11.7x 9.6xMax Healthcare Institute Limited IN 25% 21.70 1,420 1,570 n.a. 3.5x 3.1x n.a. 17.2x 13.2x n.a. n.a. n.a.Netcare Limited ZA -37% 87.61 919 1,555 1.5x 1.3x 1.2x 8.9x 7.2x 6.2x 13.6x 9.4x 8.0xAster DM Healthcare Limited AE 1% 20.88 910 1,501 1.6x 1.3x 1.2x 11.0x 9.4x 7.9x 21.7x 16.9x 14.1xFortis Healthcare Limited IN 15% 59.91 1,315 1,493 3.4x 2.9x 2.5x 32.3x 19.9x 14.7x nm 34.2x 22.9xRamkhamhaeng Hospital Public Company TH -8% 18.15 919 1,264 n.a. n.a. n.a. n.a. n.a. n.a. n.a. n.a. n.a.Raffles Medical Group Ltd SG 0% 45.73 1,130 1,188 3.9x 3.4x 3.2x 21.4x 18.6x 16.3x 34.9x 28.8x 24.7xSamitivej Public Company Limited TH -11% 3.93 1,086 1,082 n.a. n.a. n.a. n.a. n.a. n.a. n.a. n.a. n.a.Chularat Hospital Public Company Limited TH -4% 35.18 747 777 5.4x 4.9x 4.4x 21.7x 19.0x 17.6x 29.1x 25.6x 23.2xChina Resources Medical Holdings Company CN 48% 63.25 915 728 2.7x 2.5x 2.3x 9.8x 9.0x 8.5x 10.8x 10.7x 10.1xMLP Saglik Hizmetleri A.S. TR 25% 36.39 458 697 1.6x 1.3x 1.2x 7.1x 5.9x 5.0x 10.1x 8.1x 8.0xMedicare Group Q.P.S.C. QA 3% 77.50 550 579 6.1x 5.1x n.a. 29.0x 24.4x n.a. 41.6x 34.2x n.a.PT Siloam International Hospitals Tbk ID -21% 15.72 516 567 1.4x 1.3x 1.2x 9.0x 8.2x 7.6x 22.9x 19.2x 17.1xClínica Las Condes S.A. CL -22% 44.77 239 435 n.a. n.a. n.a. n.a. n.a. n.a. n.a. n.a. n.a.Chiang Mai Ram Medical Business TH -13% 15.70 193 335 n.a. n.a. n.a. n.a. n.a. n.a. n.a. n.a. n.a.Instituto de Diagnóstico S.A. CL -13% 69.21 241 294 n.a. n.a. n.a. n.a. n.a. n.a. n.a. n.a. n.a.Nonthavej Hospital Public Company Limited TH -13% 40.66 185 162 n.a. n.a. n.a. n.a. n.a. n.a. n.a. n.a. n.a.Honliv Healthcare Management Group CN -2% 26.00 133 155 n.a. n.a. n.a. n.a. n.a. n.a. n.a. n.a. n.a.New Century Healthcare Holding Co. Limited CN -28% 42.61 104 101 1.0x 0.9x 0.8x 4.1x 3.8x 3.7x 9.5x 7.7x 6.4xUMP Healthcare Holdings Limited HK -13% 30.43 96 82 n.a. n.a. n.a. n.a. n.a. n.a. n.a. n.a. n.a.Shifa International Hospitals Limited PK -41% 53.84 64 73 1.0x 1.0x 0.9x n.a. n.a. n.a. 9.5x 8.8x 7.7xIndraprastha Medical Corporation Limited IN 43% 44.70 59 58 0.6x 0.5x n.a. 5.5x 5.1x n.a. n.a. n.a. n.a.Clínica de Marly S.A. CO -3% 33.15 16 8 n.a. n.a. n.a. n.a. n.a. n.a. n.a. n.a. n.a.
Mean 3.1x 2.8x 2.5x 16.8x 14.0x 12.0x 23.1x 21.4x 17.3xMedian 2.3x 2.5x 2.3x 12.3x 14.1x 11.7x 22.3x 19.6x 17.3x
Notes: Capital market data as per 30.12.2020; EV/Sales 0x< & > 7x, EV/EBITDA 0x< & > 35x, EV/EBIT 0x< & > 45x considered non-meaningful for applied analysis Source: S&P Capital IQ, IMAP Research
IMAP HCSF – outpatient medical centers segment valuation (I/II)
22
Selected public companies
2021
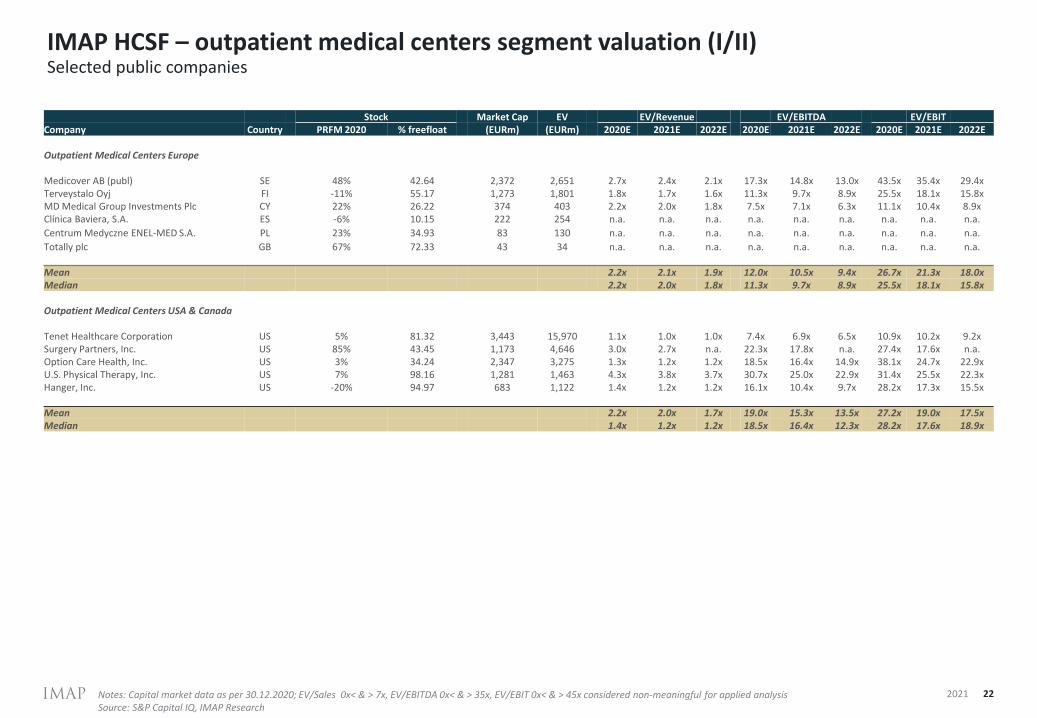
Stock Market Cap EV EV/Revenue EV/EBITDA EV/EBITCompany Country PRFM 2020 % freefloat (EURm) (EURm) 2020E 2021E 2022E 2020E 2021E 2022E 2020E 2021E 2022E
Outpatient Medical Centers Europe
Medicover AB (publ) SE 48% 42.64 2,372 2,651 2.7x 2.4x 2.1x 17.3x 14.8x 13.0x 43.5x 35.4x 29.4xTerveystalo Oyj FI -11% 55.17 1,273 1,801 1.8x 1.7x 1.6x 11.3x 9.7x 8.9x 25.5x 18.1x 15.8xMD Medical Group Investments Plc CY 22% 26.22 374 403 2.2x 2.0x 1.8x 7.5x 7.1x 6.3x 11.1x 10.4x 8.9xClínica Baviera, S.A. ES -6% 10.15 222 254 n.a. n.a. n.a. n.a. n.a. n.a. n.a. n.a. n.a.
Centrum Medyczne ENEL-MED S.A. PL 23% 34.93 83 130 n.a. n.a. n.a. n.a. n.a. n.a. n.a. n.a. n.a.
Totally plc GB 67% 72.33 43 34 n.a. n.a. n.a. n.a. n.a. n.a. n.a. n.a. n.a.
Mean 2.2x 2.1x 1.9x 12.0x 10.5x 9.4x 26.7x 21.3x 18.0xMedian 2.2x 2.0x 1.8x 11.3x 9.7x 8.9x 25.5x 18.1x 15.8x
Outpatient Medical Centers USA & Canada
Tenet Healthcare Corporation US 5% 81.32 3,443 15,970 1.1x 1.0x 1.0x 7.4x 6.9x 6.5x 10.9x 10.2x 9.2xSurgery Partners, Inc. US 85% 43.45 1,173 4,646 3.0x 2.7x n.a. 22.3x 17.8x n.a. 27.4x 17.6x n.a.Option Care Health, Inc. US 3% 34.24 2,347 3,275 1.3x 1.2x 1.2x 18.5x 16.4x 14.9x 38.1x 24.7x 22.9xU.S. Physical Therapy, Inc. US 7% 98.16 1,281 1,463 4.3x 3.8x 3.7x 30.7x 25.0x 22.9x 31.4x 25.5x 22.3xHanger, Inc. US -20% 94.97 683 1,122 1.4x 1.2x 1.2x 16.1x 10.4x 9.7x 28.2x 17.3x 15.5x
Mean 2.2x 2.0x 1.7x 19.0x 15.3x 13.5x 27.2x 19.0x 17.5xMedian 1.4x 1.2x 1.2x 18.5x 16.4x 12.3x 28.2x 17.6x 18.9x
Notes: Capital market data as per 30.12.2020; EV/Sales 0x< & > 7x, EV/EBITDA 0x< & > 35x, EV/EBIT 0x< & > 45x considered non-meaningful for applied analysis Source: S&P Capital IQ, IMAP Research
IMAP HCSF – outpatient medical centers segment valuation (II/II)
23
Selected public companies
2021
Stock Market Cap EV EV/Revenue EV/EBITDA EV/EBITCompany Country PRFM 2020 % freefloat (EURm) (EURm) 2020E 2021E 2022E 2020E 2021E 2022E 2020E 2021E 2022E
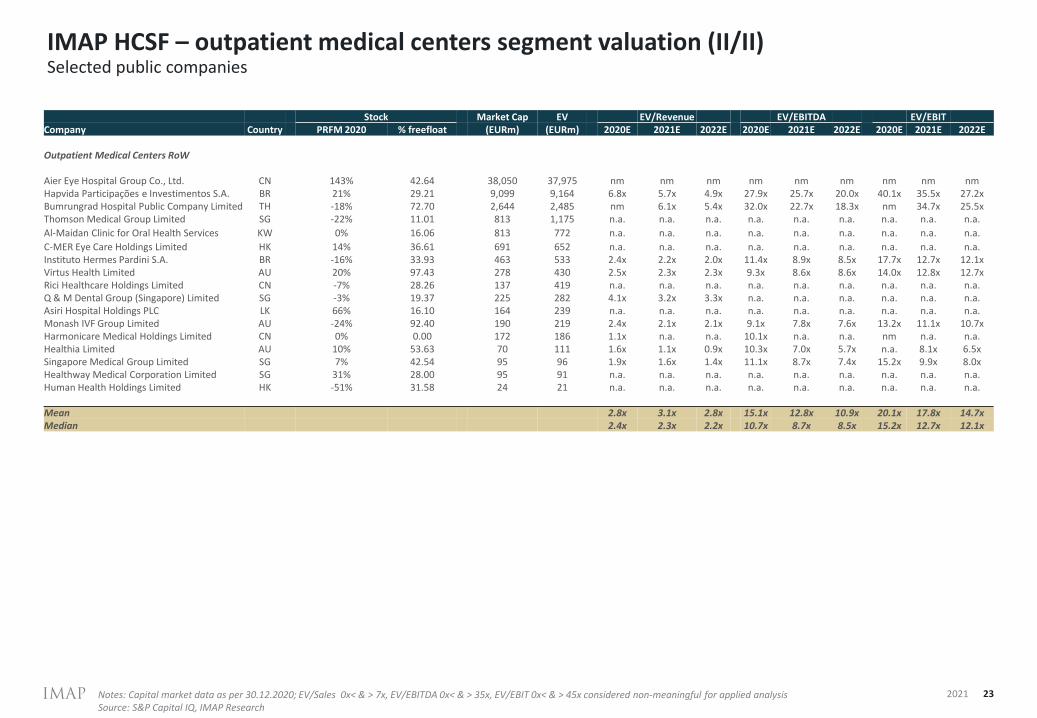
Outpatient Medical Centers RoW
Aier Eye Hospital Group Co., Ltd. CN 143% 42.64 38,050 37,975 nm nm nm nm nm nm nm nm nmHapvida Participações e Investimentos S.A. BR 21% 29.21 9,099 9,164 6.8x 5.7x 4.9x 27.9x 25.7x 20.0x 40.1x 35.5x 27.2xBumrungrad Hospital Public Company Limited TH -18% 72.70 2,644 2,485 nm 6.1x 5.4x 32.0x 22.7x 18.3x nm 34.7x 25.5xThomson Medical Group Limited SG -22% 11.01 813 1,175 n.a. n.a. n.a. n.a. n.a. n.a. n.a. n.a. n.a.
Al-Maidan Clinic for Oral Health Services KW 0% 16.06 813 772 n.a. n.a. n.a. n.a. n.a. n.a. n.a. n.a. n.a.
C-MER Eye Care Holdings Limited HK 14% 36.61 691 652 n.a. n.a. n.a. n.a. n.a. n.a. n.a. n.a. n.a.Instituto Hermes Pardini S.A. BR -16% 33.93 463 533 2.4x 2.2x 2.0x 11.4x 8.9x 8.5x 17.7x 12.7x 12.1xVirtus Health Limited AU 20% 97.43 278 430 2.5x 2.3x 2.3x 9.3x 8.6x 8.6x 14.0x 12.8x 12.7xRici Healthcare Holdings Limited CN -7% 28.26 137 419 n.a. n.a. n.a. n.a. n.a. n.a. n.a. n.a. n.a.Q & M Dental Group (Singapore) Limited SG -3% 19.37 225 282 4.1x 3.2x 3.3x n.a. n.a. n.a. n.a. n.a. n.a.Asiri Hospital Holdings PLC LK 66% 16.10 164 239 n.a. n.a. n.a. n.a. n.a. n.a. n.a. n.a. n.a.Monash IVF Group Limited AU -24% 92.40 190 219 2.4x 2.1x 2.1x 9.1x 7.8x 7.6x 13.2x 11.1x 10.7xHarmonicare Medical Holdings Limited CN 0% 0.00 172 186 1.1x n.a. n.a. 10.1x n.a. n.a. nm n.a. n.a.Healthia Limited AU 10% 53.63 70 111 1.6x 1.1x 0.9x 10.3x 7.0x 5.7x n.a. 8.1x 6.5xSingapore Medical Group Limited SG 7% 42.54 95 96 1.9x 1.6x 1.4x 11.1x 8.7x 7.4x 15.2x 9.9x 8.0xHealthway Medical Corporation Limited SG 31% 28.00 95 91 n.a. n.a. n.a. n.a. n.a. n.a. n.a. n.a. n.a.Human Health Holdings Limited HK -51% 31.58 24 21 n.a. n.a. n.a. n.a. n.a. n.a. n.a. n.a. n.a.
Mean 2.8x 3.1x 2.8x 15.1x 12.8x 10.9x 20.1x 17.8x 14.7xMedian 2.4x 2.3x 2.2x 10.7x 8.7x 8.5x 15.2x 12.7x 12.1x
Notes: Capital market data as per 30.12.2020; EV/Sales 0x< & > 7x, EV/EBITDA 0x< & > 35x, EV/EBIT 0x< & > 45x considered non-meaningful for applied analysis Source: S&P Capital IQ, IMAP Research
IMAP HCSF – dialysis & imaging service providers valuation
24
Selected public companies
2021
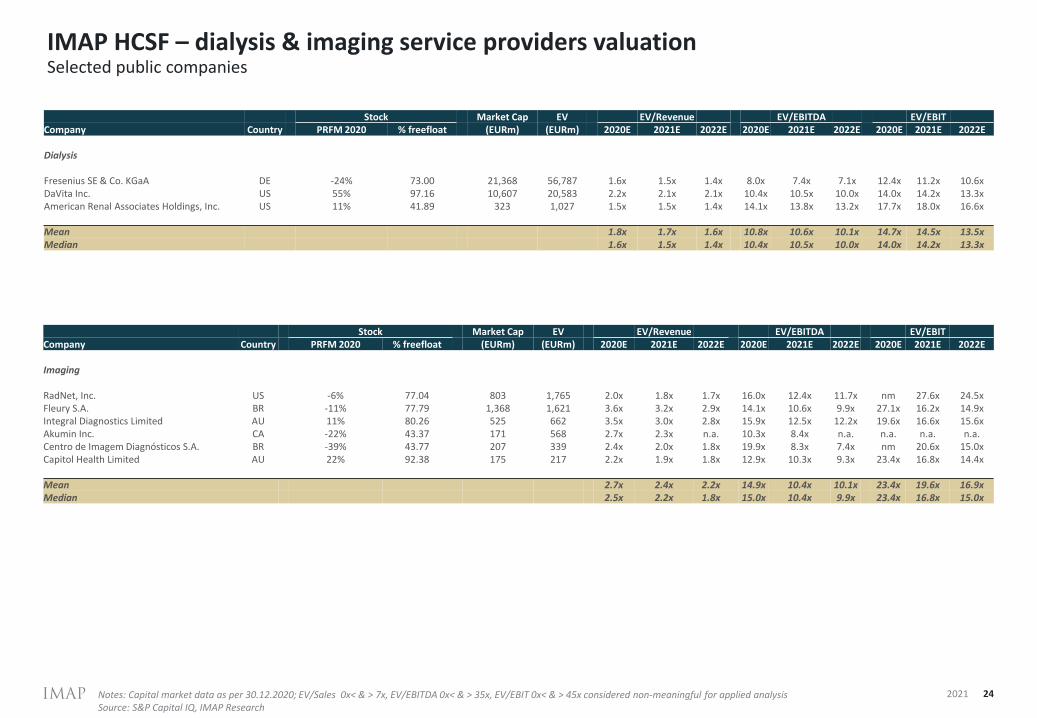
Stock Market Cap EV EV/Revenue EV/EBITDA EV/EBITCompany Country PRFM 2020 % freefloat (EURm) (EURm) 2020E 2021E 2022E 2020E 2021E 2022E 2020E 2021E 2022E
Dialysis
Fresenius SE & Co. KGaA DE -24% 73.00 21,368 56,787 1.6x 1.5x 1.4x 8.0x 7.4x 7.1x 12.4x 11.2x 10.6xDaVita Inc. US 55% 97.16 10,607 20,583 2.2x 2.1x 2.1x 10.4x 10.5x 10.0x 14.0x 14.2x 13.3xAmerican Renal Associates Holdings, Inc. US 11% 41.89 323 1,027 1.5x 1.5x 1.4x 14.1x 13.8x 13.2x 17.7x 18.0x 16.6x
Mean 1.8x 1.7x 1.6x 10.8x 10.6x 10.1x 14.7x 14.5x 13.5xMedian 1.6x 1.5x 1.4x 10.4x 10.5x 10.0x 14.0x 14.2x 13.3x
Stock Market Cap EV EV/Revenue EV/EBITDA EV/EBITCompany Country PRFM 2020 % freefloat (EURm) (EURm) 2020E 2021E 2022E 2020E 2021E 2022E 2020E 2021E 2022E
Imaging
RadNet, Inc. US -6% 77.04 803 1,765 2.0x 1.8x 1.7x 16.0x 12.4x 11.7x nm 27.6x 24.5xFleury S.A. BR -11% 77.79 1,368 1,621 3.6x 3.2x 2.9x 14.1x 10.6x 9.9x 27.1x 16.2x 14.9xIntegral Diagnostics Limited AU 11% 80.26 525 662 3.5x 3.0x 2.8x 15.9x 12.5x 12.2x 19.6x 16.6x 15.6xAkumin Inc. CA -22% 43.37 171 568 2.7x 2.3x n.a. 10.3x 8.4x n.a. n.a. n.a. n.a.Centro de Imagem Diagnósticos S.A. BR -39% 43.77 207 339 2.4x 2.0x 1.8x 19.9x 8.3x 7.4x nm 20.6x 15.0xCapitol Health Limited AU 22% 92.38 175 217 2.2x 1.9x 1.8x 12.9x 10.3x 9.3x 23.4x 16.8x 14.4x
Mean 2.7x 2.4x 2.2x 14.9x 10.4x 10.1x 23.4x 19.6x 16.9xMedian 2.5x 2.2x 1.8x 15.0x 10.4x 9.9x 23.4x 16.8x 15.0x
Notes: Capital market data as per 30.12.2020; EV/Sales 0x< & > 7x, EV/EBITDA 0x< & > 35x, EV/EBIT 0x< & > 45x considered non-meaningful for applied analysis Source: S&P Capital IQ, IMAP Research
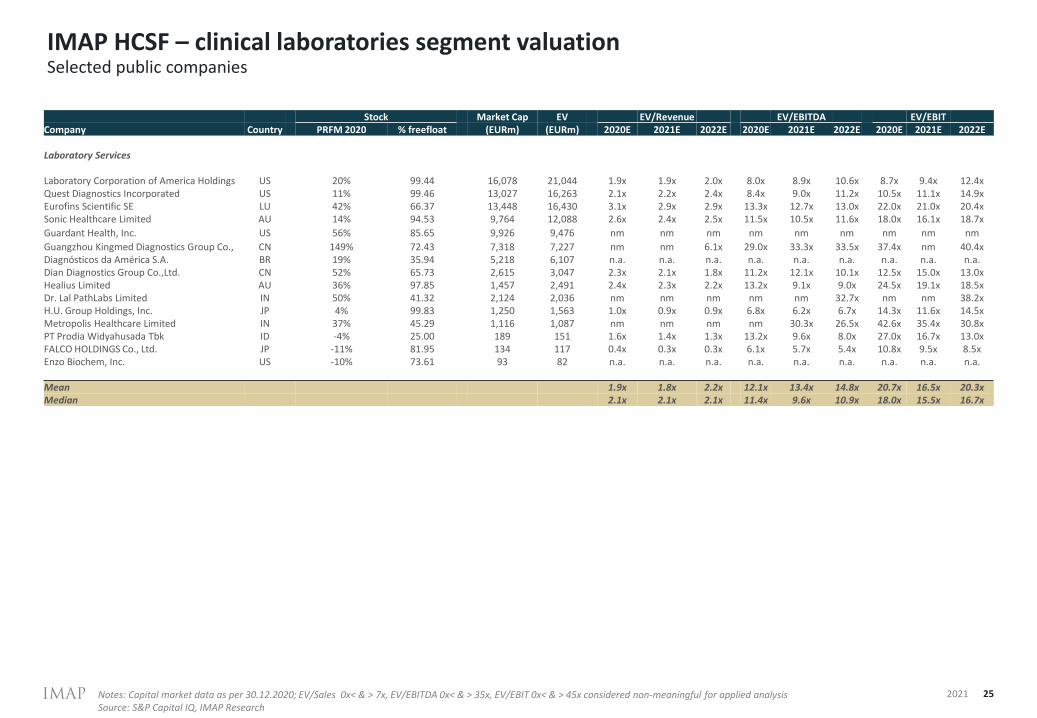
IMAP HCSF – clinical laboratories segment valuation
25
Selected public companies
2021
Stock Market Cap EV EV/Revenue EV/EBITDA EV/EBITCompany Country PRFM 2020 % freefloat (EURm) (EURm) 2020E 2021E 2022E 2020E 2021E 2022E 2020E 2021E 2022E
Laboratory Services
Laboratory Corporation of America Holdings US 20% 99.44 16,078 21,044 1.9x 1.9x 2.0x 8.0x 8.9x 10.6x 8.7x 9.4x 12.4xQuest Diagnostics Incorporated US 11% 99.46 13,027 16,263 2.1x 2.2x 2.4x 8.4x 9.0x 11.2x 10.5x 11.1x 14.9xEurofins Scientific SE LU 42% 66.37 13,448 16,430 3.1x 2.9x 2.9x 13.3x 12.7x 13.0x 22.0x 21.0x 20.4xSonic Healthcare Limited AU 14% 94.53 9,764 12,088 2.6x 2.4x 2.5x 11.5x 10.5x 11.6x 18.0x 16.1x 18.7x
Guardant Health, Inc. US 56% 85.65 9,926 9,476 nm nm nm nm nm nm nm nm nm
Guangzhou Kingmed Diagnostics Group Co., CN 149% 72.43 7,318 7,227 nm nm 6.1x 29.0x 33.3x 33.5x 37.4x nm 40.4xDiagnósticos da América S.A. BR 19% 35.94 5,218 6,107 n.a. n.a. n.a. n.a. n.a. n.a. n.a. n.a. n.a.Dian Diagnostics Group Co.,Ltd. CN 52% 65.73 2,615 3,047 2.3x 2.1x 1.8x 11.2x 12.1x 10.1x 12.5x 15.0x 13.0xHealius Limited AU 36% 97.85 1,457 2,491 2.4x 2.3x 2.2x 13.2x 9.1x 9.0x 24.5x 19.1x 18.5xDr. Lal PathLabs Limited IN 50% 41.32 2,124 2,036 nm nm nm nm nm 32.7x nm nm 38.2xH.U. Group Holdings, Inc. JP 4% 99.83 1,250 1,563 1.0x 0.9x 0.9x 6.8x 6.2x 6.7x 14.3x 11.6x 14.5xMetropolis Healthcare Limited IN 37% 45.29 1,116 1,087 nm nm nm nm 30.3x 26.5x 42.6x 35.4x 30.8xPT Prodia Widyahusada Tbk ID -4% 25.00 189 151 1.6x 1.4x 1.3x 13.2x 9.6x 8.0x 27.0x 16.7x 13.0xFALCO HOLDINGS Co., Ltd. JP -11% 81.95 134 117 0.4x 0.3x 0.3x 6.1x 5.7x 5.4x 10.8x 9.5x 8.5xEnzo Biochem, Inc. US -10% 73.61 93 82 n.a. n.a. n.a. n.a. n.a. n.a. n.a. n.a. n.a.
Mean 1.9x 1.8x 2.2x 12.1x 13.4x 14.8x 20.7x 16.5x 20.3xMedian 2.1x 2.1x 2.1x 11.4x 9.6x 10.9x 18.0x 15.5x 16.7x
Notes: Capital market data as per 30.12.2020; EV/Sales 0x< & > 7x, EV/EBITDA 0x< & > 35x, EV/EBIT 0x< & > 45x considered non-meaningful for applied analysis Source: S&P Capital IQ, IMAP Research
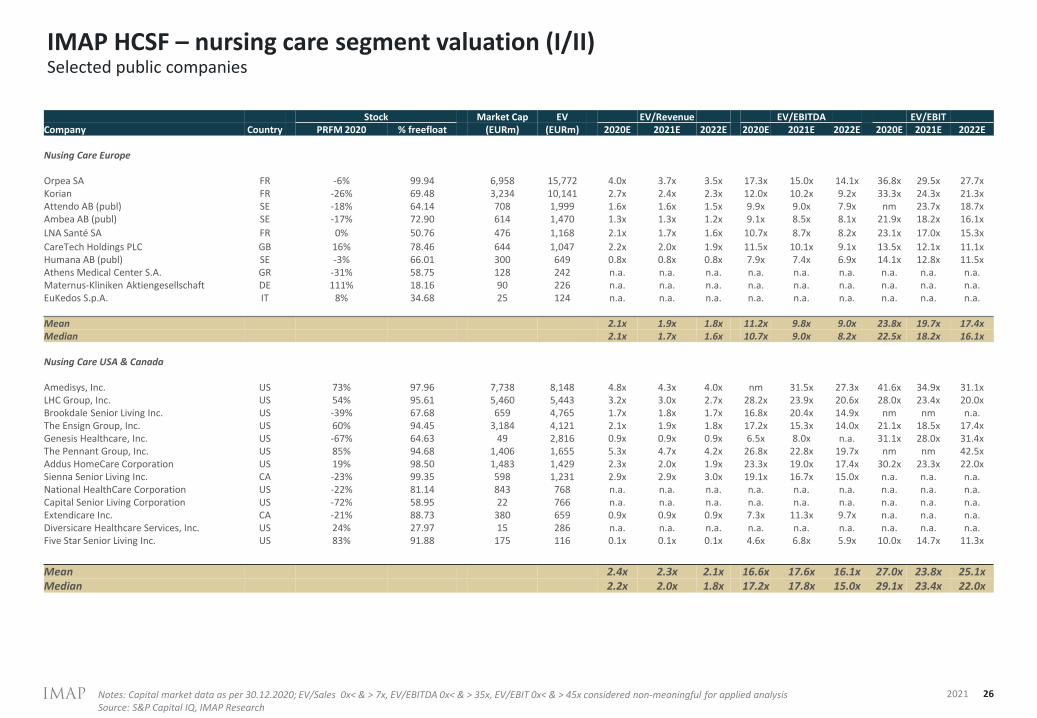
IMAP HCSF – nursing care segment valuation (I/II)
26
Selected public companies
2021
Stock Market Cap EV EV/Revenue EV/EBITDA EV/EBITCompany Country PRFM 2020 % freefloat (EURm) (EURm) 2020E 2021E 2022E 2020E 2021E 2022E 2020E 2021E 2022E
Nusing Care Europe
Orpea SA FR -6% 99.94 6,958 15,772 4.0x 3.7x 3.5x 17.3x 15.0x 14.1x 36.8x 29.5x 27.7xKorian FR -26% 69.48 3,234 10,141 2.7x 2.4x 2.3x 12.0x 10.2x 9.2x 33.3x 24.3x 21.3xAttendo AB (publ) SE -18% 64.14 708 1,999 1.6x 1.6x 1.5x 9.9x 9.0x 7.9x nm 23.7x 18.7xAmbea AB (publ) SE -17% 72.90 614 1,470 1.3x 1.3x 1.2x 9.1x 8.5x 8.1x 21.9x 18.2x 16.1x
LNA Santé SA FR 0% 50.76 476 1,168 2.1x 1.7x 1.6x 10.7x 8.7x 8.2x 23.1x 17.0x 15.3x
CareTech Holdings PLC GB 16% 78.46 644 1,047 2.2x 2.0x 1.9x 11.5x 10.1x 9.1x 13.5x 12.1x 11.1xHumana AB (publ) SE -3% 66.01 300 649 0.8x 0.8x 0.8x 7.9x 7.4x 6.9x 14.1x 12.8x 11.5xAthens Medical Center S.A. GR -31% 58.75 128 242 n.a. n.a. n.a. n.a. n.a. n.a. n.a. n.a. n.a.Maternus-Kliniken Aktiengesellschaft DE 111% 18.16 90 226 n.a. n.a. n.a. n.a. n.a. n.a. n.a. n.a. n.a.EuKedos S.p.A. IT 8% 34.68 25 124 n.a. n.a. n.a. n.a. n.a. n.a. n.a. n.a. n.a.
Mean 2.1x 1.9x 1.8x 11.2x 9.8x 9.0x 23.8x 19.7x 17.4xMedian 2.1x 1.7x 1.6x 10.7x 9.0x 8.2x 22.5x 18.2x 16.1x
Nusing Care USA & Canada
Amedisys, Inc. US 73% 97.96 7,738 8,148 4.8x 4.3x 4.0x nm 31.5x 27.3x 41.6x 34.9x 31.1xLHC Group, Inc. US 54% 95.61 5,460 5,443 3.2x 3.0x 2.7x 28.2x 23.9x 20.6x 28.0x 23.4x 20.0xBrookdale Senior Living Inc. US -39% 67.68 659 4,765 1.7x 1.8x 1.7x 16.8x 20.4x 14.9x nm nm n.a.The Ensign Group, Inc. US 60% 94.45 3,184 4,121 2.1x 1.9x 1.8x 17.2x 15.3x 14.0x 21.1x 18.5x 17.4xGenesis Healthcare, Inc. US -67% 64.63 49 2,816 0.9x 0.9x 0.9x 6.5x 8.0x n.a. 31.1x 28.0x 31.4xThe Pennant Group, Inc. US 85% 94.68 1,406 1,655 5.3x 4.7x 4.2x 26.8x 22.8x 19.7x nm nm 42.5xAddus HomeCare Corporation US 19% 98.50 1,483 1,429 2.3x 2.0x 1.9x 23.3x 19.0x 17.4x 30.2x 23.3x 22.0xSienna Senior Living Inc. CA -23% 99.35 598 1,231 2.9x 2.9x 3.0x 19.1x 16.7x 15.0x n.a. n.a. n.a.National HealthCare Corporation US -22% 81.14 843 768 n.a. n.a. n.a. n.a. n.a. n.a. n.a. n.a. n.a.Capital Senior Living Corporation US -72% 58.95 22 766 n.a. n.a. n.a. n.a. n.a. n.a. n.a. n.a. n.a.Extendicare Inc. CA -21% 88.73 380 659 0.9x 0.9x 0.9x 7.3x 11.3x 9.7x n.a. n.a. n.a.Diversicare Healthcare Services, Inc. US 24% 27.97 15 286 n.a. n.a. n.a. n.a. n.a. n.a. n.a. n.a. n.a.Five Star Senior Living Inc. US 83% 91.88 175 116 0.1x 0.1x 0.1x 4.6x 6.8x 5.9x 10.0x 14.7x 11.3x
Mean 2.4x 2.3x 2.1x 16.6x 17.6x 16.1x 27.0x 23.8x 25.1xMedian 2.2x 2.0x 1.8x 17.2x 17.8x 15.0x 29.1x 23.4x 22.0x
Notes: Capital market data as per 30.12.2020; EV/Sales 0x< & > 7x, EV/EBITDA 0x< & > 35x, EV/EBIT 0x< & > 45x considered non-meaningful for applied analysis Source: S&P Capital IQ, IMAP Research
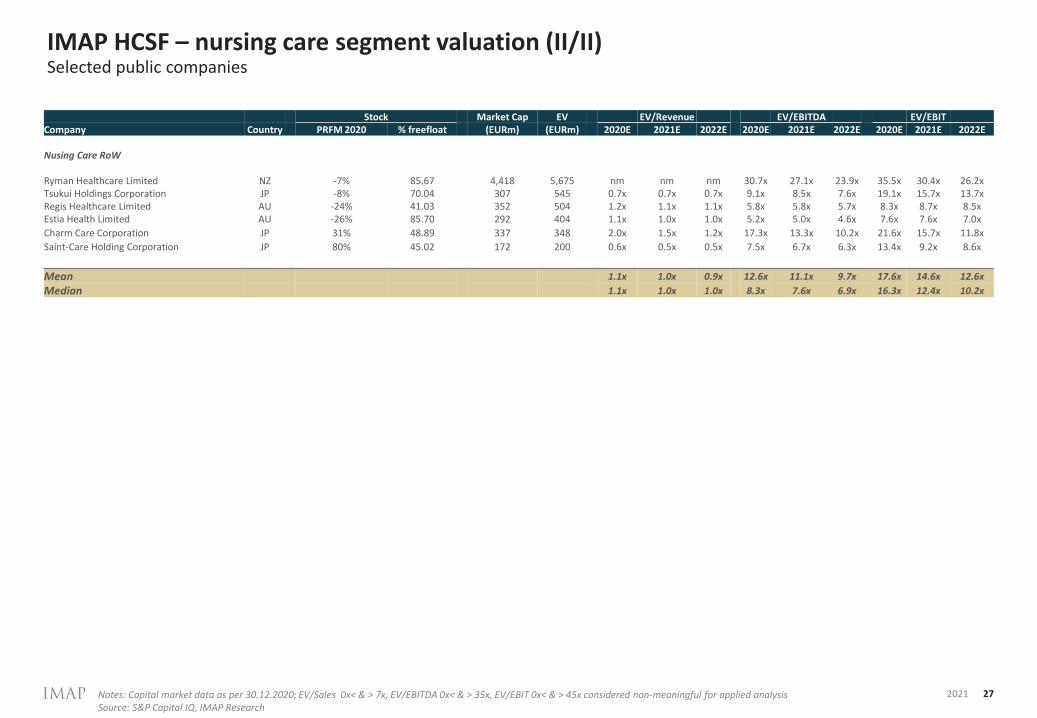
IMAP HCSF – nursing care segment valuation (II/II)
27
Selected public companies
2021
Stock Market Cap EV EV/Revenue EV/EBITDA EV/EBITCompany Country PRFM 2020 % freefloat (EURm) (EURm) 2020E 2021E 2022E 2020E 2021E 2022E 2020E 2021E 2022E
Nusing Care RoW
Ryman Healthcare Limited NZ -7% 85.67 4,418 5,675 nm nm nm 30.7x 27.1x 23.9x 35.5x 30.4x 26.2xTsukui Holdings Corporation JP -8% 70.04 307 545 0.7x 0.7x 0.7x 9.1x 8.5x 7.6x 19.1x 15.7x 13.7xRegis Healthcare Limited AU -24% 41.03 352 504 1.2x 1.1x 1.1x 5.8x 5.8x 5.7x 8.3x 8.7x 8.5xEstia Health Limited AU -26% 85.70 292 404 1.1x 1.0x 1.0x 5.2x 5.0x 4.6x 7.6x 7.6x 7.0x
Charm Care Corporation JP 31% 48.89 337 348 2.0x 1.5x 1.2x 17.3x 13.3x 10.2x 21.6x 15.7x 11.8x
Saint-Care Holding Corporation JP 80% 45.02 172 200 0.6x 0.5x 0.5x 7.5x 6.7x 6.3x 13.4x 9.2x 8.6x
Mean 1.1x 1.0x 0.9x 12.6x 11.1x 9.7x 17.6x 14.6x 12.6x
Median 1.1x 1.0x 1.0x 8.3x 7.6x 6.9x 16.3x 12.4x 10.2x
Notes: Capital market data as per 30.12.2020; EV/Sales 0x< & > 7x, EV/EBITDA 0x< & > 35x, EV/EBIT 0x< & > 45x considered non-meaningful for applied analysis Source: S&P Capital IQ, IMAP Research
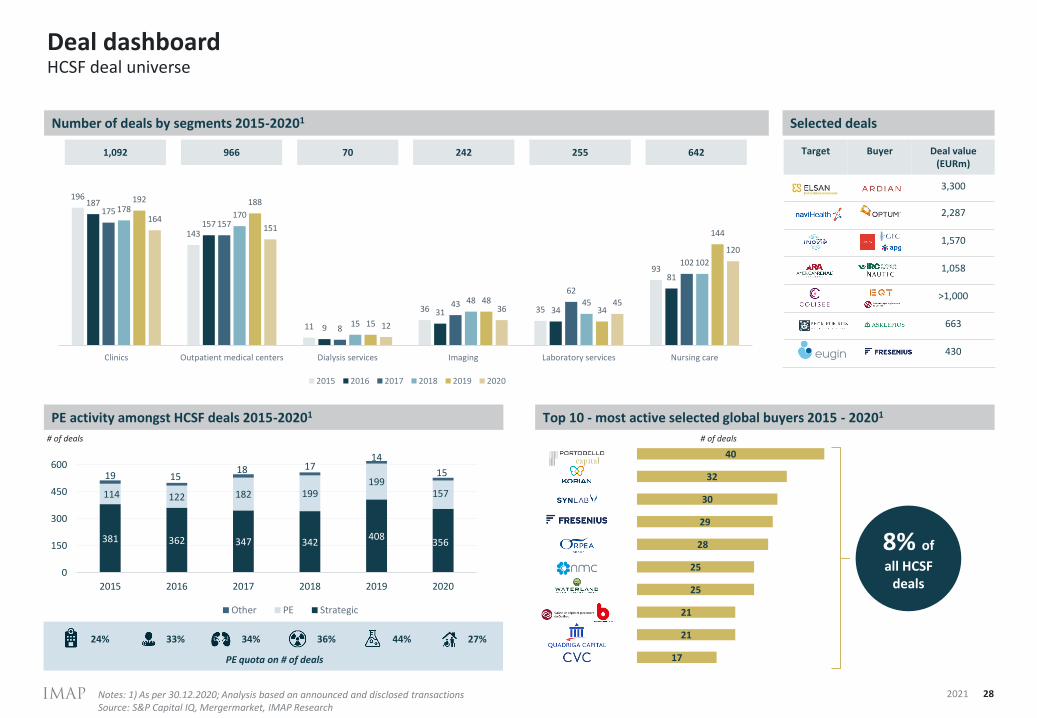
Deal dashboard
28
HCSF deal universe
PE activity amongst HCSF deals 2015-20201 Top 10 - most active selected global buyers 2015 - 20201
Selected deals
Target Buyer Deal value (EURm)
3,300
2,287
1,570
1,058
>1,000
663
430
Number of deals by segments 2015-20201
196
143
11
36 35
93
187
157
9
31 34
81
175
157
8
43
62
102
178170
15
48 45
102
192 188
15
4834
144
164151
12
3645
120
Clinics Outpatient medical centers Dialysis services Imaging Laboratory services Nursing care
2015 2016 2017 2018 2019 2020
381 362 347 342408
356
114 122 182 199199
157
19 1518 17
14
15
0
150
300
450
600
2015 2016 2017 2018 2019 2020
Other PE Strategic
24% 33% 34% 36% 44% 27%
PE quota on # of deals
Notes: 1) As per 30.12.2020; Analysis based on announced and disclosed transactionsSource: S&P Capital IQ, Mergermarket, IMAP Research
# of deals
17
21
21
25
25
28
29
30
32
40
# of deals
8% of
all HCSF deals
1,092 966 70 242 255 642
2021
Deal value EV / EBITDA
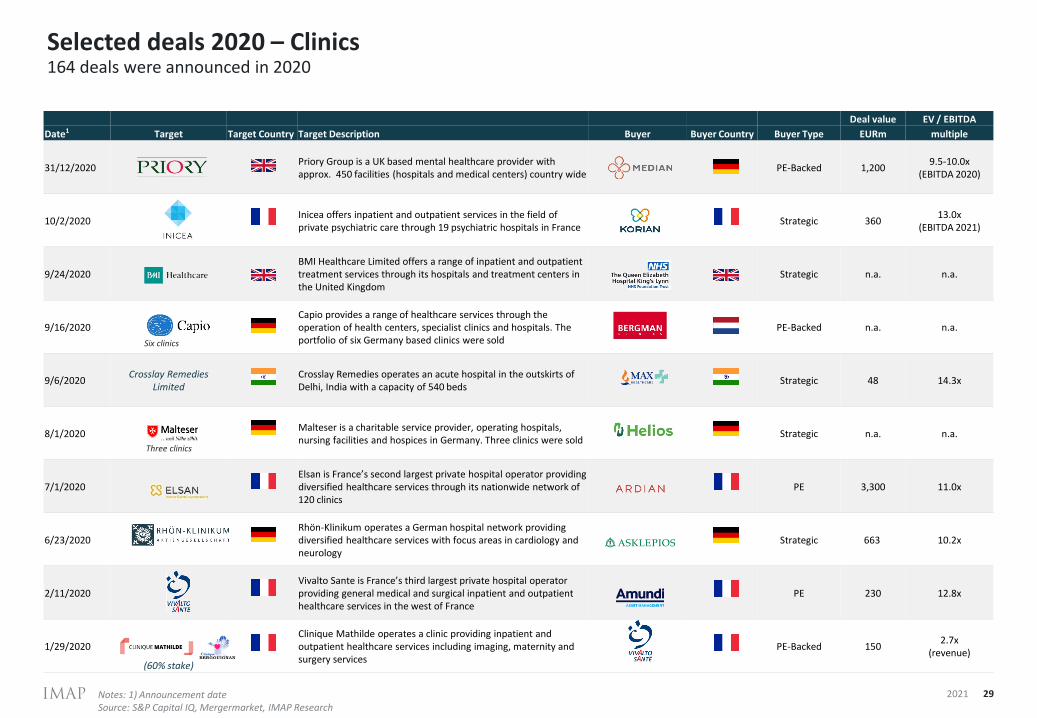
Date1 Target Target Country Target Description Buyer Buyer Country Buyer Type EURm multiple
31/12/2020Priory Group is a UK based mental healthcare provider with approx. 450 facilities (hospitals and medical centers) country wide
PE-Backed 1,2009.5-10.0x
(EBITDA 2020)
10/2/2020Inicea offers inpatient and outpatient services in the field of private psychiatric care through 19 psychiatric hospitals in France
Strategic 36013.0x
(EBITDA 2021)
9/24/2020BMI Healthcare Limited offers a range of inpatient and outpatient treatment services through its hospitals and treatment centers in the United Kingdom
Strategic n.a. n.a.
9/16/2020Capio provides a range of healthcare services through the operation of health centers, specialist clinics and hospitals. The portfolio of six Germany based clinics were sold
PE-Backed n.a. n.a.
9/6/2020Crosslay Remedies
LimitedCrosslay Remedies operates an acute hospital in the outskirts of Delhi, India with a capacity of 540 beds
Strategic 48 14.3x
8/1/2020Malteser is a charitable service provider, operating hospitals, nursing facilities and hospices in Germany. Three clinics were sold
Strategic n.a. n.a.
7/1/2020Elsan is France’s second largest private hospital operator providing diversified healthcare services through its nationwide network of 120 clinics
PE 3,300 11.0x
6/23/2020Rhön-Klinikum operates a German hospital network providing diversified healthcare services with focus areas in cardiology and neurology
Strategic 663 10.2x
2/11/2020Vivalto Sante is France’s third largest private hospital operator providing general medical and surgical inpatient and outpatient healthcare services in the west of France
PE 230 12.8x
1/29/2020
(60% stake)
Clinique Mathilde operates a clinic providing inpatient and outpatient healthcare services including imaging, maternity and surgery services
PE-Backed 1502.7x
(revenue)
Selected deals 2020 – Clinics
29
164 deals were announced in 2020
2021Notes: 1) Announcement dateSource: S&P Capital IQ, Mergermarket, IMAP Research
Six clinics
Three clinics
Deal value EV / EBITDA
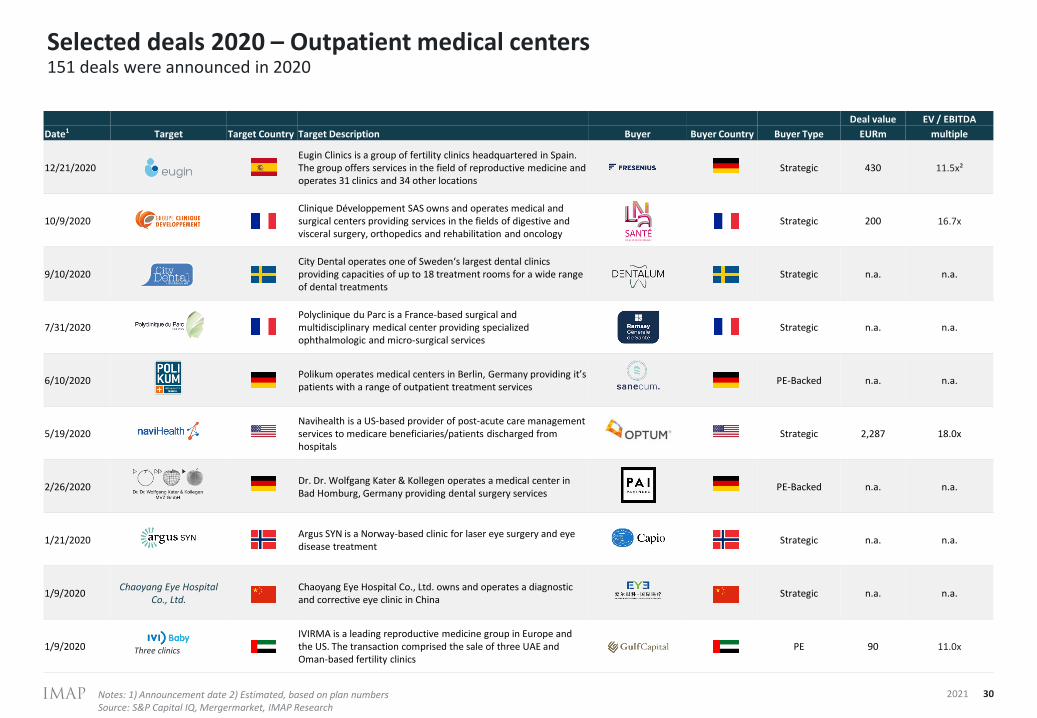
Date1 Target Target Country Target Description Buyer Buyer Country Buyer Type EURm multiple
12/21/2020Eugin Clinics is a group of fertility clinics headquartered in Spain. The group offers services in the field of reproductive medicine and operates 31 clinics and 34 other locations
Strategic 430 11.5x²
10/9/2020Clinique Développement SAS owns and operates medical and surgical centers providing services in the fields of digestive and visceral surgery, orthopedics and rehabilitation and oncology
Strategic 200 16.7x
9/10/2020City Dental operates one of Sweden‘s largest dental clinics providing capacities of up to 18 treatment rooms for a wide range of dental treatments
Strategic n.a. n.a.
7/31/2020Polyclinique du Parc is a France-based surgical and multidisciplinary medical center providing specialized ophthalmologic and micro-surgical services
Strategic n.a. n.a.
6/10/2020Polikum operates medical centers in Berlin, Germany providing it’s patients with a range of outpatient treatment services
PE-Backed n.a. n.a.
5/19/2020Navihealth is a US-based provider of post-acute care management services to medicare beneficiaries/patients discharged from hospitals
Strategic 2,287 18.0x
2/26/2020Dr. Dr. Wolfgang Kater & Kollegen operates a medical center in Bad Homburg, Germany providing dental surgery services
PE-Backed n.a. n.a.
1/21/2020Argus SYN is a Norway-based clinic for laser eye surgery and eye disease treatment
Strategic n.a. n.a.
1/9/2020Chaoyang Eye Hospital
Co., Ltd.Chaoyang Eye Hospital Co., Ltd. owns and operates a diagnostic and corrective eye clinic in China
Strategic n.a. n.a.
1/9/2020IVIRMA is a leading reproductive medicine group in Europe and the US. The transaction comprised the sale of three UAE and Oman-based fertility clinics
PE 90 11.0x
Selected deals 2020 – Outpatient medical centers
30
151 deals were announced in 2020
2021Notes: 1) Announcement date 2) Estimated, based on plan numbersSource: S&P Capital IQ, Mergermarket, IMAP Research
Three clinics
Deal value EV / EBITDA
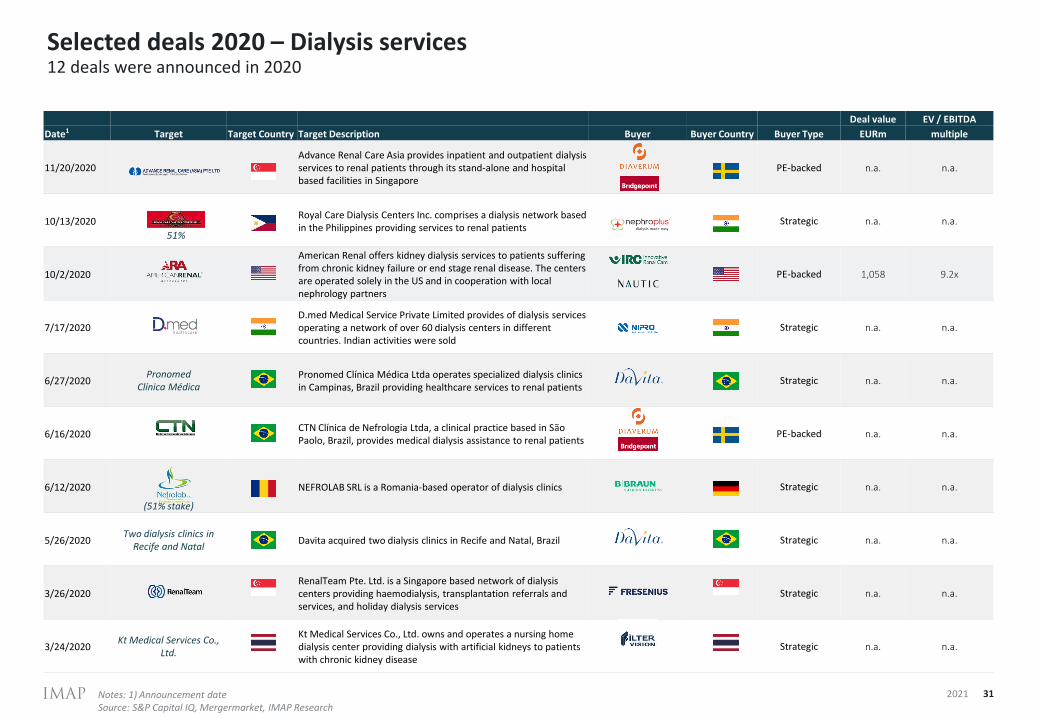
Date1 Target Target Country Target Description Buyer Buyer Country Buyer Type EURm multiple
11/20/2020Advance Renal Care Asia provides inpatient and outpatient dialysis services to renal patients through its stand-alone and hospital based facilities in Singapore
PE-backed n.a. n.a.
10/13/2020Royal Care Dialysis Centers Inc. comprises a dialysis network based in the Philippines providing services to renal patients
Strategic n.a. n.a.
10/2/2020
American Renal offers kidney dialysis services to patients suffering from chronic kidney failure or end stage renal disease. The centers are operated solely in the US and in cooperation with local nephrology partners
PE-backed 1,058 9.2x
7/17/2020D.med Medical Service Private Limited provides of dialysis services operating a network of over 60 dialysis centers in different countries. Indian activities were sold
Strategic n.a. n.a.
6/27/2020Pronomed
Clínica MédicaPronomed Clínica Médica Ltda operates specialized dialysis clinics in Campinas, Brazil providing healthcare services to renal patients
Strategic n.a. n.a.
6/16/2020CTN Clínica de Nefrologia Ltda, a clinical practice based in São Paolo, Brazil, provides medical dialysis assistance to renal patients
PE-backed n.a. n.a.
6/12/2020
(51% stake)
NEFROLAB SRL is a Romania-based operator of dialysis clinics Strategic n.a. n.a.
5/26/2020Two dialysis clinics in
Recife and NatalDavita acquired two dialysis clinics in Recife and Natal, Brazil Strategic n.a. n.a.
3/26/2020RenalTeam Pte. Ltd. is a Singapore based network of dialysis centers providing haemodialysis, transplantation referrals and services, and holiday dialysis services
Strategic n.a. n.a.
3/24/2020Kt Medical Services Co.,
Ltd.
Kt Medical Services Co., Ltd. owns and operates a nursing home dialysis center providing dialysis with artificial kidneys to patients with chronic kidney disease
Strategic n.a. n.a.
Selected deals 2020 – Dialysis services
31
12 deals were announced in 2020
2021Notes: 1) Announcement dateSource: S&P Capital IQ, Mergermarket, IMAP Research
51%
Deal value EV / EBITDA
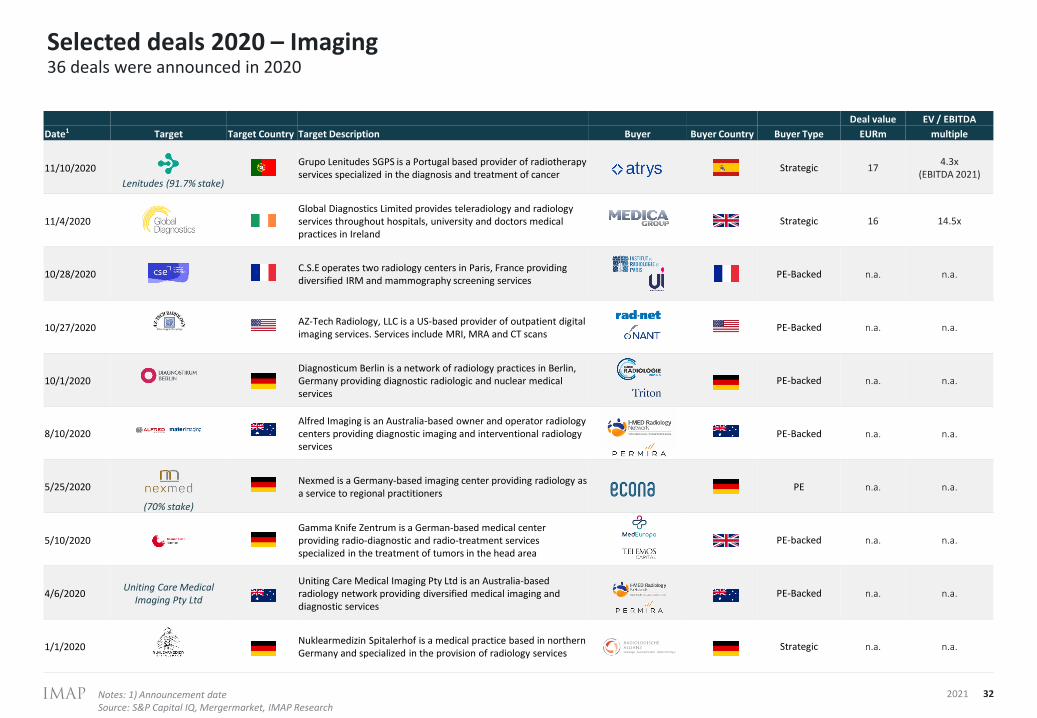
Date1 Target Target Country Target Description Buyer Buyer Country Buyer Type EURm multiple
11/10/2020Grupo Lenitudes SGPS is a Portugal based provider of radiotherapy services specialized in the diagnosis and treatment of cancer
Strategic 174.3x
(EBITDA 2021)
11/4/2020Global Diagnostics Limited provides teleradiology and radiology services throughout hospitals, university and doctors medical practices in Ireland
Strategic 16 14.5x
10/28/2020C.S.E operates two radiology centers in Paris, France providing diversified IRM and mammography screening services
PE-Backed n.a. n.a.
10/27/2020AZ-Tech Radiology, LLC is a US-based provider of outpatient digital imaging services. Services include MRI, MRA and CT scans
PE-Backed n.a. n.a.
10/1/2020Diagnosticum Berlin is a network of radiology practices in Berlin, Germany providing diagnostic radiologic and nuclear medical services
PE-backed n.a. n.a.
8/10/2020Alfred Imaging is an Australia-based owner and operator radiology centers providing diagnostic imaging and interventional radiology services
PE-Backed n.a. n.a.
5/25/2020
(70% stake)
Nexmed is a Germany-based imaging center providing radiology as a service to regional practitioners
PE n.a. n.a.
5/10/2020Gamma Knife Zentrum is a German-based medical center providing radio-diagnostic and radio-treatment services specialized in the treatment of tumors in the head area
PE-backed n.a. n.a.
4/6/2020Uniting Care Medical
Imaging Pty Ltd
Uniting Care Medical Imaging Pty Ltd is an Australia-based radiology network providing diversified medical imaging and diagnostic services
PE-Backed n.a. n.a.
1/1/2020Nuklearmedizin Spitalerhof is a medical practice based in northern Germany and specialized in the provision of radiology services
Strategic n.a. n.a.
Selected deals 2020 – Imaging
32
36 deals were announced in 2020
2021Notes: 1) Announcement dateSource: S&P Capital IQ, Mergermarket, IMAP Research
Lenitudes (91.7% stake)
Deal value EV / EBITDA
Date1 Target Target Country Target Description Buyer Buyer Country Buyer Type EURm multiple
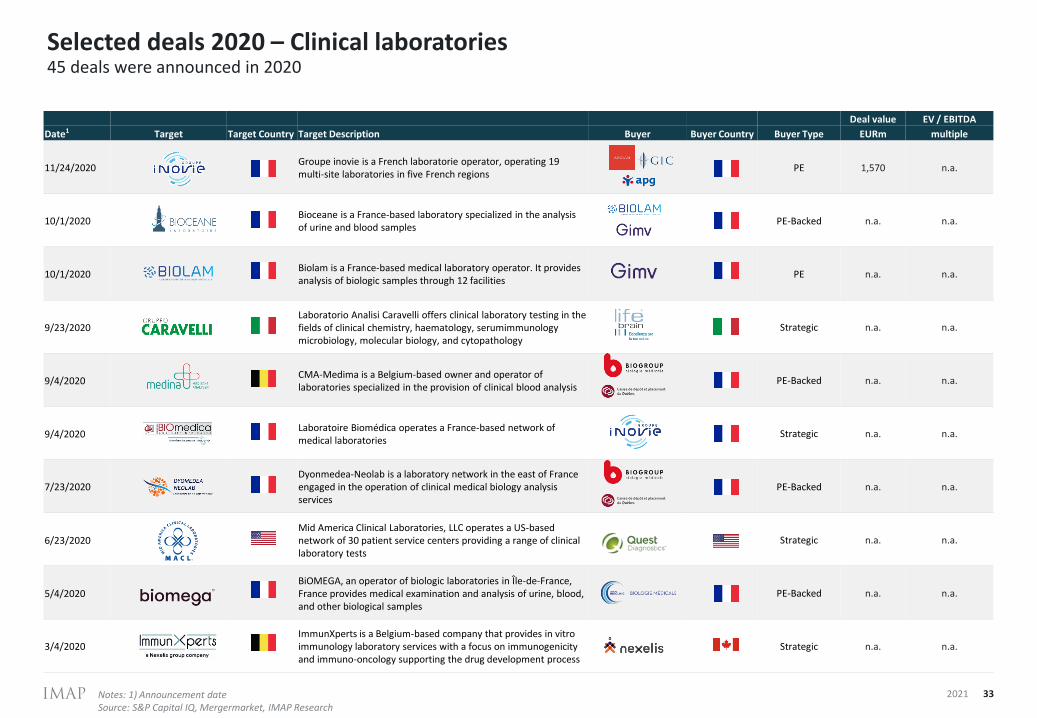
11/24/2020Groupe inovie is a French laboratorie operator, operating 19 multi-site laboratories in five French regions
PE 1,570 n.a.
10/1/2020Bioceane is a France-based laboratory specialized in the analysis of urine and blood samples
PE-Backed n.a. n.a.
10/1/2020Biolam is a France-based medical laboratory operator. It provides analysis of biologic samples through 12 facilities
PE n.a. n.a.
9/23/2020Laboratorio Analisi Caravelli offers clinical laboratory testing in the fields of clinical chemistry, haematology, serumimmunology microbiology, molecular biology, and cytopathology
Strategic n.a. n.a.
9/4/2020CMA-Medima is a Belgium-based owner and operator of laboratories specialized in the provision of clinical blood analysis
PE-Backed n.a. n.a.
9/4/2020Laboratoire Biomédica operates a France-based network of medical laboratories
Strategic n.a. n.a.
7/23/2020Dyonmedea-Neolab is a laboratory network in the east of France engaged in the operation of clinical medical biology analysis services
PE-Backed n.a. n.a.
6/23/2020Mid America Clinical Laboratories, LLC operates a US-based network of 30 patient service centers providing a range of clinical laboratory tests
Strategic n.a. n.a.
5/4/2020BiOMEGA, an operator of biologic laboratories in Île-de-France, France provides medical examination and analysis of urine, blood, and other biological samples
PE-Backed n.a. n.a.
3/4/2020ImmunXperts is a Belgium-based company that provides in vitro immunology laboratory services with a focus on immunogenicity and immuno-oncology supporting the drug development process
Strategic n.a. n.a.
Selected deals 2020 – Clinical laboratories
33
45 deals were announced in 2020
2021Notes: 1) Announcement dateSource: S&P Capital IQ, Mergermarket, IMAP Research
Deal value EV / EBITDA
Date1 Target Target Country Target Description Buyer Buyer Country Buyer Type EURm multiple
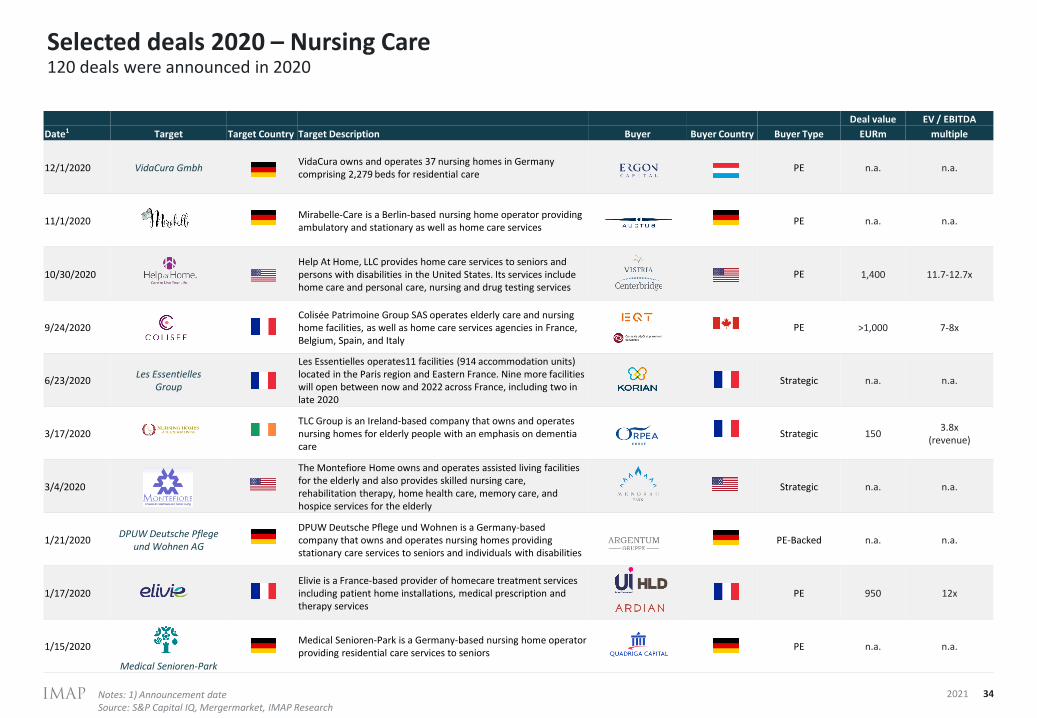
12/1/2020 VidaCura GmbhVidaCura owns and operates 37 nursing homes in Germany comprising 2,279 beds for residential care
PE n.a. n.a.
11/1/2020Mirabelle-Care is a Berlin-based nursing home operator providingambulatory and stationary as well as home care services
PE n.a. n.a.
10/30/2020Help At Home, LLC provides home care services to seniors and persons with disabilities in the United States. Its services include home care and personal care, nursing and drug testing services
PE 1,400 11.7-12.7x
9/24/2020Colisée Patrimoine Group SAS operates elderly care and nursing home facilities, as well as home care services agencies in France, Belgium, Spain, and Italy
PE >1,000 7-8x
6/23/2020Les Essentielles
Group
Les Essentielles operates11 facilities (914 accommodation units) located in the Paris region and Eastern France. Nine more facilities will open between now and 2022 across France, including two in late 2020
Strategic n.a. n.a.
3/17/2020TLC Group is an Ireland-based company that owns and operates nursing homes for elderly people with an emphasis on dementia care
Strategic 1503.8x
(revenue)
3/4/2020
The Montefiore Home owns and operates assisted living facilities for the elderly and also provides skilled nursing care, rehabilitation therapy, home health care, memory care, and hospice services for the elderly
Strategic n.a. n.a.
1/21/2020DPUW Deutsche Pflege
und Wohnen AG
DPUW Deutsche Pflege und Wohnen is a Germany-based company that owns and operates nursing homes providing stationary care services to seniors and individuals with disabilities
PE-Backed n.a. n.a.
1/17/2020Elivie is a France-based provider of homecare treatment services including patient home installations, medical prescription and therapy services
PE 950 12x
1/15/2020
Medical Senioren-Park
Medical Senioren-Park is a Germany-based nursing home operator providing residential care services to seniors
PE n.a. n.a.
Selected deals 2020 – Nursing Care
34
120 deals were announced in 2020
2021Notes: 1) Announcement dateSource: S&P Capital IQ, Mergermarket, IMAP Research
16
39
108
27
15
Clinics Outpatient medicalcenters
Dialysis services Imaging Clinical laboratories Nursing care
2015 2016 2017 2018 2019 2020
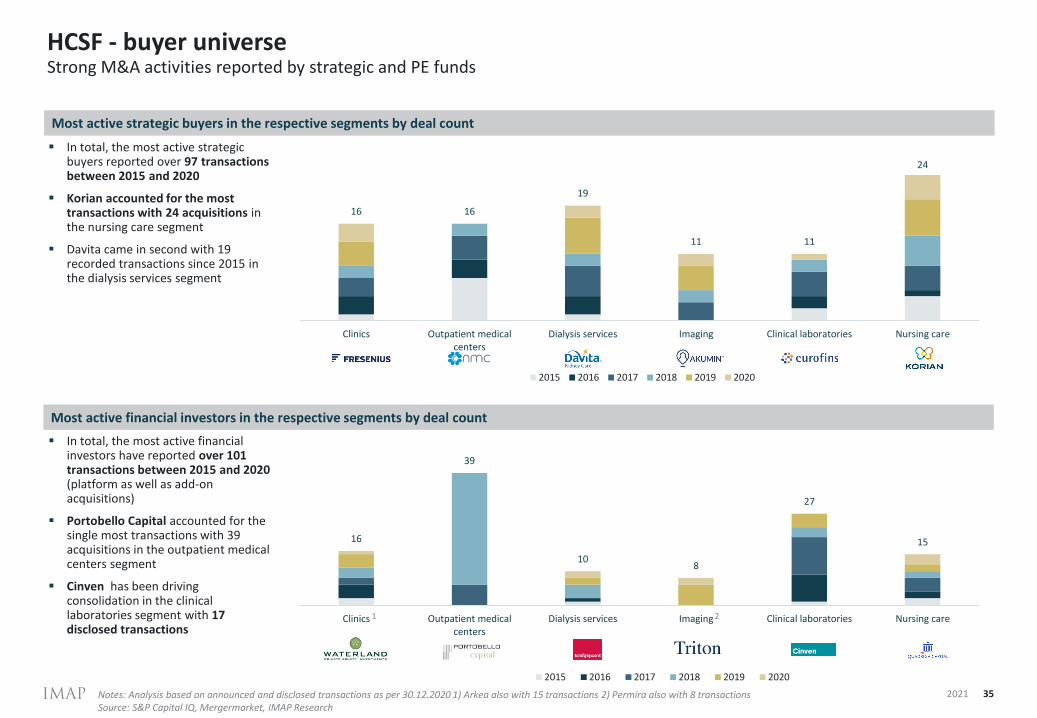
HCSF - buyer universe
35
Strong M&A activities reported by strategic and PE funds
Most active strategic buyers in the respective segments by deal count
Most active financial investors in the respective segments by deal count
▪ In total, the most active strategic buyers reported over 97 transactions between 2015 and 2020
▪ Korian accounted for the most transactions with 24 acquisitions in the nursing care segment
▪ Davita came in second with 19 recorded transactions since 2015 in the dialysis services segment
▪ In total, the most active financial investors have reported over 101 transactions between 2015 and 2020 (platform as well as add-on acquisitions)
▪ Portobello Capital accounted for the single most transactions with 39 acquisitions in the outpatient medical centers segment
▪ Cinven has been driving consolidation in the clinical laboratories segment with 17 disclosed transactions
2021
16 16
19
11 11
24
Clinics Outpatient medicalcenters
Dialysis services Imaging Clinical laboratories Nursing care
2015 2016 2017 2018 2019 2020
Notes: Analysis based on announced and disclosed transactions as per 30.12.2020 1) Arkea also with 15 transactions 2) Permira also with 8 transactionsSource: S&P Capital IQ, Mergermarket, IMAP Research
1 2
Agenda
1. Introduction Page 3
2. Healthcare services and facilities market Page 4
3. Valuation and M&A activity Page 10
4. Introduction to IMAP and relevant expertise Page 36
IMAP is specialized on mid-cap M&A transactions
37
With over 200 transactions annually, we are one of the leading M&A advisory globally
Our values:
Execution
Dedication
Talent
Informality
IMAP is a global, integrated and efficient M&A organization with more than 60 offices and more than 500 professionals worldwide
Global M&A organization with more
than 60 offices in 43 countries, thereof 3 in
Germany
> 450 professionalsthereof approx. 40 in
Germany
Ø 220 transactionsp.a., thereof c. 20-25
in Germany
Annual deal volume > USD 12bn. -
typical deal value range: USD 20 - 300m
Successful in the German market since
1997
Managed by partners, who are fully
committed to the clients
International sector teams
connected via global IT platform
Regularly ranked among Top 10 M&A
advisory firms
24
2021
Years
IMAP International Around 220 transactions with over 450 professionals in 43 countries completed in 2020
38
Global partnership Transactions by sectors (2020 - # Deals: 218)
PublicationsInternational presence
▪ Combining local knowledge and network in the most important international markets
▪ Standardized, IMAP-wide working routines regarding market developments and market opportunities
▪ Globally rotating IMAP conferences & symposia
▪ International sector and project teams▪ Resources and knowledge pool for all sector
specific projects▪ Access to all relevant national and
international databases
2021
14%
12%
9%
9%
7%7%6%
6%
5%
4%
21%
Technology
Industrials
Consumer & Retail
Business Services
Healthcare
Business Services
Food & Beverage
Transport & Logistics
Materials, Chemicals & Mining
Building Products
Automotive
others
Europe and Africa ▪ 24 offices in the EU▪ 1 office each in UK, Serbia and Bosnia and
Herzegovina▪ 9 offices in Africa▪ over 280 M&A professionals
North and South America▪ 17 offices in USA, 2 offices in Canada ▪ 1 office each in Argentina, Brazil, Chile, Colombia,
Mexico and Peru▪ over 170 M&A professionals
Asia▪ 2 offices in Japan, 1 office each in China, India and
Thailand▪ over 50 M&A professionals
IMAP Germany
IMAP Global Healthcare TeamLocal sector expertise with global reach
39
Healthcare Senior team IMAP Healthcare deal statistics
IMAP Germany – healthcare sector coverage
Ø approx. 20 deals p.a.
In total 113 deals in the HC sector globally
since 2015
Ruta [email protected]
Deal split by healthcare sub-sector1
2021Note: 1) since 2015
50
138
20
8
14
Healthcare services andfacilitiesMedical devices andequipment or hospital suppliesHealhtcare supplies
Healthcare distribution
Pharmaceuticals and relatedsegmentsOther
IMAP Healthcare Americas
USA▪ John Ferrara (Founder & CEO)▪ David Baker (MD)▪ Sophea Chau (MD)▪ David Desimone (MD)▪ Michael Ewing (MD)▪ Roger Kahn (MD)▪ Rod Rivera (MD)▪ Eric Williams (MD)▪ Mark Surowiak (D)
Canada▪ Doug Irwin (Partner)▪ Kenneth Skinner (MD)▪ Benjamin Kinder (D)
Argentina▪ Mario Hugo Azulay (Partner)
Brasil▪ Luiz Eduardo Costa (Partner)
Peru▪ Carlos Garcia (MD)
Germany▪ Ruta Hildebrand (Partner)
Finland▪ Harri Roos (Partner)
Russia▪ Evgeny Antipov (MD)
Poland▪ Jorge A. Abugaber (VP)
Hungary▪ Gabror Szendroi (MD)
Czech Republic▪ Michal Mišun (Partner)
France▪ Cyril Kammoun (Managing Partner)▪ David Amar (MD)
Belgium▪ Oriol Huguet (Managing Partner)▪ Olivier De Vos (MD)
The Netherlands▪ Ian Bussey (MD)▪ Frank Ruijgrok (D)
Ireland▪ John Sisk (Senior Advisor)
UK▪ Coverage by Ian Bussey (MD) / The
Netherlands
IMAP Healthcare Europa
Morocco▪ Mehdi Berbich (Partner)
India▪ Ashutosh Maheshvari (MD)
IMAP Healthcare RoW
113 deals
IMAP Healthcare DealsSelected IMAP international deals
402021

IMAP M&A Consultants AGOffices
IMAP M&A Consultants AG
München
Bernhard-Wicki-Straße 380636 MünchenTelefon: +49 89 5402273-0
Frankfurt
Junghofstraße 2460311 Frankfurt am MainTelefon: +49 69 5050604-190
Mannheim
Harrlachweg 168163 MannheimTelefon: +49 621 3286-0Fax: +49 621 3286-100
E-mail: [email protected]
Internet: www.imap.de
This document and the information contained therein neither constitute an agreement nor does IMAP M&A Consultants AG (“IMAP”) pursuant to this document provide any advice to you or assume any disclosure obligations or other contractual or pre-contractual obligations, insofar as not explicitly agreed in writing with you otherwise.
The information contained herein is based on publicly available information or upon information which was provided by the management of potentially relevant transaction participant and/or otherwise relevant persons, as may be the case. The information was not verified by IMAP with respect to its accuracy and completeness. Insofar as not explicitly agreed with you otherwise in writing, IMAP shall not make any representation or warranty or assume any other liability with respect to the accuracy and completeness of such information.
This document shall not be construed as containing any legal, tax or accounting advice or recommendation. This document is not intended to serve as a basis for an investment decision and shall not replace your independent review of the information referenced in the document and the corresponding legal, financial and other matters.
Insofar as this document contains estimates and forecasts of future (financial) developments, these shall be understood as non-binding assessments and views of IMAP as of the date of the preparation of the document by IMAP. The actual results may deviate from the estimates and forecasts. IMAP assumes no obligation to update or otherwise review this document.
This document is protected by copyright. Any editing thereof is prohibited. Any use of this document requires the prior written consent of IMAP.
Legal notice
422021
List of abbreviations
2021 43
Abbreviation Meaning# Number
2020A 2020 actual
2020E 2020 estimated
adj. Adjusted
AE United Arab Emirates
approx. Approximately
AU Australia
bn Billion
BR Brasil
CA Canada
CAGR Compound annual growth rate
CH Switzerland
CL Chile
CN China
CO Colombia
CQ Calender quarter
CY Cyprus
CY calendar year
DE Germany
DRG Diagnosis related groups
E Expected
e.g. Exempli gratia
EBIT Earnings before interest and taxes
EBITDA Earnings before interest, taxes, depreciation and amortization
EBM Einheitlicher Bewertungsmaßstab (uniform valuation standard)
EMEA Europe, Middle East, Africa
EUR Euro
EV Enterprise value
FI Finland
FR France
GB Great Britain
GR Greece
HCSF Healthcare services and facilities
HK Hong Kong
HQ Headquarter country
ID Indonesia
IN India
IT Italy
JP Japan
Abbreviation MeaningKW Kuwait
LK Sri Lanka
LTM Last twelve months
m Million
M&A Mergers & acquisitions
MY Malaysia
n.a. Not available
nm Non-meaningful
NTM Next twelve months
NZ New Zealand
p.a. Per annum
PE Private equity
PK Pakistan
PL Poland
PRFM Performance
QA Qatar
Rev. Revenue
RO Romania
RoW Rest of world
SA Saudi Arabia
SE Sweden
SG Singapore
TH Thailand
TR Turkey
tril trillion
US United States
USD United States dollar
YoY Year over year
YTD Year to date
ZA South Africa