Embed Size (px)
Citation preview

M E R C E R TA L E N T A L L A C C E S S ®
2021 | sample
global compensation planning
welcome to brighter SAMPLE

The workforce is evolving. Data is powerful.
The Talent All Access® portfolio puts global data at your fingertips to help you manage your workforce.
Get everything in one place
Knowledge is powerful. Time is limited.
Talent All Access® Portal+ gives you both at our fingertips with quick to find and easy to digest content.
Demo VideoLearn More
Order Now
*Not included in Talent All Access®
Flexible Working Policies
& Practices
Global Parental Leave
Salary Movement Snapshot*
Workforce Metrics Around
the World
Worldwide Benefit & Employment
Guidelines
Workforce Turnover Around
the World
Incentives Around the World
Vacation and Other Leave Policies
Severance Pay Policies
Car Benefit Policies
Global Compensation
Drivers
Global Pay Summary
The Design of Work
Global Compensation
Planning
Car Cost Report
Employee Engagement Survey
Toolkit
Global Incentive Benefits
SAMPLE
8 Report structure
10 Reading this report
47 Africa
135 Algeria141 Angola147 Botswana153 Cameroon
159 Democratic Republic of the Congo
165 Egypt171 Ethiopia177 Gabon183 Ghana189 Ivory Coast195 Kenya201 Libya207 Madagascar209 Malawi213 Mauritius
47 Middle East
135 Bahrain141 Iraq147 Israel153 Jordan159 Kuwait165 Lebanon171 Oman177 Qatar183 Saudi Arabia189 United Arab Emirates195 Yemen
47 Africa
219 Morocco225 Mozambique231 Namibia237 Nigeria243 Rwanda249 Senegal255 South Africa261 Tanzania267 Tunisia273 Uganda279 Zambia285 Zimbabwe
Note: You may find this report easier to navigate by using bookmarks. Watch this short video to learn more.
Table of contents
SAMPLE

Report structure
The 2021 Global Compensation Planning Report (GCPR) offers salary increase forecasts for 145 markets in 124 countries around the world. With salary increase and economic data that cover the past (2020), current (2021), and upcoming (2022) years, this report is a critical resource for working HR professionals responsible for the annual compensation planning process.
The report has the following sections:
Reading this report The Reading this report section provides details about the report format and data being reported.
Individual market The Individual market pages offer specific data for individual countries (and, in some cases cities), including economic trends, base salary practices, mandatory pay increase schemes, promotional increases, and incentive programs. They also include details on the data sources used.
About this report The About this report section delineates the methods of data gathering and cleaning used for the report and lists key definitions.
SAMPLE
©2021 Mercer LLC. 4 Global Compensation Planning — Sample

Reading this report
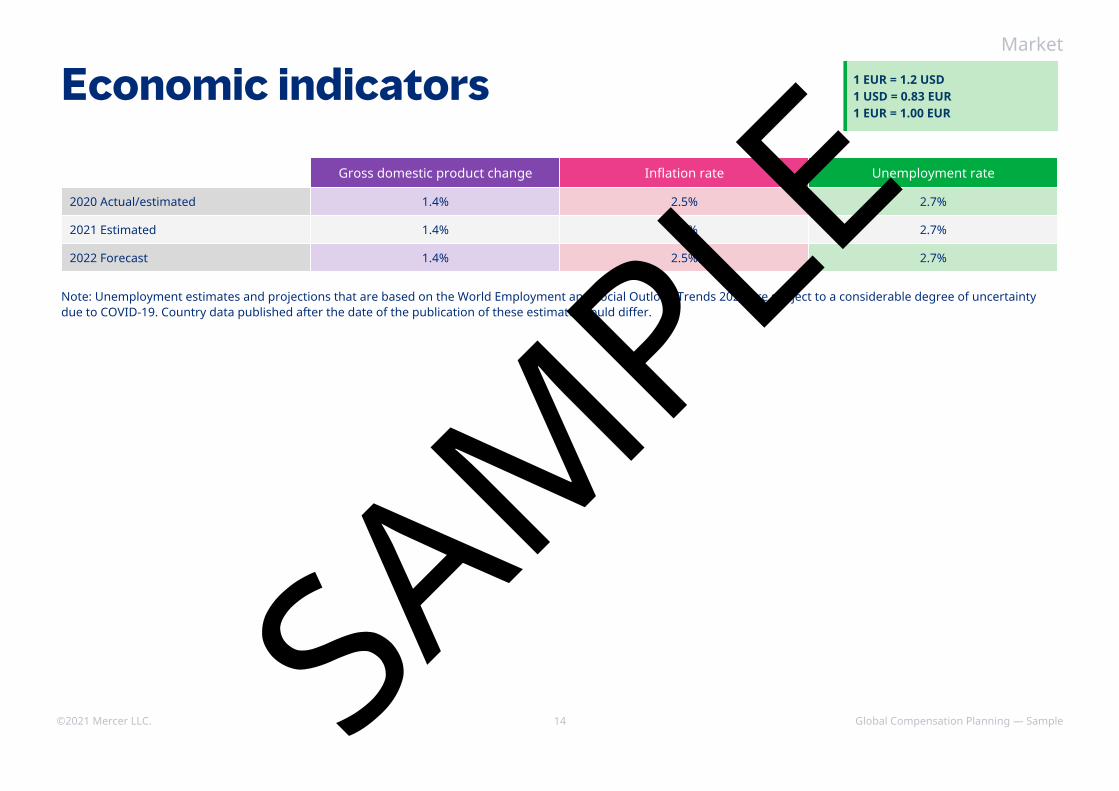
Three years of economic indicators and the status of the data are provided.
SAMPLE DATA
SAMPLE
©2021 Mercer LLC. 5 Global Compensation Planning — Sample

Reading this report
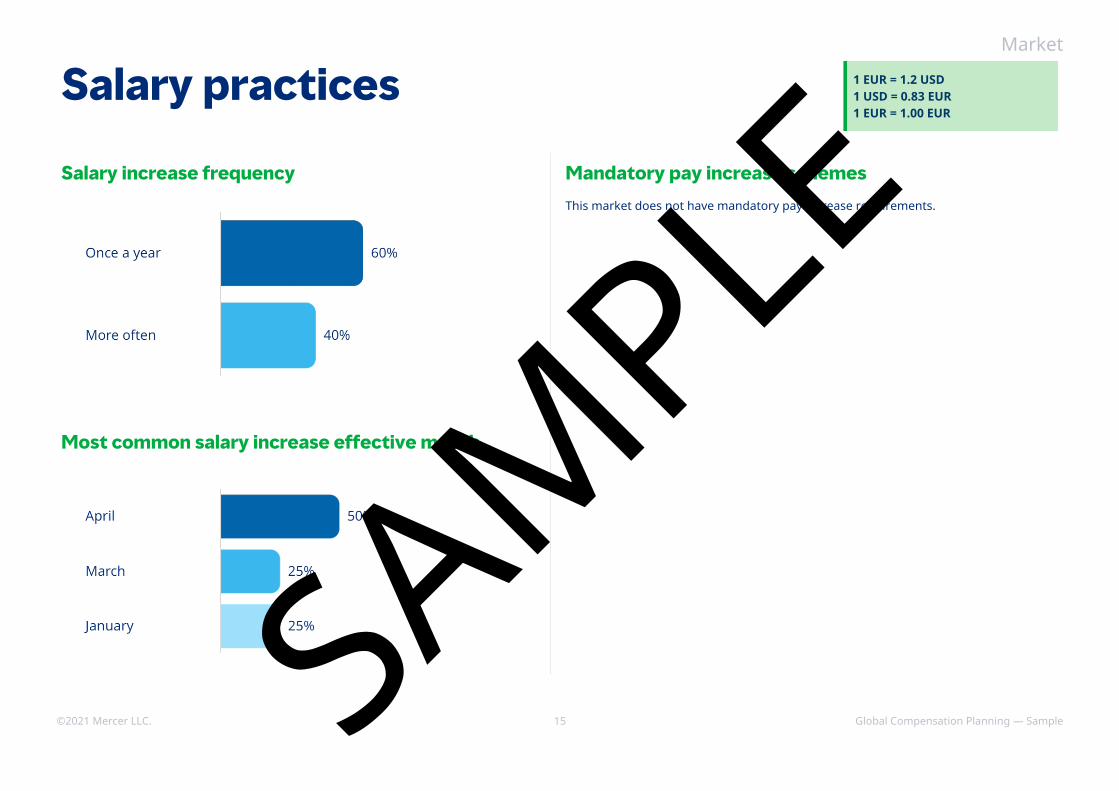
The percentage of companies that increase salaries according to each listed time frame. Once a year is the most common practice in most markets.
Any mandatory pay increase requirements are detailed here.
The percentage of companies that increase salaries in the months listed. The top three months are provided and may vary from one market to another.
SAMPLE DATA
SAMPLE
©2021 Mercer LLC. 6 Global Compensation Planning — Sample
Reading this report
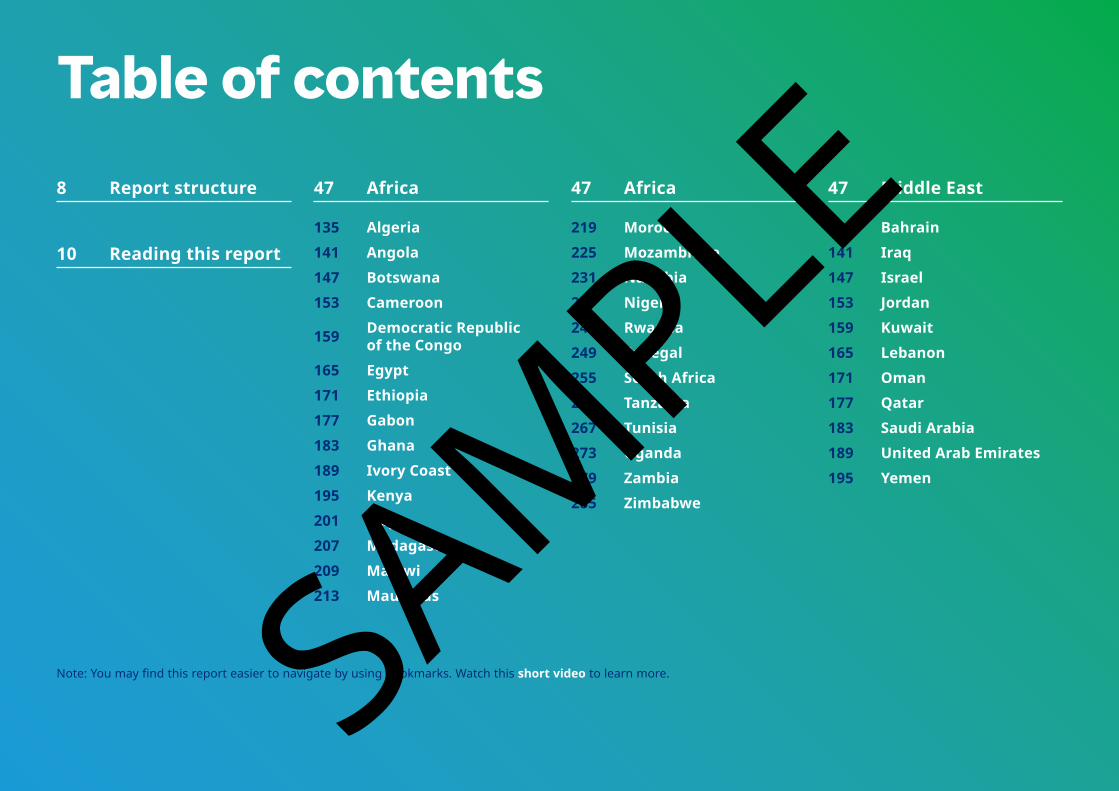
Separate tables are provided for excluding and including zeros. Salary increases excluding zeros excludes all salary freeze data to represent only those organizations implementing a salary increase.
The type of salary increase is noted below the table.
Estimated EstimatedMedian salary increases are reported for each career level, both excluding and including zeros.
Average salary increases are reported for each career level, both excluding and including zeros.
SAMPLE DATA
SAMPLE
©2021 Mercer LLC. 7 Global Compensation Planning — Sample
Estimated Estimated
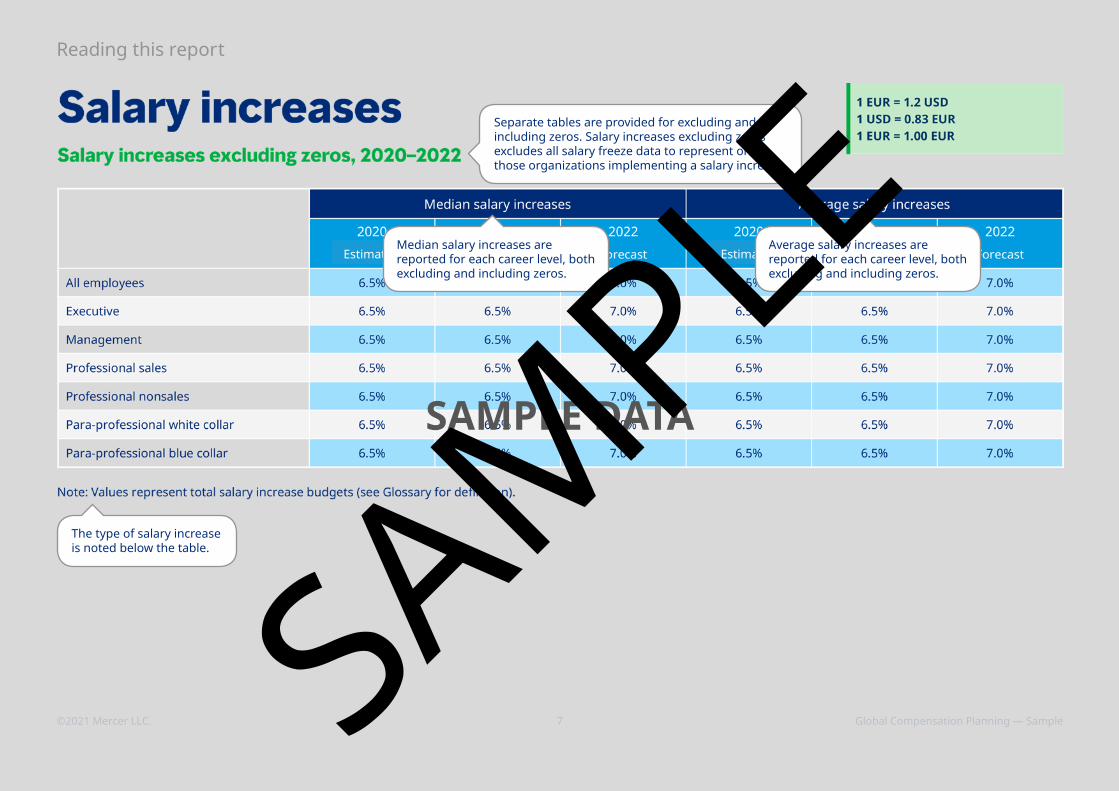
Reading this reportSeparate tables are provided for excluding and including zeros. Salary increases including zeros are based on all responses to represent the overall market, including those organizations implementing salary freezes.
Salary increases are reported for all employees and by career level.
Actual, estimated, or forecast salary increase budgets are reported for the market.
SAMPLE DATA
SAMPLE
©2021 Mercer LLC. 8 Global Compensation Planning — Sample

Reading this report
This table indicates the percentage of companies that reported a salary freeze in each of the three calendar years.
SAMPLE DATA
SAMPLE
©2021 Mercer LLC. 9 Global Compensation Planning — Sample
Reading this report
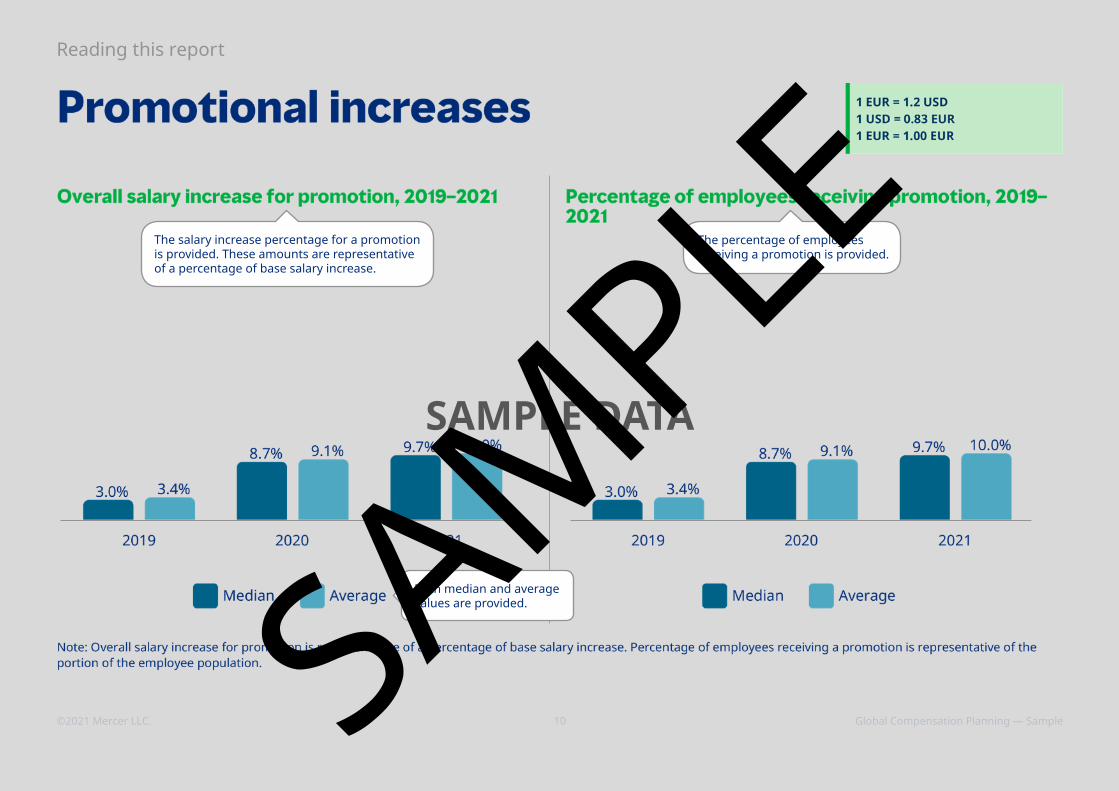
The salary increase percentage for a promotion is provided. These amounts are representative of a percentage of base salary increase.
The percentage of employees receiving a promotion is provided.
Both median and average values are provided.
SAMPLE DATA
SAMPLE
©2021 Mercer LLC. 10 Global Compensation Planning — Sample

Reading this report
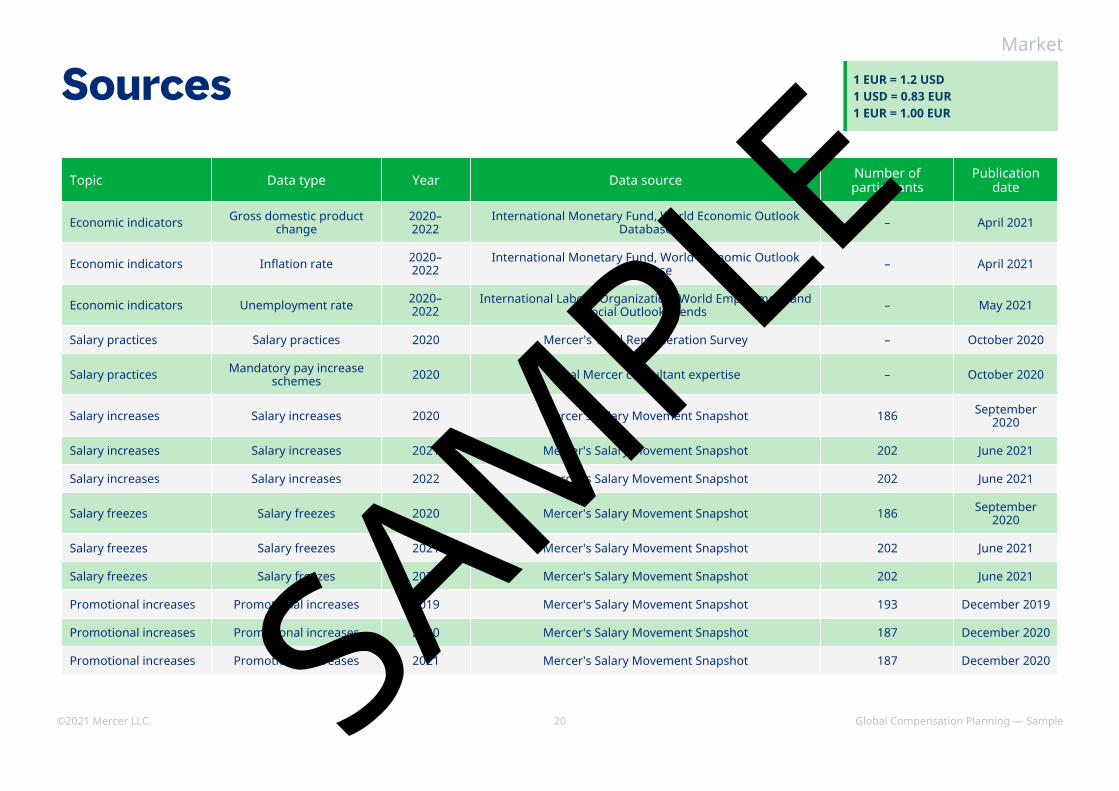
The data source is listed separately for each year in instances where the source differs for one of the three years.
The majority of the economic data (GDP, inflation, and unemployment) are sourced outside of Mercer.
A detailed list of data sources can be found at the end of each set of country pages.
SAMPLE DATA
SAMPLE
©2021 Mercer LLC. 11 Global Compensation Planning — Sample

Region SAMPLE
©2021 Mercer LLC. 12 Global Compensation Planning — Sample

Market SAMPLE
©2021 Mercer LLC. 13 Global Compensation Planning — Sample
1 EUR = 1.2 USD 1 USD = 0.83 EUR 1 EUR = 1.00 EUR
Economic indicators
Col1 Gross domestic product change Inflation rate Unemployment rate
2020 Actual/estimated 1.4% 2.5% 2.7%
2021 Estimated 1.4% 2.5% 2.7%
2022 Forecast 1.4% 2.5% 2.7%
Note: Unemployment estimates and projections that are based on the World Employment and Social Outlook Trends 2021 are subject to a considerable degree of uncertaintydue to COVID-19. Country data published after the date of the publication of these estimates could differ.
Market
SAMPLE
©2021 Mercer LLC. 14 Global Compensation Planning — Sample
1 EUR = 1.2 USD 1 USD = 0.83 EUR 1 EUR = 1.00 EUR
Salary practices
Salary increase frequency
Most common salary increase effective month
Mandatory pay increase schemes
This market does not have mandatory pay increase requirements.
Market
SAMPLE
©2021 Mercer LLC. 15 Global Compensation Planning — Sample

1 EUR = 1.2 USD 1 USD = 0.83 EUR 1 EUR = 1.00 EUR
Salary increasesSalary increases excluding zeros, 2020–2022
Median salary increases Average salary increases
Career 2020 2021 2022 2020 2021 2022
Actual Actual Forecast Actual Actual Forecast
All employees 6.5% 6.5% 7.0% 6.5% 6.5% 7.0%
Executive 6.5% 6.5% 7.0% 6.5% 6.5% 7.0%
Management 6.5% 6.5% 7.0% 6.5% 6.5% 7.0%
Professional sales 6.5% 6.5% 7.0% 6.5% 6.5% 7.0%
Professional nonsales 6.5% 6.5% 7.0% 6.5% 6.5% 7.0%
Para-professional white collar 6.5% 6.5% 7.0% 6.5% 6.5% 7.0%
Para-professional blue collar 6.5% 6.5% 7.0% 6.5% 6.5% 7.0%
Note: Values represent total salary increase budgets (see Glossary for definition).
Market
SAMPLE
©2021 Mercer LLC. 16 Global Compensation Planning — Sample

Salary increases including zeros, 2020–2022
Median salary increases Average salary increases
Career 2020 2021 2022 2020 2021 2022
Actual Actual Forecast Actual Actual Forecast
All employees 6.5% 6.5% 7.0% 6.5% 6.5% 7.0%
Executive 6.5% 6.5% 7.0% 6.5% 6.5% 7.0%
Management 6.5% 6.5% 7.0% 6.5% 6.5% 7.0%
Professional sales 6.5% 6.5% 7.0% 6.5% 6.5% 7.0%
Professional nonsales 6.5% 6.5% 7.0% 6.5% 6.5% 7.0%
Para-professional white collar 6.5% 6.5% 7.0% 6.5% 6.5% 7.0%
Para-professional blue collar 6.5% 6.5% 7.0% 6.5% 6.5% 7.0%
Note: Values represent total salary increase budgets (see Glossary for definition).
Market
SAMPLE
©2021 Mercer LLC. 17 Global Compensation Planning — Sample

1 EUR = 1.2 USD 1 USD = 0.83 EUR 1 EUR = 1.00 EUR
Salary freezesPercentage of companies reporting salary freezes
Career 2020 2021 2022
All employees 19.4% 10.1% 4.5%
Executive 20.8% 11.6% 3.6%
Management 20.7% 10.9% 4.2%
Professional sales 19.7% 9.3% 4.0%
Professional nonsales 19.9% 10.3% 4.2%
Para-professional white collar 21.9% 9.8% 4.4%
Para-professional blue collar 17.9% 11.1% 3.9%
Market
SAMPLE
©2021 Mercer LLC. 18 Global Compensation Planning — Sample

1 EUR = 1.2 USD 1 USD = 0.83 EUR 1 EUR = 1.00 EUR
Promotional increases
Note: Overall salary increase for promotion is representative of a percentage of base salary increase. Percentage of employees receiving a promotion is representative of theportion of the employee population.
Overall salary increase for promotion, 2019–2021 Percentage of employees receiving promotion, 2019–2021
Market
SAMPLE
©2021 Mercer LLC. 19 Global Compensation Planning — Sample
1 EUR = 1.2 USD 1 USD = 0.83 EUR 1 EUR = 1.00 EUR
Sources
Topic Data type Year Data source Number ofparticipants
Publicationdate
Economic indicators Gross domestic productchange
International Monetary Fund, World Economic OutlookDatabase – April 2021
Economic indicators Inflation rate International Monetary Fund, World Economic OutlookDatabase – April 2021
Economic indicators Unemployment rate International Labour Organization, World Employment andSocial Outlook Trends – May 2021
Salary practices Salary practices 2020 Mercer's Total Remuneration Survey – October 2020
Salary practices Mandatory pay increaseschemes 2020 Local Mercer consultant expertise – October 2020
Salary increases Salary increases 2020 Mercer's Salary Movement Snapshot 186 September2020
Salary increases Salary increases 2021 Mercer's Salary Movement Snapshot 202 June 2021
Salary increases Salary increases 2022 Mercer's Salary Movement Snapshot 202 June 2021
Salary freezes Salary freezes 2020 Mercer's Salary Movement Snapshot 186 September2020
Salary freezes Salary freezes 2021 Mercer's Salary Movement Snapshot 202 June 2021
Salary freezes Salary freezes 2022 Mercer's Salary Movement Snapshot 202 June 2021
Promotional increases Promotional increases 2019 Mercer's Salary Movement Snapshot 193 December 2019
Promotional increases Promotional increases 2020 Mercer's Salary Movement Snapshot 187 December 2020
Promotional increases Promotional increases 2021 Mercer's Salary Movement Snapshot 187 December 2020
2020–2022
2020–2022
2020–2022
Market
SAMPLE
©2021 Mercer LLC. 20 Global Compensation Planning — Sample

about this
reportSAMPLE
©2021 Mercer LLC. 21 Global Compensation Planning — Sample
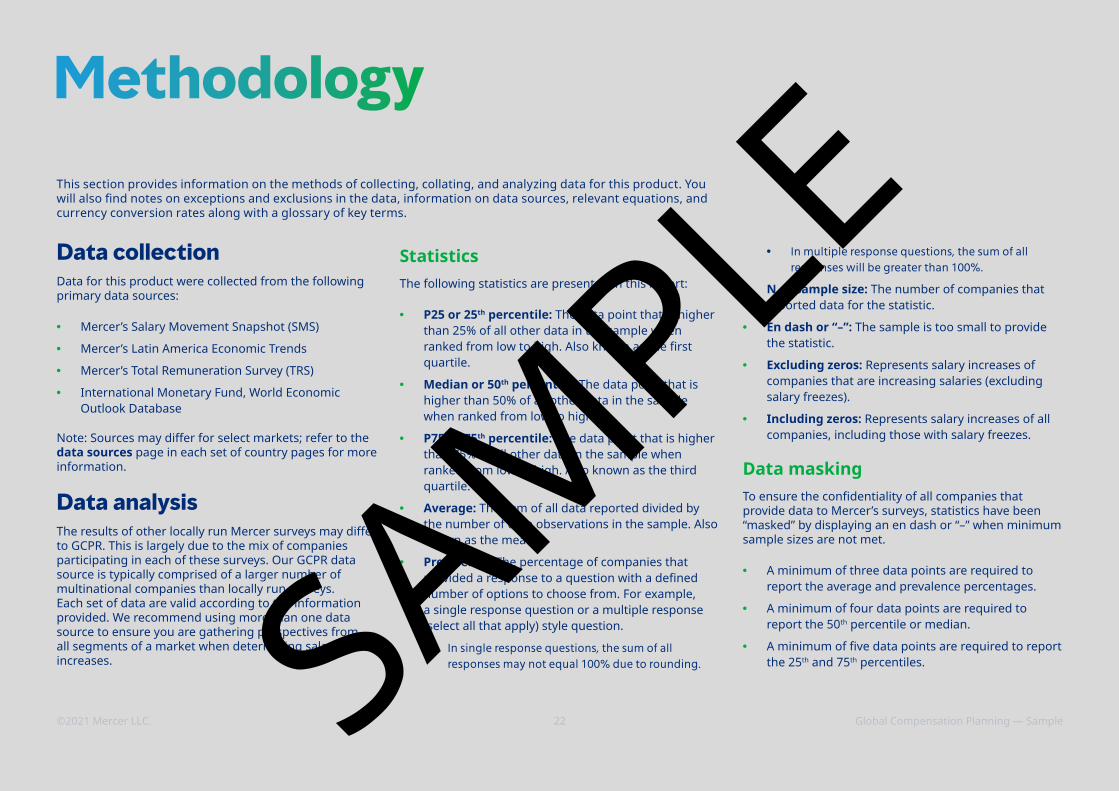
This section provides information on the methods of collecting, collating, and analyzing data for this product. You will also find notes on exceptions and exclusions in the data, information on data sources, relevant equations, and currency conversion rates along with a glossary of key terms.
Methodology
Data collectionData for this product were collected from the following primary data sources:
• Mercer’s Salary Movement Snapshot (SMS)
• Mercer’s Latin America Economic Trends
• Mercer’s Total Remuneration Survey (TRS)
• International Monetary Fund, World Economic Outlook Database
Note: Sources may differ for select markets; refer to the data sources page in each set of country pages for more information.
Data analysisThe results of other locally run Mercer surveys may differ to GCPR. This is largely due to the mix of companies participating in each of these surveys. Our GCPR data source is typically comprised of a larger number of multinational companies than locally run surveys. Each set of data are valid according to the information provided. We recommend using more than one data source to ensure you are gathering perspectives from all segments of a market when determining salary increases.
StatisticsThe following statistics are presented in this report:
• P25 or 25th percentile: The data point that is higher than 25% of all other data in the sample when ranked from low to high. Also known as the first quartile.
• Median or 50th percentile: The data point that is higher than 50% of all other data in the sample when ranked from low to high.
• P75 or 75th percentile: The data point that is higher than 75% of all other data in the sample when ranked from low to high. Also known as the third quartile.
• Average: The sum of all data reported divided by the number of data observations in the sample. Also known as the mean.
• Prevalence: The percentage of companies that provided a response to a question with a defined number of options to choose from. For example, a single response question or a multiple response (select all that apply) style question.
• In single response questions, the sum of all responses may not equal 100% due to rounding.
• In multiple response questions, the sum of all responses will be greater than 100%.
• N or sample size: The number of companies that reported data for the statistic.
• En dash or “–”: The sample is too small to provide the statistic.
• Excluding zeros: Represents salary increases of companies that are increasing salaries (excluding salary freezes).
• Including zeros: Represents salary increases of all companies, including those with salary freezes.
Data maskingTo ensure the confidentiality of all companies that provide data to Mercer’s surveys, statistics have been “masked” by displaying an en dash or “–” when minimum sample sizes are not met.
• A minimum of three data points are required to report the average and prevalence percentages.
• A minimum of four data points are required to report the 50th percentile or median.
• A minimum of five data points are required to report the 25th and 75th percentiles.SA
MPLE
©2021 Mercer LLC. 22 Global Compensation Planning — Sample

Knowledge is powerful. Time is limited.
Talent All Access® gives you both with quick to find and easy to digest content.
Looking for actionable insights?Access articles, videos, infographics, checklists (and more) to help you design, deliver, grow and transform your workforce.
More hands-on?Manipulate data with or using interactive online dashboards and tools; or download excel files to run your own calculations.
Need to present to your boss?Grab graphics and visuals directly from our reports to incorporate into your presentations, or use our prepared PowerPoint decks.
Planning for the future?Use our calculators to help evaluate cost saving opportunities and benchmark your company policies to others in the market.
M E R C E R TA L E N T A L L A C C E S S ®
Start putting more time back into your day.
Watch Video
Learn More
Request DemoSAMPLE

Mercer believes in building brighter futures by redefining the world of work, reshaping retirement and investment outcomes, and unlocking real health and well-being. Mercer’s more than 25,000 employees are based in 44 countries and the firm operates in over 130 countries. Mercer is a business of Marsh & McLennan (NYSE: MMC), the world’s leading professional services firm in the areas of risk, strategy and people, with 76,000 colleagues and annual revenue of $17 billion. Through its market-leading businesses including Marsh, Guy Carpenter and Oliver Wyman, Marsh & McLennan helps clients navigate an increasingly dynamic and complex environment. For more information, visit www.mercer.com. Follow Mercer on Twitter @Mercer.
welcome to brighter SAMPLE

SAMPLE