Embed Size (px)
Citation preview

2021 Sales Ratio Study Criteria 1
2021 Sales Ratio Criteria Issued October 2020
Property Tax Data & Analysis Unit

2021 Sales Ratio Study Criteria 2
Table of Contents Table of Contents ............................................................................................................................................. 2
Changes for the 2021 Study .............................................................................................................................. 4
Items of Note ................................................................................................................................................... 4
Overview of the Sales Ratio Study .................................................................................................................... 5
State Board of Equalization ................................................................................................................................... 5
Tax Court ................................................................................................................................................................ 6
Adjusted Net Tax Capacities .................................................................................................................................. 8
Railroad and Utility Equalization ............................................................................................................................ 8
Economic Market Values ....................................................................................................................................... 8
Sales Ratio Methodology ................................................................................................................................. 8
Sales Reporting ...................................................................................................................................................... 9
eCRV Submission Timeline ................................................................................................................................ 9
Primary Parcel ID for Multi-Parcel Sales ............................................................................................................ 9
Combining multiple eCRVs into one good sale: ................................................................................................ 9
Determining Sales Ratio Property Types ......................................................................................................... 10
Reporting Special Assessments ....................................................................................................................... 13
Reporting Water Value Influence .................................................................................................................... 13
Rejecting Sales from the Study ........................................................................................................................ 14
Sales Listings .................................................................................................................................................... 16
PRISM Reporting .................................................................................................................................................. 17
Sale Price Adjustments ........................................................................................................................................ 18
Financing Adjustments .................................................................................................................................... 18
EMV Adjustments ................................................................................................................................................ 19
Net Improvements .......................................................................................................................................... 20
Exempt Value ................................................................................................................................................... 22
Stratification ........................................................................................................................................................ 22
Property Types ................................................................................................................................................. 22
Property Type Aggregations ............................................................................................................................ 25
2020 Sales Ratio Study Criteria 3
Regions ............................................................................................................................................................ 27
Determining Extremes ......................................................................................................................................... 29
Market Condition Trends ..................................................................................................................................... 31
Trend Appeals .................................................................................................................................................. 33
Market Condition Adjustments ........................................................................................................................... 34
Market Condition Adjustment Examples ........................................................................................................ 35
Ratios ................................................................................................................................................................... 36
Preliminary Ratios............................................................................................................................................ 36
Final Ratios ...................................................................................................................................................... 37
Assessment Statistics ........................................................................................................................................... 37
Price Related Differential ................................................................................................................................ 37
Price Related Bias ............................................................................................................................................ 38
Small Sample Study .............................................................................................................................................. 40
Reports .......................................................................................................................................................... 41
2021 Study Timeline ....................................................................................................................................... 43
Reject Reason Definitions .............................................................................................................................. 44
Joint City Regions ........................................................................................................................................... 53
Agricultural/Rural Vacant Region Map ........................................................................................................... 57

2020 Sales Ratio Study Criteria 4
Changes for the 2021 Study • Final Extremes are no longer calculated. All ratios will be included in the statistics calculations.
Extremes will continue to be calculated for Market Condition Trends only.
• A flow chart has been added to show how Commercial and Industrial sales are used to determine Tax Court ratios.
• Commercial / Industrial Aggregation (PT94) definition has been added to the Property Types Aggregations table.
Items of Note • The 2021 criteria should be used to code eCRV sales from October 1, 2020 – September 30, 2021, but
the study methodology (e.g., calculating trends, ratios and extremes) applies to sales from January 1, 2020 – September 30, 2021. The criteria for coding eCRVs from January 1, 2020 – Sept 30, 2020 can be found in the 2020 criteria.
• Mean Ratio, and Aggregate Mean Ratio have been removed from the Ratio Print reports. These measures were also removed in the 2020 Study reports.

2020 Sales Ratio Study Criteria 5
Overview of the Sales Ratio Study In order to evaluate the accuracy and uniformity of assessments within the state and to ensure compliance with property tax laws, the Minnesota Department of Revenue conducts an annual sales ratio study. The Sales Ratio Study is required by Minnesota Statute 270.12. The study measures the relationship between appraised values and actual sale prices, indicating both of the level of assessment (how close appraisals are to market value on an overall basis) and the uniformity of assessment (how close individual ratios are to the median ratio and each other). As a mathematical expression, a sales ratio is the assessor’s estimated market value (EMV) of a property divided by its sales price, as seen here:
Sales Ratio = Assessor's Estimated Market Value
Sales Price
The Sales Ratio Study is the culmination of the ongoing process of collecting and verifying sales information. The State of Minnesota requires the reporting of sales information on an electronic Certificate of Real Estate Value (eCRV) in Minnesota Statute 272.115. Assessors must verify and review sales information reported through eCRV before it can be used in the study. Sales must meet certain criteria to be included in the study, and these criteria are outlined in this document. These sales are then summarized and analyzed to make generalizations about the market and the assessment for the Sales Ratio Study. The Department of Revenue’s Property Tax Data & Analysis Unit, and Property Tax Compliance Officers (PTCOs) perform and review the Sales Ratio Study, working closing with county assessors and staff.
The Sales Ratio Study is primarily used for the following purposes:
• State Board of Equalization • Tax Court
• Adjusted Net Tax Capacities • Railroad and Utility Equalization
• Economic Market Values
More information on how sales are studied for each of these purposes can be found in the following sections.
Beyond its primary uses, information from the study can be used for many other purposes. The study provides assessors with important information for refining the upcoming assessment, evaluating the existing assessment, and identifying inequities in an assessment. Legislators use information from the study when developing tax policy. Property owners may also use the studies if they have concerns about unfair or inequitable treatment by their assessor.
State Board of Equalization
The Minnesota State Board of Equalization uses a 12-month forward-adjusted study to review overall levels of assessment. The study period for the 2021 State Board of Equalization study is October 1, 2020 through September 30, 2021. This study adjusts sale prices by a determined market trend to estimate what the ratio

2020 Sales Ratio Study Criteria 6
would be if the sale took place January 2, 2022. The State Board of Equalization study determines the median sales ratio for each jurisdiction by property type.
The Commissioner of Revenue constitutes the State Board of Equalization, and in that capacity is empowered to reduce disparities in assessment levels between counties and among the property types within counties. When the State Board of Equalization determines that there has been an unfair or inequitable assessment, the Commissioner is authorized under Minnesota Statute 270C.94 to order a reassessment of any jurisdiction in order to make a correction.
Tax Court
The Minnesota Tax Court uses both a 9-month and a 12-month study when reviewing property valuation cases under Minnesota Statute 278.05. The study period for the 2021 9-month Tax Court study is January 1, 2021 through September 30, 2021. The study period for the 2021 12-month Tax Court study is October 1, 2020 through September 30, 2021. For both of these studies, sales prices are adjusted by a determined market trend to estimate what the ratio would be if the sale took place on January 2, 2021. The Tax Court study determines the median sales ratio for each jurisdiction by property type.
The Tax Court uses the Tax Court studies to measure unequal levels of assessment within property types. The Tax Court prefers to use the 9-month study, for which all sales are backward-adjusted, because all sales occur after the assessment date.
When determining Tax Court ratios, separate commercial and industrial ratios will be determined if each of these property types have at least 6 sales. However, if both of those property types do not have at least 6 sales, a combined ratio (PT 94) will be determined based on the combination of those property types.

2020 Sales Ratio Study Criteria 7

2020 Sales Ratio Study Criteria 8
Adjusted Net Tax Capacities
The Department of Revenue uses a 21-month backward-adjusted study to calculate adjusted net tax capacities (ANTCs), as established by Minnesota Statute 273.1325. The study period for the 2021 21-month ANTC study is January 1, 2020 through September 30, 2021. This study adjusts all sales that occur in 2020 backward to January 2, 2020 and all sales that occur from January 1, 2021 through September 30, 2021 backward to January 2, 2021 using a determined market trend to estimate what the ratio would be if the sale took place at the time of assessment. A weighted median sales ratio for each jurisdiction is calculated to be used for school and local government aid calculations as well as a variety of levy apportionments.
Railroad and Utility Equalization
The Department of Revenue uses a 12-month forward-adjusted study to equalize railroad and utility values under Minnesota Statute 270.86. The study period for the 2021 State Board of Equalization study is October 1, 2020 through September 30, 2021. This study adjusts sale prices by a determined market trend to estimate what the ratio would be if the sale took place at the time of assessment (January 2, 2022). The Railroad & Utility Equalization study uses a median sales ratio of all commercial and industrial sales by county.
Economic Market Values
The Department of Revenue uses a 12-month study to calculate a jurisdiction/s economic market value (EcMV). The study period for the 2021 EcMV study is October 1, 2020 through September 30, 2021. This study adjusts sale prices by a determined market trend to estimate what the ratio would be if the sale took place on January 2, 2021. Median sales ratios by property type for each jurisdiction are used to calculate a weighted market value for the jurisdiction. Bonding companies use the EcMV to measure fiscal capacities for bond rating calculations.
Sales Ratio Methodology This section describes the methodology employed by the Department of Revenue to perform the Sales Ratio Study, from collecting sale information to issuing final ratios. This methodology applies to all uses of the Sales Ratio Study outlined in Overview of the Sales Ratio Study. Any differences in the methodology between uses will be noted. The 2021 Sales Ratio Study will analyze sales that occurred between January 1, 2020 and September 30, 2021.
The methodology can be broken down into several steps. The Department of Revenue collects sale information through eCRV and assessment information through PRISM. The sale price of a property reported in eCRV and the EMV of a property reported in PRISM are used to calculate a sales ratio for each sale. Sale prices may be adjusted based on the terms of the sale, and EMVs may be adjusted based on the presence of net improvement and/or exempt value. Sales are then stratified into representative groups based on their property type, county, city/township, and water influence status. Outlier sales within these representative groups are identified as extreme. A market condition trend is then determined for each representative group. If there is evidence of a

2020 Sales Ratio Study Criteria 9
market condition trend for a representative group, the trend will be applied to the sale prices of all sales in that group in order to determine what the prices would have been if the sale had occurred in January 2022. These adjusted sale prices are then compared to EMVs to determine each sales ratio, which are then aggregated and analyzed by county, city/township, property type, and water influence status. Each of these steps are further detailed in the following sections.
Sales Reporting
Sales information is the basis of the Sales Ratio Study. In Minnesota, all real estate transactions over $1,000 must be reported on an electronic Certificate of Real Estate Value (eCRV) according to Minnesota Statute 272.115. On January 1, 2021, this consideration amount will increase to $3,000.
Counties and the Department of Revenue use the sale information reported on an eCRV to verify the sale, determine the sale’s eligibility for the study, and perform the Sales Ratio Study.
The following sections will define how sales information should be reported and how it will be used in the study.
eCRV Submission Timeline
The 2021 Sales Ratio Study will include sales that occurred from January 1, 2020 through September 30, 2021. For sales that occur in this period, only those sales with an eCRV that is accepted by the county by November 1, 2021 will be included in the 2021 Study. Note that sales that do not meet this deadline for the 2021 Study will still be used in the 21-month studies of the 2022 Sales Ratio Study, assuming they meet all other criteria.
Sales included in the 2021 Study must be submitted to the Department of Revenue by 5 p.m., November 10, 2021. This deadline is necessary to allow county assessors and PTCOs sufficient time to review the reports issued by the Department of Revenue, for counties to appeal applied market condition trends, and for the Department’s appeals panel to meet and review appeals. See Trend Appeals for more information on the appeals process.
More information on eCRV can be found on the Department’s website.
Primary Parcel ID for Multi-Parcel Sales
If there are multiple parcels included in a sale, the county must identify which parcel is the primary parcel. The primary parcel ID for the sale will appear on the county sales listing. It is important that all non-primary parcels are also reported on eCRV so that the Department of Revenue can accurately determine the total EMV for the sale. See Sales Listings for more information.
Combining multiple eCRVs into one good sale:
When a property sells with two or more eCRVs they may be combined into one “good” sale. To determine if the eCRVs should be combined, consider the following:

2020 Sales Ratio Study Criteria 10
• If one of the deed types is subject to a possible finance adjustment (i.e. CD) and the other is not (i.e. WD), then the two eCRVs should not be combined.
• The purchase price needs to have been negotiated as a group, and not as individual owners (county will need to verify this).
• A note needs to be made on each eCRV that clearly explains that the county has combined this eCRV# with another eCRV# to make one good sale.
• The sale/s that are combined with the another eCRV will need to be rejected (Reject reason 4). The single combined eCRV must reflect all of the information from the individual eCRVs. Combine totals for: parcel numbers, sales price, deeded acres, tillable acres, structures, conservation data, etc. Do not include legal descriptions and buyer/seller names.
An optional text box is available when a county accepts a sale for the state study. This is where you can state what eCRV numbers and values were combined with this sale. We do not want this information only in workflow notes so others may see it.
Determining Sales Ratio Property Types
Property types are determined for each sale based on the information reported on the eCRV. Each sale can only be assigned one sales ratio property type. Accurate reporting of the following fields is critical for ensuring that sales get assigned the correct sales ratio property type:
• Property Type Group—County tab, under Property Types
The Property Type Group describes generally the type of property included in the sale. For guidance on classifying commercial or industrial sales, see Reporting Commercial and Industrial Sales.
• Primary Type for Study Indicator—County tab, under Property Types
This indicator determines which Property Type Group reported for a sale will be used to determine the sales ratio property type. Generally, the Property Type Group with the most value should be the primary type, but there are many exceptions to this rule. Contact your PTCO with any questions.
• Land/Building Indicator—Property tab, under Property Description Questions
This indicator describes whether Land and Buildings, Land only, or Buildings only were included in the sale, to determine if the sale should classified as a bare land sales ratio property type.
• Deeded Acres—Property tab or County tab, under County Data
The deeded acres field describes whether an agricultural/rural vacant sale is more or less than 34.5 acres. This field is necessary only for agricultural and rural vacant sales.
• Agricultural Classification Acreage—County tab, under Property Types
For sales with both agricultural and rural vacant property types, the acreage amounts from the classification table will used to determine whether a sale is considered 2a, 2b, or mixed. This table is necessary only for agricultural and rural vacant sales. For guidance on classifying 2a and 2b land, see Reporting Agricultural and Rural Vacant Sales.

2020 Sales Ratio Study Criteria 11
For a list and description of the sales ratio property types, see Property Types. The Sales Ratio Property Types document on our website describes how information from eCRV is translated into sales ratio property types.
If the Department of Revenue cannot determine the sales ratio property type from the information reported on the eCRV, the sale will be flagged on the county’s sales listing for further review. See Sales Listings for more information.
Reporting Commercial and Industrial Sales
It can sometimes be difficult to classify a property as either commercial or industrial. In an effort to ensure that sales are classified consistently across the state and to provide clarity to counties, the Department of Revenue recommends the following property uses be classified as Industrial for the Sales Ratio Study:
• Self/mini-storage • Warehouses, including general, distribution, office, R&D/engineering, refrigerated, computer/data,
and transit • Manufacturing, including food processing, agribusiness related, high tech, general light, and general
heavy
• Energy (not utility), including fuel production, fuel storage, refinery, wind energy conversion systems, and solar energy conversion systems
• Grain elevators • Mineral deposits
• Gravel pits • Waste/recycling
Any use not listed above should be considered commercial for the Sales Ratio Study. Deviations from these recommendations are allowed with an explanation in eCRV. Consult with your PTCO on any questionable properties.
A change in use from commercial to industrial or industrial to commercial should not be rejected as a use change, as both uses reside with the same class (3a). Within eCRV, under the County Tab > Property Types, the ‘Property Type Group’ should be based on the Buyer’s planned use of the property. As always if there are extenuating circumstances with a sale, contact your PTCO.
Sales of Property with both Commercial and Industrial use
Sales of properties with both commercial and industrial use, shall be placed in the property type (commercial or industrial) in which the majority of the value is assigned. Properties where a single building includes both a commercial and industrial use shall be classed according to the predominant use of the building, either all commercial or all industrial. Properties containing multiple buildings may be classed by individual building as above. For example, a property having a mini-storage and a convenience store on the same parcel, would require a split class, commercial/industrial.
2020 Sales Ratio Study Criteria 12
Reporting Agricultural and Rural Vacant Sales
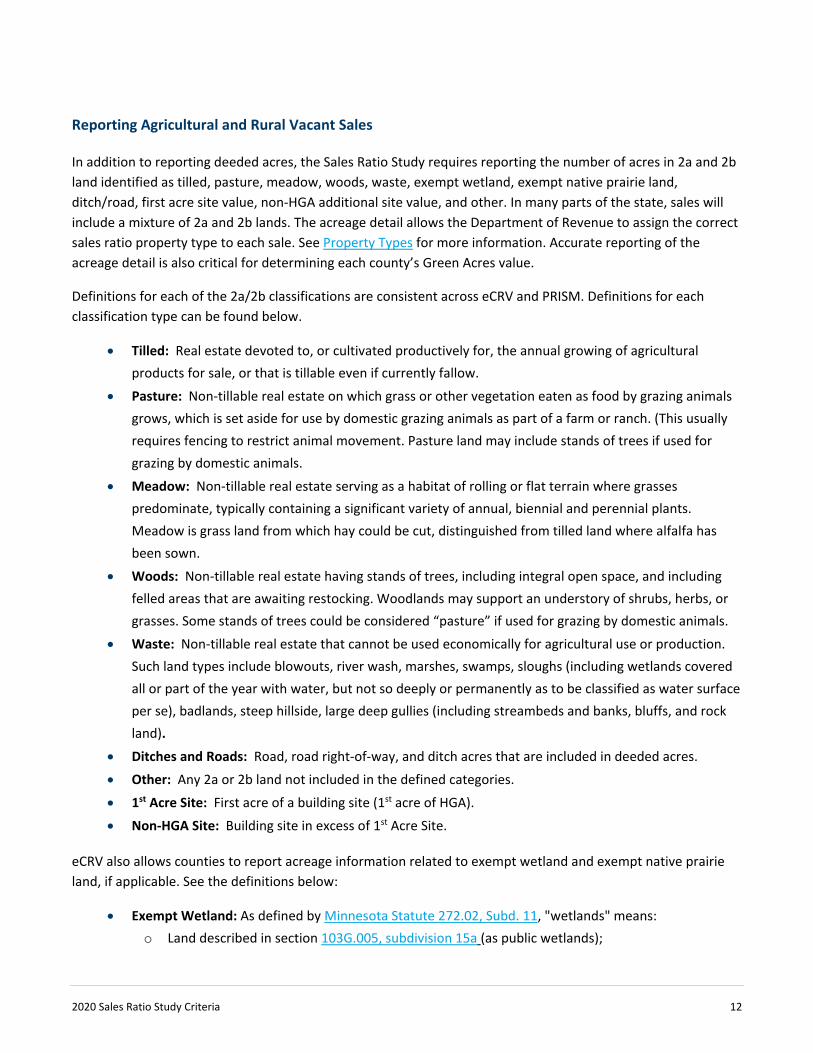
In addition to reporting deeded acres, the Sales Ratio Study requires reporting the number of acres in 2a and 2b land identified as tilled, pasture, meadow, woods, waste, exempt wetland, exempt native prairie land, ditch/road, first acre site value, non-HGA additional site value, and other. In many parts of the state, sales will include a mixture of 2a and 2b lands. The acreage detail allows the Department of Revenue to assign the correct sales ratio property type to each sale. See Property Types for more information. Accurate reporting of the acreage detail is also critical for determining each county’s Green Acres value.
Definitions for each of the 2a/2b classifications are consistent across eCRV and PRISM. Definitions for each classification type can be found below.
• Tilled: Real estate devoted to, or cultivated productively for, the annual growing of agricultural products for sale, or that is tillable even if currently fallow.
• Pasture: Non-tillable real estate on which grass or other vegetation eaten as food by grazing animals grows, which is set aside for use by domestic grazing animals as part of a farm or ranch. (This usually requires fencing to restrict animal movement. Pasture land may include stands of trees if used for grazing by domestic animals.
• Meadow: Non-tillable real estate serving as a habitat of rolling or flat terrain where grasses predominate, typically containing a significant variety of annual, biennial and perennial plants. Meadow is grass land from which hay could be cut, distinguished from tilled land where alfalfa has been sown.
• Woods: Non-tillable real estate having stands of trees, including integral open space, and including felled areas that are awaiting restocking. Woodlands may support an understory of shrubs, herbs, or grasses. Some stands of trees could be considered “pasture” if used for grazing by domestic animals.
• Waste: Non-tillable real estate that cannot be used economically for agricultural use or production. Such land types include blowouts, river wash, marshes, swamps, sloughs (including wetlands covered all or part of the year with water, but not so deeply or permanently as to be classified as water surface per se), badlands, steep hillside, large deep gullies (including streambeds and banks, bluffs, and rock land).
• Ditches and Roads: Road, road right-of-way, and ditch acres that are included in deeded acres. • Other: Any 2a or 2b land not included in the defined categories.
• 1st Acre Site: First acre of a building site (1st acre of HGA). • Non-HGA Site: Building site in excess of 1st Acre Site.
eCRV also allows counties to report acreage information related to exempt wetland and exempt native prairie land, if applicable. See the definitions below:
• Exempt Wetland: As defined by Minnesota Statute 272.02, Subd. 11, "wetlands" means: o Land described in section 103G.005, subdivision 15a (as public wetlands);

2020 Sales Ratio Study Criteria 13
o Land which is mostly under water, produces little if any income, and has no use except for wildlife or water conservation purposes, provided it is preserved in its natural condition and drainage of it would be legal, feasible, and economically practical for the production of livestock, dairy animals, poultry, fruit, vegetables, forage and grains, except wild rice; or
o Land in a wetland preservation area under sections 103F.612 to 103F.616.
"Wetlands" under clauses (i) and (ii) include adjacent land which is not suitable for agricultural purposes due to the presence of the wetlands, but do not include woody swamps containing shrubs or trees, wet meadows, meandered water, streams, rivers, and floodplains or river bottoms.
• Exempt Native Prairie: Land defined by Minnesota Statute 272.02, Subd. 12, and determined by the Commissioner of the Department of Natural Resources as native prairie. Pasture land used for livestock grazing purposes is not considered native prairie.
Reporting Special Assessments
In most cases, the inclusion of special assessments in the study can complicate the determination of the sale price without significantly improving accuracy. Special assessments for a sale should only be reported in eCRV if the buyer paid off delinquent special assessments and delinquent taxes owed on the property. These are costs that the buyer assumes in order to complete the transaction and are necessary for understanding the terms of the sale. Current and future special assessments that the buyer pays are generally considered the cost of owning the property rather than the cost of buying the property and do not need to be reported. This field can be found on the Sales Agreement tab of eCRV.
There may be special circumstances in which non-delinquent special assessments should be reported. Discuss any non-delinquent special assessments that should be included in the study of the sale with your PTCO. A manual adjustment to the sale price can be made for any buyer paid special assessments that had a known effect on the sale price. See Sale Price Adjustments for information on how special assessments are used in the study.
Reporting Water Value Influence
If the sale was influenced by the presence of water, water value influence must be reported on eCRV. Water value influence is necessary to determine whether a sale should be considered on-water or off-water for the purposes of the Sales Ratio Study (see Regions for more information on how water influence affects the study). This field can be found on the County tab, under Property Attributes. The available water influence options are defined below, including how they are used in the Sales Ratio Study. These definitions are consistent with PRISM water codes.
• Lake: Sale of a property physically located on, or having immediate access to, a lake with a valid DNR Water Code. This includes properties with egress accessibility, properties located across the road with a dock, and properties with shared immediate access and views. These sales will be considered on-water for the Sales Ratio Study.
2020 Sales Ratio Study Criteria 14
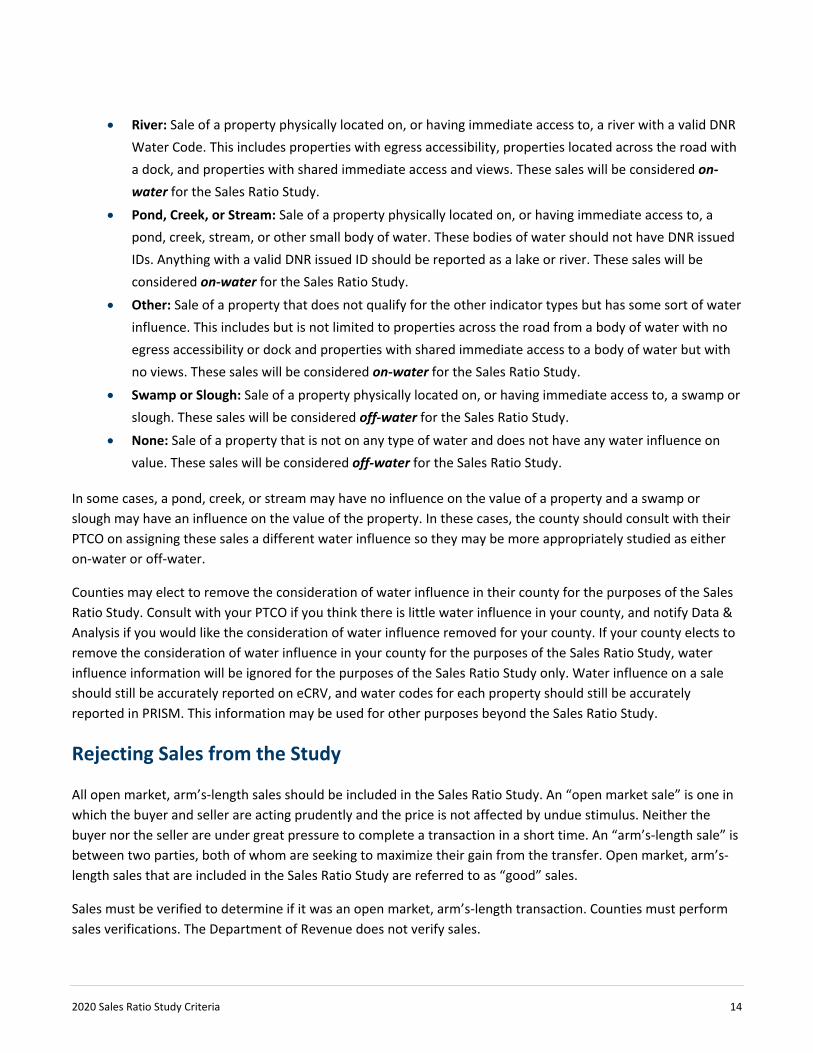
• River: Sale of a property physically located on, or having immediate access to, a river with a valid DNR Water Code. This includes properties with egress accessibility, properties located across the road with a dock, and properties with shared immediate access and views. These sales will be considered on-water for the Sales Ratio Study.
• Pond, Creek, or Stream: Sale of a property physically located on, or having immediate access to, a pond, creek, stream, or other small body of water. These bodies of water should not have DNR issued IDs. Anything with a valid DNR issued ID should be reported as a lake or river. These sales will be considered on-water for the Sales Ratio Study.
• Other: Sale of a property that does not qualify for the other indicator types but has some sort of water influence. This includes but is not limited to properties across the road from a body of water with no egress accessibility or dock and properties with shared immediate access to a body of water but with no views. These sales will be considered on-water for the Sales Ratio Study.
• Swamp or Slough: Sale of a property physically located on, or having immediate access to, a swamp or slough. These sales will be considered off-water for the Sales Ratio Study.
• None: Sale of a property that is not on any type of water and does not have any water influence on value. These sales will be considered off-water for the Sales Ratio Study.
In some cases, a pond, creek, or stream may have no influence on the value of a property and a swamp or slough may have an influence on the value of the property. In these cases, the county should consult with their PTCO on assigning these sales a different water influence so they may be more appropriately studied as either on-water or off-water.
Counties may elect to remove the consideration of water influence in their county for the purposes of the Sales Ratio Study. Consult with your PTCO if you think there is little water influence in your county, and notify Data & Analysis if you would like the consideration of water influence removed for your county. If your county elects to remove the consideration of water influence in your county for the purposes of the Sales Ratio Study, water influence information will be ignored for the purposes of the Sales Ratio Study only. Water influence on a sale should still be accurately reported on eCRV, and water codes for each property should still be accurately reported in PRISM. This information may be used for other purposes beyond the Sales Ratio Study.
Rejecting Sales from the Study
All open market, arm’s-length sales should be included in the Sales Ratio Study. An “open market sale” is one in which the buyer and seller are acting prudently and the price is not affected by undue stimulus. Neither the buyer nor the seller are under great pressure to complete a transaction in a short time. An “arm’s-length sale” is between two parties, both of whom are seeking to maximize their gain from the transfer. Open market, arm’s-length sales that are included in the Sales Ratio Study are referred to as “good” sales.
Sales must be verified to determine if it was an open market, arm’s-length transaction. Counties must perform sales verifications. The Department of Revenue does not verify sales.
2020 Sales Ratio Study Criteria 15
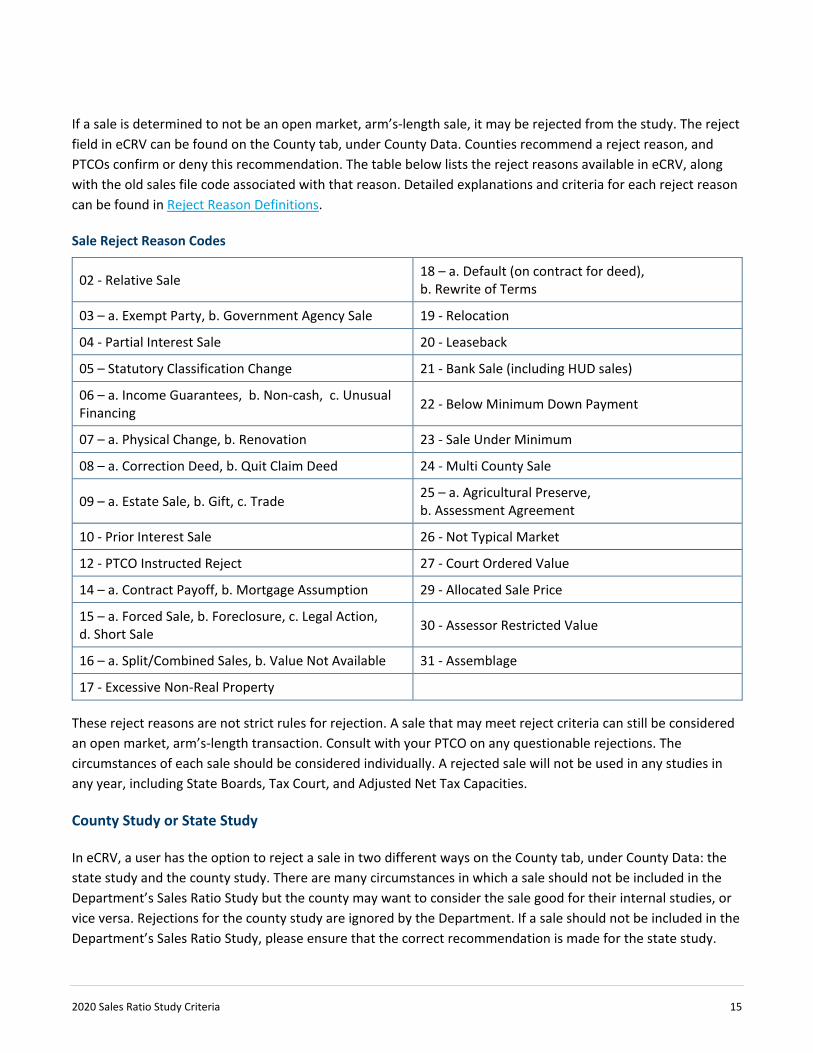
If a sale is determined to not be an open market, arm’s-length sale, it may be rejected from the study. The reject field in eCRV can be found on the County tab, under County Data. Counties recommend a reject reason, and PTCOs confirm or deny this recommendation. The table below lists the reject reasons available in eCRV, along with the old sales file code associated with that reason. Detailed explanations and criteria for each reject reason can be found in Reject Reason Definitions.
Sale Reject Reason Codes
02 - Relative Sale 18 – a. Default (on contract for deed), b. Rewrite of Terms
03 – a. Exempt Party, b. Government Agency Sale 19 - Relocation
04 - Partial Interest Sale 20 - Leaseback
05 – Statutory Classification Change 21 - Bank Sale (including HUD sales)
06 – a. Income Guarantees, b. Non-cash, c. Unusual Financing 22 - Below Minimum Down Payment
07 – a. Physical Change, b. Renovation 23 - Sale Under Minimum
08 – a. Correction Deed, b. Quit Claim Deed 24 - Multi County Sale
09 – a. Estate Sale, b. Gift, c. Trade 25 – a. Agricultural Preserve, b. Assessment Agreement
10 - Prior Interest Sale 26 - Not Typical Market
12 - PTCO Instructed Reject 27 - Court Ordered Value
14 – a. Contract Payoff, b. Mortgage Assumption 29 - Allocated Sale Price
15 – a. Forced Sale, b. Foreclosure, c. Legal Action, d. Short Sale 30 - Assessor Restricted Value
16 – a. Split/Combined Sales, b. Value Not Available 31 - Assemblage
17 - Excessive Non-Real Property
These reject reasons are not strict rules for rejection. A sale that may meet reject criteria can still be considered an open market, arm’s-length transaction. Consult with your PTCO on any questionable rejections. The circumstances of each sale should be considered individually. A rejected sale will not be used in any studies in any year, including State Boards, Tax Court, and Adjusted Net Tax Capacities.
County Study or State Study
In eCRV, a user has the option to reject a sale in two different ways on the County tab, under County Data: the state study and the county study. There are many circumstances in which a sale should not be included in the Department’s Sales Ratio Study but the county may want to consider the sale good for their internal studies, or vice versa. Rejections for the county study are ignored by the Department. If a sale should not be included in the Department’s Sales Ratio Study, please ensure that the correct recommendation is made for the state study.
2020 Sales Ratio Study Criteria 16
Split Sales
Agricultural and rural vacant split sales should be included in the Sales Ratio Study. For example, if a farmer sells 40 acres from a 160-acre farm, this would be considered a good split sale. Agricultural and rural vacant split sales consisting of fewer than 34.5 acres should NOT be included in the study. Split sales that are not agricultural or rural vacant should also be rejected from the study.
When a good split sale occurs, the county assessor must ensure that the value is split promptly and a new parcel ID is assigned so that these sales can be properly analyzed for the study.
Resales
If a property sells more than once within the study period, only the most recent good sale is included in the study. Older sales will be automatically removed from the study by the Department of Revenue based on matching parcel IDs. The county should not reject resales in eCRV if they were otherwise good, open market, and arm’s-length transactions.
Net Improvements
There are certain situations where, due to net improvements on the property, a sale price cannot be reasonably compared to the necessary EMVs. In the following situations, the sale should be rejected from the study:
• If net improvements occurred after the assessment date but before the sale, the sale should be rejected. In these cases, the assessed net improvement amount may be affected by the sale price so the study cannot accurately measure a county’s assessing level.
• If the sale occurred between October 2020 and December 2020 and net improvements occurred after the sale but before the 2021 assessment, the sale should be rejected. If these sales were accepted, the 2022 EMV would have to be adjusted by 2020 net improvement value which might have been impacted by market forces in the 12+ months since the improvement.
• Only positive Net Improvements should be entered.
For more information, see the Net Improvement EMV Adjustments flow chart, which describes whether a sale with net improvements should be accepted or rejected, and how the accepted sales will be adjusted.
Sales that occurred between January 2020 and September 2020 were already accepted or rejected in the 2020 Study. Those accepts and rejects still apply for the 2021 study.
Sales Listings
The Department of Revenue compiles the information reported through eCRV into sales listings for each county for all good sales in the study period. These sales listings are issued to each county regularly to represent the data that the Department will use to perform the study. It is each county’s responsibility to ensure that the appropriate sales are being included in the study and that the information for each sale is correct. Data & Analysis performs audits on all sale data to help identify and flag sales that may require additional review. These

2020 Sales Ratio Study Criteria 17
flags will also be displayed on the sales listing. See the Sales Listing Companion document for more details about the information provided on the sales listings. Counties should notify their PTCO of errors on the listing as early as possible so that they can be corrected in eCRV.
A listing of rejected sales will also be created for each county for the study period.
PRISM Reporting
Counties are required to send the Department of Revenue four parcel-level PRISM files each year. Parcel information from PRISM is matched with sale information from eCRV based on parcel ID.
Land, building, and net improvement EMVs from the following PRISM files will be used in the 2021 Sales Ratio Study:
• PRISM Submission 2: 2020 Adjusted Assessment. The EMVs on this file will be used to calculate market condition trends. See Market Condition Trends for more information.
• PRISM Submission 2: 2021 Adjusted Assessment. The EMVs on this file will be used to calculate preliminary ratios. See Preliminary Ratios for more information.
• PRISM Submission 1: 2022 Preliminary Assessment. The EMVs on this file will be used to calculate final ratios. See Final Ratios for more information.
Exempt values reported on these PRISM files will also be used in the 2021 Study. Exempt values are only required to be reported to the Department of Revenue every six years on PRISM Submission 2. The last exempt reporting year was 2018 and the next is 2023. However, counties have the option to report exempt values on PRISM Submission 2 in any year.
If a county reports exempt values on any given Submission 2, those values will be used to adjust EMVs. See EMV Adjustments for more information on what is adjusted and when. If a county chooses to report exempt values in a non-required reporting year, there is no requirement that the values be updated from the last required reporting year. Choosing to report exempt values in non-required years may help counties reduce time spent editing sales information for the study and will improve the accuracy of the Sales Ratio Study.
The county should pay particular attention to the EMVs on their sales listing. EMVs reported in PRISM can be overridden for Sales Ratio Study purposes in eCRV. Notify your PTCO if an EMV needs to be changed in eCRV. Exempt values will not be added to EMVs overridden in eCRV. If there is exempt value that should be included in the EMV for the purposes of comparing the assessed value to the sale price, the value should be entered into eCRV under an “Exempt” Property Type Group on the County tab, under Property Types.
For more information on PRISM, see the PRISM webpage. Please notify Data & Analysis if you would like to see other PRISM information on the sales listings.

2020 Sales Ratio Study Criteria 18
Sale Price Adjustments
In order to determine a market sales price, the Department of Revenue may adjust a sale’s gross sale price by several factors included in the terms and financing of the sale. These adjustments allow the sale price to be compared to the assessor’s EMV.
The net sale price is the gross sale price after adjusting for the terms and financing of the sale. See the equation for net sale price below.
Net sale price = Gross sale price − personal property − seller paid points +delinquent special assessments and delinquent taxes paid by buyer +financing adjustments
Gross sale price, personal property, seller paid points, and delinquent special assessments and delinquent taxes paid by buyer are reported directly on the Sales Agreement tab of eCRV. See Reporting Special Assessments for details on which special assessments should be reported on eCRV. Financing adjustments are determined by the Department of Revenue based on financing arrangements reported on the Sales Agreement tab of eCRV. See the following Financing Adjustments section for more information on when and how these financing adjustments are made.
The net sale price is used in all ratio calculations, including those ratios used to determine market condition trends. Once the market condition trend is determined, it is applied to the net sale price. See Market Condition Trends and Ratios for more information on these calculations.
Financing Adjustments
Minnesota Statute 270.12 requires that financing adjustments are made when performing the Sales Ratio Study. The Department of Revenue calculates a financing adjustment for sales with non-market financing in order to estimate what the sale price would have been with market financing. Any sale with an assumed mortgage or a contract for deed will be considered for a financing adjustment.
Financing adjustments are based on basic present value equations. The Department determines the present value of payments using the market rate rather than the contract rate over the length of the contract. This can be replicated in Excel using the following formula:
=PV(rate/p, nper, pmt)
• Rate is the market rate. Market rates are published on the Department of Revenue’s Interest Rate Bulletin.
• P is the annual number of payments. If the contract calls for annual payments, this number will be 1. If semiannual, 2. If quarterly, 4. If monthly, 12.

2020 Sales Ratio Study Criteria 19
• Nper is the total number of payments that will be made over the length of the contract.
• Pmt is the payment amount.
If there are multiple financing arrangements, the present value must be calculated for each arrangement.
If there is a balloon payment, the present value of the balloon payment is determined using the following formula, where “# of Years” is the number of years between the original contract date and the date of the balloon payment:
𝑃𝑃𝑃𝑃𝐵𝐵𝐵𝐵𝐵𝐵𝐵𝐵𝐵𝐵𝐵𝐵𝑜𝑜 =𝐵𝐵𝐵𝐵𝐵𝐵𝐵𝐵𝐵𝐵𝐵𝐵𝐵𝐵 𝐴𝐴𝐴𝐴𝐵𝐵𝐴𝐴𝐵𝐵𝐴𝐴
(1 + 𝑀𝑀𝐵𝐵𝑀𝑀𝑀𝑀𝑀𝑀𝐴𝐴 𝑅𝑅𝐵𝐵𝐴𝐴𝑀𝑀)# 𝐵𝐵𝑜𝑜 𝑌𝑌𝑌𝑌𝐵𝐵𝑌𝑌𝑌𝑌
Once the present value is determined for each financing arrangement and the balloon payment (if applicable), the present values are summed for a total present value. The sum of the contract amounts for each arrangement is subtracted from the total present value to get the financing adjustment amount for the sale.
There are several conditions where a financing adjustment will not be automatically made on an assumed mortgage or contract for deed sale.
• The contract rate is within half a percentage point of the market rate. Market rates are published on the Department of Revenue’s Interest Rate Bulletin.
• The determined financing adjustment is less than 1% of the net sale price.
• There are more than two financing arrangements. • The payments are for “Principal Only” or “Interest Only” and no balloon payment is reported.
• The payment type or payment for is reported as “Other.”
While an automatic adjustment will not be made, sales that meet at least one of the last three conditions will be flagged on the sales listing. Counties should review these sales to determine a suitable financing adjustment, if any.
The Department’s automatic financing adjustments may not appropriate for specific sales, as determined during the sales verification process. In these cases, the adjustment can be manually overridden by the PTCO. Work with your PTCO to determine a more appropriate financing adjustment for these sales.
Interest Rate Bulletin
The Department of Revenue publishes market rates for the purposes of the Sales Ratio Study on the Interest Rate Bulletin. There are three separate rates for residential/seasonal residential recreational, agricultural/rural vacant, and commercial/industrial/apartment sales. This bulletin is updated quarterly.
EMV Adjustments
The Department of Revenue may adjust the assessor’s EMV for the purposes of the Sales Ratio Study in order to accurately compare the EMV to the net sale price. If there were net improvements on a property before or after
2020 Sales Ratio Study Criteria 20
the sale, that property’s EMV may be adjusted by the net improvement amount for particular years. If there are certain types of exempt property included in the sale, that exempt value may be added to the EMV. Each of these EMV adjustments are detailed below.
Net Improvements
If there were net improvements on a property that sells within the 2021 study period, certain EMVs may need to be adjusted by the net improvement amount in order to compare the EMV to the sale price. Net improvements that occur before January 2, 2020 and after January 2, 2022 do not affect EMV adjustments. The EMV Adjustments for Net Improvements Flow Chart describes when and how EMVs are adjusted for net improvements. A high resolution version of this flow chart is available on our website. Note that net improvements that occur during an assessment year are reported in the following assessment year, i.e. net improvements that occur in 2020 will be reported to the Department of Revenue in 2021 and will be called 2020 net improvements.
There are certain situations where these adjustments to the EMV cannot be made and the sale should be rejected. See Rejecting Sales from the Study for more information on when sales should be rejected for net improvements.
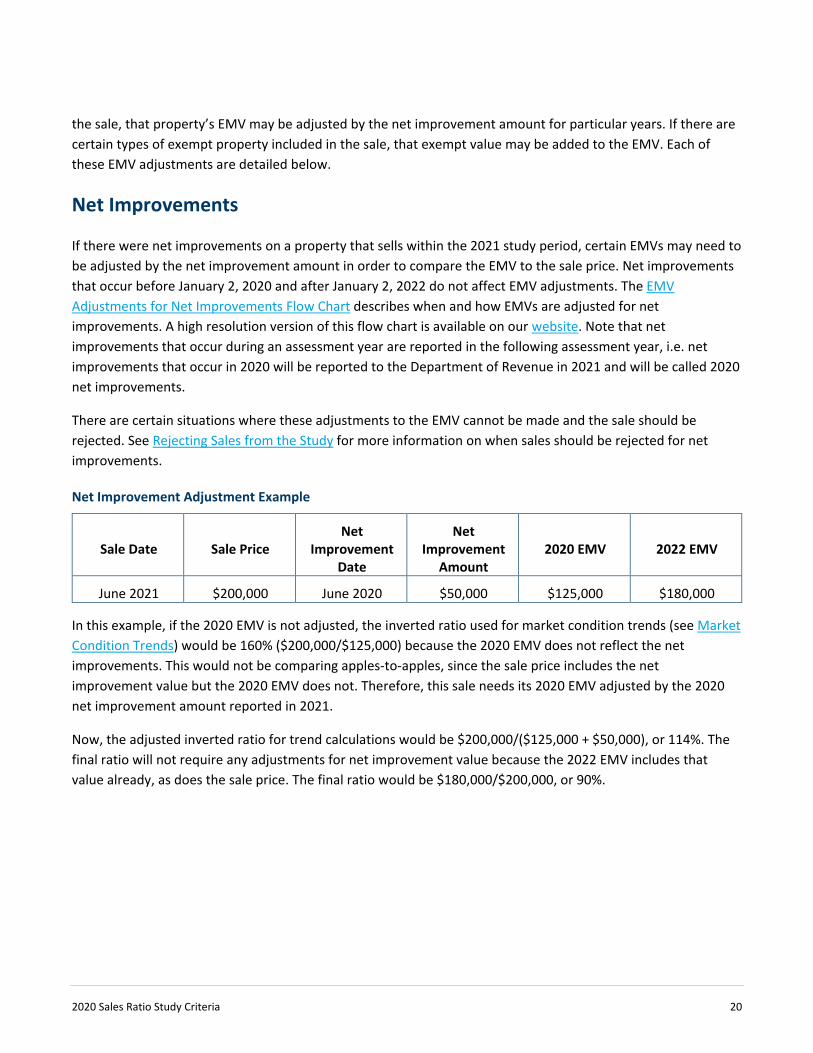
Net Improvement Adjustment Example
Sale Date Sale Price Net
Improvement Date
Net Improvement
Amount 2020 EMV 2022 EMV
June 2021 $200,000 June 2020 $50,000 $125,000 $180,000
In this example, if the 2020 EMV is not adjusted, the inverted ratio used for market condition trends (see Market Condition Trends) would be 160% ($200,000/$125,000) because the 2020 EMV does not reflect the net improvements. This would not be comparing apples-to-apples, since the sale price includes the net improvement value but the 2020 EMV does not. Therefore, this sale needs its 2020 EMV adjusted by the 2020 net improvement amount reported in 2021.
Now, the adjusted inverted ratio for trend calculations would be $200,000/($125,000 + $50,000), or 114%. The final ratio will not require any adjustments for net improvement value because the 2022 EMV includes that value already, as does the sale price. The final ratio would be $180,000/$200,000, or 90%.

2021 Sales Ratio Study Criteria 21

2021 Sales Ratio Study Criteria 22
Exempt Value
The EMVs reported through PRISM only describe the taxable property on a parcel. Therefore, in order to determine the total assessed value that should be compared to the sale price for a sales ratio, exempt value reported through PRISM may need to be added to the EMV reported through PRISM.
The value of the following types of exempt property will be used to adjust EMVs:
• Senior citizen facilities (PRISM code 0720) • Elderly living facilities (PRISM code 0780)
• Ag containment facilities (PRISM code 1010) • Manure pits (PRISM code 1020)
• Monosloped roofs (PRISM code 1040) • Wetlands (PRISM code 1100)
• Native prairie (PRISM code 1200)
Exempt values were required on 2020 PRISM Submission 2. The value of the above exempt types reported on 2020 PRISM Submission 2 will be added to the 2020 EMV. If a county chooses to report exempt values on their 2021 PRISM Submission 2, the value of the above exempt types reported on that file will be added to the 2021 EMV reported on the 2021 PRISM Submission 2 and to the 2022 EMV reported on the 2022 PRISM Submission 1.
Choosing to report exempt values in non-required years may help counties cut down on time spent editing sales information for the study and improve the accuracy of the Sales Ratio Study.
Exempt values will not be added to EMVs overridden in eCRV by the PTCO. If there is exempt value that should be included in the EMV for the purposes of comparing the assessed value to the sale price, the value should be entered into eCRV under an “Exempt” Property Type Group on the County tab, under Property Types.
Stratification
Sales within the 2021 study period are stratified into representative groups for market condition trend calculations and for ratio calculations. Stratification is based on each sale’s property type, city, county, and water status.
Property Types
The Department of Revenue determines each sale’s property type for the Sales Ratio Study based on information reported on eCRV. See Determining Sales Ratio Property Types for information on which eCRV fields are used to determine each sale’s sales ratio property type. The Sales Ratio Property Types table below lists the various property types that sales are sorted into. Each sale is only assigned one property type. The 2021 Sales Ratio Property Types document on our website describes how information from eCRV is translated into these property types. Each of these property types are then combined with like property types to form property type

2020 Sales Ratio Study Criteria 23
aggregations. These aggregations are the basis for determining market condition trends and ratios. See Property Type Aggregations for more information.
When determining if an agricultural and/or rural vacant sale should be considered 2a, 2b, or mixed 2a/2b for the purposes of assigning sales ratio property types, the Department will first consult the Agricultural Classification Acreage reported on the County tab, under Property Types on eCRV. If more than 75% of the acreage included in a sale is classified as 2a, the sale will be considered 2a. If more than 75% of the acreage included in a sale is classified as 2b, the sale will be considered 2b. A sale which is not at least 75% 2a acreage nor 75% 2b acreage will be considered mixed 2a/2b. If Agricultural Classification Acreage is not provided on eCRV, the primary Property Type Group as identified on the County tab, under Property Types on eCRV, will determine if a sale is considered 2a or 2b. However, if Agricultural Classification Acreage is not provided on eCRV, that sale will be flagged on the sales listing. This detail is necessary in order to compute each county’s Green Acres value.
When determining if an agricultural and/or rural vacant sale should be considered more or less than 34.5 acres, the Department will first consult the Deeded Acres field on eCRV, found on the Property tab or on the County tab, under County Data. If Deeded Acres is not provided on eCRV, the total Agricultural Classification Acreage will be used. If neither is provided, a property type cannot be determined and the sale will be flag on the county’s sales listing.

2020 Sales Ratio Study Criteria 24
Sales Ratio Property Types
Sales Ratio Property Type Code Sales Ratio Property Type Description
01 Residential (less than 4 units)
02 Apartments
03 Non-commercial seasonal residential recreational
06 Commercial
07 Industrial
08 Public utility
09 Railroads
10 Mineral
14 Seasonal recreational commercial and resorts
20 Personal property
21 Residential bare land
22 Apartment bare land
23 Seasonal recreational bare land
26 Commercial bare land
27 Industrial bare land
30 Exempt
31 Agriculture 2a - land with buildings more than 34.5 acres
32 Agriculture 2a - bare land more than 34.5 acres
33 Rural Vacant 2b - land with buildings more than 34.5 acres
34 Rural Vacant 2b - bare land more than 34.5 acres
35 Managed Forest 2c - bare land more than 34.5 acres
36 Agriculture 2a - land with buildings less than 34.5 acres
37 Agriculture 2a - bare land less than 34.5 acres
38 Rural Vacant 2b - land with buildings less than 34.5 acres
39 Rural Vacant 2b - bare land less than 34.5 acres
40 Managed Forest 2c - bare land less than 34.5 acres
47 Mixed 2a, 2b - land with buildings more than 34.5 acres
48 Mixed 2a, 2b - bare land more than 34.5 acres
49 Mixed 2a, 2b - land with buildings less than 34.5 acres
50 Mixed 2a, 2b - bare land less than 34.5 acres
51 Manufactured home parks
52 Short Term Rentals
2021 Sales Ratio Study Criteria 25
Property Type Aggregations
Various sales ratio property types are combined into like groups to form property type aggregations. The Sales Ratio Property Type Aggregation table below describes which property types are combined to form these aggregations. A high resolution version of this table is available on our website.
Market condition trends are determined based on the following property types/aggregations:
• 02 – Apartments
• 06 – Commercial • 07 – Industrial
• 91 – Residential/Seasonal Residential Recreational • 93 – Agricultural/Rural Vacant Bare Land
All of the sales in each of these property types will then be separated by region. See Regions for more information.
Note that some property types fall within more than one aggregation and some property types do not fall in an aggregation at all. The aggregations noted with an asterisk (*) in the table below include property types that also fall in the 93 aggregation. In those aggregations, sales that are also in the 93 aggregation will be adjusted by the 93 trend while all other sales in the aggregation will not be adjusted by a trend. The 96 aggregation is used as a catch-all aggregation for property types which are not used to calculate market condition trends and ratios. Although sales in the 96 aggregation will not be used in the Sales Ratio Study, they may be good sales studied in other ways.
If it is determined that the improvement value had minimal impact on the price paid for the land (general rule of thumb is 5% or less of the total EMV), these sales should be considered as land only sales (PT 93).

2020 Sales Ratio Study Criteria 26
Use Aggregation Code Aggregation Description Property Type Code Description
Ratio + Trend 02 Apartments 02 Apartments
Ratio + Trend 06 Commercial 06 Commercial
Ratio + Trend 07 Industrial 07 Industrial
Ratio 90 Bare Land LESS than 34.5 acres 2a, 2b, 2c, and mixed
37 Agriculture 2a - bare land less than 34.5 acres
39 Rural Vacant 2b - bare land less than 34.5 acres
40 Managed Forest 2c - bare land less than 34.5 acres
50 Mixed 2a, 2b - bare land less than 34.5 acres
Ratio + Trend 91 Residential/Seasonal Recreational Residential
01 Residential (less than 4 units)
03 Non-commercial seasonal residential recreational
Ratio 92* Bare Land MORE than 34.5 acres 2b, 2c, and mixed
34 Rural Vacant 2b - bare land more than 34.5 acres
35 Managed Forest 2c - bare land more than 34.5 acres
48 Mixed 2a, 2b - bare land more than 34.5 acres
Ratio + Trend 93 Bare Land MORE than 34.5 acres 2a, 2b, 2c and mixed
32 Agriculture 2a - bare land more than 34.5 acres
34 Rural Vacant 2b - bare land more than 34.5 acres
35 Managed Forest 2c - bare land more than 34.5 acres
48 Mixed 2a, Rural 2b - bare land more than 34.5 acres
Tax Court 94 Commercial / Industrial 06 Commercial
07 Industrial
Ratio + Trend 95*
Bare Land + Land with Buildings MORE than 34.5 acres 2a, 2b, 2c, and mixed
31 Agriculture 2a - land with buildings more than 34.5 acres
32 Agriculture 2a - bare land more than 34.5 acres
33 Rural Vacant 2b - land with buildings more than 34.5 acres
34 Rural Vacant 2b - bare land more than 34.5 acres
35 Managed Forest 2c - bare land more than 34.5 acres
47 Mixed 2a, 2b - land with buildings more than 34.5 acres
48 Mixed 2a, 2b - bare land more than 34.5 acres
NOT USED 96
Miscellaneous property type codes. Sales not included in ratios or trends
08 Public utility
09 Railroads
10 Mineral
14 Seasonal recreational commercial and resorts
20 Personal property
21 Residential bare land
22 Apartment bare land
23 Seasonal recreational bare land
26 Commercial bare land
27 Industrial bare land
30 Exempt
36 Agriculture 2a - land with buildings less than 34.5 acres
38 Rural Vacant 2b - land with buildings less than 34.5 acres
49 Mixed 2a, 2b - land with buildings less than 34.5 acres
51 Manufactured Home Parks
52 Short Term Rentals

2021 Sales Ratio Study Criteria 27
Regions
For the purpose of the Sales Ratio Study, regions are geographic areas that have been identified as having similar markets for a particular property type. Regions can be a jurisdiction, a county, or a group of jurisdictions or counties. Residential/SRR (91) sales are further split into on-water regions and off-water regions. See Reporting Water Value Influence for more information on identifying on- and off-water sales. Market condition trends, or trends, are determined based on sales of the various property types in these regions.
Every sale in each property type aggregation has a base region, or the area for which a trend is initially calculated. However, if there are less than 30 sales or the trend is statistically insignificant in the base region, the sales in that aggregation may revert to the trend of a larger default region. If the default region has less than 30 sales or the trend is statistically insignificant, the sales in that base region receive no trend. Default trend calculations include all sales within the default region, even if some of those sales are receiving a base trend. See Market Condition Trends for more information on how trends are determined and applied.
Below is a summary table of each property type aggregation’s base and default regions. Note that these are general rules for the state. Base and default regions are flexible and can be tailored to suit the needs of each county’s markets. Please contact your PTCO and Data & Analysis to discuss changing your regions. Region change requests are due August 31, 2021. Contact Data & Analysis for clarification on your county’s regions.
Base and Default Regions by Property Type Aggregation
Property Type Aggregation Base Region Default Region
02 – Apartments* County None
06 – Commercial* County None
07 – Industrial* County None
91W – Residential/SRR On-Water Residential region Countywide on-water OR combined on-/off-water base region
91N – Residential/SRR Off-Water Residential region Countywide off-water
93 – Agricultural/Rural Vacant County Agricultural/rural vacant region
*Indicates aggregations for which metro counties and first class cities have different regions. See below for details.
2020 Sales Ratio Study Criteria 28
Apartments, Commercial, and Industrial Regions
Trends for apartments, commercial, and industrial sales are generally determined at the county level. However, the following cities will be considered their own region, and the sales in these cities will not be included in the county’s trend calculation:
• Minneapolis
• St. Paul • Duluth + Hermantown
• Rochester • St. Cloud
• Moorhead
For metro counties, commercial and industrial sales default to a metro wide region that includes Minneapolis and St. Paul.
For apartment sales, metro counties will default to a metro wide region that excludes Minneapolis and St. Paul. Minneapolis and St. Paul default to a combined Minneapolis and St. Paul region.
Residential/Seasonal Residential Recreational Regions
Residential/SRR base regions are geographic subsets of a county. These base regions are determined by the county. Residential/SRR regions range in size from an individual city or township, to groups of cities and townships, to the entire county. These regions do not need to be contiguous areas, but they should all share similar markets.
In counties with water influence, there will be separate base and default regions for on-water residential/SRR sales and off-water residential/SRR sales. The base regions are determined by the county, and they do not need to cover the same geographic area as the off-water base regions. The standard default for on-water base regions is the countywide on-water trend. However, Counties can elect for their on-water sales to default to a combined on- and off-water trend for the geographic area of the on-water base region. Off-water base regions default to a countywide off-water trend.
The following cities will be considered their own regions, both on-water and off-water, and the sales in these cities will not be included in the countywide trend calculations:
• Minneapolis • St. Paul
• Duluth • Rochester
• St. Cloud
Counties may elect to remove the consideration of water influence in their county for the purposes of the Sales Ratio Study. Consult with your PTCO if you think there is little water influence in your county, and notify Data &
2020 Sales Ratio Study Criteria 29
Analysis if you would like the consideration of water influence removed for your county. If your county elects to remove the consideration of water influence in your county for the purposes of the Sales Ratio Study, water influence information will be ignored for the purposes of the Sales Ratio Study only. Water influence on a sale should still be accurately reported on eCRV, and water codes for each property should still be accurately reported in PRISM. This information may still be used for other purposes beyond the Sales Ratio Study at this time.
Agricultural/Rural Vacant Regions
Agricultural/rural vacant regions are made up of at least two counties. Minnesota is divided into 23 agricultural/rural vacant regions. Go to Agricultural/Rural Vacant Region Map to see the regions.
Agricultural/rural vacant trends are first calculated at the county level. If the county has at least 30 sales and a statistically significant trend, it will receive its individual county trend. Otherwise, the county is eligible to receive the regional trend if the agricultural/rural vacant region has at least 30 sales and a statistically significant trend.
Joint Cities
A joint city is a city that crosses county boundaries. A joint city may have parcels in more than one county. There are 42 joint cities in the State of Minnesota. Joint cities may be treated differently than other jurisdictions for the purposes of the Sales Ratio Study to ensure that trends, ratios, and statistics accurately reflect the assessment of the multiple county components of the joint city.
Every joint city is assigned a home county based on the highest percentage of value or improved parcels in the city. Every joint city also has one or more non-home counties. These are the complement to the home county, the county or counties that do not make up the highest percentage of value or improved parcels in the city. The county of location refers to the county which individual parcels are located in.
If a city falls within more than one county, only the part of the city that falls in each county (the count of location) is used when calculated each county’s countywide trend. If the trend of a joint city must default to a countywide trend, the whole city receives the home county countywide trend. See Joint City Regions for the list of base and default regions for each joint city and the exceptions to these rules.
Determining Extremes
Once sales are stratified into their representative groups, the Department of Revenue identifies any extreme sales within each representative group that should not be included in market condition trends as they may distort the analysis.
The Department of Revenue determines extreme sales using an interquartile range (IQR). The IQR methodology uses the distribution of ratios within a representative group to determine which sales fall outside of the normal distribution of sales for that particular representative group. Sales outside of the lower and upper boundaries determined by the IQR methodology will be considered extreme sales. These limits fall approximately 2 to 3 standard deviations from the mean ratio.
2020 Sales Ratio Study Criteria 30
The following steps outline how to calculate the IQR range for each representative group. The ratios used to determine the IQR range depend on the stage of the study.
1. Determine the first quartile, or the point where 25% of sales ratios fall below.
2. Determine the third quartile, or the point where 75% of all sales ratios fall below.
3. Calculate the difference between the first and third quartile.
4. Calculate the lower and upper boundaries. Lower boundary = first quartile – 1.5 * difference. Upper boundary = third quartile + 1.5 * difference.
Good open market, arm’s-length sales can be extreme, outlier sales. The Department of Revenue will determine which sales are extremes, but these sales will not be automatically removed from the study. Extreme sales will be identified on each county’s sales listing. Counties should not reject a sale from the study on the sole basis of it being extreme. Sales identified as extreme could indicate that the sale needs additional verification. Extreme sales could be the result of an error on the eCRV, a physical change to the property, or a processing error.
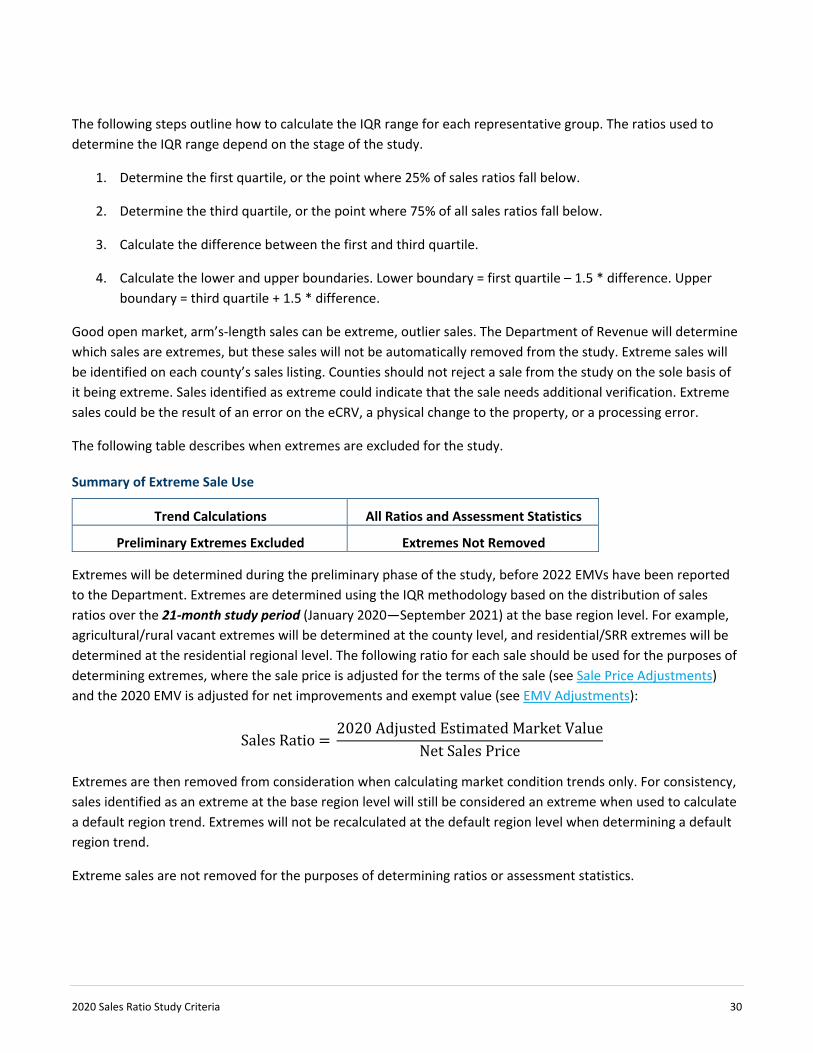
The following table describes when extremes are excluded for the study.
Summary of Extreme Sale Use
Trend Calculations All Ratios and Assessment Statistics
Preliminary Extremes Excluded Extremes Not Removed
Extremes will be determined during the preliminary phase of the study, before 2022 EMVs have been reported to the Department. Extremes are determined using the IQR methodology based on the distribution of sales ratios over the 21-month study period (January 2020—September 2021) at the base region level. For example, agricultural/rural vacant extremes will be determined at the county level, and residential/SRR extremes will be determined at the residential regional level. The following ratio for each sale should be used for the purposes of determining extremes, where the sale price is adjusted for the terms of the sale (see Sale Price Adjustments) and the 2020 EMV is adjusted for net improvements and exempt value (see EMV Adjustments):
Sales Ratio = 2020 Adjusted Estimated Market Value
Net Sales Price
Extremes are then removed from consideration when calculating market condition trends only. For consistency, sales identified as an extreme at the base region level will still be considered an extreme when used to calculate a default region trend. Extremes will not be recalculated at the default region level when determining a default region trend.
Extreme sales are not removed for the purposes of determining ratios or assessment statistics.

2020 Sales Ratio Study Criteria 31
Market Condition Trends
Once sales are stratified into their representative groups and extremes have been identified, the Department of Revenue determines if there are any market condition trends occurring within each group. A simple linear regression of sales ratios is then run over the 21-month study period to calculate market condition trends. If there is evidence of a trend, sale prices will be adjusted for market conditions. See Market Condition Adjustments for more information on those calculations. Counties are notified of the Department’s determined trends in October. Any edits made to sale information may affect the county’s trends, and the Department will issue updated trends to counties regularly. Counties have until mid-December to appeal their trends issued by the department. See Trend Appeals for more information. In mid-January, after the appeal process is complete, trends will be finalized and any further edits to sales will not affect the final market condition trends that have been issued.
The IAAO recognizes market condition adjustments as a crucial part of any ratio study. IAAO recommends five methods for calculating market condition adjustments:
• Paired sales analysis
• Resale analysis • Sales ratio time trend analysis
• Multiple regression analysis • Comparing per-unit values over time
Paired sales, multiple regression, and per-unit analyses require more extensive sale and parcel data than the Department collects. Per-unit and resale analyses require a higher volumes of sales and resales. This leaves the Department with the sales ratio time trend method, which can be applied fairly throughout the state.
The basis for the sales ratio time trend method is that changes in market conditions are represented by changes in sale prices over time. However, a simple analysis of changes in sale price can be misleading, especially in areas with few sales. A difference in median sale price of 10% from one month to the next does not usually mean that market values changed 10%. Rather, this is typically a sign that different types of properties sold in each month with more valuable properties being sold in one month than the other. To find out if overall values actually changed, these prices need to be standardized so they can be compared on the same scale.
Using the sales ratio accomplishes this goal because it controls for individual characteristics of the properties, making them comparable. For market condition analysis, we use the inverse of the sales ratio (sale price/assessed value) for ease of interpretation. For example, using the inverted ratio allows us to compare the assessment of a home that sold for $200,000 to a newer neighboring home that sold for a higher price. The house that sold for $200,000 should have an EMV that is lower than the house that sold for a higher price, so even though the two homes sell for different prices, the inverted ratio provides an apples-to-apples comparison. Calculating trends with the inverted ratio allows us to isolate the effect of prices, given an acceptable uniformity of assessment. An increase in the inverse sales ratio over time indicates an increase in sale prices, and a decrease in the ratio corresponds to a decrease in sale prices relative to assessed values as of a fixed date.
2020 Sales Ratio Study Criteria 32
If a default region includes multiple counties, the trend calculation will include a normalization of the ratios. Before a regression is run on the inverted ratios of multiple counties, each sale’s inverted ratio is divided by the median inverted ratio for that property type in that county. The regression is then run on these new values. This accounts for counties targeting different assessment levels.
Only sales identified as good open market, arm’s-length transactions are used to determine market condition trends. Additionally, extremes are not included in the trend analysis as they can distort calculations. See Determining Extremes for more information on how extremes are determined.
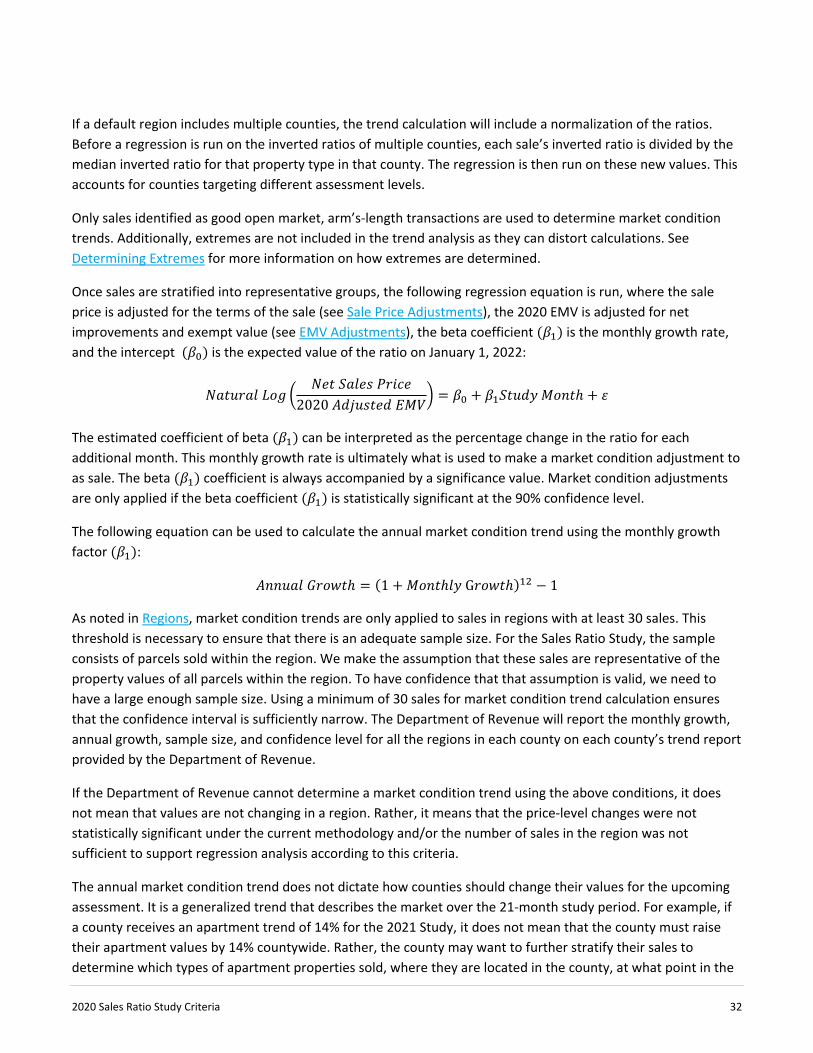
Once sales are stratified into representative groups, the following regression equation is run, where the sale price is adjusted for the terms of the sale (see Sale Price Adjustments), the 2020 EMV is adjusted for net improvements and exempt value (see EMV Adjustments), the beta coefficient (𝛽𝛽1) is the monthly growth rate, and the intercept (𝛽𝛽0) is the expected value of the ratio on January 1, 2022:
𝑁𝑁𝐵𝐵𝐴𝐴𝐴𝐴𝑀𝑀𝐵𝐵𝐵𝐵 𝐿𝐿𝐵𝐵𝐿𝐿 �𝑁𝑁𝑀𝑀𝐴𝐴 𝑆𝑆𝐵𝐵𝐵𝐵𝑀𝑀𝑆𝑆 𝑃𝑃𝑀𝑀𝑃𝑃𝑃𝑃𝑀𝑀
2020 𝐴𝐴𝐴𝐴𝐴𝐴𝐴𝐴𝑆𝑆𝐴𝐴𝑀𝑀𝐴𝐴 𝐸𝐸𝑀𝑀𝑃𝑃� = 𝛽𝛽0 + 𝛽𝛽1𝑆𝑆𝐴𝐴𝐴𝐴𝐴𝐴𝑆𝑆 𝑀𝑀𝐵𝐵𝐵𝐵𝐴𝐴ℎ + 𝜀𝜀
The estimated coefficient of beta (𝛽𝛽1) can be interpreted as the percentage change in the ratio for each additional month. This monthly growth rate is ultimately what is used to make a market condition adjustment to as sale. The beta (𝛽𝛽1) coefficient is always accompanied by a significance value. Market condition adjustments are only applied if the beta coefficient (𝛽𝛽1) is statistically significant at the 90% confidence level.
The following equation can be used to calculate the annual market condition trend using the monthly growth factor (𝛽𝛽1):
𝐴𝐴𝐵𝐵𝐵𝐵𝐴𝐴𝐵𝐵𝐵𝐵 𝐺𝐺𝑀𝑀𝐵𝐵𝐺𝐺𝐴𝐴ℎ = (1 + 𝑀𝑀𝐵𝐵𝐵𝐵𝐴𝐴ℎ𝐵𝐵𝑆𝑆 G𝑀𝑀𝐵𝐵𝐺𝐺𝐴𝐴ℎ)12 − 1
As noted in Regions, market condition trends are only applied to sales in regions with at least 30 sales. This threshold is necessary to ensure that there is an adequate sample size. For the Sales Ratio Study, the sample consists of parcels sold within the region. We make the assumption that these sales are representative of the property values of all parcels within the region. To have confidence that that assumption is valid, we need to have a large enough sample size. Using a minimum of 30 sales for market condition trend calculation ensures that the confidence interval is sufficiently narrow. The Department of Revenue will report the monthly growth, annual growth, sample size, and confidence level for all the regions in each county on each county’s trend report provided by the Department of Revenue.
If the Department of Revenue cannot determine a market condition trend using the above conditions, it does not mean that values are not changing in a region. Rather, it means that the price-level changes were not statistically significant under the current methodology and/or the number of sales in the region was not sufficient to support regression analysis according to this criteria.
The annual market condition trend does not dictate how counties should change their values for the upcoming assessment. It is a generalized trend that describes the market over the 21-month study period. For example, if a county receives an apartment trend of 14% for the 2021 Study, it does not mean that the county must raise their apartment values by 14% countywide. Rather, the county may want to further stratify their sales to determine which types of apartment properties sold, where they are located in the county, at what point in the

2020 Sales Ratio Study Criteria 33
study they were sold, and what their ratios were at the time of sale in order to determine how to change their apartment values for the upcoming assessment. Contact your PTCO for more guidance on interpreting your market condition trends.
Trend Appeals
If the county finds that a market condition trend determined by the Department of Revenue is not appropriate for one or more of the regions within their county, they have a right to appeal that trend.
The county assessor must notify their PTCO and Data & Analysis of their appeal. The deadline for appeals will be in mid-December. This deadline will be communicated to counties well in advance. Appeals will be accepted after the study period ends on September 30, 2021, but only after the county has finished reviewing and editing all sales in the property type they are appealing. The appeal of agricultural/rural vacant trends requires that all counties in the agricultural/rural vacant region have completely clean agricultural and rural vacant sales.
A county’s appeal must be specific as to which property type(s) and which jurisdiction(s) are included in their appeal. The county must also provide a summary explaining their reasons for believing a trend appeal is necessary. These reasons should be backed up with sales and/or other data as much as possible. Anecdotal evidence will also be considered.
After receiving an appeal of a trend, Data & Analysis will work closely with the PTCOs to conduct an internal analysis using any and all sales and assessment information available, including any additional information provided by the appealing county. Data & Analysis will complete a detailed summary of the trend and will analyze various things that may impact the trend, including but not limited to:
• extreme ratios within the data set • the trend when the sales are truncated to a 12-month study period
• the trend from the previous year’s 21-month data set • any non-linear trends within the region
• seasonal impacts on sales in the region • graphical analysis
• the trend after considering sales that occurred in October, November and December of 2021
Data & Analysis will present this information to the Department’s appeals panel for review. The PTCO will participate in this review, and the county will be invited to participate in the review. The appeals panel will make the determination of whether or not to grant the appeal, and Data & Analysis will make the appropriate adjustments to the study.
Counties who submit their appeals well before the mid-December deadline will receive an early determination of their appeal. Counties who submit by mid-December will receive a determination of their appeal by mid-January. More details on appeals will be provided to the counties in the fall of 2021.
Final preliminary ratios will be issued when trends are finalized after the appeal process. See Preliminary Ratios for more information.

2020 Sales Ratio Study Criteria 34
Market Condition Adjustments
Market condition adjustments, based on market condition trends, are a necessary component of the Sales Ratio Study in order to control for the impact of market conditions. The purpose of market condition adjustments is to determine what the sale price would have been if it occurred at the same point in time as the assessment. For example, if values have been rising in a market and no adjustment has been made to the sale price, a sale that occurred in February 2021 may have an artificially high State Board ratio. The EMV is the value as of January 2022 and accounts for the rising market but the sale price is from 10 months earlier and does not capture the rising market, therefore overstating the level of appraisal for the State Board study if market conditions are not accounted for.
By adjusting each sales price based on a market condition trend, the Department of Revenue can more accurately measure a county’s assessment level because the two values used to calculate the final ratio are representative of the same point in time. When all sale prices are adjusted to the same point in time, the median ratio better reflects the overall assessment level of that jurisdiction.
To adjust a sale forward for its market condition trend, we use the following formula:
Adjusted Sales Price = Net Sale Price ∗ [(1 + 𝑀𝑀𝐵𝐵𝐵𝐵𝐴𝐴ℎ𝐵𝐵𝑆𝑆 𝐺𝐺𝑀𝑀𝐵𝐵𝐺𝐺𝐴𝐴ℎ R𝐵𝐵𝐴𝐴𝑀𝑀)𝐴𝐴𝐴𝐴𝐴𝐴𝐴𝐴𝑌𝑌𝐴𝐴𝐴𝐴𝑌𝑌𝑜𝑜𝐴𝐴 𝑀𝑀𝐵𝐵𝑜𝑜𝐴𝐴ℎ𝑌𝑌]
The Adjustment Month table below describes what value to use for the adjustment month depending on the date of sale. Note that the adjustment month differs depending on the study and the EMV year you will be comparing it to. See Overview of the Sales Ratio Study for an explanation of how sale prices are adjusted for each study.

2020 Sales Ratio Study Criteria 35
Adjustment Months for Market Condition Adjustments
Sale Date State Board and RR &
Utility Adjustment Months to January 2022
Tax Court and EcMV Adjustment Months
to January 2021
ANTC Adjustment Months to January
2020 or January 2021
January 2020 N/A N/A 0
February 2020 N/A N/A -1
March 2020 N/A N/A -2
April 2020 N/A N/A -3
May 2020 N/A N/A -4
June 2020 N/A N/A -5
July 2020 N/A N/A -6
August 2020 N/A N/A -7
September 2020 N/A N/A -8
October 2020 15 3 -9
November 2020 14 2 -10
December 2020 13 1 -11
January 2021 12 0 0
February 2021 11 -1 -1
March 2021 10 -2 -2
April 2021 9 -3 -3
May 2021 8 -4 -4
June 2021 7 -5 -5
July 2021 6 -6 -6
August 2021 5 -7 -7
September 2021 4 -8 -8
Market Condition Adjustment Examples
The two following examples will demonstrate the calculations to adjust a sale price forward to January 2022 for the State Board study.
Example 1
A home sold for $100,000 in October 2020. The monthly growth rate for residential/SRR properties in the region was 2%. To adjust the sale forward to January 2, 2022 we use the following formula:
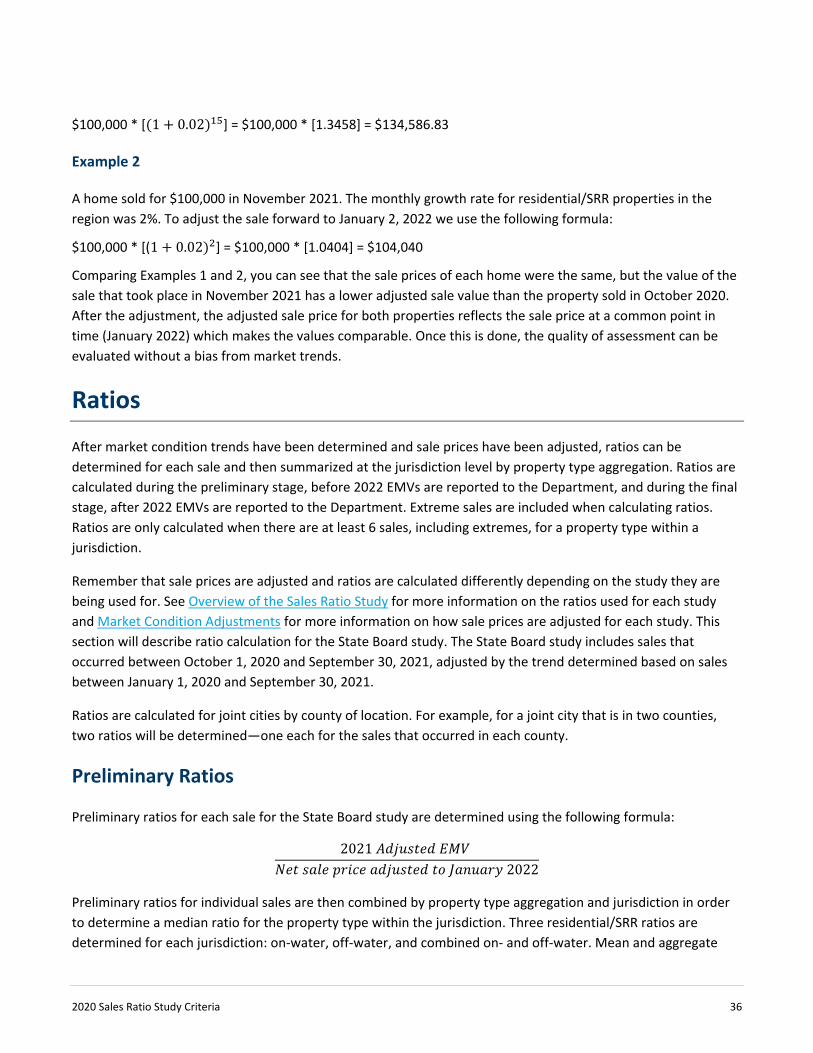
2020 Sales Ratio Study Criteria 36
$100,000 * [(1 + 0.02)15] = $100,000 * [1.3458] = $134,586.83
Example 2
A home sold for $100,000 in November 2021. The monthly growth rate for residential/SRR properties in the region was 2%. To adjust the sale forward to January 2, 2022 we use the following formula:
$100,000 * [(1 + 0.02)2] = $100,000 * [1.0404] = $104,040
Comparing Examples 1 and 2, you can see that the sale prices of each home were the same, but the value of the sale that took place in November 2021 has a lower adjusted sale value than the property sold in October 2020. After the adjustment, the adjusted sale price for both properties reflects the sale price at a common point in time (January 2022) which makes the values comparable. Once this is done, the quality of assessment can be evaluated without a bias from market trends.
Ratios
After market condition trends have been determined and sale prices have been adjusted, ratios can be determined for each sale and then summarized at the jurisdiction level by property type aggregation. Ratios are calculated during the preliminary stage, before 2022 EMVs are reported to the Department, and during the final stage, after 2022 EMVs are reported to the Department. Extreme sales are included when calculating ratios. Ratios are only calculated when there are at least 6 sales, including extremes, for a property type within a jurisdiction.
Remember that sale prices are adjusted and ratios are calculated differently depending on the study they are being used for. See Overview of the Sales Ratio Study for more information on the ratios used for each study and Market Condition Adjustments for more information on how sale prices are adjusted for each study. This section will describe ratio calculation for the State Board study. The State Board study includes sales that occurred between October 1, 2020 and September 30, 2021, adjusted by the trend determined based on sales between January 1, 2020 and September 30, 2021.
Ratios are calculated for joint cities by county of location. For example, for a joint city that is in two counties, two ratios will be determined—one each for the sales that occurred in each county.
Preliminary Ratios
Preliminary ratios for each sale for the State Board study are determined using the following formula:
2021 𝐴𝐴𝐴𝐴𝐴𝐴𝐴𝐴𝑆𝑆𝐴𝐴𝑀𝑀𝐴𝐴 𝐸𝐸𝑀𝑀𝑃𝑃 𝑁𝑁𝑀𝑀𝐴𝐴 𝑆𝑆𝐵𝐵𝐵𝐵𝑀𝑀 𝑝𝑝𝑀𝑀𝑃𝑃𝑃𝑃𝑀𝑀 𝐵𝐵𝐴𝐴𝐴𝐴𝐴𝐴𝑆𝑆𝐴𝐴𝑀𝑀𝐴𝐴 𝐴𝐴𝐵𝐵 𝐽𝐽𝐵𝐵𝐵𝐵𝐴𝐴𝐵𝐵𝑀𝑀𝑆𝑆 2022
Preliminary ratios for individual sales are then combined by property type aggregation and jurisdiction in order to determine a median ratio for the property type within the jurisdiction. Three residential/SRR ratios are determined for each jurisdiction: on-water, off-water, and combined on- and off-water. Mean and aggregate
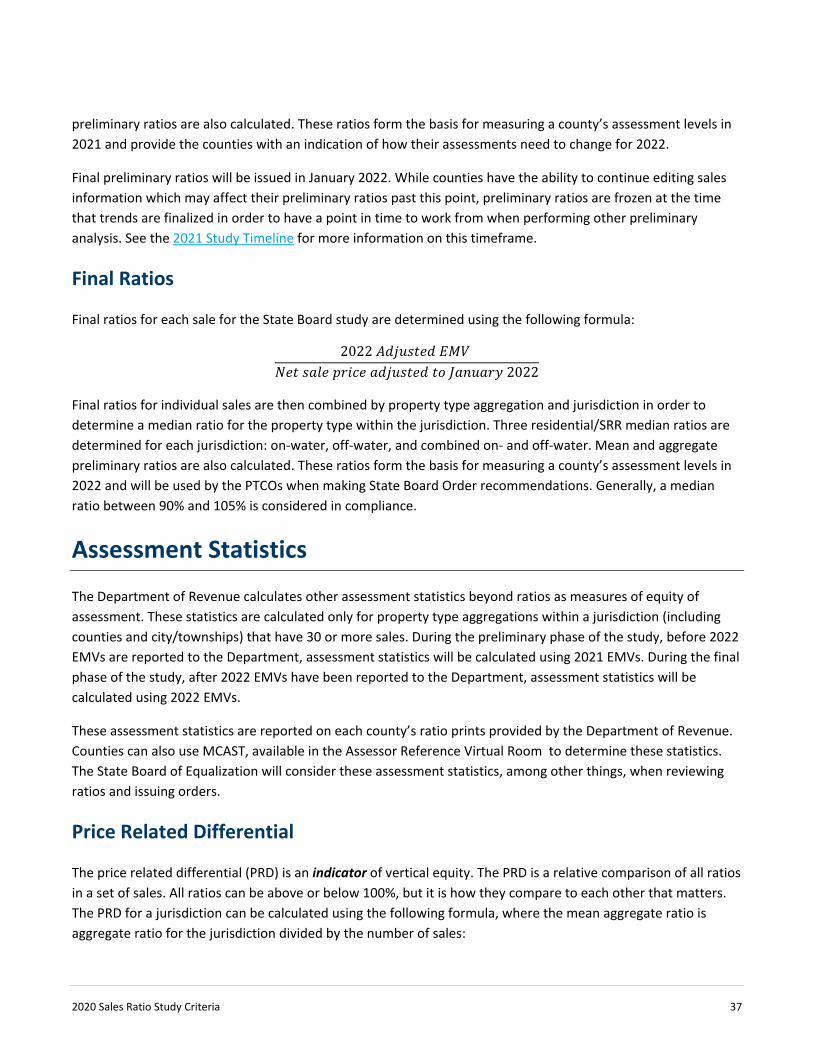
2020 Sales Ratio Study Criteria 37
preliminary ratios are also calculated. These ratios form the basis for measuring a county’s assessment levels in 2021 and provide the counties with an indication of how their assessments need to change for 2022.
Final preliminary ratios will be issued in January 2022. While counties have the ability to continue editing sales information which may affect their preliminary ratios past this point, preliminary ratios are frozen at the time that trends are finalized in order to have a point in time to work from when performing other preliminary analysis. See the 2021 Study Timeline for more information on this timeframe.
Final Ratios
Final ratios for each sale for the State Board study are determined using the following formula:
2022 𝐴𝐴𝐴𝐴𝐴𝐴𝐴𝐴𝑆𝑆𝐴𝐴𝑀𝑀𝐴𝐴 𝐸𝐸𝑀𝑀𝑃𝑃 𝑁𝑁𝑀𝑀𝐴𝐴 𝑆𝑆𝐵𝐵𝐵𝐵𝑀𝑀 𝑝𝑝𝑀𝑀𝑃𝑃𝑃𝑃𝑀𝑀 𝐵𝐵𝐴𝐴𝐴𝐴𝐴𝐴𝑆𝑆𝐴𝐴𝑀𝑀𝐴𝐴 𝐴𝐴𝐵𝐵 𝐽𝐽𝐵𝐵𝐵𝐵𝐴𝐴𝐵𝐵𝑀𝑀𝑆𝑆 2022
Final ratios for individual sales are then combined by property type aggregation and jurisdiction in order to determine a median ratio for the property type within the jurisdiction. Three residential/SRR median ratios are determined for each jurisdiction: on-water, off-water, and combined on- and off-water. Mean and aggregate preliminary ratios are also calculated. These ratios form the basis for measuring a county’s assessment levels in 2022 and will be used by the PTCOs when making State Board Order recommendations. Generally, a median ratio between 90% and 105% is considered in compliance.
Assessment Statistics
The Department of Revenue calculates other assessment statistics beyond ratios as measures of equity of assessment. These statistics are calculated only for property type aggregations within a jurisdiction (including counties and city/townships) that have 30 or more sales. During the preliminary phase of the study, before 2022 EMVs are reported to the Department, assessment statistics will be calculated using 2021 EMVs. During the final phase of the study, after 2022 EMVs have been reported to the Department, assessment statistics will be calculated using 2022 EMVs.
These assessment statistics are reported on each county’s ratio prints provided by the Department of Revenue. Counties can also use MCAST, available in the Assessor Reference Virtual Room to determine these statistics. The State Board of Equalization will consider these assessment statistics, among other things, when reviewing ratios and issuing orders.
Price Related Differential
The price related differential (PRD) is an indicator of vertical equity. The PRD is a relative comparison of all ratios in a set of sales. All ratios can be above or below 100%, but it is how they compare to each other that matters. The PRD for a jurisdiction can be calculated using the following formula, where the mean aggregate ratio is aggregate ratio for the jurisdiction divided by the number of sales:
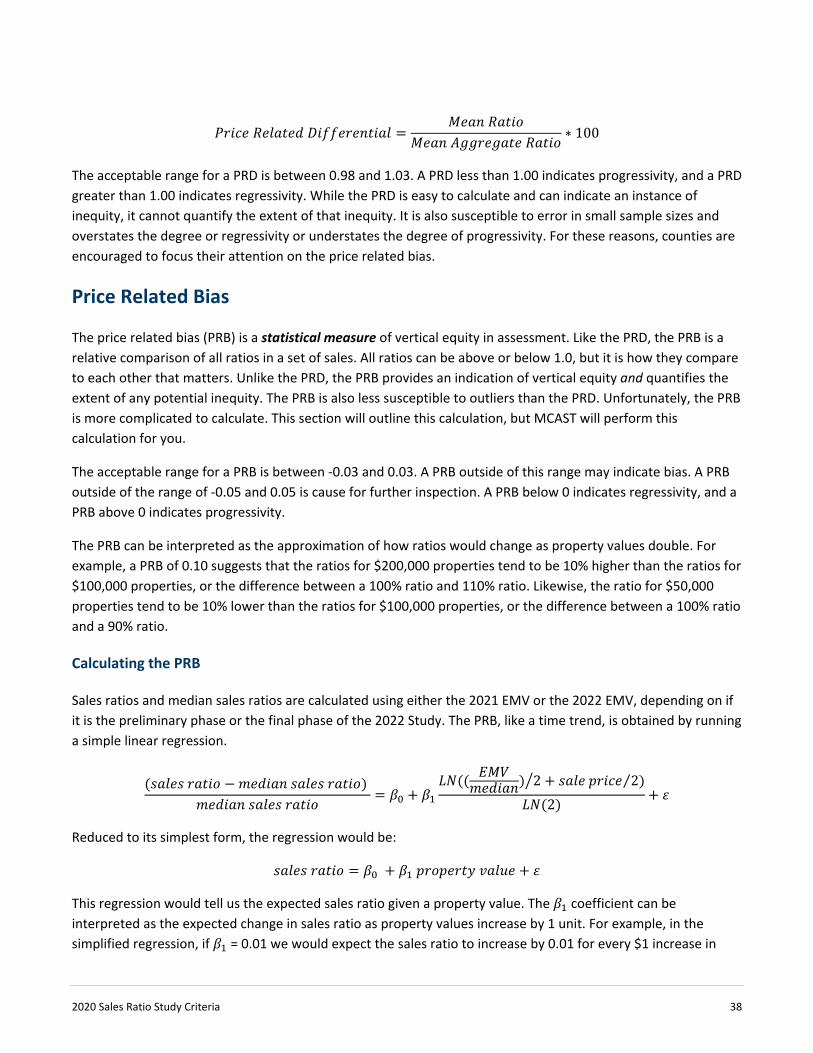
2020 Sales Ratio Study Criteria 38
𝑃𝑃𝑀𝑀𝑃𝑃𝑃𝑃𝑀𝑀 𝑅𝑅𝑀𝑀𝐵𝐵𝐵𝐵𝐴𝐴𝑀𝑀𝐴𝐴 𝐷𝐷𝑃𝑃𝐷𝐷𝐷𝐷𝑀𝑀𝑀𝑀𝑀𝑀𝐵𝐵𝐴𝐴𝑃𝑃𝐵𝐵𝐵𝐵 =𝑀𝑀𝑀𝑀𝐵𝐵𝐵𝐵 𝑅𝑅𝐵𝐵𝐴𝐴𝑃𝑃𝐵𝐵
𝑀𝑀𝑀𝑀𝐵𝐵𝐵𝐵 𝐴𝐴𝐿𝐿𝐿𝐿𝑀𝑀𝑀𝑀𝐿𝐿𝐵𝐵𝐴𝐴𝑀𝑀 𝑅𝑅𝐵𝐵𝐴𝐴𝑃𝑃𝐵𝐵∗ 100
The acceptable range for a PRD is between 0.98 and 1.03. A PRD less than 1.00 indicates progressivity, and a PRD greater than 1.00 indicates regressivity. While the PRD is easy to calculate and can indicate an instance of inequity, it cannot quantify the extent of that inequity. It is also susceptible to error in small sample sizes and overstates the degree or regressivity or understates the degree of progressivity. For these reasons, counties are encouraged to focus their attention on the price related bias.
Price Related Bias
The price related bias (PRB) is a statistical measure of vertical equity in assessment. Like the PRD, the PRB is a relative comparison of all ratios in a set of sales. All ratios can be above or below 1.0, but it is how they compare to each other that matters. Unlike the PRD, the PRB provides an indication of vertical equity and quantifies the extent of any potential inequity. The PRB is also less susceptible to outliers than the PRD. Unfortunately, the PRB is more complicated to calculate. This section will outline this calculation, but MCAST will perform this calculation for you.
The acceptable range for a PRB is between -0.03 and 0.03. A PRB outside of this range may indicate bias. A PRB outside of the range of -0.05 and 0.05 is cause for further inspection. A PRB below 0 indicates regressivity, and a PRB above 0 indicates progressivity.
The PRB can be interpreted as the approximation of how ratios would change as property values double. For example, a PRB of 0.10 suggests that the ratios for $200,000 properties tend to be 10% higher than the ratios for $100,000 properties, or the difference between a 100% ratio and 110% ratio. Likewise, the ratio for $50,000 properties tend to be 10% lower than the ratios for $100,000 properties, or the difference between a 100% ratio and a 90% ratio.
Calculating the PRB
Sales ratios and median sales ratios are calculated using either the 2021 EMV or the 2022 EMV, depending on if it is the preliminary phase or the final phase of the 2022 Study. The PRB, like a time trend, is obtained by running a simple linear regression.
(𝑆𝑆𝐵𝐵𝐵𝐵𝑀𝑀𝑆𝑆 𝑀𝑀𝐵𝐵𝐴𝐴𝑃𝑃𝐵𝐵 − 𝐴𝐴𝑀𝑀𝐴𝐴𝑃𝑃𝐵𝐵𝐵𝐵 𝑆𝑆𝐵𝐵𝐵𝐵𝑀𝑀𝑆𝑆 𝑀𝑀𝐵𝐵𝐴𝐴𝑃𝑃𝐵𝐵) 𝐴𝐴𝑀𝑀𝐴𝐴𝑃𝑃𝐵𝐵𝐵𝐵 𝑆𝑆𝐵𝐵𝐵𝐵𝑀𝑀𝑆𝑆 𝑀𝑀𝐵𝐵𝐴𝐴𝑃𝑃𝐵𝐵
= 𝛽𝛽0 + 𝛽𝛽1𝐿𝐿𝑁𝑁(( 𝐸𝐸𝑀𝑀𝑃𝑃
𝐴𝐴𝑀𝑀𝐴𝐴𝑃𝑃𝐵𝐵𝐵𝐵) 2� + 𝑆𝑆𝐵𝐵𝐵𝐵𝑀𝑀 𝑝𝑝𝑀𝑀𝑃𝑃𝑃𝑃𝑀𝑀 2)⁄
𝐿𝐿𝑁𝑁(2)+ 𝜀𝜀
Reduced to its simplest form, the regression would be:
𝑆𝑆𝐵𝐵𝐵𝐵𝑀𝑀𝑆𝑆 𝑀𝑀𝐵𝐵𝐴𝐴𝑃𝑃𝐵𝐵 = 𝛽𝛽0 + 𝛽𝛽1 𝑝𝑝𝑀𝑀𝐵𝐵𝑝𝑝𝑀𝑀𝑀𝑀𝐴𝐴𝑆𝑆 𝑣𝑣𝐵𝐵𝐵𝐵𝐴𝐴𝑀𝑀 + 𝜀𝜀
This regression would tell us the expected sales ratio given a property value. The 𝛽𝛽1 coefficient can be interpreted as the expected change in sales ratio as property values increase by 1 unit. For example, in the simplified regression, if 𝛽𝛽1 = 0.01 we would expect the sales ratio to increase by 0.01 for every $1 increase in

2020 Sales Ratio Study Criteria 39
property value. When the other elements are added to this equation, it only changes the interpretation of the 𝛽𝛽1 coefficient.
The dependent variable in the analysis is:
(𝑆𝑆𝐵𝐵𝐵𝐵𝑀𝑀𝑆𝑆 𝑀𝑀𝐵𝐵𝐴𝐴𝑃𝑃𝐵𝐵 − 𝐴𝐴𝑀𝑀𝐴𝐴𝑃𝑃𝐵𝐵𝐵𝐵 𝑆𝑆𝐵𝐵𝐵𝐵𝑀𝑀𝑆𝑆 𝑀𝑀𝐵𝐵𝐴𝐴𝑃𝑃𝐵𝐵) 𝐴𝐴𝑀𝑀𝐴𝐴𝑃𝑃𝐵𝐵𝐵𝐵 𝑆𝑆𝐵𝐵𝐵𝐵𝑀𝑀𝑆𝑆 𝑀𝑀𝐵𝐵𝐴𝐴𝑃𝑃𝐵𝐵
This is the percentage difference between any given sales ratio and the median. By using a percent, the 𝛽𝛽1can be interpreted as a percent change (from the median) in ratios.
The independent variable in the analysis is:
𝐿𝐿𝑁𝑁(( 𝐸𝐸𝑀𝑀𝑃𝑃𝐴𝐴𝑀𝑀𝐴𝐴𝑃𝑃𝐵𝐵𝐵𝐵) 2� + 𝑆𝑆𝐵𝐵𝐵𝐵𝑀𝑀 𝑝𝑝𝑀𝑀𝑃𝑃𝑃𝑃𝑀𝑀 2)⁄
𝐿𝐿𝑁𝑁(2)
We adjust the estimated market value by dividing by the median ratio to ensure the estimated market value and the sale price is equally weighted. This is important if assessors have target ratios not equal to one.
Instead of using the sale price as the indicator of value, this side of the formula uses the average of the sale price and the adjusted EMV as a proxy for value. While not a perfect indicator of value, using the average reduces the upward bias of the PRB than if the sale price was used.
Using the natural log allows us to interpret increases in property values as a percentage. Given the dependent variable in the analysis is also a percent; it will be interpreted as percent increase in value increases ratios by a percent.
Dividing by the natural log of 2 (0.693) permits each doubling of value to be associated with an increment of 1. So, a 100% increase in the value, a doubling of value, increases the estimated ratio by (𝛽𝛽1 ∗ 100)%. This is done for interpretation. If we don’t divide by the natural log of 2, the PRB would tell us how ratios change for a 1% increase in the value. This would result in very small coefficients which are hard to conceptualize.
Interpreting the PRB
The 𝛽𝛽1coefficient is the PRB. It can be interpreted as the expected change in ratios as property values double. If ratios increase as property values increase, the resulting PRB will be positive. For example, a PRB of 0.025 indicates that if property values double, ratios increase by 2.5%. A positive PRB indicates that assessments are progressive, meaning high value properties are over-appraised relative to low value properties. Conversely, if ratios decrease as property values increase, the resulting PRB will be negative. For example, a PRB of -0.055 indicates that if property values double, ratios decrease by 5.5%. A negative PRB indicates that assessments are regressive, meaning high value properties are under-appraised relative to low value properties.
Like market condition trends, the PRB is a statistical measure of bias and is subject to the same criteria as market condition trends. The coefficient must be statistically significant at the 90% confidence level, and the jurisdiction must have 30 or more sales.
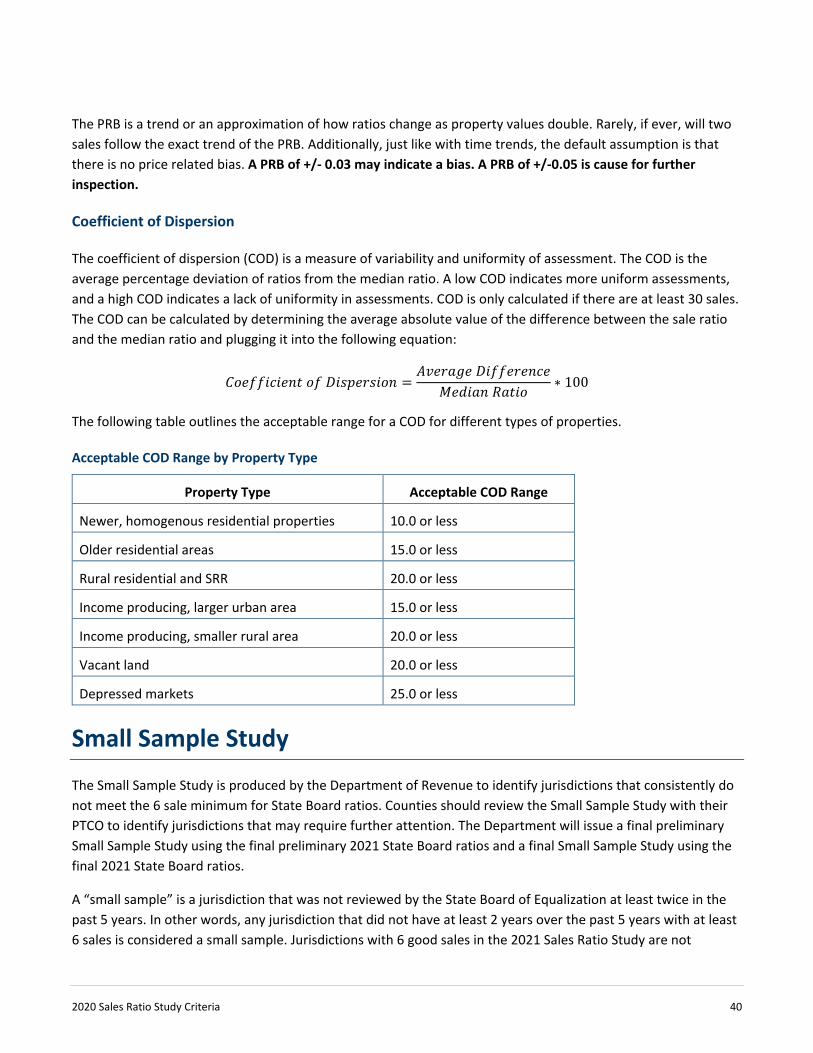
2020 Sales Ratio Study Criteria 40
The PRB is a trend or an approximation of how ratios change as property values double. Rarely, if ever, will two sales follow the exact trend of the PRB. Additionally, just like with time trends, the default assumption is that there is no price related bias. A PRB of +/- 0.03 may indicate a bias. A PRB of +/-0.05 is cause for further inspection.
Coefficient of Dispersion
The coefficient of dispersion (COD) is a measure of variability and uniformity of assessment. The COD is the average percentage deviation of ratios from the median ratio. A low COD indicates more uniform assessments, and a high COD indicates a lack of uniformity in assessments. COD is only calculated if there are at least 30 sales. The COD can be calculated by determining the average absolute value of the difference between the sale ratio and the median ratio and plugging it into the following equation:
𝐶𝐶𝐵𝐵𝑀𝑀𝐷𝐷𝐷𝐷𝑃𝑃𝑃𝑃𝑃𝑃𝑀𝑀𝐵𝐵𝐴𝐴 𝐵𝐵𝐷𝐷 𝐷𝐷𝑃𝑃𝑆𝑆𝑝𝑝𝑀𝑀𝑀𝑀𝑆𝑆𝑃𝑃𝐵𝐵𝐵𝐵 =𝐴𝐴𝑣𝑣𝑀𝑀𝑀𝑀𝐵𝐵𝐿𝐿𝑀𝑀 𝐷𝐷𝑃𝑃𝐷𝐷𝐷𝐷𝑀𝑀𝑀𝑀𝑀𝑀𝐵𝐵𝑃𝑃𝑀𝑀
𝑀𝑀𝑀𝑀𝐴𝐴𝑃𝑃𝐵𝐵𝐵𝐵 𝑅𝑅𝐵𝐵𝐴𝐴𝑃𝑃𝐵𝐵∗ 100
The following table outlines the acceptable range for a COD for different types of properties.
Acceptable COD Range by Property Type
Property Type Acceptable COD Range
Newer, homogenous residential properties 10.0 or less
Older residential areas 15.0 or less
Rural residential and SRR 20.0 or less
Income producing, larger urban area 15.0 or less
Income producing, smaller rural area 20.0 or less
Vacant land 20.0 or less
Depressed markets 25.0 or less
Small Sample Study
The Small Sample Study is produced by the Department of Revenue to identify jurisdictions that consistently do not meet the 6 sale minimum for State Board ratios. Counties should review the Small Sample Study with their PTCO to identify jurisdictions that may require further attention. The Department will issue a final preliminary Small Sample Study using the final preliminary 2021 State Board ratios and a final Small Sample Study using the final 2021 State Board ratios.
A “small sample” is a jurisdiction that was not reviewed by the State Board of Equalization at least twice in the past 5 years. In other words, any jurisdiction that did not have at least 2 years over the past 5 years with at least 6 sales is considered a small sample. Jurisdictions with 6 good sales in the 2021 Sales Ratio Study are not

2020 Sales Ratio Study Criteria 41
included in the Small Sample Study. The Small Sample Study is stratified by sales ratio property type aggregations.
The Small Sample Study provides the following information for every small sample for each of the 5 years. This information is also provided at the county level for reference:
• Sale count, including extreme sales.
• Annual trend, if any, applied or indicated. • Median ratio, including extreme sales.
• % value change, determined using values for all parcels of that property type in the jurisdiction, adjusted for net improvements. These values are determined using values from the PRISM files.
• Parcel count for that property type in that jurisdiction.
A five-year weighted median is calculated to provide a snapshot of median ratios over the 5 years. The weighted median gives more weight to the median ratios from more recent years and less weight to the median ratios from older years. The five-year weighted median is not calculated for jurisdictions with less than 6 sales over the 5 years. The table below describes the weights for each year as the percent that each contributes to the final weighted median.
Weights by Year for the Five-Year Weighted Median
2021 2020 2019 2018 2017
Weight 30% 25% 20% 15% 10%
If there is a year (or years) with no sales, the weights adjust proportionally to include only those years with sales. For example, if there were no sales in 2020, the weights only add up to 75%. To determine the new weights for each year with sales, divide the weight in Table 1 by the new total. In this example, 2021 would now hold 40% (30% ÷ 75%) of the weight, 2019 would hold 27% (20% ÷ 75%), etc.
There are certain situations which may warrant attention from the county. Several flags were created to indicate these jurisdictions. These flags are not definitive indicators of a problem, nor is a lack of flags a definitive indicator that there is not a problem. These flags are described below.
• The Low Total Sales Flag indicates jurisdictions where there are less than 6 total sales over the 5 years. • The Value Change Flag indicates jurisdictions where values did not change at least twice over the 5
years.
• The Weighted Median Flag indicates jurisdictions where the five-year weighted median is outside of the standard 90% to 105% compliance level.
Reports Throughout the Sales Ratio Study process, the Department of Revenue issues many different reports to the counties regularly in order to encourage spreading the workload out over many months and to keep counties

2020 Sales Ratio Study Criteria 42
informed on the status of the study. These reports include Sales Listings, Rejected Sales Listings, Trend Reports, Ratio Prints, and Small Sample Study Reports. Sales listings are sent out at every stage in the process to ensure that the most up to date and correct sales information is always being used. The counties must review these Sales Listings to ensure that this is the case.
Additional reports may be issued throughout the study to provide more information or guidance to the county and the PTCO. These reports should help start conversations between the PTCO and the county and help improve the study and improve the assessment. More information will be provided with each report as it is issued. Reports may be issued on:
• Agricultural and rural vacant values • Sales chasing
• Local effort/value changes • Supplementary ratios and trends
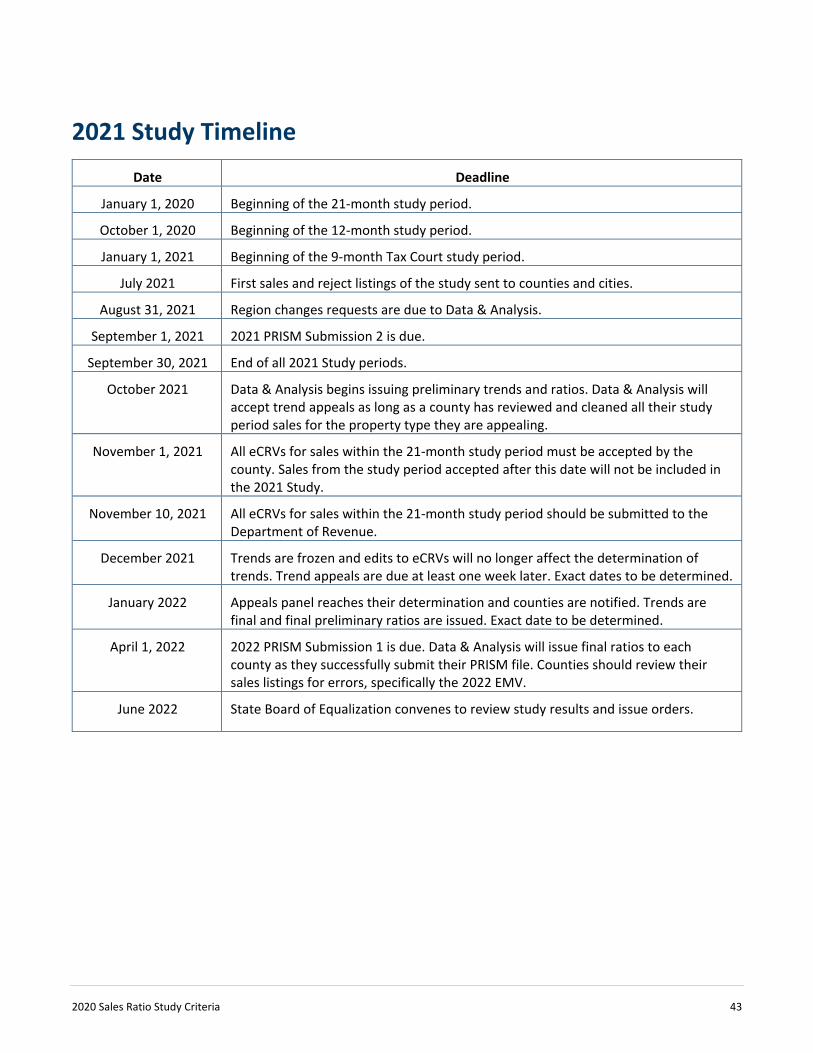
2020 Sales Ratio Study Criteria 43
2021 Study Timeline Date Deadline
January 1, 2020 Beginning of the 21-month study period.
October 1, 2020 Beginning of the 12-month study period.
January 1, 2021 Beginning of the 9-month Tax Court study period.
July 2021 First sales and reject listings of the study sent to counties and cities.
August 31, 2021 Region changes requests are due to Data & Analysis.
September 1, 2021 2021 PRISM Submission 2 is due.
September 30, 2021 End of all 2021 Study periods.
October 2021 Data & Analysis begins issuing preliminary trends and ratios. Data & Analysis will accept trend appeals as long as a county has reviewed and cleaned all their study period sales for the property type they are appealing.
November 1, 2021 All eCRVs for sales within the 21-month study period must be accepted by the county. Sales from the study period accepted after this date will not be included in the 2021 Study.
November 10, 2021 All eCRVs for sales within the 21-month study period should be submitted to the Department of Revenue.
December 2021 Trends are frozen and edits to eCRVs will no longer affect the determination of trends. Trend appeals are due at least one week later. Exact dates to be determined.
January 2022 Appeals panel reaches their determination and counties are notified. Trends are final and final preliminary ratios are issued. Exact date to be determined.
April 1, 2022 2022 PRISM Submission 1 is due. Data & Analysis will issue final ratios to each county as they successfully submit their PRISM file. Counties should review their sales listings for errors, specifically the 2022 EMV.
June 2022 State Board of Equalization convenes to review study results and issue orders.
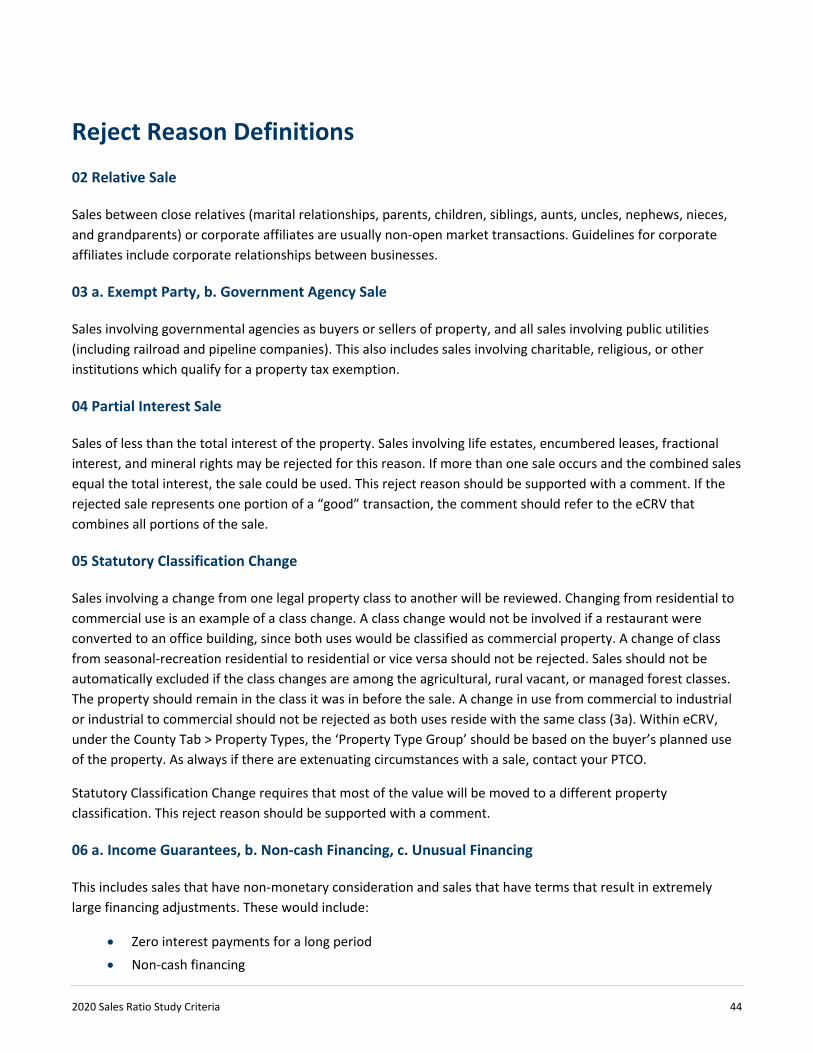
2020 Sales Ratio Study Criteria 44
Reject Reason Definitions
02 Relative Sale
Sales between close relatives (marital relationships, parents, children, siblings, aunts, uncles, nephews, nieces, and grandparents) or corporate affiliates are usually non-open market transactions. Guidelines for corporate affiliates include corporate relationships between businesses.
03 a. Exempt Party, b. Government Agency Sale
Sales involving governmental agencies as buyers or sellers of property, and all sales involving public utilities (including railroad and pipeline companies). This also includes sales involving charitable, religious, or other institutions which qualify for a property tax exemption.
04 Partial Interest Sale
Sales of less than the total interest of the property. Sales involving life estates, encumbered leases, fractional interest, and mineral rights may be rejected for this reason. If more than one sale occurs and the combined sales equal the total interest, the sale could be used. This reject reason should be supported with a comment. If the rejected sale represents one portion of a “good” transaction, the comment should refer to the eCRV that combines all portions of the sale.
05 Statutory Classification Change
Sales involving a change from one legal property class to another will be reviewed. Changing from residential to commercial use is an example of a class change. A class change would not be involved if a restaurant were converted to an office building, since both uses would be classified as commercial property. A change of class from seasonal-recreation residential to residential or vice versa should not be rejected. Sales should not be automatically excluded if the class changes are among the agricultural, rural vacant, or managed forest classes. The property should remain in the class it was in before the sale. A change in use from commercial to industrial or industrial to commercial should not be rejected as both uses reside with the same class (3a). Within eCRV, under the County Tab > Property Types, the ‘Property Type Group’ should be based on the buyer’s planned use of the property. As always if there are extenuating circumstances with a sale, contact your PTCO.
Statutory Classification Change requires that most of the value will be moved to a different property classification. This reject reason should be supported with a comment.
06 a. Income Guarantees, b. Non-cash Financing, c. Unusual Financing
This includes sales that have non-monetary consideration and sales that have terms that result in extremely large financing adjustments. These would include:
• Zero interest payments for a long period
• Non-cash financing

2020 Sales Ratio Study Criteria 45
• Extreme interest rates that would make the finance adjustment a large part of the sale price and move the sale into the extreme ratio range
• Income guarantees that require the seller to pay the buyer money if a specified income is not realized from the property
This reject reason should be supported with a comment.
Sales of shopping centers
These types of properties are generally constructed to be leased. There is usually a larger pool of prospective tenants for these types of properties than there are for single tenant properties and a larger universe of potential buyers. These sales are generally considered good for use in sales studies, although care should be taken regarding lease terms and/or rental rates that aren’t typical in the market (regardless of property size). Some items to consider when verifying these sales include:
• Are the rents typical of those found elsewhere in the market? • Are there other comparable sales that would support the price paid for the subject sale? • Are there tenants with extraordinarily good credit and/or lease terms atypical in the
marketplace that may have influenced the sale price? • The number and nature of rentable spaces may influence the decision.
Sales of Franchised property
Franchised properties also may include: • Land & building • Personal property • Business value
Standalone single tenant franchised properties can seldom be included in sales studies because the determination of the portion of the sale price attributed to real estate is too difficult to determine in mass appraisal. Occasionally some lower profile franchises or regional franchises can be included when verification allows confidence in the value of non-realty components. If the sale of a shopping center includes tenants operating franchised business, care should be exercised in evaluating these sales to determine the influence of that franchise on the sale. The presence of tenants operating franchises may be perceived to reduce the risk to the buyer if the lease is guaranteed by the franchise.
07 a. Physical Change, b. Renovation
Sales of incomplete structures or structures that were assessed prior to completion should be rejected if the property was substantially improved between assessment date and sale. Property damaged between the assessment date and sale should be rejected due to physical change. Sales in which the physical change is merely cosmetic or would not have caused the assessor to change the market value of the property should be included in the study. Sales involving structures that are more than 5% incomplete may be excluded. Sales involving missing construction should only be rejected in very specific circumstances. See the Missing

2020 Sales Ratio Study Criteria 46
Construction Flow Chart below for more details. Go to Net Improvements for more information on when net improvements should be accepted or rejected.
Missing Construction Flow Chart
Properties that sell for the purpose of renovation and resale may be rejected if certain conditions are present. These are often the first of two sales of a property within a short period of time. The first sale may have received little if any public promotion. There is typically a substantial improvement between the transactions. When the property has a level of transformation that creates a comparison issue between the property that sold and what is represented by the upcoming assessment, the sale should be rejected. Assessors must support that the sale is not a typical price for the market, the property was substantially improved between sales, and the property has been relisted or sold a second time.
08 a. Correction Deed, b. Quit Claim Deed
Sales of convenience simply to correct a defect of title or to change the character of the title, including quit claim deeds.
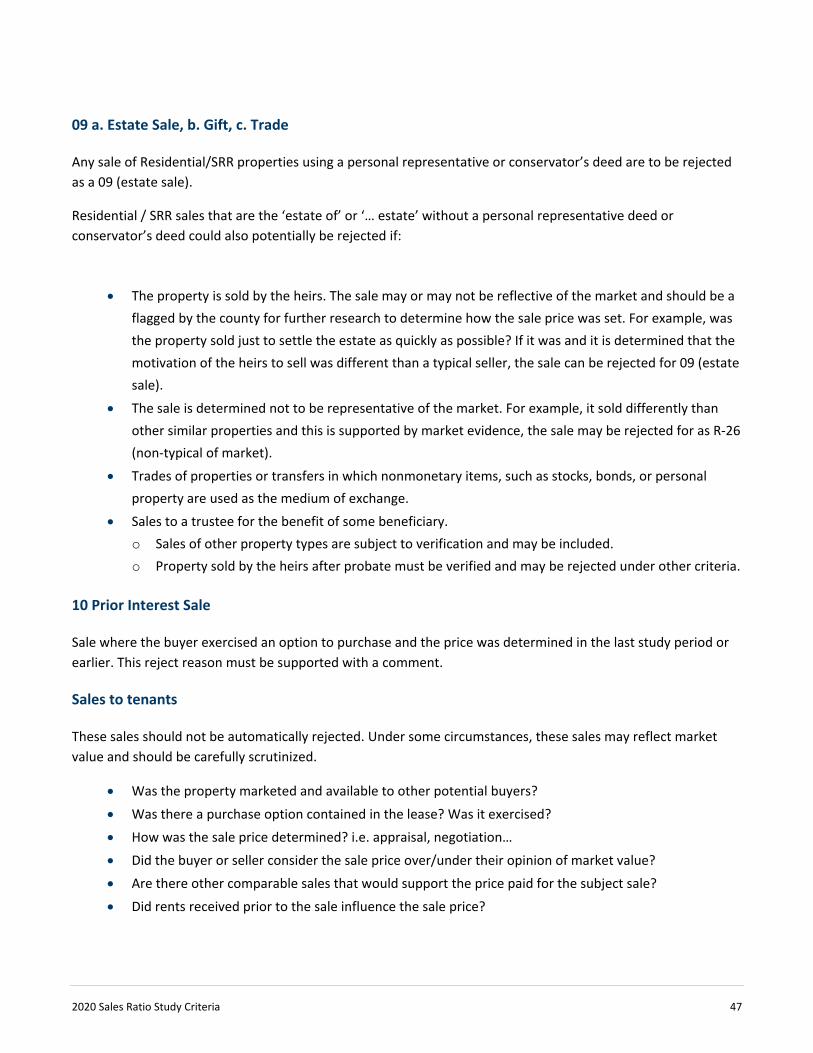
2020 Sales Ratio Study Criteria 47
09 a. Estate Sale, b. Gift, c. Trade
Any sale of Residential/SRR properties using a personal representative or conservator’s deed are to be rejected as a 09 (estate sale).
Residential / SRR sales that are the ‘estate of’ or ‘… estate’ without a personal representative deed or conservator’s deed could also potentially be rejected if:
• The property is sold by the heirs. The sale may or may not be reflective of the market and should be a flagged by the county for further research to determine how the sale price was set. For example, was the property sold just to settle the estate as quickly as possible? If it was and it is determined that the motivation of the heirs to sell was different than a typical seller, the sale can be rejected for 09 (estate sale).
• The sale is determined not to be representative of the market. For example, it sold differently than other similar properties and this is supported by market evidence, the sale may be rejected for as R-26 (non-typical of market).
• Trades of properties or transfers in which nonmonetary items, such as stocks, bonds, or personal property are used as the medium of exchange.
• Sales to a trustee for the benefit of some beneficiary. o Sales of other property types are subject to verification and may be included. o Property sold by the heirs after probate must be verified and may be rejected under other criteria.
10 Prior Interest Sale
Sale where the buyer exercised an option to purchase and the price was determined in the last study period or earlier. This reject reason must be supported with a comment.
Sales to tenants
These sales should not be automatically rejected. Under some circumstances, these sales may reflect market value and should be carefully scrutinized.
• Was the property marketed and available to other potential buyers?
• Was there a purchase option contained in the lease? Was it exercised? • How was the sale price determined? i.e. appraisal, negotiation…
• Did the buyer or seller consider the sale price over/under their opinion of market value? • Are there other comparable sales that would support the price paid for the subject sale?
• Did rents received prior to the sale influence the sale price?
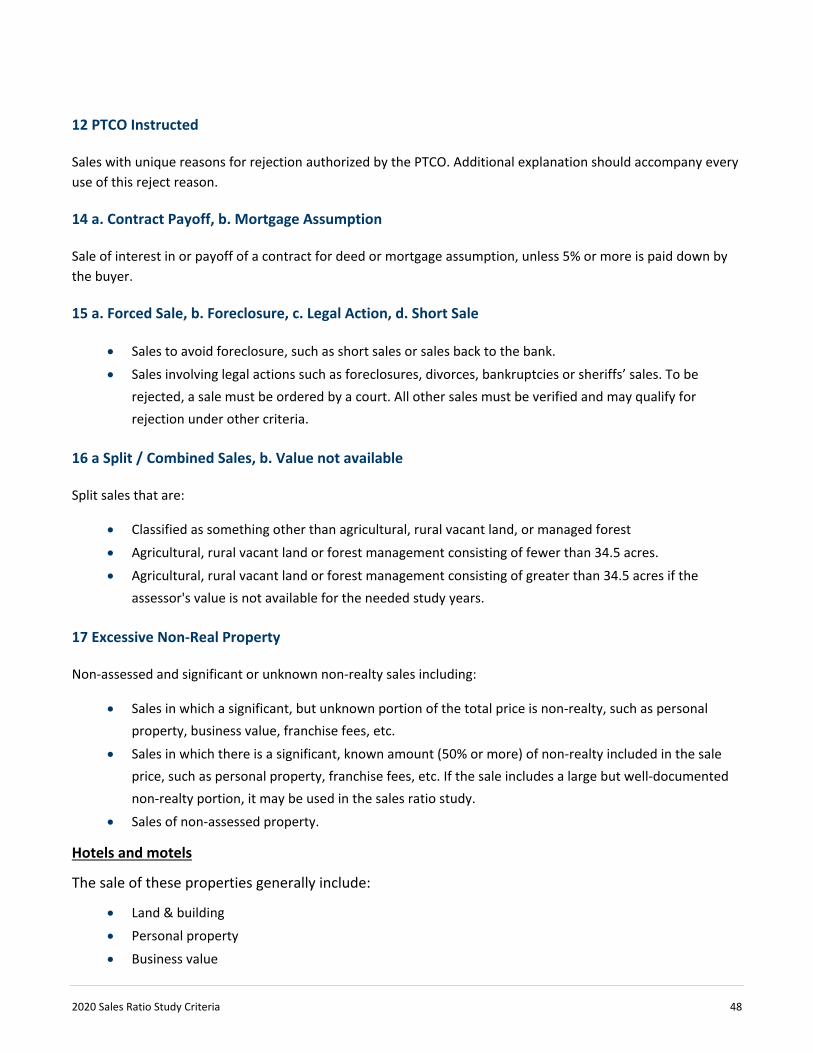
2020 Sales Ratio Study Criteria 48
12 PTCO Instructed
Sales with unique reasons for rejection authorized by the PTCO. Additional explanation should accompany every use of this reject reason.
14 a. Contract Payoff, b. Mortgage Assumption
Sale of interest in or payoff of a contract for deed or mortgage assumption, unless 5% or more is paid down by the buyer.
15 a. Forced Sale, b. Foreclosure, c. Legal Action, d. Short Sale
• Sales to avoid foreclosure, such as short sales or sales back to the bank. • Sales involving legal actions such as foreclosures, divorces, bankruptcies or sheriffs’ sales. To be
rejected, a sale must be ordered by a court. All other sales must be verified and may qualify for rejection under other criteria.
16 a Split / Combined Sales, b. Value not available
Split sales that are:
• Classified as something other than agricultural, rural vacant land, or managed forest
• Agricultural, rural vacant land or forest management consisting of fewer than 34.5 acres. • Agricultural, rural vacant land or forest management consisting of greater than 34.5 acres if the
assessor's value is not available for the needed study years.
17 Excessive Non-Real Property
Non-assessed and significant or unknown non-realty sales including:
• Sales in which a significant, but unknown portion of the total price is non-realty, such as personal property, business value, franchise fees, etc.
• Sales in which there is a significant, known amount (50% or more) of non-realty included in the sale price, such as personal property, franchise fees, etc. If the sale includes a large but well-documented non-realty portion, it may be used in the sales ratio study.
• Sales of non-assessed property.
Hotels and motels
The sale of these properties generally include:
• Land & building • Personal property
• Business value

2020 Sales Ratio Study Criteria 49
• Identifying the value of the non-realty portions so analysis can be conducted on the value of real estate sold is the challenge. There are however, industry standards that are used in determining this allocation. The IAAO recommends using income and expense data to isolate income attributable to intangibles and capitalize those income streams to arrive at intangible value. Unfortunately we don’t always have access to income and expense information. However, the market has historically displayed enough information to model estimates as follows: o For limited service hotels, the total of these intangible items is often 20-25% of sales price. o For full service hotels, the value is often 25-35% of sale price. o The reported value of intangibles in eCRV often only lists personal property. o This amount is often overstated and an amount for business value is often understated or not
reported. In practicing mass appraisal, if the value of intangibles reported in any fashion is at or very close to the ranges identified above, the sales can be considered valid for ratio. If verification reveals the reported amounts should be adjusted, the adjustments can be made to qualify the sale. If reported amounts fall outside this range and verification does not lead to information that can be supported by the market, the sale may be excluded. Sale price per room can be used as a measure to compare to other market sales in considering inclusion of a sale for study. This reject reason must be supported with a comment.
18 a. Default (on contract for deed), b. Rewrite of Terms
eCRVs which are rewrites of the terms of a contract for deed. If a rewrite occurs within a year of the original contract, both will be deleted. If it is more than a year, the original sale will be used.
19 Relocation
Sales involving a relocation company.
20 Leaseback
Sales where the property is leased back to seller for more than six months. This does not include short-term leases, such as to get crops harvested. This reject reason must be supported with a comment.
Sales of these properties should not automatically be rejected from use in the sales study. These sales should be carefully reviewed. There are numerous considerations that may lead to the conclusion that the sale may indeed reflect market value.
• The term and rental rate of the lease should be considered. A lease back of only a few months at market rate rents may not have any impact on the sales price. The type of property being conveyed will influence the decision concerning lease term and rental rates. If lease terms are unable to be verified, the sale should probably be rejected from study.
• Was the property marketed and available to other potential buyers?
• Are there other comparable sales that would support the price paid for the subject sale?

2020 Sales Ratio Study Criteria 50
• How was the sale price determined? i.e. appraisal, negotiation…
21 Bank Sale (including HUD sales)
Any sale from a bank, HUD, FMHA, or any governmental lending institution, to a private party. These sales will be considered for use in the study only in regions where they are so prevalent that they mirror the actions of buyers and sellers of non-foreclosed property. Thorough verification is necessary before the PTCO will consider including these sales.
A s of repossessed property may be considered for use in the study. Thorough verification is required before these sales can be used. They should only be used if the sale meets the “open market, arms-length” requirement. Resales of repossessed property by lending institutions will not be adjusted for financing terms. Only the most recent non-rejected resale will be considered.
22 Below Minimum Down Payment
The minimum down payment for the study is five percent, unless the sales verification proves that the chance of default was extremely low or that the term is one year or less. Many warranty deed sales, especially residential sales with nominal down payments, are insured loan sales, and the buyer is considered a good risk. No down payment can be an acceptable form of financing on a warranty deed sale.
23 Sale Under Minimum
Property Type Minimum Price
Bare land sales $3,000
All other property $20,000
24 Multi County Sale
Sales of property located in more than one taxing jurisdiction, which do not have separate appraisals for the components of the sale, may be excluded.
25 a. Agricultural Preserves, b. Assessment Agreement
All sales enrolled in Agricultural Preserve and sales subject to minimum assessment agreements in which the sales price is less than the minimum assessment agreement.
26 Not Typical Market
Sales that are not advertised, listed, or promoted to potential buyers. A sale with this reject reason and no explanation attached will not be automatically rejected by the PTCO. Additional documentation is required.

2020 Sales Ratio Study Criteria 51
While this reject reason is valid, a blanket rejection of all sales that are “not advertised, listed or promoted” would reject many sales that still meet the Department of Revenue guidelines for sales that are open market and arms-length. IAAO recognizes the following as methods of marketing:
• Listing with a real estate broker • Auctions
• For sale by owner • Internet marketing
• Newspaper advertisements • Sealed bids
• Word of mouth
Three tests have been developed in an effort to: 1) maximize the number of sales in the study sample, 2) provide appraisers with all possible sales that reflect market value and market trends, and 3) help to establish benchmarks for current and future assessments.
The following three tests will help determine if the sale should be rejected or accepted for the study.
Was the sale exposed to the market, or announced and/or promoted through realtor listings, newspapers, or other publications, advertisements, brochures, or other promotional or informational mailings, including if the property was for sale by owner? o If YES, the sale SHOULD NOT be rejected. o If NO, go to test 2.
Was an appraisal done prior to the sale to establish the sale price or to be used as a starting point for negotiations? o If YES, the sale SHOULD NOT be rejected. o If NO, go to test 3.
Did the sale involve a willing and informed buyer and a willing and informed seller, neither of whom were under duress to buy or sell, and is the sale price typical of the market for this type of property in your assessment district? o If YES, the sale SHOULD NOT be rejected. o If NO, the sale SHOULD be rejected.
If it is determined through the verification process that the sale should be considered as a market comparable and meets all other acceptance criteria, then the sale should be included in the study.
Agricultural/rural vacant, apartment, and commercial/industrial sales should not be rejected simply because the property was not advertised. However, individual situations may warrant this reject reason on these property types.
Transfers with doubtful title should be rejected.
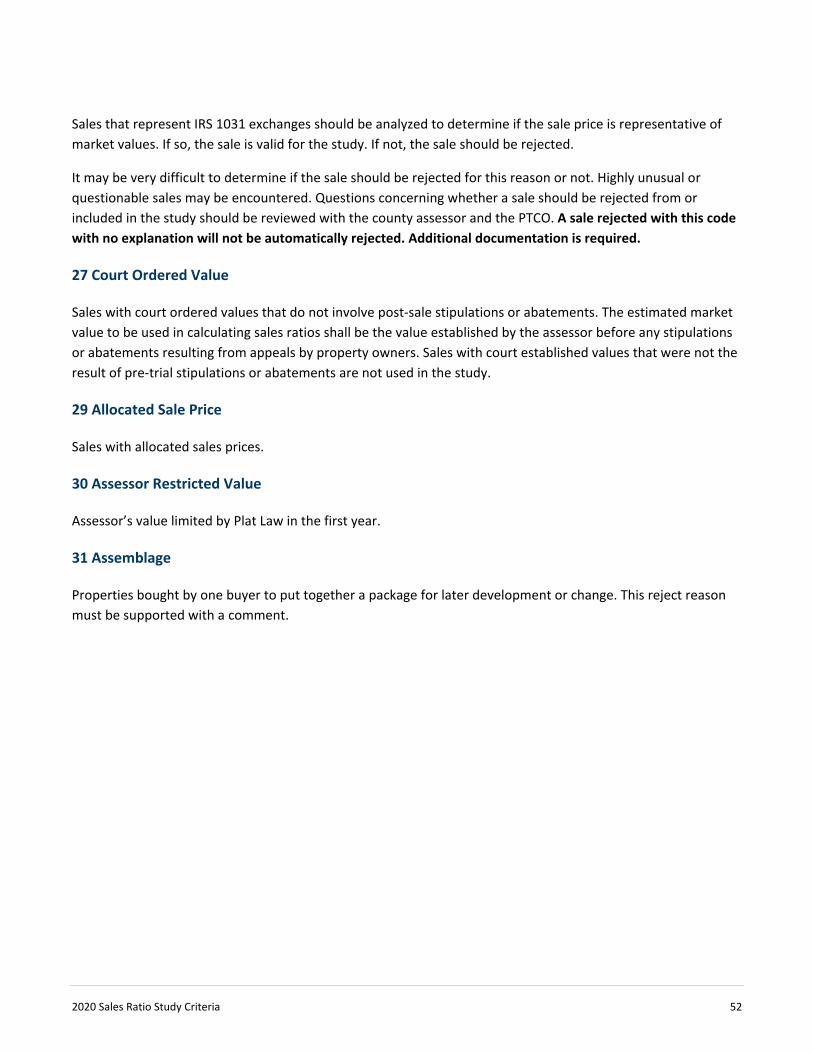
2020 Sales Ratio Study Criteria 52
Sales that represent IRS 1031 exchanges should be analyzed to determine if the sale price is representative of market values. If so, the sale is valid for the study. If not, the sale should be rejected.
It may be very difficult to determine if the sale should be rejected for this reason or not. Highly unusual or questionable sales may be encountered. Questions concerning whether a sale should be rejected from or included in the study should be reviewed with the county assessor and the PTCO. A sale rejected with this code with no explanation will not be automatically rejected. Additional documentation is required.
27 Court Ordered Value
Sales with court ordered values that do not involve post-sale stipulations or abatements. The estimated market value to be used in calculating sales ratios shall be the value established by the assessor before any stipulations or abatements resulting from appeals by property owners. Sales with court established values that were not the result of pre-trial stipulations or abatements are not used in the study.
29 Allocated Sale Price
Sales with allocated sales prices.
30 Assessor Restricted Value
Assessor’s value limited by Plat Law in the first year.
31 Assemblage
Properties bought by one buyer to put together a package for later development or change. This reject reason must be supported with a comment.

2021 Sales Ratio Study Criteria 53
Joint City Regions
City Name County of Location
Home County County Wide Trend Calculation
Base Region Default Region
Bellechester Goodhue Goodhue Goodhue Dennison, Wanamingo, Kenyon, Bellechester Goodhue County
Bellechester Wabasha Goodhue Wabasha Dennison, Wanamingo, Kenyon, Bellechester Wabasha County
Blaine Anoka Anoka County Anoka Blaine Anoka County
Blaine Ramsey Anoka County Ramsey Blaine Anoka County
Braham Isanti Isanti Isanti Balance of Isanti County Isanti County
Braham Kanabec Isanti Kanabec Balance of Isanti County Isanti County
Chanhassen Carver Carver County Carver Chanhassen & Victoria/Carver Water One Carver County
Chanhassen Hennepin Carver County Hennepin Chanhassen & Victoria/Carver Water One Carver County
Chatfield Fillmore Fillmore Fillmore Fillmore City Region One Fillmore County
Chatfield Olmsted Fillmore Olmsted Fillmore City Region One Fillmore County
Clearwater Stearns Wright Stearns Clearwater Wright County
Clearwater Wright Wright Wright Clearwater Wright County
Comfrey Brown Brown County Brown Balance of Brown County Brown County
Comfrey Cottonwood Brown County Cottonwood Balance of Brown County Brown County
Dayton Hennepin Hennepin Hennepin Dayton, Hanover, Rogers Hennepin County
Dayton Wright Hennepin Wright Otsego, Dayton Hennepin County
Dennison Goodhue Goodhue Goodhue Dennison, Wanamingo, Kenyon, Bellechester Goodhue County
Dennison Rice Goodhue Rice Dennison, Wanamingo, Kenyon, Bellechester Goodhue County
Eden Valley Meeker Meeker Meeker Balance of Meeker/Meeker Water 2 Meeker County

2020 Sales Ratio Study Criteria 54
City Name County of Location
Home County County Wide Trend Calculation
Base Region Default Region
Eden Valley Stearns Meeker Stearns Balance of Meeker/Meeker Water 2 Meeker County
Elysian Le Sueur Le Sueur Le Sueur Balance of Le Sueur County Le Sueur Country
Elysian Waseca Le Sueur Waseca Balance of Le Sueur County Le Sueur Country
Granite Falls Chippewa Yellow Medicine Chippewa Granite Falls Yellow Medicine County
Granite Falls Yellow Medicine Yellow Medicine Yellow Medicine Granite Falls Yellow Medicine County
Hanover Hennepin Wright Hennepin Dayton, Hanover, Rogers Hennepin County
Hanover Wright Wright Wright St. Michael, Hanover Wright County
Hastings Dakota Dakota Dakota Hastings Hastings On & Off Water
Hastings Washington Dakota Washington Hastings Hastings On & Off Water
Jasper Pipestone Pipestone Pipestone Jasper Pipestone County
Jasper Rock Pipestone Rock Jasper Pipestone County
La Crescent Houston Houston Houston Houston Region One Houston County
La Crescent Winona Houston Winona Balance of Winona County Winona County
Lake City Goodhue Wabasha Goodhue Lake City Wabasha County
Lake City Wabasha Wabasha Wabasha Lake City Wabasha County
Mankato Blue Earth Blue Earth Blue Earth Mankato, Skyline Blue Earth County
Mankato Le Sueur Blue Earth Le Sueur Mankato, Skyline Blue Earth County
Mankato Nicollet Blue Earth Nicollet Mankato, Skyline Blue Earth County
Minneiska Wabasha Wabasha Wabasha Balance of Wabasha Wabasha County
Minneiska Winona Wabasha Winona Balance of Wabasha Wabasha County
Minnesota Lake Blue Earth Faribault Blue Earth Balance of Faribault Faribault County
Minnesota Lake Faribault Faribault Faribault Balance of Faribault Faribault County

2020 Sales Ratio Study Criteria 55
City Name County of Location
Home County County Wide Trend Calculation
Base Region Default Region
Motley Cass Morrison Cass Motley Morrison County
Motley Morrison Morrison Morrison Motley Morrison County
New Prague Le Sueur Scott Le Sueur New Prague Scott County
New Prague Scott Scott Scott New Prague Scott County
North Mankato Blue Earth Nicollet Blue Earth North Mankato Nicollet County
North Mankato Nicollet Nicollet Nicollet North Mankato Nicollet County
Northfield Dakota Rice Dakota Northfield Rice County
Northfield Rice Rice Rice Northfield Rice County
Ormsby Martin Watonwan Martin Balance of Watonwan County Watonwan County
Ormsby Watonwan Watonwan Watonwan Balance of Watonwan County Watonwan County
Osakis Douglas Douglas Douglas Osakis Douglas County
Osakis Todd Douglas Todd Osakis Douglas County
Pine Island Goodhue Goodhue Goodhue Goodhue, Pine Island, Zumbrota Goodhue County
Pine Island Olmsted Goodhue Olmsted Byron, Stewartville, Pine Island Olmsted County
Princeton Mille Lacs Mille Lacs Mille Lacs Princeton Mille Lacs County
Princeton Sherburne Mille Lacs Sherburne Princeton Mille Lacs County
Rockford Hennepin Wright Hennepin Hennepin West Central Wright County
Rockford Wright Wright Wright Rockford City Wright County
Roosevelt Lake of the Woods Roseau Lake of the
Woods Balance of Roseau County Roseau County
Roosevelt Roseau Roseau Roseau Balance of Roseau County Roseau County
Rothsay Otter Tail Wilkin Otter Tail Rothsay Wilkin County
Rothsay Wilkin Wilkin Wilkin Rothsay Wilkin County Trend

2020 Sales Ratio Study Criteria 56
City Name County of Location
Home County County Wide Trend Calculation
Base Region Default Region
Royalton Benton Morrison Benton Balance of Morrison County Morrison County Trend
Royalton Morrison Morrison Morrison Balance of Morrison County Morrison County Trend
Sartell Benton Stearns Benton Sartell Stearns County Trend
Sartell Stearns Stearns Stearns Sartell Stearns County Trend
Spring Lake Park Anoka Anoka County Anoka Spring Lake Park Anoka County Trend
Spring Lake Park Ramsey Anoka County Ramsey Spring Lake Park Anoka County Trend
St. Anthony Hennepin Hennepin Hennepin St. Anthony St. Anthony On & Off
St. Anthony Ramsey Hennepin Ramsey St. Anthony St. Anthony On & Off
St. Cloud Benton Stearns St. Cloud St. Cloud St. Cloud
St. Cloud Sherburne Stearns St. Cloud St. Cloud St. Cloud
St. Cloud Stearns Stearns St. Cloud St. Cloud St. Cloud
St. Francis Anoka Anoka County Anoka St. Francis, Bethel Anoka County
St. Francis Isanti Anoka County Isanti St. Francis, Bethel Anoka County
Staples Todd Todd Todd Staples Todd County Trend
Staples Wadena Todd Wadena Staples Todd County Trend
Swanville Morrison Morrison Morrison Balance of Morrison County Morrison County Trend
Swanville Todd Morrison Todd Balance of Morrison County Morrison County Trend
Wadena Otter Tail Wadena Otter Tail Wadena Wadena County Trend
Wadena Wadena Wadena Wadena Wadena Wadena County Trend
White Bear Lake Ramsey Ramsey Ramsey White Bear Lake Ramsey County Trend
White Bear Lake Washington Ramsey Washington Mahtomedi, Willernie, Pine Springs, Birchwood, White Bear Lake
Washington County Trend

2021 Sales Ratio Study Criteria 57
Agricultural/Rural Vacant Region Map