Embed Size (px)
Citation preview

2021 North American Alternative Asset Management Marketing and Investor Relations Professional Compensation Survey
Financial Services Practice

Document title
2

Heidrick & Struggles
3
Contents A message from the authors 4
Methodology 4
Alternative asset management market context 5
Base and bonus compensation trends, 2018–2020 8

A message from the authors
2021 North American Alternative Asset Management Marketing and Investor Relations Professional Compensation Survey
4
Welcome to our second annual North American Alternative Asset Management Marketing and Investor Relations Professional Compensation Survey.
Together with our surveys of private equity investment and operating professionals, this report provides a comprehensive picture of the compensation that North American executives in the hedge fund, real estate, and private equity industries currently receive.
For this report, Heidrick & Struggles compiled compensation data from a survey of 366 alternative asset management marketing and investor relations professionals in North America who are employed in private equity, hedge funds, or real estate.
We hope you enjoy reading the report, which remains the only one of its kind. As always, suggestions are welcome, so please feel free to contact us—or your Heidrick & Struggles representative—with questions and comments.
With warmest regards,
On confidentiality
The North America alternative asset management marketing and investor relations professional compensation survey, 2021, was conducted on an anonymous basis.
Acknowledgments
The authors wish to thank Mohd Arsalan and Daria Sklyarova for their contributions to this report.
Graham Beatty Partner Financial Services Practice
Paul Charles Partner Financial Services Practice
John Hindley Partner Financial Services Practice
Methodology
In an online survey in the field in April and May of 2021, we asked participants to provide their compensation data for 2018, 2019, and 2020. All data collected was self-reported by the survey respondents and has been aggregated to evaluate trends in cash base salary and bonus compensation packages.
Heidrick & Struggles
5
This year’s survey of compensation of marketing and investor relations professionals in the hedge fund, real estate investment, and private equity industries is set in the context of a reacceleration of these sectors after a pause early in the COVID-19 pandemic. In addition, requirements to work remotely for most executives have altered some dynamics, particularly in fundraising.
We have seen that larger, better-known firms have, on the whole, had an edge in fundraising across all three sectors. This reflects a greater comfort level with name firms during uncertainty, as well as the economy-wide trend of connecting with fewer new people during the pandemic.1 Digital assets (including bitcoin) have also been strong performers. It’s notable, however, that 14% of respondents to the survey indicated their firm had not raised new money in 2020.
The fundraising edge of larger firms means that they have also been more able to innovate and introduce new products, while smaller firms tended to bring fewer new products to market over the past year. That said, 70% of all respondents indicated their firm’s performance had improved in 2020 compared with 2019, and 11% said performance was up 20% or more.
In terms of hiring trends, last year we noted a competitive market—and it has only become more so. This is true for all candidates and particularly for candidates diverse in terms of gender or race and ethnicity. Firms have become very focused on adding diverse executives and are willing to offer significant rises in base and bonus to attract them. Here too, just as larger firms have been more able to innovate their products, they have, in our experience, been more able to increase the diversity of their leadership teams. The demographics of our survey respondents highlight this point: the lowest share of white respondents, 58%, and the highest share of Latinx respondents, 5%, were at companies with more than $30 billion in assets under management. The highest share of white respondents, 81%, was at firms with $5 billion to $10 billion in assets under management; the highest share of male respondents, 67%, is at firms with under $1 billion in assets under management.
As for executives, after seeing some hesitance to change firms during the height of the uncertainty, we have seen an increasing willingness to move, particularly to the larger firms. Given that it can be harder to break into new markets or products while remote work continues, some
smaller firms may be able to compete by seeking out people who want to leave their current firm but stay in the same field.
A strong majority of respondents, 71%, said there had been no change in performance expectations last year after COVID-19 began affecting business operations, and a slim majority expect cash compensation this year to rise over last year.
Looking ahead, we expect demand for diverse executives to continue to rise, and we see increasing interest from many firms in finding executives with experience in ESG investing, both of which should lead to higher compensation for executives who meet those criteria.
Alternative asset management market context
1 “The next great disruption is hybrid work—are we ready?” 2020 Work Trend Index Annual Report, Microsoft, March 22, 2021, microsoft.com.
Source: Heidrick & Struggles’ North America alternative asset management marketing and investor relations professional compensation survey, 2021, n=321 investment professionals
New money raised 2020
N/A
$1bn or less
$1bn–$5bn
$5bn–$10bn
More than $10bn
Prefer not to answer
14
38
21
4
10
12
Source: Heidrick & Struggles’ North America alternative asset management marketing and investor relations professional compensation survey, 2021, n=366 investment professionals
2020 target or expectation changes, post-COVID-19 (%)
10
18
71
Yes, they were raised
Yes, they were lowered
No
Source: Heidrick & Struggles’ North America alternative asset management marketing and investor relations professional compensation survey, 2021, n=366 investment professionals
Total cash compensation expectations compared to 2020 (%)
Down 21% or more
Down 11–20%
Down 0–10%
Flat
Up 0–10%
Up 11–20%
Up 21% or more
Prefer not to answer
4
4
1
29
24
18
14
5

2021 North American Alternative Asset Management Marketing and Investor Relations Professional Compensation Survey
6
DemographicsNearly half of the respondents to this survey had more than 20 years of work experience, and nearly two-thirds had more than 10 years’ experience in alternative asset fundraising.
Source: Heidrick & Struggles’ North America alternative asset management marketing and investor relations professional compensation survey, 2021, n=366 investment professionals
Endowments/foundations
Public pensions
Family office
Corporate pensions
Consultants
Sovereign wealth funds/international pension funds
Retail/wealth management
Taft-Hartley
Insurance/healthcare
Other
84
81
80
78
76
64
42
3
6
49
Total years of work experience (%) Years of AM fundraising experience (%)
0–2
3–5
6–10
11–15
16–20
More than 20
Prefer not to answer
0–2
3–5
6–10
11–15
16–20
More than 20
Prefer not to answer
0 2
0
0 1
6 27
8
17 20 13 18 28 4
Note: Numbers may not sum to 100% due to rounding. Source: Heidrick & Struggles’ North America alternative asset management marketing and investor relations professional compensation survey, 2021, n=366 investment professionals
Note: Numbers may not sum to 100% because respondents were able to choose more than one answer. Source: Heidrick & Struggles’ North America alternative asset management marketing and investor relations professional compensation survey, 2021, n=366 investment professionals
AUM (%)
16 20 13 17 332021
2020
Sales and investor relations
Head of sales (player-coach)
Sales individual producer
Head of sales (manager)
Product specialist
Consultant relations
Sales management and strategy
Other, please specify
37
21
14
7
6
5
8
2
Role (%) Investments covered (%)
Hedge funds
Private credit (in long-locked format)
Private equity
Real assets
Fund of funds
Other
44
44
43
37
12
10
Products covered (%)
22 35
25 19
848
In terms of their firms, a third of respondents belonged to firms with more than $30 billion under management.
Just over a third of respondents were in sales and investor relations, covering a wide range of products and investments.
Less than $1bn $1bn–$5bn $5bn–$10bn $10bn–$30bn More than $30bn Was at a different firm last year

Heidrick & Struggles
7
White/Caucasian
Prefer not to answer
Asian/Asian American
Black/African American
Mixed/Two or more races
Arab/Arab American/Middle Eastern
Hispanic/Latinx
Native Hawaiian/Pacific Islander
Other
Source: Heidrick & Struggles’ North America alternative asset management marketing and investor relations professional compensation survey, 2021, n=322 investment professionals
Source: Heidrick & Struggles’ North America alternative asset management marketing and investor relations professional compensation survey, 2021, n=320 investment professionals
Gender (%) Ethnicity (%)
7
37
56
Just over half of respondents were male, and the majority were white.
0
2
2
2
3
1
70
11
10
Female Male Prefer not to say

2021 North American Alternative Asset Management Marketing and Investor Relations Professional Compensation Survey
8
Overall Compensation for alternative asset marketing and investor relations professionals in all three sectors on the whole rises with seniority and size of firm, though there
is some variation. Viewed by industry sector for 2020, professionals in hedge funds surpassed the other two sectors in median total cash compensation.2
Base and bonus compensation trends, 2018–2020
238
350
238
350
238
350
238
250
238
250
238
400
238
400
263
450
238
350
226
250
263
450
238
450
288
700
325
550
263
350
288
750
188
150
238
150
Overall Head of sales
Sales individual producer
Sales and investor relations
Other Vice president
0–5 Under $1bn
Principal 6–10 $1bn– $5bn
Director 11–15 $5bn– $10bn
Managing director
16–20 $10bn–$30bn
Partner More than 20
Over $30bn
Compensation 2020: Private equity/creditMedian base Median bonus Median total cash compensation
675 1,063 675 551 594 363 513 463 800 1,457 513 538 713 988 975 438 638 676 675 757
Role type Title AM experience AUM 2021
325
1,038
238
250
2 Median total cash compensation figures are not always the total of median base and median bonus figures, because not all respondents received a bonus.Source: Heidrick & Struggles’ North America alternative asset management marketing and investor relations professional compensation survey, 2021, n=252 investment professionals

Heidrick & Struggles
9
Overall Head of sales
Sales individual producer
Sales and investor relations
Other Vice president
0–5 Under $1bn
Principal 6–10 $1bn– $5bn
Director 11–15 $5bn– $10bn
Managing director
16–20 $10bn–$30bn
Partner More than 20
Over $30bn
Compensation 2020: Hedge fundsMedian base Median bonus Median total cash compensation
726 988 688 563 726 238 613 526 894 1,038 438 588 788 975 863 488 788 663 788 875
Role type Title AM experience AUM 2021
238
450
238238
450
213
350
263
450
750
238213 213 213
450
238
350
238
550
450
263238
550550
300
263
600
238 238 238
550
750
600
850
163
75 238
250
201
250
Source: Heidrick & Struggles’ North America alternative asset management marketing and investor relations professional compensation survey, 2021, n=182 investment professionals

2021 North American Alternative Asset Management Marketing and Investor Relations Professional Compensation Survey
10
Overall Head of sales
Sales individual producer
Sales and investor relations
Other Vice president
0–5 Under $1bn
Principal 6–10 $1bn– $5bn
Director 11–15 $5bn– $10bn
Managing director
16–20 $10bn–$30bn
Partner More than 20
Over $30bn
Compensation 2020: Real estateMedian base Median bonus Median total cash compensation
638 1,126 526 501 657 301 513 463 775 1,338 463 463 588 901 1,107 463 550 675 488 726
Role type Title AM experience AUM 2021
325
213 213 213 213 213213
288
250250 250
450
263
450
288
450
238
600
950
188
75
250 250 250
251
350
238
300
213
250
251
250
263
350350
325 325 325
800 800
Source: Heidrick & Struggles’ North America alternative asset management marketing and investor relations professional compensation survey, 2021, n=136 investment professionals

Heidrick & Struggles
11
Compensation trends, 2018–2020: Private equity/credit2018 2019 2020
Source: Heidrick & Struggles’ North America alternative asset management marketing and investor relations professional compensation survey, 2021, n=252 investment professionals
Base
25th percentile Mean 75th percentile 25th percentile Mean 75th percentile 25th percentile Mean 75th percentile
Overall (n=232) 188 238 288 213 238 325 213 238 325
SPEC
IFIC
RO
LE
Head of sales (n=68) 238 238 325 238 263 325 238 288 325
Sales individual producer (n=32) 169 213 288 188 238 288 213 238 325
Sales and investor relations (n=82) 163 213 263 188 213 263 188 238 263
Other (n=50) 188 238 325 188 238 325 213 263 325
TITL
E
Vice president (n=24) 125 163 182 163 163 207 163 188 213
Principal (n=13) 188 213 263 213 238 263 213 238 263
Director (n=46) 163 188 238 163 213 238 188 226 263
Managing director (n=95) 213 238 325 238 263 325 238 263 325
Partner (n=30) 238 307 388 238 325 450 238 325 450
YEA
RS
EXPE
RIEN
CE
0–5 (n=24) 163 201 238 169 238 257 188 238 263
6–10 (n=74) 163 213 263 188 238 263 213 238 325
11–15 (n=70) 188 238 288 213 238 288 213 238 325
16–20 (n=42) 213 263 325 238 276 388 238 288 388
More than 20 (n=21) 238 263 325 238 288 325 213 325 325
AU
M 2
021
Under $1bn (n=35) 163 238 263 188 263 288 188 238 288
$1bn–$5bn (n=36) 176 238 325 213 238 325 213 238 372
$5bn–$10bn (n=24) 188 226 263 213 238 282 213 238 325
$10bn–$30bn (n=43) 163 188 263 188 213 263 213 238 325
Over $30bn (n=94) 188 238 288 213 238 325 213 263 325
Bonu
s
Overall 150 350 650 150 350 750 250 350 750
SPEC
IFIC
RO
LE
Head of sales (n=68) 350 650 1,125 350 750 1,125 350 750 1,125
Sales individual producer (n=32) 150 350 450 150 350 525 250 350 525
Sales and investor relations (n=82) 150 250 450 150 250 450 150 350 550
Other (n=50) 150 250 550 150 350 550 150 350 650
TITL
E
Vice president (n=24) 75 150 150 75 150 225 75 150 250
Principal (n=13) 150 250 350 250 250 350 250 250 450
Director (n=46) 150 150 350 150 250 350 150 250 350
Managing director (n=95) 250 450 750 350 550 850 350 450 850
Partner (n=30) 350 850 1,625 450 900 1,375 550 1,038 1,375
YEA
RS
EXPE
RIEN
CE
0–5 (n=24) 75 150 350 150 250 350 175 250 450
6–10 (n=74) 150 250 450 150 250 450 150 250 450
11–15 (n=70) 150 350 650 250 450 850 250 450 750
16–20 (n=42) 250 600 1,125 350 750 1,125 350 700 1,125
More than 20 (n=21) 150 550 850 150 550 1,125 250 550 1,125
AU
M 2
021
Under $1bn (n=35) 75 150 450 75 150 350 75 150 350
$1bn–$5bn (n=36) 150 300 625 150 300 750 250 400 800
$5bn–$10bn (n=24) 150 350 725 250 400 750 250 400 650
$10bn–$30bn (n=43) 150 350 850 150 350 850 250 350 850
Over $30bn (n=94) 150 350 750 250 400 850 250 450 850
Tota
l cas
h co
mpe
nsat
ion
Overall 338 588 957 391 638 1,013 438 675 1,038
SPEC
IFIC
RO
LE
Head of sales (n=68) 619 976 1,394 588 1,013 1,560 578 1,063 1,560
Sales individual producer (n=32) 338 563 710 376 613 776 444 675 826
Sales and investor relations (n=82) 313 463 688 338 513 763 363 551 813
Other (n=50) 338 538 813 388 557 875 413 594 975
TITL
E
Vice president (n=24) 210 313 338 247 313 401 288 363 513
Principal (n=13) 338 488 675 463 488 675 463 513 675
Director (n=46) 313 388 538 338 451 588 388 463 588
Managing director (n=95) 563 763 988 588 788 1,113 600 800 1,175
Partner (n=30) 738 1,163 1,863 788 1,213 1,825 788 1,457 1,825
YEA
RS
EXPE
RIEN
CE
0–5 (n=24) 266 363 588 326 451 666 401 513 707
6–10 (n=74) 338 451 688 363 513 738 400 538 738
11–15 (n=70) 438 651 963 463 701 1,063 463 713 1,038
16–20 (n=42) 538 901 1,363 588 1,007 1,513 663 988 1,513
More than 20 (n=21) 400 800 1,113 400 788 1,413 463 975 1,450
AU
M 2
021
Under $1bn (n=35) 313 413 713 313 438 688 288 438 675
$1bn–$5bn (n=36) 313 575 997 369 575 1,107 463 638 1,166
$5bn–$10bn (n=24) 338 651 972 444 663 1,013 451 676 913
$10bn–$30bn (n=43) 338 588 1,013 363 663 1,013 463 675 1,175
Over $30bn (n=94) 413 638 988 463 688 1,088 463 757 1,138
Over the three years from 2018 to 2020, we saw some change—mostly increases—year over year, but a bit less than might have been expected. This is probably because the pause
in early 2020 flattened the trajectory. Most respondents, 85%, said their bonuses were discretionary, and just over half, 57%, said that none of their 2020 bonus had been deferred.

2021 North American Alternative Asset Management Marketing and Investor Relations Professional Compensation Survey
12
Compensation trends, 2018–2020: Hedge funds
Source: Heidrick & Struggles’ North America alternative asset management marketing and investor relations professional compensation survey, 2021, n=182 investment professionals
2018 2019 2020
25th percentile Mean 75th percentile 25th percentile Mean 75th percentile 25th percentile Mean 75th percentile
Overall (n=182) 188 238 288 188 238 288 188 238 288
SPEC
IFIC
RO
LE
Head of sales (n=57) 213 238 288 238 238 325 213 238 325
Sales individual producer (n=27) 163 188 288 188 238 288 188 238 288
Sales and investor relations (n=62) 163 188 238 163 213 238 188 213 238
Other (n=36) 188 263 325 188 251 325 213 263 325
TITL
E
Vice president (n=7) 125 125 163 125 163 163 125 163 288
Principal (n=3) 125 213 263 163 213 263 163 213 213
Director (n=50) 163 188 238 163 213 238 188 213 263
Managing director (n=62) 188 238 288 213 263 325 213 263 325
Partner (n=33) 213 238 325 213 238 288 213 238 288
YEA
RS
EXPE
RIEN
CE
0–5 (n=19) 163 213 238 163 238 238 188 238 288
6–10 (n=47) 163 213 263 163 238 263 188 238 288
11–15 (n=67) 188 238 263 188 238 288 188 238 288
16–20 (n=33) 213 238 288 213 238 325 213 238 325
More than 20 (n=14) 188 238 288 188 263 325 188 238 325
AU
M 2
021
Under $1bn (n=24) 163 201 263 163 201 263 163 201 238
$1bn–$5bn (n=41) 188 238 238 188 238 263 188 238 263
$5bn–$10bn (n=25) 188 213 263 188 213 263 188 213 263
$10bn–$30bn (n=33) 163 213 238 188 238 263 213 238 288
Over $30bn (n=59) 188 263 325 213 263 325 213 263 325
Overall (n=182) 150 350 750 150 450 750 250 450 850
SPEC
IFIC
RO
LE
Head of sales (n=57) 350 750 1,125 350 750 1,375 350 750 1,375
Sales individual producer (n=27) 150 350 450 150 350 550 250 450 550
Sales and investor relations (n=62) 150 250 550 150 250 550 150 350 750
Other (n=36) 250 400 650 250 400 750 250 450 750
TITL
E
Vice president (n=7) 75 75 150 75 75 150 75 75 250
Principal (n=3) 150 250 250 250 250 250 250 450 450
Director (n=50) 150 250 350 150 250 450 150 300 550
Managing director (n=62) 350 550 850 350 600 950 450 600 950
Partner (n=33) 350 850 1,125 250 650 1,375 250 850 1,375
YEA
RS
EXPE
RIEN
CE
0–5 (n=19) 75 150 350 75 150 250 75 250 350
6–10 (n=47) 150 350 550 150 250 650 150 350 650
11–15 (n=67) 250 350 850 250 450 850 350 550 950
16–20 (n=33) 450 650 1,125 550 750 1,375 450 750 1,375
More than 20 (n=14) 150 600 750 150 650 850 350 600 850
AU
M 2
021
Under $1bn (n=24) 150 350 625 150 250 625 94 250 525
$1bn–$5bn (n=41) 150 350 850 250 450 850 350 550 950
$5bn–$10bn (n=25) 150 450 750 150 450 750 150 450 650
$10bn–$30bn (n=33) 150 350 850 150 450 850 150 550 850
Over $30bn (n=59) 250 350 850 250 550 850 250 550 950
Overall (n=182) 363 651 1,013 388 688 1,075 438 726 1,113
SPEC
IFIC
RO
LE
Head of sales (n=57) 588 988 1,363 588 1,013 1,613 688 988 1,613
Sales individual producer (n=27) 313 588 738 363 538 788 438 688 838
Sales and investor relations (n=62) 275 426 763 313 463 838 338 563 988
Other (n=36) 444 713 1,022 438 719 1,022 444 726 975
TITL
E
Vice president (n=7) 200 200 313 200 238 313 200 238 538
Principal (n=3) 275 463 513 413 463 513 463 613 663
Director (n=50) 313 438 588 338 463 738 338 526 813
Managing director (n=62) 588 775 1,038 638 869 1,175 688 894 1,238
Partner (n=33) 675 1,038 1,575 575 888 1,825 538 1,038 1,700
YEA
RS
EXPE
RIEN
CE
0–5 (n=19) 263 338 563 313 388 538 313 438 713
6–10 (n=47) 363 588 813 338 588 888 338 588 988
11–15 (n=67) 438 688 1,088 463 738 1,138 538 788 1,238
16–20 (n=33) 663 975 1,413 788 1,075 1,613 713 975 1,613
More than 20 (n=14) 275 863 1,038 363 913 1,238 475 863 1,300
AU
M 2
021
Under $1bn (n=24) 275 607 888 285 476 882 275 488 785
$1bn–$5bn (n=41) 388 588 1,038 438 688 1,175 563 788 1,238
$5bn–$10bn (n=25) 338 663 988 338 663 1,038 363 663 913
$10bn–$30bn (n=33) 313 663 1,013 338 738 1,038 438 788 1,175
Over $30bn (n=59) 438 638 1,088 438 763 1,238 488 875 1,300
Base
Bonu
sTo
tal c
ash
com
pens
atio
n

Heidrick & Struggles
13
Source: Heidrick & Struggles’ North America alternative asset management marketing and investor relations professional compensation survey, 2021, n=136 investment professionals
2018 2019 2020
25th percentile Mean 75th percentile 25th percentile Mean 75th percentile 25th percentile Mean 75th percentile
Overall (n=136) 188 238 288 194 238 325 213 251 325
SPEC
IFIC
RO
LE
Head of sales (n=36) 238 325 388 263 325 388 263 325 388
Sales individual producer (n=28) 163 201 257 169 213 263 188 238 288
Sales and investor relations (n=44) 163 213 263 188 213 282 188 213 282
Other (n=28) 194 263 288 194 263 316 213 263 325
TITL
E
Vice president (n=12) 125 125 163 163 163 188 163 188 213
Principal (n=5) 188 213 263 188 213 263 188 213 213
Director (n=27) 163 188 213 163 188 213 188 213 238
Managing director (n=57) 238 263 325 238 263 325 238 288 325
Partner (n=17) 288 325 388 288 325 388 288 325 388
YEA
RS
EXPE
RIEN
CE
0–5 (n=13) 125 163 238 163 188 263 188 213 263
6–10 (n=33) 163 213 238 163 213 263 188 213 288
11–15 (n=53) 188 238 288 213 238 288 213 238 288
16–20 (n=28) 263 325 388 263 325 388 263 325 388
More than 20 (n=8) 238 307 372 251 325 388 251 325 435
AU
M 2
021
Under $1bn (n=18) 163 226 263 163 226 288 163 213 288
$1bn–$5bn (n=20) 213 251 388 213 263 388 213 251 388
$5bn–$10bn (n=15) 188 238 325 188 288 325 213 288 325
$10bn–$30bn (n=17) 163 213 263 188 213 263 188 213 238
Over $30bn (n=66) 213 238 288 213 251 325 213 263 325
Overall (n=136) 150 350 650 150 350 650 150 350 725
SPEC
IFIC
RO
LE
Head of sales (n=36) 475 650 950 475 750 1,125 375 800 1,125
Sales individual producer (n=28) 75 200 350 150 250 425 150 300 450
Sales and investor relations (n=44) 94 250 450 150 250 450 94 250 450
Other (n=28) 150 300 650 94 300 750 150 350 725
TITL
E
Vice president (n=12) 75 75 150 75 113 225 75 75 225
Principal (n=5) 250 250 250 250 250 250 250 250 350
Director (n=27) 75 150 350 75 150 350 75 250 350
Managing director (n=57) 250 450 750 250 450 750 350 450 850
Partner (n=17) 550 750 1,375 550 850 1,375 550 950 1,375
YEA
RS
EXPE
RIEN
CE
0–5 (n=13) 75 150 350 75 150 450 75 250 450
6–10 (n=33) 150 150 350 150 250 350 150 250 450
11–15 (n=53) 150 350 550 250 450 650 250 350 550
16–20 (n=28) 250 500 750 275 600 825 350 600 1,081
More than 20 (n=8) 400 650 750 400 700 825 400 800 850
AU
M 2
021
Under $1bn (n=18) 75 200 450 75 200 450 75 250 350
$1bn–$5bn (n=20) 150 350 550 150 400 725 94 250 650
$5bn–$10bn (n=15) 150 450 650 75 450 650 75 450 750
$10bn–$30bn (n=17) 75 250 350 150 250 350 150 250 350
Over $30bn (n=66) 150 350 750 250 400 850 250 450 850
Overall (n=136) 338 576 972 388 613 1,038 438 638 985
SPEC
IFIC
RO
LE
Head of sales (n=36) 778 1,019 1,313 778 1,088 1,513 700 1,126 1,560
Sales individual producer (n=28) 313 413 632 319 463 672 363 526 707
Sales and investor relations (n=44) 266 513 672 294 526 672 288 501 663
Other (n=28) 319 538 1,022 338 538 1,066 382 657 972
TITL
E
Vice president (n=12) 200 238 313 238 288 388 238 301 419
Principal (n=5) 463 513 513 463 513 513 463 513 538
Director (n=27) 263 338 513 313 388 538 313 463 563
Managing director (n=57) 538 713 1,000 588 775 1,088 563 775 1,113
Partner (n=17) 788 1,100 1,663 788 1,175 1,825 788 1,338 1,825
YEA
RS
EXPE
RIEN
CE
0–5 (n=13) 200 313 563 263 313 688 288 463 713
6–10 (n=33) 313 363 638 313 438 588 338 463 675
11–15 (n=53) 438 613 788 463 638 875 463 588 875
16–20 (n=28) 557 844 1,066 603 938 1,138 629 901 1,422
More than 20 (n=8) 703 963 1,066 703 1,038 1,197 703 1,107 1,285
AU
M 2
021
Under $1bn (n=18) 263 476 713 263 426 675 263 463 675
$1bn–$5bn (n=20) 332 682 1,000 407 694 1,104 363 550 1,047
$5bn–$10bn (n=15) 363 775 988 288 675 1,038 288 675 1,138
$10bn–$30bn (n=17) 288 413 613 338 513 663 363 488 588
Over $30bn (n=66) 388 601 1,038 463 651 1,100 488 726 1,188
Base
Bonu
sTo
tal c
ash
com
pens
atio
n
Compensation trends, 2018–2020: Real estate

2021 North American Alternative Asset Management Marketing and Investor Relations Professional Compensation Survey
14
Gender, racial, and ethnic diversity
The survey shows that white or Asian male executives across sectors report higher median cash compensation than female executives or those who are Black, Hispanic, or Latinx. The overall difference in reported cash compensation is consistently greater for women
than racially or ethnically diverse executives. This may be related to the fact that firms are paying a particular premium for racially or ethnically diverse executives because of the very low numbers of them in the industry.
Compensation 2020: Private equity/credit Compensation 2020: Hedge funds
Median base Median bonus Median total cash compensation
588 688 575 688 663 675
Overall diversity Gender Ethnicity
Diverse overall
Not diverse Female Male Black/Hispanic/
Latinx
White/Asian
238 238 238 238 238
350 350 350 350
263
450450
569 769 488 782 563 738
Overall diversity Gender Ethnicity
Diverse overall
Not diverse Female Male Black/Hispanic/
Latinx
White/Asian
213238
213 213238
350300
350
450
263
500
450
Source: Heidrick & Struggles’ North America alternative asset management marketing and investor relations professional compensation survey, 2021, n=252 investment professionals
Compensation 2020: Real estate
501 675 488 675 638 638
Overall diversity Gender Ethnicity
Diverse overall
Not diverse Female Male Black/Hispanic/
Latinx
White/Asian
226263
213 213263
250 250
350350
263
450400
Source: Heidrick & Struggles’ North America alternative asset management marketing and investor relations professional compensation survey, 2021, n=136 investment professionals
Source: Heidrick & Struggles’ North America alternative asset management marketing and investor relations professional compensation survey, 2021, n=182 investment professionals
Heidrick & Struggles
15
25th pct Mean 75th pct
Overall (n=76) 725 2,450 4,375
SPEC
IFIC
RO
LE
Head of sales (n=30) 1,470 3,000 9,000
Sales individual producer (n=7) 200 400 8,650
Sales and investor relations (n=33) 1,000 2,000 3,500
Other (n=6) 1,200 7,000 11,000
TITL
E
Vice president (n=9) 400 700 1,000
Principal (n=6) 1,500 3,000 3,200
Director (n=8) 625 2,620 11,000
Managing director (n=30) 1,110 2,750 4,000
Partner (n=19) 1,850 3,000 11,000
YEA
RS
EXPE
RIEN
CE
0–5 (n=4) 550 1,235 3,368
6–10 (n=26) 500 1,620 4,000
11–15 (n=22) 1,110 3,000 8,650
16–20 (n=19) 1,850 2,500 9,000
More than 20 (n=5) 500 3,000 11,000
AU
M 2
021
Under $1bn (n=16) 500 1,925 4,000
$1bn–$5bn (n=21) 700 2,000 3,000
$5bn–$10bn (n=7) 3,000 4,000 8,500
$10bn–$30bn (n=13) 800 1,500 11,000
Over $30bn (n=19) 500 3,000 7,200
25th pct Mean 75th pct
Overall (n=33) 500 3,440 5,000
SPEC
IFIC
RO
LE
Head of sales (n=16) 975 3,220 5,750
Sales individual producer (n=4) 40 150 350
Sales and investor relations (n=9) 2,500 4,000 4,900
Other (n=4) 2,350 5,500 8,500
TITL
E
Vice president (n=0) N/A N/A N/A
Principal (n=0) N/A N/A N/A
Director (n=8) 475 2,650 9,250
Managing director (n=8) 250 2,750 3,860
Partner (n=10) 3,000 3,875 5,000
YEA
RS
EXPE
RIEN
CE
0–5 (n=2) 400 2,200 4,000
6–10 (n=8) 475 2,650 4,000
11–15 (n=14) 3,000 3,875 7,000
16–20 (n=7) 100 500 10,000
More than 20 (n=2) 3,000 4,500 6,000
AU
M 2
021
Under $1bn (n=12) 825 3,875 6,750
$1bn–$5bn (n=8) 283 3,000 7,975
$5bn–$10bn (n=0) N/A N/A N/A
$10bn–$30bn (n=5) 2,400 3,000 4,000
Over $30bn (n=8) 250 3,000 4,750
25th pct Mean 75th pct
Overall (n=76) 1,000 3,550 9,938
SPEC
IFIC
RO
LE
Head of sales (n=30) 3,000 5,215 11,000
Sales individual producer (n=7) 400 1,000 8,660
Sales and investor relations (n=33) 1,000 3,000 5,600
Other (n=6) 2,000 7,000 11,000
TITL
E
Vice president (n=9) 450 700 1,000
Principal (n=6) 1,500 4,100 6,000
Director (n=8) 775 2,620 11,000
Managing director (n=30) 2,000 3,550 8,660
Partner (n=19) 3,000 6,000 11,000
YEA
RS
EXPE
RIEN
CE
0–5 (n=4) 550 2,500 5,073
6–10 (n=26) 600 3,000 6,000
11–15 (n=22) 1,500 3,520 10,000
16–20 (n=19) 3,000 5,000 11,000
More than 20 (n=5) 1,000 5,000 11,000
AU
M 2
021
Under $1bn (n=16) 700 2,500 4,000
$1bn–$5bn (n=21) 1,500 3,000 5,430
$5bn–$10bn (n=7) 3,600 6,000 10,000
$10bn–$30bn (n=13) 1,000 3,000 11,000
Over $30bn (n=19) 2,000 6,200 11,000
25th pct Mean 75th pct
Overall (n=33) 1,800 4,000 7,000
SPEC
IFIC
RO
LE
Head of sales (n=16) 2,550 4,375 7,275
Sales individual producer (n=4) 40 250 850
Sales and investor relations (n=9) 3,500 4,900 10,000
Other (n=4) 2,350 5,500 8,500
TITL
E
Vice president (n=0) N/A N/A N/A
Principal (n=0) N/A N/A N/A
Director (n=8) 475 2,650 9,250
Managing director (n=8) 550 3,220 9,000
Partner (n=10) 3,750 4,950 6,000
YEA
RS
EXPE
RIEN
CE
0–5 (n=2) 400 2,200 4,000
6–10 (n=8) 550 2,650 9,000
11–15 (n=14) 3,000 4,450 7,000
16–20 (n=7) 100 3,000 11,000
More than 20 (n=2) 5,000 5,500 6,000
AU
M 2
021
Under $1bn (n=12) 825 3,875 6,750
$1bn–$5bn (n=8) 3,000 3,950 8,000
$5bn–$10bn (n=0) N/A N/A N/A
$10bn–$30bn (n=5) 2,400 4,000 6,000
Over $30bn (n=8) 550 4,250 10,750
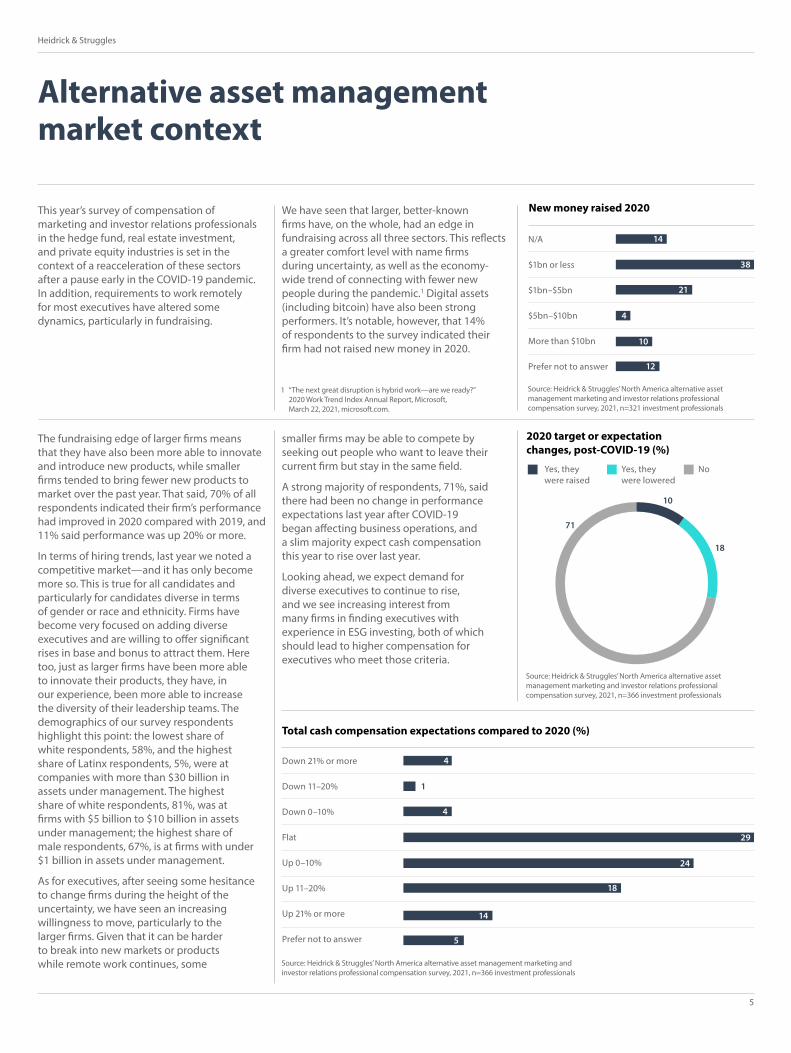
Carry
Forty-five percent of respondents said they receive carry. The average vesting time is four years, and 69% of respondents say it starts vesting after the first year.
Looking across all funds, median carry is highest at hedge funds, but PE firms edge them out at the 75th percentile.
Compensation trends, carry: Private equity/credit
Compensation trends, carry: Hedge funds
Source: Heidrick & Struggles’ North America alternative asset management marketing and investor relations professional compensation survey, 2021, n=76 investment professionals
Source: Heidrick & Struggles’ North America alternative asset management marketing and investor relations professional compensation survey, 2021, n=33 investment professionals
Most recent fund All funds
Most recent fund All funds

2021 North American Alternative Asset Management Marketing and Investor Relations Professional Compensation Survey
16
25th pct Mean 75th pct
Overall (n=45) 500 1,500 3,500
SPEC
IFIC
RO
LE
Head of sales (n=16) 575 2,750 7,750
Sales individual producer (n=7) 100 200 640
Sales and investor relations (n=19) 500 1,500 3,750
Other (n=3) 1,200 2,000 7,000
TITL
E
Vice president (n=2) 640 1,070 1,500
Principal (n=3) 300 1,500 1,500
Director (n=7) 200 500 3,500
Managing director (n=19) 500 1,200 3,750
Partner (n=12) 2,000 3,000 11,000
YEA
RS
EXPE
RIEN
CE
0–5 (n=1) 10 10 10
6–10 (n=13) 500 800 2,500
11–15 (n=17) 500 1,500 3,440
16–20 (n=13) 1,200 2,000 9,000
More than 20 (n=1) 3,000 3,000 3,000
AU
M 2
021
Under $1bn (n=7) 500 1,140 2,400
$1bn–$5bn (n=11) 300 640 2,850
$5bn–$10bn (n=4) 2,500 7,500 11,000
$10bn–$30bn (n=7) 200 1,500 3,750
Over $30bn (n=16) 500 2,000 6,250
25th pct Mean 75th pct
Overall (n=45) 640 3,000 6,000
SPEC
IFIC
RO
LE
Head of sales (n=16) 1,300 5,500 11,000
Sales individual producer (n=7) 100 700 1,000
Sales and investor relations (n=19) 500 3,000 5,000
Other (n=3) 2,000 2,000 9,000
TITL
E
Vice president (n=2) 640 1,820 3,000
Principal (n=3) 400 1,500 1,500
Director (n=7) 500 700 3,500
Managing director (n=19) 800 2,200 5,000
Partner (n=12) 5,000 9,500 11,000
YEA
RS
EXPE
RIEN
CE
0–5 (n=1) 50 50 50
6–10 (n=13) 500 2,200 3,500
11–15 (n=17) 800 1,500 5,000
16–20 (n=13) 2,000 5,000 11,000
More than 20 (n=1) 5,000 5,000 5,000
AU
M 2
021
Under $1bn (n=7) 500 1,500 3,440
$1bn–$5bn (n=11) 400 1,000 5,000
$5bn–$10bn (n=4) 5,000 8,000 11,000
$10bn–$30bn (n=7) 700 3,000 6,000
Over $30bn (n=16) 850 3,250 10,750
Compensation trends, carry: Real estate
Source: Heidrick & Struggles’ North America alternative asset management marketing and investor relations professional compensation survey, 2021, n=45 investment professionals
Most recent fund All funds


Copyright © 2021 Heidrick & Struggles International, Inc. All rights reserved. Reproduction without permission is prohibited. Trademarks and logos are copyrights of their respective owners.
Leaders of Heidrick & Struggles’ Financial Services Practice
Financial Services Practice
Heidrick & Struggles’ global Financial Services Practice uses our broad and deep experience to find the leaders today who are equipped to address the critical issues of tomorrow.
Emerging from global crises while adapting to new markets, the global financial services industry needs leaders with the technical skills, creativity, and insight to craft winning strategies in an increasingly data-heavy digital world. With more than 80 consultants in locations around the world, our Financial Services Practice team combines unparalleled search resources with a deeply consultative approach. We have strong expertise across all financial services sectors, including: asset management; consumer and commercial finance; financial services infrastructure; financial technology; global markets; hedge funds; insurance; investment banking; private equity; real estate; venture capital; and wealth management.
Global Todd Taylor Regional Managing Partner [email protected]
Dominique Fortier Regional Managing Partner [email protected]
Shadi El Farr Regional Managing Partner [email protected]
Wolfgang Schmidt-Soelch Regional Managing Partner [email protected]
Americas
Asia Pacific and Middle East
Europe and Africa