Embed Size (px)
Citation preview

NIPSCO | NIPSCOcom |
Stakeholder Advisory Meeting 5
October 21st 2021900AM-200PM CT
2021 NIPSCO Integrated Resource Plan
NIPSCO | NIPSCOcom |
SAFETY MOMENT
2
NIPSCO | NIPSCOcom |
bull Your input and feedback is critical to NIPSCOrsquos Integrated Resource Plan (ldquoIRPrdquo) Process
bull The Public Advisory Process provides NIPSCO with feedback on its assumptions and sources of data This helps inform the modeling process and overall IRP
bull We set aside time at the end of each section to ask questions
bull Your candid and ongoing feedback is key
ndash Please ask questions and make comments on the content presented
ndash Please provide feedback on the process itself
bull While we will mostly utilize the chat feature in WebEx to facilitate comments we will gladly unmute you if you would like to speak Please identify yourself by name prior to speaking This will help keep track of comments and follow up actions
bull If you wish to make a presentation during a meeting please reach out to Alison Becker (abeckernisourcecom)
STAKEHOLDER ADVISORY MEETING PROTOCOLS
3
Alison Becker
NIPSCO | NIPSCOcom |
AGENDA
4
TimeCentral Time
Topic Speaker
900-905AM Webinar Introduction Safety Moment Meeting Protocols Agenda Alison Becker Manager Regulatory Policy NIPSCO
905-915AM Welcome Mike Hooper President amp COO NIPSCO
915-930AM NIPSCOrsquos Public Advisory Process andResource Planning Activity Review Fred Gomos Director Strategy amp Risk Integration NiSource
930-1000AM Existing Fleet Analysis Review Pat Augustine Vice President CRA
1000-1015AM Break
1015-1100AM Replacement Analysis ReviewPat Augustine Vice President CRAHisham Othman VP Transmission and Regulatory Consulting Quanta Technology LLC
1100-1130AM Responses to Stakeholder Feedback Pat Augustine Vice President CRA
1130AM-1200PM Lunch
1200-100PM Preferred Resource Plan and Action Plan Fred Gomos Director Strategy amp Risk Integration NiSourcePat Augustine Vice President CRA
100-155PM Stakeholder Presentations TBD155-200PM Wrap Up amp Next Steps Erin Whitehead Vice President Regulatory amp Major Accounts NIPSCO
NIPSCO | NIPSCOcom | NIPSCO | NIPSCOcom |
Mike Hooper President amp COO NIPSCO
WELCOME
5
NIPSCO | NIPSCOcom | 6
PILLARS OF OUR ONGOING GENERATION TRANSITION PLANThis plan creates a vision for the future that is better for our customers and itrsquos consistent with our goal to transition
to the best cost cleanest electric supply mix available while maintaining reliability diversity and flexibility for the technology and market changes on the horizon
Reliable and sustainable
Flexibility for the future
Best plan for customers and the company
Local and statewide economic benefits
NIPSCO | NIPSCOcom | NIPSCO | NIPSCOcom |
Fred Gomos Director Strategy amp Risk Integration NiSource
NIPSCOrsquoS PUBLIC ADVISORY PROCESS AND RESOURCE PLANNING ACTIVITY REVIEW
7
NIPSCO | NIPSCOcom |
bull At least every three years NIPSCO outlines its long-term plan to supply electricity to customers over the next 20 years
bull This study ndash known as an IRP ndash is required of all electric utilities in Indiana
bull The IRP process includes extensive analysis of a range of generation scenarios with criteria such as reliable affordable compliant diverse and flexible
HOW DOES NIPSCO PLAN FOR THE FUTURE
8
Reliable
Compliant
FlexibleDiverse
Affordable
Requires Careful Planning and Consideration forbull NIPSCOrsquos employeesbull Environmental regulationsbull Changes in the local economy (property tax
supplier spending employee base)
NIPSCO | NIPSCOcom |
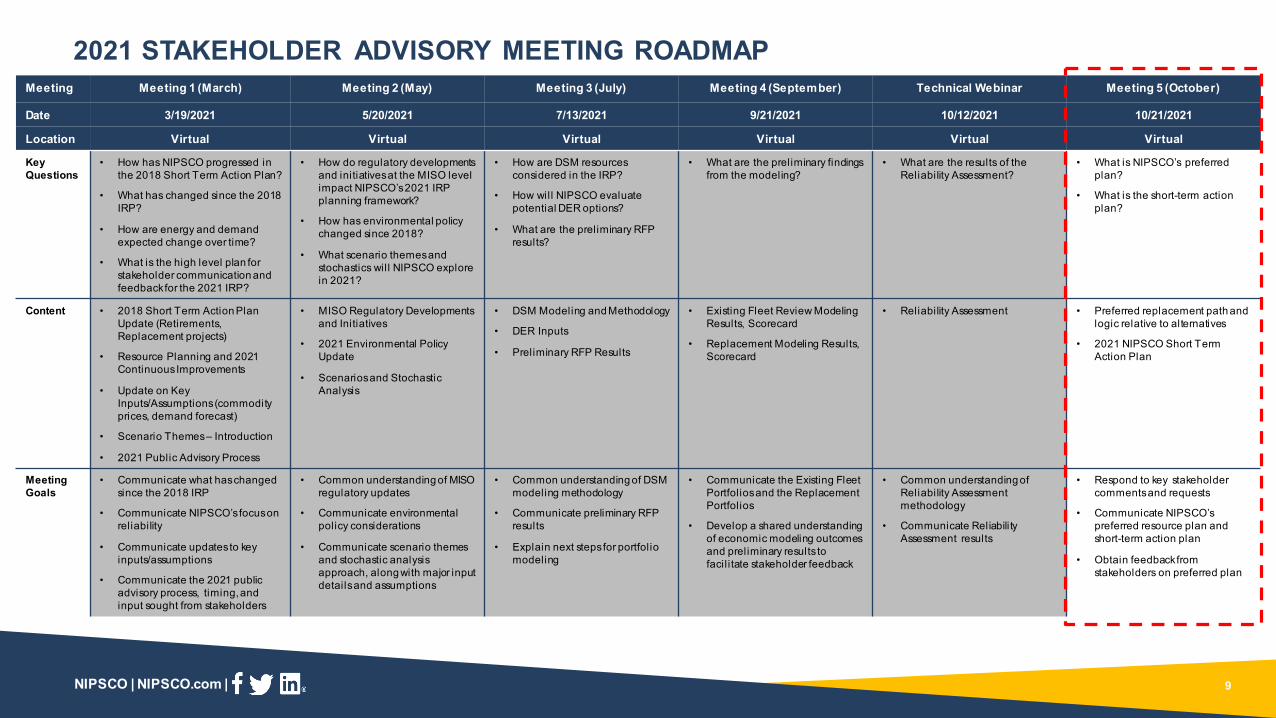
2021 STAKEHOLDER ADVISORY MEETING ROADMAP
9
Meeting Meeting 1 (March) Meeting 2 (May) Meeting 3 (July) Meeting 4 (September) Technical Webinar Meeting 5 (October)
Date 3192021 5202021 7132021 9212021 10122021 10212021
Location Virtual Virtual Virtual Virtual Virtual Virtual
Key Questions
bull How has NIPSCO progressed in the 2018 Short Term Action Plan
bull What has changed since the 2018 IRP
bull How are energy and demand expected change over time
bull What is the high level plan for stakeholder communication and feedback for the 2021 IRP
bull How do regulatory developments and initiatives at the MISO level impact NIPSCOrsquos 2021 IRP planning framework
bull How has environmental policy changed since 2018
bull What scenario themes and stochastics will NIPSCO explore in 2021
bull How are DSM resources considered in the IRP
bull How will NIPSCO evaluate potential DER options
bull What are the preliminary RFPresults
bull What are the preliminary findings from the modeling
bull What are the results of the Reliability Assessment
bull What is NIPSCOrsquos preferred plan
bull What is the short-term action plan
Content bull 2018 Short Term Action Plan Update (Retirements Replacement projects)
bull Resource Planning and 2021 Continuous Improvements
bull Update on Key InputsAssumptions (commodity prices demand forecast)
bull Scenario Themes ndash Introduction
bull 2021 Public Advisory Process
bull MISO Regulatory Developments and Initiatives
bull 2021 Environmental Policy Update
bull Scenariosand Stochastic Analysis
bull DSM Modeling and Methodology
bull DER Inputs
bull Preliminary RFP Results
bull Existing Fleet Review Modeling Results Scorecard
bull Replacement Modeling Results Scorecard
bull Reliability Assessment bull Preferred replacement path and logic relative to alternatives
bull 2021 NIPSCO Short Term Action Plan
Meeting Goals
bull Communicate what has changed since the 2018 IRP
bull Communicate NIPSCOrsquos focus on reliability
bull Communicate updates to key inputsassumptions
bull Communicate the 2021 public advisory process timing and input sought from stakeholders
bull Common understanding of MISO regulatory updates
bull Communicate environmental policy considerations
bull Communicate scenario themes and stochastic analysis approach along with major input details and assumptions
bull Common understanding of DSM modeling methodology
bull Communicate preliminary RFP results
bull Explain next steps for portfolio modeling
bull Communicate the Existing Fleet Portfolios and the Replacement Portfolios
bull Develop a shared understanding of economic modeling outcomes and preliminary results to facil itate stakeholder feedback
bull Common understanding of Reliability Assessment methodology
bull Communicate Reliability Assessment results
bull Respond to key stakeholder comments and requests
bull Communicate NIPSCOrsquos preferred resource plan and short-term action plan
bull Obtain feedback from stakeholders on preferred plan
NIPSCO | NIPSCOcom |
RESOURCE PLANNING APPROACH
10
Scorecard(Example)
Other Analysis (eg Reliability Assessment
Employee Impacts etc)
Aurora ndash NIPSCO Portfolio Market ModelProduction Cost Dispatch (hourly
chronological)
PERFORMDetailed cost of
service and revenue requirements
4
RFP Information
DSM Study
New resource option parameters
Portfolio Optimization
Retirement options and replacement themes (informed
by scenarios)NIPSCO
Portfolios
3
Market Modeling Tools (NGF GPCM Aurora)
Scenario Narrative Development2
Activity Timing
Identify key planning questions and themes Mar
Develop market perspectives (planning reference case and scenarios stochastic inputs)
Mar-May
Develop integrated resource strategies for NIPSCO (portfolios)
Jun-Jul
Portfolio modeling Detailed scenario dispatch Stochastic simulations
Aug-Sep
Evaluate trade-offs and produce recommendation Sep-Oct
1
2
3
4
5 Stochastic Modeling Tools
Integrated gas coal carbon forecasts and MISO market outlook prices
NIPSCO | NIPSCOcom |
bull The ongoing fleet transition in MISO makes it critical for NIPSCOrsquos IRP to capture several changing dynamics to allow NIPSCO to remain flexible
bull Over the course of the 2021 IRP NIPSCO has discussed these topics
IDENTIFY KEY PLANNING QUESTIONS AND THEMES1KEY PLANNING QUESTIONS AND THEMES
Topic
Retirement Timing for Existing Coal and Gas Units
Assessing the retirement timing of the remaining generating fleet after the Schahfer coal units retire which includes Michigan City Unit 12 Schahfer Units 16A and 16B and Sugar Creek
Flexibility amp Adaptability of The Portfolio
Incorporating evolving capacity credit expectations for resources and an imminent seasonal resource adequacy requirement
Carbon Emissions amp RegulationIncentives
Assessing diverse portfolio options in the context of increased policy conversations that push for 100 decarbonization of the power sector by the middle of the next decade
Long-Term Planning With Intermittent Resources
Understanding system reliability implications of a portfolio that will have significant intermittent resources in light of the MISO market evolution and NIPSCOrsquos operational responsibilities
11
NIPSCO | NIPSCOcom |
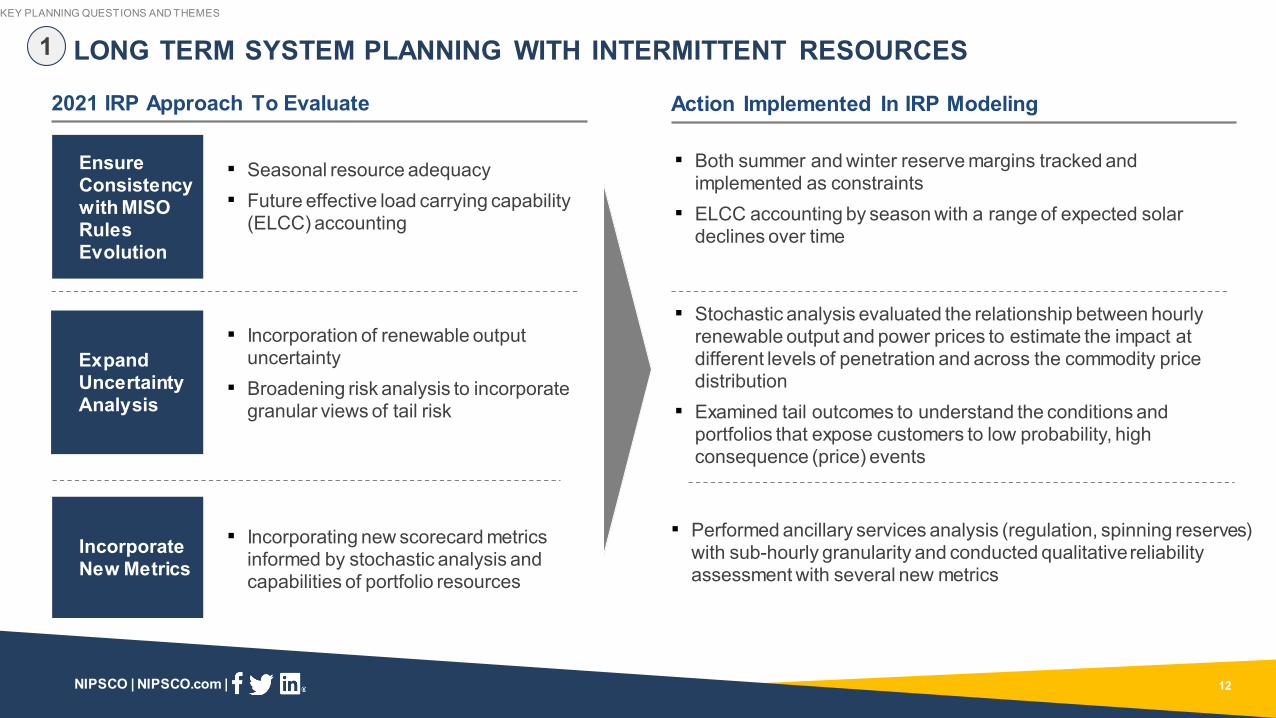
LONG TERM SYSTEM PLANNING WITH INTERMITTENT RESOURCES
12
Ensure Consistency with MISO Rules Evolution
Expand Uncertainty Analysis
Incorporate New Metrics
Seasonal resource adequacy Future effective load carrying capability
(ELCC) accounting
Incorporation of renewable output uncertainty
Broadening risk analysis to incorporate granular views of tail risk
Incorporating new scorecard metrics informed by stochastic analysis and capabilities of portfolio resources
Both summer and winter reserve margins tracked and implemented as constraints
ELCC accounting by season with a range of expected solar declines over time
Stochastic analysis evaluated the relationship between hourly renewable output and power prices to estimate the impact at different levels of penetration and across the commodity price distribution
Examined tail outcomes to understand the conditions and portfolios that expose customers to low probability high consequence (price) events
Performed ancillary services analysis (regulation spinning reserves) with sub-hourly granularity and conducted qualitative reliability assessment with several new metrics
2021 IRP Approach To Evaluate Action Implemented In IRP Modeling
1KEY PLANNING QUESTIONS AND THEMES
NIPSCO | NIPSCOcom |
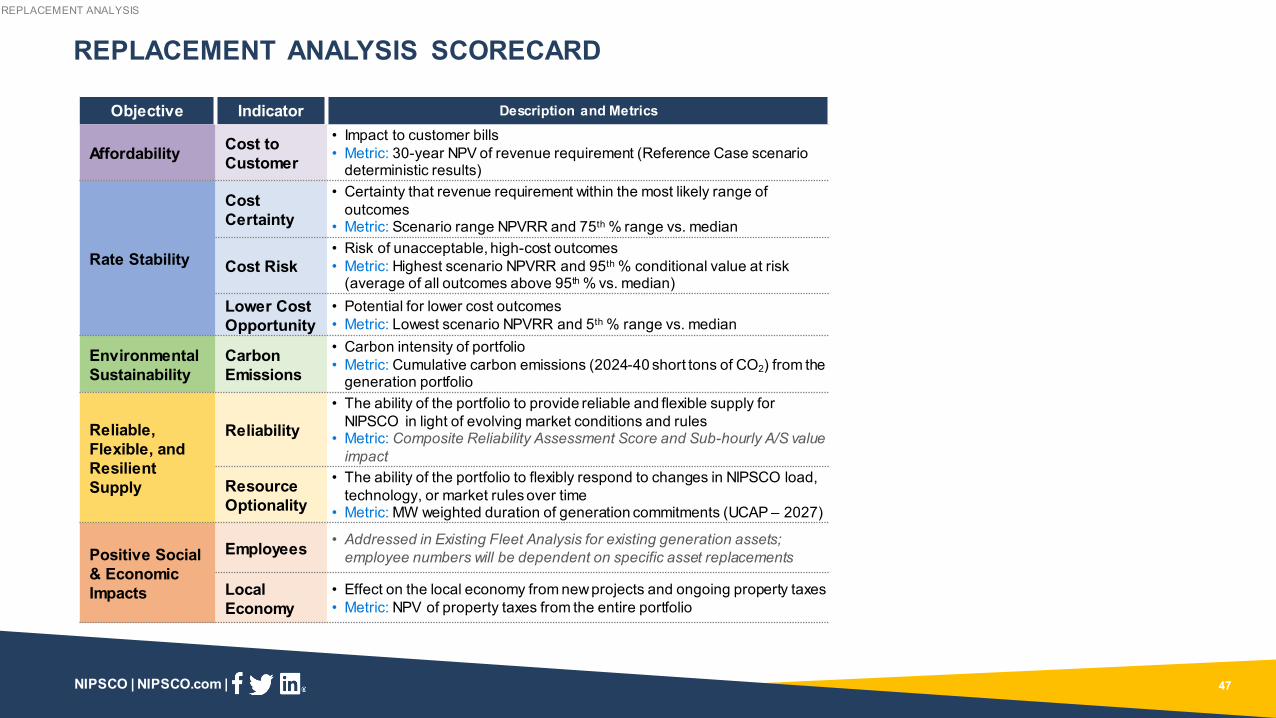
As in the 2018 IRP multiple objectives and indicators are summarized across portfolios in an integrated scorecard framework against which to test portfolios and evaluate the major planning questions
IDENTIFY KEY PLANNING QUESTIONS AND THEMES1
bull The scorecard is a means of reporting key metrics for different portfolio options to transparently review tradeoffs and relative performance it does not produce a single score or ranking of portfolios but serves as a tool to facilitate decision-making
bull NIPSCO has identified 5 major planning objectives and multiple metrics within 9 key indicator categories
bull The Existing Fleet Analysis scorecard focuses on scenario costs carbon emissions and impact on NIPSCO employees and the local economy
bull The Replacement Analysis scorecard incorporates broader perspectives on risk (stochastic analysis) and reliability than the Existing Fleet Analysis scorecard
Objective Indicator
Affordability Cost to Customer
Rate Stability
Cost Certainty
Cost Risk
Lower Cost Opportunity
Environmental Sustainability
Carbon Emissions
Reliable Flexible and Resilient Supply
Reliability
Resource Optionality
Positive Social amp Economic Impacts
Employees
Local Economy
KEY PLANNING QUESTIONS AND THEMES
13
NIPSCO | NIPSCOcom |
bull NIPSCO developed four integrated market scenarios or future ldquostates of the worldrdquo
ndash Scenarios incorporate a range of future outcomes for load commodity prices technology and policy
ndash The 2021 IRP includes two distinct policy frameworks for achieving net-zero emission trajectories for the broader power market
bull Stochastic inputs have been developed for key components of quantifiable stochastic risk
ndash For the 2021 IRP the stochastic analysis has been expanded to include hourly renewable availability in addition to commodity price volatility
DEVELOP MARKET PERSPECTIVES (REF CASE SCENARIOS STOCHASTIC INPUTS)
14
2
Reference Casebull The MISO market continues to evolve based on current expectations for load growth commodity
price trajectories technology development and policy change (some carbon regulation and MISO rules evolution)
Status Quo Extended (ldquoSQErdquo)bull Binding federal limits on carbon emissions are not implemented natural gas prices remain low and
result in new gas additions remaining competitive versus renewables as coal capacity more gradually fades from the MISO market
Aggressive Environmental Regulation (ldquoAERrdquo)bull Carbon emissions from the power sector are regulated through a mix of incentives and a federal
taxcap-and-trade program that results in a significant CO2 price and net-zero emission targets for the power sector by 2040 restrictions on natural gas production increase gas prices
Economy-Wide Decarbonization (ldquoEWDrdquo)bull Technology development and federal incentives push towards a decarbonized economy including
through a power sector Clean Energy Standard (supporting renewables and other non-emitting technologies) and large-scale electrification in other sectors (EVs heating processes etc)
0
20
40
60
80
100
1 4 7 1013161922C
apac
ity F
acto
r
Hour of Day
Solar Output Power Prices
-
20
40
60
80
100
120
nom
inal
$M
Wh
MARKET PERSPECTIVES AND MODELING OF UNCERTAINTY
NIPSCO | NIPSCOcom |
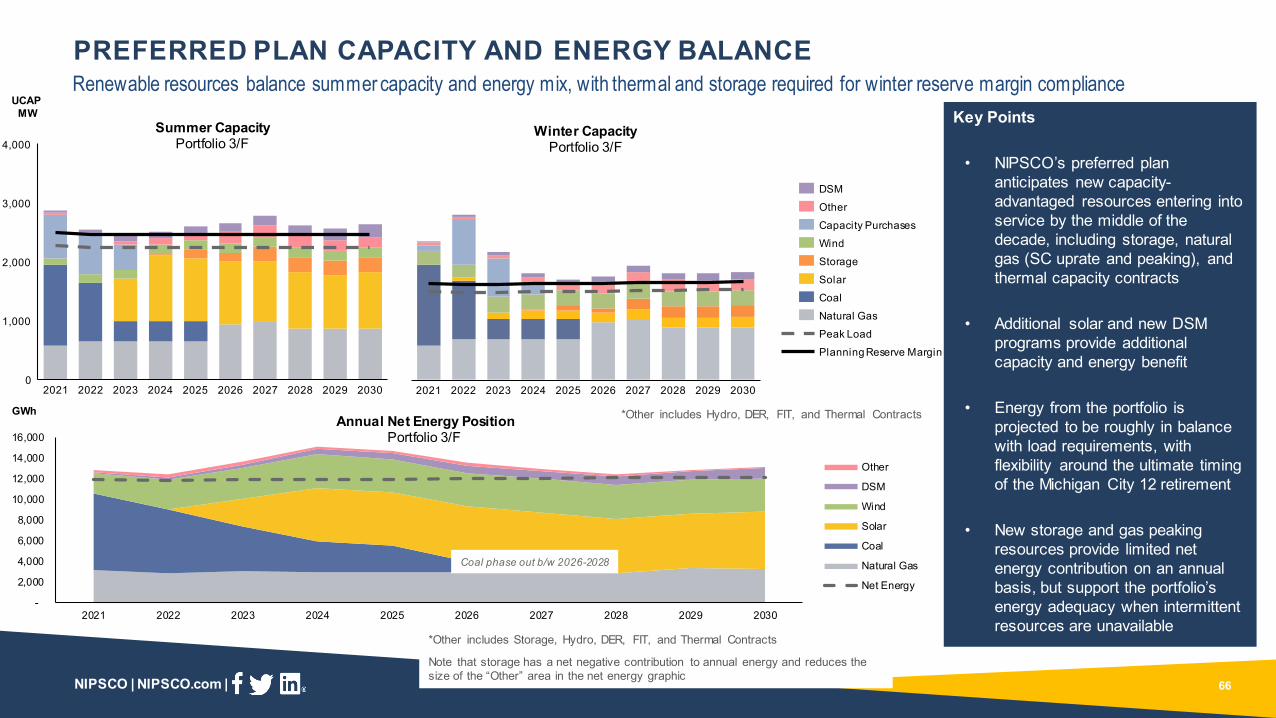
NIPSCO is now monitoring summer and winter reserve margins plus the annual energy balanceKey Points
bull The capacity credit for some of the 2023 projects is not reflected until 2024 due to in-service date timing
bull Capacity credit for some storage resources is not reflected until 2025 (after a full year of operations) due to plant configuration
bull While winter loads are lower the lower capacity credit in the winter for solar resources results in a similar reserve margin
bull On an annual basis the net energy position for the portfolio is long driven by the energy value and economic dispatch advantage of wind and solar resources However the tight capacity position may create hourly gaps particularly in the winter mornings and evenings when solar resources ramp down (next slide)
1000
0
2000
3000
202420232021 2022 2025 2026 2027 2028
Summer Capacity
20282021 2022 20262023 2024 2025 2027
Winter Capacity
UCAP MW
Capacity PurchasesCapacity Gap
WindOtherFiled DSM Programs
Storage
SolarCoalNatural GasPeak Load (or Net Energy)
Planning Reserve Margin
Annual EnergyGWh
Multiple renew able projects coming online in 2023 to address capacity gap
0
2000
4000
6000
8000
10000
12000
14000
16000
2021 2022 2023 2024 2025 2026 2027 2028
STARTING NEAR-TERM CAPACITY AND ENERGY BALANCE3CURRENT PORTFOLIO POSITION
15
NIPSCO | NIPSCOcom |
bull There are hours of the day where renewable resources are not available (ex overnight for solar) Furthermore solar resources may experience steep production declines in the evening hours
bull Currently Sugar Creek (natural gas CC) Schahfer 16AB (natural gas peaker) and Michigan City 12 (coal) are part of the portfolio and when economic NIPSCO can purchase from the MISO market
bull As 16AB and MC12 retire the portfolio will require new resources to be available to mitigate against specific hourly energy exposure
STARTING ENERGY BALANCE VARIES ON AN HOURLY BASIS
Average Summer Day after Schahfer coal ret wo MC12 and 16AB Average Winter Day after Schahfer coal ret wo MC12 and 16AB
Steep ramping needs
0
500
1000
1500
2000
2500
1 2 3 4 5 6 7 8 9 10 11 12 13 14 15 16 17 18 19 20 21 22 23 24
MW
1 2 3 4 5 6 7 8 9 10 11 12 13 14 15 16 17 18 19 20 21 22 23 24
Sugar Creek
Hydro
Wind
FiT DER
Solar
Storage
Gross Load
Load Net of DSM
Net Requirement
3CURRENT PORTFOLIO POSITION
16
NIPSCO | NIPSCOcom | NIPSCO | NIPSCOcom |
Pat Augustine Vice President CRA
EXISTING FLEET ANALYSIS REVIEW
17
NIPSCO | NIPSCOcom |
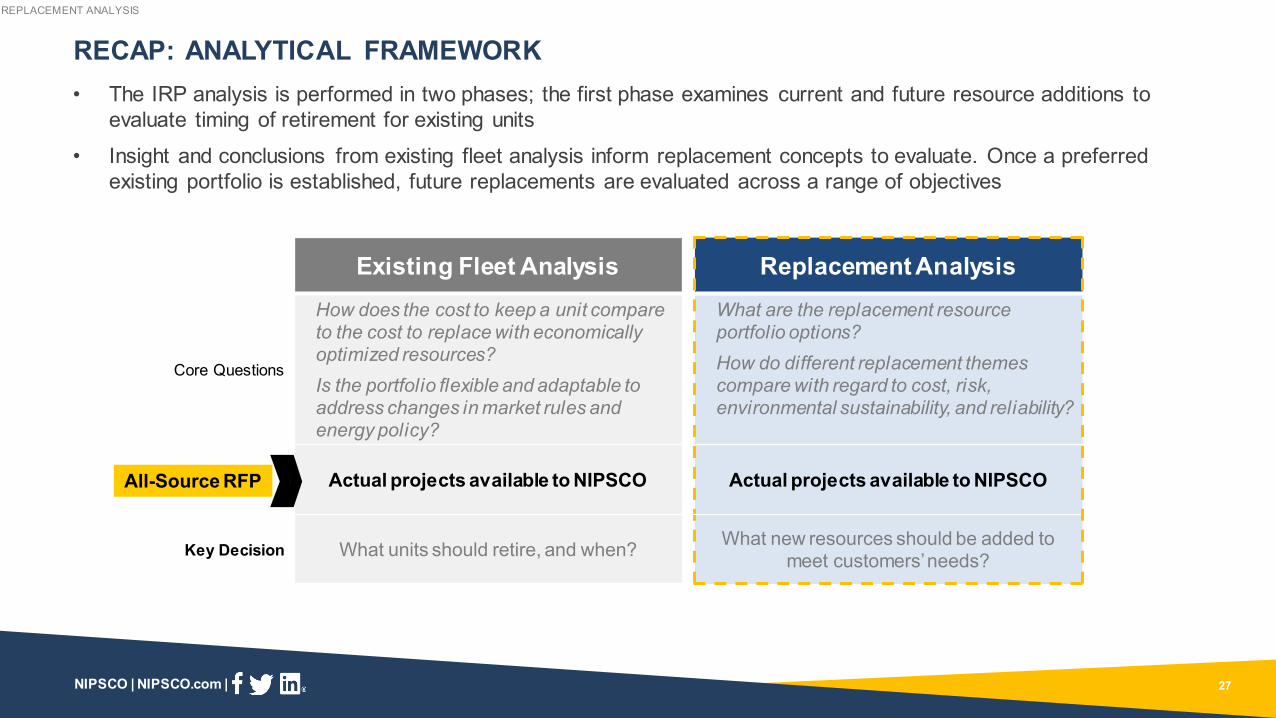
bull The IRP analysis is performed in two phases the first phase examines current and future resource additions to evaluate timing of retirement for existing units
bull Insight and conclusions from existing fleet analysis inform replacement concepts to evaluate Once a preferred existing portfolio is established future replacements are evaluated across a range of objectives
RECAP ANALYTICAL FRAMEWORK
18
Existing Fleet Analysis Replacement Analysis
Core Questions
How does the cost to keep a unit compare to the cost to replace with economically optimized resourcesIs the portfolio flexible and adaptable to address changes in market rules and energy policy
What are the replacement resource portfolio options How do different replacement themes compare with regard to cost risk environmental sustainability and reliability
Actual projects available to NIPSCO Actual projects available to NIPSCO
Key Decision What units should retire and when What new resources should be added to meet customersrsquo needs
All-Source RFP
EXISTING FLEET ANALYSIS
NIPSCO | NIPSCOcom |
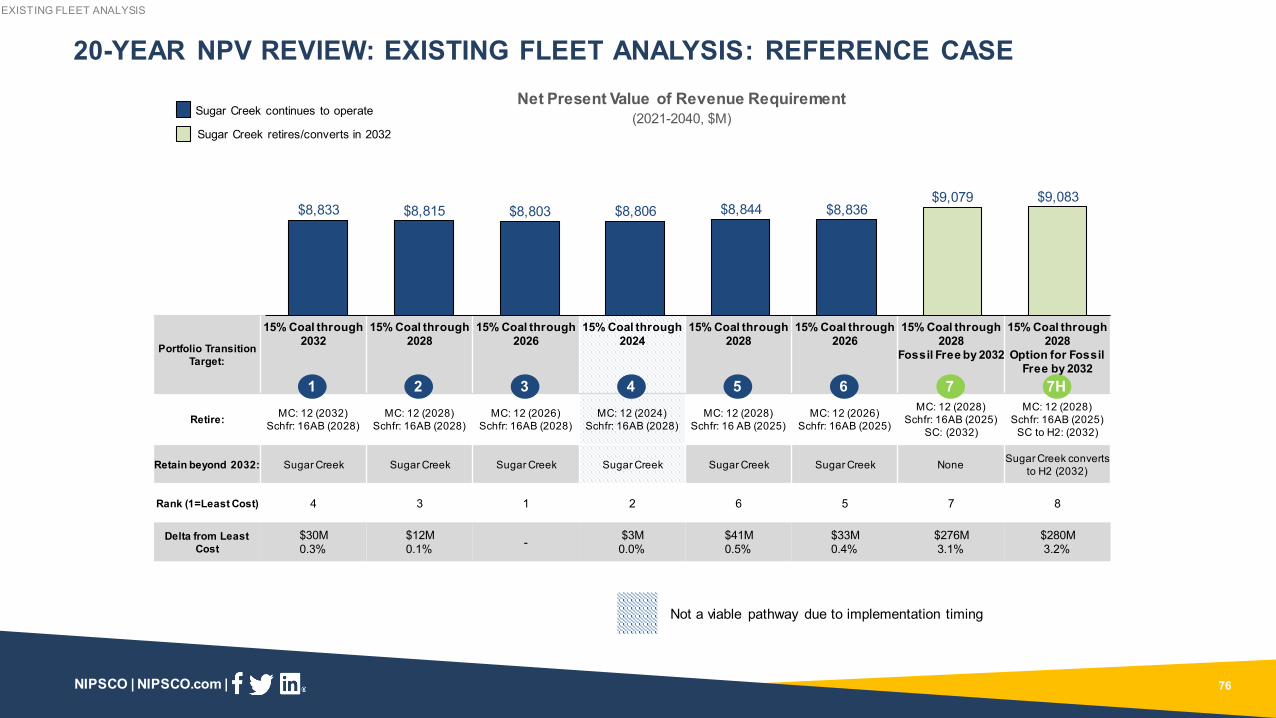
RECAP CONSTRUCTED RETIREMENT PORTFOLIOS TO COVER THE RANGE OF TIMING POSSIBILITIES FOR REMAINING FOSSIL UNITS
Key Points
bull Portfolio construction is necessarily broad to fully address tradeoffs
bull Portfolios 1-4 focus on the timing of the Michigan City retirement
bull Portfolios 5 and 6 focus on the replacement timing for Schahfer 16AB Units are not retained beyond 2028 in any portfolio given current condition and age
bull Portfolio 7 and 7H are assessing implications of carbon free portfolio pathways
Portfolio Transition
Target
15 Coal through 2032
15 Coal through 2028
15 Coal through 2026
15 Coal through 2024
15 Coal through 2028
15 Coal through 2026
15 Coal through 2028
Fossil Free by 2032
15 Coal through 2028
Option for Fossil Free by 2032
MC 12 Through Book life
2018 IRP Preferred Plan
Early Retirement of MC 12
Early Retirement of MC 12
2018 IRP Preferred Plan + 2025 16AB
retirement
Early Retirement of MC 12
+ 2025 16AB retirement
2018 IRP Preferred Plan + 2025 16AB ret +
2032 SC ret
2018 IRP Preferred Plan + 2025 16AB ret +
2032 SC conv
Retain beyond
2032Sugar Creek Sugar Creek Sugar Creek Sugar Creek Sugar Creek Sugar Creek None
Sugar Creek conv erts to H2
(2032)
Michigan City 12
Retire Retire Retire Retire Retire Retire Retire
2032 2028 2026 2024 2028 2026 2028
Schahfer 16AB
Retire Retire
2028 2025
Sugar Creek Retain
Retire Convert to H2
2032 2032
1 2 3 4 5 6 7 7H
Short term Longer term
EXISTING FLEET ANALYSIS
Not a viable pathway due to implementation timing19
NIPSCO | NIPSCOcom |
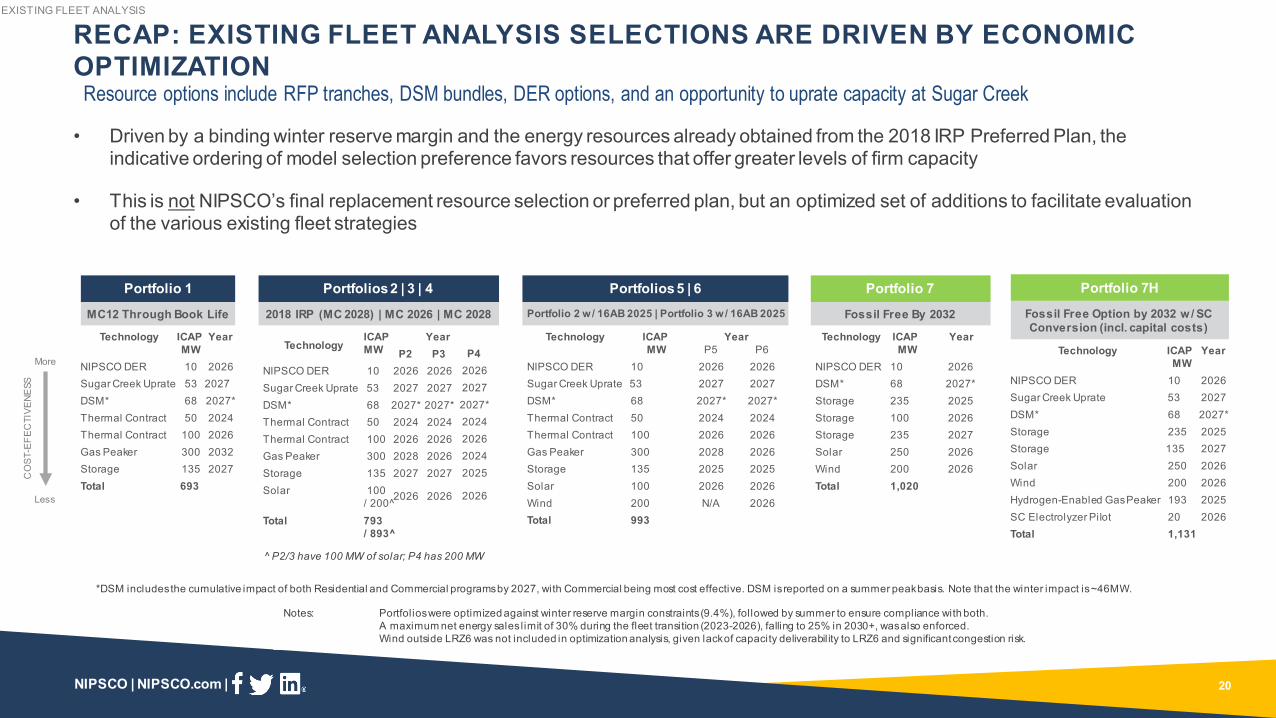
bull Driven by a binding winter reserve margin and the energy resources already obtained from the 2018 IRP Preferred Plan the indicative ordering of model selection preference favors resources that offer greater levels of firm capacity
bull This is not NIPSCOrsquos final replacement resource selection or preferred plan but an optimized set of additions to facilitate evaluation of the various existing fleet strategies
RECAP EXISTING FLEET ANALYSIS SELECTIONS ARE DRIVEN BY ECONOMIC OPTIMIZATION
Resource options include RFP tranches DSM bundles DER options and an opportunity to uprate capacity at Sugar Creek
Portfolio 1
MC12 Through Book Life
Technology ICAP MW
Year
NIPSCO DER 10 2026Sugar Creek Uprate 53 2027DSMThermal Contract 50 2024Thermal Contract 100 2026Gas Peaker 300 2032Storage 135 2027Total 693
Portfolios 2 | 3 | 4
2018 IRP (MC 2028) | MC 2026 | MC 2028
TechnologyICAP MW
YearP2 P3
NIPSCO DER 10 2026 2026Sugar Creek Uprate 53 2027 2027DSMThermal Contract 50 2024 2024Thermal Contract 100 2026 2026Gas Peaker 300 2028 2026Storage 135 2027 2027Solar 100
200^2026 2026
Total 793 893^
Portfolio 7H
Fossil Free Option by 2032 w SC Conversion (incl capital costs)
Technology ICAP MW
Year
NIPSCO DER 10 2026Sugar Creek Uprate 53 2027DSMStorage 235 2025Storage 135 2027Solar 250 2026Wind 200 2026Hydrogen-Enabled Gas Peaker 193 2025SC Electrolyzer Pilot 20 2026Total 1131
DSM includes the cumulative impact of both Residential and Commercial programs by 2027 with Commercial being most cost effective DSM is reported on a summer peak basis Note that the winter impact is ~46MW
CO
ST-E
FEC
TIVE
NESS
Less
More
68 6868
2027 2027 20272027
Portfolios 5 | 6Portfolio 2 w 16AB 2025 | Portfolio 3 w 16AB 2025
Technology ICAP MW
YearP5 P6
NIPSCO DER 10 2026 2026Sugar Creek Uprate 53 2027 2027DSM 68 2027 2027Thermal Contract 50 2024 2024Thermal Contract 100 2026 2026Gas Peaker 300 2028 2026Storage 135 2025 2025Solar 100 2026 2026Wind 200 NA 2026Total 993
Portfolio 7
Fossil Free By 2032
Technology ICAP MW
Year
NIPSCO DER 10 2026DSM 68 2027Storage 235 2025Storage 100 2026Storage 235 2027Solar 250 2026Wind 200 2026Total 1020
EXISTING FLEET ANALYSIS
Notes Portfolios were optimized against winter reserve margin constraints (94) followed by summer to ensure compliance with bothA maximum net energy sales limit of 30 during the fleet transition (2023-2026) falling to 25 in 2030+ was also enforcedWind outside LRZ6 was not included in optimization analysis given lack of capacity deliverabil ity to LRZ6 and significant congestion risk
P420262027
2024202620242025
2026
2027
^ P23 have 100 MW of solar P4 has 200 MW
20
NIPSCO | NIPSCOcom |
Portfolio Transition Target
15 Coal through 2032
15 Coal through 2028
15 Coal through 2026
15 Coal through 2024
15 Coal through 2028
15 Coal through 2026
15 Coal through 2028
Fossil Free by 2032
15 Coal through 2028
Option for Fossil Free by 2032
Retire MC 12 (2032)Schfr 16AB (2028)
MC 12 (2028)Schfr 16AB (2028)
MC 12 (2026)Schfr 16AB (2028)
MC 12 (2024)Schfr 16AB (2028)
MC 12 (2028)Schfr 16 AB (2025)
MC 12 (2026)Schfr 16AB (2025)
MC 12 (2028)Schfr 16AB (2025)
SC (2032)
MC 12 (2028)Schfr 16AB (2025)
SC to H2 (2032)
Retain beyond 2032 Sugar Creek Sugar Creek Sugar Creek Sugar Creek Sugar Creek Sugar Creek None Sugar Creek converts to H2 (2032)
Rank (1=Least Cost) 5 3 1 2 6 4 8 7
Delta from LeastCost
$35M03
$16M02 - $10M
01$47M05
$24M02
$417M41
$357M35
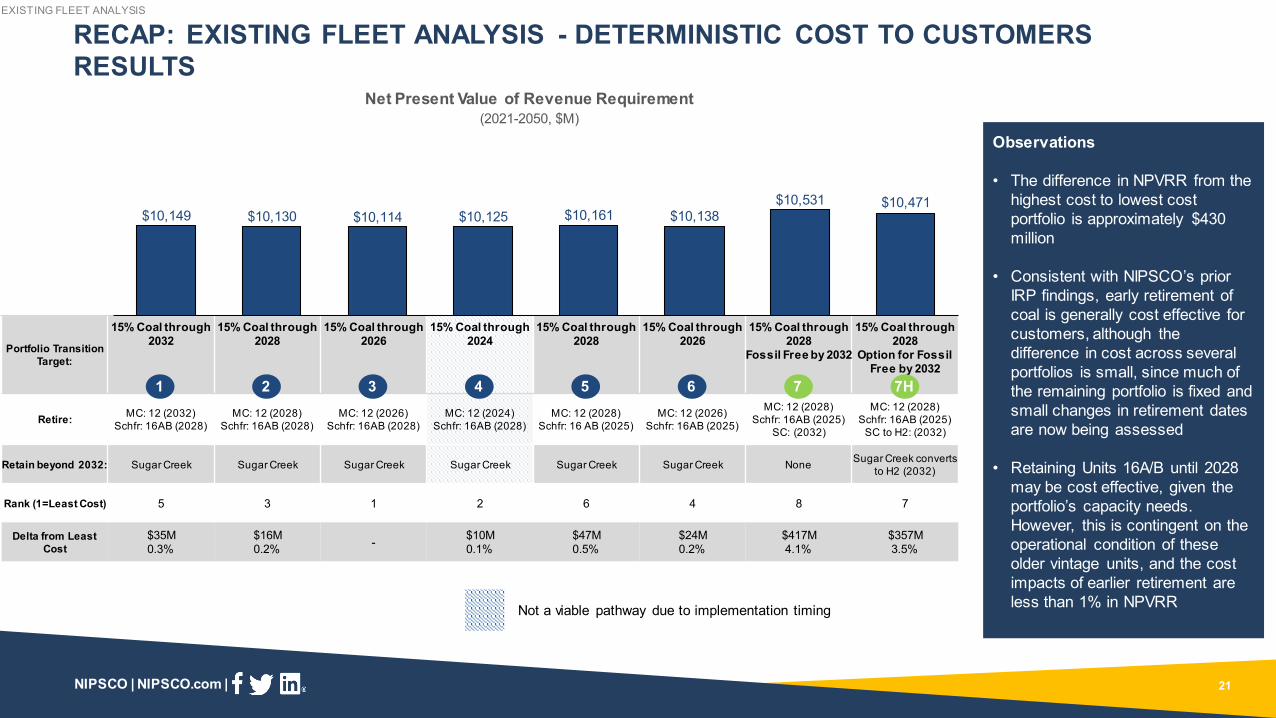
RECAP EXISTING FLEET ANALYSIS - DETERMINISTIC COST TO CUSTOMERSRESULTS
Observations
bull The difference in NPVRR from the highest cost to lowest cost portfolio is approximately $430 million
bull Consistent with NIPSCOrsquos prior IRP findings early retirement of coal is generally cost effective for customers although the difference in cost across several portfolios is small since much of the remaining portfolio is fixed and small changes in retirement dates are now being assessed
bull Retaining Units 16AB until 2028 may be cost effective given the portfoliorsquos capacity needs However this is contingent on the operational condition of these older vintage units and the cost impacts of earlier retirement are less than 1 in NPVRR
Net Present Value of Revenue Requirement(2021-2050 $M)
1
$10149 $10130 $10114 $10125 $10161 $10138$10531 $10471
2 3 5 6 7 7H
EXISTING FLEET ANALYSIS
4
Not a viable pathway due to implementation timing
21
NIPSCO | NIPSCOcom |
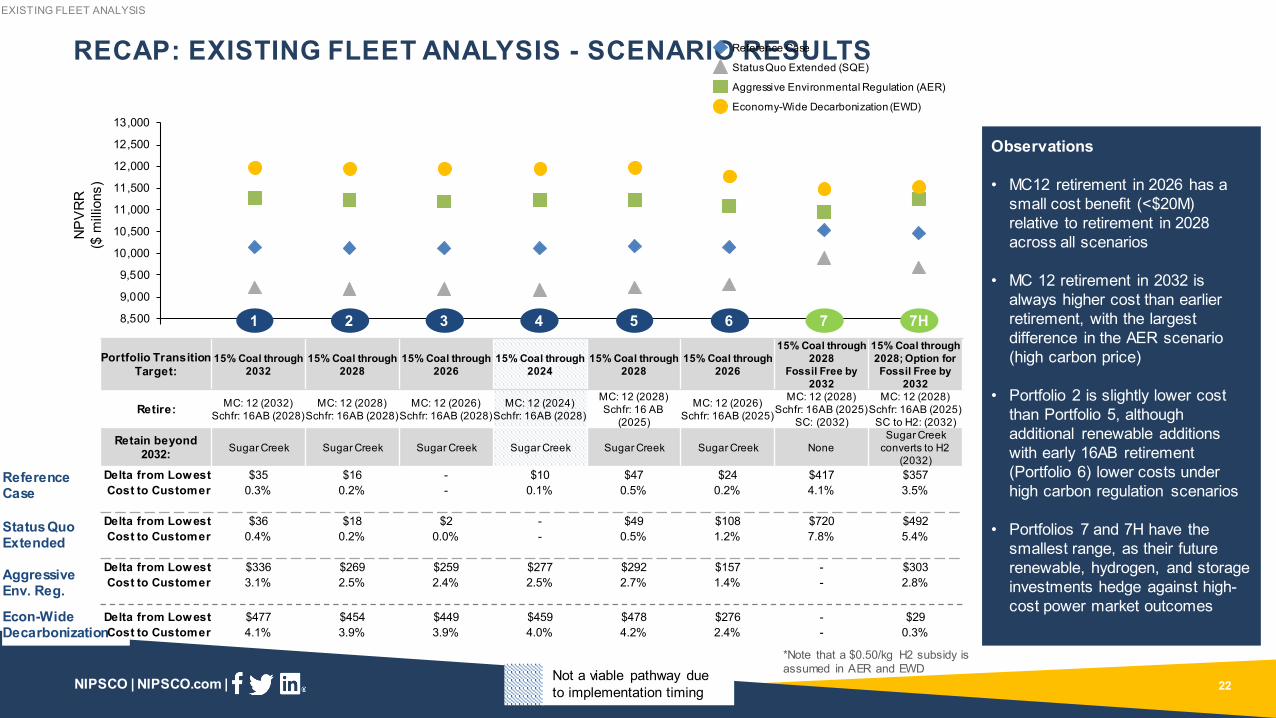
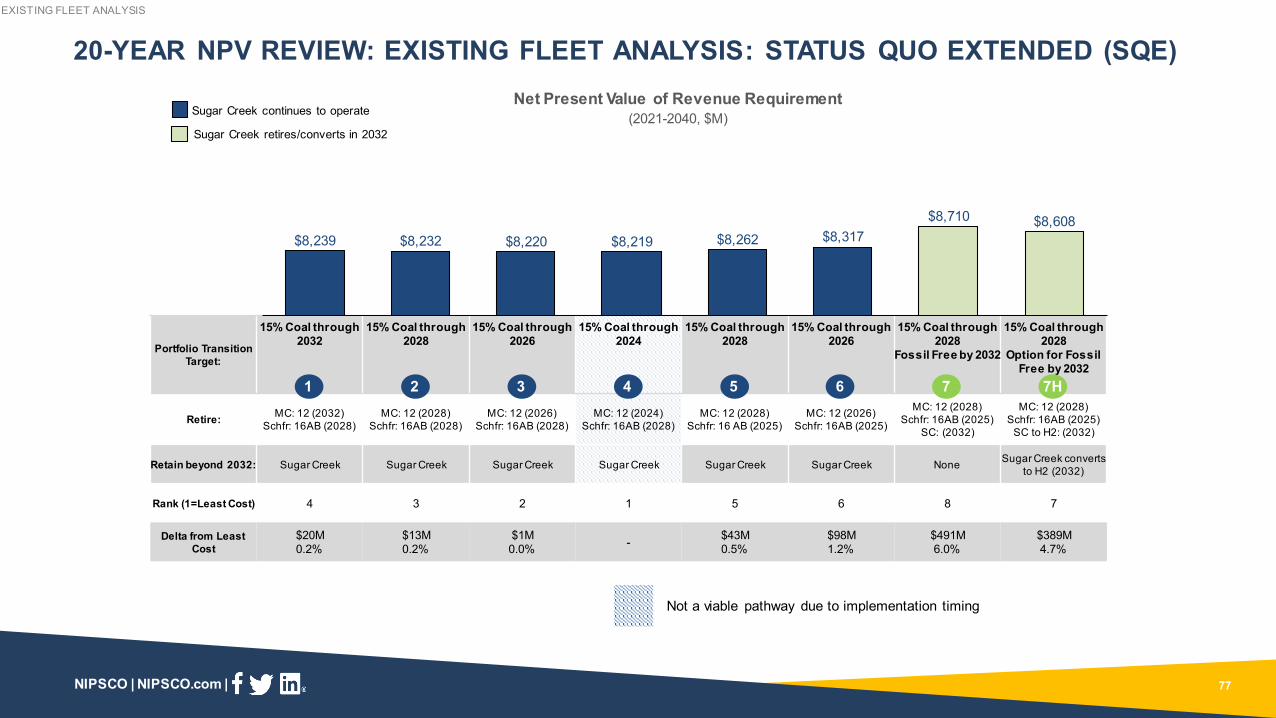
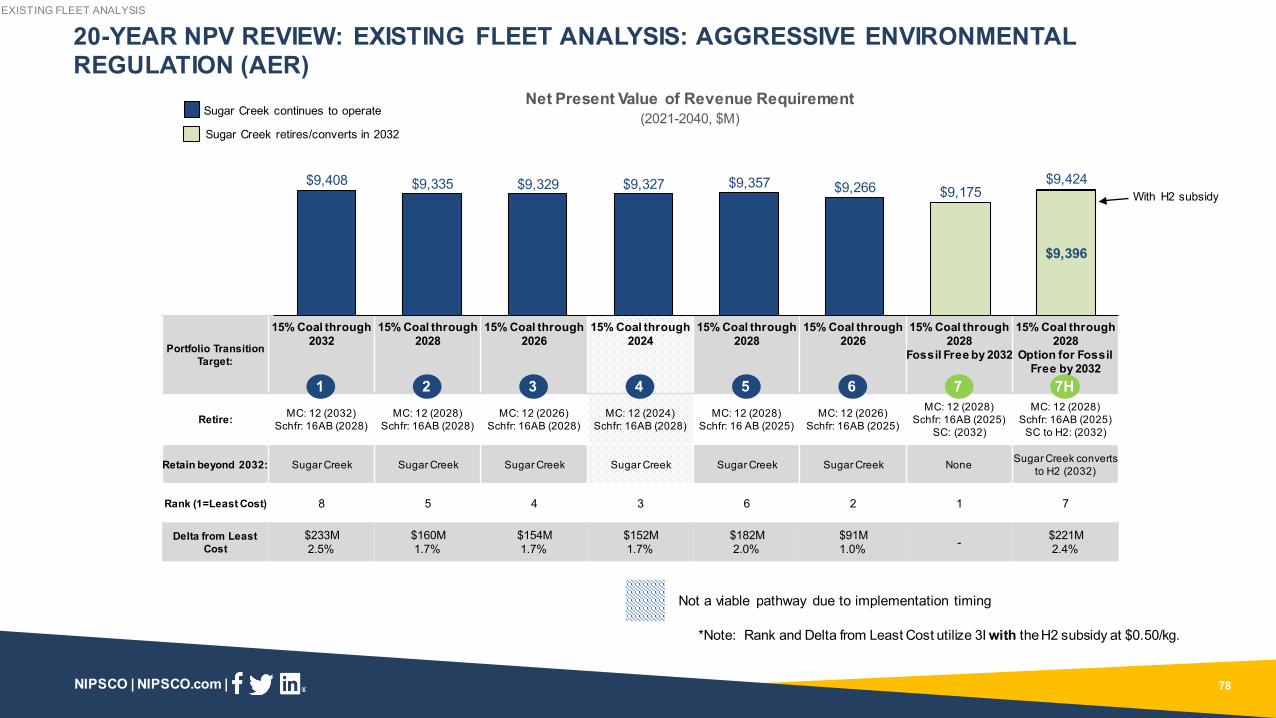
RECAP EXISTING FLEET ANALYSIS - SCENARIO RESULTS
Econ-Wide Decarbonization
Portfolio Transition Target
15 Coal through 2032
15 Coal through 2028
15 Coal through 2026
15 Coal through 2024
15 Coal through 2028
15 Coal through 2026
15 Coal through 2028
Fossil Free by 2032
15 Coal through 2028 Option forFossil Free by
2032
Retire MC 12 (2032)Schfr 16AB (2028)
MC 12 (2028)Schfr 16AB (2028)
MC 12 (2026)Schfr 16AB (2028)
MC 12 (2024)Schfr 16AB (2028)
MC 12 (2028)Schfr 16 AB
(2025)
MC 12 (2026)Schfr 16AB (2025)
MC 12 (2028)Schfr 16AB (2025)
SC (2032)
MC 12 (2028)Schfr 16AB (2025)
SC to H2 (2032)
Retain beyond 2032 Sugar Creek Sugar Creek Sugar Creek Sugar Creek Sugar Creek Sugar Creek None
Sugar Creek converts to H2
(2032)Delta from Lowest $35 $16 - $10 $47 $24 $417 $357Cost to Customer 03 02 - 01 05 02 41 35
Delta from Lowest $36 $18 $2 - $49 $108 $720 $492Cost to Customer 04 02 00 - 05 12 78 54
Delta from Lowest $336 $269 $259 $277 $292 $157 - $303Cost to Customer 31 25 24 25 27 14 - 28
Delta from Lowest $477 $454 $449 $459 $478 $276 - $29Cost to Customer 41 39 39 40 42 24 - 03
Reference Case
Status Quo Extended
Aggressive Env Reg
8500
9000
9500
10000
10500
11000
11500
12000
12500
13000
NP
VR
R($
mill
ions
)
1 2 3 5 6 7 7H
Observations
bull MC12 retirement in 2026 has a small cost benefit (lt$20M) relative to retirement in 2028 across all scenarios
bull MC 12 retirement in 2032 is always higher cost than earlier retirement with the largest difference in the AER scenario (high carbon price)
bull Portfolio 2 is slightly lower cost than Portfolio 5 although additional renewable additions with early 16AB retirement (Portfolio 6) lower costs under high carbon regulation scenarios
bull Portfolios 7 and 7H have the smallest range as their future renewable hydrogen and storage investments hedge against high-cost power market outcomes
EXISTING FLEET ANALYSIS
Note that a $050kg H2 subsidy is assumed in AER and EWD
4
Reference Case
Status Quo Extended (SQE)
Aggressive Environmental Regulation (AER)
Economy-Wide Decarbonization (EWD)
Not a viable pathway due to implementation timing 22
NIPSCO | NIPSCOcom |
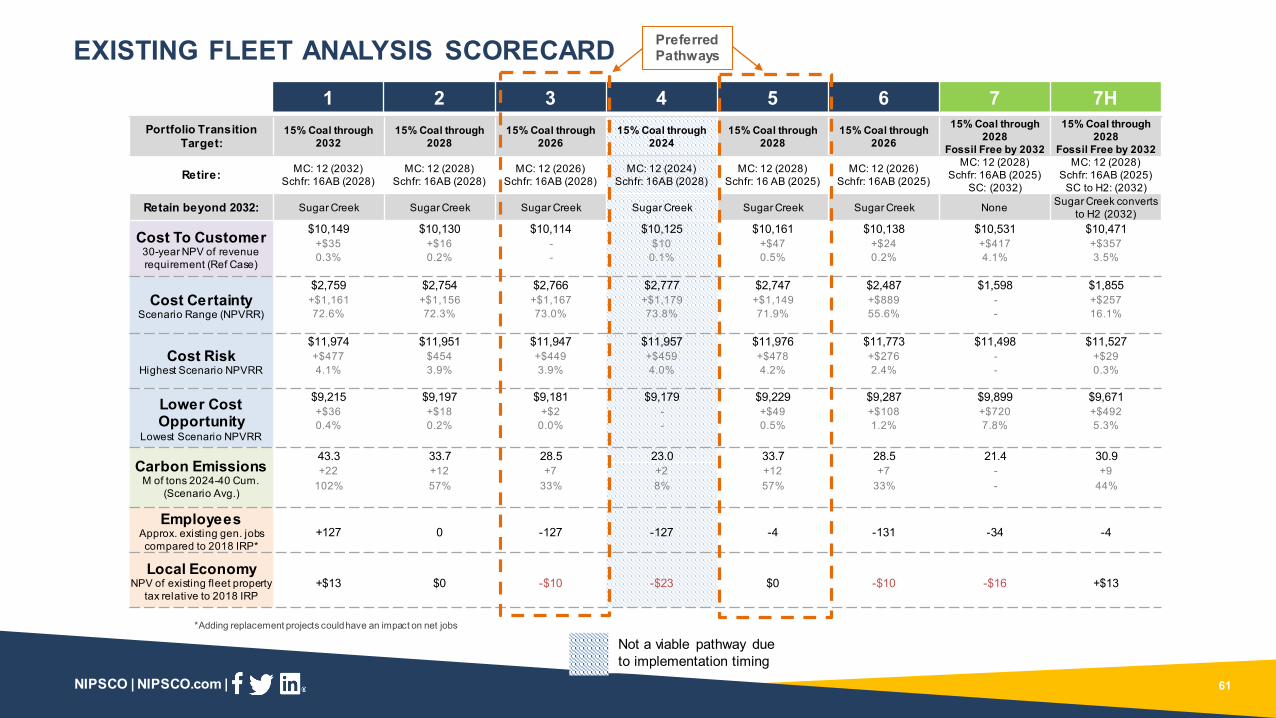
RECAP EXISTING FLEET ANALYSIS SCORECARD
23
Objective Indicator Description and Metrics
Affordability Cost to Customer
bull Impact to customer billsbull Metric 30-year NPV of revenue requirement
(Reference Case scenario deterministic results)
Rate Stability
Cost Certainty
bull Certainty that revenue requirement within the most likely range of outcomes
bull Metric Scenario range NPVRR
Cost Risk bull Risk of unacceptable high-cost outcomesbull Metric Highest scenario NPVRR
Lower Cost Opportunity
bull Potential for lower cost outcomesbull Metric Lowest scenario NPVRR
Environmental Sustainability
Carbon Emissions
bull Carbon intensity of portfoliobull Metric Cumulative carbon emissions (2024-40
short tons of CO2) from the generation portfolio
Reliable Flexible and Resilient Supply
Reliabilitybull To be addressed in Replacement Analysis stage
Resource Optionality
Positive Social amp Economic Impacts
Employeesbull Net impact on NiSource jobsbull Metric Approx number of permanent NiSource jobs
associated with generation
Local Economy
bull Net effect on the local economy (relative to 2018 IRP) from new projects and ongoing property taxes
bull Metric NPV of existing fleet property tax relative to 2018 IRP
Additional risk metrics will be included in the Replacement Analysis when broader set of resource types are evaluated
Key Points
bull Two closely related but distinct scorecards are used for the Existing Fleet Analysis and the Replacement Analysis
bull The Existing Fleet Analysis focuses on scenario costs carbon emissions and impact on NIPSCO employees and the local economy
bull The Replacement Analysis expands the risk assessment to include a stochastic assessment and introduces reliability metrics to assess a broader range of future resource options
EXISTING FLEET ANALYSIS
NIPSCO | NIPSCOcom |
RECAP EXISTING FLEET ANALYSIS SCORECARD
24
1 2 3 4 5 6 7 7H
Not a viable pathway due to implementation timing
Adding replacement projects could have an impact on net jobs
Portfolio Transition Target
15 Coal through 2032
15 Coal through 2028
15 Coal through 2026
15 Coal through 2024
15 Coal through 2028
15 Coal through 2026
15 Coal through 2028
Fossil Free by 2032
15 Coal through 2028
Fossil Free by 2032
Retire MC 12 (2032)Schfr 16AB (2028)
MC 12 (2028)Schfr 16AB (2028)
MC 12 (2026)Schfr 16AB (2028)
MC 12 (2024)Schfr 16AB (2028)
MC 12 (2028)Schfr 16 AB (2025)
MC 12 (2026)Schfr 16AB (2025)
MC 12 (2028)Schfr 16AB (2025)
SC (2032)
MC 12 (2028)Schfr 16AB (2025)
SC to H2 (2032)
Retain beyond 2032 Sugar Creek Sugar Creek Sugar Creek Sugar Creek Sugar Creek Sugar Creek None Sugar Creek converts to H2 (2032)
Cost To Customer30-year NPV of revenue requirement (Ref Case)
$10149 $10130 $10114 $10125 $10161 $10138 $10531 $10471+$35 +$16 - $10 +$47 +$24 +$417 +$35703 02 - 01 05 02 41 35
Cost CertaintyScenario Range (NPVRR)
$2759 $2754 $2766 $2777 $2747 $2487 $1598 $1855+$1161 +$1156 +$1167 +$1179 +$1149 +$889 - +$257726 723 730 738 719 556 - 161
Cost RiskHighest Scenario NPVRR
$11974 $11951 $11947 $11957 $11976 $11773 $11498 $11527+$477 $454 +$449 +$459 +$478 +$276 - +$2941 39 39 40 42 24 - 03
Lower Cost Opportunity
Lowest Scenario NPVRR
$9215 $9197 $9181 $9179 $9229 $9287 $9899 $9671+$36 +$18 +$2 - +$49 +$108 +$720 +$49204 02 00 - 05 12 78 53
Carbon EmissionsM of tons 2024-40 Cum
(Scenario Avg)
433 337 285 230 337 285 214 309+22 +12 +7 +2 +12 +7 - +9
102 57 33 8 57 33 - 44
EmployeesApprox existing gen jobs compared to 2018 IRP
+127 0 -127 -127 -4 -131 -34 -4
Local EconomyNPV of existing fleet property
tax relative to 2018 IRP+$13 $0 -$10 -$23 $0 -$10 -$16 +$13
EXISTING FLEET ANALYSIS
NIPSCO | NIPSCOcom | NIPSCO | NIPSCOcom |
BREAK
25
NIPSCO | NIPSCOcom | NIPSCO | NIPSCOcom |
Pat Augustine Vice President CRAHisham Othman VP Transmission and Regulatory Consulting Quanta Technology LLC
REPLACEMENT ANALYSIS REVIEW
26
NIPSCO | NIPSCOcom |
bull The IRP analysis is performed in two phases the first phase examines current and future resource additions to evaluate timing of retirement for existing units
bull Insight and conclusions from existing fleet analysis inform replacement concepts to evaluate Once a preferred existing portfolio is established future replacements are evaluated across a range of objectives
RECAP ANALYTICAL FRAMEWORK
27
Existing Fleet Analysis Replacement Analysis
Core Questions
How does the cost to keep a unit compare to the cost to replace with economically optimized resourcesIs the portfolio flexible and adaptable to address changes in market rules and energy policy
What are the replacement resource portfolio options How do different replacement themes compare with regard to cost risk environmental sustainability and reliability
Actual projects available to NIPSCO Actual projects available to NIPSCO
Key Decision What units should retire and when What new resources should be added to meet customersrsquo needs
All-Source RFP
REPLACEMENT ANALYSIS
NIPSCO | NIPSCOcom |
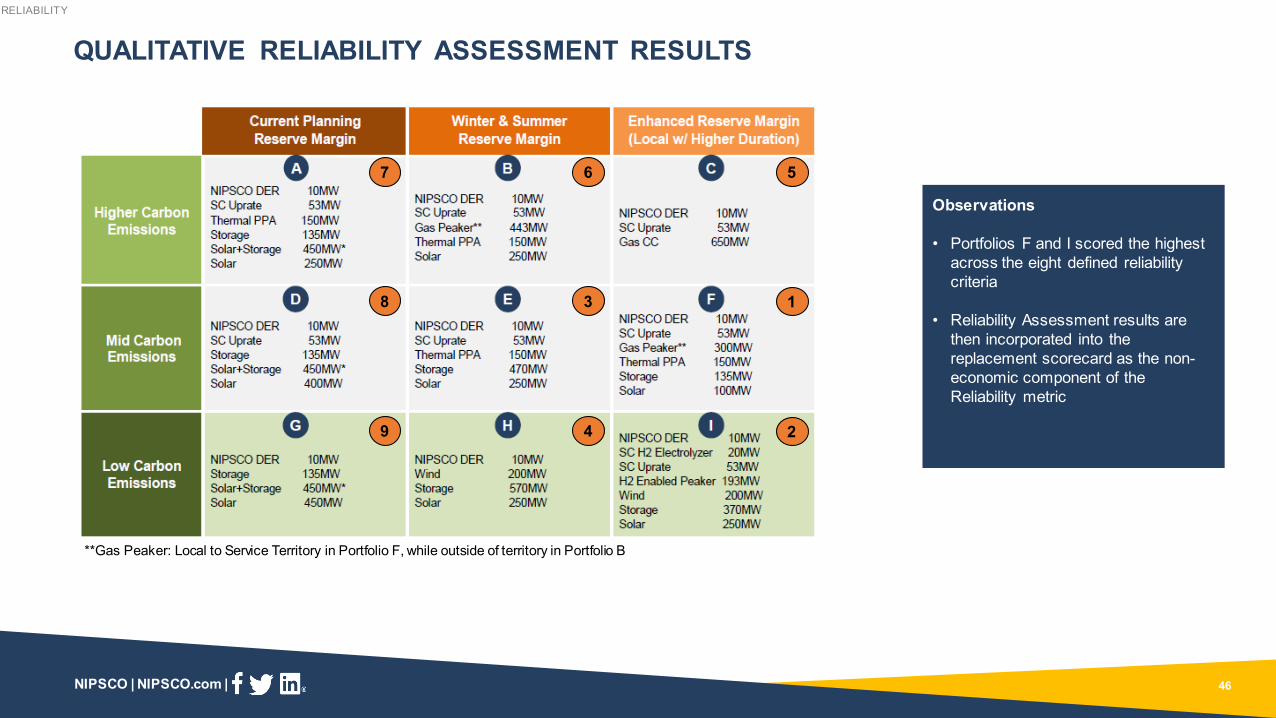
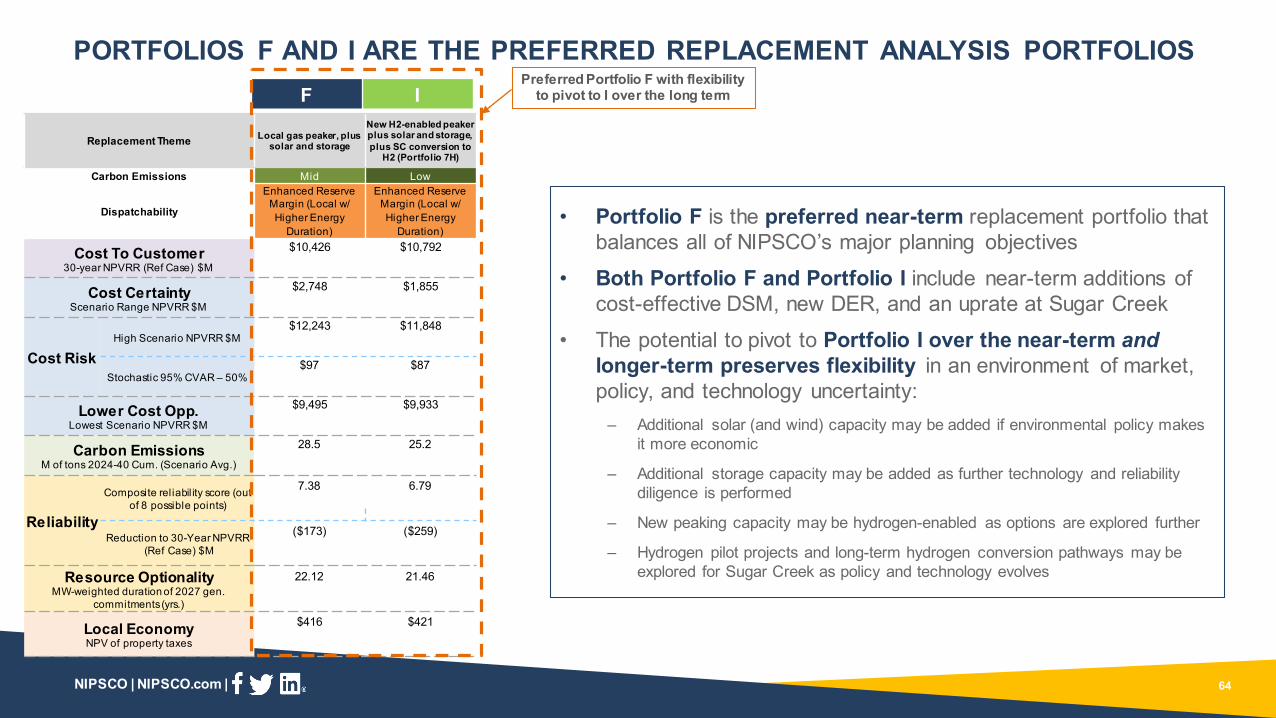
RECAP REPLACEMENT ANALYSIS PORTFOLIOS HAVE BEEN DEVELOPED ACROSS NINE CONCEPTSThe concepts are informed by the IRP themes findings from the Existing Fleet Analysis and additional optimization testing
DispatchabilityCurrent Planning Reserve Margin
Winter amp Summer Reserve Margin
Enhanced Reserve Margin (Local w Higher Energy Duration)
Emis
sion
s
Higher CarbonEmissions
Thermal PPAs solar and storage
Non-service territory gas peaking (no early storage) Natural gas dominant (CC)
Mid Carbon Emissions
No new thermal resources solar dominant w storage
Thermal PPAs plus storage and solar
Local gas peaker plus solar and storage
Low Carbon Emissions
Solar dominant w storage plus retire Sugar Creek
All renewables and storage plus retire Sugar Creek (Portfolio 7)
New H2-enabled peaker plus solar and storage plus SC conversion to H2 (Portfolio 7H)
Sugar Creek Retires or converts to H2
Net Zero Concepts
A B C
D E F
G H I
REPLACEMENT ANALYSIS
Sugar Creek is retained through modeling
horizon
bull For the Replacement Analysis Portfolio 3 from the Existing Fleet analysis has been used to assess portfolio selection under the earliest possible retirement of MC12 Note that Portfolio 2 would have similar results with small changes in resource addition timing This approach does not imply that NIPSCO has determined a specific MC12 retirement date
bull Resource combinations are constructed based on RFP projects (tranches) and other opportunities to explore a range of emissions profiles and dispatchability under current and proposed market rules
28
NIPSCO | NIPSCOcom |
bull Several resource additions are common across all themes when allowed RampC DSM programs Thermal PPAs attractive NIPSCO DER SC uprate
bull A range of solar storage gas wind and hydrogen-enabled resources are incorporated across portfolios
RECAP ICAP ADDITIONSndash RFP PROJECTS AND OTHER NEAR-TERM OPPORTUNITIES
29
Dispatchability
Current Planning Reserve Margin
Winter amp Summer Reserve Margin
Enhanced Reserve Margin (Local w Higher Energy Duration)
Emis
sion
s
Higher CarbonEmissions
NIPSCO DER 10MWSC Uprate 53MWThermal PPA 150MWStorage 135MWSolar+Storage 450MWSolar 250MW
NIPSCO DER 10MWSC Uprate 53MWGas Peaker 443MWThermal PPA 150MWSolar 250MW
NIPSCO DER 10MWSC Uprate 53MWGas CC 650MW
Portfolio violates normal net long energy sales constraints enforced in optimization
Mid Carbon Emissions
NIPSCO DER 10MWSC Uprate 53MWStorage 135MWSolar+Storage 450MWSolar 400MW
NIPSCO DER 10MWSC Uprate 53MWThermal PPA 150MWStorage 470MWSolar 250MW
NIPSCO DER 10MWSC Uprate 53MWGas Peaker 300MWThermal PPA 150MWStorage 135MWSolar 100MW
Low Carbon Emissions
NIPSCO DER 10MWStorage 135MWSolar+Storage 450MWSolar 450MW
NIPSCO DER 10MWWind 200MWStorage 570MWSolar 250MW
NIPSCO DER 10MWSC H2 Electrolyzer 20MWSC Uprate 53MWH2 Enabled Peaker 193MWWind 200MWStorage 370MWSolar 250MW
Sugar Creek Retires or converts to H2
Net Zero Concepts
A B C
D E F
G H I
Note ResidentialCommercial DSM universally selected across portfolios Represents 300 MW of solar and 150 MW of storageGas peaker in Portfolio B represents an out-of-service territory PPA Gas peaker in Portfolio F represents asset sale proposal
ICAP Additions through 2027 Planning Year
REPLACEMENT ANALYSIS
Sugar Creek is retained through modeling
horizon
NIPSCO | NIPSCOcom |
Replacement Theme
Thermal PPAssolar and storage
Non-serv ice territory gas
peaking (no early storage)
Natural gas dominant (CC)
No new thermal resources solar
dominant w storage
Thermal PPAs plus storage and
solar
Local gas peaker plus solar and
storage
Solar dominant w storage plus
retire Sugar Creek
All renewables and storage plus retire Sugar Creek
(Portfolio 7)
New H2-enabled peaker plus solar and storage plus SC conv ersion to H2 (Portfolio 7H)
Carbon Emissions Higher Higher Higher Mid Mid Mid Low Low Low
Dispatchability Current Planning Reserv e Margin
Winter amp SummerReserv eMargin
Enhanced Reserve Margin (Local w Higher
Energy Duration)
Current Planning Reserv e Margin
Winter amp SummerReserv eMargin
Enhanced Reserve Margin (Local w Higher
Energy Duration)
Current Planning Reserv e Margin
Winter amp SummerReserv eMargin
Enhanced Reserve Margin (Local w Higher
Energy Duration)
Rank (1=Least Cost) 5 2 1 4 6 3 8 9 7
Delta from LeastCost
$14914
$2002 - $126
12$15515
$11411
$73071
$77875
$48047
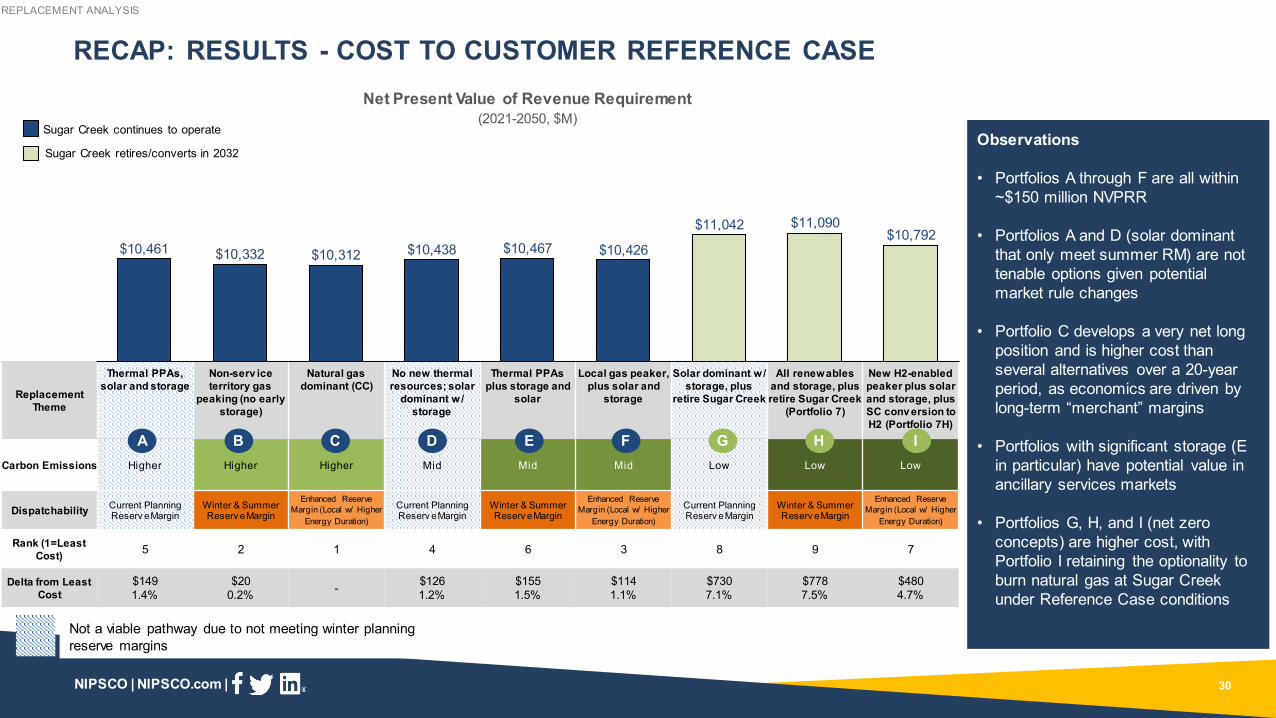
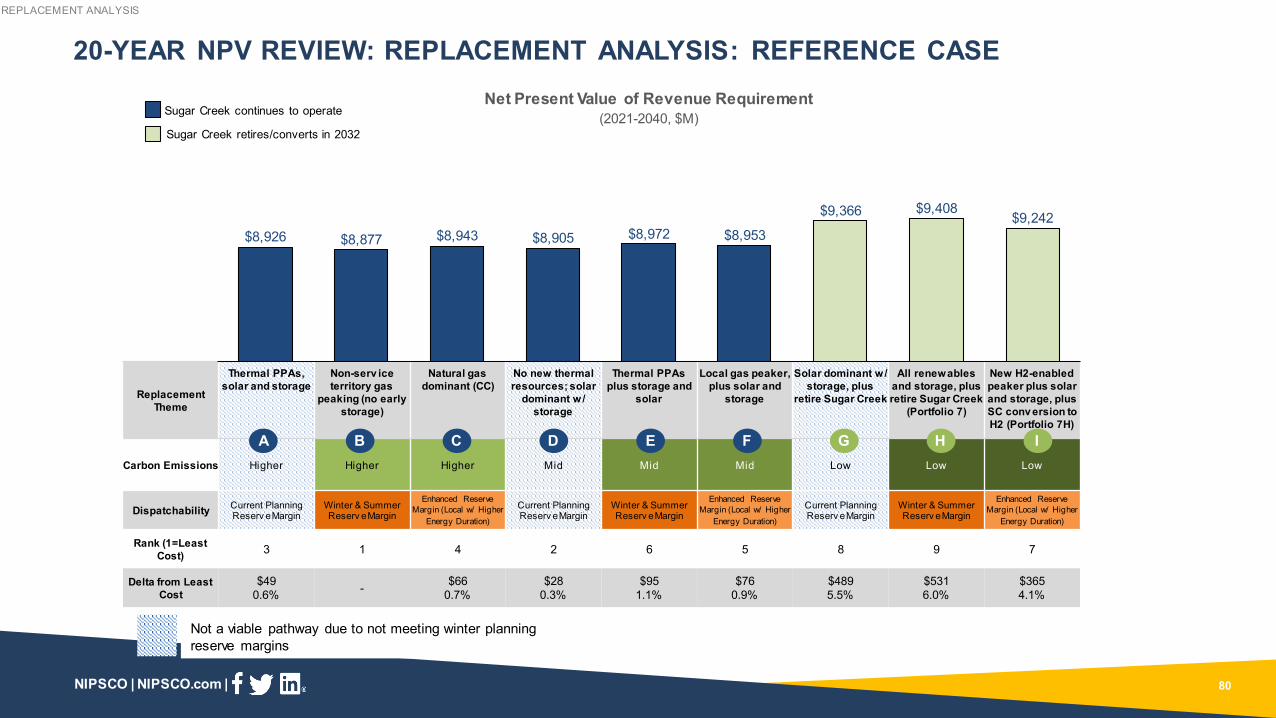
RECAP RESULTS - COST TO CUSTOMER REFERENCE CASE
Observations
bull Portfolios A through F are all within ~$150 million NVPRR
bull Portfolios A and D (solar dominant that only meet summer RM) are not tenable options given potential market rule changes
bull Portfolio C develops a very net long position and is higher cost than several alternatives over a 20-year period as economics are driven by long-term ldquomerchantrdquo margins
bull Portfolios with significant storage (E in particular) have potential value in ancillary services markets
bull Portfolios G H and I (net zero concepts) are higher cost with Portfolio I retaining the optionality to burn natural gas at Sugar Creek under Reference Case conditions
Net Present Value of Revenue Requirement(2021-2050 $M)
A
$10461 $10332 $10312 $10438 $10467 $10426
$11042 $11090$10792
B C D E F
REPLACEMENT ANALYSIS
G H I
Not a viable pathway due to not meeting winter planning reserve margins
Sugar Creek continues to operate
Sugar Creek retiresconverts in 2032
30
NIPSCO | NIPSCOcom |
RECAP REPLACEMENT ANALYSIS SCENARIO RESULTS
31
REPLACEMENT ANALYSIS
Econ-Wide Decarb
Carbon Emissions Higher Higher Higher Mid Mid Mid Low Low Low
Dispatchability Current Planning Reserv e Margin
Winter amp SummerReserv eMargin
Enhanced Reserve Margin (Local w Higher Energy
Duration)
Current Planning Reserv e Margin
Winter amp SummerReserv eMargin
Enhanced Reserve Margin (Local w Higher Energy
Duration)
Current Planning Reserv e Margin
Winter amp SummerReserv eMargin
Enhanced Reserve Margin (Local w Higher Energy
Duration)
Delta from Lowest $149 $20 - $126 $155 $114 $730 $778 $480Cost to Customer 14 02 - 12 15 11 71 75 47
Delta from Lowest $347 $91 - $334 $278 $186 $1176 $1149 $624Cost to Customer 37 10 - 36 30 20 126 123 67
Delta from Lowest $18 $106 $299 - $35 $151 $235 $144 $212Cost to Customer 02 09 26 - 03 13 21 13 19
Delta from Lowest $207 $373 $709 $156 $317 $434 - $202 $39Cost to Customer 17 32 60 13 27 37 - 17 03
Reference Case
Status Quo Extended
Aggressive Env Reg
8500
9000
9500
10000
10500
11000
11500
12000
12500
13000
30-Y
ear
NP
VR
R($
mill
ions
)
A B C E F G I
Observations
bull Portfolios B C and F have lowest costs among viable options under the Reference and SQE scenarios
bull Portfolio E has the lowest cost among viable portfolios under the AER scenario with C highest cost and HI more competitive
bull Emission free resources (clean energy) have the most value in the EWD scenario with Portfolio I (assuming a future H2 subsidy) having the lowest cost among viable portfolios
Note that a $050kg H2 subsidy is assumed in AER and EWD
D
Not a viable pathway due to not meeting winter planning reserve margins
H
Economy-Wide Decarbonization (EWD)
Reference Case
Status Quo Extended (SQE)
Aggressive Environmental Regulation (AER)
NIPSCO | NIPSCOcom |
A B C D E F G H I (80) (60) (40) (20)
- 20 40 60 80
100 120
Replacement Theme
Thermal PPAssolar and storage
Non-serv ice territory gas
peaking (no early storage)
Natural gas dominant (CC)
No new thermal resources solar
dominant w storage
Thermal PPAs plus storage and
solar
Local gas peaker plus solar and
storage
Solar dominant w storage plus
retire Sugar Creek
All renewables and storage plus retire Sugar Creek
(Portfolio 7)
New H2-enabled peaker plus solar and storage plus SC conv ersion to H2 (Portfolio 7H)
Carbon Emissions Higher Higher Higher Mid Mid Mid Low Low Low
Dispatchability Current Planning Reserv e Margin
Winter amp SummerReserv eMargin
Enhanced Reserve Margin (Local w Higher
Energy Duration)
Current Planning Reserv e Margin
Winter amp SummerReserv eMargin
Enhanced Reserve Margin (Local w Higher
Energy Duration)
Current Planning Reserv e Margin
Winter amp SummerReserv eMargin
Enhanced Reserve Margin (Local w Higher
Energy Duration)
95th CVARDelta from Low 21 9 - 21 15 14 40 31 4
75th Delta from Low 8 6 - 8 6 6 9 7 9
5th Delta from Low 13 15 22 12 17 18 - 4 11
RECAP RESULTS - STOCHASTIC ANALYSIS
Observations
bull The stochastic analysis evaluates short-term volatility in commodity prices (natural gas and power) and hourly renewable (solar and wind) output
bull The overall magnitude of cost distributions across portfolios is narrower than the scenario range suggesting that stochastic risk for these portfolio options is less impactful than the major policy or market shifts evaluated across scenarios
bull Over the 30-year time horizon dispatchability serves to mitigate tail risk as portfolios that retain SC or add gas (including with hydrogen enablement) or storage capacity perform best at minimizing upside risk
bull The lowest downside range is observed in renewable-dominant portfolios
Net Present Value of Revenue Requirement ndash Delta to Median Value(2021-2050 $M)
A B C D E F
32
G H I
CVAR ndash Avg of observations above 95th
95th
50th
25th
5th
75th
REPLACEMENT ANALYSIS
NIPSCO | NIPSCOcom |
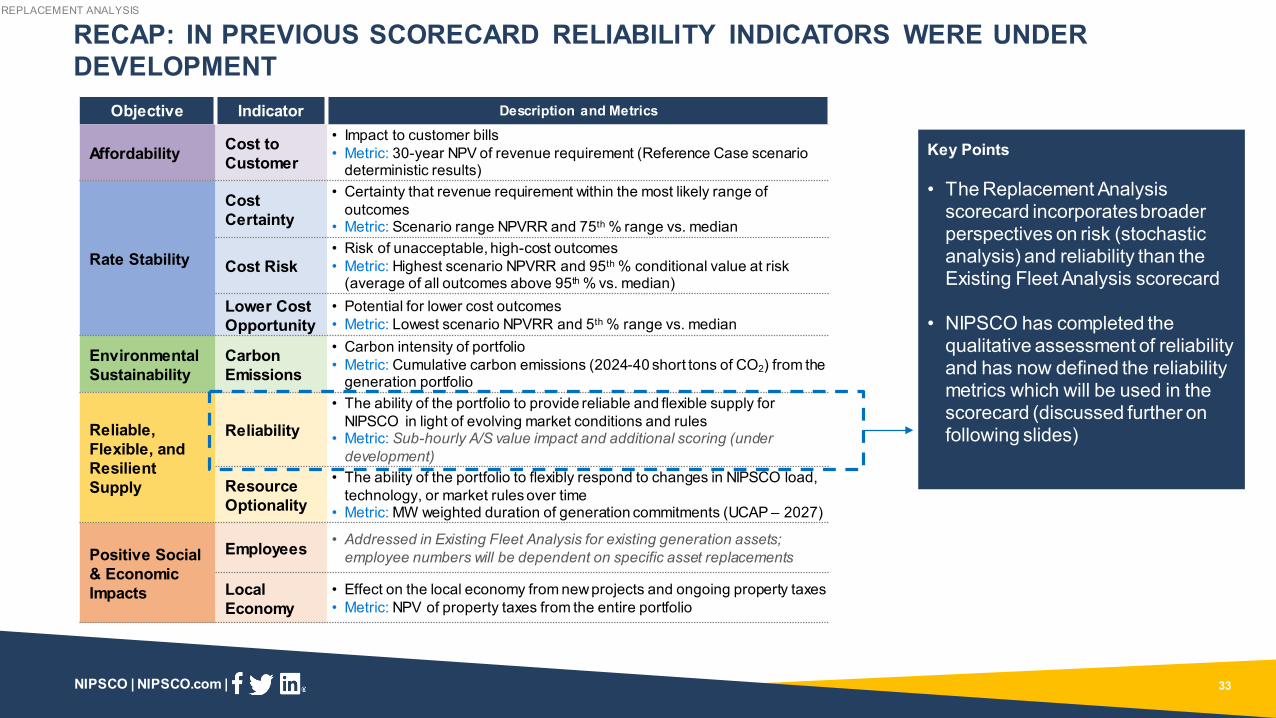
RECAP IN PREVIOUS SCORECARD RELIABILITY INDICATORS WERE UNDER DEVELOPMENT
33
Objective Indicator Description and Metrics
Affordability Cost to Customer
bull Impact to customer billsbull Metric 30-year NPV of revenue requirement (Reference Case scenario
deterministic results)
Rate Stability
Cost Certainty
bull Certainty that revenue requirement within the most likely range of outcomes
bull Metric Scenario range NPVRR and 75th range vs median
Cost Riskbull Risk of unacceptable high-cost outcomesbull Metric Highest scenario NPVRR and 95th conditional value at risk
(average of all outcomes above 95th vs median)Lower Cost Opportunity
bull Potential for lower cost outcomesbull Metric Lowest scenario NPVRR and 5th range vs median
Environmental Sustainability
Carbon Emissions
bull Carbon intensity of portfoliobull Metric Cumulative carbon emissions (2024-40 short tons of CO2) from the
generation portfolio
Reliable Flexible and Resilient Supply
Reliabilitybull The ability of the portfolio to provide reliable and flexible supply for
NIPSCO in light of evolving market conditions and rulesbull Metric Sub-hourly AS value impact and additional scoring (under
development)
Resource Optionality
bull The ability of the portfolio to flexibly respond to changes in NIPSCO load technology or market rules over time
bull Metric MW weighted duration of generation commitments (UCAP ndash 2027)
Positive Social amp Economic Impacts
Employees bull Addressed in Existing Fleet Analysis for existing generation assets employee numbers will be dependent on specific asset replacements
Local Economy
bull Effect on the local economy from new projects and ongoing property taxesbull Metric NPV of property taxes from the entire portfolio
Key Points
bull The Replacement Analysis scorecard incorporates broader perspectives on risk (stochastic analysis) and reliability than the Existing Fleet Analysis scorecard
bull NIPSCO has completed the qualitative assessment of reliability and has now defined the reliability metrics which will be used in the scorecard (discussed further on following slides)
REPLACEMENT ANALYSIS
NIPSCO | NIPSCOcom |
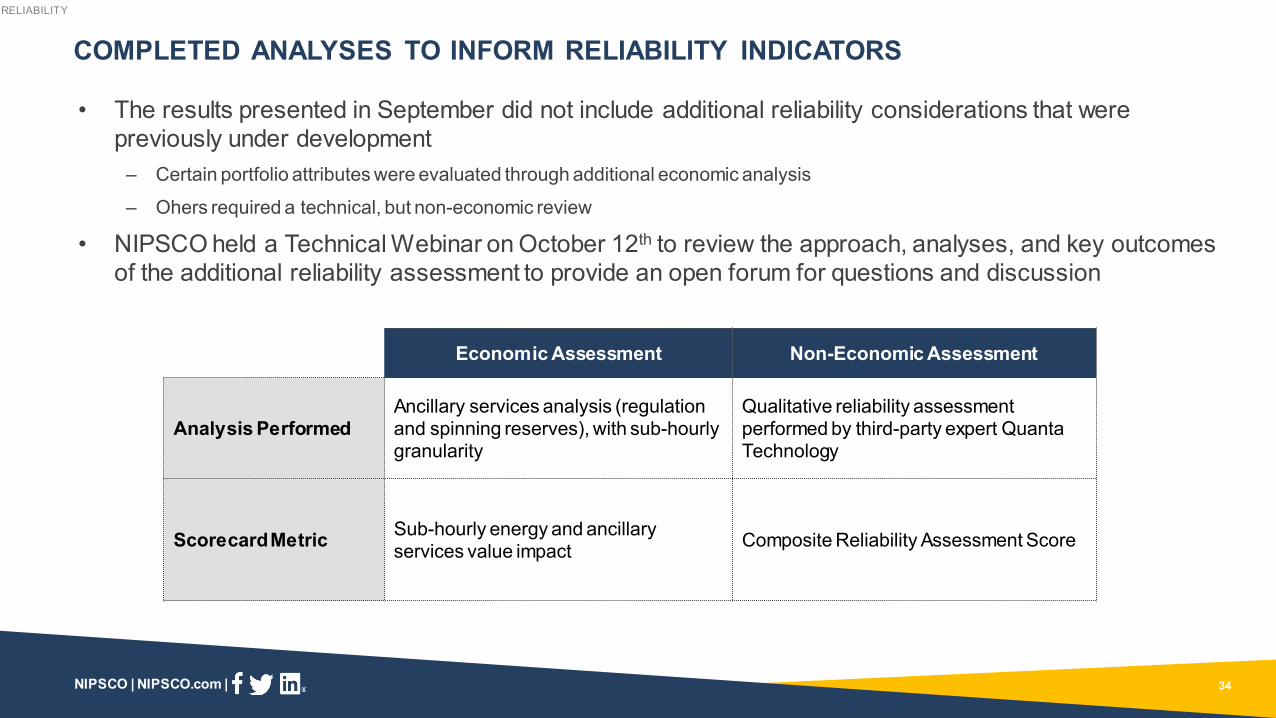
bull The results presented in September did not include additional reliability considerations that were previously under development
ndash Certain portfolio attributes were evaluated through additional economic analysis
ndash Ohers required a technical but non-economic review
bull NIPSCO held a Technical Webinar on October 12th to review the approach analyses and key outcomes of the additional reliability assessment to provide an open forum for questions and discussion
COMPLETED ANALYSES TO INFORM RELIABILITY INDICATORS
34
RELIABILITY
Economic Assessment Non-Economic Assessment
Analysis PerformedAncillary services analysis (regulation and spinning reserves) with sub-hourly granularity
Qualitative reliability assessment performed by third-party expert Quanta Technology
Scorecard Metric Sub-hourly energy and ancillary services value impact Composite Reliability Assessment Score
NIPSCO | NIPSCOcom |
bull While most of NIPSCOrsquos existing portfolio (including new renewables) realize nearly all value from energy and capacity contributions highly flexible resources that do not provide a lot of energy to the portfolio may still provide value in the form of ancillary services and in their ability to respond to changing market conditions in real time at sub-hourly granularity
ndash The MISO market currently operates markets for spinning reserves and regulation
ndash FERC Order 841 also requires ISOs to redesign markets to accommodate energy storage
bull Long-term market developments are uncertain and fundamental evaluation of sub-hourly ancillary services markets is challenging but the 2021 IRP has performed an analysis incorporating
ndash 5-minute granularity for energy and ancillary services based on historical data observations and future energy market scenario projections
ndash Operational parameters for various storage and gas peaking options
ndash Incremental value above and beyond what is picked up in the Aurora-based hourly energy dispatch is assessed and summarized on a portfolio level
SUB-HOURLY ENERGY AND ANCILLARY SERVICES EVALUATION
35
RELIABILITY
NIPSCO | NIPSCOcom |
RANGE OF ADDITIONAL VALUE OPPORTUNITY (NPVRR COST REDUCTION) BY PORTFOLIO
36
-
100
200
300
400
500
600
700
800
900Range
AERRefEWDSQE
Replacement Theme
Thermal PPAssolar and storage
Non-serv ice territory gas
peaking (no early storage)
Natural gas dominant (CC)
No new thermal resources solar
dominant w storage
Thermal PPAs plus storage and
solar
Local gas peaker plus solar and
storage
Solar dominant w storage plus
retire Sugar Creek
All renewables and storage plus retire Sugar Creek
(Portfolio 7)
New H2-enabled peaker plus solar and storage plus SC conv ersion to H2 (Portfolio 7H)
Carbon Emissions Higher Higher Higher Mid Mid Mid Low Low Low
Dispatchability Current Planning Reserv e Margin
Winter amp SummerReserv eMargin
Enhanced Reserve Margin (Local w Higher
Energy Duration)
Current Planning Reserv e Margin
Winter amp SummerReserv eMargin
Enhanced Reserve Margin (Local w Higher
Energy Duration)
Current Planning Reserv e Margin
Winter amp SummerReserv eMargin
Enhanced Reserve Margin (Local w Higher
Energy Duration)
A B C D E F G H I
Observations
bull Additional value is uncertain and dependent on market rules evolution MISO generation mix changes and market participant behavior
bull Portfolios with the largest amounts of storage (E and H) have the greatest potential to lower NPVRR by capturing flexibility value that may manifest in the sub-hourly energy and ancillary services markets
bull A wide range of value is possible with higher prices and price spreads in the AER scenario driving higher estimates
bull Results are incorporated into the final replacement analysis scorecard
Impact on Net Present Value of Revenue Requirement Value(2021-2050 $M)
RELIABILITY
NIPSCO | NIPSCOcom |
RELIABILITY ASSESSMENT GUIDING PRINCIPLES
37
The resources modeled are based on the portfolios constructed for the Replacement Analysis
Analysis incorporates planned transmission projectsTransmission
Upgrades
ResourcesModeled Goal
bull Understand potential reliability implications of potential resource additions to the NIPSCO portfolio
bull Understand the range of potential mitigations required associated with different replacement portfolio strategies The analysis is conducted at a planning level and
therefore further evaluation and granular studies will be required in the future
Individual resources from the 9 replacement portfolios are assessed based on the established reliability criteria The score of the individual resources drive the portfolio score
Evaluation
Resources are evaluated in 2030 after the Michigan City Unit 12 retirement
Time Period
RELIABILITY
NIPSCO | NIPSCOcom |
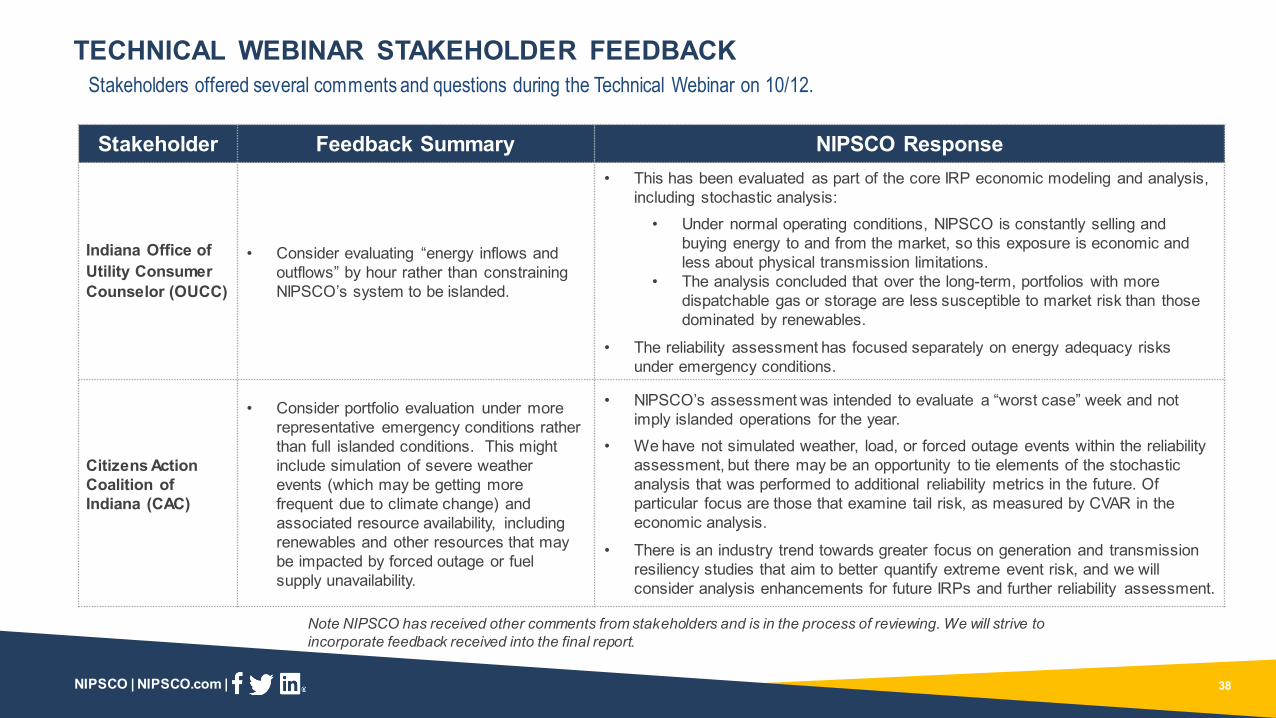
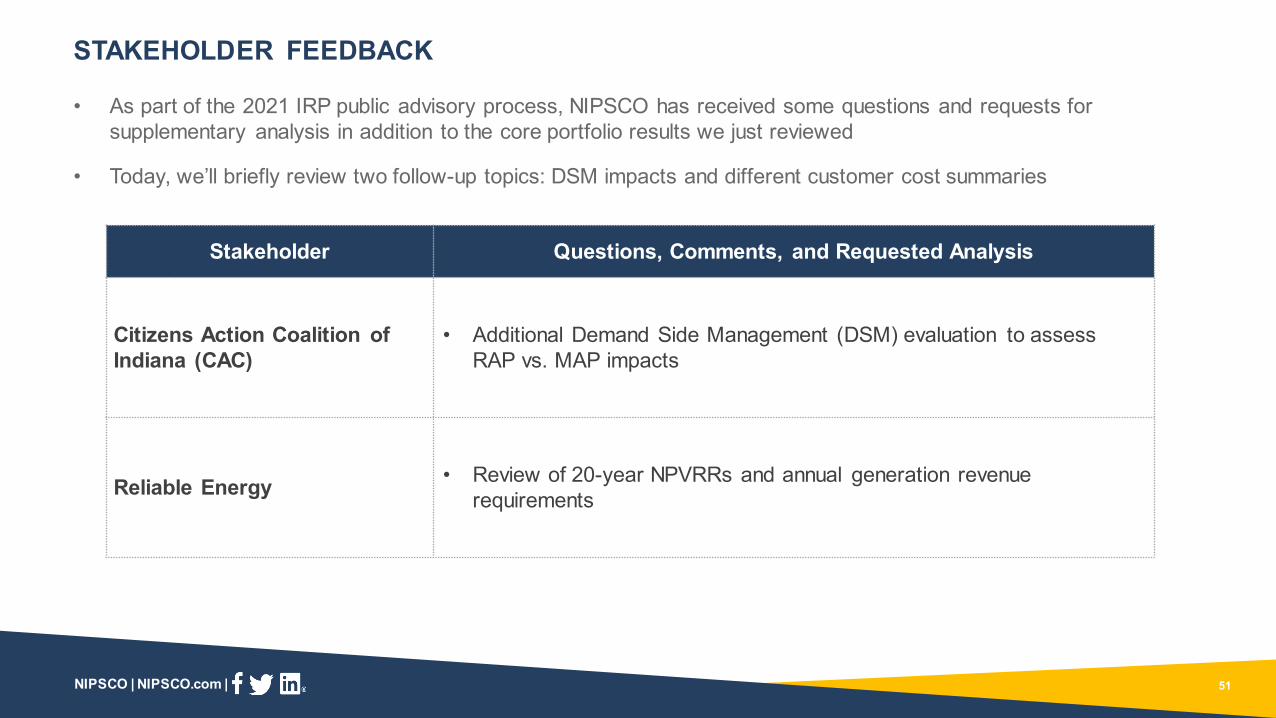
Stakeholders offered several comments and questions during the Technical Webinar on 1012 TECHNICAL WEBINAR STAKEHOLDER FEEDBACK
38
Stakeholder Feedback Summary NIPSCO Response
Indiana Office of Utility Consumer Counselor (OUCC)
bull Consider evaluating ldquoenergy inflows and outflowsrdquo by hour rather than constraining NIPSCOrsquos system to be islanded
bull This has been evaluated as part of the core IRP economic modeling and analysis including stochastic analysis
bull Under normal operating conditions NIPSCO is constantly selling and buying energy to and from the market so this exposure is economic and less about physical transmission limitations
bull The analysis concluded that over the long-term portfolios with more dispatchable gas or storage are less susceptible to market risk than those dominated by renewables
bull The reliability assessment has focused separately on energy adequacy risks under emergency conditions
Citizens Action Coalition of Indiana (CAC)
bull Consider portfolio evaluation under more representative emergency conditions rather than full islanded conditions This might include simulation of severe weather events (which may be getting more frequent due to climate change) and associated resource availability including renewables and other resources that may be impacted by forced outage or fuel supply unavailability
bull NIPSCOrsquos assessment was intended to evaluate a ldquoworst caserdquo week and not imply islanded operations for the year
bull We have not simulated weather load or forced outage events within the reliability assessment but there may be an opportunity to tie elements of the stochastic analysis that was performed to additional reliability metrics in the future Of particular focus are those that examine tail risk as measured by CVAR in the economic analysis
bull There is an industry trend towards greater focus on generation and transmission resiliency studies that aim to better quantify extreme event risk and we will consider analysis enhancements for future IRPs and further reliability assessment
Note NIPSCO has received other comments from stakeholders and is in the process of reviewing We will strive to incorporate feedback received into the final report
NIPSCO | NIPSCOcom |
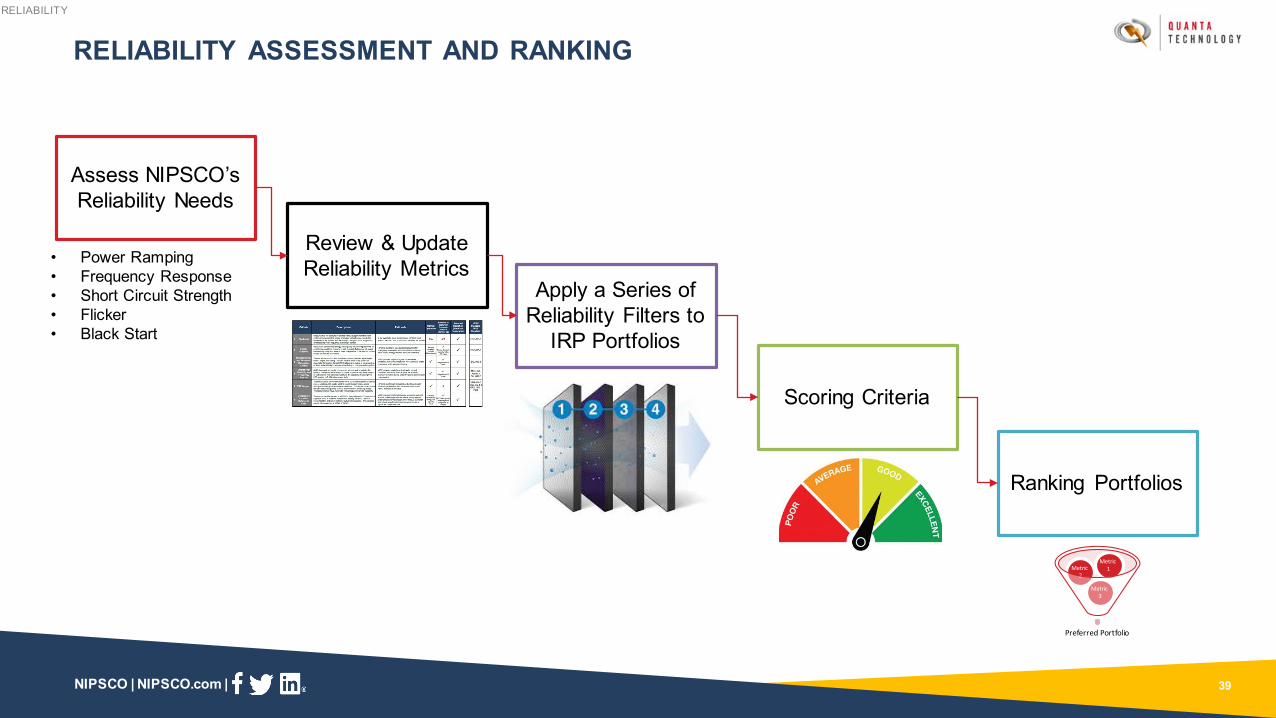
RELIABILITY ASSESSMENT AND RANKING
39
Review amp Update Reliability Metrics
Assess NIPSCOrsquos Reliability Needs
Apply a Series of Reliability Filters to
IRP Portfolios
Scoring Criteria
Ranking Portfolios
bull Power Rampingbull Frequency Responsebull Short Circuit Strengthbull Flickerbull Black Start
Preferred Portfolio
Metric 3
Metric 2
Metric 1
RELIABILITY
NIPSCO | NIPSCOcom |
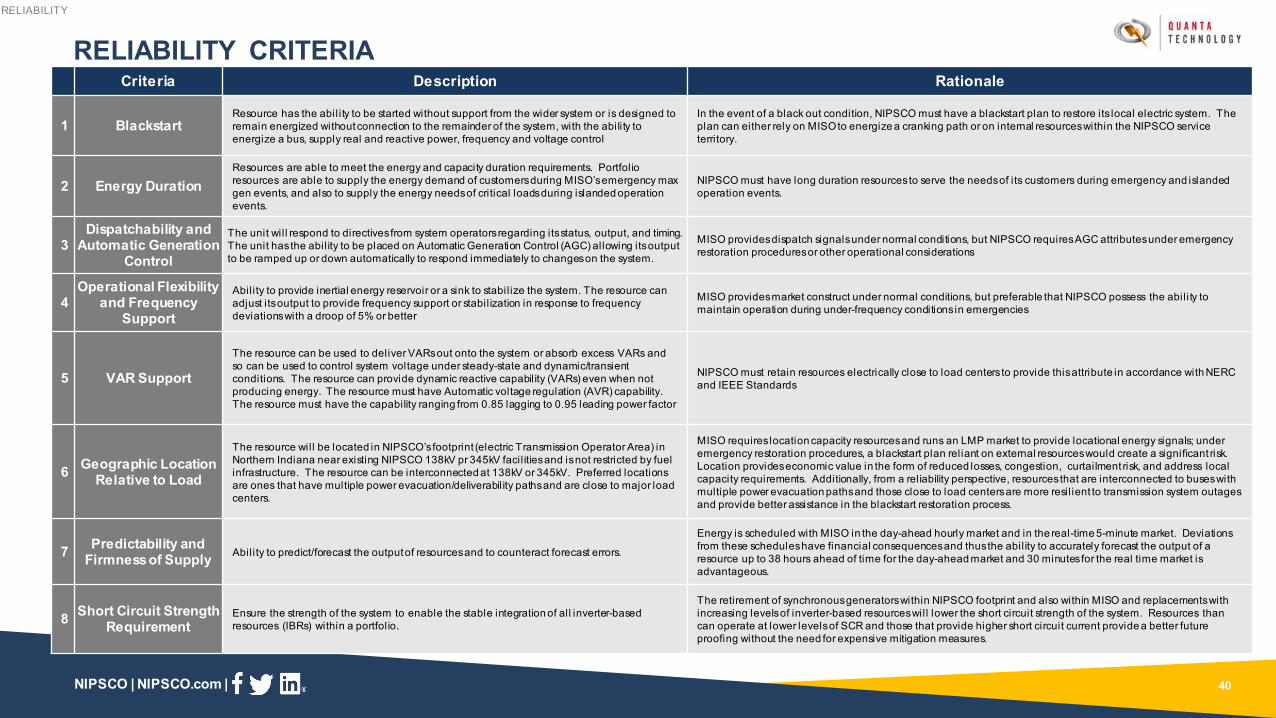
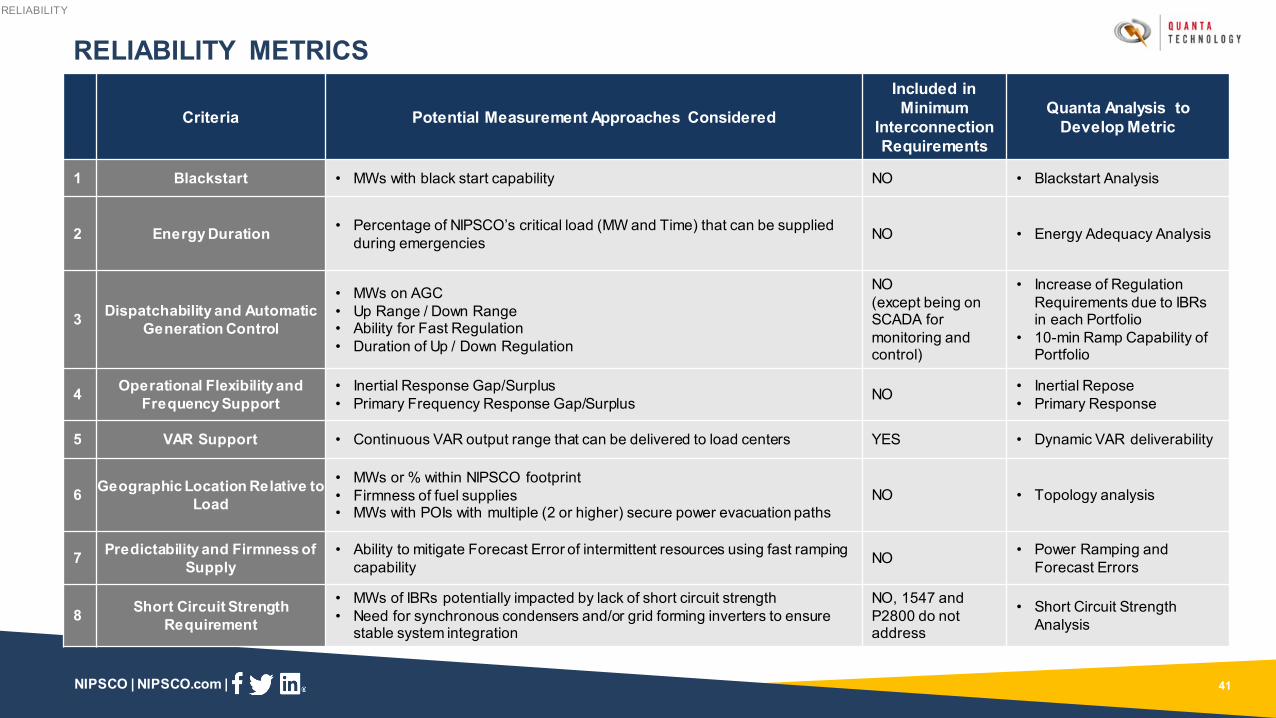
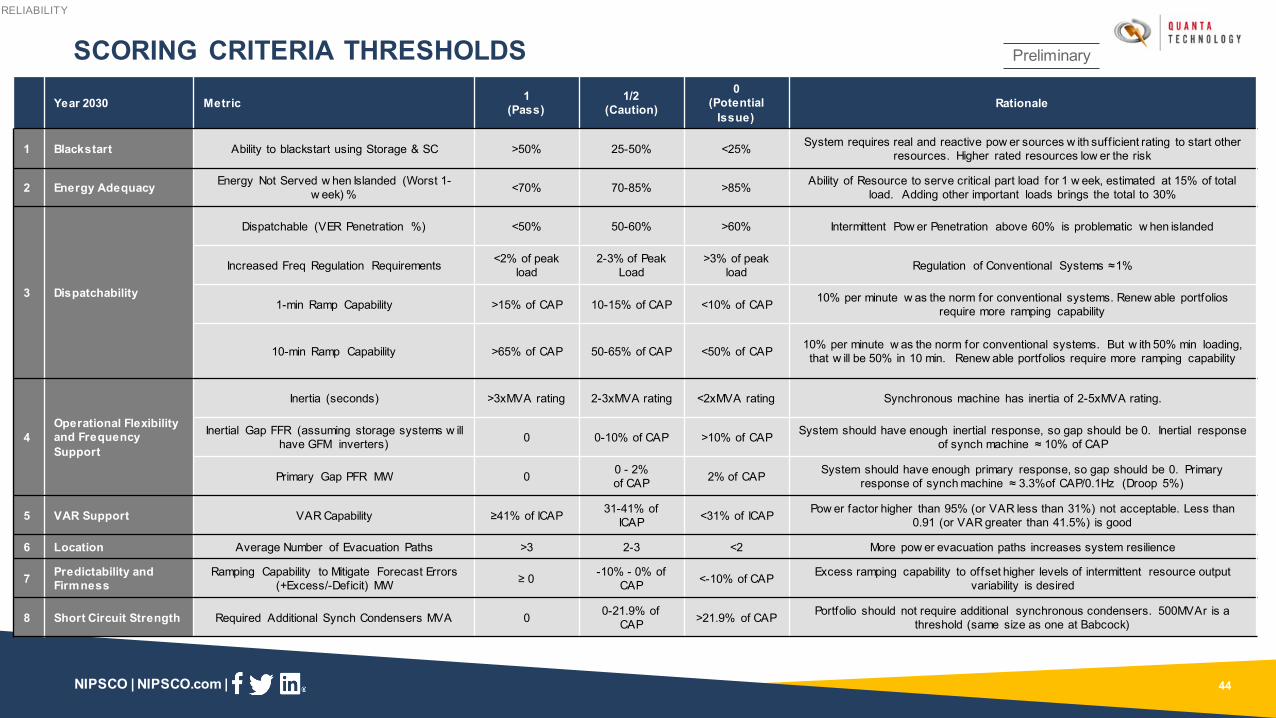
RELIABILITY CRITERIA
40
Criteria Description Rationale
1 BlackstartResource has the abil ity to be started without support from the wider system or is designed to remain energized without connection to the remainder of the system with the ability to energize a bus supply real and reactive power frequency and voltage control
In the event of a black out condition NIPSCO must have a blackstart plan to restore its local electric system The plan can either rely on MISO to energize a cranking path or on internal resources within the NIPSCO service territory
2 Energy DurationResources are able to meet the energy and capacity duration requirements Portfolio resources are able to supply the energy demand of customers during MISOrsquos emergency max gen events and also to supply the energy needs of critical loads during islanded operation events
NIPSCO must have long duration resources to serve the needs of its customers during emergency and islanded operation events
3Dispatchability and
Automatic Generation Control
The unit wil l respond to directives from system operators regarding its status output and timing The unit has the abil ity to be placed on Automatic Generation Control (AGC) allowing its output to be ramped up or down automatically to respond immediately to changes on the system
MISO provides dispatch signals under normal conditions but NIPSCO requires AGC attributes under emergency restoration procedures or other operational considerations
4Operational Flexibility
and Frequency Support
Ability to provide inertial energy reservoir or a sink to stabil ize the system The resource can adjust its output to provide frequency support or stabil ization in response to frequency deviations with a droop of 5 or better
MISO provides market construct under normal conditions but preferable that NIPSCO possess the abil ity to maintain operation during under-frequency conditions in emergencies
5 VAR Support
The resource can be used to deliver VARs out onto the system or absorb excess VARs and so can be used to control system voltage under steady-state and dynamictransient conditions The resource can provide dynamic reactive capability (VARs) even when not producing energy The resource must have Automatic voltage regulation (AVR) capability The resource must have the capability ranging from 085 lagging to 095 leading power factor
NIPSCO must retain resources electrically close to load centers to provide this attribute in accordance with NERC and IEEE Standards
6 Geographic Location Relative to Load
The resource will be located in NIPSCOrsquos footprint (electric Transmission Operator Area) in Northern Indiana near existing NIPSCO 138kV pr 345kV facil ities and is not restricted by fuel infrastructure The resource can be interconnected at 138kV or 345kV Preferred locations are ones that have multiple power evacuationdeliverabil ity paths and are close to major load centers
MISO requires location capacity resources and runs an LMP market to provide locational energy signals under emergency restoration procedures a blackstart plan reliant on external resources would create a significant risk Location provides economic value in the form of reduced losses congestion curtailment risk and address local capacity requirements Additionally from a reliability perspective resources that are interconnected to buses with multiple power evacuation paths and those close to load centers are more resil ient to transmission system outages and provide better assistance in the blackstart restoration process
7 Predictability and Firmness of Supply Ability to predictforecast the output of resources and to counteract forecast errors
Energy is scheduled with MISO in the day-ahead hourly market and in the real-time 5-minute market Deviations from these schedules have financial consequences and thus the abil ity to accurately forecast the output of a resource up to 38 hours ahead of time for the day-ahead market and 30 minutes for the real time market is advantageous
8 Short Circuit Strength Requirement
Ensure the strength of the system to enable the stable integration of all inverter-based resources (IBRs) within a portfolio
The retirement of synchronous generators within NIPSCO footprint and also within MISO and replacements with increasing levels of inverter-based resources will lower the short circuit strength of the system Resources than can operate at lower levels of SCR and those that provide higher short circuit current provide a better future proofing without the need for expensive mitigation measures
RELIABILITY
NIPSCO | NIPSCOcom |
RELIABILITY METRICS
41
Criteria Potential Measurement Approaches Considered
Included in Minimum
Interconnection Requirements
Quanta Analysis to Develop Metric
1 Blackstart bull MWs with black start capability NO bull Blackstart Analysis
2 Energy Duration bull Percentage of NIPSCOrsquos critical load (MW and Time) that can be supplied during emergencies NO bull Energy Adequacy Analysis
3 Dispatchability and Automatic Generation Control
bull MWs on AGCbull Up Range Down Rangebull Ability for Fast Regulationbull Duration of Up Down Regulation
NO (except being on SCADA for monitoring and control)
bull Increase of Regulation Requirements due to IBRs in each Portfolio
bull 10-min Ramp Capability of Portfolio
4 Operational Flexibility and Frequency Support
bull Inertial Response GapSurplusbull Primary Frequency Response GapSurplus NO bull Inertial Repose
bull Primary Response
5 VAR Support bull Continuous VAR output range that can be delivered to load centers YES bull Dynamic VAR deliverability
6 Geographic Location Relative to Load
bull MWs or within NIPSCO footprintbull Firmness of fuel supplies bull MWs with POIs with multiple (2 or higher) secure power evacuation paths
NO bull Topology analysis
7 Predictability and Firmness of Supply
bull Ability to mitigate Forecast Error of intermittent resources using fast ramping capability NO bull Power Ramping and
Forecast Errors
8 Short Circuit Strength Requirement
bull MWs of IBRs potentially impacted by lack of short circuit strengthbull Need for synchronous condensers andor grid forming inverters to ensure
stable system integration
NO 1547 and P2800 do not address
bull Short Circuit Strength Analysis
RELIABILITY
NIPSCO | NIPSCOcom |
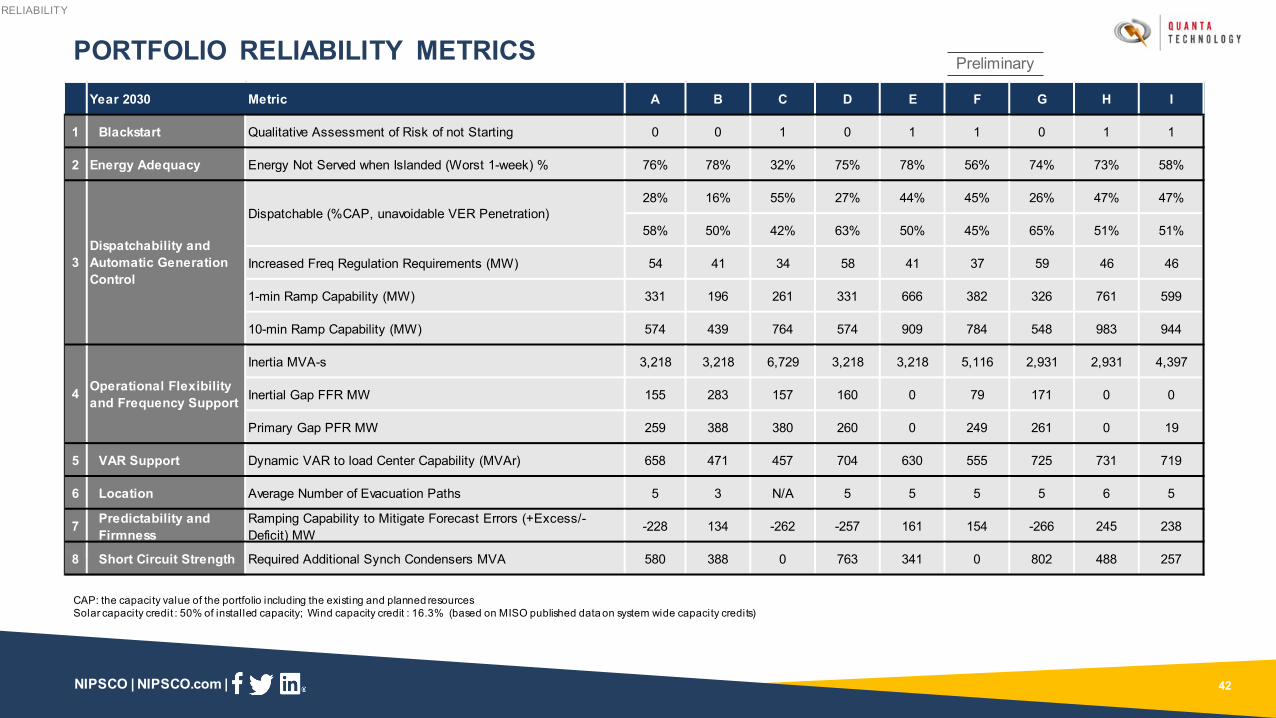
PORTFOLIO RELIABILITY METRICSYear 2030 Metric A B C D E F G H I
1 Blackstart Qualitative Assessment of Risk of not Starting 0 0 1 0 1 1 0 1 1
2 Energy Adequacy Energy Not Served when Islanded (Worst 1-week) 76 78 32 75 78 56 74 73 58
28 16 55 27 44 45 26 47 47
58 50 42 63 50 45 65 51 51
Increased Freq Regulation Requirements (MW) 54 41 34 58 41 37 59 46 46
1-min Ramp Capability (MW) 331 196 261 331 666 382 326 761 599
10-min Ramp Capability (MW) 574 439 764 574 909 784 548 983 944
Inertia MVA-s 3218 3218 6729 3218 3218 5116 2931 2931 4397
Inertial Gap FFR MW 155 283 157 160 0 79 171 0 0
Primary Gap PFR MW 259 388 380 260 0 249 261 0 19
5 VAR Support Dynamic VAR to load Center Capability (MVAr) 658 471 457 704 630 555 725 731 719
6 Location Average Number of Evacuation Paths 5 3 NA 5 5 5 5 6 5
7 Predictability and Firmness
Ramping Capability to Mitigate Forecast Errors (+Excess-Deficit) MW
-228 134 -262 -257 161 154 -266 245 238
8 Short Circuit Strength Required Additional Synch Condensers MVA 580 388 0 763 341 0 802 488 257
Dispatchable (CAP unavoidable VER Penetration)
4 Operational Flexibility and Frequency Support
3Dispatchability and Automatic Generation Control
CAP the capacity value of the portfolio including the existing and planned resourcesSolar capacity credit 50 of installed capacity Wind capacity credit 163 (based on MISO published data on system wide capacity credits)
Preliminary
RELIABILITY
42

NIPSCO | NIPSCOcom |
SAFETY MOMENT
2
NIPSCO | NIPSCOcom |
bull Your input and feedback is critical to NIPSCOrsquos Integrated Resource Plan (ldquoIRPrdquo) Process
bull The Public Advisory Process provides NIPSCO with feedback on its assumptions and sources of data This helps inform the modeling process and overall IRP
bull We set aside time at the end of each section to ask questions
bull Your candid and ongoing feedback is key
ndash Please ask questions and make comments on the content presented
ndash Please provide feedback on the process itself
bull While we will mostly utilize the chat feature in WebEx to facilitate comments we will gladly unmute you if you would like to speak Please identify yourself by name prior to speaking This will help keep track of comments and follow up actions
bull If you wish to make a presentation during a meeting please reach out to Alison Becker (abeckernisourcecom)
STAKEHOLDER ADVISORY MEETING PROTOCOLS
3
Alison Becker
NIPSCO | NIPSCOcom |
AGENDA
4
TimeCentral Time
Topic Speaker
900-905AM Webinar Introduction Safety Moment Meeting Protocols Agenda Alison Becker Manager Regulatory Policy NIPSCO
905-915AM Welcome Mike Hooper President amp COO NIPSCO
915-930AM NIPSCOrsquos Public Advisory Process andResource Planning Activity Review Fred Gomos Director Strategy amp Risk Integration NiSource
930-1000AM Existing Fleet Analysis Review Pat Augustine Vice President CRA
1000-1015AM Break
1015-1100AM Replacement Analysis ReviewPat Augustine Vice President CRAHisham Othman VP Transmission and Regulatory Consulting Quanta Technology LLC
1100-1130AM Responses to Stakeholder Feedback Pat Augustine Vice President CRA
1130AM-1200PM Lunch
1200-100PM Preferred Resource Plan and Action Plan Fred Gomos Director Strategy amp Risk Integration NiSourcePat Augustine Vice President CRA
100-155PM Stakeholder Presentations TBD155-200PM Wrap Up amp Next Steps Erin Whitehead Vice President Regulatory amp Major Accounts NIPSCO
NIPSCO | NIPSCOcom | NIPSCO | NIPSCOcom |
Mike Hooper President amp COO NIPSCO
WELCOME
5
NIPSCO | NIPSCOcom | 6
PILLARS OF OUR ONGOING GENERATION TRANSITION PLANThis plan creates a vision for the future that is better for our customers and itrsquos consistent with our goal to transition
to the best cost cleanest electric supply mix available while maintaining reliability diversity and flexibility for the technology and market changes on the horizon
Reliable and sustainable
Flexibility for the future
Best plan for customers and the company
Local and statewide economic benefits
NIPSCO | NIPSCOcom | NIPSCO | NIPSCOcom |
Fred Gomos Director Strategy amp Risk Integration NiSource
NIPSCOrsquoS PUBLIC ADVISORY PROCESS AND RESOURCE PLANNING ACTIVITY REVIEW
7
NIPSCO | NIPSCOcom |
bull At least every three years NIPSCO outlines its long-term plan to supply electricity to customers over the next 20 years
bull This study ndash known as an IRP ndash is required of all electric utilities in Indiana
bull The IRP process includes extensive analysis of a range of generation scenarios with criteria such as reliable affordable compliant diverse and flexible
HOW DOES NIPSCO PLAN FOR THE FUTURE
8
Reliable
Compliant
FlexibleDiverse
Affordable
Requires Careful Planning and Consideration forbull NIPSCOrsquos employeesbull Environmental regulationsbull Changes in the local economy (property tax
supplier spending employee base)
NIPSCO | NIPSCOcom |
2021 STAKEHOLDER ADVISORY MEETING ROADMAP
9
Meeting Meeting 1 (March) Meeting 2 (May) Meeting 3 (July) Meeting 4 (September) Technical Webinar Meeting 5 (October)
Date 3192021 5202021 7132021 9212021 10122021 10212021
Location Virtual Virtual Virtual Virtual Virtual Virtual
Key Questions
bull How has NIPSCO progressed in the 2018 Short Term Action Plan
bull What has changed since the 2018 IRP
bull How are energy and demand expected change over time
bull What is the high level plan for stakeholder communication and feedback for the 2021 IRP
bull How do regulatory developments and initiatives at the MISO level impact NIPSCOrsquos 2021 IRP planning framework
bull How has environmental policy changed since 2018
bull What scenario themes and stochastics will NIPSCO explore in 2021
bull How are DSM resources considered in the IRP
bull How will NIPSCO evaluate potential DER options
bull What are the preliminary RFPresults
bull What are the preliminary findings from the modeling
bull What are the results of the Reliability Assessment
bull What is NIPSCOrsquos preferred plan
bull What is the short-term action plan
Content bull 2018 Short Term Action Plan Update (Retirements Replacement projects)
bull Resource Planning and 2021 Continuous Improvements
bull Update on Key InputsAssumptions (commodity prices demand forecast)
bull Scenario Themes ndash Introduction
bull 2021 Public Advisory Process
bull MISO Regulatory Developments and Initiatives
bull 2021 Environmental Policy Update
bull Scenariosand Stochastic Analysis
bull DSM Modeling and Methodology
bull DER Inputs
bull Preliminary RFP Results
bull Existing Fleet Review Modeling Results Scorecard
bull Replacement Modeling Results Scorecard
bull Reliability Assessment bull Preferred replacement path and logic relative to alternatives
bull 2021 NIPSCO Short Term Action Plan
Meeting Goals
bull Communicate what has changed since the 2018 IRP
bull Communicate NIPSCOrsquos focus on reliability
bull Communicate updates to key inputsassumptions
bull Communicate the 2021 public advisory process timing and input sought from stakeholders
bull Common understanding of MISO regulatory updates
bull Communicate environmental policy considerations
bull Communicate scenario themes and stochastic analysis approach along with major input details and assumptions
bull Common understanding of DSM modeling methodology
bull Communicate preliminary RFP results
bull Explain next steps for portfolio modeling
bull Communicate the Existing Fleet Portfolios and the Replacement Portfolios
bull Develop a shared understanding of economic modeling outcomes and preliminary results to facil itate stakeholder feedback
bull Common understanding of Reliability Assessment methodology
bull Communicate Reliability Assessment results
bull Respond to key stakeholder comments and requests
bull Communicate NIPSCOrsquos preferred resource plan and short-term action plan
bull Obtain feedback from stakeholders on preferred plan
NIPSCO | NIPSCOcom |
RESOURCE PLANNING APPROACH
10
Scorecard(Example)
Other Analysis (eg Reliability Assessment
Employee Impacts etc)
Aurora ndash NIPSCO Portfolio Market ModelProduction Cost Dispatch (hourly
chronological)
PERFORMDetailed cost of
service and revenue requirements
4
RFP Information
DSM Study
New resource option parameters
Portfolio Optimization
Retirement options and replacement themes (informed
by scenarios)NIPSCO
Portfolios
3
Market Modeling Tools (NGF GPCM Aurora)
Scenario Narrative Development2
Activity Timing
Identify key planning questions and themes Mar
Develop market perspectives (planning reference case and scenarios stochastic inputs)
Mar-May
Develop integrated resource strategies for NIPSCO (portfolios)
Jun-Jul
Portfolio modeling Detailed scenario dispatch Stochastic simulations
Aug-Sep
Evaluate trade-offs and produce recommendation Sep-Oct
1
2
3
4
5 Stochastic Modeling Tools
Integrated gas coal carbon forecasts and MISO market outlook prices
NIPSCO | NIPSCOcom |
bull The ongoing fleet transition in MISO makes it critical for NIPSCOrsquos IRP to capture several changing dynamics to allow NIPSCO to remain flexible
bull Over the course of the 2021 IRP NIPSCO has discussed these topics
IDENTIFY KEY PLANNING QUESTIONS AND THEMES1KEY PLANNING QUESTIONS AND THEMES
Topic
Retirement Timing for Existing Coal and Gas Units
Assessing the retirement timing of the remaining generating fleet after the Schahfer coal units retire which includes Michigan City Unit 12 Schahfer Units 16A and 16B and Sugar Creek
Flexibility amp Adaptability of The Portfolio
Incorporating evolving capacity credit expectations for resources and an imminent seasonal resource adequacy requirement
Carbon Emissions amp RegulationIncentives
Assessing diverse portfolio options in the context of increased policy conversations that push for 100 decarbonization of the power sector by the middle of the next decade
Long-Term Planning With Intermittent Resources
Understanding system reliability implications of a portfolio that will have significant intermittent resources in light of the MISO market evolution and NIPSCOrsquos operational responsibilities
11
NIPSCO | NIPSCOcom |
LONG TERM SYSTEM PLANNING WITH INTERMITTENT RESOURCES
12
Ensure Consistency with MISO Rules Evolution
Expand Uncertainty Analysis
Incorporate New Metrics
Seasonal resource adequacy Future effective load carrying capability
(ELCC) accounting
Incorporation of renewable output uncertainty
Broadening risk analysis to incorporate granular views of tail risk
Incorporating new scorecard metrics informed by stochastic analysis and capabilities of portfolio resources
Both summer and winter reserve margins tracked and implemented as constraints
ELCC accounting by season with a range of expected solar declines over time
Stochastic analysis evaluated the relationship between hourly renewable output and power prices to estimate the impact at different levels of penetration and across the commodity price distribution
Examined tail outcomes to understand the conditions and portfolios that expose customers to low probability high consequence (price) events
Performed ancillary services analysis (regulation spinning reserves) with sub-hourly granularity and conducted qualitative reliability assessment with several new metrics
2021 IRP Approach To Evaluate Action Implemented In IRP Modeling
1KEY PLANNING QUESTIONS AND THEMES
NIPSCO | NIPSCOcom |
As in the 2018 IRP multiple objectives and indicators are summarized across portfolios in an integrated scorecard framework against which to test portfolios and evaluate the major planning questions
IDENTIFY KEY PLANNING QUESTIONS AND THEMES1
bull The scorecard is a means of reporting key metrics for different portfolio options to transparently review tradeoffs and relative performance it does not produce a single score or ranking of portfolios but serves as a tool to facilitate decision-making
bull NIPSCO has identified 5 major planning objectives and multiple metrics within 9 key indicator categories
bull The Existing Fleet Analysis scorecard focuses on scenario costs carbon emissions and impact on NIPSCO employees and the local economy
bull The Replacement Analysis scorecard incorporates broader perspectives on risk (stochastic analysis) and reliability than the Existing Fleet Analysis scorecard
Objective Indicator
Affordability Cost to Customer
Rate Stability
Cost Certainty
Cost Risk
Lower Cost Opportunity
Environmental Sustainability
Carbon Emissions
Reliable Flexible and Resilient Supply
Reliability
Resource Optionality
Positive Social amp Economic Impacts
Employees
Local Economy
KEY PLANNING QUESTIONS AND THEMES
13
NIPSCO | NIPSCOcom |
bull NIPSCO developed four integrated market scenarios or future ldquostates of the worldrdquo
ndash Scenarios incorporate a range of future outcomes for load commodity prices technology and policy
ndash The 2021 IRP includes two distinct policy frameworks for achieving net-zero emission trajectories for the broader power market
bull Stochastic inputs have been developed for key components of quantifiable stochastic risk
ndash For the 2021 IRP the stochastic analysis has been expanded to include hourly renewable availability in addition to commodity price volatility
DEVELOP MARKET PERSPECTIVES (REF CASE SCENARIOS STOCHASTIC INPUTS)
14
2
Reference Casebull The MISO market continues to evolve based on current expectations for load growth commodity
price trajectories technology development and policy change (some carbon regulation and MISO rules evolution)
Status Quo Extended (ldquoSQErdquo)bull Binding federal limits on carbon emissions are not implemented natural gas prices remain low and
result in new gas additions remaining competitive versus renewables as coal capacity more gradually fades from the MISO market
Aggressive Environmental Regulation (ldquoAERrdquo)bull Carbon emissions from the power sector are regulated through a mix of incentives and a federal
taxcap-and-trade program that results in a significant CO2 price and net-zero emission targets for the power sector by 2040 restrictions on natural gas production increase gas prices
Economy-Wide Decarbonization (ldquoEWDrdquo)bull Technology development and federal incentives push towards a decarbonized economy including
through a power sector Clean Energy Standard (supporting renewables and other non-emitting technologies) and large-scale electrification in other sectors (EVs heating processes etc)
0
20
40
60
80
100
1 4 7 1013161922C
apac
ity F
acto
r
Hour of Day
Solar Output Power Prices
-
20
40
60
80
100
120
nom
inal
$M
Wh
MARKET PERSPECTIVES AND MODELING OF UNCERTAINTY
NIPSCO | NIPSCOcom |
NIPSCO is now monitoring summer and winter reserve margins plus the annual energy balanceKey Points
bull The capacity credit for some of the 2023 projects is not reflected until 2024 due to in-service date timing
bull Capacity credit for some storage resources is not reflected until 2025 (after a full year of operations) due to plant configuration
bull While winter loads are lower the lower capacity credit in the winter for solar resources results in a similar reserve margin
bull On an annual basis the net energy position for the portfolio is long driven by the energy value and economic dispatch advantage of wind and solar resources However the tight capacity position may create hourly gaps particularly in the winter mornings and evenings when solar resources ramp down (next slide)
1000
0
2000
3000
202420232021 2022 2025 2026 2027 2028
Summer Capacity
20282021 2022 20262023 2024 2025 2027
Winter Capacity
UCAP MW
Capacity PurchasesCapacity Gap
WindOtherFiled DSM Programs
Storage
SolarCoalNatural GasPeak Load (or Net Energy)
Planning Reserve Margin
Annual EnergyGWh
Multiple renew able projects coming online in 2023 to address capacity gap
0
2000
4000
6000
8000
10000
12000
14000
16000
2021 2022 2023 2024 2025 2026 2027 2028
STARTING NEAR-TERM CAPACITY AND ENERGY BALANCE3CURRENT PORTFOLIO POSITION
15
NIPSCO | NIPSCOcom |
bull There are hours of the day where renewable resources are not available (ex overnight for solar) Furthermore solar resources may experience steep production declines in the evening hours
bull Currently Sugar Creek (natural gas CC) Schahfer 16AB (natural gas peaker) and Michigan City 12 (coal) are part of the portfolio and when economic NIPSCO can purchase from the MISO market
bull As 16AB and MC12 retire the portfolio will require new resources to be available to mitigate against specific hourly energy exposure
STARTING ENERGY BALANCE VARIES ON AN HOURLY BASIS
Average Summer Day after Schahfer coal ret wo MC12 and 16AB Average Winter Day after Schahfer coal ret wo MC12 and 16AB
Steep ramping needs
0
500
1000
1500
2000
2500
1 2 3 4 5 6 7 8 9 10 11 12 13 14 15 16 17 18 19 20 21 22 23 24
MW
1 2 3 4 5 6 7 8 9 10 11 12 13 14 15 16 17 18 19 20 21 22 23 24
Sugar Creek
Hydro
Wind
FiT DER
Solar
Storage
Gross Load
Load Net of DSM
Net Requirement
3CURRENT PORTFOLIO POSITION
16
NIPSCO | NIPSCOcom | NIPSCO | NIPSCOcom |
Pat Augustine Vice President CRA
EXISTING FLEET ANALYSIS REVIEW
17
NIPSCO | NIPSCOcom |
bull The IRP analysis is performed in two phases the first phase examines current and future resource additions to evaluate timing of retirement for existing units
bull Insight and conclusions from existing fleet analysis inform replacement concepts to evaluate Once a preferred existing portfolio is established future replacements are evaluated across a range of objectives
RECAP ANALYTICAL FRAMEWORK
18
Existing Fleet Analysis Replacement Analysis
Core Questions
How does the cost to keep a unit compare to the cost to replace with economically optimized resourcesIs the portfolio flexible and adaptable to address changes in market rules and energy policy
What are the replacement resource portfolio options How do different replacement themes compare with regard to cost risk environmental sustainability and reliability
Actual projects available to NIPSCO Actual projects available to NIPSCO
Key Decision What units should retire and when What new resources should be added to meet customersrsquo needs
All-Source RFP
EXISTING FLEET ANALYSIS
NIPSCO | NIPSCOcom |
RECAP CONSTRUCTED RETIREMENT PORTFOLIOS TO COVER THE RANGE OF TIMING POSSIBILITIES FOR REMAINING FOSSIL UNITS
Key Points
bull Portfolio construction is necessarily broad to fully address tradeoffs
bull Portfolios 1-4 focus on the timing of the Michigan City retirement
bull Portfolios 5 and 6 focus on the replacement timing for Schahfer 16AB Units are not retained beyond 2028 in any portfolio given current condition and age
bull Portfolio 7 and 7H are assessing implications of carbon free portfolio pathways
Portfolio Transition
Target
15 Coal through 2032
15 Coal through 2028
15 Coal through 2026
15 Coal through 2024
15 Coal through 2028
15 Coal through 2026
15 Coal through 2028
Fossil Free by 2032
15 Coal through 2028
Option for Fossil Free by 2032
MC 12 Through Book life
2018 IRP Preferred Plan
Early Retirement of MC 12
Early Retirement of MC 12
2018 IRP Preferred Plan + 2025 16AB
retirement
Early Retirement of MC 12
+ 2025 16AB retirement
2018 IRP Preferred Plan + 2025 16AB ret +
2032 SC ret
2018 IRP Preferred Plan + 2025 16AB ret +
2032 SC conv
Retain beyond
2032Sugar Creek Sugar Creek Sugar Creek Sugar Creek Sugar Creek Sugar Creek None
Sugar Creek conv erts to H2
(2032)
Michigan City 12
Retire Retire Retire Retire Retire Retire Retire
2032 2028 2026 2024 2028 2026 2028
Schahfer 16AB
Retire Retire
2028 2025
Sugar Creek Retain
Retire Convert to H2
2032 2032
1 2 3 4 5 6 7 7H
Short term Longer term
EXISTING FLEET ANALYSIS
Not a viable pathway due to implementation timing19
NIPSCO | NIPSCOcom |
bull Driven by a binding winter reserve margin and the energy resources already obtained from the 2018 IRP Preferred Plan the indicative ordering of model selection preference favors resources that offer greater levels of firm capacity
bull This is not NIPSCOrsquos final replacement resource selection or preferred plan but an optimized set of additions to facilitate evaluation of the various existing fleet strategies
RECAP EXISTING FLEET ANALYSIS SELECTIONS ARE DRIVEN BY ECONOMIC OPTIMIZATION
Resource options include RFP tranches DSM bundles DER options and an opportunity to uprate capacity at Sugar Creek
Portfolio 1
MC12 Through Book Life
Technology ICAP MW
Year
NIPSCO DER 10 2026Sugar Creek Uprate 53 2027DSMThermal Contract 50 2024Thermal Contract 100 2026Gas Peaker 300 2032Storage 135 2027Total 693
Portfolios 2 | 3 | 4
2018 IRP (MC 2028) | MC 2026 | MC 2028
TechnologyICAP MW
YearP2 P3
NIPSCO DER 10 2026 2026Sugar Creek Uprate 53 2027 2027DSMThermal Contract 50 2024 2024Thermal Contract 100 2026 2026Gas Peaker 300 2028 2026Storage 135 2027 2027Solar 100
200^2026 2026
Total 793 893^
Portfolio 7H
Fossil Free Option by 2032 w SC Conversion (incl capital costs)
Technology ICAP MW
Year
NIPSCO DER 10 2026Sugar Creek Uprate 53 2027DSMStorage 235 2025Storage 135 2027Solar 250 2026Wind 200 2026Hydrogen-Enabled Gas Peaker 193 2025SC Electrolyzer Pilot 20 2026Total 1131
DSM includes the cumulative impact of both Residential and Commercial programs by 2027 with Commercial being most cost effective DSM is reported on a summer peak basis Note that the winter impact is ~46MW
CO
ST-E
FEC
TIVE
NESS
Less
More
68 6868
2027 2027 20272027
Portfolios 5 | 6Portfolio 2 w 16AB 2025 | Portfolio 3 w 16AB 2025
Technology ICAP MW
YearP5 P6
NIPSCO DER 10 2026 2026Sugar Creek Uprate 53 2027 2027DSM 68 2027 2027Thermal Contract 50 2024 2024Thermal Contract 100 2026 2026Gas Peaker 300 2028 2026Storage 135 2025 2025Solar 100 2026 2026Wind 200 NA 2026Total 993
Portfolio 7
Fossil Free By 2032
Technology ICAP MW
Year
NIPSCO DER 10 2026DSM 68 2027Storage 235 2025Storage 100 2026Storage 235 2027Solar 250 2026Wind 200 2026Total 1020
EXISTING FLEET ANALYSIS
Notes Portfolios were optimized against winter reserve margin constraints (94) followed by summer to ensure compliance with bothA maximum net energy sales limit of 30 during the fleet transition (2023-2026) falling to 25 in 2030+ was also enforcedWind outside LRZ6 was not included in optimization analysis given lack of capacity deliverabil ity to LRZ6 and significant congestion risk
P420262027
2024202620242025
2026
2027
^ P23 have 100 MW of solar P4 has 200 MW
20
NIPSCO | NIPSCOcom |
Portfolio Transition Target
15 Coal through 2032
15 Coal through 2028
15 Coal through 2026
15 Coal through 2024
15 Coal through 2028
15 Coal through 2026
15 Coal through 2028
Fossil Free by 2032
15 Coal through 2028
Option for Fossil Free by 2032
Retire MC 12 (2032)Schfr 16AB (2028)
MC 12 (2028)Schfr 16AB (2028)
MC 12 (2026)Schfr 16AB (2028)
MC 12 (2024)Schfr 16AB (2028)
MC 12 (2028)Schfr 16 AB (2025)
MC 12 (2026)Schfr 16AB (2025)
MC 12 (2028)Schfr 16AB (2025)
SC (2032)
MC 12 (2028)Schfr 16AB (2025)
SC to H2 (2032)
Retain beyond 2032 Sugar Creek Sugar Creek Sugar Creek Sugar Creek Sugar Creek Sugar Creek None Sugar Creek converts to H2 (2032)
Rank (1=Least Cost) 5 3 1 2 6 4 8 7
Delta from LeastCost
$35M03
$16M02 - $10M
01$47M05
$24M02
$417M41
$357M35
RECAP EXISTING FLEET ANALYSIS - DETERMINISTIC COST TO CUSTOMERSRESULTS
Observations
bull The difference in NPVRR from the highest cost to lowest cost portfolio is approximately $430 million
bull Consistent with NIPSCOrsquos prior IRP findings early retirement of coal is generally cost effective for customers although the difference in cost across several portfolios is small since much of the remaining portfolio is fixed and small changes in retirement dates are now being assessed
bull Retaining Units 16AB until 2028 may be cost effective given the portfoliorsquos capacity needs However this is contingent on the operational condition of these older vintage units and the cost impacts of earlier retirement are less than 1 in NPVRR
Net Present Value of Revenue Requirement(2021-2050 $M)
1
$10149 $10130 $10114 $10125 $10161 $10138$10531 $10471
2 3 5 6 7 7H
EXISTING FLEET ANALYSIS
4
Not a viable pathway due to implementation timing
21
NIPSCO | NIPSCOcom |
RECAP EXISTING FLEET ANALYSIS - SCENARIO RESULTS
Econ-Wide Decarbonization
Portfolio Transition Target
15 Coal through 2032
15 Coal through 2028
15 Coal through 2026
15 Coal through 2024
15 Coal through 2028
15 Coal through 2026
15 Coal through 2028
Fossil Free by 2032
15 Coal through 2028 Option forFossil Free by
2032
Retire MC 12 (2032)Schfr 16AB (2028)
MC 12 (2028)Schfr 16AB (2028)
MC 12 (2026)Schfr 16AB (2028)
MC 12 (2024)Schfr 16AB (2028)
MC 12 (2028)Schfr 16 AB
(2025)
MC 12 (2026)Schfr 16AB (2025)
MC 12 (2028)Schfr 16AB (2025)
SC (2032)
MC 12 (2028)Schfr 16AB (2025)
SC to H2 (2032)
Retain beyond 2032 Sugar Creek Sugar Creek Sugar Creek Sugar Creek Sugar Creek Sugar Creek None
Sugar Creek converts to H2
(2032)Delta from Lowest $35 $16 - $10 $47 $24 $417 $357Cost to Customer 03 02 - 01 05 02 41 35
Delta from Lowest $36 $18 $2 - $49 $108 $720 $492Cost to Customer 04 02 00 - 05 12 78 54
Delta from Lowest $336 $269 $259 $277 $292 $157 - $303Cost to Customer 31 25 24 25 27 14 - 28
Delta from Lowest $477 $454 $449 $459 $478 $276 - $29Cost to Customer 41 39 39 40 42 24 - 03
Reference Case
Status Quo Extended
Aggressive Env Reg
8500
9000
9500
10000
10500
11000
11500
12000
12500
13000
NP
VR
R($
mill
ions
)
1 2 3 5 6 7 7H
Observations
bull MC12 retirement in 2026 has a small cost benefit (lt$20M) relative to retirement in 2028 across all scenarios
bull MC 12 retirement in 2032 is always higher cost than earlier retirement with the largest difference in the AER scenario (high carbon price)
bull Portfolio 2 is slightly lower cost than Portfolio 5 although additional renewable additions with early 16AB retirement (Portfolio 6) lower costs under high carbon regulation scenarios
bull Portfolios 7 and 7H have the smallest range as their future renewable hydrogen and storage investments hedge against high-cost power market outcomes
EXISTING FLEET ANALYSIS
Note that a $050kg H2 subsidy is assumed in AER and EWD
4
Reference Case
Status Quo Extended (SQE)
Aggressive Environmental Regulation (AER)
Economy-Wide Decarbonization (EWD)
Not a viable pathway due to implementation timing 22
NIPSCO | NIPSCOcom |
RECAP EXISTING FLEET ANALYSIS SCORECARD
23
Objective Indicator Description and Metrics
Affordability Cost to Customer
bull Impact to customer billsbull Metric 30-year NPV of revenue requirement
(Reference Case scenario deterministic results)
Rate Stability
Cost Certainty
bull Certainty that revenue requirement within the most likely range of outcomes
bull Metric Scenario range NPVRR
Cost Risk bull Risk of unacceptable high-cost outcomesbull Metric Highest scenario NPVRR
Lower Cost Opportunity
bull Potential for lower cost outcomesbull Metric Lowest scenario NPVRR
Environmental Sustainability
Carbon Emissions
bull Carbon intensity of portfoliobull Metric Cumulative carbon emissions (2024-40
short tons of CO2) from the generation portfolio
Reliable Flexible and Resilient Supply
Reliabilitybull To be addressed in Replacement Analysis stage
Resource Optionality
Positive Social amp Economic Impacts
Employeesbull Net impact on NiSource jobsbull Metric Approx number of permanent NiSource jobs
associated with generation
Local Economy
bull Net effect on the local economy (relative to 2018 IRP) from new projects and ongoing property taxes
bull Metric NPV of existing fleet property tax relative to 2018 IRP
Additional risk metrics will be included in the Replacement Analysis when broader set of resource types are evaluated
Key Points
bull Two closely related but distinct scorecards are used for the Existing Fleet Analysis and the Replacement Analysis
bull The Existing Fleet Analysis focuses on scenario costs carbon emissions and impact on NIPSCO employees and the local economy
bull The Replacement Analysis expands the risk assessment to include a stochastic assessment and introduces reliability metrics to assess a broader range of future resource options
EXISTING FLEET ANALYSIS
NIPSCO | NIPSCOcom |
RECAP EXISTING FLEET ANALYSIS SCORECARD
24
1 2 3 4 5 6 7 7H
Not a viable pathway due to implementation timing
Adding replacement projects could have an impact on net jobs
Portfolio Transition Target
15 Coal through 2032
15 Coal through 2028
15 Coal through 2026
15 Coal through 2024
15 Coal through 2028
15 Coal through 2026
15 Coal through 2028
Fossil Free by 2032
15 Coal through 2028
Fossil Free by 2032
Retire MC 12 (2032)Schfr 16AB (2028)
MC 12 (2028)Schfr 16AB (2028)
MC 12 (2026)Schfr 16AB (2028)
MC 12 (2024)Schfr 16AB (2028)
MC 12 (2028)Schfr 16 AB (2025)
MC 12 (2026)Schfr 16AB (2025)
MC 12 (2028)Schfr 16AB (2025)
SC (2032)
MC 12 (2028)Schfr 16AB (2025)
SC to H2 (2032)
Retain beyond 2032 Sugar Creek Sugar Creek Sugar Creek Sugar Creek Sugar Creek Sugar Creek None Sugar Creek converts to H2 (2032)
Cost To Customer30-year NPV of revenue requirement (Ref Case)
$10149 $10130 $10114 $10125 $10161 $10138 $10531 $10471+$35 +$16 - $10 +$47 +$24 +$417 +$35703 02 - 01 05 02 41 35
Cost CertaintyScenario Range (NPVRR)
$2759 $2754 $2766 $2777 $2747 $2487 $1598 $1855+$1161 +$1156 +$1167 +$1179 +$1149 +$889 - +$257726 723 730 738 719 556 - 161
Cost RiskHighest Scenario NPVRR
$11974 $11951 $11947 $11957 $11976 $11773 $11498 $11527+$477 $454 +$449 +$459 +$478 +$276 - +$2941 39 39 40 42 24 - 03
Lower Cost Opportunity
Lowest Scenario NPVRR
$9215 $9197 $9181 $9179 $9229 $9287 $9899 $9671+$36 +$18 +$2 - +$49 +$108 +$720 +$49204 02 00 - 05 12 78 53
Carbon EmissionsM of tons 2024-40 Cum
(Scenario Avg)
433 337 285 230 337 285 214 309+22 +12 +7 +2 +12 +7 - +9
102 57 33 8 57 33 - 44
EmployeesApprox existing gen jobs compared to 2018 IRP
+127 0 -127 -127 -4 -131 -34 -4
Local EconomyNPV of existing fleet property
tax relative to 2018 IRP+$13 $0 -$10 -$23 $0 -$10 -$16 +$13
EXISTING FLEET ANALYSIS
NIPSCO | NIPSCOcom | NIPSCO | NIPSCOcom |
BREAK
25
NIPSCO | NIPSCOcom | NIPSCO | NIPSCOcom |
Pat Augustine Vice President CRAHisham Othman VP Transmission and Regulatory Consulting Quanta Technology LLC
REPLACEMENT ANALYSIS REVIEW
26
NIPSCO | NIPSCOcom |
bull The IRP analysis is performed in two phases the first phase examines current and future resource additions to evaluate timing of retirement for existing units
bull Insight and conclusions from existing fleet analysis inform replacement concepts to evaluate Once a preferred existing portfolio is established future replacements are evaluated across a range of objectives
RECAP ANALYTICAL FRAMEWORK
27
Existing Fleet Analysis Replacement Analysis
Core Questions
How does the cost to keep a unit compare to the cost to replace with economically optimized resourcesIs the portfolio flexible and adaptable to address changes in market rules and energy policy
What are the replacement resource portfolio options How do different replacement themes compare with regard to cost risk environmental sustainability and reliability
Actual projects available to NIPSCO Actual projects available to NIPSCO
Key Decision What units should retire and when What new resources should be added to meet customersrsquo needs
All-Source RFP
REPLACEMENT ANALYSIS
NIPSCO | NIPSCOcom |
RECAP REPLACEMENT ANALYSIS PORTFOLIOS HAVE BEEN DEVELOPED ACROSS NINE CONCEPTSThe concepts are informed by the IRP themes findings from the Existing Fleet Analysis and additional optimization testing
DispatchabilityCurrent Planning Reserve Margin
Winter amp Summer Reserve Margin
Enhanced Reserve Margin (Local w Higher Energy Duration)
Emis
sion
s
Higher CarbonEmissions
Thermal PPAs solar and storage
Non-service territory gas peaking (no early storage) Natural gas dominant (CC)
Mid Carbon Emissions
No new thermal resources solar dominant w storage
Thermal PPAs plus storage and solar
Local gas peaker plus solar and storage
Low Carbon Emissions
Solar dominant w storage plus retire Sugar Creek
All renewables and storage plus retire Sugar Creek (Portfolio 7)
New H2-enabled peaker plus solar and storage plus SC conversion to H2 (Portfolio 7H)
Sugar Creek Retires or converts to H2
Net Zero Concepts
A B C
D E F
G H I
REPLACEMENT ANALYSIS
Sugar Creek is retained through modeling
horizon
bull For the Replacement Analysis Portfolio 3 from the Existing Fleet analysis has been used to assess portfolio selection under the earliest possible retirement of MC12 Note that Portfolio 2 would have similar results with small changes in resource addition timing This approach does not imply that NIPSCO has determined a specific MC12 retirement date
bull Resource combinations are constructed based on RFP projects (tranches) and other opportunities to explore a range of emissions profiles and dispatchability under current and proposed market rules
28
NIPSCO | NIPSCOcom |
bull Several resource additions are common across all themes when allowed RampC DSM programs Thermal PPAs attractive NIPSCO DER SC uprate
bull A range of solar storage gas wind and hydrogen-enabled resources are incorporated across portfolios
RECAP ICAP ADDITIONSndash RFP PROJECTS AND OTHER NEAR-TERM OPPORTUNITIES
29
Dispatchability
Current Planning Reserve Margin
Winter amp Summer Reserve Margin
Enhanced Reserve Margin (Local w Higher Energy Duration)
Emis
sion
s
Higher CarbonEmissions
NIPSCO DER 10MWSC Uprate 53MWThermal PPA 150MWStorage 135MWSolar+Storage 450MWSolar 250MW
NIPSCO DER 10MWSC Uprate 53MWGas Peaker 443MWThermal PPA 150MWSolar 250MW
NIPSCO DER 10MWSC Uprate 53MWGas CC 650MW
Portfolio violates normal net long energy sales constraints enforced in optimization
Mid Carbon Emissions
NIPSCO DER 10MWSC Uprate 53MWStorage 135MWSolar+Storage 450MWSolar 400MW
NIPSCO DER 10MWSC Uprate 53MWThermal PPA 150MWStorage 470MWSolar 250MW
NIPSCO DER 10MWSC Uprate 53MWGas Peaker 300MWThermal PPA 150MWStorage 135MWSolar 100MW
Low Carbon Emissions
NIPSCO DER 10MWStorage 135MWSolar+Storage 450MWSolar 450MW
NIPSCO DER 10MWWind 200MWStorage 570MWSolar 250MW
NIPSCO DER 10MWSC H2 Electrolyzer 20MWSC Uprate 53MWH2 Enabled Peaker 193MWWind 200MWStorage 370MWSolar 250MW
Sugar Creek Retires or converts to H2
Net Zero Concepts
A B C
D E F
G H I
Note ResidentialCommercial DSM universally selected across portfolios Represents 300 MW of solar and 150 MW of storageGas peaker in Portfolio B represents an out-of-service territory PPA Gas peaker in Portfolio F represents asset sale proposal
ICAP Additions through 2027 Planning Year
REPLACEMENT ANALYSIS
Sugar Creek is retained through modeling
horizon
NIPSCO | NIPSCOcom |
Replacement Theme
Thermal PPAssolar and storage
Non-serv ice territory gas
peaking (no early storage)
Natural gas dominant (CC)
No new thermal resources solar
dominant w storage
Thermal PPAs plus storage and
solar
Local gas peaker plus solar and
storage
Solar dominant w storage plus
retire Sugar Creek
All renewables and storage plus retire Sugar Creek
(Portfolio 7)
New H2-enabled peaker plus solar and storage plus SC conv ersion to H2 (Portfolio 7H)
Carbon Emissions Higher Higher Higher Mid Mid Mid Low Low Low
Dispatchability Current Planning Reserv e Margin
Winter amp SummerReserv eMargin
Enhanced Reserve Margin (Local w Higher
Energy Duration)
Current Planning Reserv e Margin
Winter amp SummerReserv eMargin
Enhanced Reserve Margin (Local w Higher
Energy Duration)
Current Planning Reserv e Margin
Winter amp SummerReserv eMargin
Enhanced Reserve Margin (Local w Higher
Energy Duration)
Rank (1=Least Cost) 5 2 1 4 6 3 8 9 7
Delta from LeastCost
$14914
$2002 - $126
12$15515
$11411
$73071
$77875
$48047
RECAP RESULTS - COST TO CUSTOMER REFERENCE CASE
Observations
bull Portfolios A through F are all within ~$150 million NVPRR
bull Portfolios A and D (solar dominant that only meet summer RM) are not tenable options given potential market rule changes
bull Portfolio C develops a very net long position and is higher cost than several alternatives over a 20-year period as economics are driven by long-term ldquomerchantrdquo margins
bull Portfolios with significant storage (E in particular) have potential value in ancillary services markets
bull Portfolios G H and I (net zero concepts) are higher cost with Portfolio I retaining the optionality to burn natural gas at Sugar Creek under Reference Case conditions
Net Present Value of Revenue Requirement(2021-2050 $M)
A
$10461 $10332 $10312 $10438 $10467 $10426
$11042 $11090$10792
B C D E F
REPLACEMENT ANALYSIS
G H I
Not a viable pathway due to not meeting winter planning reserve margins
Sugar Creek continues to operate
Sugar Creek retiresconverts in 2032
30
NIPSCO | NIPSCOcom |
RECAP REPLACEMENT ANALYSIS SCENARIO RESULTS
31
REPLACEMENT ANALYSIS
Econ-Wide Decarb
Carbon Emissions Higher Higher Higher Mid Mid Mid Low Low Low
Dispatchability Current Planning Reserv e Margin
Winter amp SummerReserv eMargin
Enhanced Reserve Margin (Local w Higher Energy
Duration)
Current Planning Reserv e Margin
Winter amp SummerReserv eMargin
Enhanced Reserve Margin (Local w Higher Energy
Duration)
Current Planning Reserv e Margin
Winter amp SummerReserv eMargin
Enhanced Reserve Margin (Local w Higher Energy
Duration)
Delta from Lowest $149 $20 - $126 $155 $114 $730 $778 $480Cost to Customer 14 02 - 12 15 11 71 75 47
Delta from Lowest $347 $91 - $334 $278 $186 $1176 $1149 $624Cost to Customer 37 10 - 36 30 20 126 123 67
Delta from Lowest $18 $106 $299 - $35 $151 $235 $144 $212Cost to Customer 02 09 26 - 03 13 21 13 19
Delta from Lowest $207 $373 $709 $156 $317 $434 - $202 $39Cost to Customer 17 32 60 13 27 37 - 17 03
Reference Case
Status Quo Extended
Aggressive Env Reg
8500
9000
9500
10000
10500
11000
11500
12000
12500
13000
30-Y
ear
NP
VR
R($
mill
ions
)
A B C E F G I
Observations
bull Portfolios B C and F have lowest costs among viable options under the Reference and SQE scenarios
bull Portfolio E has the lowest cost among viable portfolios under the AER scenario with C highest cost and HI more competitive
bull Emission free resources (clean energy) have the most value in the EWD scenario with Portfolio I (assuming a future H2 subsidy) having the lowest cost among viable portfolios
Note that a $050kg H2 subsidy is assumed in AER and EWD
D
Not a viable pathway due to not meeting winter planning reserve margins
H
Economy-Wide Decarbonization (EWD)
Reference Case
Status Quo Extended (SQE)
Aggressive Environmental Regulation (AER)
NIPSCO | NIPSCOcom |
A B C D E F G H I (80) (60) (40) (20)
- 20 40 60 80
100 120
Replacement Theme
Thermal PPAssolar and storage
Non-serv ice territory gas
peaking (no early storage)
Natural gas dominant (CC)
No new thermal resources solar
dominant w storage
Thermal PPAs plus storage and
solar
Local gas peaker plus solar and
storage
Solar dominant w storage plus
retire Sugar Creek
All renewables and storage plus retire Sugar Creek
(Portfolio 7)
New H2-enabled peaker plus solar and storage plus SC conv ersion to H2 (Portfolio 7H)
Carbon Emissions Higher Higher Higher Mid Mid Mid Low Low Low
Dispatchability Current Planning Reserv e Margin
Winter amp SummerReserv eMargin
Enhanced Reserve Margin (Local w Higher
Energy Duration)
Current Planning Reserv e Margin
Winter amp SummerReserv eMargin
Enhanced Reserve Margin (Local w Higher
Energy Duration)
Current Planning Reserv e Margin
Winter amp SummerReserv eMargin
Enhanced Reserve Margin (Local w Higher
Energy Duration)
95th CVARDelta from Low 21 9 - 21 15 14 40 31 4
75th Delta from Low 8 6 - 8 6 6 9 7 9
5th Delta from Low 13 15 22 12 17 18 - 4 11
RECAP RESULTS - STOCHASTIC ANALYSIS
Observations
bull The stochastic analysis evaluates short-term volatility in commodity prices (natural gas and power) and hourly renewable (solar and wind) output
bull The overall magnitude of cost distributions across portfolios is narrower than the scenario range suggesting that stochastic risk for these portfolio options is less impactful than the major policy or market shifts evaluated across scenarios
bull Over the 30-year time horizon dispatchability serves to mitigate tail risk as portfolios that retain SC or add gas (including with hydrogen enablement) or storage capacity perform best at minimizing upside risk
bull The lowest downside range is observed in renewable-dominant portfolios
Net Present Value of Revenue Requirement ndash Delta to Median Value(2021-2050 $M)
A B C D E F
32
G H I
CVAR ndash Avg of observations above 95th
95th
50th
25th
5th
75th
REPLACEMENT ANALYSIS
NIPSCO | NIPSCOcom |
RECAP IN PREVIOUS SCORECARD RELIABILITY INDICATORS WERE UNDER DEVELOPMENT
33
Objective Indicator Description and Metrics
Affordability Cost to Customer
bull Impact to customer billsbull Metric 30-year NPV of revenue requirement (Reference Case scenario
deterministic results)
Rate Stability
Cost Certainty
bull Certainty that revenue requirement within the most likely range of outcomes
bull Metric Scenario range NPVRR and 75th range vs median
Cost Riskbull Risk of unacceptable high-cost outcomesbull Metric Highest scenario NPVRR and 95th conditional value at risk
(average of all outcomes above 95th vs median)Lower Cost Opportunity
bull Potential for lower cost outcomesbull Metric Lowest scenario NPVRR and 5th range vs median
Environmental Sustainability
Carbon Emissions
bull Carbon intensity of portfoliobull Metric Cumulative carbon emissions (2024-40 short tons of CO2) from the
generation portfolio
Reliable Flexible and Resilient Supply
Reliabilitybull The ability of the portfolio to provide reliable and flexible supply for
NIPSCO in light of evolving market conditions and rulesbull Metric Sub-hourly AS value impact and additional scoring (under
development)
Resource Optionality
bull The ability of the portfolio to flexibly respond to changes in NIPSCO load technology or market rules over time
bull Metric MW weighted duration of generation commitments (UCAP ndash 2027)
Positive Social amp Economic Impacts
Employees bull Addressed in Existing Fleet Analysis for existing generation assets employee numbers will be dependent on specific asset replacements
Local Economy
bull Effect on the local economy from new projects and ongoing property taxesbull Metric NPV of property taxes from the entire portfolio
Key Points
bull The Replacement Analysis scorecard incorporates broader perspectives on risk (stochastic analysis) and reliability than the Existing Fleet Analysis scorecard
bull NIPSCO has completed the qualitative assessment of reliability and has now defined the reliability metrics which will be used in the scorecard (discussed further on following slides)
REPLACEMENT ANALYSIS
NIPSCO | NIPSCOcom |
bull The results presented in September did not include additional reliability considerations that were previously under development
ndash Certain portfolio attributes were evaluated through additional economic analysis
ndash Ohers required a technical but non-economic review
bull NIPSCO held a Technical Webinar on October 12th to review the approach analyses and key outcomes of the additional reliability assessment to provide an open forum for questions and discussion
COMPLETED ANALYSES TO INFORM RELIABILITY INDICATORS
34
RELIABILITY
Economic Assessment Non-Economic Assessment
Analysis PerformedAncillary services analysis (regulation and spinning reserves) with sub-hourly granularity
Qualitative reliability assessment performed by third-party expert Quanta Technology
Scorecard Metric Sub-hourly energy and ancillary services value impact Composite Reliability Assessment Score
NIPSCO | NIPSCOcom |
bull While most of NIPSCOrsquos existing portfolio (including new renewables) realize nearly all value from energy and capacity contributions highly flexible resources that do not provide a lot of energy to the portfolio may still provide value in the form of ancillary services and in their ability to respond to changing market conditions in real time at sub-hourly granularity
ndash The MISO market currently operates markets for spinning reserves and regulation
ndash FERC Order 841 also requires ISOs to redesign markets to accommodate energy storage
bull Long-term market developments are uncertain and fundamental evaluation of sub-hourly ancillary services markets is challenging but the 2021 IRP has performed an analysis incorporating
ndash 5-minute granularity for energy and ancillary services based on historical data observations and future energy market scenario projections
ndash Operational parameters for various storage and gas peaking options
ndash Incremental value above and beyond what is picked up in the Aurora-based hourly energy dispatch is assessed and summarized on a portfolio level
SUB-HOURLY ENERGY AND ANCILLARY SERVICES EVALUATION
35
RELIABILITY
NIPSCO | NIPSCOcom |
RANGE OF ADDITIONAL VALUE OPPORTUNITY (NPVRR COST REDUCTION) BY PORTFOLIO
36
-
100
200
300
400
500
600
700
800
900Range
AERRefEWDSQE
Replacement Theme
Thermal PPAssolar and storage
Non-serv ice territory gas
peaking (no early storage)
Natural gas dominant (CC)
No new thermal resources solar
dominant w storage
Thermal PPAs plus storage and
solar
Local gas peaker plus solar and
storage
Solar dominant w storage plus
retire Sugar Creek
All renewables and storage plus retire Sugar Creek
(Portfolio 7)
New H2-enabled peaker plus solar and storage plus SC conv ersion to H2 (Portfolio 7H)
Carbon Emissions Higher Higher Higher Mid Mid Mid Low Low Low
Dispatchability Current Planning Reserv e Margin
Winter amp SummerReserv eMargin
Enhanced Reserve Margin (Local w Higher
Energy Duration)
Current Planning Reserv e Margin
Winter amp SummerReserv eMargin
Enhanced Reserve Margin (Local w Higher
Energy Duration)
Current Planning Reserv e Margin
Winter amp SummerReserv eMargin
Enhanced Reserve Margin (Local w Higher
Energy Duration)
A B C D E F G H I
Observations
bull Additional value is uncertain and dependent on market rules evolution MISO generation mix changes and market participant behavior
bull Portfolios with the largest amounts of storage (E and H) have the greatest potential to lower NPVRR by capturing flexibility value that may manifest in the sub-hourly energy and ancillary services markets
bull A wide range of value is possible with higher prices and price spreads in the AER scenario driving higher estimates
bull Results are incorporated into the final replacement analysis scorecard
Impact on Net Present Value of Revenue Requirement Value(2021-2050 $M)
RELIABILITY
NIPSCO | NIPSCOcom |
RELIABILITY ASSESSMENT GUIDING PRINCIPLES
37
The resources modeled are based on the portfolios constructed for the Replacement Analysis
Analysis incorporates planned transmission projectsTransmission
Upgrades
ResourcesModeled Goal
bull Understand potential reliability implications of potential resource additions to the NIPSCO portfolio
bull Understand the range of potential mitigations required associated with different replacement portfolio strategies The analysis is conducted at a planning level and
therefore further evaluation and granular studies will be required in the future
Individual resources from the 9 replacement portfolios are assessed based on the established reliability criteria The score of the individual resources drive the portfolio score
Evaluation
Resources are evaluated in 2030 after the Michigan City Unit 12 retirement
Time Period
RELIABILITY
NIPSCO | NIPSCOcom |
Stakeholders offered several comments and questions during the Technical Webinar on 1012 TECHNICAL WEBINAR STAKEHOLDER FEEDBACK
38
Stakeholder Feedback Summary NIPSCO Response
Indiana Office of Utility Consumer Counselor (OUCC)
bull Consider evaluating ldquoenergy inflows and outflowsrdquo by hour rather than constraining NIPSCOrsquos system to be islanded
bull This has been evaluated as part of the core IRP economic modeling and analysis including stochastic analysis
bull Under normal operating conditions NIPSCO is constantly selling and buying energy to and from the market so this exposure is economic and less about physical transmission limitations
bull The analysis concluded that over the long-term portfolios with more dispatchable gas or storage are less susceptible to market risk than those dominated by renewables
bull The reliability assessment has focused separately on energy adequacy risks under emergency conditions
Citizens Action Coalition of Indiana (CAC)
bull Consider portfolio evaluation under more representative emergency conditions rather than full islanded conditions This might include simulation of severe weather events (which may be getting more frequent due to climate change) and associated resource availability including renewables and other resources that may be impacted by forced outage or fuel supply unavailability
bull NIPSCOrsquos assessment was intended to evaluate a ldquoworst caserdquo week and not imply islanded operations for the year
bull We have not simulated weather load or forced outage events within the reliability assessment but there may be an opportunity to tie elements of the stochastic analysis that was performed to additional reliability metrics in the future Of particular focus are those that examine tail risk as measured by CVAR in the economic analysis
bull There is an industry trend towards greater focus on generation and transmission resiliency studies that aim to better quantify extreme event risk and we will consider analysis enhancements for future IRPs and further reliability assessment
Note NIPSCO has received other comments from stakeholders and is in the process of reviewing We will strive to incorporate feedback received into the final report
NIPSCO | NIPSCOcom |
RELIABILITY ASSESSMENT AND RANKING
39
Review amp Update Reliability Metrics
Assess NIPSCOrsquos Reliability Needs
Apply a Series of Reliability Filters to
IRP Portfolios
Scoring Criteria
Ranking Portfolios
bull Power Rampingbull Frequency Responsebull Short Circuit Strengthbull Flickerbull Black Start
Preferred Portfolio
Metric 3
Metric 2
Metric 1
RELIABILITY
NIPSCO | NIPSCOcom |
RELIABILITY CRITERIA
40
Criteria Description Rationale
1 BlackstartResource has the abil ity to be started without support from the wider system or is designed to remain energized without connection to the remainder of the system with the ability to energize a bus supply real and reactive power frequency and voltage control
In the event of a black out condition NIPSCO must have a blackstart plan to restore its local electric system The plan can either rely on MISO to energize a cranking path or on internal resources within the NIPSCO service territory
2 Energy DurationResources are able to meet the energy and capacity duration requirements Portfolio resources are able to supply the energy demand of customers during MISOrsquos emergency max gen events and also to supply the energy needs of critical loads during islanded operation events
NIPSCO must have long duration resources to serve the needs of its customers during emergency and islanded operation events
3Dispatchability and
Automatic Generation Control
The unit wil l respond to directives from system operators regarding its status output and timing The unit has the abil ity to be placed on Automatic Generation Control (AGC) allowing its output to be ramped up or down automatically to respond immediately to changes on the system
MISO provides dispatch signals under normal conditions but NIPSCO requires AGC attributes under emergency restoration procedures or other operational considerations
4Operational Flexibility
and Frequency Support
Ability to provide inertial energy reservoir or a sink to stabil ize the system The resource can adjust its output to provide frequency support or stabil ization in response to frequency deviations with a droop of 5 or better
MISO provides market construct under normal conditions but preferable that NIPSCO possess the abil ity to maintain operation during under-frequency conditions in emergencies
5 VAR Support
The resource can be used to deliver VARs out onto the system or absorb excess VARs and so can be used to control system voltage under steady-state and dynamictransient conditions The resource can provide dynamic reactive capability (VARs) even when not producing energy The resource must have Automatic voltage regulation (AVR) capability The resource must have the capability ranging from 085 lagging to 095 leading power factor
NIPSCO must retain resources electrically close to load centers to provide this attribute in accordance with NERC and IEEE Standards
6 Geographic Location Relative to Load
The resource will be located in NIPSCOrsquos footprint (electric Transmission Operator Area) in Northern Indiana near existing NIPSCO 138kV pr 345kV facil ities and is not restricted by fuel infrastructure The resource can be interconnected at 138kV or 345kV Preferred locations are ones that have multiple power evacuationdeliverabil ity paths and are close to major load centers
MISO requires location capacity resources and runs an LMP market to provide locational energy signals under emergency restoration procedures a blackstart plan reliant on external resources would create a significant risk Location provides economic value in the form of reduced losses congestion curtailment risk and address local capacity requirements Additionally from a reliability perspective resources that are interconnected to buses with multiple power evacuation paths and those close to load centers are more resil ient to transmission system outages and provide better assistance in the blackstart restoration process
7 Predictability and Firmness of Supply Ability to predictforecast the output of resources and to counteract forecast errors
Energy is scheduled with MISO in the day-ahead hourly market and in the real-time 5-minute market Deviations from these schedules have financial consequences and thus the abil ity to accurately forecast the output of a resource up to 38 hours ahead of time for the day-ahead market and 30 minutes for the real time market is advantageous
8 Short Circuit Strength Requirement
Ensure the strength of the system to enable the stable integration of all inverter-based resources (IBRs) within a portfolio
The retirement of synchronous generators within NIPSCO footprint and also within MISO and replacements with increasing levels of inverter-based resources will lower the short circuit strength of the system Resources than can operate at lower levels of SCR and those that provide higher short circuit current provide a better future proofing without the need for expensive mitigation measures
RELIABILITY
NIPSCO | NIPSCOcom |
RELIABILITY METRICS
41
Criteria Potential Measurement Approaches Considered
Included in Minimum
Interconnection Requirements
Quanta Analysis to Develop Metric
1 Blackstart bull MWs with black start capability NO bull Blackstart Analysis
2 Energy Duration bull Percentage of NIPSCOrsquos critical load (MW and Time) that can be supplied during emergencies NO bull Energy Adequacy Analysis
3 Dispatchability and Automatic Generation Control
bull MWs on AGCbull Up Range Down Rangebull Ability for Fast Regulationbull Duration of Up Down Regulation
NO (except being on SCADA for monitoring and control)
bull Increase of Regulation Requirements due to IBRs in each Portfolio
bull 10-min Ramp Capability of Portfolio
4 Operational Flexibility and Frequency Support
bull Inertial Response GapSurplusbull Primary Frequency Response GapSurplus NO bull Inertial Repose
bull Primary Response
5 VAR Support bull Continuous VAR output range that can be delivered to load centers YES bull Dynamic VAR deliverability
6 Geographic Location Relative to Load
bull MWs or within NIPSCO footprintbull Firmness of fuel supplies bull MWs with POIs with multiple (2 or higher) secure power evacuation paths
NO bull Topology analysis
7 Predictability and Firmness of Supply
bull Ability to mitigate Forecast Error of intermittent resources using fast ramping capability NO bull Power Ramping and
Forecast Errors
8 Short Circuit Strength Requirement
bull MWs of IBRs potentially impacted by lack of short circuit strengthbull Need for synchronous condensers andor grid forming inverters to ensure
stable system integration
NO 1547 and P2800 do not address
bull Short Circuit Strength Analysis
RELIABILITY
NIPSCO | NIPSCOcom |
PORTFOLIO RELIABILITY METRICSYear 2030 Metric A B C D E F G H I
1 Blackstart Qualitative Assessment of Risk of not Starting 0 0 1 0 1 1 0 1 1
2 Energy Adequacy Energy Not Served when Islanded (Worst 1-week) 76 78 32 75 78 56 74 73 58
28 16 55 27 44 45 26 47 47
58 50 42 63 50 45 65 51 51
Increased Freq Regulation Requirements (MW) 54 41 34 58 41 37 59 46 46
1-min Ramp Capability (MW) 331 196 261 331 666 382 326 761 599
10-min Ramp Capability (MW) 574 439 764 574 909 784 548 983 944
Inertia MVA-s 3218 3218 6729 3218 3218 5116 2931 2931 4397
Inertial Gap FFR MW 155 283 157 160 0 79 171 0 0
Primary Gap PFR MW 259 388 380 260 0 249 261 0 19
5 VAR Support Dynamic VAR to load Center Capability (MVAr) 658 471 457 704 630 555 725 731 719
6 Location Average Number of Evacuation Paths 5 3 NA 5 5 5 5 6 5
7 Predictability and Firmness
Ramping Capability to Mitigate Forecast Errors (+Excess-Deficit) MW
-228 134 -262 -257 161 154 -266 245 238
8 Short Circuit Strength Required Additional Synch Condensers MVA 580 388 0 763 341 0 802 488 257
Dispatchable (CAP unavoidable VER Penetration)
4 Operational Flexibility and Frequency Support
3Dispatchability and Automatic Generation Control
CAP the capacity value of the portfolio including the existing and planned resourcesSolar capacity credit 50 of installed capacity Wind capacity credit 163 (based on MISO published data on system wide capacity credits)
Preliminary
RELIABILITY
42
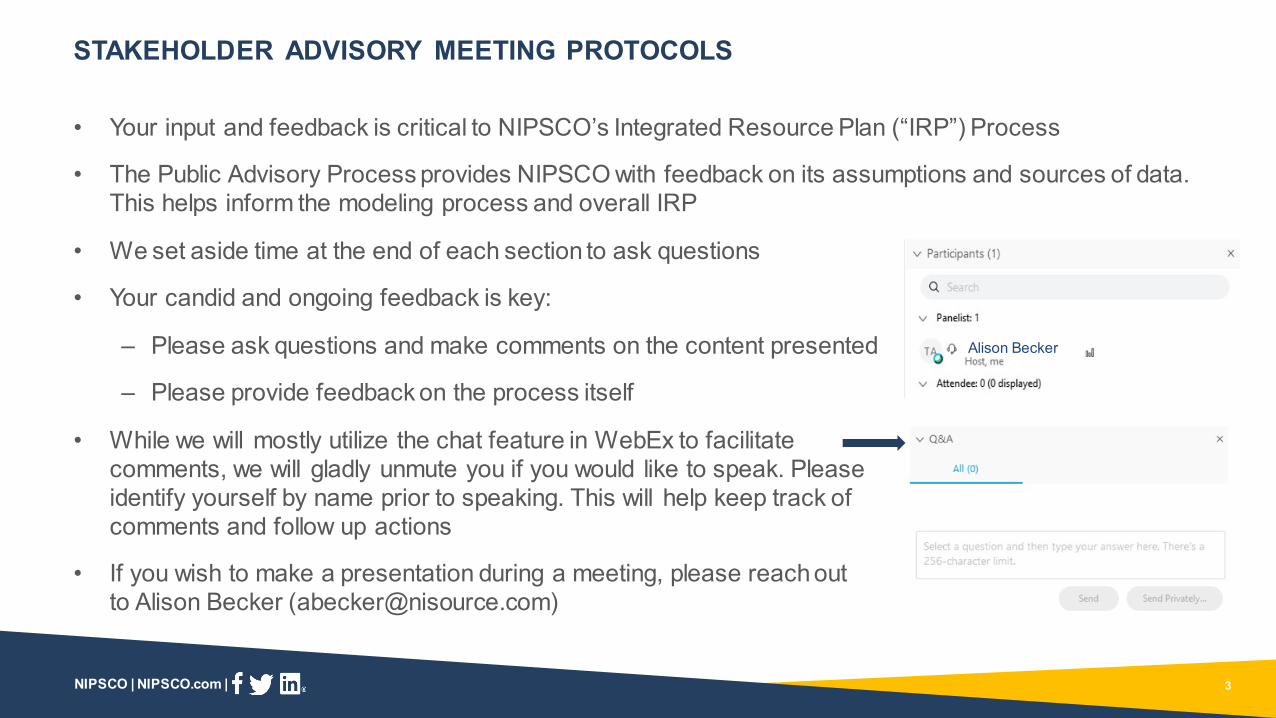
NIPSCO | NIPSCOcom |
AGENDA
4
TimeCentral Time
Topic Speaker
900-905AM Webinar Introduction Safety Moment Meeting Protocols Agenda Alison Becker Manager Regulatory Policy NIPSCO
905-915AM Welcome Mike Hooper President amp COO NIPSCO
915-930AM NIPSCOrsquos Public Advisory Process andResource Planning Activity Review Fred Gomos Director Strategy amp Risk Integration NiSource
930-1000AM Existing Fleet Analysis Review Pat Augustine Vice President CRA
1000-1015AM Break
1015-1100AM Replacement Analysis ReviewPat Augustine Vice President CRAHisham Othman VP Transmission and Regulatory Consulting Quanta Technology LLC
1100-1130AM Responses to Stakeholder Feedback Pat Augustine Vice President CRA
1130AM-1200PM Lunch
1200-100PM Preferred Resource Plan and Action Plan Fred Gomos Director Strategy amp Risk Integration NiSourcePat Augustine Vice President CRA
100-155PM Stakeholder Presentations TBD155-200PM Wrap Up amp Next Steps Erin Whitehead Vice President Regulatory amp Major Accounts NIPSCO
NIPSCO | NIPSCOcom | NIPSCO | NIPSCOcom |
Mike Hooper President amp COO NIPSCO
WELCOME
5
NIPSCO | NIPSCOcom | 6
PILLARS OF OUR ONGOING GENERATION TRANSITION PLANThis plan creates a vision for the future that is better for our customers and itrsquos consistent with our goal to transition
to the best cost cleanest electric supply mix available while maintaining reliability diversity and flexibility for the technology and market changes on the horizon
Reliable and sustainable
Flexibility for the future
Best plan for customers and the company
Local and statewide economic benefits
NIPSCO | NIPSCOcom | NIPSCO | NIPSCOcom |
Fred Gomos Director Strategy amp Risk Integration NiSource
NIPSCOrsquoS PUBLIC ADVISORY PROCESS AND RESOURCE PLANNING ACTIVITY REVIEW
7
NIPSCO | NIPSCOcom |
bull At least every three years NIPSCO outlines its long-term plan to supply electricity to customers over the next 20 years
bull This study ndash known as an IRP ndash is required of all electric utilities in Indiana
bull The IRP process includes extensive analysis of a range of generation scenarios with criteria such as reliable affordable compliant diverse and flexible
HOW DOES NIPSCO PLAN FOR THE FUTURE
8
Reliable
Compliant
FlexibleDiverse
Affordable
Requires Careful Planning and Consideration forbull NIPSCOrsquos employeesbull Environmental regulationsbull Changes in the local economy (property tax
supplier spending employee base)
NIPSCO | NIPSCOcom |
2021 STAKEHOLDER ADVISORY MEETING ROADMAP
9
Meeting Meeting 1 (March) Meeting 2 (May) Meeting 3 (July) Meeting 4 (September) Technical Webinar Meeting 5 (October)
Date 3192021 5202021 7132021 9212021 10122021 10212021
Location Virtual Virtual Virtual Virtual Virtual Virtual
Key Questions
bull How has NIPSCO progressed in the 2018 Short Term Action Plan
bull What has changed since the 2018 IRP
bull How are energy and demand expected change over time
bull What is the high level plan for stakeholder communication and feedback for the 2021 IRP
bull How do regulatory developments and initiatives at the MISO level impact NIPSCOrsquos 2021 IRP planning framework
bull How has environmental policy changed since 2018
bull What scenario themes and stochastics will NIPSCO explore in 2021
bull How are DSM resources considered in the IRP
bull How will NIPSCO evaluate potential DER options
bull What are the preliminary RFPresults
bull What are the preliminary findings from the modeling
bull What are the results of the Reliability Assessment
bull What is NIPSCOrsquos preferred plan
bull What is the short-term action plan
Content bull 2018 Short Term Action Plan Update (Retirements Replacement projects)
bull Resource Planning and 2021 Continuous Improvements
bull Update on Key InputsAssumptions (commodity prices demand forecast)
bull Scenario Themes ndash Introduction
bull 2021 Public Advisory Process
bull MISO Regulatory Developments and Initiatives
bull 2021 Environmental Policy Update
bull Scenariosand Stochastic Analysis
bull DSM Modeling and Methodology
bull DER Inputs
bull Preliminary RFP Results
bull Existing Fleet Review Modeling Results Scorecard
bull Replacement Modeling Results Scorecard
bull Reliability Assessment bull Preferred replacement path and logic relative to alternatives
bull 2021 NIPSCO Short Term Action Plan
Meeting Goals
bull Communicate what has changed since the 2018 IRP
bull Communicate NIPSCOrsquos focus on reliability
bull Communicate updates to key inputsassumptions
bull Communicate the 2021 public advisory process timing and input sought from stakeholders
bull Common understanding of MISO regulatory updates
bull Communicate environmental policy considerations
bull Communicate scenario themes and stochastic analysis approach along with major input details and assumptions
bull Common understanding of DSM modeling methodology
bull Communicate preliminary RFP results
bull Explain next steps for portfolio modeling
bull Communicate the Existing Fleet Portfolios and the Replacement Portfolios
bull Develop a shared understanding of economic modeling outcomes and preliminary results to facil itate stakeholder feedback
bull Common understanding of Reliability Assessment methodology
bull Communicate Reliability Assessment results
bull Respond to key stakeholder comments and requests
bull Communicate NIPSCOrsquos preferred resource plan and short-term action plan
bull Obtain feedback from stakeholders on preferred plan
NIPSCO | NIPSCOcom |
RESOURCE PLANNING APPROACH
10
Scorecard(Example)
Other Analysis (eg Reliability Assessment
Employee Impacts etc)
Aurora ndash NIPSCO Portfolio Market ModelProduction Cost Dispatch (hourly
chronological)
PERFORMDetailed cost of
service and revenue requirements
4
RFP Information
DSM Study
New resource option parameters
Portfolio Optimization
Retirement options and replacement themes (informed
by scenarios)NIPSCO
Portfolios
3
Market Modeling Tools (NGF GPCM Aurora)
Scenario Narrative Development2
Activity Timing
Identify key planning questions and themes Mar
Develop market perspectives (planning reference case and scenarios stochastic inputs)
Mar-May
Develop integrated resource strategies for NIPSCO (portfolios)
Jun-Jul
Portfolio modeling Detailed scenario dispatch Stochastic simulations
Aug-Sep
Evaluate trade-offs and produce recommendation Sep-Oct
1
2
3
4
5 Stochastic Modeling Tools
Integrated gas coal carbon forecasts and MISO market outlook prices
NIPSCO | NIPSCOcom |
bull The ongoing fleet transition in MISO makes it critical for NIPSCOrsquos IRP to capture several changing dynamics to allow NIPSCO to remain flexible
bull Over the course of the 2021 IRP NIPSCO has discussed these topics
IDENTIFY KEY PLANNING QUESTIONS AND THEMES1KEY PLANNING QUESTIONS AND THEMES
Topic
Retirement Timing for Existing Coal and Gas Units
Assessing the retirement timing of the remaining generating fleet after the Schahfer coal units retire which includes Michigan City Unit 12 Schahfer Units 16A and 16B and Sugar Creek
Flexibility amp Adaptability of The Portfolio
Incorporating evolving capacity credit expectations for resources and an imminent seasonal resource adequacy requirement
Carbon Emissions amp RegulationIncentives
Assessing diverse portfolio options in the context of increased policy conversations that push for 100 decarbonization of the power sector by the middle of the next decade
Long-Term Planning With Intermittent Resources
Understanding system reliability implications of a portfolio that will have significant intermittent resources in light of the MISO market evolution and NIPSCOrsquos operational responsibilities
11
NIPSCO | NIPSCOcom |
LONG TERM SYSTEM PLANNING WITH INTERMITTENT RESOURCES
12
Ensure Consistency with MISO Rules Evolution
Expand Uncertainty Analysis
Incorporate New Metrics
Seasonal resource adequacy Future effective load carrying capability
(ELCC) accounting
Incorporation of renewable output uncertainty
Broadening risk analysis to incorporate granular views of tail risk
Incorporating new scorecard metrics informed by stochastic analysis and capabilities of portfolio resources
Both summer and winter reserve margins tracked and implemented as constraints
ELCC accounting by season with a range of expected solar declines over time
Stochastic analysis evaluated the relationship between hourly renewable output and power prices to estimate the impact at different levels of penetration and across the commodity price distribution
Examined tail outcomes to understand the conditions and portfolios that expose customers to low probability high consequence (price) events
Performed ancillary services analysis (regulation spinning reserves) with sub-hourly granularity and conducted qualitative reliability assessment with several new metrics
2021 IRP Approach To Evaluate Action Implemented In IRP Modeling
1KEY PLANNING QUESTIONS AND THEMES
NIPSCO | NIPSCOcom |
As in the 2018 IRP multiple objectives and indicators are summarized across portfolios in an integrated scorecard framework against which to test portfolios and evaluate the major planning questions
IDENTIFY KEY PLANNING QUESTIONS AND THEMES1
bull The scorecard is a means of reporting key metrics for different portfolio options to transparently review tradeoffs and relative performance it does not produce a single score or ranking of portfolios but serves as a tool to facilitate decision-making
bull NIPSCO has identified 5 major planning objectives and multiple metrics within 9 key indicator categories
bull The Existing Fleet Analysis scorecard focuses on scenario costs carbon emissions and impact on NIPSCO employees and the local economy
bull The Replacement Analysis scorecard incorporates broader perspectives on risk (stochastic analysis) and reliability than the Existing Fleet Analysis scorecard
Objective Indicator
Affordability Cost to Customer
Rate Stability
Cost Certainty
Cost Risk
Lower Cost Opportunity
Environmental Sustainability
Carbon Emissions
Reliable Flexible and Resilient Supply
Reliability
Resource Optionality
Positive Social amp Economic Impacts
Employees
Local Economy
KEY PLANNING QUESTIONS AND THEMES
13
NIPSCO | NIPSCOcom |
bull NIPSCO developed four integrated market scenarios or future ldquostates of the worldrdquo
ndash Scenarios incorporate a range of future outcomes for load commodity prices technology and policy
ndash The 2021 IRP includes two distinct policy frameworks for achieving net-zero emission trajectories for the broader power market
bull Stochastic inputs have been developed for key components of quantifiable stochastic risk
ndash For the 2021 IRP the stochastic analysis has been expanded to include hourly renewable availability in addition to commodity price volatility
DEVELOP MARKET PERSPECTIVES (REF CASE SCENARIOS STOCHASTIC INPUTS)
14
2
Reference Casebull The MISO market continues to evolve based on current expectations for load growth commodity
price trajectories technology development and policy change (some carbon regulation and MISO rules evolution)
Status Quo Extended (ldquoSQErdquo)bull Binding federal limits on carbon emissions are not implemented natural gas prices remain low and
result in new gas additions remaining competitive versus renewables as coal capacity more gradually fades from the MISO market
Aggressive Environmental Regulation (ldquoAERrdquo)bull Carbon emissions from the power sector are regulated through a mix of incentives and a federal
taxcap-and-trade program that results in a significant CO2 price and net-zero emission targets for the power sector by 2040 restrictions on natural gas production increase gas prices
Economy-Wide Decarbonization (ldquoEWDrdquo)bull Technology development and federal incentives push towards a decarbonized economy including
through a power sector Clean Energy Standard (supporting renewables and other non-emitting technologies) and large-scale electrification in other sectors (EVs heating processes etc)
0
20
40
60
80
100
1 4 7 1013161922C
apac
ity F
acto
r
Hour of Day
Solar Output Power Prices
-
20
40
60
80
100
120
nom
inal
$M
Wh
MARKET PERSPECTIVES AND MODELING OF UNCERTAINTY
NIPSCO | NIPSCOcom |
NIPSCO is now monitoring summer and winter reserve margins plus the annual energy balanceKey Points
bull The capacity credit for some of the 2023 projects is not reflected until 2024 due to in-service date timing
bull Capacity credit for some storage resources is not reflected until 2025 (after a full year of operations) due to plant configuration
bull While winter loads are lower the lower capacity credit in the winter for solar resources results in a similar reserve margin
bull On an annual basis the net energy position for the portfolio is long driven by the energy value and economic dispatch advantage of wind and solar resources However the tight capacity position may create hourly gaps particularly in the winter mornings and evenings when solar resources ramp down (next slide)
1000
0
2000
3000
202420232021 2022 2025 2026 2027 2028
Summer Capacity
20282021 2022 20262023 2024 2025 2027
Winter Capacity
UCAP MW
Capacity PurchasesCapacity Gap
WindOtherFiled DSM Programs
Storage
SolarCoalNatural GasPeak Load (or Net Energy)
Planning Reserve Margin
Annual EnergyGWh
Multiple renew able projects coming online in 2023 to address capacity gap
0
2000
4000
6000
8000
10000
12000
14000
16000
2021 2022 2023 2024 2025 2026 2027 2028
STARTING NEAR-TERM CAPACITY AND ENERGY BALANCE3CURRENT PORTFOLIO POSITION
15
NIPSCO | NIPSCOcom |
bull There are hours of the day where renewable resources are not available (ex overnight for solar) Furthermore solar resources may experience steep production declines in the evening hours
bull Currently Sugar Creek (natural gas CC) Schahfer 16AB (natural gas peaker) and Michigan City 12 (coal) are part of the portfolio and when economic NIPSCO can purchase from the MISO market
bull As 16AB and MC12 retire the portfolio will require new resources to be available to mitigate against specific hourly energy exposure
STARTING ENERGY BALANCE VARIES ON AN HOURLY BASIS
Average Summer Day after Schahfer coal ret wo MC12 and 16AB Average Winter Day after Schahfer coal ret wo MC12 and 16AB
Steep ramping needs
0
500
1000
1500
2000
2500
1 2 3 4 5 6 7 8 9 10 11 12 13 14 15 16 17 18 19 20 21 22 23 24
MW
1 2 3 4 5 6 7 8 9 10 11 12 13 14 15 16 17 18 19 20 21 22 23 24
Sugar Creek
Hydro
Wind
FiT DER
Solar
Storage
Gross Load
Load Net of DSM
Net Requirement
3CURRENT PORTFOLIO POSITION
16
NIPSCO | NIPSCOcom | NIPSCO | NIPSCOcom |
Pat Augustine Vice President CRA
EXISTING FLEET ANALYSIS REVIEW
17
NIPSCO | NIPSCOcom |
bull The IRP analysis is performed in two phases the first phase examines current and future resource additions to evaluate timing of retirement for existing units
bull Insight and conclusions from existing fleet analysis inform replacement concepts to evaluate Once a preferred existing portfolio is established future replacements are evaluated across a range of objectives
RECAP ANALYTICAL FRAMEWORK
18
Existing Fleet Analysis Replacement Analysis
Core Questions
How does the cost to keep a unit compare to the cost to replace with economically optimized resourcesIs the portfolio flexible and adaptable to address changes in market rules and energy policy
What are the replacement resource portfolio options How do different replacement themes compare with regard to cost risk environmental sustainability and reliability
Actual projects available to NIPSCO Actual projects available to NIPSCO
Key Decision What units should retire and when What new resources should be added to meet customersrsquo needs
All-Source RFP
EXISTING FLEET ANALYSIS
NIPSCO | NIPSCOcom |
RECAP CONSTRUCTED RETIREMENT PORTFOLIOS TO COVER THE RANGE OF TIMING POSSIBILITIES FOR REMAINING FOSSIL UNITS
Key Points
bull Portfolio construction is necessarily broad to fully address tradeoffs
bull Portfolios 1-4 focus on the timing of the Michigan City retirement
bull Portfolios 5 and 6 focus on the replacement timing for Schahfer 16AB Units are not retained beyond 2028 in any portfolio given current condition and age
bull Portfolio 7 and 7H are assessing implications of carbon free portfolio pathways
Portfolio Transition
Target
15 Coal through 2032
15 Coal through 2028
15 Coal through 2026
15 Coal through 2024
15 Coal through 2028
15 Coal through 2026
15 Coal through 2028
Fossil Free by 2032
15 Coal through 2028
Option for Fossil Free by 2032
MC 12 Through Book life
2018 IRP Preferred Plan
Early Retirement of MC 12
Early Retirement of MC 12
2018 IRP Preferred Plan + 2025 16AB
retirement
Early Retirement of MC 12
+ 2025 16AB retirement
2018 IRP Preferred Plan + 2025 16AB ret +
2032 SC ret
2018 IRP Preferred Plan + 2025 16AB ret +
2032 SC conv
Retain beyond
2032Sugar Creek Sugar Creek Sugar Creek Sugar Creek Sugar Creek Sugar Creek None
Sugar Creek conv erts to H2
(2032)
Michigan City 12
Retire Retire Retire Retire Retire Retire Retire
2032 2028 2026 2024 2028 2026 2028
Schahfer 16AB
Retire Retire
2028 2025
Sugar Creek Retain
Retire Convert to H2
2032 2032
1 2 3 4 5 6 7 7H
Short term Longer term
EXISTING FLEET ANALYSIS
Not a viable pathway due to implementation timing19
NIPSCO | NIPSCOcom |
bull Driven by a binding winter reserve margin and the energy resources already obtained from the 2018 IRP Preferred Plan the indicative ordering of model selection preference favors resources that offer greater levels of firm capacity
bull This is not NIPSCOrsquos final replacement resource selection or preferred plan but an optimized set of additions to facilitate evaluation of the various existing fleet strategies
RECAP EXISTING FLEET ANALYSIS SELECTIONS ARE DRIVEN BY ECONOMIC OPTIMIZATION
Resource options include RFP tranches DSM bundles DER options and an opportunity to uprate capacity at Sugar Creek
Portfolio 1
MC12 Through Book Life
Technology ICAP MW
Year
NIPSCO DER 10 2026Sugar Creek Uprate 53 2027DSMThermal Contract 50 2024Thermal Contract 100 2026Gas Peaker 300 2032Storage 135 2027Total 693
Portfolios 2 | 3 | 4
2018 IRP (MC 2028) | MC 2026 | MC 2028
TechnologyICAP MW
YearP2 P3
NIPSCO DER 10 2026 2026Sugar Creek Uprate 53 2027 2027DSMThermal Contract 50 2024 2024Thermal Contract 100 2026 2026Gas Peaker 300 2028 2026Storage 135 2027 2027Solar 100
200^2026 2026
Total 793 893^
Portfolio 7H
Fossil Free Option by 2032 w SC Conversion (incl capital costs)
Technology ICAP MW
Year
NIPSCO DER 10 2026Sugar Creek Uprate 53 2027DSMStorage 235 2025Storage 135 2027Solar 250 2026Wind 200 2026Hydrogen-Enabled Gas Peaker 193 2025SC Electrolyzer Pilot 20 2026Total 1131
DSM includes the cumulative impact of both Residential and Commercial programs by 2027 with Commercial being most cost effective DSM is reported on a summer peak basis Note that the winter impact is ~46MW
CO
ST-E
FEC
TIVE
NESS
Less
More
68 6868
2027 2027 20272027
Portfolios 5 | 6Portfolio 2 w 16AB 2025 | Portfolio 3 w 16AB 2025
Technology ICAP MW
YearP5 P6
NIPSCO DER 10 2026 2026Sugar Creek Uprate 53 2027 2027DSM 68 2027 2027Thermal Contract 50 2024 2024Thermal Contract 100 2026 2026Gas Peaker 300 2028 2026Storage 135 2025 2025Solar 100 2026 2026Wind 200 NA 2026Total 993
Portfolio 7
Fossil Free By 2032
Technology ICAP MW
Year
NIPSCO DER 10 2026DSM 68 2027Storage 235 2025Storage 100 2026Storage 235 2027Solar 250 2026Wind 200 2026Total 1020
EXISTING FLEET ANALYSIS
Notes Portfolios were optimized against winter reserve margin constraints (94) followed by summer to ensure compliance with bothA maximum net energy sales limit of 30 during the fleet transition (2023-2026) falling to 25 in 2030+ was also enforcedWind outside LRZ6 was not included in optimization analysis given lack of capacity deliverabil ity to LRZ6 and significant congestion risk
P420262027
2024202620242025
2026
2027
^ P23 have 100 MW of solar P4 has 200 MW
20
NIPSCO | NIPSCOcom |
Portfolio Transition Target
15 Coal through 2032
15 Coal through 2028
15 Coal through 2026
15 Coal through 2024
15 Coal through 2028
15 Coal through 2026
15 Coal through 2028
Fossil Free by 2032
15 Coal through 2028
Option for Fossil Free by 2032
Retire MC 12 (2032)Schfr 16AB (2028)
MC 12 (2028)Schfr 16AB (2028)
MC 12 (2026)Schfr 16AB (2028)
MC 12 (2024)Schfr 16AB (2028)
MC 12 (2028)Schfr 16 AB (2025)
MC 12 (2026)Schfr 16AB (2025)
MC 12 (2028)Schfr 16AB (2025)
SC (2032)
MC 12 (2028)Schfr 16AB (2025)
SC to H2 (2032)
Retain beyond 2032 Sugar Creek Sugar Creek Sugar Creek Sugar Creek Sugar Creek Sugar Creek None Sugar Creek converts to H2 (2032)
Rank (1=Least Cost) 5 3 1 2 6 4 8 7
Delta from LeastCost
$35M03
$16M02 - $10M
01$47M05
$24M02
$417M41
$357M35
RECAP EXISTING FLEET ANALYSIS - DETERMINISTIC COST TO CUSTOMERSRESULTS
Observations
bull The difference in NPVRR from the highest cost to lowest cost portfolio is approximately $430 million
bull Consistent with NIPSCOrsquos prior IRP findings early retirement of coal is generally cost effective for customers although the difference in cost across several portfolios is small since much of the remaining portfolio is fixed and small changes in retirement dates are now being assessed
bull Retaining Units 16AB until 2028 may be cost effective given the portfoliorsquos capacity needs However this is contingent on the operational condition of these older vintage units and the cost impacts of earlier retirement are less than 1 in NPVRR
Net Present Value of Revenue Requirement(2021-2050 $M)
1
$10149 $10130 $10114 $10125 $10161 $10138$10531 $10471
2 3 5 6 7 7H
EXISTING FLEET ANALYSIS
4
Not a viable pathway due to implementation timing
21
NIPSCO | NIPSCOcom |
RECAP EXISTING FLEET ANALYSIS - SCENARIO RESULTS
Econ-Wide Decarbonization
Portfolio Transition Target
15 Coal through 2032
15 Coal through 2028
15 Coal through 2026
15 Coal through 2024
15 Coal through 2028
15 Coal through 2026
15 Coal through 2028
Fossil Free by 2032
15 Coal through 2028 Option forFossil Free by
2032
Retire MC 12 (2032)Schfr 16AB (2028)
MC 12 (2028)Schfr 16AB (2028)
MC 12 (2026)Schfr 16AB (2028)
MC 12 (2024)Schfr 16AB (2028)
MC 12 (2028)Schfr 16 AB
(2025)
MC 12 (2026)Schfr 16AB (2025)
MC 12 (2028)Schfr 16AB (2025)
SC (2032)
MC 12 (2028)Schfr 16AB (2025)
SC to H2 (2032)
Retain beyond 2032 Sugar Creek Sugar Creek Sugar Creek Sugar Creek Sugar Creek Sugar Creek None
Sugar Creek converts to H2
(2032)Delta from Lowest $35 $16 - $10 $47 $24 $417 $357Cost to Customer 03 02 - 01 05 02 41 35
Delta from Lowest $36 $18 $2 - $49 $108 $720 $492Cost to Customer 04 02 00 - 05 12 78 54
Delta from Lowest $336 $269 $259 $277 $292 $157 - $303Cost to Customer 31 25 24 25 27 14 - 28
Delta from Lowest $477 $454 $449 $459 $478 $276 - $29Cost to Customer 41 39 39 40 42 24 - 03
Reference Case
Status Quo Extended
Aggressive Env Reg
8500
9000
9500
10000
10500
11000
11500
12000
12500
13000
NP
VR
R($
mill
ions
)
1 2 3 5 6 7 7H
Observations
bull MC12 retirement in 2026 has a small cost benefit (lt$20M) relative to retirement in 2028 across all scenarios
bull MC 12 retirement in 2032 is always higher cost than earlier retirement with the largest difference in the AER scenario (high carbon price)
bull Portfolio 2 is slightly lower cost than Portfolio 5 although additional renewable additions with early 16AB retirement (Portfolio 6) lower costs under high carbon regulation scenarios
bull Portfolios 7 and 7H have the smallest range as their future renewable hydrogen and storage investments hedge against high-cost power market outcomes
EXISTING FLEET ANALYSIS
Note that a $050kg H2 subsidy is assumed in AER and EWD
4
Reference Case
Status Quo Extended (SQE)
Aggressive Environmental Regulation (AER)
Economy-Wide Decarbonization (EWD)
Not a viable pathway due to implementation timing 22
NIPSCO | NIPSCOcom |
RECAP EXISTING FLEET ANALYSIS SCORECARD
23
Objective Indicator Description and Metrics
Affordability Cost to Customer
bull Impact to customer billsbull Metric 30-year NPV of revenue requirement
(Reference Case scenario deterministic results)
Rate Stability
Cost Certainty
bull Certainty that revenue requirement within the most likely range of outcomes
bull Metric Scenario range NPVRR
Cost Risk bull Risk of unacceptable high-cost outcomesbull Metric Highest scenario NPVRR
Lower Cost Opportunity
bull Potential for lower cost outcomesbull Metric Lowest scenario NPVRR
Environmental Sustainability
Carbon Emissions
bull Carbon intensity of portfoliobull Metric Cumulative carbon emissions (2024-40
short tons of CO2) from the generation portfolio
Reliable Flexible and Resilient Supply
Reliabilitybull To be addressed in Replacement Analysis stage
Resource Optionality
Positive Social amp Economic Impacts
Employeesbull Net impact on NiSource jobsbull Metric Approx number of permanent NiSource jobs
associated with generation
Local Economy
bull Net effect on the local economy (relative to 2018 IRP) from new projects and ongoing property taxes
bull Metric NPV of existing fleet property tax relative to 2018 IRP
Additional risk metrics will be included in the Replacement Analysis when broader set of resource types are evaluated
Key Points
bull Two closely related but distinct scorecards are used for the Existing Fleet Analysis and the Replacement Analysis
bull The Existing Fleet Analysis focuses on scenario costs carbon emissions and impact on NIPSCO employees and the local economy
bull The Replacement Analysis expands the risk assessment to include a stochastic assessment and introduces reliability metrics to assess a broader range of future resource options
EXISTING FLEET ANALYSIS
NIPSCO | NIPSCOcom |
RECAP EXISTING FLEET ANALYSIS SCORECARD
24
1 2 3 4 5 6 7 7H
Not a viable pathway due to implementation timing
Adding replacement projects could have an impact on net jobs
Portfolio Transition Target
15 Coal through 2032
15 Coal through 2028
15 Coal through 2026
15 Coal through 2024
15 Coal through 2028
15 Coal through 2026
15 Coal through 2028
Fossil Free by 2032
15 Coal through 2028
Fossil Free by 2032
Retire MC 12 (2032)Schfr 16AB (2028)
MC 12 (2028)Schfr 16AB (2028)
MC 12 (2026)Schfr 16AB (2028)
MC 12 (2024)Schfr 16AB (2028)
MC 12 (2028)Schfr 16 AB (2025)
MC 12 (2026)Schfr 16AB (2025)
MC 12 (2028)Schfr 16AB (2025)
SC (2032)
MC 12 (2028)Schfr 16AB (2025)
SC to H2 (2032)
Retain beyond 2032 Sugar Creek Sugar Creek Sugar Creek Sugar Creek Sugar Creek Sugar Creek None Sugar Creek converts to H2 (2032)
Cost To Customer30-year NPV of revenue requirement (Ref Case)
$10149 $10130 $10114 $10125 $10161 $10138 $10531 $10471+$35 +$16 - $10 +$47 +$24 +$417 +$35703 02 - 01 05 02 41 35
Cost CertaintyScenario Range (NPVRR)
$2759 $2754 $2766 $2777 $2747 $2487 $1598 $1855+$1161 +$1156 +$1167 +$1179 +$1149 +$889 - +$257726 723 730 738 719 556 - 161
Cost RiskHighest Scenario NPVRR
$11974 $11951 $11947 $11957 $11976 $11773 $11498 $11527+$477 $454 +$449 +$459 +$478 +$276 - +$2941 39 39 40 42 24 - 03
Lower Cost Opportunity
Lowest Scenario NPVRR
$9215 $9197 $9181 $9179 $9229 $9287 $9899 $9671+$36 +$18 +$2 - +$49 +$108 +$720 +$49204 02 00 - 05 12 78 53
Carbon EmissionsM of tons 2024-40 Cum
(Scenario Avg)
433 337 285 230 337 285 214 309+22 +12 +7 +2 +12 +7 - +9
102 57 33 8 57 33 - 44
EmployeesApprox existing gen jobs compared to 2018 IRP
+127 0 -127 -127 -4 -131 -34 -4
Local EconomyNPV of existing fleet property
tax relative to 2018 IRP+$13 $0 -$10 -$23 $0 -$10 -$16 +$13
EXISTING FLEET ANALYSIS
NIPSCO | NIPSCOcom | NIPSCO | NIPSCOcom |
BREAK
25
NIPSCO | NIPSCOcom | NIPSCO | NIPSCOcom |
Pat Augustine Vice President CRAHisham Othman VP Transmission and Regulatory Consulting Quanta Technology LLC
REPLACEMENT ANALYSIS REVIEW
26
NIPSCO | NIPSCOcom |
bull The IRP analysis is performed in two phases the first phase examines current and future resource additions to evaluate timing of retirement for existing units
bull Insight and conclusions from existing fleet analysis inform replacement concepts to evaluate Once a preferred existing portfolio is established future replacements are evaluated across a range of objectives
RECAP ANALYTICAL FRAMEWORK
27
Existing Fleet Analysis Replacement Analysis
Core Questions
How does the cost to keep a unit compare to the cost to replace with economically optimized resourcesIs the portfolio flexible and adaptable to address changes in market rules and energy policy
What are the replacement resource portfolio options How do different replacement themes compare with regard to cost risk environmental sustainability and reliability
Actual projects available to NIPSCO Actual projects available to NIPSCO
Key Decision What units should retire and when What new resources should be added to meet customersrsquo needs
All-Source RFP
REPLACEMENT ANALYSIS
NIPSCO | NIPSCOcom |
RECAP REPLACEMENT ANALYSIS PORTFOLIOS HAVE BEEN DEVELOPED ACROSS NINE CONCEPTSThe concepts are informed by the IRP themes findings from the Existing Fleet Analysis and additional optimization testing
DispatchabilityCurrent Planning Reserve Margin
Winter amp Summer Reserve Margin
Enhanced Reserve Margin (Local w Higher Energy Duration)
Emis
sion
s
Higher CarbonEmissions
Thermal PPAs solar and storage
Non-service territory gas peaking (no early storage) Natural gas dominant (CC)
Mid Carbon Emissions
No new thermal resources solar dominant w storage
Thermal PPAs plus storage and solar
Local gas peaker plus solar and storage
Low Carbon Emissions
Solar dominant w storage plus retire Sugar Creek
All renewables and storage plus retire Sugar Creek (Portfolio 7)
New H2-enabled peaker plus solar and storage plus SC conversion to H2 (Portfolio 7H)
Sugar Creek Retires or converts to H2
Net Zero Concepts
A B C
D E F
G H I
REPLACEMENT ANALYSIS
Sugar Creek is retained through modeling
horizon
bull For the Replacement Analysis Portfolio 3 from the Existing Fleet analysis has been used to assess portfolio selection under the earliest possible retirement of MC12 Note that Portfolio 2 would have similar results with small changes in resource addition timing This approach does not imply that NIPSCO has determined a specific MC12 retirement date
bull Resource combinations are constructed based on RFP projects (tranches) and other opportunities to explore a range of emissions profiles and dispatchability under current and proposed market rules
28
NIPSCO | NIPSCOcom |
bull Several resource additions are common across all themes when allowed RampC DSM programs Thermal PPAs attractive NIPSCO DER SC uprate
bull A range of solar storage gas wind and hydrogen-enabled resources are incorporated across portfolios
RECAP ICAP ADDITIONSndash RFP PROJECTS AND OTHER NEAR-TERM OPPORTUNITIES
29
Dispatchability
Current Planning Reserve Margin
Winter amp Summer Reserve Margin
Enhanced Reserve Margin (Local w Higher Energy Duration)
Emis
sion
s
Higher CarbonEmissions
NIPSCO DER 10MWSC Uprate 53MWThermal PPA 150MWStorage 135MWSolar+Storage 450MWSolar 250MW
NIPSCO DER 10MWSC Uprate 53MWGas Peaker 443MWThermal PPA 150MWSolar 250MW
NIPSCO DER 10MWSC Uprate 53MWGas CC 650MW
Portfolio violates normal net long energy sales constraints enforced in optimization
Mid Carbon Emissions
NIPSCO DER 10MWSC Uprate 53MWStorage 135MWSolar+Storage 450MWSolar 400MW
NIPSCO DER 10MWSC Uprate 53MWThermal PPA 150MWStorage 470MWSolar 250MW
NIPSCO DER 10MWSC Uprate 53MWGas Peaker 300MWThermal PPA 150MWStorage 135MWSolar 100MW
Low Carbon Emissions
NIPSCO DER 10MWStorage 135MWSolar+Storage 450MWSolar 450MW
NIPSCO DER 10MWWind 200MWStorage 570MWSolar 250MW
NIPSCO DER 10MWSC H2 Electrolyzer 20MWSC Uprate 53MWH2 Enabled Peaker 193MWWind 200MWStorage 370MWSolar 250MW
Sugar Creek Retires or converts to H2
Net Zero Concepts
A B C
D E F
G H I
Note ResidentialCommercial DSM universally selected across portfolios Represents 300 MW of solar and 150 MW of storageGas peaker in Portfolio B represents an out-of-service territory PPA Gas peaker in Portfolio F represents asset sale proposal
ICAP Additions through 2027 Planning Year
REPLACEMENT ANALYSIS
Sugar Creek is retained through modeling
horizon
NIPSCO | NIPSCOcom |
Replacement Theme
Thermal PPAssolar and storage
Non-serv ice territory gas
peaking (no early storage)
Natural gas dominant (CC)
No new thermal resources solar
dominant w storage
Thermal PPAs plus storage and
solar
Local gas peaker plus solar and
storage
Solar dominant w storage plus
retire Sugar Creek
All renewables and storage plus retire Sugar Creek
(Portfolio 7)
New H2-enabled peaker plus solar and storage plus SC conv ersion to H2 (Portfolio 7H)
Carbon Emissions Higher Higher Higher Mid Mid Mid Low Low Low
Dispatchability Current Planning Reserv e Margin
Winter amp SummerReserv eMargin
Enhanced Reserve Margin (Local w Higher
Energy Duration)
Current Planning Reserv e Margin
Winter amp SummerReserv eMargin
Enhanced Reserve Margin (Local w Higher
Energy Duration)
Current Planning Reserv e Margin
Winter amp SummerReserv eMargin
Enhanced Reserve Margin (Local w Higher
Energy Duration)
Rank (1=Least Cost) 5 2 1 4 6 3 8 9 7
Delta from LeastCost
$14914
$2002 - $126
12$15515
$11411
$73071
$77875
$48047
RECAP RESULTS - COST TO CUSTOMER REFERENCE CASE
Observations
bull Portfolios A through F are all within ~$150 million NVPRR
bull Portfolios A and D (solar dominant that only meet summer RM) are not tenable options given potential market rule changes
bull Portfolio C develops a very net long position and is higher cost than several alternatives over a 20-year period as economics are driven by long-term ldquomerchantrdquo margins
bull Portfolios with significant storage (E in particular) have potential value in ancillary services markets
bull Portfolios G H and I (net zero concepts) are higher cost with Portfolio I retaining the optionality to burn natural gas at Sugar Creek under Reference Case conditions
Net Present Value of Revenue Requirement(2021-2050 $M)
A
$10461 $10332 $10312 $10438 $10467 $10426
$11042 $11090$10792
B C D E F
REPLACEMENT ANALYSIS
G H I
Not a viable pathway due to not meeting winter planning reserve margins
Sugar Creek continues to operate
Sugar Creek retiresconverts in 2032
30
NIPSCO | NIPSCOcom |
RECAP REPLACEMENT ANALYSIS SCENARIO RESULTS
31
REPLACEMENT ANALYSIS
Econ-Wide Decarb
Carbon Emissions Higher Higher Higher Mid Mid Mid Low Low Low
Dispatchability Current Planning Reserv e Margin
Winter amp SummerReserv eMargin
Enhanced Reserve Margin (Local w Higher Energy
Duration)
Current Planning Reserv e Margin
Winter amp SummerReserv eMargin
Enhanced Reserve Margin (Local w Higher Energy
Duration)
Current Planning Reserv e Margin
Winter amp SummerReserv eMargin
Enhanced Reserve Margin (Local w Higher Energy
Duration)
Delta from Lowest $149 $20 - $126 $155 $114 $730 $778 $480Cost to Customer 14 02 - 12 15 11 71 75 47
Delta from Lowest $347 $91 - $334 $278 $186 $1176 $1149 $624Cost to Customer 37 10 - 36 30 20 126 123 67
Delta from Lowest $18 $106 $299 - $35 $151 $235 $144 $212Cost to Customer 02 09 26 - 03 13 21 13 19
Delta from Lowest $207 $373 $709 $156 $317 $434 - $202 $39Cost to Customer 17 32 60 13 27 37 - 17 03
Reference Case
Status Quo Extended
Aggressive Env Reg
8500
9000
9500
10000
10500
11000
11500
12000
12500
13000
30-Y
ear
NP
VR
R($
mill
ions
)
A B C E F G I
Observations
bull Portfolios B C and F have lowest costs among viable options under the Reference and SQE scenarios
bull Portfolio E has the lowest cost among viable portfolios under the AER scenario with C highest cost and HI more competitive
bull Emission free resources (clean energy) have the most value in the EWD scenario with Portfolio I (assuming a future H2 subsidy) having the lowest cost among viable portfolios
Note that a $050kg H2 subsidy is assumed in AER and EWD
D
Not a viable pathway due to not meeting winter planning reserve margins
H
Economy-Wide Decarbonization (EWD)
Reference Case
Status Quo Extended (SQE)
Aggressive Environmental Regulation (AER)
NIPSCO | NIPSCOcom |
A B C D E F G H I (80) (60) (40) (20)
- 20 40 60 80
100 120
Replacement Theme
Thermal PPAssolar and storage
Non-serv ice territory gas
peaking (no early storage)
Natural gas dominant (CC)
No new thermal resources solar
dominant w storage
Thermal PPAs plus storage and
solar
Local gas peaker plus solar and
storage
Solar dominant w storage plus
retire Sugar Creek
All renewables and storage plus retire Sugar Creek
(Portfolio 7)
New H2-enabled peaker plus solar and storage plus SC conv ersion to H2 (Portfolio 7H)
Carbon Emissions Higher Higher Higher Mid Mid Mid Low Low Low
Dispatchability Current Planning Reserv e Margin
Winter amp SummerReserv eMargin
Enhanced Reserve Margin (Local w Higher
Energy Duration)
Current Planning Reserv e Margin
Winter amp SummerReserv eMargin
Enhanced Reserve Margin (Local w Higher
Energy Duration)
Current Planning Reserv e Margin
Winter amp SummerReserv eMargin
Enhanced Reserve Margin (Local w Higher
Energy Duration)
95th CVARDelta from Low 21 9 - 21 15 14 40 31 4
75th Delta from Low 8 6 - 8 6 6 9 7 9
5th Delta from Low 13 15 22 12 17 18 - 4 11
RECAP RESULTS - STOCHASTIC ANALYSIS
Observations
bull The stochastic analysis evaluates short-term volatility in commodity prices (natural gas and power) and hourly renewable (solar and wind) output
bull The overall magnitude of cost distributions across portfolios is narrower than the scenario range suggesting that stochastic risk for these portfolio options is less impactful than the major policy or market shifts evaluated across scenarios
bull Over the 30-year time horizon dispatchability serves to mitigate tail risk as portfolios that retain SC or add gas (including with hydrogen enablement) or storage capacity perform best at minimizing upside risk
bull The lowest downside range is observed in renewable-dominant portfolios
Net Present Value of Revenue Requirement ndash Delta to Median Value(2021-2050 $M)
A B C D E F
32
G H I
CVAR ndash Avg of observations above 95th
95th
50th
25th
5th
75th
REPLACEMENT ANALYSIS
NIPSCO | NIPSCOcom |
RECAP IN PREVIOUS SCORECARD RELIABILITY INDICATORS WERE UNDER DEVELOPMENT
33
Objective Indicator Description and Metrics
Affordability Cost to Customer
bull Impact to customer billsbull Metric 30-year NPV of revenue requirement (Reference Case scenario
deterministic results)
Rate Stability
Cost Certainty
bull Certainty that revenue requirement within the most likely range of outcomes
bull Metric Scenario range NPVRR and 75th range vs median
Cost Riskbull Risk of unacceptable high-cost outcomesbull Metric Highest scenario NPVRR and 95th conditional value at risk
(average of all outcomes above 95th vs median)Lower Cost Opportunity
bull Potential for lower cost outcomesbull Metric Lowest scenario NPVRR and 5th range vs median
Environmental Sustainability
Carbon Emissions
bull Carbon intensity of portfoliobull Metric Cumulative carbon emissions (2024-40 short tons of CO2) from the
generation portfolio
Reliable Flexible and Resilient Supply
Reliabilitybull The ability of the portfolio to provide reliable and flexible supply for
NIPSCO in light of evolving market conditions and rulesbull Metric Sub-hourly AS value impact and additional scoring (under
development)
Resource Optionality
bull The ability of the portfolio to flexibly respond to changes in NIPSCO load technology or market rules over time
bull Metric MW weighted duration of generation commitments (UCAP ndash 2027)
Positive Social amp Economic Impacts
Employees bull Addressed in Existing Fleet Analysis for existing generation assets employee numbers will be dependent on specific asset replacements
Local Economy
bull Effect on the local economy from new projects and ongoing property taxesbull Metric NPV of property taxes from the entire portfolio
Key Points
bull The Replacement Analysis scorecard incorporates broader perspectives on risk (stochastic analysis) and reliability than the Existing Fleet Analysis scorecard
bull NIPSCO has completed the qualitative assessment of reliability and has now defined the reliability metrics which will be used in the scorecard (discussed further on following slides)
REPLACEMENT ANALYSIS
NIPSCO | NIPSCOcom |
bull The results presented in September did not include additional reliability considerations that were previously under development
ndash Certain portfolio attributes were evaluated through additional economic analysis
ndash Ohers required a technical but non-economic review
bull NIPSCO held a Technical Webinar on October 12th to review the approach analyses and key outcomes of the additional reliability assessment to provide an open forum for questions and discussion
COMPLETED ANALYSES TO INFORM RELIABILITY INDICATORS
34
RELIABILITY
Economic Assessment Non-Economic Assessment
Analysis PerformedAncillary services analysis (regulation and spinning reserves) with sub-hourly granularity
Qualitative reliability assessment performed by third-party expert Quanta Technology
Scorecard Metric Sub-hourly energy and ancillary services value impact Composite Reliability Assessment Score
NIPSCO | NIPSCOcom |
bull While most of NIPSCOrsquos existing portfolio (including new renewables) realize nearly all value from energy and capacity contributions highly flexible resources that do not provide a lot of energy to the portfolio may still provide value in the form of ancillary services and in their ability to respond to changing market conditions in real time at sub-hourly granularity
ndash The MISO market currently operates markets for spinning reserves and regulation
ndash FERC Order 841 also requires ISOs to redesign markets to accommodate energy storage
bull Long-term market developments are uncertain and fundamental evaluation of sub-hourly ancillary services markets is challenging but the 2021 IRP has performed an analysis incorporating
ndash 5-minute granularity for energy and ancillary services based on historical data observations and future energy market scenario projections
ndash Operational parameters for various storage and gas peaking options
ndash Incremental value above and beyond what is picked up in the Aurora-based hourly energy dispatch is assessed and summarized on a portfolio level
SUB-HOURLY ENERGY AND ANCILLARY SERVICES EVALUATION
35
RELIABILITY
NIPSCO | NIPSCOcom |
RANGE OF ADDITIONAL VALUE OPPORTUNITY (NPVRR COST REDUCTION) BY PORTFOLIO
36
-
100
200
300
400
500
600
700
800
900Range
AERRefEWDSQE
Replacement Theme
Thermal PPAssolar and storage
Non-serv ice territory gas
peaking (no early storage)
Natural gas dominant (CC)
No new thermal resources solar
dominant w storage
Thermal PPAs plus storage and
solar
Local gas peaker plus solar and
storage
Solar dominant w storage plus
retire Sugar Creek
All renewables and storage plus retire Sugar Creek
(Portfolio 7)
New H2-enabled peaker plus solar and storage plus SC conv ersion to H2 (Portfolio 7H)
Carbon Emissions Higher Higher Higher Mid Mid Mid Low Low Low
Dispatchability Current Planning Reserv e Margin
Winter amp SummerReserv eMargin
Enhanced Reserve Margin (Local w Higher
Energy Duration)
Current Planning Reserv e Margin
Winter amp SummerReserv eMargin
Enhanced Reserve Margin (Local w Higher
Energy Duration)
Current Planning Reserv e Margin
Winter amp SummerReserv eMargin
Enhanced Reserve Margin (Local w Higher
Energy Duration)
A B C D E F G H I
Observations
bull Additional value is uncertain and dependent on market rules evolution MISO generation mix changes and market participant behavior
bull Portfolios with the largest amounts of storage (E and H) have the greatest potential to lower NPVRR by capturing flexibility value that may manifest in the sub-hourly energy and ancillary services markets
bull A wide range of value is possible with higher prices and price spreads in the AER scenario driving higher estimates
bull Results are incorporated into the final replacement analysis scorecard
Impact on Net Present Value of Revenue Requirement Value(2021-2050 $M)
RELIABILITY
NIPSCO | NIPSCOcom |
RELIABILITY ASSESSMENT GUIDING PRINCIPLES
37
The resources modeled are based on the portfolios constructed for the Replacement Analysis
Analysis incorporates planned transmission projectsTransmission
Upgrades
ResourcesModeled Goal
bull Understand potential reliability implications of potential resource additions to the NIPSCO portfolio
bull Understand the range of potential mitigations required associated with different replacement portfolio strategies The analysis is conducted at a planning level and
therefore further evaluation and granular studies will be required in the future
Individual resources from the 9 replacement portfolios are assessed based on the established reliability criteria The score of the individual resources drive the portfolio score
Evaluation
Resources are evaluated in 2030 after the Michigan City Unit 12 retirement
Time Period
RELIABILITY
NIPSCO | NIPSCOcom |
Stakeholders offered several comments and questions during the Technical Webinar on 1012 TECHNICAL WEBINAR STAKEHOLDER FEEDBACK
38
Stakeholder Feedback Summary NIPSCO Response
Indiana Office of Utility Consumer Counselor (OUCC)
bull Consider evaluating ldquoenergy inflows and outflowsrdquo by hour rather than constraining NIPSCOrsquos system to be islanded
bull This has been evaluated as part of the core IRP economic modeling and analysis including stochastic analysis
bull Under normal operating conditions NIPSCO is constantly selling and buying energy to and from the market so this exposure is economic and less about physical transmission limitations
bull The analysis concluded that over the long-term portfolios with more dispatchable gas or storage are less susceptible to market risk than those dominated by renewables
bull The reliability assessment has focused separately on energy adequacy risks under emergency conditions
Citizens Action Coalition of Indiana (CAC)
bull Consider portfolio evaluation under more representative emergency conditions rather than full islanded conditions This might include simulation of severe weather events (which may be getting more frequent due to climate change) and associated resource availability including renewables and other resources that may be impacted by forced outage or fuel supply unavailability
bull NIPSCOrsquos assessment was intended to evaluate a ldquoworst caserdquo week and not imply islanded operations for the year
bull We have not simulated weather load or forced outage events within the reliability assessment but there may be an opportunity to tie elements of the stochastic analysis that was performed to additional reliability metrics in the future Of particular focus are those that examine tail risk as measured by CVAR in the economic analysis
bull There is an industry trend towards greater focus on generation and transmission resiliency studies that aim to better quantify extreme event risk and we will consider analysis enhancements for future IRPs and further reliability assessment
Note NIPSCO has received other comments from stakeholders and is in the process of reviewing We will strive to incorporate feedback received into the final report
NIPSCO | NIPSCOcom |
RELIABILITY ASSESSMENT AND RANKING
39
Review amp Update Reliability Metrics
Assess NIPSCOrsquos Reliability Needs
Apply a Series of Reliability Filters to
IRP Portfolios
Scoring Criteria
Ranking Portfolios
bull Power Rampingbull Frequency Responsebull Short Circuit Strengthbull Flickerbull Black Start
Preferred Portfolio
Metric 3
Metric 2
Metric 1
RELIABILITY
NIPSCO | NIPSCOcom |
RELIABILITY CRITERIA
40
Criteria Description Rationale
1 BlackstartResource has the abil ity to be started without support from the wider system or is designed to remain energized without connection to the remainder of the system with the ability to energize a bus supply real and reactive power frequency and voltage control
In the event of a black out condition NIPSCO must have a blackstart plan to restore its local electric system The plan can either rely on MISO to energize a cranking path or on internal resources within the NIPSCO service territory
2 Energy DurationResources are able to meet the energy and capacity duration requirements Portfolio resources are able to supply the energy demand of customers during MISOrsquos emergency max gen events and also to supply the energy needs of critical loads during islanded operation events
NIPSCO must have long duration resources to serve the needs of its customers during emergency and islanded operation events
3Dispatchability and
Automatic Generation Control
The unit wil l respond to directives from system operators regarding its status output and timing The unit has the abil ity to be placed on Automatic Generation Control (AGC) allowing its output to be ramped up or down automatically to respond immediately to changes on the system
MISO provides dispatch signals under normal conditions but NIPSCO requires AGC attributes under emergency restoration procedures or other operational considerations
4Operational Flexibility
and Frequency Support
Ability to provide inertial energy reservoir or a sink to stabil ize the system The resource can adjust its output to provide frequency support or stabil ization in response to frequency deviations with a droop of 5 or better
MISO provides market construct under normal conditions but preferable that NIPSCO possess the abil ity to maintain operation during under-frequency conditions in emergencies
5 VAR Support
The resource can be used to deliver VARs out onto the system or absorb excess VARs and so can be used to control system voltage under steady-state and dynamictransient conditions The resource can provide dynamic reactive capability (VARs) even when not producing energy The resource must have Automatic voltage regulation (AVR) capability The resource must have the capability ranging from 085 lagging to 095 leading power factor
NIPSCO must retain resources electrically close to load centers to provide this attribute in accordance with NERC and IEEE Standards
6 Geographic Location Relative to Load
The resource will be located in NIPSCOrsquos footprint (electric Transmission Operator Area) in Northern Indiana near existing NIPSCO 138kV pr 345kV facil ities and is not restricted by fuel infrastructure The resource can be interconnected at 138kV or 345kV Preferred locations are ones that have multiple power evacuationdeliverabil ity paths and are close to major load centers
MISO requires location capacity resources and runs an LMP market to provide locational energy signals under emergency restoration procedures a blackstart plan reliant on external resources would create a significant risk Location provides economic value in the form of reduced losses congestion curtailment risk and address local capacity requirements Additionally from a reliability perspective resources that are interconnected to buses with multiple power evacuation paths and those close to load centers are more resil ient to transmission system outages and provide better assistance in the blackstart restoration process
7 Predictability and Firmness of Supply Ability to predictforecast the output of resources and to counteract forecast errors
Energy is scheduled with MISO in the day-ahead hourly market and in the real-time 5-minute market Deviations from these schedules have financial consequences and thus the abil ity to accurately forecast the output of a resource up to 38 hours ahead of time for the day-ahead market and 30 minutes for the real time market is advantageous
8 Short Circuit Strength Requirement
Ensure the strength of the system to enable the stable integration of all inverter-based resources (IBRs) within a portfolio
The retirement of synchronous generators within NIPSCO footprint and also within MISO and replacements with increasing levels of inverter-based resources will lower the short circuit strength of the system Resources than can operate at lower levels of SCR and those that provide higher short circuit current provide a better future proofing without the need for expensive mitigation measures
RELIABILITY
NIPSCO | NIPSCOcom |
RELIABILITY METRICS
41
Criteria Potential Measurement Approaches Considered
Included in Minimum
Interconnection Requirements
Quanta Analysis to Develop Metric
1 Blackstart bull MWs with black start capability NO bull Blackstart Analysis
2 Energy Duration bull Percentage of NIPSCOrsquos critical load (MW and Time) that can be supplied during emergencies NO bull Energy Adequacy Analysis
3 Dispatchability and Automatic Generation Control
bull MWs on AGCbull Up Range Down Rangebull Ability for Fast Regulationbull Duration of Up Down Regulation
NO (except being on SCADA for monitoring and control)
bull Increase of Regulation Requirements due to IBRs in each Portfolio
bull 10-min Ramp Capability of Portfolio
4 Operational Flexibility and Frequency Support
bull Inertial Response GapSurplusbull Primary Frequency Response GapSurplus NO bull Inertial Repose
bull Primary Response
5 VAR Support bull Continuous VAR output range that can be delivered to load centers YES bull Dynamic VAR deliverability
6 Geographic Location Relative to Load
bull MWs or within NIPSCO footprintbull Firmness of fuel supplies bull MWs with POIs with multiple (2 or higher) secure power evacuation paths
NO bull Topology analysis
7 Predictability and Firmness of Supply
bull Ability to mitigate Forecast Error of intermittent resources using fast ramping capability NO bull Power Ramping and
Forecast Errors
8 Short Circuit Strength Requirement
bull MWs of IBRs potentially impacted by lack of short circuit strengthbull Need for synchronous condensers andor grid forming inverters to ensure
stable system integration
NO 1547 and P2800 do not address
bull Short Circuit Strength Analysis
RELIABILITY
NIPSCO | NIPSCOcom |
PORTFOLIO RELIABILITY METRICSYear 2030 Metric A B C D E F G H I
1 Blackstart Qualitative Assessment of Risk of not Starting 0 0 1 0 1 1 0 1 1
2 Energy Adequacy Energy Not Served when Islanded (Worst 1-week) 76 78 32 75 78 56 74 73 58
28 16 55 27 44 45 26 47 47
58 50 42 63 50 45 65 51 51
Increased Freq Regulation Requirements (MW) 54 41 34 58 41 37 59 46 46
1-min Ramp Capability (MW) 331 196 261 331 666 382 326 761 599
10-min Ramp Capability (MW) 574 439 764 574 909 784 548 983 944
Inertia MVA-s 3218 3218 6729 3218 3218 5116 2931 2931 4397
Inertial Gap FFR MW 155 283 157 160 0 79 171 0 0
Primary Gap PFR MW 259 388 380 260 0 249 261 0 19
5 VAR Support Dynamic VAR to load Center Capability (MVAr) 658 471 457 704 630 555 725 731 719
6 Location Average Number of Evacuation Paths 5 3 NA 5 5 5 5 6 5
7 Predictability and Firmness
Ramping Capability to Mitigate Forecast Errors (+Excess-Deficit) MW
-228 134 -262 -257 161 154 -266 245 238
8 Short Circuit Strength Required Additional Synch Condensers MVA 580 388 0 763 341 0 802 488 257
Dispatchable (CAP unavoidable VER Penetration)
4 Operational Flexibility and Frequency Support
3Dispatchability and Automatic Generation Control
CAP the capacity value of the portfolio including the existing and planned resourcesSolar capacity credit 50 of installed capacity Wind capacity credit 163 (based on MISO published data on system wide capacity credits)
Preliminary
RELIABILITY
42

NIPSCO | NIPSCOcom | NIPSCO | NIPSCOcom |
Mike Hooper President amp COO NIPSCO
WELCOME
5
NIPSCO | NIPSCOcom | 6
PILLARS OF OUR ONGOING GENERATION TRANSITION PLANThis plan creates a vision for the future that is better for our customers and itrsquos consistent with our goal to transition
to the best cost cleanest electric supply mix available while maintaining reliability diversity and flexibility for the technology and market changes on the horizon
Reliable and sustainable
Flexibility for the future
Best plan for customers and the company
Local and statewide economic benefits
NIPSCO | NIPSCOcom | NIPSCO | NIPSCOcom |
Fred Gomos Director Strategy amp Risk Integration NiSource
NIPSCOrsquoS PUBLIC ADVISORY PROCESS AND RESOURCE PLANNING ACTIVITY REVIEW
7
NIPSCO | NIPSCOcom |
bull At least every three years NIPSCO outlines its long-term plan to supply electricity to customers over the next 20 years
bull This study ndash known as an IRP ndash is required of all electric utilities in Indiana
bull The IRP process includes extensive analysis of a range of generation scenarios with criteria such as reliable affordable compliant diverse and flexible
HOW DOES NIPSCO PLAN FOR THE FUTURE
8
Reliable
Compliant
FlexibleDiverse
Affordable
Requires Careful Planning and Consideration forbull NIPSCOrsquos employeesbull Environmental regulationsbull Changes in the local economy (property tax
supplier spending employee base)
NIPSCO | NIPSCOcom |
2021 STAKEHOLDER ADVISORY MEETING ROADMAP
9
Meeting Meeting 1 (March) Meeting 2 (May) Meeting 3 (July) Meeting 4 (September) Technical Webinar Meeting 5 (October)
Date 3192021 5202021 7132021 9212021 10122021 10212021
Location Virtual Virtual Virtual Virtual Virtual Virtual
Key Questions
bull How has NIPSCO progressed in the 2018 Short Term Action Plan
bull What has changed since the 2018 IRP
bull How are energy and demand expected change over time
bull What is the high level plan for stakeholder communication and feedback for the 2021 IRP
bull How do regulatory developments and initiatives at the MISO level impact NIPSCOrsquos 2021 IRP planning framework
bull How has environmental policy changed since 2018
bull What scenario themes and stochastics will NIPSCO explore in 2021
bull How are DSM resources considered in the IRP
bull How will NIPSCO evaluate potential DER options
bull What are the preliminary RFPresults
bull What are the preliminary findings from the modeling
bull What are the results of the Reliability Assessment
bull What is NIPSCOrsquos preferred plan
bull What is the short-term action plan
Content bull 2018 Short Term Action Plan Update (Retirements Replacement projects)
bull Resource Planning and 2021 Continuous Improvements
bull Update on Key InputsAssumptions (commodity prices demand forecast)
bull Scenario Themes ndash Introduction
bull 2021 Public Advisory Process
bull MISO Regulatory Developments and Initiatives
bull 2021 Environmental Policy Update
bull Scenariosand Stochastic Analysis
bull DSM Modeling and Methodology
bull DER Inputs
bull Preliminary RFP Results
bull Existing Fleet Review Modeling Results Scorecard
bull Replacement Modeling Results Scorecard
bull Reliability Assessment bull Preferred replacement path and logic relative to alternatives
bull 2021 NIPSCO Short Term Action Plan
Meeting Goals
bull Communicate what has changed since the 2018 IRP
bull Communicate NIPSCOrsquos focus on reliability
bull Communicate updates to key inputsassumptions
bull Communicate the 2021 public advisory process timing and input sought from stakeholders
bull Common understanding of MISO regulatory updates
bull Communicate environmental policy considerations
bull Communicate scenario themes and stochastic analysis approach along with major input details and assumptions
bull Common understanding of DSM modeling methodology
bull Communicate preliminary RFP results
bull Explain next steps for portfolio modeling
bull Communicate the Existing Fleet Portfolios and the Replacement Portfolios
bull Develop a shared understanding of economic modeling outcomes and preliminary results to facil itate stakeholder feedback
bull Common understanding of Reliability Assessment methodology
bull Communicate Reliability Assessment results
bull Respond to key stakeholder comments and requests
bull Communicate NIPSCOrsquos preferred resource plan and short-term action plan
bull Obtain feedback from stakeholders on preferred plan
NIPSCO | NIPSCOcom |
RESOURCE PLANNING APPROACH
10
Scorecard(Example)
Other Analysis (eg Reliability Assessment
Employee Impacts etc)
Aurora ndash NIPSCO Portfolio Market ModelProduction Cost Dispatch (hourly
chronological)
PERFORMDetailed cost of
service and revenue requirements
4
RFP Information
DSM Study
New resource option parameters
Portfolio Optimization
Retirement options and replacement themes (informed
by scenarios)NIPSCO
Portfolios
3
Market Modeling Tools (NGF GPCM Aurora)
Scenario Narrative Development2
Activity Timing
Identify key planning questions and themes Mar
Develop market perspectives (planning reference case and scenarios stochastic inputs)
Mar-May
Develop integrated resource strategies for NIPSCO (portfolios)
Jun-Jul
Portfolio modeling Detailed scenario dispatch Stochastic simulations
Aug-Sep
Evaluate trade-offs and produce recommendation Sep-Oct
1
2
3
4
5 Stochastic Modeling Tools
Integrated gas coal carbon forecasts and MISO market outlook prices
NIPSCO | NIPSCOcom |
bull The ongoing fleet transition in MISO makes it critical for NIPSCOrsquos IRP to capture several changing dynamics to allow NIPSCO to remain flexible
bull Over the course of the 2021 IRP NIPSCO has discussed these topics
IDENTIFY KEY PLANNING QUESTIONS AND THEMES1KEY PLANNING QUESTIONS AND THEMES
Topic
Retirement Timing for Existing Coal and Gas Units
Assessing the retirement timing of the remaining generating fleet after the Schahfer coal units retire which includes Michigan City Unit 12 Schahfer Units 16A and 16B and Sugar Creek
Flexibility amp Adaptability of The Portfolio
Incorporating evolving capacity credit expectations for resources and an imminent seasonal resource adequacy requirement
Carbon Emissions amp RegulationIncentives
Assessing diverse portfolio options in the context of increased policy conversations that push for 100 decarbonization of the power sector by the middle of the next decade
Long-Term Planning With Intermittent Resources
Understanding system reliability implications of a portfolio that will have significant intermittent resources in light of the MISO market evolution and NIPSCOrsquos operational responsibilities
11
NIPSCO | NIPSCOcom |
LONG TERM SYSTEM PLANNING WITH INTERMITTENT RESOURCES
12
Ensure Consistency with MISO Rules Evolution
Expand Uncertainty Analysis
Incorporate New Metrics
Seasonal resource adequacy Future effective load carrying capability
(ELCC) accounting
Incorporation of renewable output uncertainty
Broadening risk analysis to incorporate granular views of tail risk
Incorporating new scorecard metrics informed by stochastic analysis and capabilities of portfolio resources
Both summer and winter reserve margins tracked and implemented as constraints
ELCC accounting by season with a range of expected solar declines over time
Stochastic analysis evaluated the relationship between hourly renewable output and power prices to estimate the impact at different levels of penetration and across the commodity price distribution
Examined tail outcomes to understand the conditions and portfolios that expose customers to low probability high consequence (price) events
Performed ancillary services analysis (regulation spinning reserves) with sub-hourly granularity and conducted qualitative reliability assessment with several new metrics
2021 IRP Approach To Evaluate Action Implemented In IRP Modeling
1KEY PLANNING QUESTIONS AND THEMES
NIPSCO | NIPSCOcom |
As in the 2018 IRP multiple objectives and indicators are summarized across portfolios in an integrated scorecard framework against which to test portfolios and evaluate the major planning questions
IDENTIFY KEY PLANNING QUESTIONS AND THEMES1
bull The scorecard is a means of reporting key metrics for different portfolio options to transparently review tradeoffs and relative performance it does not produce a single score or ranking of portfolios but serves as a tool to facilitate decision-making
bull NIPSCO has identified 5 major planning objectives and multiple metrics within 9 key indicator categories
bull The Existing Fleet Analysis scorecard focuses on scenario costs carbon emissions and impact on NIPSCO employees and the local economy
bull The Replacement Analysis scorecard incorporates broader perspectives on risk (stochastic analysis) and reliability than the Existing Fleet Analysis scorecard
Objective Indicator
Affordability Cost to Customer
Rate Stability
Cost Certainty
Cost Risk
Lower Cost Opportunity
Environmental Sustainability
Carbon Emissions
Reliable Flexible and Resilient Supply
Reliability
Resource Optionality
Positive Social amp Economic Impacts
Employees
Local Economy
KEY PLANNING QUESTIONS AND THEMES
13
NIPSCO | NIPSCOcom |
bull NIPSCO developed four integrated market scenarios or future ldquostates of the worldrdquo
ndash Scenarios incorporate a range of future outcomes for load commodity prices technology and policy
ndash The 2021 IRP includes two distinct policy frameworks for achieving net-zero emission trajectories for the broader power market
bull Stochastic inputs have been developed for key components of quantifiable stochastic risk
ndash For the 2021 IRP the stochastic analysis has been expanded to include hourly renewable availability in addition to commodity price volatility
DEVELOP MARKET PERSPECTIVES (REF CASE SCENARIOS STOCHASTIC INPUTS)
14
2
Reference Casebull The MISO market continues to evolve based on current expectations for load growth commodity
price trajectories technology development and policy change (some carbon regulation and MISO rules evolution)
Status Quo Extended (ldquoSQErdquo)bull Binding federal limits on carbon emissions are not implemented natural gas prices remain low and
result in new gas additions remaining competitive versus renewables as coal capacity more gradually fades from the MISO market
Aggressive Environmental Regulation (ldquoAERrdquo)bull Carbon emissions from the power sector are regulated through a mix of incentives and a federal
taxcap-and-trade program that results in a significant CO2 price and net-zero emission targets for the power sector by 2040 restrictions on natural gas production increase gas prices
Economy-Wide Decarbonization (ldquoEWDrdquo)bull Technology development and federal incentives push towards a decarbonized economy including
through a power sector Clean Energy Standard (supporting renewables and other non-emitting technologies) and large-scale electrification in other sectors (EVs heating processes etc)
0
20
40
60
80
100
1 4 7 1013161922C
apac
ity F
acto
r
Hour of Day
Solar Output Power Prices
-
20
40
60
80
100
120
nom
inal
$M
Wh
MARKET PERSPECTIVES AND MODELING OF UNCERTAINTY
NIPSCO | NIPSCOcom |
NIPSCO is now monitoring summer and winter reserve margins plus the annual energy balanceKey Points
bull The capacity credit for some of the 2023 projects is not reflected until 2024 due to in-service date timing
bull Capacity credit for some storage resources is not reflected until 2025 (after a full year of operations) due to plant configuration
bull While winter loads are lower the lower capacity credit in the winter for solar resources results in a similar reserve margin
bull On an annual basis the net energy position for the portfolio is long driven by the energy value and economic dispatch advantage of wind and solar resources However the tight capacity position may create hourly gaps particularly in the winter mornings and evenings when solar resources ramp down (next slide)
1000
0
2000
3000
202420232021 2022 2025 2026 2027 2028
Summer Capacity
20282021 2022 20262023 2024 2025 2027
Winter Capacity
UCAP MW
Capacity PurchasesCapacity Gap
WindOtherFiled DSM Programs
Storage
SolarCoalNatural GasPeak Load (or Net Energy)
Planning Reserve Margin
Annual EnergyGWh
Multiple renew able projects coming online in 2023 to address capacity gap
0
2000
4000
6000
8000
10000
12000
14000
16000
2021 2022 2023 2024 2025 2026 2027 2028
STARTING NEAR-TERM CAPACITY AND ENERGY BALANCE3CURRENT PORTFOLIO POSITION
15
NIPSCO | NIPSCOcom |
bull There are hours of the day where renewable resources are not available (ex overnight for solar) Furthermore solar resources may experience steep production declines in the evening hours
bull Currently Sugar Creek (natural gas CC) Schahfer 16AB (natural gas peaker) and Michigan City 12 (coal) are part of the portfolio and when economic NIPSCO can purchase from the MISO market
bull As 16AB and MC12 retire the portfolio will require new resources to be available to mitigate against specific hourly energy exposure
STARTING ENERGY BALANCE VARIES ON AN HOURLY BASIS
Average Summer Day after Schahfer coal ret wo MC12 and 16AB Average Winter Day after Schahfer coal ret wo MC12 and 16AB
Steep ramping needs
0
500
1000
1500
2000
2500
1 2 3 4 5 6 7 8 9 10 11 12 13 14 15 16 17 18 19 20 21 22 23 24
MW
1 2 3 4 5 6 7 8 9 10 11 12 13 14 15 16 17 18 19 20 21 22 23 24
Sugar Creek
Hydro
Wind
FiT DER
Solar
Storage
Gross Load
Load Net of DSM
Net Requirement
3CURRENT PORTFOLIO POSITION
16
NIPSCO | NIPSCOcom | NIPSCO | NIPSCOcom |
Pat Augustine Vice President CRA
EXISTING FLEET ANALYSIS REVIEW
17
NIPSCO | NIPSCOcom |
bull The IRP analysis is performed in two phases the first phase examines current and future resource additions to evaluate timing of retirement for existing units
bull Insight and conclusions from existing fleet analysis inform replacement concepts to evaluate Once a preferred existing portfolio is established future replacements are evaluated across a range of objectives
RECAP ANALYTICAL FRAMEWORK
18
Existing Fleet Analysis Replacement Analysis
Core Questions
How does the cost to keep a unit compare to the cost to replace with economically optimized resourcesIs the portfolio flexible and adaptable to address changes in market rules and energy policy
What are the replacement resource portfolio options How do different replacement themes compare with regard to cost risk environmental sustainability and reliability
Actual projects available to NIPSCO Actual projects available to NIPSCO
Key Decision What units should retire and when What new resources should be added to meet customersrsquo needs
All-Source RFP
EXISTING FLEET ANALYSIS
NIPSCO | NIPSCOcom |
RECAP CONSTRUCTED RETIREMENT PORTFOLIOS TO COVER THE RANGE OF TIMING POSSIBILITIES FOR REMAINING FOSSIL UNITS
Key Points
bull Portfolio construction is necessarily broad to fully address tradeoffs
bull Portfolios 1-4 focus on the timing of the Michigan City retirement
bull Portfolios 5 and 6 focus on the replacement timing for Schahfer 16AB Units are not retained beyond 2028 in any portfolio given current condition and age
bull Portfolio 7 and 7H are assessing implications of carbon free portfolio pathways
Portfolio Transition
Target
15 Coal through 2032
15 Coal through 2028
15 Coal through 2026
15 Coal through 2024
15 Coal through 2028
15 Coal through 2026
15 Coal through 2028
Fossil Free by 2032
15 Coal through 2028
Option for Fossil Free by 2032
MC 12 Through Book life
2018 IRP Preferred Plan
Early Retirement of MC 12
Early Retirement of MC 12
2018 IRP Preferred Plan + 2025 16AB
retirement
Early Retirement of MC 12
+ 2025 16AB retirement
2018 IRP Preferred Plan + 2025 16AB ret +
2032 SC ret
2018 IRP Preferred Plan + 2025 16AB ret +
2032 SC conv
Retain beyond
2032Sugar Creek Sugar Creek Sugar Creek Sugar Creek Sugar Creek Sugar Creek None
Sugar Creek conv erts to H2
(2032)
Michigan City 12
Retire Retire Retire Retire Retire Retire Retire
2032 2028 2026 2024 2028 2026 2028
Schahfer 16AB
Retire Retire
2028 2025
Sugar Creek Retain
Retire Convert to H2
2032 2032
1 2 3 4 5 6 7 7H
Short term Longer term
EXISTING FLEET ANALYSIS
Not a viable pathway due to implementation timing19
NIPSCO | NIPSCOcom |
bull Driven by a binding winter reserve margin and the energy resources already obtained from the 2018 IRP Preferred Plan the indicative ordering of model selection preference favors resources that offer greater levels of firm capacity
bull This is not NIPSCOrsquos final replacement resource selection or preferred plan but an optimized set of additions to facilitate evaluation of the various existing fleet strategies
RECAP EXISTING FLEET ANALYSIS SELECTIONS ARE DRIVEN BY ECONOMIC OPTIMIZATION
Resource options include RFP tranches DSM bundles DER options and an opportunity to uprate capacity at Sugar Creek
Portfolio 1
MC12 Through Book Life
Technology ICAP MW
Year
NIPSCO DER 10 2026Sugar Creek Uprate 53 2027DSMThermal Contract 50 2024Thermal Contract 100 2026Gas Peaker 300 2032Storage 135 2027Total 693
Portfolios 2 | 3 | 4
2018 IRP (MC 2028) | MC 2026 | MC 2028
TechnologyICAP MW
YearP2 P3
NIPSCO DER 10 2026 2026Sugar Creek Uprate 53 2027 2027DSMThermal Contract 50 2024 2024Thermal Contract 100 2026 2026Gas Peaker 300 2028 2026Storage 135 2027 2027Solar 100
200^2026 2026
Total 793 893^
Portfolio 7H
Fossil Free Option by 2032 w SC Conversion (incl capital costs)
Technology ICAP MW
Year
NIPSCO DER 10 2026Sugar Creek Uprate 53 2027DSMStorage 235 2025Storage 135 2027Solar 250 2026Wind 200 2026Hydrogen-Enabled Gas Peaker 193 2025SC Electrolyzer Pilot 20 2026Total 1131
DSM includes the cumulative impact of both Residential and Commercial programs by 2027 with Commercial being most cost effective DSM is reported on a summer peak basis Note that the winter impact is ~46MW
CO
ST-E
FEC
TIVE
NESS
Less
More
68 6868
2027 2027 20272027
Portfolios 5 | 6Portfolio 2 w 16AB 2025 | Portfolio 3 w 16AB 2025
Technology ICAP MW
YearP5 P6
NIPSCO DER 10 2026 2026Sugar Creek Uprate 53 2027 2027DSM 68 2027 2027Thermal Contract 50 2024 2024Thermal Contract 100 2026 2026Gas Peaker 300 2028 2026Storage 135 2025 2025Solar 100 2026 2026Wind 200 NA 2026Total 993
Portfolio 7
Fossil Free By 2032
Technology ICAP MW
Year
NIPSCO DER 10 2026DSM 68 2027Storage 235 2025Storage 100 2026Storage 235 2027Solar 250 2026Wind 200 2026Total 1020
EXISTING FLEET ANALYSIS
Notes Portfolios were optimized against winter reserve margin constraints (94) followed by summer to ensure compliance with bothA maximum net energy sales limit of 30 during the fleet transition (2023-2026) falling to 25 in 2030+ was also enforcedWind outside LRZ6 was not included in optimization analysis given lack of capacity deliverabil ity to LRZ6 and significant congestion risk
P420262027
2024202620242025
2026
2027
^ P23 have 100 MW of solar P4 has 200 MW
20
NIPSCO | NIPSCOcom |
Portfolio Transition Target
15 Coal through 2032
15 Coal through 2028
15 Coal through 2026
15 Coal through 2024
15 Coal through 2028
15 Coal through 2026
15 Coal through 2028
Fossil Free by 2032
15 Coal through 2028
Option for Fossil Free by 2032
Retire MC 12 (2032)Schfr 16AB (2028)
MC 12 (2028)Schfr 16AB (2028)
MC 12 (2026)Schfr 16AB (2028)
MC 12 (2024)Schfr 16AB (2028)
MC 12 (2028)Schfr 16 AB (2025)
MC 12 (2026)Schfr 16AB (2025)
MC 12 (2028)Schfr 16AB (2025)
SC (2032)
MC 12 (2028)Schfr 16AB (2025)
SC to H2 (2032)
Retain beyond 2032 Sugar Creek Sugar Creek Sugar Creek Sugar Creek Sugar Creek Sugar Creek None Sugar Creek converts to H2 (2032)
Rank (1=Least Cost) 5 3 1 2 6 4 8 7
Delta from LeastCost
$35M03
$16M02 - $10M
01$47M05
$24M02
$417M41
$357M35
RECAP EXISTING FLEET ANALYSIS - DETERMINISTIC COST TO CUSTOMERSRESULTS
Observations
bull The difference in NPVRR from the highest cost to lowest cost portfolio is approximately $430 million
bull Consistent with NIPSCOrsquos prior IRP findings early retirement of coal is generally cost effective for customers although the difference in cost across several portfolios is small since much of the remaining portfolio is fixed and small changes in retirement dates are now being assessed
bull Retaining Units 16AB until 2028 may be cost effective given the portfoliorsquos capacity needs However this is contingent on the operational condition of these older vintage units and the cost impacts of earlier retirement are less than 1 in NPVRR
Net Present Value of Revenue Requirement(2021-2050 $M)
1
$10149 $10130 $10114 $10125 $10161 $10138$10531 $10471
2 3 5 6 7 7H
EXISTING FLEET ANALYSIS
4
Not a viable pathway due to implementation timing
21
NIPSCO | NIPSCOcom |
RECAP EXISTING FLEET ANALYSIS - SCENARIO RESULTS
Econ-Wide Decarbonization
Portfolio Transition Target
15 Coal through 2032
15 Coal through 2028
15 Coal through 2026
15 Coal through 2024
15 Coal through 2028
15 Coal through 2026
15 Coal through 2028
Fossil Free by 2032
15 Coal through 2028 Option forFossil Free by
2032
Retire MC 12 (2032)Schfr 16AB (2028)
MC 12 (2028)Schfr 16AB (2028)
MC 12 (2026)Schfr 16AB (2028)
MC 12 (2024)Schfr 16AB (2028)
MC 12 (2028)Schfr 16 AB
(2025)
MC 12 (2026)Schfr 16AB (2025)
MC 12 (2028)Schfr 16AB (2025)
SC (2032)
MC 12 (2028)Schfr 16AB (2025)
SC to H2 (2032)
Retain beyond 2032 Sugar Creek Sugar Creek Sugar Creek Sugar Creek Sugar Creek Sugar Creek None
Sugar Creek converts to H2
(2032)Delta from Lowest $35 $16 - $10 $47 $24 $417 $357Cost to Customer 03 02 - 01 05 02 41 35
Delta from Lowest $36 $18 $2 - $49 $108 $720 $492Cost to Customer 04 02 00 - 05 12 78 54
Delta from Lowest $336 $269 $259 $277 $292 $157 - $303Cost to Customer 31 25 24 25 27 14 - 28
Delta from Lowest $477 $454 $449 $459 $478 $276 - $29Cost to Customer 41 39 39 40 42 24 - 03
Reference Case
Status Quo Extended
Aggressive Env Reg
8500
9000
9500
10000
10500
11000
11500
12000
12500
13000
NP
VR
R($
mill
ions
)
1 2 3 5 6 7 7H
Observations
bull MC12 retirement in 2026 has a small cost benefit (lt$20M) relative to retirement in 2028 across all scenarios
bull MC 12 retirement in 2032 is always higher cost than earlier retirement with the largest difference in the AER scenario (high carbon price)
bull Portfolio 2 is slightly lower cost than Portfolio 5 although additional renewable additions with early 16AB retirement (Portfolio 6) lower costs under high carbon regulation scenarios
bull Portfolios 7 and 7H have the smallest range as their future renewable hydrogen and storage investments hedge against high-cost power market outcomes
EXISTING FLEET ANALYSIS
Note that a $050kg H2 subsidy is assumed in AER and EWD
4
Reference Case
Status Quo Extended (SQE)
Aggressive Environmental Regulation (AER)
Economy-Wide Decarbonization (EWD)
Not a viable pathway due to implementation timing 22
NIPSCO | NIPSCOcom |
RECAP EXISTING FLEET ANALYSIS SCORECARD
23
Objective Indicator Description and Metrics
Affordability Cost to Customer
bull Impact to customer billsbull Metric 30-year NPV of revenue requirement
(Reference Case scenario deterministic results)
Rate Stability
Cost Certainty
bull Certainty that revenue requirement within the most likely range of outcomes
bull Metric Scenario range NPVRR
Cost Risk bull Risk of unacceptable high-cost outcomesbull Metric Highest scenario NPVRR
Lower Cost Opportunity
bull Potential for lower cost outcomesbull Metric Lowest scenario NPVRR
Environmental Sustainability
Carbon Emissions
bull Carbon intensity of portfoliobull Metric Cumulative carbon emissions (2024-40
short tons of CO2) from the generation portfolio
Reliable Flexible and Resilient Supply
Reliabilitybull To be addressed in Replacement Analysis stage
Resource Optionality
Positive Social amp Economic Impacts
Employeesbull Net impact on NiSource jobsbull Metric Approx number of permanent NiSource jobs
associated with generation
Local Economy
bull Net effect on the local economy (relative to 2018 IRP) from new projects and ongoing property taxes
bull Metric NPV of existing fleet property tax relative to 2018 IRP
Additional risk metrics will be included in the Replacement Analysis when broader set of resource types are evaluated
Key Points
bull Two closely related but distinct scorecards are used for the Existing Fleet Analysis and the Replacement Analysis
bull The Existing Fleet Analysis focuses on scenario costs carbon emissions and impact on NIPSCO employees and the local economy
bull The Replacement Analysis expands the risk assessment to include a stochastic assessment and introduces reliability metrics to assess a broader range of future resource options
EXISTING FLEET ANALYSIS
NIPSCO | NIPSCOcom |
RECAP EXISTING FLEET ANALYSIS SCORECARD
24
1 2 3 4 5 6 7 7H
Not a viable pathway due to implementation timing
Adding replacement projects could have an impact on net jobs
Portfolio Transition Target
15 Coal through 2032
15 Coal through 2028
15 Coal through 2026
15 Coal through 2024
15 Coal through 2028
15 Coal through 2026
15 Coal through 2028
Fossil Free by 2032
15 Coal through 2028
Fossil Free by 2032
Retire MC 12 (2032)Schfr 16AB (2028)
MC 12 (2028)Schfr 16AB (2028)
MC 12 (2026)Schfr 16AB (2028)
MC 12 (2024)Schfr 16AB (2028)
MC 12 (2028)Schfr 16 AB (2025)
MC 12 (2026)Schfr 16AB (2025)
MC 12 (2028)Schfr 16AB (2025)
SC (2032)
MC 12 (2028)Schfr 16AB (2025)
SC to H2 (2032)
Retain beyond 2032 Sugar Creek Sugar Creek Sugar Creek Sugar Creek Sugar Creek Sugar Creek None Sugar Creek converts to H2 (2032)
Cost To Customer30-year NPV of revenue requirement (Ref Case)
$10149 $10130 $10114 $10125 $10161 $10138 $10531 $10471+$35 +$16 - $10 +$47 +$24 +$417 +$35703 02 - 01 05 02 41 35
Cost CertaintyScenario Range (NPVRR)
$2759 $2754 $2766 $2777 $2747 $2487 $1598 $1855+$1161 +$1156 +$1167 +$1179 +$1149 +$889 - +$257726 723 730 738 719 556 - 161
Cost RiskHighest Scenario NPVRR
$11974 $11951 $11947 $11957 $11976 $11773 $11498 $11527+$477 $454 +$449 +$459 +$478 +$276 - +$2941 39 39 40 42 24 - 03
Lower Cost Opportunity
Lowest Scenario NPVRR
$9215 $9197 $9181 $9179 $9229 $9287 $9899 $9671+$36 +$18 +$2 - +$49 +$108 +$720 +$49204 02 00 - 05 12 78 53
Carbon EmissionsM of tons 2024-40 Cum
(Scenario Avg)
433 337 285 230 337 285 214 309+22 +12 +7 +2 +12 +7 - +9
102 57 33 8 57 33 - 44
EmployeesApprox existing gen jobs compared to 2018 IRP
+127 0 -127 -127 -4 -131 -34 -4
Local EconomyNPV of existing fleet property
tax relative to 2018 IRP+$13 $0 -$10 -$23 $0 -$10 -$16 +$13
EXISTING FLEET ANALYSIS
NIPSCO | NIPSCOcom | NIPSCO | NIPSCOcom |
BREAK
25
NIPSCO | NIPSCOcom | NIPSCO | NIPSCOcom |
Pat Augustine Vice President CRAHisham Othman VP Transmission and Regulatory Consulting Quanta Technology LLC
REPLACEMENT ANALYSIS REVIEW
26
NIPSCO | NIPSCOcom |
bull The IRP analysis is performed in two phases the first phase examines current and future resource additions to evaluate timing of retirement for existing units
bull Insight and conclusions from existing fleet analysis inform replacement concepts to evaluate Once a preferred existing portfolio is established future replacements are evaluated across a range of objectives
RECAP ANALYTICAL FRAMEWORK
27
Existing Fleet Analysis Replacement Analysis
Core Questions
How does the cost to keep a unit compare to the cost to replace with economically optimized resourcesIs the portfolio flexible and adaptable to address changes in market rules and energy policy
What are the replacement resource portfolio options How do different replacement themes compare with regard to cost risk environmental sustainability and reliability
Actual projects available to NIPSCO Actual projects available to NIPSCO
Key Decision What units should retire and when What new resources should be added to meet customersrsquo needs
All-Source RFP
REPLACEMENT ANALYSIS
NIPSCO | NIPSCOcom |
RECAP REPLACEMENT ANALYSIS PORTFOLIOS HAVE BEEN DEVELOPED ACROSS NINE CONCEPTSThe concepts are informed by the IRP themes findings from the Existing Fleet Analysis and additional optimization testing
DispatchabilityCurrent Planning Reserve Margin
Winter amp Summer Reserve Margin
Enhanced Reserve Margin (Local w Higher Energy Duration)
Emis
sion
s
Higher CarbonEmissions
Thermal PPAs solar and storage
Non-service territory gas peaking (no early storage) Natural gas dominant (CC)
Mid Carbon Emissions
No new thermal resources solar dominant w storage
Thermal PPAs plus storage and solar
Local gas peaker plus solar and storage
Low Carbon Emissions
Solar dominant w storage plus retire Sugar Creek
All renewables and storage plus retire Sugar Creek (Portfolio 7)
New H2-enabled peaker plus solar and storage plus SC conversion to H2 (Portfolio 7H)
Sugar Creek Retires or converts to H2
Net Zero Concepts
A B C
D E F
G H I
REPLACEMENT ANALYSIS
Sugar Creek is retained through modeling
horizon
bull For the Replacement Analysis Portfolio 3 from the Existing Fleet analysis has been used to assess portfolio selection under the earliest possible retirement of MC12 Note that Portfolio 2 would have similar results with small changes in resource addition timing This approach does not imply that NIPSCO has determined a specific MC12 retirement date
bull Resource combinations are constructed based on RFP projects (tranches) and other opportunities to explore a range of emissions profiles and dispatchability under current and proposed market rules
28
NIPSCO | NIPSCOcom |
bull Several resource additions are common across all themes when allowed RampC DSM programs Thermal PPAs attractive NIPSCO DER SC uprate
bull A range of solar storage gas wind and hydrogen-enabled resources are incorporated across portfolios
RECAP ICAP ADDITIONSndash RFP PROJECTS AND OTHER NEAR-TERM OPPORTUNITIES
29
Dispatchability
Current Planning Reserve Margin
Winter amp Summer Reserve Margin
Enhanced Reserve Margin (Local w Higher Energy Duration)
Emis
sion
s
Higher CarbonEmissions
NIPSCO DER 10MWSC Uprate 53MWThermal PPA 150MWStorage 135MWSolar+Storage 450MWSolar 250MW
NIPSCO DER 10MWSC Uprate 53MWGas Peaker 443MWThermal PPA 150MWSolar 250MW
NIPSCO DER 10MWSC Uprate 53MWGas CC 650MW
Portfolio violates normal net long energy sales constraints enforced in optimization
Mid Carbon Emissions
NIPSCO DER 10MWSC Uprate 53MWStorage 135MWSolar+Storage 450MWSolar 400MW
NIPSCO DER 10MWSC Uprate 53MWThermal PPA 150MWStorage 470MWSolar 250MW
NIPSCO DER 10MWSC Uprate 53MWGas Peaker 300MWThermal PPA 150MWStorage 135MWSolar 100MW
Low Carbon Emissions
NIPSCO DER 10MWStorage 135MWSolar+Storage 450MWSolar 450MW
NIPSCO DER 10MWWind 200MWStorage 570MWSolar 250MW
NIPSCO DER 10MWSC H2 Electrolyzer 20MWSC Uprate 53MWH2 Enabled Peaker 193MWWind 200MWStorage 370MWSolar 250MW
Sugar Creek Retires or converts to H2
Net Zero Concepts
A B C
D E F
G H I
Note ResidentialCommercial DSM universally selected across portfolios Represents 300 MW of solar and 150 MW of storageGas peaker in Portfolio B represents an out-of-service territory PPA Gas peaker in Portfolio F represents asset sale proposal
ICAP Additions through 2027 Planning Year
REPLACEMENT ANALYSIS
Sugar Creek is retained through modeling
horizon
NIPSCO | NIPSCOcom |
Replacement Theme
Thermal PPAssolar and storage
Non-serv ice territory gas
peaking (no early storage)
Natural gas dominant (CC)
No new thermal resources solar
dominant w storage
Thermal PPAs plus storage and
solar
Local gas peaker plus solar and
storage
Solar dominant w storage plus
retire Sugar Creek
All renewables and storage plus retire Sugar Creek
(Portfolio 7)
New H2-enabled peaker plus solar and storage plus SC conv ersion to H2 (Portfolio 7H)
Carbon Emissions Higher Higher Higher Mid Mid Mid Low Low Low
Dispatchability Current Planning Reserv e Margin
Winter amp SummerReserv eMargin
Enhanced Reserve Margin (Local w Higher
Energy Duration)
Current Planning Reserv e Margin
Winter amp SummerReserv eMargin
Enhanced Reserve Margin (Local w Higher
Energy Duration)
Current Planning Reserv e Margin
Winter amp SummerReserv eMargin
Enhanced Reserve Margin (Local w Higher
Energy Duration)
Rank (1=Least Cost) 5 2 1 4 6 3 8 9 7
Delta from LeastCost
$14914
$2002 - $126
12$15515
$11411
$73071
$77875
$48047
RECAP RESULTS - COST TO CUSTOMER REFERENCE CASE
Observations
bull Portfolios A through F are all within ~$150 million NVPRR
bull Portfolios A and D (solar dominant that only meet summer RM) are not tenable options given potential market rule changes
bull Portfolio C develops a very net long position and is higher cost than several alternatives over a 20-year period as economics are driven by long-term ldquomerchantrdquo margins
bull Portfolios with significant storage (E in particular) have potential value in ancillary services markets
bull Portfolios G H and I (net zero concepts) are higher cost with Portfolio I retaining the optionality to burn natural gas at Sugar Creek under Reference Case conditions
Net Present Value of Revenue Requirement(2021-2050 $M)
A
$10461 $10332 $10312 $10438 $10467 $10426
$11042 $11090$10792
B C D E F
REPLACEMENT ANALYSIS
G H I
Not a viable pathway due to not meeting winter planning reserve margins
Sugar Creek continues to operate
Sugar Creek retiresconverts in 2032
30
NIPSCO | NIPSCOcom |
RECAP REPLACEMENT ANALYSIS SCENARIO RESULTS
31
REPLACEMENT ANALYSIS
Econ-Wide Decarb
Carbon Emissions Higher Higher Higher Mid Mid Mid Low Low Low
Dispatchability Current Planning Reserv e Margin
Winter amp SummerReserv eMargin
Enhanced Reserve Margin (Local w Higher Energy
Duration)
Current Planning Reserv e Margin
Winter amp SummerReserv eMargin
Enhanced Reserve Margin (Local w Higher Energy
Duration)
Current Planning Reserv e Margin
Winter amp SummerReserv eMargin
Enhanced Reserve Margin (Local w Higher Energy
Duration)
Delta from Lowest $149 $20 - $126 $155 $114 $730 $778 $480Cost to Customer 14 02 - 12 15 11 71 75 47
Delta from Lowest $347 $91 - $334 $278 $186 $1176 $1149 $624Cost to Customer 37 10 - 36 30 20 126 123 67
Delta from Lowest $18 $106 $299 - $35 $151 $235 $144 $212Cost to Customer 02 09 26 - 03 13 21 13 19
Delta from Lowest $207 $373 $709 $156 $317 $434 - $202 $39Cost to Customer 17 32 60 13 27 37 - 17 03
Reference Case
Status Quo Extended
Aggressive Env Reg
8500
9000
9500
10000
10500
11000
11500
12000
12500
13000
30-Y
ear
NP
VR
R($
mill
ions
)
A B C E F G I
Observations
bull Portfolios B C and F have lowest costs among viable options under the Reference and SQE scenarios
bull Portfolio E has the lowest cost among viable portfolios under the AER scenario with C highest cost and HI more competitive
bull Emission free resources (clean energy) have the most value in the EWD scenario with Portfolio I (assuming a future H2 subsidy) having the lowest cost among viable portfolios
Note that a $050kg H2 subsidy is assumed in AER and EWD
D
Not a viable pathway due to not meeting winter planning reserve margins
H
Economy-Wide Decarbonization (EWD)
Reference Case
Status Quo Extended (SQE)
Aggressive Environmental Regulation (AER)
NIPSCO | NIPSCOcom |
A B C D E F G H I (80) (60) (40) (20)
- 20 40 60 80
100 120
Replacement Theme
Thermal PPAssolar and storage
Non-serv ice territory gas
peaking (no early storage)
Natural gas dominant (CC)
No new thermal resources solar
dominant w storage
Thermal PPAs plus storage and
solar
Local gas peaker plus solar and
storage
Solar dominant w storage plus
retire Sugar Creek
All renewables and storage plus retire Sugar Creek
(Portfolio 7)
New H2-enabled peaker plus solar and storage plus SC conv ersion to H2 (Portfolio 7H)
Carbon Emissions Higher Higher Higher Mid Mid Mid Low Low Low
Dispatchability Current Planning Reserv e Margin
Winter amp SummerReserv eMargin
Enhanced Reserve Margin (Local w Higher
Energy Duration)
Current Planning Reserv e Margin
Winter amp SummerReserv eMargin
Enhanced Reserve Margin (Local w Higher
Energy Duration)
Current Planning Reserv e Margin
Winter amp SummerReserv eMargin
Enhanced Reserve Margin (Local w Higher
Energy Duration)
95th CVARDelta from Low 21 9 - 21 15 14 40 31 4
75th Delta from Low 8 6 - 8 6 6 9 7 9
5th Delta from Low 13 15 22 12 17 18 - 4 11
RECAP RESULTS - STOCHASTIC ANALYSIS
Observations
bull The stochastic analysis evaluates short-term volatility in commodity prices (natural gas and power) and hourly renewable (solar and wind) output
bull The overall magnitude of cost distributions across portfolios is narrower than the scenario range suggesting that stochastic risk for these portfolio options is less impactful than the major policy or market shifts evaluated across scenarios
bull Over the 30-year time horizon dispatchability serves to mitigate tail risk as portfolios that retain SC or add gas (including with hydrogen enablement) or storage capacity perform best at minimizing upside risk
bull The lowest downside range is observed in renewable-dominant portfolios
Net Present Value of Revenue Requirement ndash Delta to Median Value(2021-2050 $M)
A B C D E F
32
G H I
CVAR ndash Avg of observations above 95th
95th
50th
25th
5th
75th
REPLACEMENT ANALYSIS
NIPSCO | NIPSCOcom |
RECAP IN PREVIOUS SCORECARD RELIABILITY INDICATORS WERE UNDER DEVELOPMENT
33
Objective Indicator Description and Metrics
Affordability Cost to Customer
bull Impact to customer billsbull Metric 30-year NPV of revenue requirement (Reference Case scenario
deterministic results)
Rate Stability
Cost Certainty
bull Certainty that revenue requirement within the most likely range of outcomes
bull Metric Scenario range NPVRR and 75th range vs median
Cost Riskbull Risk of unacceptable high-cost outcomesbull Metric Highest scenario NPVRR and 95th conditional value at risk
(average of all outcomes above 95th vs median)Lower Cost Opportunity
bull Potential for lower cost outcomesbull Metric Lowest scenario NPVRR and 5th range vs median
Environmental Sustainability
Carbon Emissions
bull Carbon intensity of portfoliobull Metric Cumulative carbon emissions (2024-40 short tons of CO2) from the
generation portfolio
Reliable Flexible and Resilient Supply
Reliabilitybull The ability of the portfolio to provide reliable and flexible supply for
NIPSCO in light of evolving market conditions and rulesbull Metric Sub-hourly AS value impact and additional scoring (under
development)
Resource Optionality
bull The ability of the portfolio to flexibly respond to changes in NIPSCO load technology or market rules over time
bull Metric MW weighted duration of generation commitments (UCAP ndash 2027)
Positive Social amp Economic Impacts
Employees bull Addressed in Existing Fleet Analysis for existing generation assets employee numbers will be dependent on specific asset replacements
Local Economy
bull Effect on the local economy from new projects and ongoing property taxesbull Metric NPV of property taxes from the entire portfolio
Key Points
bull The Replacement Analysis scorecard incorporates broader perspectives on risk (stochastic analysis) and reliability than the Existing Fleet Analysis scorecard
bull NIPSCO has completed the qualitative assessment of reliability and has now defined the reliability metrics which will be used in the scorecard (discussed further on following slides)
REPLACEMENT ANALYSIS
NIPSCO | NIPSCOcom |
bull The results presented in September did not include additional reliability considerations that were previously under development
ndash Certain portfolio attributes were evaluated through additional economic analysis
ndash Ohers required a technical but non-economic review
bull NIPSCO held a Technical Webinar on October 12th to review the approach analyses and key outcomes of the additional reliability assessment to provide an open forum for questions and discussion
COMPLETED ANALYSES TO INFORM RELIABILITY INDICATORS
34
RELIABILITY
Economic Assessment Non-Economic Assessment
Analysis PerformedAncillary services analysis (regulation and spinning reserves) with sub-hourly granularity
Qualitative reliability assessment performed by third-party expert Quanta Technology
Scorecard Metric Sub-hourly energy and ancillary services value impact Composite Reliability Assessment Score
NIPSCO | NIPSCOcom |
bull While most of NIPSCOrsquos existing portfolio (including new renewables) realize nearly all value from energy and capacity contributions highly flexible resources that do not provide a lot of energy to the portfolio may still provide value in the form of ancillary services and in their ability to respond to changing market conditions in real time at sub-hourly granularity
ndash The MISO market currently operates markets for spinning reserves and regulation
ndash FERC Order 841 also requires ISOs to redesign markets to accommodate energy storage
bull Long-term market developments are uncertain and fundamental evaluation of sub-hourly ancillary services markets is challenging but the 2021 IRP has performed an analysis incorporating
ndash 5-minute granularity for energy and ancillary services based on historical data observations and future energy market scenario projections
ndash Operational parameters for various storage and gas peaking options
ndash Incremental value above and beyond what is picked up in the Aurora-based hourly energy dispatch is assessed and summarized on a portfolio level
SUB-HOURLY ENERGY AND ANCILLARY SERVICES EVALUATION
35
RELIABILITY
NIPSCO | NIPSCOcom |
RANGE OF ADDITIONAL VALUE OPPORTUNITY (NPVRR COST REDUCTION) BY PORTFOLIO
36
-
100
200
300
400
500
600
700
800
900Range
AERRefEWDSQE
Replacement Theme
Thermal PPAssolar and storage
Non-serv ice territory gas
peaking (no early storage)
Natural gas dominant (CC)
No new thermal resources solar
dominant w storage
Thermal PPAs plus storage and
solar
Local gas peaker plus solar and
storage
Solar dominant w storage plus
retire Sugar Creek
All renewables and storage plus retire Sugar Creek
(Portfolio 7)
New H2-enabled peaker plus solar and storage plus SC conv ersion to H2 (Portfolio 7H)
Carbon Emissions Higher Higher Higher Mid Mid Mid Low Low Low
Dispatchability Current Planning Reserv e Margin
Winter amp SummerReserv eMargin
Enhanced Reserve Margin (Local w Higher
Energy Duration)
Current Planning Reserv e Margin
Winter amp SummerReserv eMargin
Enhanced Reserve Margin (Local w Higher
Energy Duration)
Current Planning Reserv e Margin
Winter amp SummerReserv eMargin
Enhanced Reserve Margin (Local w Higher
Energy Duration)
A B C D E F G H I
Observations
bull Additional value is uncertain and dependent on market rules evolution MISO generation mix changes and market participant behavior
bull Portfolios with the largest amounts of storage (E and H) have the greatest potential to lower NPVRR by capturing flexibility value that may manifest in the sub-hourly energy and ancillary services markets
bull A wide range of value is possible with higher prices and price spreads in the AER scenario driving higher estimates
bull Results are incorporated into the final replacement analysis scorecard
Impact on Net Present Value of Revenue Requirement Value(2021-2050 $M)
RELIABILITY
NIPSCO | NIPSCOcom |
RELIABILITY ASSESSMENT GUIDING PRINCIPLES
37
The resources modeled are based on the portfolios constructed for the Replacement Analysis
Analysis incorporates planned transmission projectsTransmission
Upgrades
ResourcesModeled Goal
bull Understand potential reliability implications of potential resource additions to the NIPSCO portfolio
bull Understand the range of potential mitigations required associated with different replacement portfolio strategies The analysis is conducted at a planning level and
therefore further evaluation and granular studies will be required in the future
Individual resources from the 9 replacement portfolios are assessed based on the established reliability criteria The score of the individual resources drive the portfolio score
Evaluation
Resources are evaluated in 2030 after the Michigan City Unit 12 retirement
Time Period
RELIABILITY
NIPSCO | NIPSCOcom |
Stakeholders offered several comments and questions during the Technical Webinar on 1012 TECHNICAL WEBINAR STAKEHOLDER FEEDBACK
38
Stakeholder Feedback Summary NIPSCO Response
Indiana Office of Utility Consumer Counselor (OUCC)
bull Consider evaluating ldquoenergy inflows and outflowsrdquo by hour rather than constraining NIPSCOrsquos system to be islanded
bull This has been evaluated as part of the core IRP economic modeling and analysis including stochastic analysis
bull Under normal operating conditions NIPSCO is constantly selling and buying energy to and from the market so this exposure is economic and less about physical transmission limitations
bull The analysis concluded that over the long-term portfolios with more dispatchable gas or storage are less susceptible to market risk than those dominated by renewables
bull The reliability assessment has focused separately on energy adequacy risks under emergency conditions
Citizens Action Coalition of Indiana (CAC)
bull Consider portfolio evaluation under more representative emergency conditions rather than full islanded conditions This might include simulation of severe weather events (which may be getting more frequent due to climate change) and associated resource availability including renewables and other resources that may be impacted by forced outage or fuel supply unavailability
bull NIPSCOrsquos assessment was intended to evaluate a ldquoworst caserdquo week and not imply islanded operations for the year
bull We have not simulated weather load or forced outage events within the reliability assessment but there may be an opportunity to tie elements of the stochastic analysis that was performed to additional reliability metrics in the future Of particular focus are those that examine tail risk as measured by CVAR in the economic analysis
bull There is an industry trend towards greater focus on generation and transmission resiliency studies that aim to better quantify extreme event risk and we will consider analysis enhancements for future IRPs and further reliability assessment
Note NIPSCO has received other comments from stakeholders and is in the process of reviewing We will strive to incorporate feedback received into the final report
NIPSCO | NIPSCOcom |
RELIABILITY ASSESSMENT AND RANKING
39
Review amp Update Reliability Metrics
Assess NIPSCOrsquos Reliability Needs
Apply a Series of Reliability Filters to
IRP Portfolios
Scoring Criteria
Ranking Portfolios
bull Power Rampingbull Frequency Responsebull Short Circuit Strengthbull Flickerbull Black Start
Preferred Portfolio
Metric 3
Metric 2
Metric 1
RELIABILITY
NIPSCO | NIPSCOcom |
RELIABILITY CRITERIA
40
Criteria Description Rationale
1 BlackstartResource has the abil ity to be started without support from the wider system or is designed to remain energized without connection to the remainder of the system with the ability to energize a bus supply real and reactive power frequency and voltage control
In the event of a black out condition NIPSCO must have a blackstart plan to restore its local electric system The plan can either rely on MISO to energize a cranking path or on internal resources within the NIPSCO service territory
2 Energy DurationResources are able to meet the energy and capacity duration requirements Portfolio resources are able to supply the energy demand of customers during MISOrsquos emergency max gen events and also to supply the energy needs of critical loads during islanded operation events
NIPSCO must have long duration resources to serve the needs of its customers during emergency and islanded operation events
3Dispatchability and
Automatic Generation Control
The unit wil l respond to directives from system operators regarding its status output and timing The unit has the abil ity to be placed on Automatic Generation Control (AGC) allowing its output to be ramped up or down automatically to respond immediately to changes on the system
MISO provides dispatch signals under normal conditions but NIPSCO requires AGC attributes under emergency restoration procedures or other operational considerations
4Operational Flexibility
and Frequency Support
Ability to provide inertial energy reservoir or a sink to stabil ize the system The resource can adjust its output to provide frequency support or stabil ization in response to frequency deviations with a droop of 5 or better
MISO provides market construct under normal conditions but preferable that NIPSCO possess the abil ity to maintain operation during under-frequency conditions in emergencies
5 VAR Support
The resource can be used to deliver VARs out onto the system or absorb excess VARs and so can be used to control system voltage under steady-state and dynamictransient conditions The resource can provide dynamic reactive capability (VARs) even when not producing energy The resource must have Automatic voltage regulation (AVR) capability The resource must have the capability ranging from 085 lagging to 095 leading power factor
NIPSCO must retain resources electrically close to load centers to provide this attribute in accordance with NERC and IEEE Standards
6 Geographic Location Relative to Load
The resource will be located in NIPSCOrsquos footprint (electric Transmission Operator Area) in Northern Indiana near existing NIPSCO 138kV pr 345kV facil ities and is not restricted by fuel infrastructure The resource can be interconnected at 138kV or 345kV Preferred locations are ones that have multiple power evacuationdeliverabil ity paths and are close to major load centers
MISO requires location capacity resources and runs an LMP market to provide locational energy signals under emergency restoration procedures a blackstart plan reliant on external resources would create a significant risk Location provides economic value in the form of reduced losses congestion curtailment risk and address local capacity requirements Additionally from a reliability perspective resources that are interconnected to buses with multiple power evacuation paths and those close to load centers are more resil ient to transmission system outages and provide better assistance in the blackstart restoration process
7 Predictability and Firmness of Supply Ability to predictforecast the output of resources and to counteract forecast errors
Energy is scheduled with MISO in the day-ahead hourly market and in the real-time 5-minute market Deviations from these schedules have financial consequences and thus the abil ity to accurately forecast the output of a resource up to 38 hours ahead of time for the day-ahead market and 30 minutes for the real time market is advantageous
8 Short Circuit Strength Requirement
Ensure the strength of the system to enable the stable integration of all inverter-based resources (IBRs) within a portfolio
The retirement of synchronous generators within NIPSCO footprint and also within MISO and replacements with increasing levels of inverter-based resources will lower the short circuit strength of the system Resources than can operate at lower levels of SCR and those that provide higher short circuit current provide a better future proofing without the need for expensive mitigation measures
RELIABILITY
NIPSCO | NIPSCOcom |
RELIABILITY METRICS
41
Criteria Potential Measurement Approaches Considered
Included in Minimum
Interconnection Requirements
Quanta Analysis to Develop Metric
1 Blackstart bull MWs with black start capability NO bull Blackstart Analysis
2 Energy Duration bull Percentage of NIPSCOrsquos critical load (MW and Time) that can be supplied during emergencies NO bull Energy Adequacy Analysis
3 Dispatchability and Automatic Generation Control
bull MWs on AGCbull Up Range Down Rangebull Ability for Fast Regulationbull Duration of Up Down Regulation
NO (except being on SCADA for monitoring and control)
bull Increase of Regulation Requirements due to IBRs in each Portfolio
bull 10-min Ramp Capability of Portfolio
4 Operational Flexibility and Frequency Support
bull Inertial Response GapSurplusbull Primary Frequency Response GapSurplus NO bull Inertial Repose
bull Primary Response
5 VAR Support bull Continuous VAR output range that can be delivered to load centers YES bull Dynamic VAR deliverability
6 Geographic Location Relative to Load
bull MWs or within NIPSCO footprintbull Firmness of fuel supplies bull MWs with POIs with multiple (2 or higher) secure power evacuation paths
NO bull Topology analysis
7 Predictability and Firmness of Supply
bull Ability to mitigate Forecast Error of intermittent resources using fast ramping capability NO bull Power Ramping and
Forecast Errors
8 Short Circuit Strength Requirement
bull MWs of IBRs potentially impacted by lack of short circuit strengthbull Need for synchronous condensers andor grid forming inverters to ensure
stable system integration
NO 1547 and P2800 do not address
bull Short Circuit Strength Analysis
RELIABILITY
NIPSCO | NIPSCOcom |
PORTFOLIO RELIABILITY METRICSYear 2030 Metric A B C D E F G H I
1 Blackstart Qualitative Assessment of Risk of not Starting 0 0 1 0 1 1 0 1 1
2 Energy Adequacy Energy Not Served when Islanded (Worst 1-week) 76 78 32 75 78 56 74 73 58
28 16 55 27 44 45 26 47 47
58 50 42 63 50 45 65 51 51
Increased Freq Regulation Requirements (MW) 54 41 34 58 41 37 59 46 46
1-min Ramp Capability (MW) 331 196 261 331 666 382 326 761 599
10-min Ramp Capability (MW) 574 439 764 574 909 784 548 983 944
Inertia MVA-s 3218 3218 6729 3218 3218 5116 2931 2931 4397
Inertial Gap FFR MW 155 283 157 160 0 79 171 0 0
Primary Gap PFR MW 259 388 380 260 0 249 261 0 19
5 VAR Support Dynamic VAR to load Center Capability (MVAr) 658 471 457 704 630 555 725 731 719
6 Location Average Number of Evacuation Paths 5 3 NA 5 5 5 5 6 5
7 Predictability and Firmness
Ramping Capability to Mitigate Forecast Errors (+Excess-Deficit) MW
-228 134 -262 -257 161 154 -266 245 238
8 Short Circuit Strength Required Additional Synch Condensers MVA 580 388 0 763 341 0 802 488 257
Dispatchable (CAP unavoidable VER Penetration)
4 Operational Flexibility and Frequency Support
3Dispatchability and Automatic Generation Control
CAP the capacity value of the portfolio including the existing and planned resourcesSolar capacity credit 50 of installed capacity Wind capacity credit 163 (based on MISO published data on system wide capacity credits)
Preliminary
RELIABILITY
42

NIPSCO | NIPSCOcom | NIPSCO | NIPSCOcom |
Fred Gomos Director Strategy amp Risk Integration NiSource
NIPSCOrsquoS PUBLIC ADVISORY PROCESS AND RESOURCE PLANNING ACTIVITY REVIEW
7
NIPSCO | NIPSCOcom |
bull At least every three years NIPSCO outlines its long-term plan to supply electricity to customers over the next 20 years
bull This study ndash known as an IRP ndash is required of all electric utilities in Indiana
bull The IRP process includes extensive analysis of a range of generation scenarios with criteria such as reliable affordable compliant diverse and flexible
HOW DOES NIPSCO PLAN FOR THE FUTURE
8
Reliable
Compliant
FlexibleDiverse
Affordable
Requires Careful Planning and Consideration forbull NIPSCOrsquos employeesbull Environmental regulationsbull Changes in the local economy (property tax
supplier spending employee base)
NIPSCO | NIPSCOcom |
2021 STAKEHOLDER ADVISORY MEETING ROADMAP
9
Meeting Meeting 1 (March) Meeting 2 (May) Meeting 3 (July) Meeting 4 (September) Technical Webinar Meeting 5 (October)
Date 3192021 5202021 7132021 9212021 10122021 10212021
Location Virtual Virtual Virtual Virtual Virtual Virtual
Key Questions
bull How has NIPSCO progressed in the 2018 Short Term Action Plan
bull What has changed since the 2018 IRP
bull How are energy and demand expected change over time
bull What is the high level plan for stakeholder communication and feedback for the 2021 IRP
bull How do regulatory developments and initiatives at the MISO level impact NIPSCOrsquos 2021 IRP planning framework
bull How has environmental policy changed since 2018
bull What scenario themes and stochastics will NIPSCO explore in 2021
bull How are DSM resources considered in the IRP
bull How will NIPSCO evaluate potential DER options
bull What are the preliminary RFPresults
bull What are the preliminary findings from the modeling
bull What are the results of the Reliability Assessment
bull What is NIPSCOrsquos preferred plan
bull What is the short-term action plan
Content bull 2018 Short Term Action Plan Update (Retirements Replacement projects)
bull Resource Planning and 2021 Continuous Improvements
bull Update on Key InputsAssumptions (commodity prices demand forecast)
bull Scenario Themes ndash Introduction
bull 2021 Public Advisory Process
bull MISO Regulatory Developments and Initiatives
bull 2021 Environmental Policy Update
bull Scenariosand Stochastic Analysis
bull DSM Modeling and Methodology
bull DER Inputs
bull Preliminary RFP Results
bull Existing Fleet Review Modeling Results Scorecard
bull Replacement Modeling Results Scorecard
bull Reliability Assessment bull Preferred replacement path and logic relative to alternatives
bull 2021 NIPSCO Short Term Action Plan
Meeting Goals
bull Communicate what has changed since the 2018 IRP
bull Communicate NIPSCOrsquos focus on reliability
bull Communicate updates to key inputsassumptions
bull Communicate the 2021 public advisory process timing and input sought from stakeholders
bull Common understanding of MISO regulatory updates
bull Communicate environmental policy considerations
bull Communicate scenario themes and stochastic analysis approach along with major input details and assumptions
bull Common understanding of DSM modeling methodology
bull Communicate preliminary RFP results
bull Explain next steps for portfolio modeling
bull Communicate the Existing Fleet Portfolios and the Replacement Portfolios
bull Develop a shared understanding of economic modeling outcomes and preliminary results to facil itate stakeholder feedback
bull Common understanding of Reliability Assessment methodology
bull Communicate Reliability Assessment results
bull Respond to key stakeholder comments and requests
bull Communicate NIPSCOrsquos preferred resource plan and short-term action plan
bull Obtain feedback from stakeholders on preferred plan
NIPSCO | NIPSCOcom |
RESOURCE PLANNING APPROACH
10
Scorecard(Example)
Other Analysis (eg Reliability Assessment
Employee Impacts etc)
Aurora ndash NIPSCO Portfolio Market ModelProduction Cost Dispatch (hourly
chronological)
PERFORMDetailed cost of
service and revenue requirements
4
RFP Information
DSM Study
New resource option parameters
Portfolio Optimization
Retirement options and replacement themes (informed
by scenarios)NIPSCO
Portfolios
3
Market Modeling Tools (NGF GPCM Aurora)
Scenario Narrative Development2
Activity Timing
Identify key planning questions and themes Mar
Develop market perspectives (planning reference case and scenarios stochastic inputs)
Mar-May
Develop integrated resource strategies for NIPSCO (portfolios)
Jun-Jul
Portfolio modeling Detailed scenario dispatch Stochastic simulations
Aug-Sep
Evaluate trade-offs and produce recommendation Sep-Oct
1
2
3
4
5 Stochastic Modeling Tools
Integrated gas coal carbon forecasts and MISO market outlook prices
NIPSCO | NIPSCOcom |
bull The ongoing fleet transition in MISO makes it critical for NIPSCOrsquos IRP to capture several changing dynamics to allow NIPSCO to remain flexible
bull Over the course of the 2021 IRP NIPSCO has discussed these topics
IDENTIFY KEY PLANNING QUESTIONS AND THEMES1KEY PLANNING QUESTIONS AND THEMES
Topic
Retirement Timing for Existing Coal and Gas Units
Assessing the retirement timing of the remaining generating fleet after the Schahfer coal units retire which includes Michigan City Unit 12 Schahfer Units 16A and 16B and Sugar Creek
Flexibility amp Adaptability of The Portfolio
Incorporating evolving capacity credit expectations for resources and an imminent seasonal resource adequacy requirement
Carbon Emissions amp RegulationIncentives
Assessing diverse portfolio options in the context of increased policy conversations that push for 100 decarbonization of the power sector by the middle of the next decade
Long-Term Planning With Intermittent Resources
Understanding system reliability implications of a portfolio that will have significant intermittent resources in light of the MISO market evolution and NIPSCOrsquos operational responsibilities
11
NIPSCO | NIPSCOcom |
LONG TERM SYSTEM PLANNING WITH INTERMITTENT RESOURCES
12
Ensure Consistency with MISO Rules Evolution
Expand Uncertainty Analysis
Incorporate New Metrics
Seasonal resource adequacy Future effective load carrying capability
(ELCC) accounting
Incorporation of renewable output uncertainty
Broadening risk analysis to incorporate granular views of tail risk
Incorporating new scorecard metrics informed by stochastic analysis and capabilities of portfolio resources
Both summer and winter reserve margins tracked and implemented as constraints
ELCC accounting by season with a range of expected solar declines over time
Stochastic analysis evaluated the relationship between hourly renewable output and power prices to estimate the impact at different levels of penetration and across the commodity price distribution
Examined tail outcomes to understand the conditions and portfolios that expose customers to low probability high consequence (price) events
Performed ancillary services analysis (regulation spinning reserves) with sub-hourly granularity and conducted qualitative reliability assessment with several new metrics
2021 IRP Approach To Evaluate Action Implemented In IRP Modeling
1KEY PLANNING QUESTIONS AND THEMES
NIPSCO | NIPSCOcom |
As in the 2018 IRP multiple objectives and indicators are summarized across portfolios in an integrated scorecard framework against which to test portfolios and evaluate the major planning questions
IDENTIFY KEY PLANNING QUESTIONS AND THEMES1
bull The scorecard is a means of reporting key metrics for different portfolio options to transparently review tradeoffs and relative performance it does not produce a single score or ranking of portfolios but serves as a tool to facilitate decision-making
bull NIPSCO has identified 5 major planning objectives and multiple metrics within 9 key indicator categories
bull The Existing Fleet Analysis scorecard focuses on scenario costs carbon emissions and impact on NIPSCO employees and the local economy
bull The Replacement Analysis scorecard incorporates broader perspectives on risk (stochastic analysis) and reliability than the Existing Fleet Analysis scorecard
Objective Indicator
Affordability Cost to Customer
Rate Stability
Cost Certainty
Cost Risk
Lower Cost Opportunity
Environmental Sustainability
Carbon Emissions
Reliable Flexible and Resilient Supply
Reliability
Resource Optionality
Positive Social amp Economic Impacts
Employees
Local Economy
KEY PLANNING QUESTIONS AND THEMES
13
NIPSCO | NIPSCOcom |
bull NIPSCO developed four integrated market scenarios or future ldquostates of the worldrdquo
ndash Scenarios incorporate a range of future outcomes for load commodity prices technology and policy
ndash The 2021 IRP includes two distinct policy frameworks for achieving net-zero emission trajectories for the broader power market
bull Stochastic inputs have been developed for key components of quantifiable stochastic risk
ndash For the 2021 IRP the stochastic analysis has been expanded to include hourly renewable availability in addition to commodity price volatility
DEVELOP MARKET PERSPECTIVES (REF CASE SCENARIOS STOCHASTIC INPUTS)
14
2
Reference Casebull The MISO market continues to evolve based on current expectations for load growth commodity
price trajectories technology development and policy change (some carbon regulation and MISO rules evolution)
Status Quo Extended (ldquoSQErdquo)bull Binding federal limits on carbon emissions are not implemented natural gas prices remain low and
result in new gas additions remaining competitive versus renewables as coal capacity more gradually fades from the MISO market
Aggressive Environmental Regulation (ldquoAERrdquo)bull Carbon emissions from the power sector are regulated through a mix of incentives and a federal
taxcap-and-trade program that results in a significant CO2 price and net-zero emission targets for the power sector by 2040 restrictions on natural gas production increase gas prices
Economy-Wide Decarbonization (ldquoEWDrdquo)bull Technology development and federal incentives push towards a decarbonized economy including
through a power sector Clean Energy Standard (supporting renewables and other non-emitting technologies) and large-scale electrification in other sectors (EVs heating processes etc)
0
20
40
60
80
100
1 4 7 1013161922C
apac
ity F
acto
r
Hour of Day
Solar Output Power Prices
-
20
40
60
80
100
120
nom
inal
$M
Wh
MARKET PERSPECTIVES AND MODELING OF UNCERTAINTY
NIPSCO | NIPSCOcom |
NIPSCO is now monitoring summer and winter reserve margins plus the annual energy balanceKey Points
bull The capacity credit for some of the 2023 projects is not reflected until 2024 due to in-service date timing
bull Capacity credit for some storage resources is not reflected until 2025 (after a full year of operations) due to plant configuration
bull While winter loads are lower the lower capacity credit in the winter for solar resources results in a similar reserve margin
bull On an annual basis the net energy position for the portfolio is long driven by the energy value and economic dispatch advantage of wind and solar resources However the tight capacity position may create hourly gaps particularly in the winter mornings and evenings when solar resources ramp down (next slide)
1000
0
2000
3000
202420232021 2022 2025 2026 2027 2028
Summer Capacity
20282021 2022 20262023 2024 2025 2027
Winter Capacity
UCAP MW
Capacity PurchasesCapacity Gap
WindOtherFiled DSM Programs
Storage
SolarCoalNatural GasPeak Load (or Net Energy)
Planning Reserve Margin
Annual EnergyGWh
Multiple renew able projects coming online in 2023 to address capacity gap
0
2000
4000
6000
8000
10000
12000
14000
16000
2021 2022 2023 2024 2025 2026 2027 2028
STARTING NEAR-TERM CAPACITY AND ENERGY BALANCE3CURRENT PORTFOLIO POSITION
15
NIPSCO | NIPSCOcom |
bull There are hours of the day where renewable resources are not available (ex overnight for solar) Furthermore solar resources may experience steep production declines in the evening hours
bull Currently Sugar Creek (natural gas CC) Schahfer 16AB (natural gas peaker) and Michigan City 12 (coal) are part of the portfolio and when economic NIPSCO can purchase from the MISO market
bull As 16AB and MC12 retire the portfolio will require new resources to be available to mitigate against specific hourly energy exposure
STARTING ENERGY BALANCE VARIES ON AN HOURLY BASIS
Average Summer Day after Schahfer coal ret wo MC12 and 16AB Average Winter Day after Schahfer coal ret wo MC12 and 16AB
Steep ramping needs
0
500
1000
1500
2000
2500
1 2 3 4 5 6 7 8 9 10 11 12 13 14 15 16 17 18 19 20 21 22 23 24
MW
1 2 3 4 5 6 7 8 9 10 11 12 13 14 15 16 17 18 19 20 21 22 23 24
Sugar Creek
Hydro
Wind
FiT DER
Solar
Storage
Gross Load
Load Net of DSM
Net Requirement
3CURRENT PORTFOLIO POSITION
16
NIPSCO | NIPSCOcom | NIPSCO | NIPSCOcom |
Pat Augustine Vice President CRA
EXISTING FLEET ANALYSIS REVIEW
17
NIPSCO | NIPSCOcom |
bull The IRP analysis is performed in two phases the first phase examines current and future resource additions to evaluate timing of retirement for existing units
bull Insight and conclusions from existing fleet analysis inform replacement concepts to evaluate Once a preferred existing portfolio is established future replacements are evaluated across a range of objectives
RECAP ANALYTICAL FRAMEWORK
18
Existing Fleet Analysis Replacement Analysis
Core Questions
How does the cost to keep a unit compare to the cost to replace with economically optimized resourcesIs the portfolio flexible and adaptable to address changes in market rules and energy policy
What are the replacement resource portfolio options How do different replacement themes compare with regard to cost risk environmental sustainability and reliability
Actual projects available to NIPSCO Actual projects available to NIPSCO
Key Decision What units should retire and when What new resources should be added to meet customersrsquo needs
All-Source RFP
EXISTING FLEET ANALYSIS
NIPSCO | NIPSCOcom |
RECAP CONSTRUCTED RETIREMENT PORTFOLIOS TO COVER THE RANGE OF TIMING POSSIBILITIES FOR REMAINING FOSSIL UNITS
Key Points
bull Portfolio construction is necessarily broad to fully address tradeoffs
bull Portfolios 1-4 focus on the timing of the Michigan City retirement
bull Portfolios 5 and 6 focus on the replacement timing for Schahfer 16AB Units are not retained beyond 2028 in any portfolio given current condition and age
bull Portfolio 7 and 7H are assessing implications of carbon free portfolio pathways
Portfolio Transition
Target
15 Coal through 2032
15 Coal through 2028
15 Coal through 2026
15 Coal through 2024
15 Coal through 2028
15 Coal through 2026
15 Coal through 2028
Fossil Free by 2032
15 Coal through 2028
Option for Fossil Free by 2032
MC 12 Through Book life
2018 IRP Preferred Plan
Early Retirement of MC 12
Early Retirement of MC 12
2018 IRP Preferred Plan + 2025 16AB
retirement
Early Retirement of MC 12
+ 2025 16AB retirement
2018 IRP Preferred Plan + 2025 16AB ret +
2032 SC ret
2018 IRP Preferred Plan + 2025 16AB ret +
2032 SC conv
Retain beyond
2032Sugar Creek Sugar Creek Sugar Creek Sugar Creek Sugar Creek Sugar Creek None
Sugar Creek conv erts to H2
(2032)
Michigan City 12
Retire Retire Retire Retire Retire Retire Retire
2032 2028 2026 2024 2028 2026 2028
Schahfer 16AB
Retire Retire
2028 2025
Sugar Creek Retain
Retire Convert to H2
2032 2032
1 2 3 4 5 6 7 7H
Short term Longer term
EXISTING FLEET ANALYSIS
Not a viable pathway due to implementation timing19
NIPSCO | NIPSCOcom |
bull Driven by a binding winter reserve margin and the energy resources already obtained from the 2018 IRP Preferred Plan the indicative ordering of model selection preference favors resources that offer greater levels of firm capacity
bull This is not NIPSCOrsquos final replacement resource selection or preferred plan but an optimized set of additions to facilitate evaluation of the various existing fleet strategies
RECAP EXISTING FLEET ANALYSIS SELECTIONS ARE DRIVEN BY ECONOMIC OPTIMIZATION
Resource options include RFP tranches DSM bundles DER options and an opportunity to uprate capacity at Sugar Creek
Portfolio 1
MC12 Through Book Life
Technology ICAP MW
Year
NIPSCO DER 10 2026Sugar Creek Uprate 53 2027DSMThermal Contract 50 2024Thermal Contract 100 2026Gas Peaker 300 2032Storage 135 2027Total 693
Portfolios 2 | 3 | 4
2018 IRP (MC 2028) | MC 2026 | MC 2028
TechnologyICAP MW
YearP2 P3
NIPSCO DER 10 2026 2026Sugar Creek Uprate 53 2027 2027DSMThermal Contract 50 2024 2024Thermal Contract 100 2026 2026Gas Peaker 300 2028 2026Storage 135 2027 2027Solar 100
200^2026 2026
Total 793 893^
Portfolio 7H
Fossil Free Option by 2032 w SC Conversion (incl capital costs)
Technology ICAP MW
Year
NIPSCO DER 10 2026Sugar Creek Uprate 53 2027DSMStorage 235 2025Storage 135 2027Solar 250 2026Wind 200 2026Hydrogen-Enabled Gas Peaker 193 2025SC Electrolyzer Pilot 20 2026Total 1131
DSM includes the cumulative impact of both Residential and Commercial programs by 2027 with Commercial being most cost effective DSM is reported on a summer peak basis Note that the winter impact is ~46MW
CO
ST-E
FEC
TIVE
NESS
Less
More
68 6868
2027 2027 20272027
Portfolios 5 | 6Portfolio 2 w 16AB 2025 | Portfolio 3 w 16AB 2025
Technology ICAP MW
YearP5 P6
NIPSCO DER 10 2026 2026Sugar Creek Uprate 53 2027 2027DSM 68 2027 2027Thermal Contract 50 2024 2024Thermal Contract 100 2026 2026Gas Peaker 300 2028 2026Storage 135 2025 2025Solar 100 2026 2026Wind 200 NA 2026Total 993
Portfolio 7
Fossil Free By 2032
Technology ICAP MW
Year
NIPSCO DER 10 2026DSM 68 2027Storage 235 2025Storage 100 2026Storage 235 2027Solar 250 2026Wind 200 2026Total 1020
EXISTING FLEET ANALYSIS
Notes Portfolios were optimized against winter reserve margin constraints (94) followed by summer to ensure compliance with bothA maximum net energy sales limit of 30 during the fleet transition (2023-2026) falling to 25 in 2030+ was also enforcedWind outside LRZ6 was not included in optimization analysis given lack of capacity deliverabil ity to LRZ6 and significant congestion risk
P420262027
2024202620242025
2026
2027
^ P23 have 100 MW of solar P4 has 200 MW
20
NIPSCO | NIPSCOcom |
Portfolio Transition Target
15 Coal through 2032
15 Coal through 2028
15 Coal through 2026
15 Coal through 2024
15 Coal through 2028
15 Coal through 2026
15 Coal through 2028
Fossil Free by 2032
15 Coal through 2028
Option for Fossil Free by 2032
Retire MC 12 (2032)Schfr 16AB (2028)
MC 12 (2028)Schfr 16AB (2028)
MC 12 (2026)Schfr 16AB (2028)
MC 12 (2024)Schfr 16AB (2028)
MC 12 (2028)Schfr 16 AB (2025)
MC 12 (2026)Schfr 16AB (2025)
MC 12 (2028)Schfr 16AB (2025)
SC (2032)
MC 12 (2028)Schfr 16AB (2025)
SC to H2 (2032)
Retain beyond 2032 Sugar Creek Sugar Creek Sugar Creek Sugar Creek Sugar Creek Sugar Creek None Sugar Creek converts to H2 (2032)
Rank (1=Least Cost) 5 3 1 2 6 4 8 7
Delta from LeastCost
$35M03
$16M02 - $10M
01$47M05
$24M02
$417M41
$357M35
RECAP EXISTING FLEET ANALYSIS - DETERMINISTIC COST TO CUSTOMERSRESULTS
Observations
bull The difference in NPVRR from the highest cost to lowest cost portfolio is approximately $430 million
bull Consistent with NIPSCOrsquos prior IRP findings early retirement of coal is generally cost effective for customers although the difference in cost across several portfolios is small since much of the remaining portfolio is fixed and small changes in retirement dates are now being assessed
bull Retaining Units 16AB until 2028 may be cost effective given the portfoliorsquos capacity needs However this is contingent on the operational condition of these older vintage units and the cost impacts of earlier retirement are less than 1 in NPVRR
Net Present Value of Revenue Requirement(2021-2050 $M)
1
$10149 $10130 $10114 $10125 $10161 $10138$10531 $10471
2 3 5 6 7 7H
EXISTING FLEET ANALYSIS
4
Not a viable pathway due to implementation timing
21
NIPSCO | NIPSCOcom |
RECAP EXISTING FLEET ANALYSIS - SCENARIO RESULTS
Econ-Wide Decarbonization
Portfolio Transition Target
15 Coal through 2032
15 Coal through 2028
15 Coal through 2026
15 Coal through 2024
15 Coal through 2028
15 Coal through 2026
15 Coal through 2028
Fossil Free by 2032
15 Coal through 2028 Option forFossil Free by
2032
Retire MC 12 (2032)Schfr 16AB (2028)
MC 12 (2028)Schfr 16AB (2028)
MC 12 (2026)Schfr 16AB (2028)
MC 12 (2024)Schfr 16AB (2028)
MC 12 (2028)Schfr 16 AB
(2025)
MC 12 (2026)Schfr 16AB (2025)
MC 12 (2028)Schfr 16AB (2025)
SC (2032)
MC 12 (2028)Schfr 16AB (2025)
SC to H2 (2032)
Retain beyond 2032 Sugar Creek Sugar Creek Sugar Creek Sugar Creek Sugar Creek Sugar Creek None
Sugar Creek converts to H2
(2032)Delta from Lowest $35 $16 - $10 $47 $24 $417 $357Cost to Customer 03 02 - 01 05 02 41 35
Delta from Lowest $36 $18 $2 - $49 $108 $720 $492Cost to Customer 04 02 00 - 05 12 78 54
Delta from Lowest $336 $269 $259 $277 $292 $157 - $303Cost to Customer 31 25 24 25 27 14 - 28
Delta from Lowest $477 $454 $449 $459 $478 $276 - $29Cost to Customer 41 39 39 40 42 24 - 03
Reference Case
Status Quo Extended
Aggressive Env Reg
8500
9000
9500
10000
10500
11000
11500
12000
12500
13000
NP
VR
R($
mill
ions
)
1 2 3 5 6 7 7H
Observations
bull MC12 retirement in 2026 has a small cost benefit (lt$20M) relative to retirement in 2028 across all scenarios
bull MC 12 retirement in 2032 is always higher cost than earlier retirement with the largest difference in the AER scenario (high carbon price)
bull Portfolio 2 is slightly lower cost than Portfolio 5 although additional renewable additions with early 16AB retirement (Portfolio 6) lower costs under high carbon regulation scenarios
bull Portfolios 7 and 7H have the smallest range as their future renewable hydrogen and storage investments hedge against high-cost power market outcomes
EXISTING FLEET ANALYSIS
Note that a $050kg H2 subsidy is assumed in AER and EWD
4
Reference Case
Status Quo Extended (SQE)
Aggressive Environmental Regulation (AER)
Economy-Wide Decarbonization (EWD)
Not a viable pathway due to implementation timing 22
NIPSCO | NIPSCOcom |
RECAP EXISTING FLEET ANALYSIS SCORECARD
23
Objective Indicator Description and Metrics
Affordability Cost to Customer
bull Impact to customer billsbull Metric 30-year NPV of revenue requirement
(Reference Case scenario deterministic results)
Rate Stability
Cost Certainty
bull Certainty that revenue requirement within the most likely range of outcomes
bull Metric Scenario range NPVRR
Cost Risk bull Risk of unacceptable high-cost outcomesbull Metric Highest scenario NPVRR
Lower Cost Opportunity
bull Potential for lower cost outcomesbull Metric Lowest scenario NPVRR
Environmental Sustainability
Carbon Emissions
bull Carbon intensity of portfoliobull Metric Cumulative carbon emissions (2024-40
short tons of CO2) from the generation portfolio
Reliable Flexible and Resilient Supply
Reliabilitybull To be addressed in Replacement Analysis stage
Resource Optionality
Positive Social amp Economic Impacts
Employeesbull Net impact on NiSource jobsbull Metric Approx number of permanent NiSource jobs
associated with generation
Local Economy
bull Net effect on the local economy (relative to 2018 IRP) from new projects and ongoing property taxes
bull Metric NPV of existing fleet property tax relative to 2018 IRP
Additional risk metrics will be included in the Replacement Analysis when broader set of resource types are evaluated
Key Points
bull Two closely related but distinct scorecards are used for the Existing Fleet Analysis and the Replacement Analysis
bull The Existing Fleet Analysis focuses on scenario costs carbon emissions and impact on NIPSCO employees and the local economy
bull The Replacement Analysis expands the risk assessment to include a stochastic assessment and introduces reliability metrics to assess a broader range of future resource options
EXISTING FLEET ANALYSIS
NIPSCO | NIPSCOcom |
RECAP EXISTING FLEET ANALYSIS SCORECARD
24
1 2 3 4 5 6 7 7H
Not a viable pathway due to implementation timing
Adding replacement projects could have an impact on net jobs
Portfolio Transition Target
15 Coal through 2032
15 Coal through 2028
15 Coal through 2026
15 Coal through 2024
15 Coal through 2028
15 Coal through 2026
15 Coal through 2028
Fossil Free by 2032
15 Coal through 2028
Fossil Free by 2032
Retire MC 12 (2032)Schfr 16AB (2028)
MC 12 (2028)Schfr 16AB (2028)
MC 12 (2026)Schfr 16AB (2028)
MC 12 (2024)Schfr 16AB (2028)
MC 12 (2028)Schfr 16 AB (2025)
MC 12 (2026)Schfr 16AB (2025)
MC 12 (2028)Schfr 16AB (2025)
SC (2032)
MC 12 (2028)Schfr 16AB (2025)
SC to H2 (2032)
Retain beyond 2032 Sugar Creek Sugar Creek Sugar Creek Sugar Creek Sugar Creek Sugar Creek None Sugar Creek converts to H2 (2032)
Cost To Customer30-year NPV of revenue requirement (Ref Case)
$10149 $10130 $10114 $10125 $10161 $10138 $10531 $10471+$35 +$16 - $10 +$47 +$24 +$417 +$35703 02 - 01 05 02 41 35
Cost CertaintyScenario Range (NPVRR)
$2759 $2754 $2766 $2777 $2747 $2487 $1598 $1855+$1161 +$1156 +$1167 +$1179 +$1149 +$889 - +$257726 723 730 738 719 556 - 161
Cost RiskHighest Scenario NPVRR
$11974 $11951 $11947 $11957 $11976 $11773 $11498 $11527+$477 $454 +$449 +$459 +$478 +$276 - +$2941 39 39 40 42 24 - 03
Lower Cost Opportunity
Lowest Scenario NPVRR
$9215 $9197 $9181 $9179 $9229 $9287 $9899 $9671+$36 +$18 +$2 - +$49 +$108 +$720 +$49204 02 00 - 05 12 78 53
Carbon EmissionsM of tons 2024-40 Cum
(Scenario Avg)
433 337 285 230 337 285 214 309+22 +12 +7 +2 +12 +7 - +9
102 57 33 8 57 33 - 44
EmployeesApprox existing gen jobs compared to 2018 IRP
+127 0 -127 -127 -4 -131 -34 -4
Local EconomyNPV of existing fleet property
tax relative to 2018 IRP+$13 $0 -$10 -$23 $0 -$10 -$16 +$13
EXISTING FLEET ANALYSIS
NIPSCO | NIPSCOcom | NIPSCO | NIPSCOcom |
BREAK
25
NIPSCO | NIPSCOcom | NIPSCO | NIPSCOcom |
Pat Augustine Vice President CRAHisham Othman VP Transmission and Regulatory Consulting Quanta Technology LLC
REPLACEMENT ANALYSIS REVIEW
26
NIPSCO | NIPSCOcom |
bull The IRP analysis is performed in two phases the first phase examines current and future resource additions to evaluate timing of retirement for existing units
bull Insight and conclusions from existing fleet analysis inform replacement concepts to evaluate Once a preferred existing portfolio is established future replacements are evaluated across a range of objectives
RECAP ANALYTICAL FRAMEWORK
27
Existing Fleet Analysis Replacement Analysis
Core Questions
How does the cost to keep a unit compare to the cost to replace with economically optimized resourcesIs the portfolio flexible and adaptable to address changes in market rules and energy policy
What are the replacement resource portfolio options How do different replacement themes compare with regard to cost risk environmental sustainability and reliability
Actual projects available to NIPSCO Actual projects available to NIPSCO
Key Decision What units should retire and when What new resources should be added to meet customersrsquo needs
All-Source RFP
REPLACEMENT ANALYSIS
NIPSCO | NIPSCOcom |
RECAP REPLACEMENT ANALYSIS PORTFOLIOS HAVE BEEN DEVELOPED ACROSS NINE CONCEPTSThe concepts are informed by the IRP themes findings from the Existing Fleet Analysis and additional optimization testing
DispatchabilityCurrent Planning Reserve Margin
Winter amp Summer Reserve Margin
Enhanced Reserve Margin (Local w Higher Energy Duration)
Emis
sion
s
Higher CarbonEmissions
Thermal PPAs solar and storage
Non-service territory gas peaking (no early storage) Natural gas dominant (CC)
Mid Carbon Emissions
No new thermal resources solar dominant w storage
Thermal PPAs plus storage and solar
Local gas peaker plus solar and storage
Low Carbon Emissions
Solar dominant w storage plus retire Sugar Creek
All renewables and storage plus retire Sugar Creek (Portfolio 7)
New H2-enabled peaker plus solar and storage plus SC conversion to H2 (Portfolio 7H)
Sugar Creek Retires or converts to H2
Net Zero Concepts
A B C
D E F
G H I
REPLACEMENT ANALYSIS
Sugar Creek is retained through modeling
horizon
bull For the Replacement Analysis Portfolio 3 from the Existing Fleet analysis has been used to assess portfolio selection under the earliest possible retirement of MC12 Note that Portfolio 2 would have similar results with small changes in resource addition timing This approach does not imply that NIPSCO has determined a specific MC12 retirement date
bull Resource combinations are constructed based on RFP projects (tranches) and other opportunities to explore a range of emissions profiles and dispatchability under current and proposed market rules
28
NIPSCO | NIPSCOcom |
bull Several resource additions are common across all themes when allowed RampC DSM programs Thermal PPAs attractive NIPSCO DER SC uprate
bull A range of solar storage gas wind and hydrogen-enabled resources are incorporated across portfolios
RECAP ICAP ADDITIONSndash RFP PROJECTS AND OTHER NEAR-TERM OPPORTUNITIES
29
Dispatchability
Current Planning Reserve Margin
Winter amp Summer Reserve Margin
Enhanced Reserve Margin (Local w Higher Energy Duration)
Emis
sion
s
Higher CarbonEmissions
NIPSCO DER 10MWSC Uprate 53MWThermal PPA 150MWStorage 135MWSolar+Storage 450MWSolar 250MW
NIPSCO DER 10MWSC Uprate 53MWGas Peaker 443MWThermal PPA 150MWSolar 250MW
NIPSCO DER 10MWSC Uprate 53MWGas CC 650MW
Portfolio violates normal net long energy sales constraints enforced in optimization
Mid Carbon Emissions
NIPSCO DER 10MWSC Uprate 53MWStorage 135MWSolar+Storage 450MWSolar 400MW
NIPSCO DER 10MWSC Uprate 53MWThermal PPA 150MWStorage 470MWSolar 250MW
NIPSCO DER 10MWSC Uprate 53MWGas Peaker 300MWThermal PPA 150MWStorage 135MWSolar 100MW
Low Carbon Emissions
NIPSCO DER 10MWStorage 135MWSolar+Storage 450MWSolar 450MW
NIPSCO DER 10MWWind 200MWStorage 570MWSolar 250MW
NIPSCO DER 10MWSC H2 Electrolyzer 20MWSC Uprate 53MWH2 Enabled Peaker 193MWWind 200MWStorage 370MWSolar 250MW
Sugar Creek Retires or converts to H2
Net Zero Concepts
A B C
D E F
G H I
Note ResidentialCommercial DSM universally selected across portfolios Represents 300 MW of solar and 150 MW of storageGas peaker in Portfolio B represents an out-of-service territory PPA Gas peaker in Portfolio F represents asset sale proposal
ICAP Additions through 2027 Planning Year
REPLACEMENT ANALYSIS
Sugar Creek is retained through modeling
horizon
NIPSCO | NIPSCOcom |
Replacement Theme
Thermal PPAssolar and storage
Non-serv ice territory gas
peaking (no early storage)
Natural gas dominant (CC)
No new thermal resources solar
dominant w storage
Thermal PPAs plus storage and
solar
Local gas peaker plus solar and
storage
Solar dominant w storage plus
retire Sugar Creek
All renewables and storage plus retire Sugar Creek
(Portfolio 7)
New H2-enabled peaker plus solar and storage plus SC conv ersion to H2 (Portfolio 7H)
Carbon Emissions Higher Higher Higher Mid Mid Mid Low Low Low
Dispatchability Current Planning Reserv e Margin
Winter amp SummerReserv eMargin
Enhanced Reserve Margin (Local w Higher
Energy Duration)
Current Planning Reserv e Margin
Winter amp SummerReserv eMargin
Enhanced Reserve Margin (Local w Higher
Energy Duration)
Current Planning Reserv e Margin
Winter amp SummerReserv eMargin
Enhanced Reserve Margin (Local w Higher
Energy Duration)
Rank (1=Least Cost) 5 2 1 4 6 3 8 9 7
Delta from LeastCost
$14914
$2002 - $126
12$15515
$11411
$73071
$77875
$48047
RECAP RESULTS - COST TO CUSTOMER REFERENCE CASE
Observations
bull Portfolios A through F are all within ~$150 million NVPRR
bull Portfolios A and D (solar dominant that only meet summer RM) are not tenable options given potential market rule changes
bull Portfolio C develops a very net long position and is higher cost than several alternatives over a 20-year period as economics are driven by long-term ldquomerchantrdquo margins
bull Portfolios with significant storage (E in particular) have potential value in ancillary services markets
bull Portfolios G H and I (net zero concepts) are higher cost with Portfolio I retaining the optionality to burn natural gas at Sugar Creek under Reference Case conditions
Net Present Value of Revenue Requirement(2021-2050 $M)
A
$10461 $10332 $10312 $10438 $10467 $10426
$11042 $11090$10792
B C D E F
REPLACEMENT ANALYSIS
G H I
Not a viable pathway due to not meeting winter planning reserve margins
Sugar Creek continues to operate
Sugar Creek retiresconverts in 2032
30
NIPSCO | NIPSCOcom |
RECAP REPLACEMENT ANALYSIS SCENARIO RESULTS
31
REPLACEMENT ANALYSIS
Econ-Wide Decarb
Carbon Emissions Higher Higher Higher Mid Mid Mid Low Low Low
Dispatchability Current Planning Reserv e Margin
Winter amp SummerReserv eMargin
Enhanced Reserve Margin (Local w Higher Energy
Duration)
Current Planning Reserv e Margin
Winter amp SummerReserv eMargin
Enhanced Reserve Margin (Local w Higher Energy
Duration)
Current Planning Reserv e Margin
Winter amp SummerReserv eMargin
Enhanced Reserve Margin (Local w Higher Energy
Duration)
Delta from Lowest $149 $20 - $126 $155 $114 $730 $778 $480Cost to Customer 14 02 - 12 15 11 71 75 47
Delta from Lowest $347 $91 - $334 $278 $186 $1176 $1149 $624Cost to Customer 37 10 - 36 30 20 126 123 67
Delta from Lowest $18 $106 $299 - $35 $151 $235 $144 $212Cost to Customer 02 09 26 - 03 13 21 13 19
Delta from Lowest $207 $373 $709 $156 $317 $434 - $202 $39Cost to Customer 17 32 60 13 27 37 - 17 03
Reference Case
Status Quo Extended
Aggressive Env Reg
8500
9000
9500
10000
10500
11000
11500
12000
12500
13000
30-Y
ear
NP
VR
R($
mill
ions
)
A B C E F G I
Observations
bull Portfolios B C and F have lowest costs among viable options under the Reference and SQE scenarios
bull Portfolio E has the lowest cost among viable portfolios under the AER scenario with C highest cost and HI more competitive
bull Emission free resources (clean energy) have the most value in the EWD scenario with Portfolio I (assuming a future H2 subsidy) having the lowest cost among viable portfolios
Note that a $050kg H2 subsidy is assumed in AER and EWD
D
Not a viable pathway due to not meeting winter planning reserve margins
H
Economy-Wide Decarbonization (EWD)
Reference Case
Status Quo Extended (SQE)
Aggressive Environmental Regulation (AER)
NIPSCO | NIPSCOcom |
A B C D E F G H I (80) (60) (40) (20)
- 20 40 60 80
100 120
Replacement Theme
Thermal PPAssolar and storage
Non-serv ice territory gas
peaking (no early storage)
Natural gas dominant (CC)
No new thermal resources solar
dominant w storage
Thermal PPAs plus storage and
solar
Local gas peaker plus solar and
storage
Solar dominant w storage plus
retire Sugar Creek
All renewables and storage plus retire Sugar Creek
(Portfolio 7)
New H2-enabled peaker plus solar and storage plus SC conv ersion to H2 (Portfolio 7H)
Carbon Emissions Higher Higher Higher Mid Mid Mid Low Low Low
Dispatchability Current Planning Reserv e Margin
Winter amp SummerReserv eMargin
Enhanced Reserve Margin (Local w Higher
Energy Duration)
Current Planning Reserv e Margin
Winter amp SummerReserv eMargin
Enhanced Reserve Margin (Local w Higher
Energy Duration)
Current Planning Reserv e Margin
Winter amp SummerReserv eMargin
Enhanced Reserve Margin (Local w Higher
Energy Duration)
95th CVARDelta from Low 21 9 - 21 15 14 40 31 4
75th Delta from Low 8 6 - 8 6 6 9 7 9
5th Delta from Low 13 15 22 12 17 18 - 4 11
RECAP RESULTS - STOCHASTIC ANALYSIS
Observations
bull The stochastic analysis evaluates short-term volatility in commodity prices (natural gas and power) and hourly renewable (solar and wind) output
bull The overall magnitude of cost distributions across portfolios is narrower than the scenario range suggesting that stochastic risk for these portfolio options is less impactful than the major policy or market shifts evaluated across scenarios
bull Over the 30-year time horizon dispatchability serves to mitigate tail risk as portfolios that retain SC or add gas (including with hydrogen enablement) or storage capacity perform best at minimizing upside risk
bull The lowest downside range is observed in renewable-dominant portfolios
Net Present Value of Revenue Requirement ndash Delta to Median Value(2021-2050 $M)
A B C D E F
32
G H I
CVAR ndash Avg of observations above 95th
95th
50th
25th
5th
75th
REPLACEMENT ANALYSIS
NIPSCO | NIPSCOcom |
RECAP IN PREVIOUS SCORECARD RELIABILITY INDICATORS WERE UNDER DEVELOPMENT
33
Objective Indicator Description and Metrics
Affordability Cost to Customer
bull Impact to customer billsbull Metric 30-year NPV of revenue requirement (Reference Case scenario
deterministic results)
Rate Stability
Cost Certainty
bull Certainty that revenue requirement within the most likely range of outcomes
bull Metric Scenario range NPVRR and 75th range vs median
Cost Riskbull Risk of unacceptable high-cost outcomesbull Metric Highest scenario NPVRR and 95th conditional value at risk
(average of all outcomes above 95th vs median)Lower Cost Opportunity
bull Potential for lower cost outcomesbull Metric Lowest scenario NPVRR and 5th range vs median
Environmental Sustainability
Carbon Emissions
bull Carbon intensity of portfoliobull Metric Cumulative carbon emissions (2024-40 short tons of CO2) from the
generation portfolio
Reliable Flexible and Resilient Supply
Reliabilitybull The ability of the portfolio to provide reliable and flexible supply for
NIPSCO in light of evolving market conditions and rulesbull Metric Sub-hourly AS value impact and additional scoring (under
development)
Resource Optionality
bull The ability of the portfolio to flexibly respond to changes in NIPSCO load technology or market rules over time
bull Metric MW weighted duration of generation commitments (UCAP ndash 2027)
Positive Social amp Economic Impacts
Employees bull Addressed in Existing Fleet Analysis for existing generation assets employee numbers will be dependent on specific asset replacements
Local Economy
bull Effect on the local economy from new projects and ongoing property taxesbull Metric NPV of property taxes from the entire portfolio
Key Points
bull The Replacement Analysis scorecard incorporates broader perspectives on risk (stochastic analysis) and reliability than the Existing Fleet Analysis scorecard
bull NIPSCO has completed the qualitative assessment of reliability and has now defined the reliability metrics which will be used in the scorecard (discussed further on following slides)
REPLACEMENT ANALYSIS
NIPSCO | NIPSCOcom |
bull The results presented in September did not include additional reliability considerations that were previously under development
ndash Certain portfolio attributes were evaluated through additional economic analysis
ndash Ohers required a technical but non-economic review
bull NIPSCO held a Technical Webinar on October 12th to review the approach analyses and key outcomes of the additional reliability assessment to provide an open forum for questions and discussion
COMPLETED ANALYSES TO INFORM RELIABILITY INDICATORS
34
RELIABILITY
Economic Assessment Non-Economic Assessment
Analysis PerformedAncillary services analysis (regulation and spinning reserves) with sub-hourly granularity
Qualitative reliability assessment performed by third-party expert Quanta Technology
Scorecard Metric Sub-hourly energy and ancillary services value impact Composite Reliability Assessment Score
NIPSCO | NIPSCOcom |
bull While most of NIPSCOrsquos existing portfolio (including new renewables) realize nearly all value from energy and capacity contributions highly flexible resources that do not provide a lot of energy to the portfolio may still provide value in the form of ancillary services and in their ability to respond to changing market conditions in real time at sub-hourly granularity
ndash The MISO market currently operates markets for spinning reserves and regulation
ndash FERC Order 841 also requires ISOs to redesign markets to accommodate energy storage
bull Long-term market developments are uncertain and fundamental evaluation of sub-hourly ancillary services markets is challenging but the 2021 IRP has performed an analysis incorporating
ndash 5-minute granularity for energy and ancillary services based on historical data observations and future energy market scenario projections
ndash Operational parameters for various storage and gas peaking options
ndash Incremental value above and beyond what is picked up in the Aurora-based hourly energy dispatch is assessed and summarized on a portfolio level
SUB-HOURLY ENERGY AND ANCILLARY SERVICES EVALUATION
35
RELIABILITY
NIPSCO | NIPSCOcom |
RANGE OF ADDITIONAL VALUE OPPORTUNITY (NPVRR COST REDUCTION) BY PORTFOLIO
36
-
100
200
300
400
500
600
700
800
900Range
AERRefEWDSQE
Replacement Theme
Thermal PPAssolar and storage
Non-serv ice territory gas
peaking (no early storage)
Natural gas dominant (CC)
No new thermal resources solar
dominant w storage
Thermal PPAs plus storage and
solar
Local gas peaker plus solar and
storage
Solar dominant w storage plus
retire Sugar Creek
All renewables and storage plus retire Sugar Creek
(Portfolio 7)
New H2-enabled peaker plus solar and storage plus SC conv ersion to H2 (Portfolio 7H)
Carbon Emissions Higher Higher Higher Mid Mid Mid Low Low Low
Dispatchability Current Planning Reserv e Margin
Winter amp SummerReserv eMargin
Enhanced Reserve Margin (Local w Higher
Energy Duration)
Current Planning Reserv e Margin
Winter amp SummerReserv eMargin
Enhanced Reserve Margin (Local w Higher
Energy Duration)
Current Planning Reserv e Margin
Winter amp SummerReserv eMargin
Enhanced Reserve Margin (Local w Higher
Energy Duration)
A B C D E F G H I
Observations
bull Additional value is uncertain and dependent on market rules evolution MISO generation mix changes and market participant behavior
bull Portfolios with the largest amounts of storage (E and H) have the greatest potential to lower NPVRR by capturing flexibility value that may manifest in the sub-hourly energy and ancillary services markets
bull A wide range of value is possible with higher prices and price spreads in the AER scenario driving higher estimates
bull Results are incorporated into the final replacement analysis scorecard
Impact on Net Present Value of Revenue Requirement Value(2021-2050 $M)
RELIABILITY
NIPSCO | NIPSCOcom |
RELIABILITY ASSESSMENT GUIDING PRINCIPLES
37
The resources modeled are based on the portfolios constructed for the Replacement Analysis
Analysis incorporates planned transmission projectsTransmission
Upgrades
ResourcesModeled Goal
bull Understand potential reliability implications of potential resource additions to the NIPSCO portfolio
bull Understand the range of potential mitigations required associated with different replacement portfolio strategies The analysis is conducted at a planning level and
therefore further evaluation and granular studies will be required in the future
Individual resources from the 9 replacement portfolios are assessed based on the established reliability criteria The score of the individual resources drive the portfolio score
Evaluation
Resources are evaluated in 2030 after the Michigan City Unit 12 retirement
Time Period
RELIABILITY
NIPSCO | NIPSCOcom |
Stakeholders offered several comments and questions during the Technical Webinar on 1012 TECHNICAL WEBINAR STAKEHOLDER FEEDBACK
38
Stakeholder Feedback Summary NIPSCO Response
Indiana Office of Utility Consumer Counselor (OUCC)
bull Consider evaluating ldquoenergy inflows and outflowsrdquo by hour rather than constraining NIPSCOrsquos system to be islanded
bull This has been evaluated as part of the core IRP economic modeling and analysis including stochastic analysis
bull Under normal operating conditions NIPSCO is constantly selling and buying energy to and from the market so this exposure is economic and less about physical transmission limitations
bull The analysis concluded that over the long-term portfolios with more dispatchable gas or storage are less susceptible to market risk than those dominated by renewables
bull The reliability assessment has focused separately on energy adequacy risks under emergency conditions
Citizens Action Coalition of Indiana (CAC)
bull Consider portfolio evaluation under more representative emergency conditions rather than full islanded conditions This might include simulation of severe weather events (which may be getting more frequent due to climate change) and associated resource availability including renewables and other resources that may be impacted by forced outage or fuel supply unavailability
bull NIPSCOrsquos assessment was intended to evaluate a ldquoworst caserdquo week and not imply islanded operations for the year
bull We have not simulated weather load or forced outage events within the reliability assessment but there may be an opportunity to tie elements of the stochastic analysis that was performed to additional reliability metrics in the future Of particular focus are those that examine tail risk as measured by CVAR in the economic analysis
bull There is an industry trend towards greater focus on generation and transmission resiliency studies that aim to better quantify extreme event risk and we will consider analysis enhancements for future IRPs and further reliability assessment
Note NIPSCO has received other comments from stakeholders and is in the process of reviewing We will strive to incorporate feedback received into the final report
NIPSCO | NIPSCOcom |
RELIABILITY ASSESSMENT AND RANKING
39
Review amp Update Reliability Metrics
Assess NIPSCOrsquos Reliability Needs
Apply a Series of Reliability Filters to
IRP Portfolios
Scoring Criteria
Ranking Portfolios
bull Power Rampingbull Frequency Responsebull Short Circuit Strengthbull Flickerbull Black Start
Preferred Portfolio
Metric 3
Metric 2
Metric 1
RELIABILITY
NIPSCO | NIPSCOcom |
RELIABILITY CRITERIA
40
Criteria Description Rationale
1 BlackstartResource has the abil ity to be started without support from the wider system or is designed to remain energized without connection to the remainder of the system with the ability to energize a bus supply real and reactive power frequency and voltage control
In the event of a black out condition NIPSCO must have a blackstart plan to restore its local electric system The plan can either rely on MISO to energize a cranking path or on internal resources within the NIPSCO service territory
2 Energy DurationResources are able to meet the energy and capacity duration requirements Portfolio resources are able to supply the energy demand of customers during MISOrsquos emergency max gen events and also to supply the energy needs of critical loads during islanded operation events
NIPSCO must have long duration resources to serve the needs of its customers during emergency and islanded operation events
3Dispatchability and
Automatic Generation Control
The unit wil l respond to directives from system operators regarding its status output and timing The unit has the abil ity to be placed on Automatic Generation Control (AGC) allowing its output to be ramped up or down automatically to respond immediately to changes on the system
MISO provides dispatch signals under normal conditions but NIPSCO requires AGC attributes under emergency restoration procedures or other operational considerations
4Operational Flexibility
and Frequency Support
Ability to provide inertial energy reservoir or a sink to stabil ize the system The resource can adjust its output to provide frequency support or stabil ization in response to frequency deviations with a droop of 5 or better
MISO provides market construct under normal conditions but preferable that NIPSCO possess the abil ity to maintain operation during under-frequency conditions in emergencies
5 VAR Support
The resource can be used to deliver VARs out onto the system or absorb excess VARs and so can be used to control system voltage under steady-state and dynamictransient conditions The resource can provide dynamic reactive capability (VARs) even when not producing energy The resource must have Automatic voltage regulation (AVR) capability The resource must have the capability ranging from 085 lagging to 095 leading power factor
NIPSCO must retain resources electrically close to load centers to provide this attribute in accordance with NERC and IEEE Standards
6 Geographic Location Relative to Load
The resource will be located in NIPSCOrsquos footprint (electric Transmission Operator Area) in Northern Indiana near existing NIPSCO 138kV pr 345kV facil ities and is not restricted by fuel infrastructure The resource can be interconnected at 138kV or 345kV Preferred locations are ones that have multiple power evacuationdeliverabil ity paths and are close to major load centers
MISO requires location capacity resources and runs an LMP market to provide locational energy signals under emergency restoration procedures a blackstart plan reliant on external resources would create a significant risk Location provides economic value in the form of reduced losses congestion curtailment risk and address local capacity requirements Additionally from a reliability perspective resources that are interconnected to buses with multiple power evacuation paths and those close to load centers are more resil ient to transmission system outages and provide better assistance in the blackstart restoration process
7 Predictability and Firmness of Supply Ability to predictforecast the output of resources and to counteract forecast errors
Energy is scheduled with MISO in the day-ahead hourly market and in the real-time 5-minute market Deviations from these schedules have financial consequences and thus the abil ity to accurately forecast the output of a resource up to 38 hours ahead of time for the day-ahead market and 30 minutes for the real time market is advantageous
8 Short Circuit Strength Requirement
Ensure the strength of the system to enable the stable integration of all inverter-based resources (IBRs) within a portfolio
The retirement of synchronous generators within NIPSCO footprint and also within MISO and replacements with increasing levels of inverter-based resources will lower the short circuit strength of the system Resources than can operate at lower levels of SCR and those that provide higher short circuit current provide a better future proofing without the need for expensive mitigation measures
RELIABILITY
NIPSCO | NIPSCOcom |
RELIABILITY METRICS
41
Criteria Potential Measurement Approaches Considered
Included in Minimum
Interconnection Requirements
Quanta Analysis to Develop Metric
1 Blackstart bull MWs with black start capability NO bull Blackstart Analysis
2 Energy Duration bull Percentage of NIPSCOrsquos critical load (MW and Time) that can be supplied during emergencies NO bull Energy Adequacy Analysis
3 Dispatchability and Automatic Generation Control
bull MWs on AGCbull Up Range Down Rangebull Ability for Fast Regulationbull Duration of Up Down Regulation
NO (except being on SCADA for monitoring and control)
bull Increase of Regulation Requirements due to IBRs in each Portfolio
bull 10-min Ramp Capability of Portfolio
4 Operational Flexibility and Frequency Support
bull Inertial Response GapSurplusbull Primary Frequency Response GapSurplus NO bull Inertial Repose
bull Primary Response
5 VAR Support bull Continuous VAR output range that can be delivered to load centers YES bull Dynamic VAR deliverability
6 Geographic Location Relative to Load
bull MWs or within NIPSCO footprintbull Firmness of fuel supplies bull MWs with POIs with multiple (2 or higher) secure power evacuation paths
NO bull Topology analysis
7 Predictability and Firmness of Supply
bull Ability to mitigate Forecast Error of intermittent resources using fast ramping capability NO bull Power Ramping and
Forecast Errors
8 Short Circuit Strength Requirement
bull MWs of IBRs potentially impacted by lack of short circuit strengthbull Need for synchronous condensers andor grid forming inverters to ensure
stable system integration
NO 1547 and P2800 do not address
bull Short Circuit Strength Analysis
RELIABILITY
NIPSCO | NIPSCOcom |
PORTFOLIO RELIABILITY METRICSYear 2030 Metric A B C D E F G H I
1 Blackstart Qualitative Assessment of Risk of not Starting 0 0 1 0 1 1 0 1 1
2 Energy Adequacy Energy Not Served when Islanded (Worst 1-week) 76 78 32 75 78 56 74 73 58
28 16 55 27 44 45 26 47 47
58 50 42 63 50 45 65 51 51
Increased Freq Regulation Requirements (MW) 54 41 34 58 41 37 59 46 46
1-min Ramp Capability (MW) 331 196 261 331 666 382 326 761 599
10-min Ramp Capability (MW) 574 439 764 574 909 784 548 983 944
Inertia MVA-s 3218 3218 6729 3218 3218 5116 2931 2931 4397
Inertial Gap FFR MW 155 283 157 160 0 79 171 0 0
Primary Gap PFR MW 259 388 380 260 0 249 261 0 19
5 VAR Support Dynamic VAR to load Center Capability (MVAr) 658 471 457 704 630 555 725 731 719
6 Location Average Number of Evacuation Paths 5 3 NA 5 5 5 5 6 5
7 Predictability and Firmness
Ramping Capability to Mitigate Forecast Errors (+Excess-Deficit) MW
-228 134 -262 -257 161 154 -266 245 238
8 Short Circuit Strength Required Additional Synch Condensers MVA 580 388 0 763 341 0 802 488 257
Dispatchable (CAP unavoidable VER Penetration)
4 Operational Flexibility and Frequency Support
3Dispatchability and Automatic Generation Control
CAP the capacity value of the portfolio including the existing and planned resourcesSolar capacity credit 50 of installed capacity Wind capacity credit 163 (based on MISO published data on system wide capacity credits)
Preliminary
RELIABILITY
42