Embed Size (px)
Citation preview
MassBio.us/Industry-Snapshot
Snapshot Snapshot 2021 Industry
Executive Summary
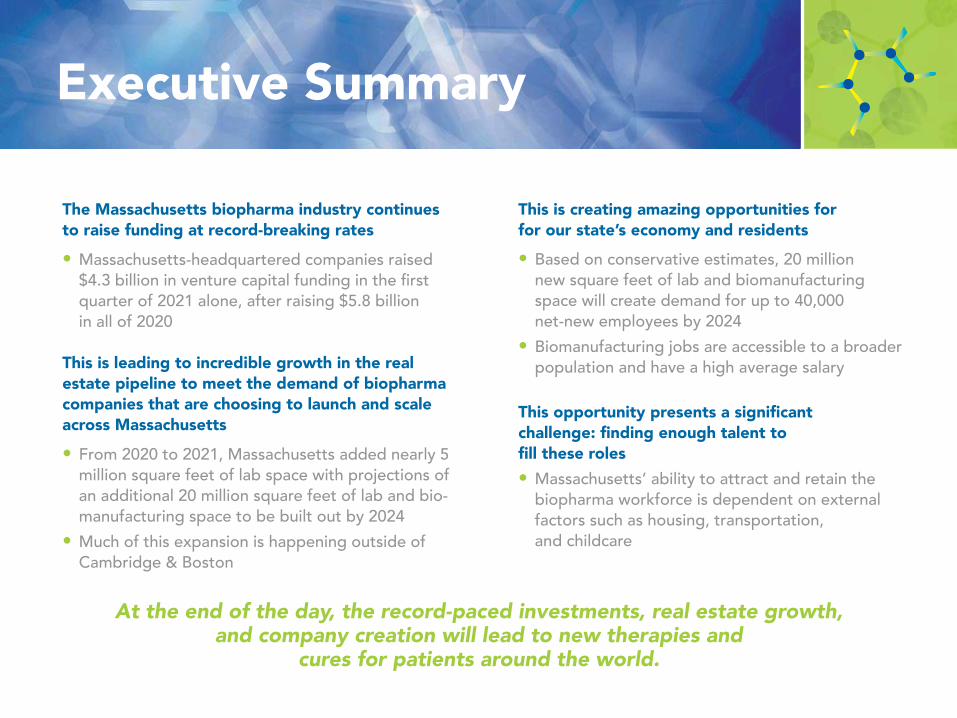
The Massachusetts biopharma industry continues to raise funding at record-breaking rates
• Massachusetts-headquartered companies raised $4.3 billion in venture capital funding in the fi rst quarter of 2021 alone, after raising $5.8 billion in all of 2020
This is leading to incredible growth in the real estate pipeline to meet the demand of biopharma companies that are choosing to launch and scale across Massachusetts
• From 2020 to 2021, Massachusetts added nearly 5 million square feet of lab space with projections of an additional 20 million square feet of lab and bio- manufacturing space to be built out by 2024
• Much of this expansion is happening outside of Cambridge & Boston
This is creating amazing opportunities for for our state’s economy and residents
• Based on conservative estimates, 20 million new square feet of lab and biomanufacturing space will create demand for up to 40,000 net-new employees by 2024
• Biomanufacturing jobs are accessible to a broader population and have a high average salary
This opportunity presents a signifi cant challenge: fi nding enough talent to fi ll these roles• Massachusetts’ ability to attract and retain the biopharma workforce is dependent on external factors such as housing, transportation, and childcare
At the end of the day, the record-paced investments, real estate growth, and company creation will lead to new therapies and
cures for patients around the world.
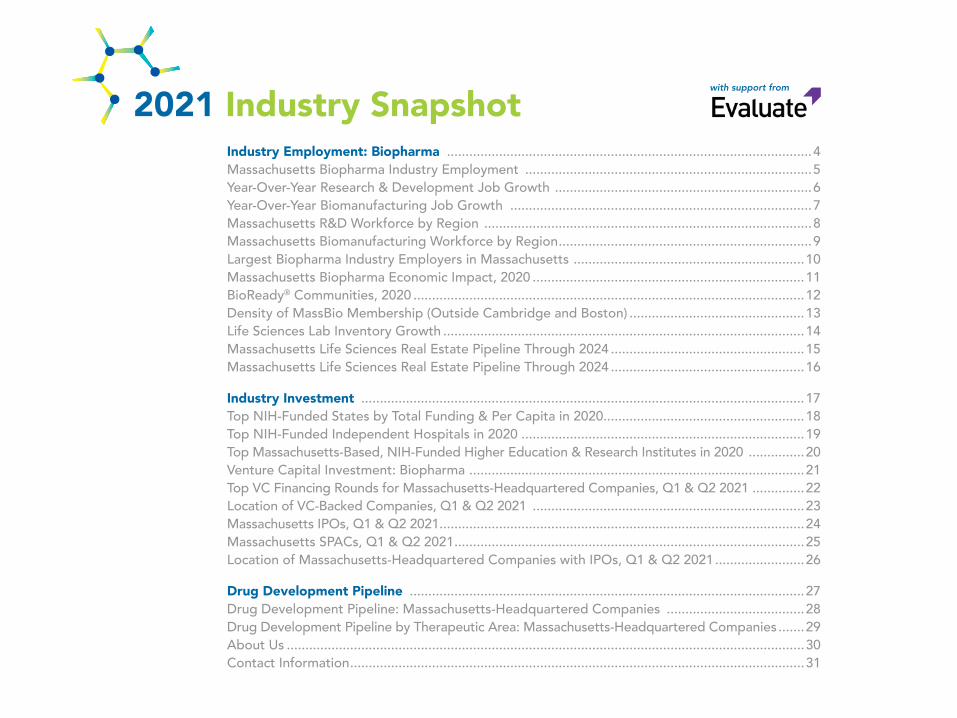
Industry Employment: Biopharma ..................................................................................................4Massachusetts Biopharma Industry Employment .............................................................................5 Year-Over-Year Research & Development Job Growth .....................................................................6Year-Over-Year Biomanufacturing Job Growth .................................................................................7 Massachusetts R&D Workforce by Region ........................................................................................8 Massachusetts Biomanufacturing Workforce by Region ....................................................................9 Largest Biopharma Industry Employers in Massachusetts ..............................................................10Massachusetts Biopharma Economic Impact, 2020 .........................................................................11BioReady® Communities, 2020 .........................................................................................................12Density of MassBio Membership (Outside Cambridge and Boston) ...............................................13Life Sciences Lab Inventory Growth .................................................................................................14Massachusetts Life Sciences Real Estate Pipeline Through 2024 ....................................................15Massachusetts Life Sciences Real Estate Pipeline Through 2024 ....................................................16
Industry Investment .......................................................................................................................17Top NIH-Funded States by Total Funding & Per Capita in 2020......................................................18 Top NIH-Funded Independent Hospitals in 2020 ............................................................................19Top Massachusetts-Based, NIH-Funded Higher Education & Research Institutes in 2020 ...............20Venture Capital Investment: Biopharma ..........................................................................................21Top VC Financing Rounds for Massachusetts-Headquartered Companies, Q1 & Q2 2021 ..............22Location of VC-Backed Companies, Q1 & Q2 2021 .........................................................................23Massachusetts IPOs, Q1 & Q2 2021 ..................................................................................................24Massachusetts SPACs, Q1 & Q2 2021 ..............................................................................................25Location of Massachusetts-Headquartered Companies with IPOs, Q1 & Q2 2021 ........................26
Drug Development Pipeline ..........................................................................................................27Drug Development Pipeline: Massachusetts-Headquartered Companies .....................................28Drug Development Pipeline by Therapeutic Area: Massachusetts-Headquartered Companies .......29About Us ...........................................................................................................................................30Contact Information ..........................................................................................................................31
2021 Industry Snapshotwith support from

Industry EmploymentBiopharma

Industry Employment
Massachusetts BiopharmaIndustry Employment
PAGE 5
In 2020, biopharma employment in Massachusetts grew at 5.5%.
Since the Massachusetts Life Sciences Initiative was passed in 2008, biopharma employment grew by 55%.
Source: Privately owned companies, U.S. Bureau of Labor Statistics, Quarterly Census of Employment and Wages (QCEW)
Industry Employment
Source: Privately owned companies, U.S. Bureau of Labor Statistics, Quarterly Census of Employment and Wages (QCEW)
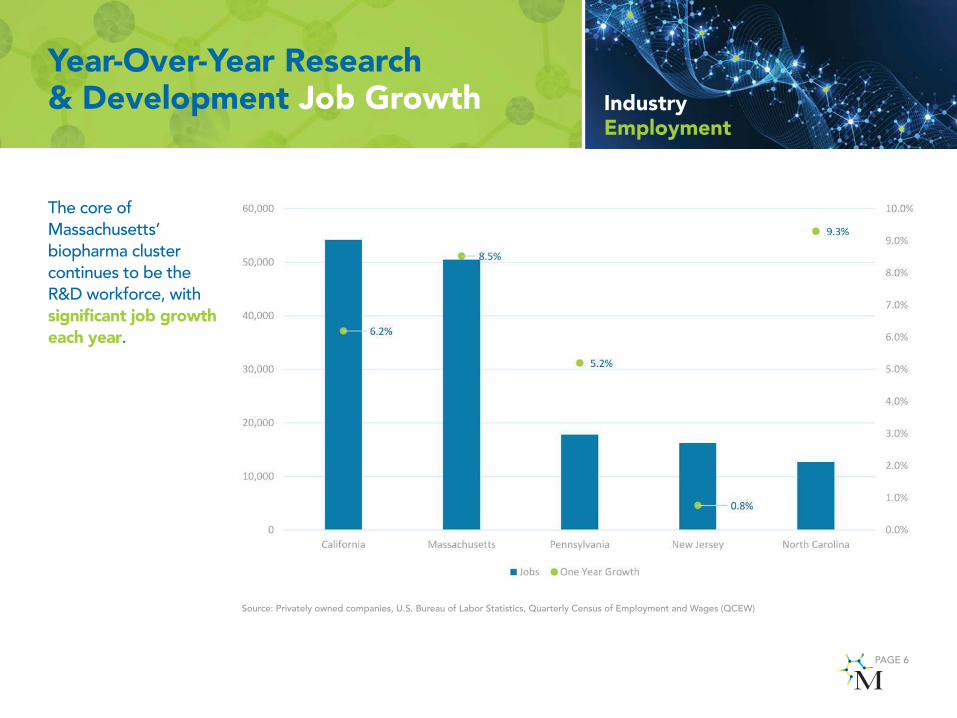
Year-Over-Year Research & Development Job Growth
PAGE 6
The core of Massachusetts’ biopharma cluster continues to be the R&D workforce, with signifi cant job growth each year.
Industry Employment
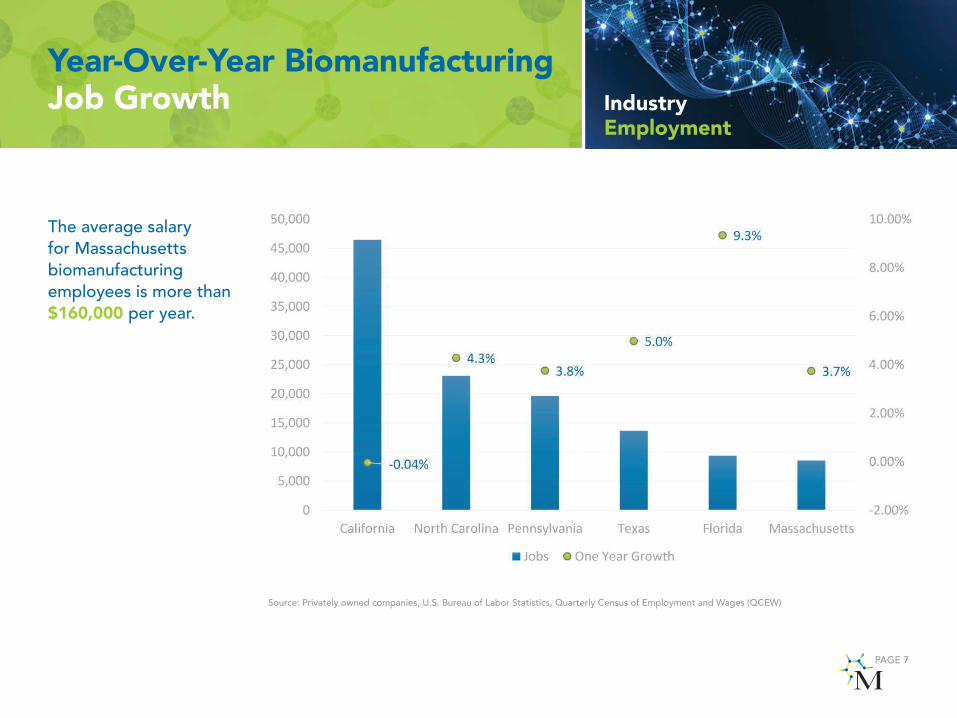
Year-Over-Year Biomanufacturing Job Growth
The average salary for Massachusetts biomanufacturingemployees is more than $160,000 per year.
PAGE 7
Source: Privately owned companies, U.S. Bureau of Labor Statistics, Quarterly Census of Employment and Wages (QCEW)
PAGE 8
Source: Privately owned companies, U.S. Bureau of Labor Statistics, Quarterly Census of Employment and Wages (QCEW)
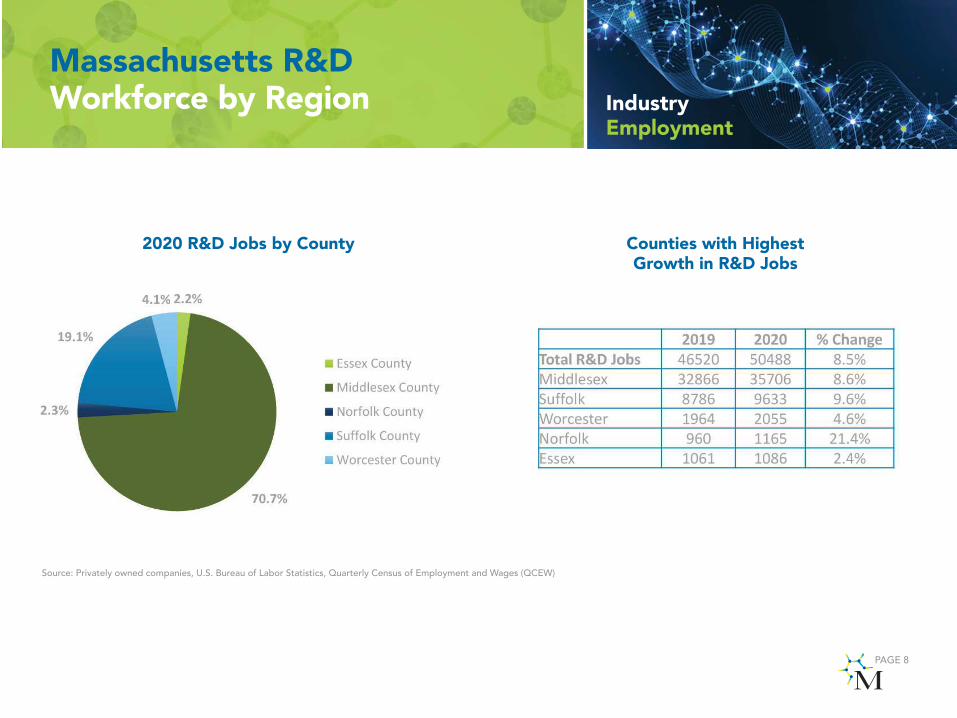
Counties with Highest Growth in R&D Jobs
2020 R&D Jobs by County
Industry Employment
Massachusetts R&D Workforce by Region
Industry Employment
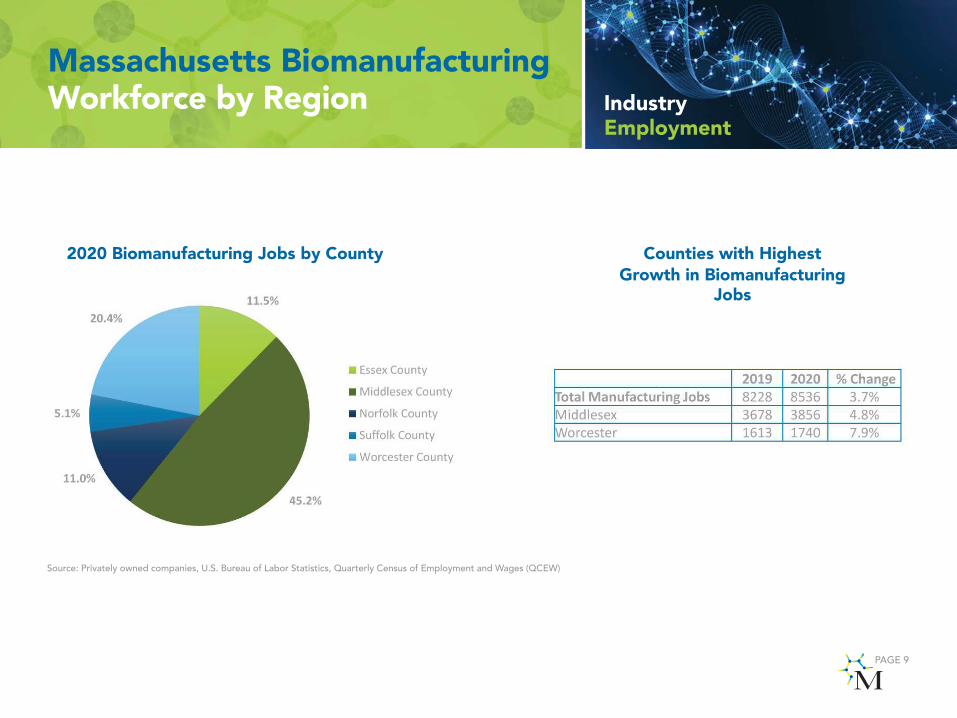
Massachusetts Biomanufacturing Workforce by Region
PAGE 9
Source: Privately owned companies, U.S. Bureau of Labor Statistics, Quarterly Census of Employment and Wages (QCEW)
Counties with Highest Growth in Biomanufacturing
Jobs
2020 Biomanufacturing Jobs by County
Industry Employment
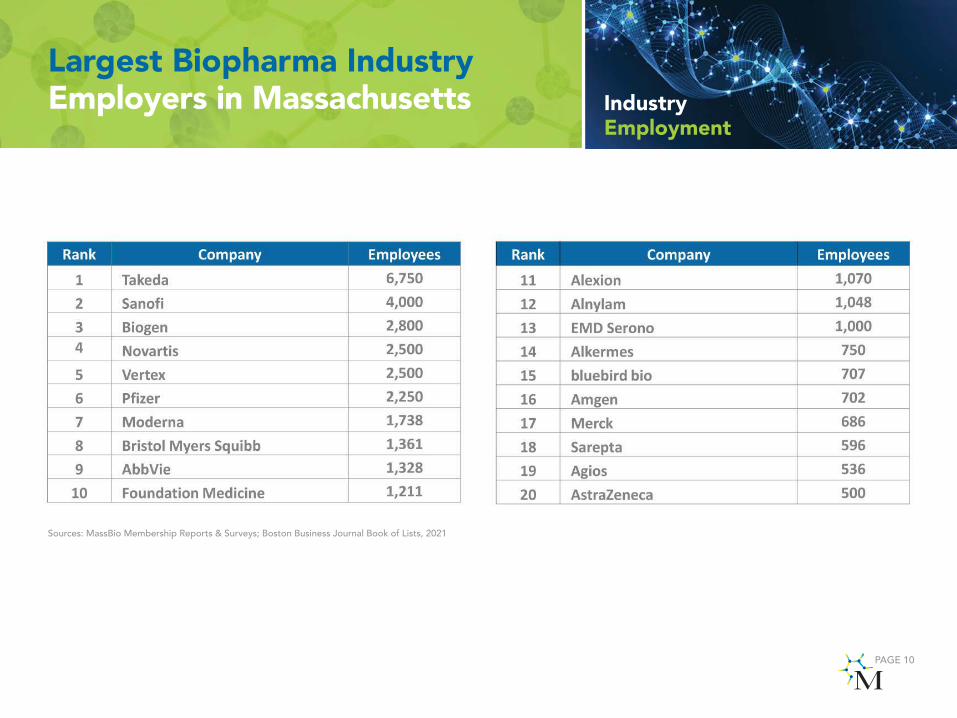
Largest Biopharma Industry Employers in Massachusetts
PAGE 10
Sources: MassBio Membership Reports & Surveys; Boston Business Journal Book of Lists, 2021

Industry Employment
Massachusetts Biopharma Economic Impact, 2020
Source: U.S. Bureau of Labor Statistics, Quarterly Census of Employment and Wages (QCEW)
PAGE 11
Industry Employment
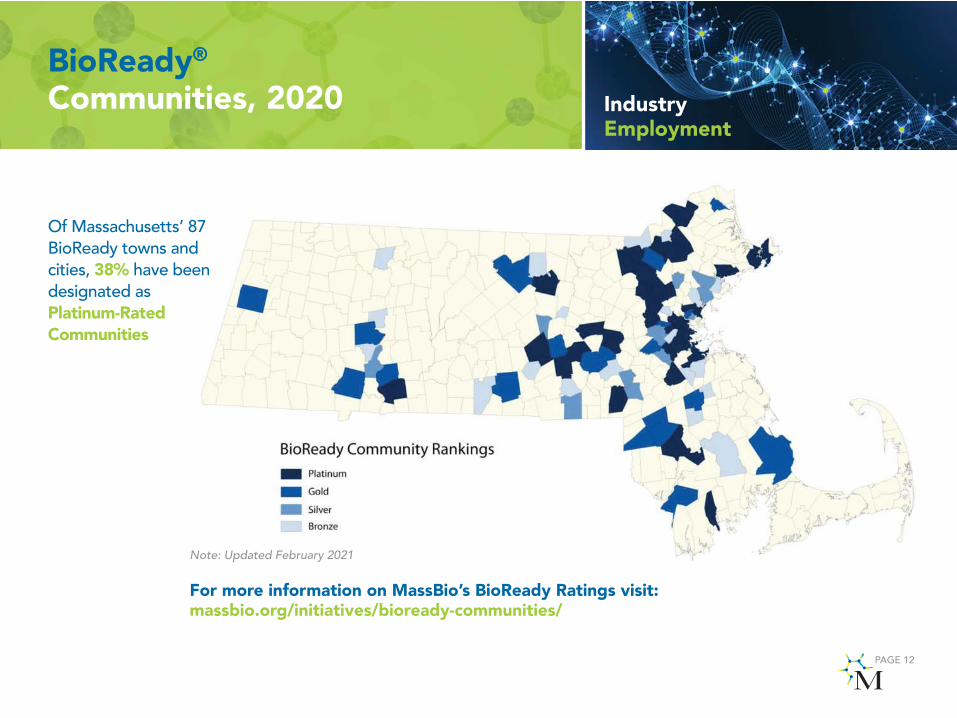
BioReady® Communities, 2020
PAGE 12
Note: Updated February 2021
For more information on MassBio’s BioReady Ratings visit:massbio.org/initiatives/bioready-communities/
Of Massachusetts’ 87 BioReady towns and cities, 38% have been designated as Platinum-Rated Communities
Industry Employment
PAGE 13
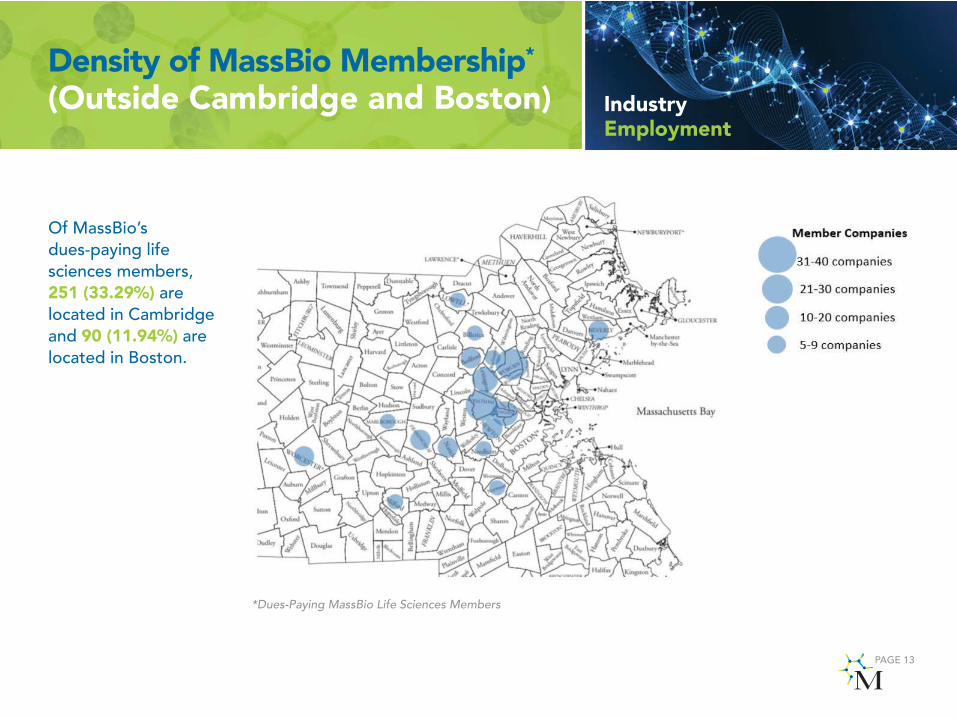
Density of MassBio Membership* (Outside Cambridge and Boston)
Of MassBio’s dues-paying life sciences members, 251 (33.29%) are located in Cambridge and 90 (11.94%) are located in Boston.
*Dues-Paying MassBio Life Sciences Members

Industry Employment
Life Sciences LabInventory Growth
Sources: Colliers and CBRE
PAGE 14
Over 21.6 million square feet of labspace has been built in Massachusetts overthe last 10 years, an increase of 117%. 2011
18.4 millionsquare feet
2020 35.2 millionsquare feet
2021 40.0 millionsquare feet
Industry Employment
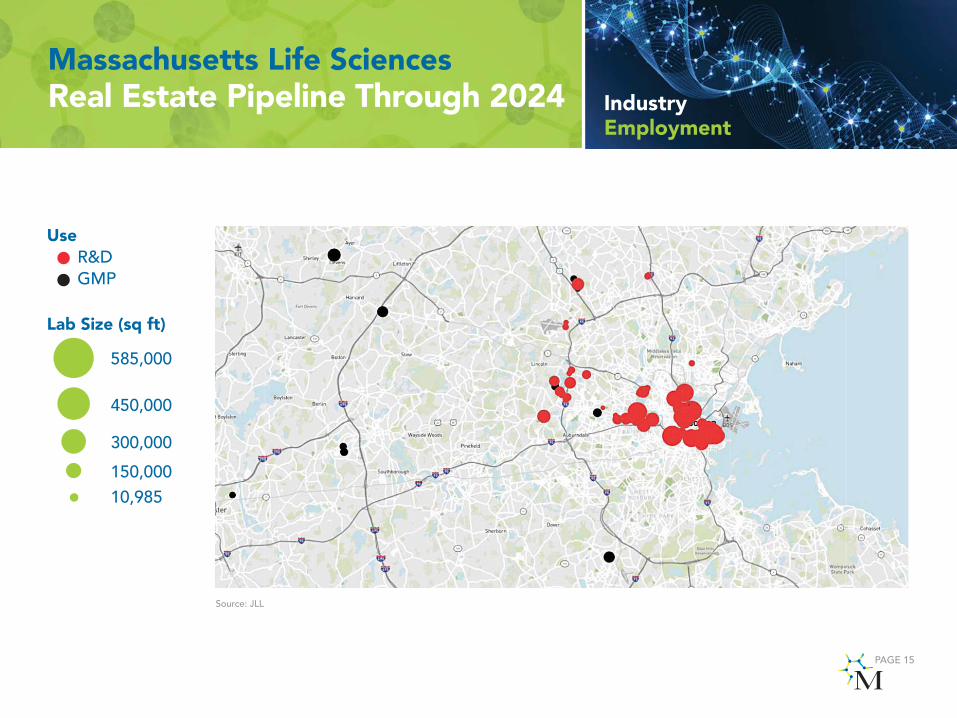
Massachusetts Life SciencesReal Estate Pipeline Through 2024
Source: JLL
PAGE 15
Use R&D GMP
Lab Size (sq ft)
585,000
450,000
300,000
150,000
10,985
Industry Employment
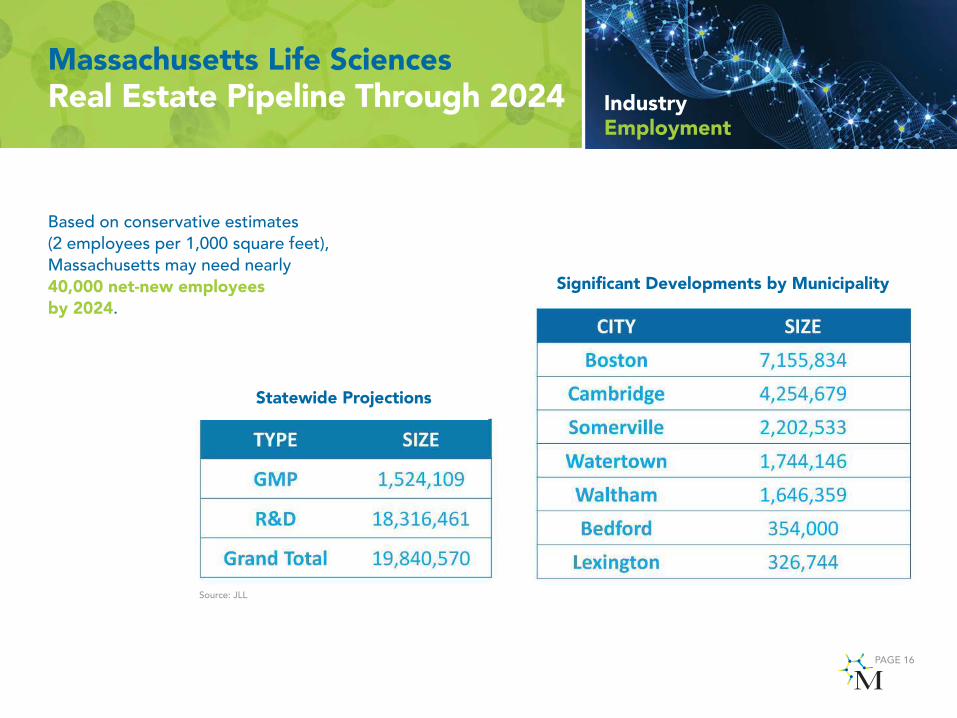
Massachusetts Life SciencesReal Estate Pipeline Through 2024
PAGE 16
Source: JLL
Signifi cant Developments by Municipality
Statewide Projections
Based on conservative estimates (2 employees per 1,000 square feet), Massachusetts may need nearly 40,000 net-new employees by 2024.

Industry Investment
IndustryInvestment
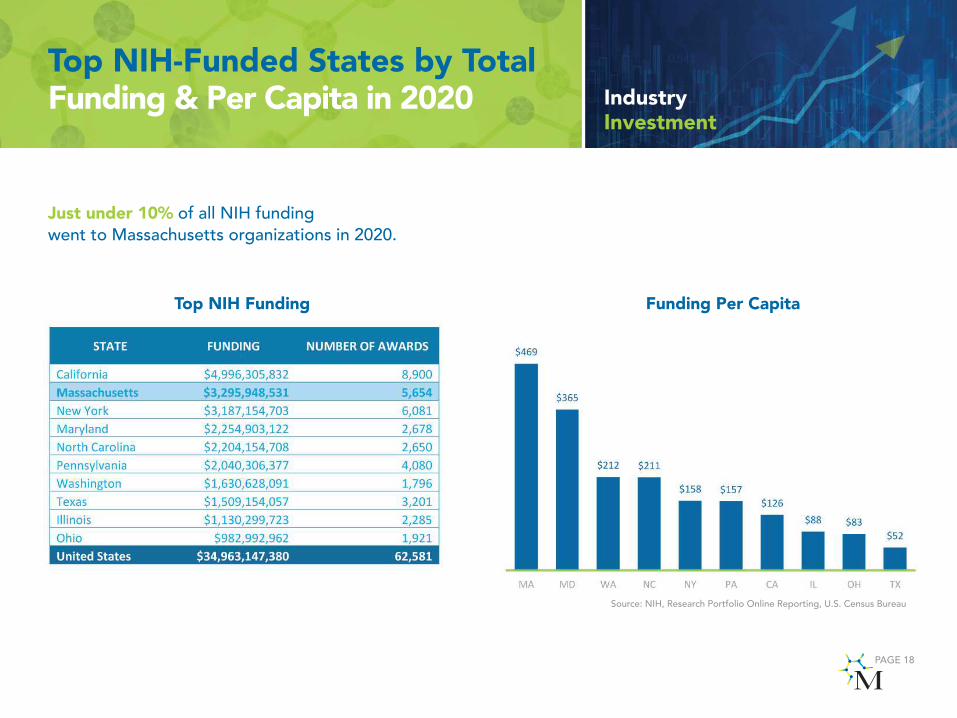
Top NIH-Funded States by TotalFunding & Per Capita in 2020
Just under 10% of all NIH funding went to Massachusetts organizations in 2020.
PAGE 18
Source: NIH, Research Portfolio Online Reporting, U.S. Census Bureau
Top NIH Funding Funding Per Capita
IndustryInvestment
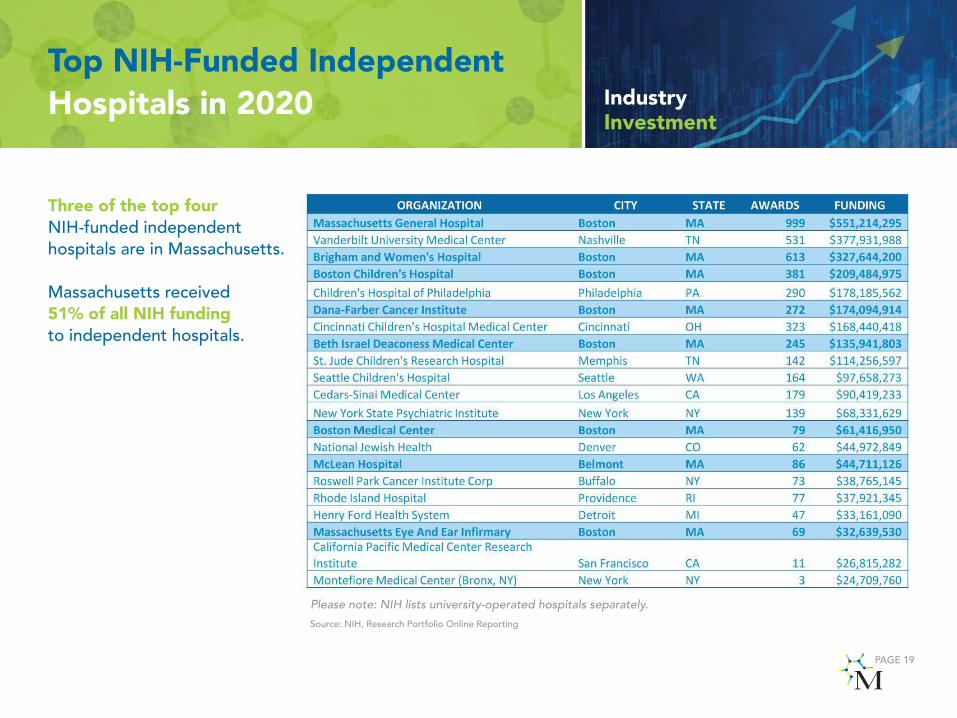
Top NIH-Funded Independent
Hospitals in 2020
Please note: NIH lists university-operated hospitals separately.
Source: NIH, Research Portfolio Online Reporting
PAGE 19
Three of the top fourNIH-funded independent hospitals are in Massachusetts.
Massachusetts received 51% of all NIH fundingto independent hospitals.
IndustryInvestment
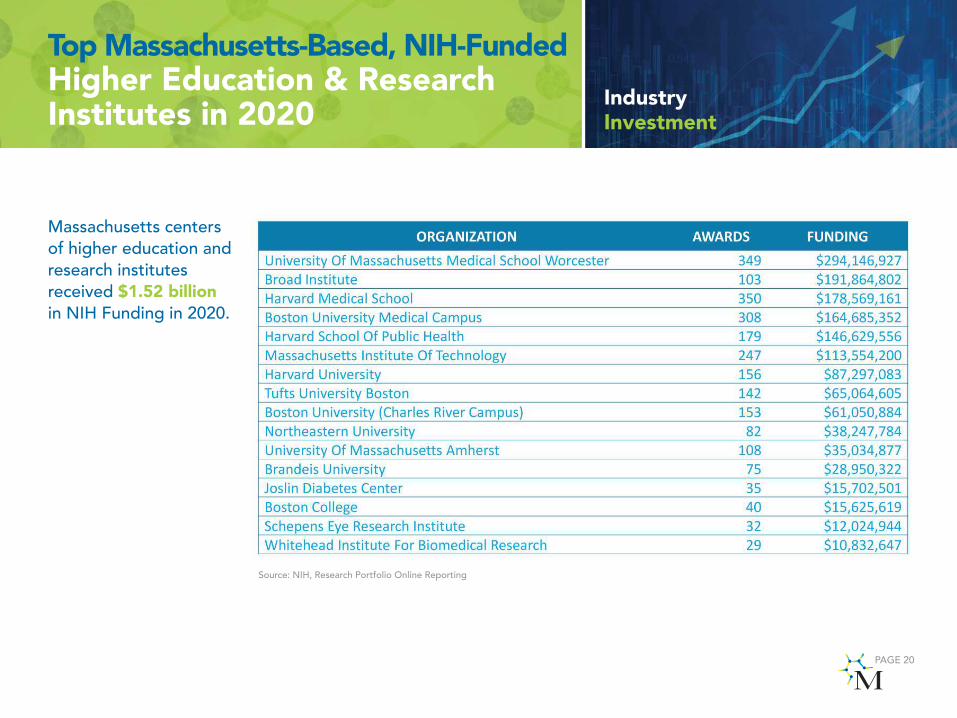
Source: NIH, Research Portfolio Online Reporting
PAGE 20
Top Massachusetts-Based, NIH-Funded Higher Education & Research Institutes in 2020
Massachusetts centers of higher education and research institutes received $1.52 billion in NIH Funding in 2020.
IndustryInvestment
Venture Capital Investment:Biopharma
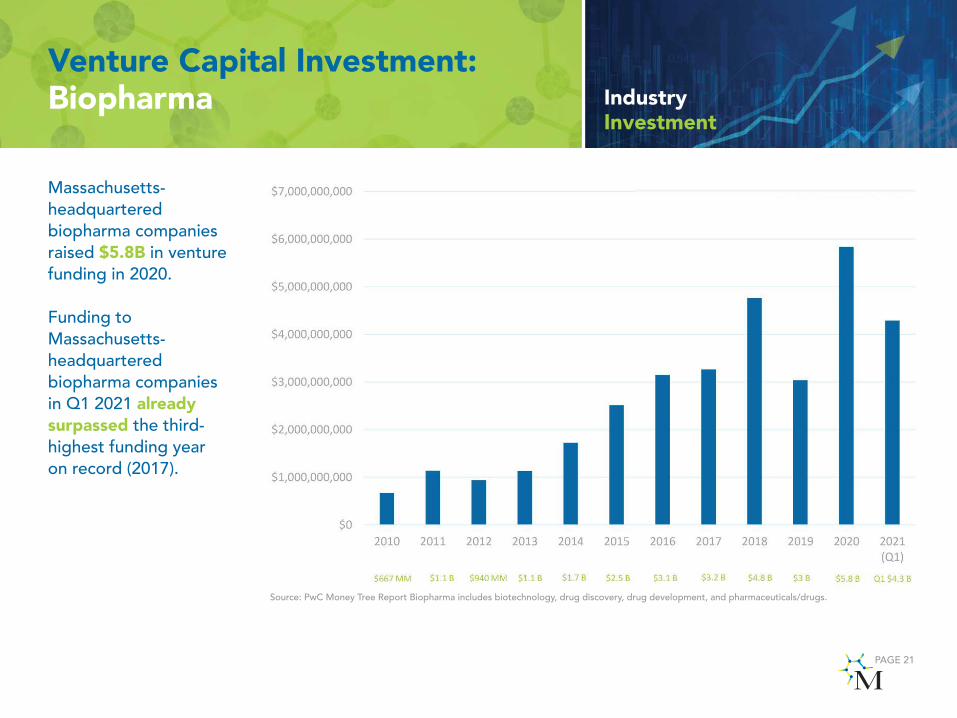
Massachusetts-headquartered biopharma companies raised $5.8B in venture funding in 2020.
Funding to Massachusetts-headquartered biopharma companies in Q1 2021 already surpassed the third- highest funding year on record (2017).
PAGE 21
Source: PwC Money Tree Report Biopharma includes biotechnology, drug discovery, drug development, and pharmaceuticals/drugs.
IndustryInvestment
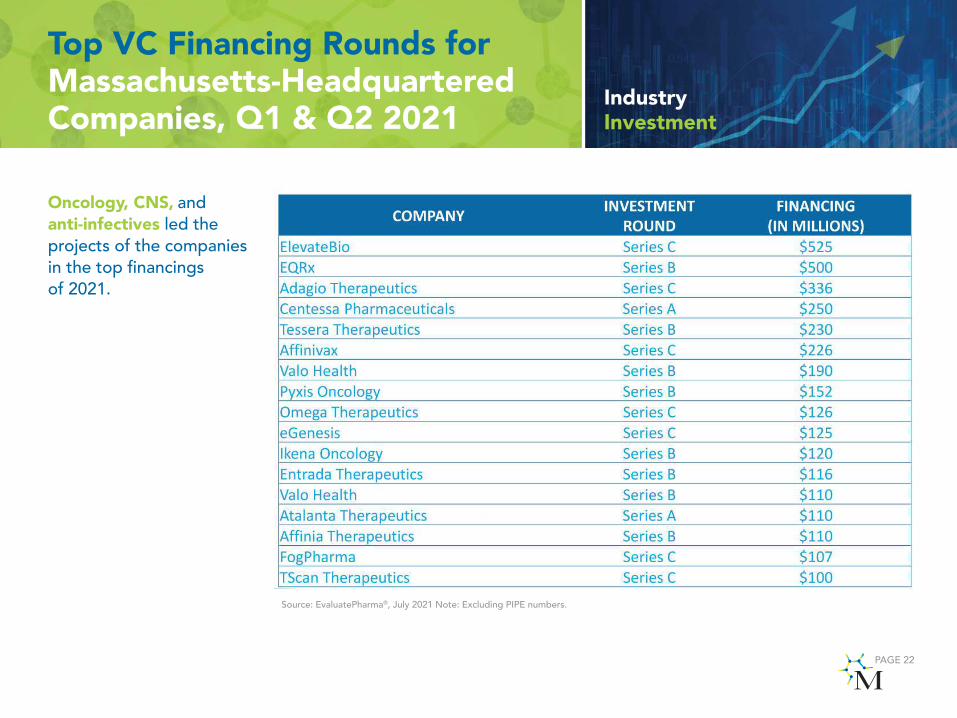
Top VC Financing Rounds forMassachusetts-Headquartered Companies, Q1 & Q2 2021
Oncology, CNS, and anti-infectives led the projects of the companies in the top fi nancings of 2021.
PAGE 22
Source: EvaluatePharma®, July 2021 Note: Excluding PIPE numbers.
IndustryInvestment
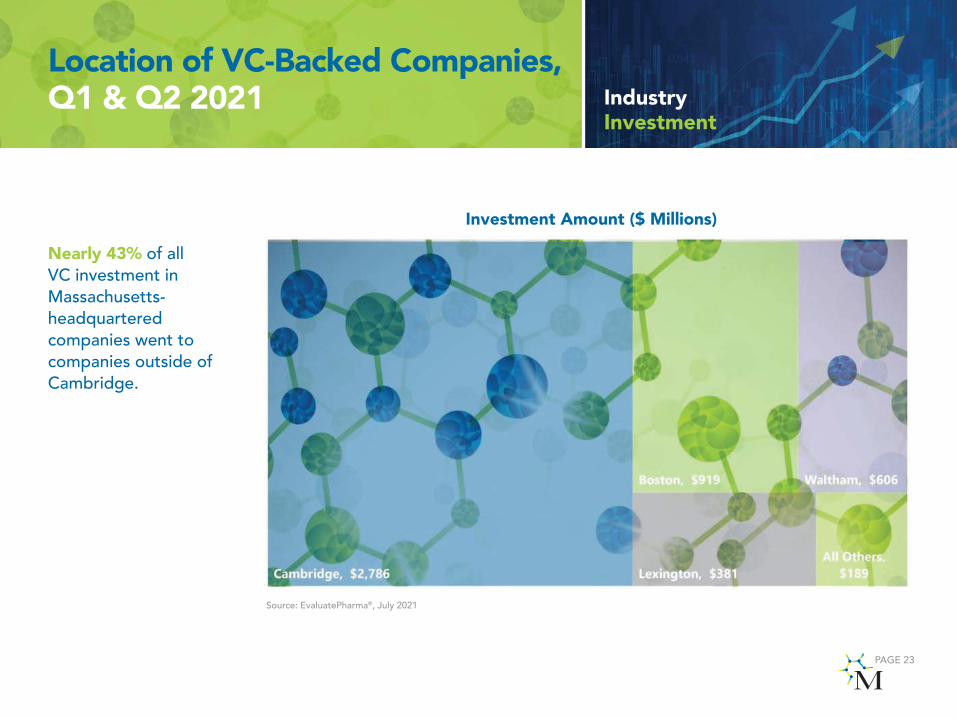
Nearly 43% of all VC investment in Massachusetts-headquartered companies went to companies outside ofCambridge.
Source: EvaluatePharma®, July 2021
PAGE 23
Location of VC-Backed Companies, Q1 & Q2 2021
Investment Amount ($ Millions)
IndustryInvestment
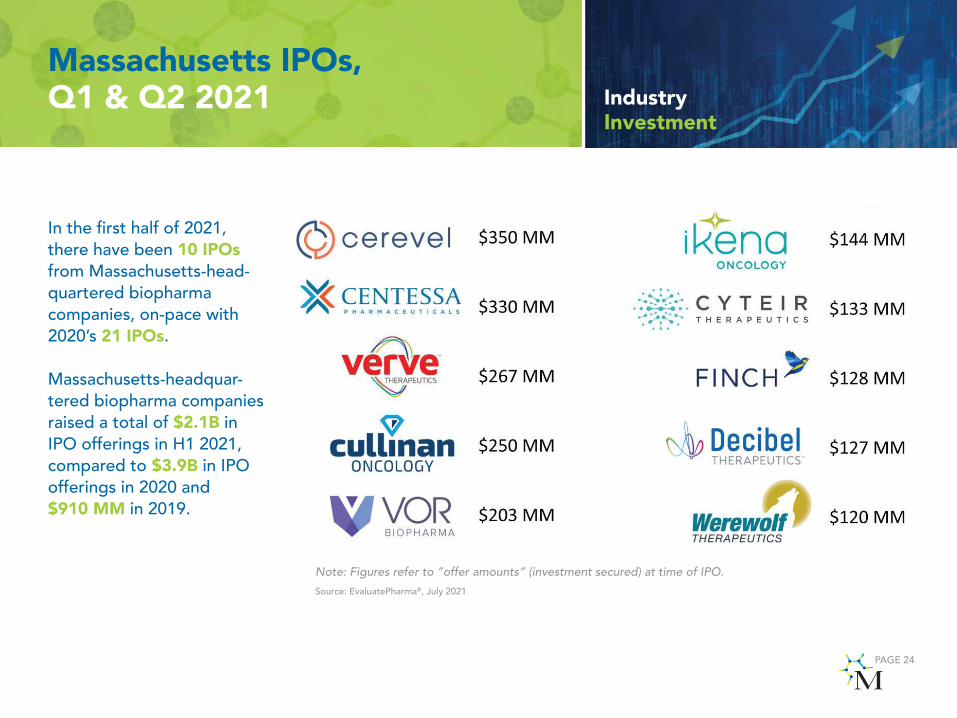
Massachusetts IPOs, Q1 & Q2 2021
PAGE 24
In the fi rst half of 2021, there have been 10 IPOs from Massachusetts-head-quartered biopharma companies, on-pace with 2020’s 21 IPOs.
Massachusetts-headquar-tered biopharma companies raised a total of $2.1B in IPO offerings in H1 2021, compared to $3.9B in IPO offerings in 2020 and $910 MM in 2019.
Note: Figures refer to “offer amounts” (investment secured) at time of IPO.
Source: EvaluatePharma®, July 2021
IndustryInvestment
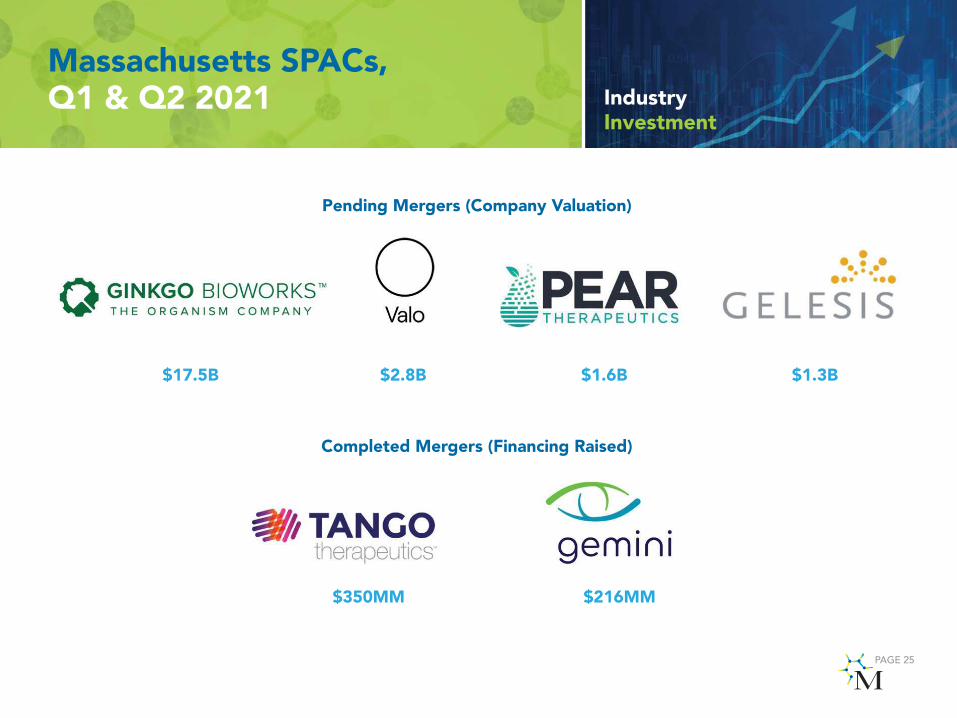
Massachusetts SPACs, Q1 & Q2 2021
PAGE 25
Pending Mergers (Company Valuation)
Completed Mergers (Financing Raised)
$17.5B $2.8B $1.6B $1.3B
$350MM $216MM

IndustryInvestment
Location of Massachusetts-Headquartered Companies with IPOs, Q1 & Q2 2021
PAGE 26
Massachusetts- headquartered biopharma companies located outside of Cambridge accounted for 43% of all dollars raised by IPO in the fi rst half of 2021.
Source: EvaluatePharma®, July 2021
Cumulative IPO Amount ($ Millions)
Drug Development Pipeline
Drug DevelopmentPipeline
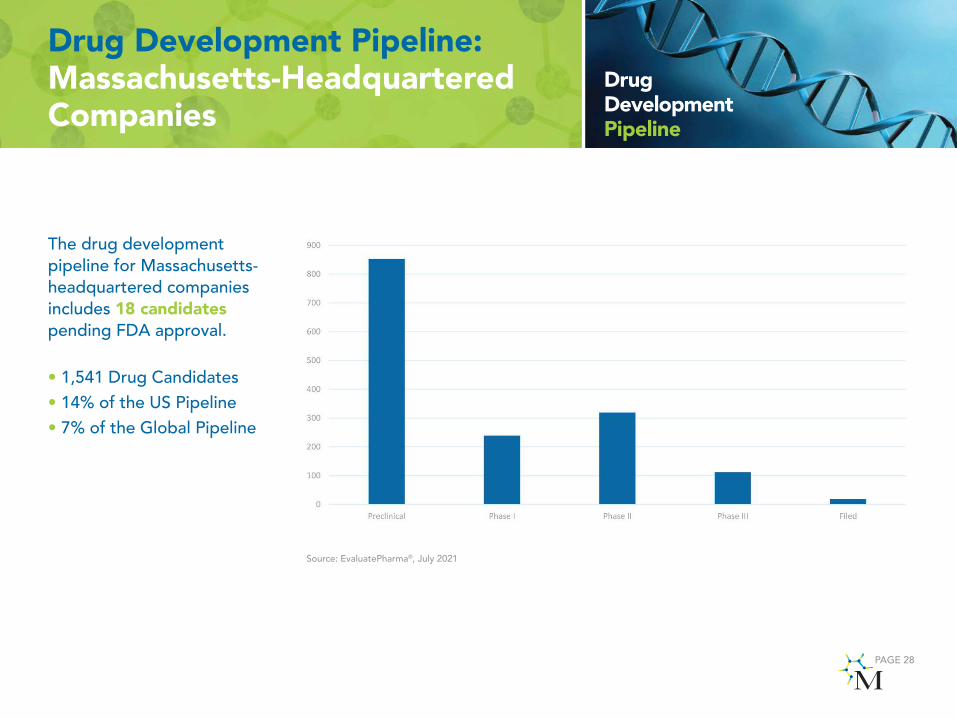
Drug Development Pipeline:Massachusetts-Headquartered Companies
The drug development pipeline for Massachusetts- headquartered companies includes 18 candidates pending FDA approval.
• 1,541 Drug Candidates
• 14% of the US Pipeline
• 7% of the Global Pipeline
Source: EvaluatePharma®, July 2021
PAGE 28

Drug DevelopmentPipeline
Drug Development Pipeline byTherapeutic Area: Massachusetts- Headquartered Companies
Source: EvaluatePharma®, July 2021
PAGE 29
Oncology continues tobe the most frequently researched therapeuticarea in Massachusetts.
MassBio’s mission is to advance Massachusetts’ leadership in the life sciences to grow the industry,
add value to the healthcare system, and improve patient lives. MassBio represents
the premier global life sciences and healthcare hub, with 1,400+ members
dedicated to preventing, treating, and curing diseases through transformative
science and technology that brings value and hope to patients.
MassBio.org • 617.674.5100
MassBio HQ 700 Technology Square, 5th Floor • Cambridge, MA 02139
MassBio West
240 Thatcher Road
Amherst, MA 01003
MassBio North
100 Cummings Center, Suite 222-F
Beverly, MA 01915
MassBio Central
60 Prescott Street
Worcester, MA 01605
About Us
PAGE 30

As the premier source of information on life sciences in Massachusetts,
MassBio tracks industry statistics over time and issues an
overview Industry Snapshot each year.
For more information, contact
Ben BradfordVice President of Membership and
Economic Development
MassBio.org
PAGE 31
with support from


![Download 150dpi version [6MB]](https://img.pdfslide.us/doc/110x75/5896ed111a28ab331f8b60f9/download-150dpi-version-6mb.jpg)