Embed Size (px)
Citation preview
2021 Impact of Change® Forecast HighlightsCOVID-19 Recovery and Impact on Future Utilization
June 2, 2021
2© 2021 Sg2
Key Takeaway: Sites of Care Are Rapidly Changing
Hospital Outpatient Departments (HOPD) and Ambulatory Surgery Centers (ASCs) will
continue to experience rapid patient growth (19% and 25% by 2029, respectively),
experiencing a patient volume that is 15 million higher in 2029 than in 2019. This will help drive
down the cost of surgical procedures.
This shift will accelerate as the Centers for Medicare & Medicaid Services (CMS) eliminates all
of the procedures listed on their In-Patient Only List (more than 1,700 codes) and expands the
number of ASC-covered procedures by 278 by the end of CY 2023.
Physicians Offices and Clinics will see 18% growth by 2029, much of which driven by
procedures formerly done in hospitals like cataract surgery and endovascular procedures.
COVID-19 will leave a lasting impact, creating an enduring demand for specialist care required
to support chronic COVID–impacted conditions, such as neurology and pulmonology.
3© 2021 Sg2
Key Takeaway: Significant Growth in Hospital-at-Home Care for Chronic
Diseases
There will be shift of admissions to the home toward the end of the decade with home-based
services increasing by 15% to an estimated volume of 474.9 million.
Growth opportunities require organizations to invest in chronic disease management services.
Health systems are making major investments in their ability to provide care to patients from
the comfort of their own home with many programs currently in pilot stage. These programs
enable patients that would traditionally be hospitalized, to be managed in the home with remote
monitoring and virtual connections to the hospital team, and with in-person visits by a nurse or
doctor.
Part of the growth in hospital-at-home will be attributable to a reimagining of senior care that
moves patients out of skilled nursing facilities, which will see a 5% reduction in patient volume
by 2029, despite an aging population.
4© 2021 Sg2
Sg2 ANALYTICS
–15%
–5%
5%
15%
25%
2019 2020 2021 2022 2023 2024 2025 2026 2027 2028 2029
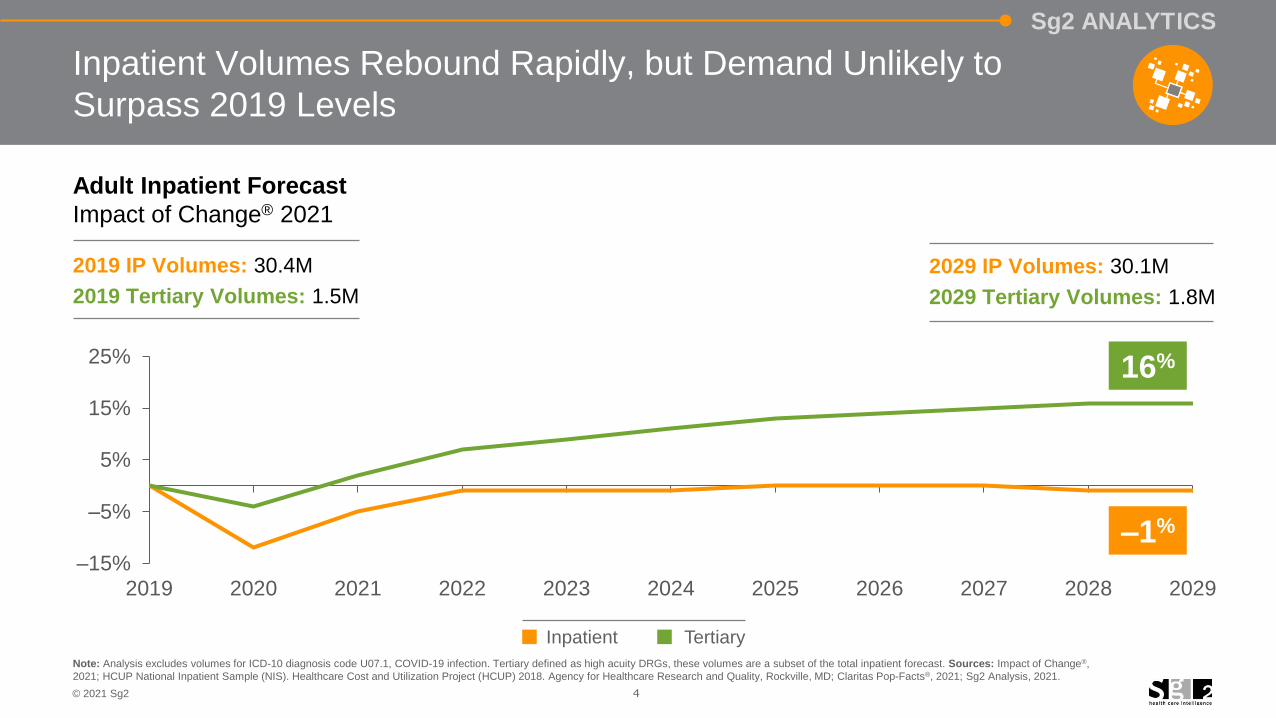
Inpatient Volumes Rebound Rapidly, but Demand Unlikely to
Surpass 2019 Levels
Note: Analysis excludes volumes for ICD-10 diagnosis code U07.1, COVID-19 infection. Tertiary defined as high acuity DRGs, these volumes are a subset of the total inpatient forecast. Sources: Impact of Change®,
2021; HCUP National Inpatient Sample (NIS). Healthcare Cost and Utilization Project (HCUP) 2018. Agency for Healthcare Research and Quality, Rockville, MD; Claritas Pop-Facts®, 2021; Sg2 Analysis, 2021.
Adult Inpatient Forecast
Impact of Change® 2021
2019 IP Volumes: 30.4M
2019 Tertiary Volumes: 1.5M
Inpatient Tertiary
–1%
16%
2029 IP Volumes: 30.1M
2029 Tertiary Volumes: 1.8M
5© 2021 Sg2
Sg2 ANALYTICS
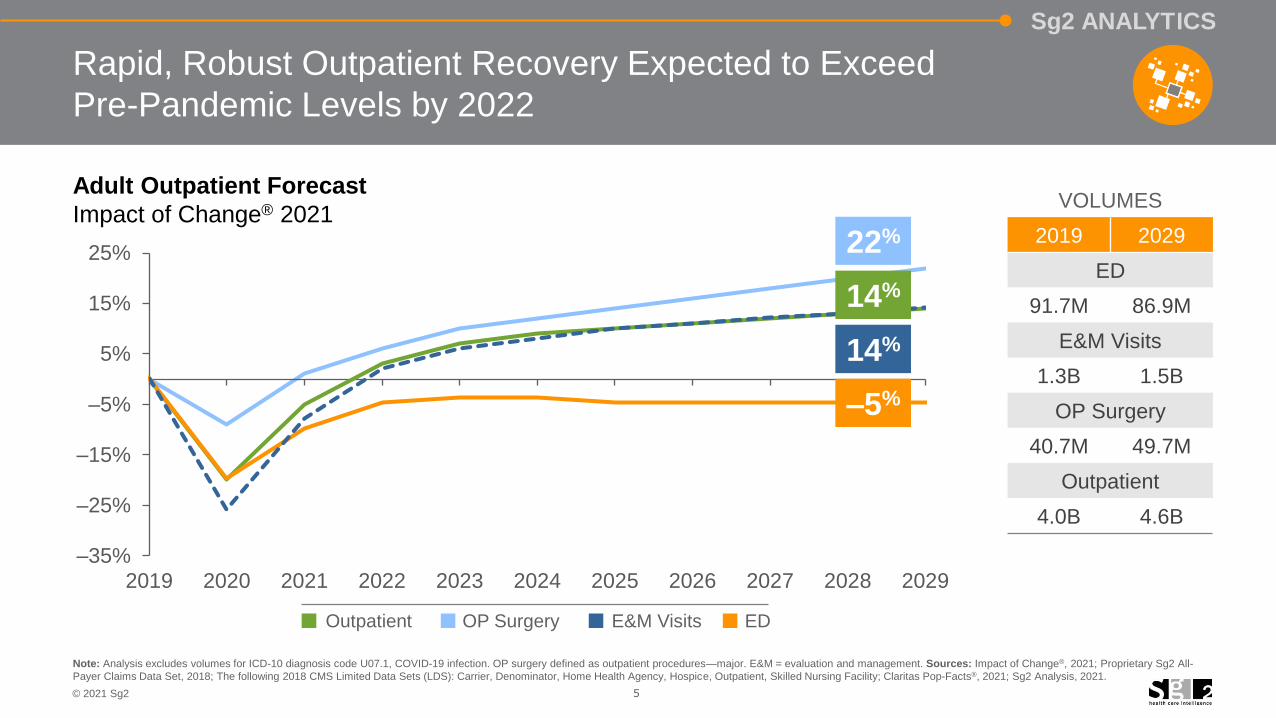
Rapid, Robust Outpatient Recovery Expected to Exceed
Pre-Pandemic Levels by 2022
Note: Analysis excludes volumes for ICD-10 diagnosis code U07.1, COVID-19 infection. OP surgery defined as outpatient procedures—major. E&M = evaluation and management. Sources: Impact of Change®, 2021; Proprietary Sg2 All-
Payer Claims Data Set, 2018; The following 2018 CMS Limited Data Sets (LDS): Carrier, Denominator, Home Health Agency, Hospice, Outpatient, Skilled Nursing Facility; Claritas Pop-Facts®, 2021; Sg2 Analysis, 2021.
Adult Outpatient Forecast
Impact of Change® 2021
–35%
–25%
–15%
–5%
5%
15%
25%
2019 2020 2021 2022 2023 2024 2025 2026 2027 2028 2029
VOLUMES
2019 2029
ED
91.7M 86.9M
E&M Visits
1.3B 1.5B
OP Surgery
40.7M 49.7M
Outpatient
4.0B 4.6B
14%
22%
14%
–5%
Outpatient OP Surgery E&M Visits ED
6© 2021 Sg2
Note: Analysis excludes 0–17 age group. ASC = ambulatory surgery center; SNF = skilled nursing facility. Sources: Impact of Change®, 2021; HCUP National Inpatient Sample (NIS). Healthcare Cost and Utilization
Project (HCUP) 2018. Agency for Healthcare Research and Quality, Rockville, MD; Claritas Pop-Facts®, 2021; Sg2 Analysis, 2021.
Physician Clinic
Proceduralist
Office
Home
SNF
Hospital OP
Virtual
ASC
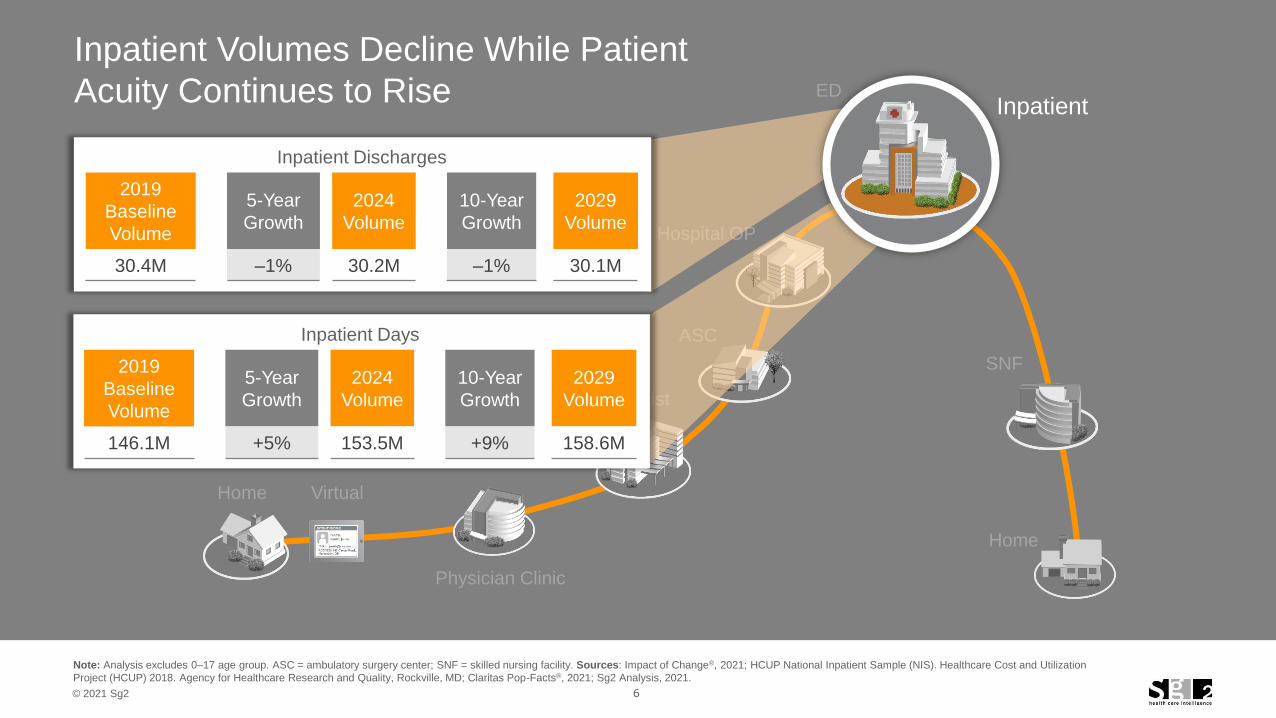
Inpatient Volumes Decline While Patient
Acuity Continues to Rise
Home
Inpatient Days
2019
Baseline
Volume
5-Year
Growth
2024
Volume
10-Year
Growth
2029
Volume
146.1M +5% 153.5M +9% 158.6M
EDInpatient
Inpatient Discharges
2019
Baseline
Volume
5-Year
Growth
2024
Volume
10-Year
Growth
2029
Volume
30.4M –1% 30.2M –1% 30.1M
7© 2021 Sg2
Sg2 ANALYTICS
0
2
4
6
2019 2024 20290
10
20
30
40
2019 2024 2029
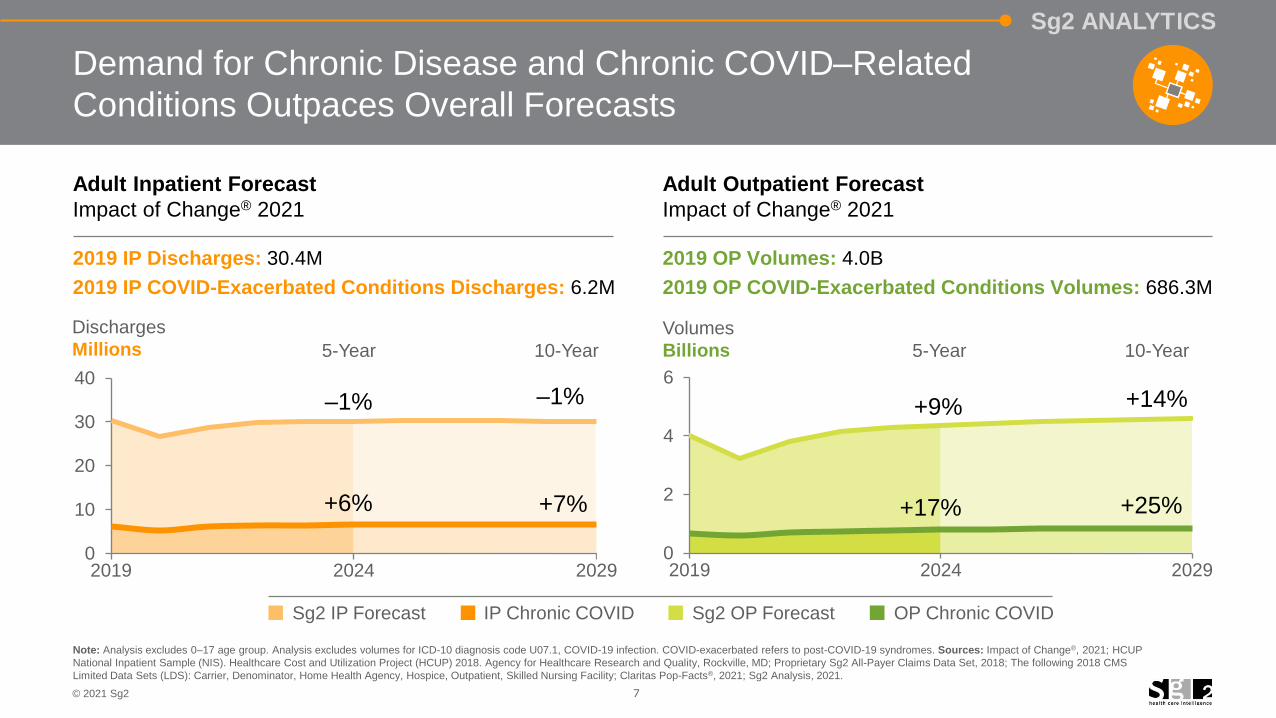
Demand for Chronic Disease and Chronic COVID–Related
Conditions Outpaces Overall Forecasts
Note: Analysis excludes 0–17 age group. Analysis excludes volumes for ICD-10 diagnosis code U07.1, COVID-19 infection. COVID-exacerbated refers to post-COVID-19 syndromes. Sources: Impact of Change®, 2021; HCUP
National Inpatient Sample (NIS). Healthcare Cost and Utilization Project (HCUP) 2018. Agency for Healthcare Research and Quality, Rockville, MD; Proprietary Sg2 All-Payer Claims Data Set, 2018; The following 2018 CMS
Limited Data Sets (LDS): Carrier, Denominator, Home Health Agency, Hospice, Outpatient, Skilled Nursing Facility; Claritas Pop-Facts®, 2021; Sg2 Analysis, 2021.
Adult Inpatient Forecast
Impact of Change® 2021
2019 IP Discharges: 30.4M
2019 IP COVID-Exacerbated Conditions Discharges: 6.2M
Adult Outpatient Forecast
Impact of Change® 2021
2019 OP Volumes: 4.0B
2019 OP COVID-Exacerbated Conditions Volumes: 686.3M
10-Year
Discharges
Millions 5-Year 10-Year
Volumes
Billions 5-Year
+6%
–1%
+7%
–1% +9%
+17%
+14%
+25%
Sg2 IP Forecast IP Chronic COVID Sg2 OP Forecast OP Chronic COVID

8© 2021 Sg2
SITE OF CARE SHIFTS
9© 2021 Sg2
Physician Clinic
Proceduralist
Office
Home
SNF
ED Inpatient
Virtual
ASC
Home
Note: Analysis excludes 0–17 age group. Forecast pulled for procedures—major and endoscopy volumes only. Sources: Impact of Change®, 2021; Proprietary Sg2 All-Payer Claims Data Set, 2018; The following 2018
CMS Limited Data Sets (LDS): Carrier, Denominator, Home Health Agency, Hospice, Outpatient, Skilled Nursing Facility; Claritas Pop-Facts®, 2021; Sg2 Analysis, 2021.
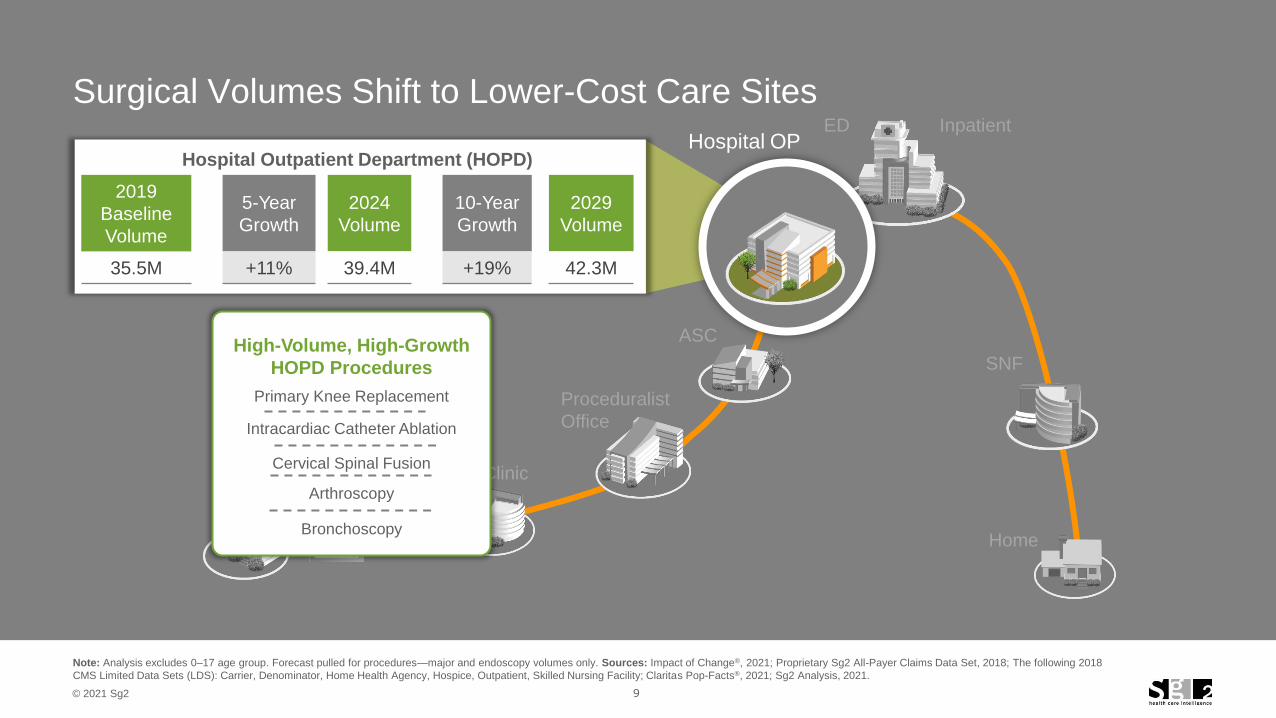
Primary Knee Replacement
Intracardiac Catheter Ablation
Cervical Spinal Fusion
High-Volume, High-Growth
HOPD Procedures
Arthroscopy
Bronchoscopy
Surgical Volumes Shift to Lower-Cost Care Sites
Hospital Outpatient Department (HOPD)
2019
Baseline
Volume
5-Year
Growth
2024
Volume
10-Year
Growth
2029
Volume
35.5M +11% 39.4M +19% 42.3M
Hospital OP
10© 2021 Sg2
Physician Clinic
Proceduralist
Office
Home
SNF
ED Inpatient
Hospital OP
VirtualHome
Note: Analysis excludes 0–17 age group. Forecast pulled for procedures—major and endoscopy volumes only. GI = gastrointestinal. Sources: Impact of Change®, 2021; Proprietary Sg2 All-Payer Claims Data Set, 2018;
The following 2018 CMS Limited Data Sets (LDS): Carrier, Denominator, Home Health Agency, Hospice, Outpatient, Skilled Nursing Facility; Claritas Pop-Facts®, 2021; Sg2 Analysis, 2021.
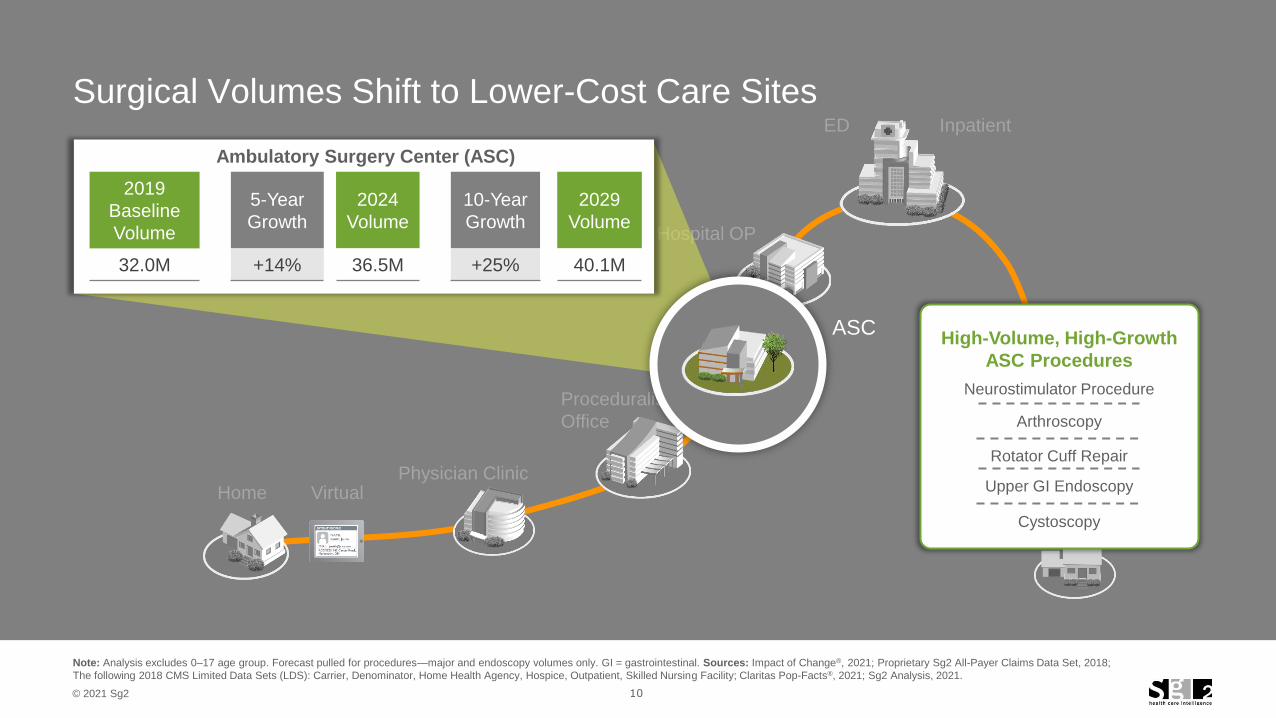
Surgical Volumes Shift to Lower-Cost Care Sites
Neurostimulator Procedure
Arthroscopy
Rotator Cuff Repair
High-Volume, High-Growth
ASC Procedures
Upper GI Endoscopy
Cystoscopy
Ambulatory Surgery Center (ASC)
2019
Baseline
Volume
5-Year
Growth
2024
Volume
10-Year
Growth
2029
Volume
32.0M +14% 36.5M +25% 40.1M
ASC
11© 2021 Sg2
Physician Office/Clinic
Proceduralist
Office
Home
SNF
ED Inpatient
Hospital OP
Virtual
ASC
Home
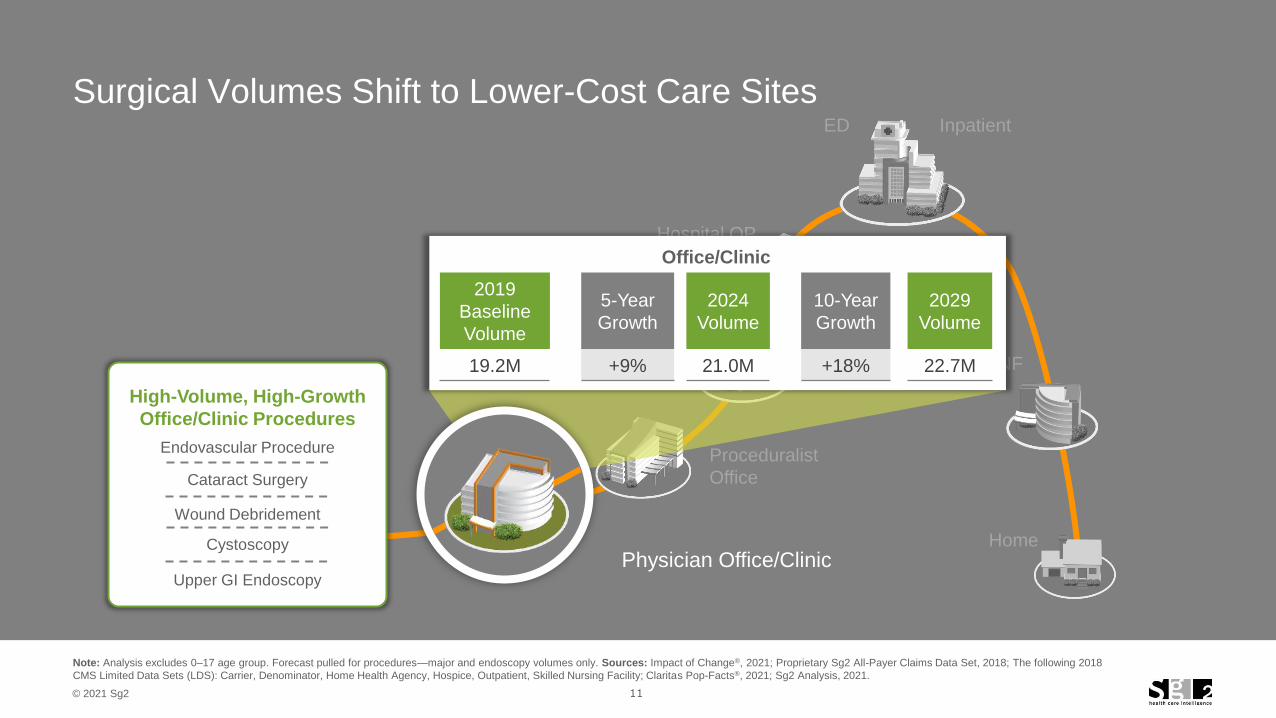
Surgical Volumes Shift to Lower-Cost Care Sites
Note: Analysis excludes 0–17 age group. Forecast pulled for procedures—major and endoscopy volumes only. Sources: Impact of Change®, 2021; Proprietary Sg2 All-Payer Claims Data Set, 2018; The following 2018
CMS Limited Data Sets (LDS): Carrier, Denominator, Home Health Agency, Hospice, Outpatient, Skilled Nursing Facility; Claritas Pop-Facts®, 2021; Sg2 Analysis, 2021.
Endovascular Procedure
Cataract Surgery
Wound Debridement
High-Volume, High-Growth
Office/Clinic Procedures
Cystoscopy
Upper GI Endoscopy
Office/Clinic
2019
Baseline
Volume
5-Year
Growth
2024
Volume
10-Year
Growth
2029
Volume
19.2M +9% 21.0M +18% 22.7M
12© 2021 Sg2
Physician Clinic
Proceduralist
Office
ED Inpatient
Hospital OP
Virtual
ASC
Home
SNF
OT = occupational therapy; PT = physical therapy. Note: Analysis excludes 0–17 age group. Sources: Impact of Change®, 2021; Proprietary Sg2 All-Payer Claims Data Set, 2018; The
following 2018 CMS Limited Data Sets (LDS): Carrier, Denominator, Home Health Agency, Hospice, Outpatient, Skilled Nursing Facility; Claritas Pop-Facts®, 2021; Sg2 Analysis, 2021.
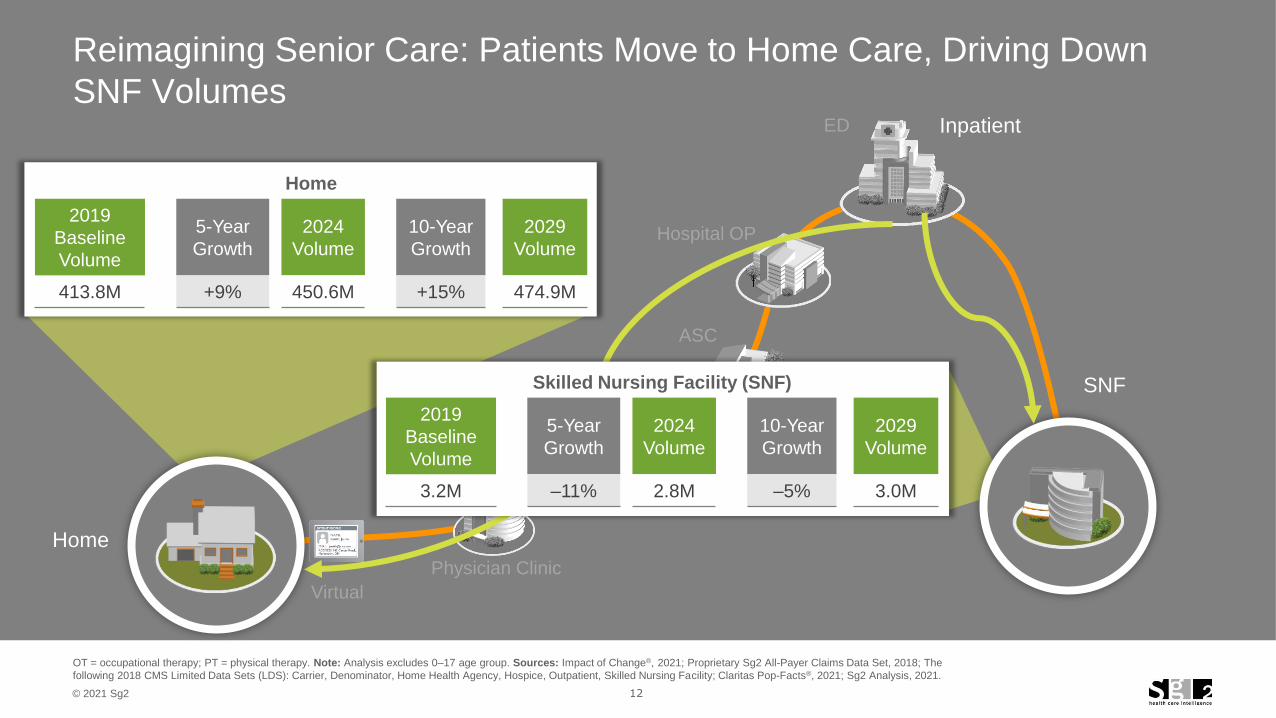
Reimagining Senior Care: Patients Move to Home Care, Driving Down
SNF Volumes
Skilled Nursing Facility (SNF)
2019
Baseline
Volume
5-Year
Growth
2024
Volume
10-Year
Growth
2029
Volume
3.2M –11% 2.8M –5% 3.0M
Home
2019
Baseline
Volume
5-Year
Growth
2024
Volume
10-Year
Growth
2029
Volume
413.8M +9% 450.6M +15% 474.9M
Home
13© 2021 Sg2
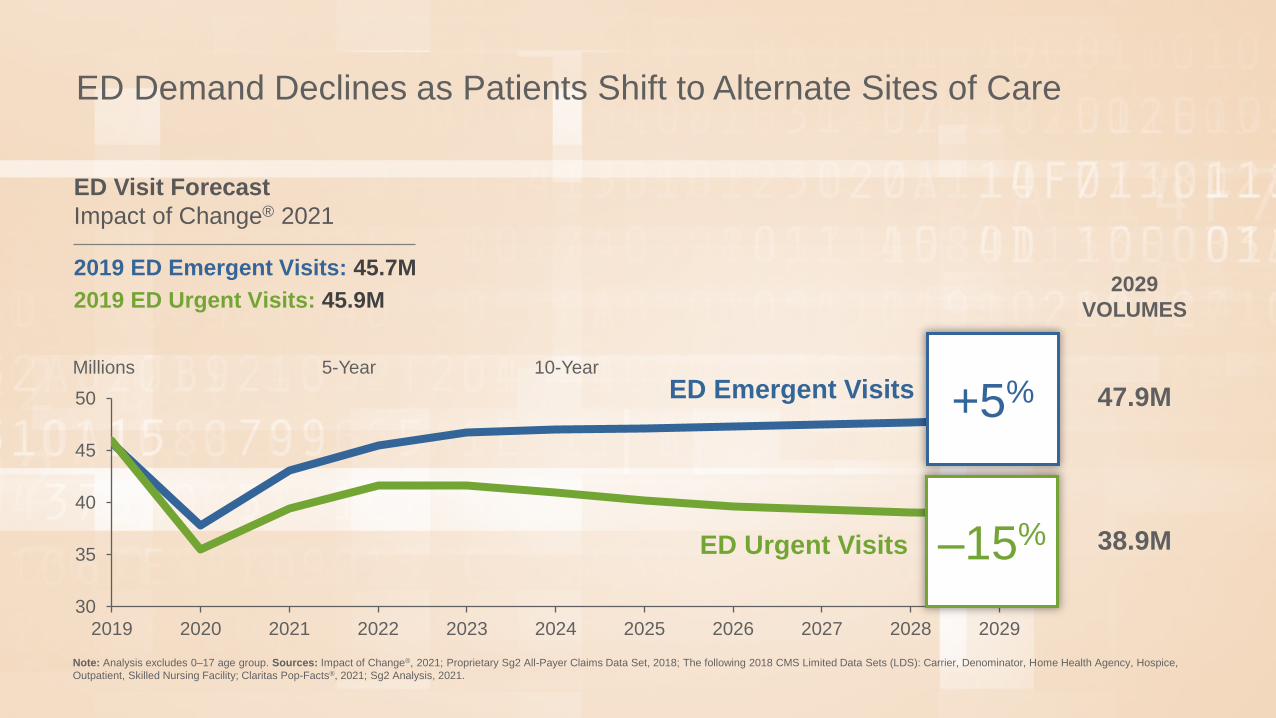
ED Demand Declines as Patients Shift to Alternate Sites of Care
30
35
40
45
50
2019 2020 2021 2022 2023 2024 2025 2026 2027 2028 2029
Note: Analysis excludes 0–17 age group. Sources: Impact of Change®, 2021; Proprietary Sg2 All-Payer Claims Data Set, 2018; The following 2018 CMS Limited Data Sets (LDS): Carrier, Denominator, Home Health Agency, Hospice,
Outpatient, Skilled Nursing Facility; Claritas Pop-Facts®, 2021; Sg2 Analysis, 2021.
ED Visit Forecast
Impact of Change® 2021
2019 ED Emergent Visits: 45.7M
2019 ED Urgent Visits: 45.9M
ED Emergent Visits
ED Urgent Visits
2029
VOLUMES
47.9M
38.9M–15%
+5%10-YearMillions 5-Year
14© 2021 Sg2
Sg2 ANALYTICS
0%
10%
20%
30%
40%
50%
60%
2019 2024 2029
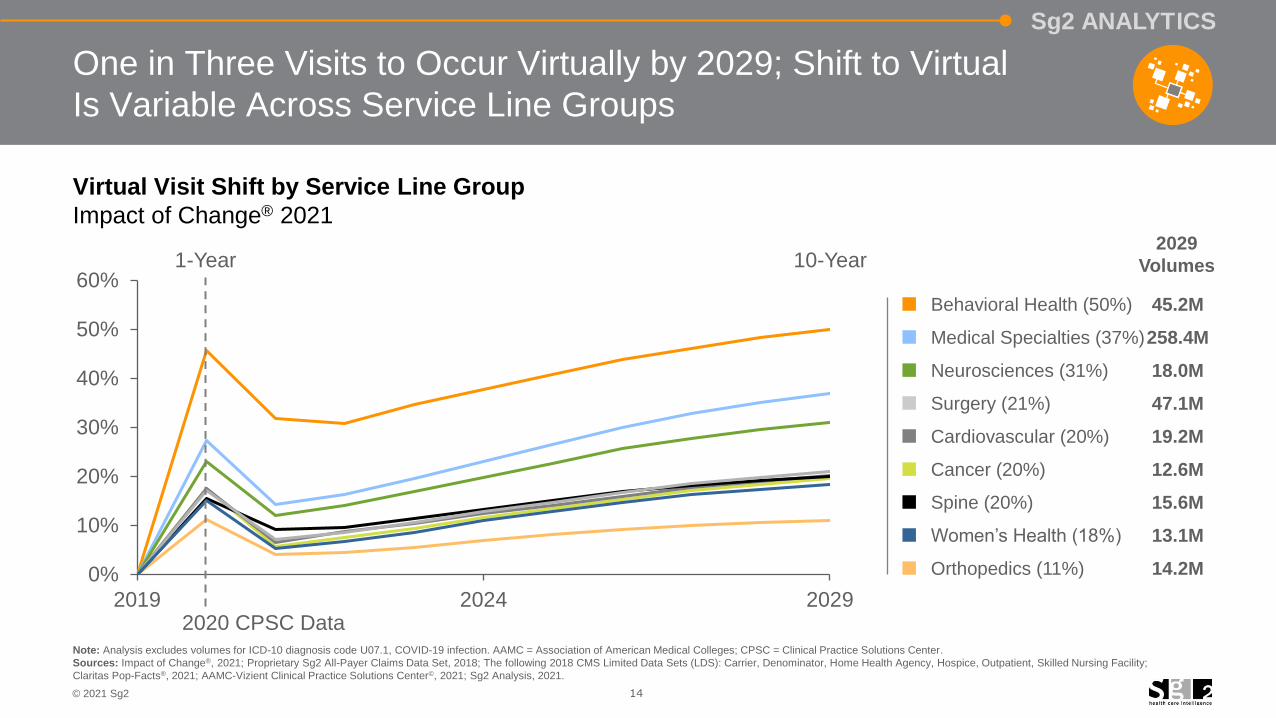
One in Three Visits to Occur Virtually by 2029; Shift to Virtual
Is Variable Across Service Line Groups
Note: Analysis excludes volumes for ICD-10 diagnosis code U07.1, COVID-19 infection. AAMC = Association of American Medical Colleges; CPSC = Clinical Practice Solutions Center.
Sources: Impact of Change®, 2021; Proprietary Sg2 All-Payer Claims Data Set, 2018; The following 2018 CMS Limited Data Sets (LDS): Carrier, Denominator, Home Health Agency, Hospice, Outpatient, Skilled Nursing Facility;
Claritas Pop-Facts®, 2021; AAMC-Vizient Clinical Practice Solutions Center©, 2021; Sg2 Analysis, 2021.
Virtual Visit Shift by Service Line Group
Impact of Change® 2021
10-Year1-Year
2020 CPSC Data
Behavioral Health (50%) 45.2M
Medical Specialties (37%)258.4M
Neurosciences (31%) 18.0M
Surgery (21%) 47.1M
Cardiovascular (20%) 19.2M
Cancer (20%) 12.6M
Spine (20%) 15.6M
Women’s Health (18%) 13.1M
Orthopedics (11%) 14.2M
2029
Volumes
15© 2021 Sg2
Sg2 ANALYTICS
0.0
0.4
0.8
1.2
1.6
2019 2024 2029
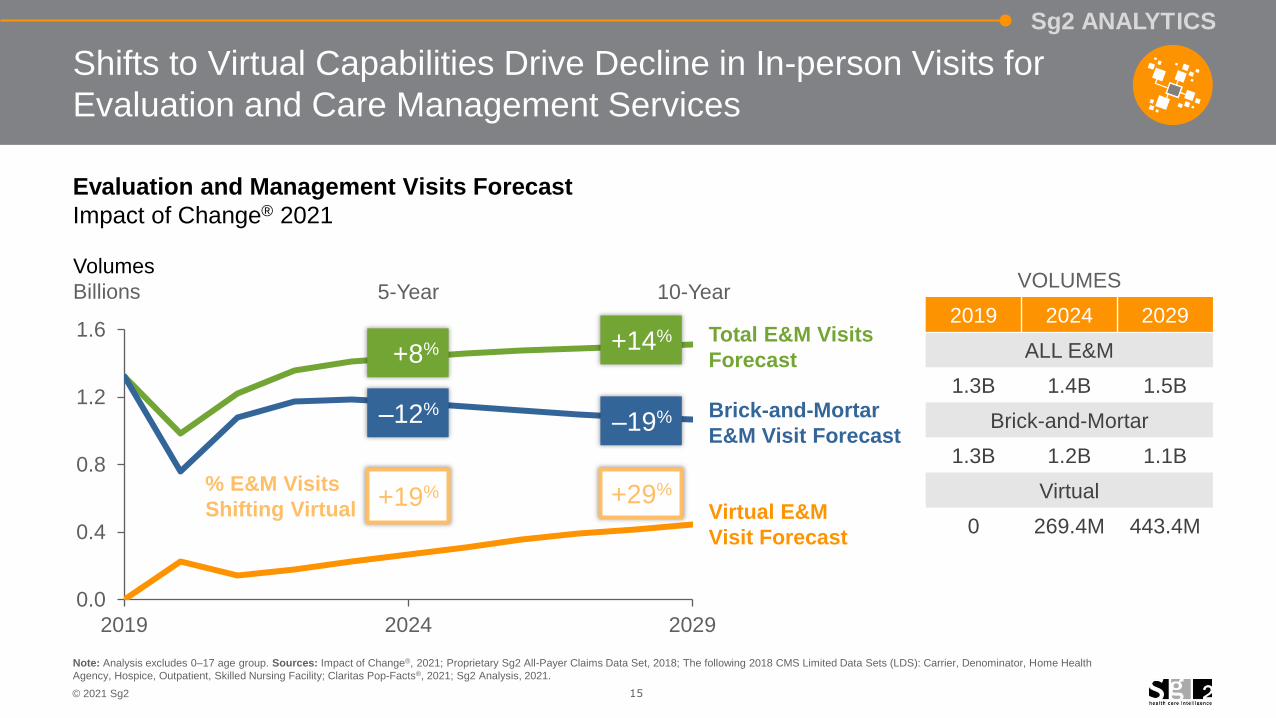
Shifts to Virtual Capabilities Drive Decline in In-person Visits for
Evaluation and Care Management Services
Note: Analysis excludes 0–17 age group. Sources: Impact of Change®, 2021; Proprietary Sg2 All-Payer Claims Data Set, 2018; The following 2018 CMS Limited Data Sets (LDS): Carrier, Denominator, Home Health
Agency, Hospice, Outpatient, Skilled Nursing Facility; Claritas Pop-Facts®, 2021; Sg2 Analysis, 2021.
5-Year 10-Year
Volumes
Billions
+29%+19%
Brick-and-Mortar
E&M Visit Forecast
Total E&M Visits
Forecast
Virtual E&M
Visit Forecast
Evaluation and Management Visits Forecast
Impact of Change® 2021
+14%
–19%
+8%
–12%
VOLUMES
2019 2024 2029
ALL E&M
1.3B 1.4B 1.5B
Brick-and-Mortar
1.3B 1.2B 1.1B
Virtual
0 269.4M 443.4M
% E&M Visits
Shifting Virtual
16© 2021 Sg2
Methodology
THE POWER OF DISEASE-BASED FORECASTING
By starting with trends in the prevalence and incidence of underlying health conditions, the disease-based
Impact of Change model analyzes patient-level data and local market trends to project demand across
inpatient and outpatient services. Each year, Sg2’s experts evaluate and update a series of impact factors
to forecast how each of these variables will influence volumes. Each impact factor reflects the trends
specific to disease groupings and procedures within the population.
Impact of Change®, 2021; HCUP National Inpatient Sample (NIS). Healthcare Cost and Utilization
Project (HCUP) 2018. Agency for Healthcare Research and Quality, Rockville, MD; Proprietary Sg2 All-
Payer Claims Data Set, 2018; The following 2018 CMS Limited Data Sets (LDS): Carrier, Denominator,
Home Health Agency, Hospice, Outpatient, Skilled Nursing Facility; Claritas Pop-Facts®, 2021; Sg2
Analysis, 2021.
SOURCES
Sg2, a Vizient company, is the health care
industry’s premier authority on health care
trends, insights and market analytics.
Our analytics and expertise help hospitals
and health systems achieve sustainable
growth and ensure ongoing market
relevance through the development of an
effective System of CARE.
Sg2.com 847.779.5300