Embed Size (px)
Citation preview

2021 Half Year
Investors/Analysts Presentation
G u a r a n t y T r u s t H o l d i n g C o m p a n y p l c S e p t e m b e r 2 0 2 1
▪ Macro-economic
Review for HY 2021
▪ Overview of HY
2021
▪ HY 2021 Performance
Review
▪ Business Segments and
Subsidiary Review
▪ Guidance and Plans for FY 2021
Outline

Macro-economic
Review for HY 2021
04
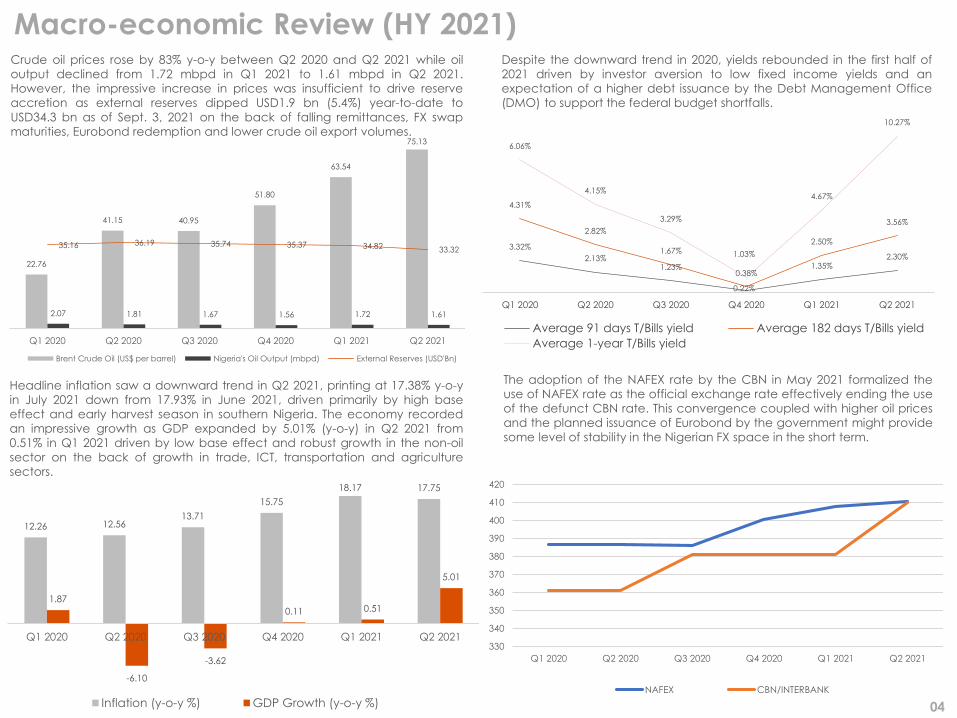
Macro-economic Review (HY 2021)Crude oil prices rose by 83% y-o-y between Q2 2020 and Q2 2021 while oil
output declined from 1.72 mbpd in Q1 2021 to 1.61 mbpd in Q2 2021.
However, the impressive increase in prices was insufficient to drive reserve
accretion as external reserves dipped USD1.9 bn (5.4%) year-to-date to
USD34.3 bn as of Sept. 3, 2021 on the back of falling remittances, FX swap
maturities, Eurobond redemption and lower crude oil export volumes.
Headline inflation saw a downward trend in Q2 2021, printing at 17.38% y-o-y
in July 2021 down from 17.93% in June 2021, driven primarily by high base
effect and early harvest season in southern Nigeria. The economy recorded
an impressive growth as GDP expanded by 5.01% (y-o-y) in Q2 2021 from
0.51% in Q1 2021 driven by low base effect and robust growth in the non-oil
sector on the back of growth in trade, ICT, transportation and agriculture
sectors.
The adoption of the NAFEX rate by the CBN in May 2021 formalized the
use of NAFEX rate as the official exchange rate effectively ending the use
of the defunct CBN rate. This convergence coupled with higher oil prices
and the planned issuance of Eurobond by the government might provide
some level of stability in the Nigerian FX space in the short term.
Despite the downward trend in 2020, yields rebounded in the first half of
2021 driven by investor aversion to low fixed income yields and an
expectation of a higher debt issuance by the Debt Management Office
(DMO) to support the federal budget shortfalls.
3.32%
2.13%1.23%
0.22%
1.35%2.30%
4.31%
2.82%
1.67%
0.38%
2.50%
3.56%
6.06%
4.15%
3.29%
1.03%
4.67%
10.27%
Q1 2020 Q2 2020 Q3 2020 Q4 2020 Q1 2021 Q2 2021
Average 91 days T/Bills yield Average 182 days T/Bills yield
Average 1-year T/Bills yield
12.26 12.5613.71
15.75
18.17 17.75
1.87
-6.10
-3.62
0.11 0.51
5.01
Q1 2020 Q2 2020 Q3 2020 Q4 2020 Q1 2021 Q2 2021
Inflation (y-o-y %) GDP Growth (y-o-y %)
22.76
41.15 40.95
51.80
63.54
75.13
2.07 1.81 1.67 1.56 1.72 1.61
35.16 36.19 35.74 35.37 34.82 33.32
Q1 2020 Q2 2020 Q3 2020 Q4 2020 Q1 2021 Q2 2021
Brent Crude Oil (US$ per barrel) Nigeria's Oil Output (mbpd) External Reserves (USD'Bn)
330
340
350
360
370
380
390
400
410
420
Q1 2020 Q2 2020 Q3 2020 Q4 2020 Q1 2021 Q2 2021
NAFEX CBN/INTERBANK
Overview of HY 2021
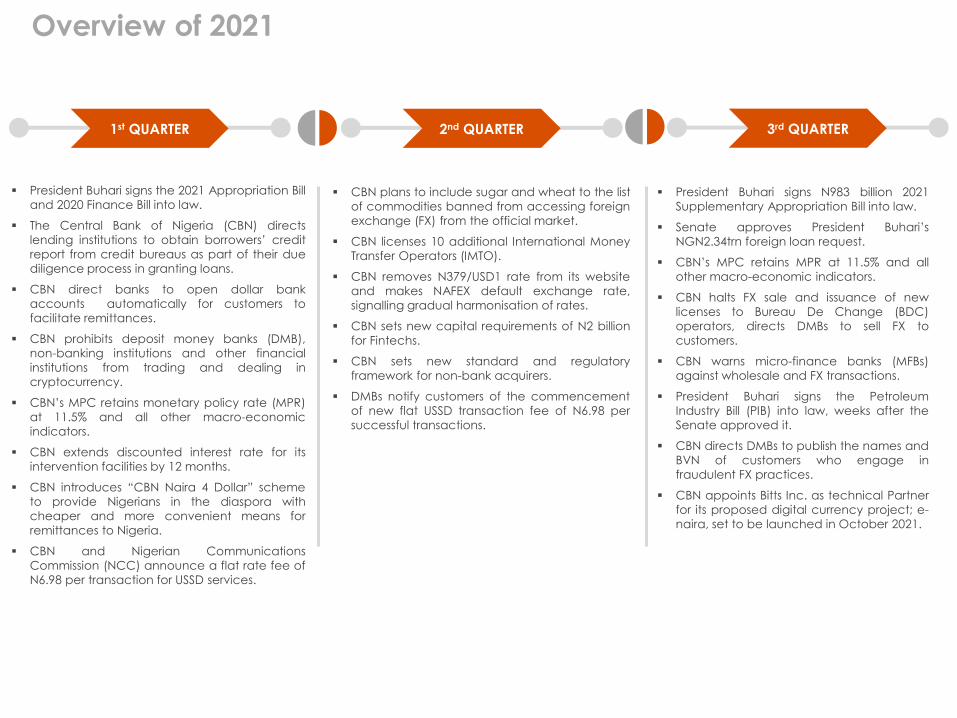
Overview of 2021
▪ President Buhari signs the 2021 Appropriation Bill
and 2020 Finance Bill into law.
▪ The Central Bank of Nigeria (CBN) directs
lending institutions to obtain borrowers’ credit
report from credit bureaus as part of their due
diligence process in granting loans.
▪ CBN direct banks to open dollar bank
accounts automatically for customers to
facilitate remittances.
▪ CBN prohibits deposit money banks (DMB),
non-banking institutions and other financial
institutions from trading and dealing in
cryptocurrency.
▪ CBN’s MPC retains monetary policy rate (MPR)
at 11.5% and all other macro-economic
indicators.
▪ CBN extends discounted interest rate for its
intervention facilities by 12 months.
▪ CBN introduces “CBN Naira 4 Dollar” scheme
to provide Nigerians in the diaspora with
cheaper and more convenient means for
remittances to Nigeria.
▪ CBN and Nigerian Communications
Commission (NCC) announce a flat rate fee of
N6.98 per transaction for USSD services.
1st QUARTER 2nd QUARTER 3rd QUARTER
▪ CBN plans to include sugar and wheat to the list
of commodities banned from accessing foreign
exchange (FX) from the official market.
▪ CBN licenses 10 additional International Money
Transfer Operators (IMTO).
▪ CBN removes N379/USD1 rate from its website
and makes NAFEX default exchange rate,
signalling gradual harmonisation of rates.
▪ CBN sets new capital requirements of N2 billion
for Fintechs.
▪ CBN sets new standard and regulatory
framework for non-bank acquirers.
▪ DMBs notify customers of the commencement
of new flat USSD transaction fee of N6.98 per
successful transactions.
▪ President Buhari signs N983 billion 2021
Supplementary Appropriation Bill into law.
▪ Senate approves President Buhari’s
NGN2.34trn foreign loan request.
▪ CBN’s MPC retains MPR at 11.5% and all
other macro-economic indicators.
▪ CBN halts FX sale and issuance of new
licenses to Bureau De Change (BDC)
operators, directs DMBs to sell FX to
customers.
▪ CBN warns micro-finance banks (MFBs)
against wholesale and FX transactions.
▪ President Buhari signs the Petroleum
Industry Bill (PIB) into law, weeks after the
Senate approved it.
▪ CBN directs DMBs to publish the names and
BVN of customers who engage in
fraudulent FX practices.
▪ CBN appoints Bitts Inc. as technical Partner
for its proposed digital currency project; e-
naira, set to be launched in October 2021.

HY 2021 Financial
Performance Review
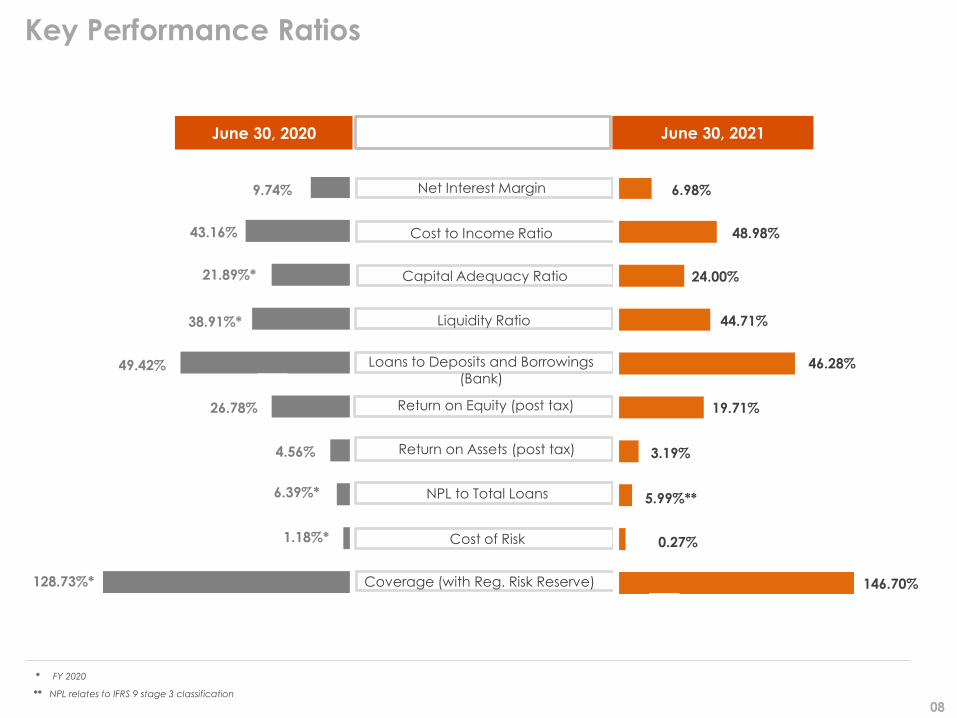
Key Performance Ratios
Cost to Income Ratio
Capital Adequacy Ratio
Liquidity Ratio
Loans to Deposits and Borrowings (Bank)
Return on Equity (post tax)
Return on Assets (post tax)
NPL to Total Loans
Cost of Risk
Coverage (with Reg. Risk Reserve)
9.74% 6.98%
43.16% 48.98%
24.00%
38.91%* 44.71%
49.42% 46.28%
26.78% 19.71%
4.56% 3.19%
6.39%* 5.99%**
1.18%* 0.27%
128.73%* 146.70%
June 30, 2020 June 30, 2021
Net Interest Margin
21.89%*
08
* FY 2020
** NPL relates to IFRS 9 stage 3 classification
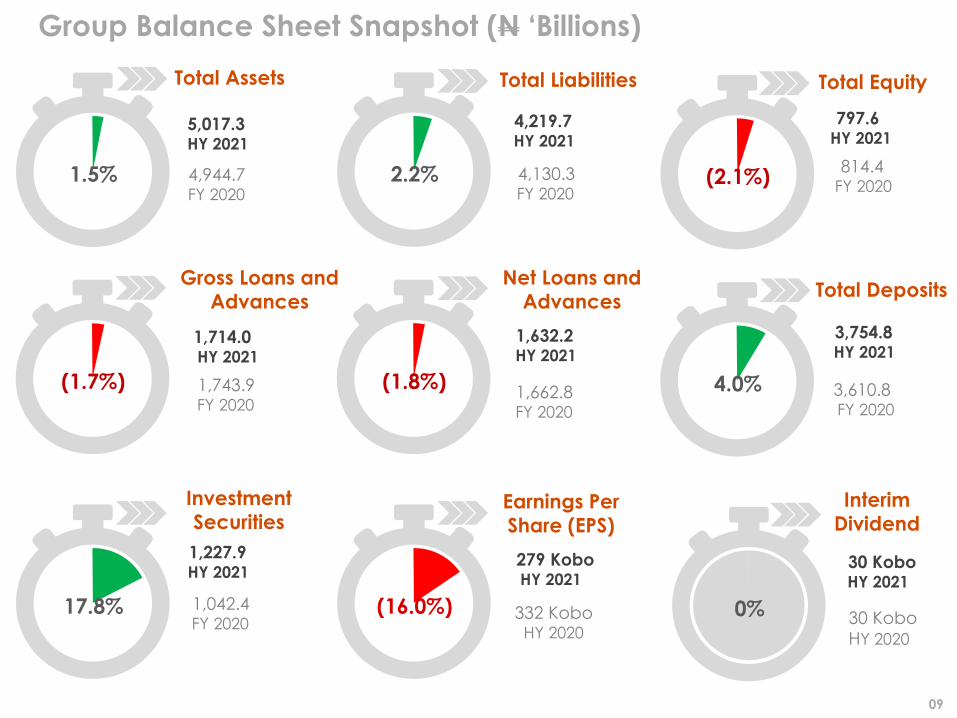
Group Balance Sheet Snapshot (N ‘Billions)
09
1.5% 2.2% (2.1%)
Total Assets Total Equity Total Liabilities
4,944.7 FY 2020
5,017.3 HY 2021
4,130.3 FY 2020
4,219.7 HY 2021
814.4 FY 2020
797.6 HY 2021
(1.7%) (1.8%) 4.0%
Gross Loans and
AdvancesTotal Deposits
Net Loans and
Advances
1,743.9 FY 2020
1,714.0 HY 2021
1,662.8 FY 2020
1,632.2 HY 2021
3,610.8 FY 2020
3,754.8HY 2021
17.8% (16.0%) 0%
Investment
SecuritiesInterim
Dividend Earnings Per
Share (EPS)
1,042.4 FY 2020
1,227.9 HY 2021
279 Kobo HY 2021
332 Kobo HY 2020
30 Kobo HY 2021
30 Kobo
HY 2020
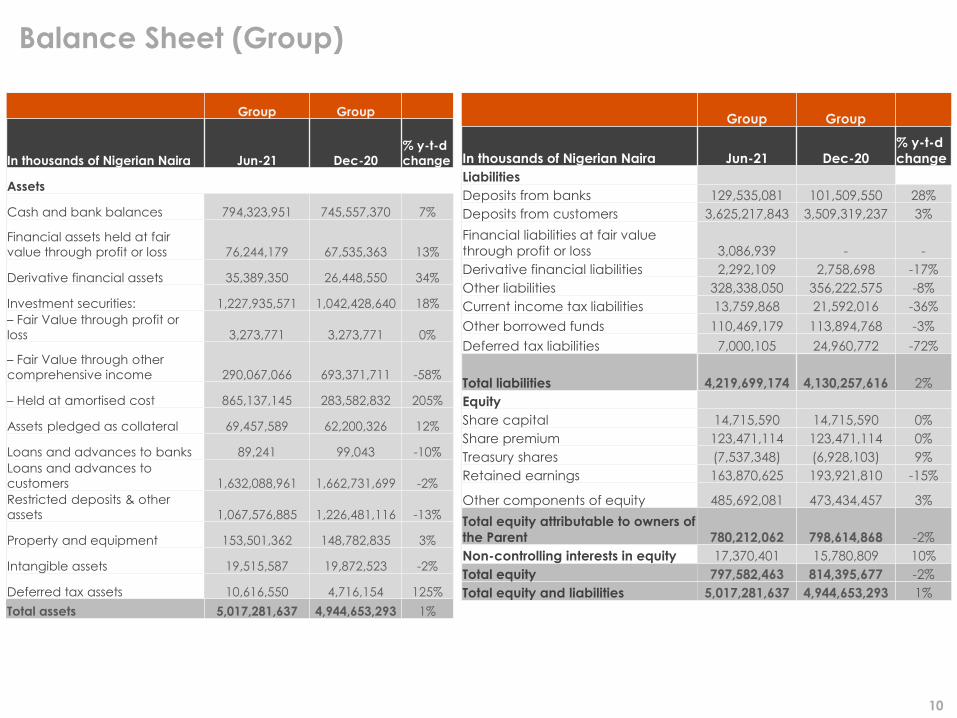
Balance Sheet (Group)
10
Group Group
In thousands of Nigerian Naira Jun-21 Dec-20
% y-t-d
change
Assets
Cash and bank balances 794,323,951 745,557,370 7%
Financial assets held at fair
value through profit or loss 76,244,179 67,535,363 13%
Derivative financial assets 35,389,350 26,448,550 34%
Investment securities: 1,227,935,571 1,042,428,640 18%
– Fair Value through profit or
loss 3,273,771 3,273,771 0%
– Fair Value through other
comprehensive income 290,067,066 693,371,711 -58%
– Held at amortised cost 865,137,145 283,582,832 205%
Assets pledged as collateral 69,457,589 62,200,326 12%
Loans and advances to banks 89,241 99,043 -10%
Loans and advances to
customers 1,632,088,961 1,662,731,699 -2%
Restricted deposits & other
assets 1,067,576,885 1,226,481,116 -13%
Property and equipment 153,501,362 148,782,835 3%
Intangible assets 19,515,587 19,872,523 -2%
Deferred tax assets 10,616,550 4,716,154 125%
Total assets 5,017,281,637 4,944,653,293 1%
Group Group
In thousands of Nigerian Naira Jun-21 Dec-20
% y-t-d
change
Liabilities
Deposits from banks 129,535,081 101,509,550 28%
Deposits from customers 3,625,217,843 3,509,319,237 3%
Financial liabilities at fair value
through profit or loss 3,086,939 - -
Derivative financial liabilities 2,292,109 2,758,698 -17%
Other liabilities 328,338,050 356,222,575 -8%
Current income tax liabilities 13,759,868 21,592,016 -36%
Other borrowed funds 110,469,179 113,894,768 -3%
Deferred tax liabilities 7,000,105 24,960,772 -72%
Total liabilities 4,219,699,174 4,130,257,616 2%
Equity
Share capital 14,715,590 14,715,590 0%
Share premium 123,471,114 123,471,114 0%
Treasury shares (7,537,348) (6,928,103) 9%
Retained earnings 163,870,625 193,921,810 -15%
Other components of equity 485,692,081 473,434,457 3%
Total equity attributable to owners of
the Parent 780,212,062 798,614,868 -2%
Non-controlling interests in equity 17,370,401 15,780,809 10%
Total equity 797,582,463 814,395,677 -2%
Total equity and liabilities 5,017,281,637 4,944,653,293 1%
2,640.06 3,086.27
3,610.83 3,754.75
163.00
145.35 113.89
110.47
233.43
525.97 356.22 328.34
576.28
720.93 814.40 797.58
Dec-2019 Jun-2020 Dec-2020 Jun-2021
Total Deposits Other Borrowed Funds Other Liabilities Equity
1,502.09 1,624.23 1,662.83 1,632.18
593.55 758.81 745.56 794.32
822.07 724.19
1,042.43 1,227.94 73.49 140.80
67.54 76.24
741.71
1,228.45 1,426.30 1,286.60
Dec-2019 Jun-2020 Dec-2020 Jun-2021Net Loans Cash and cash equivalents Investment securities Financial Assets held for trading Others
Funding Mix (₦'Bn)
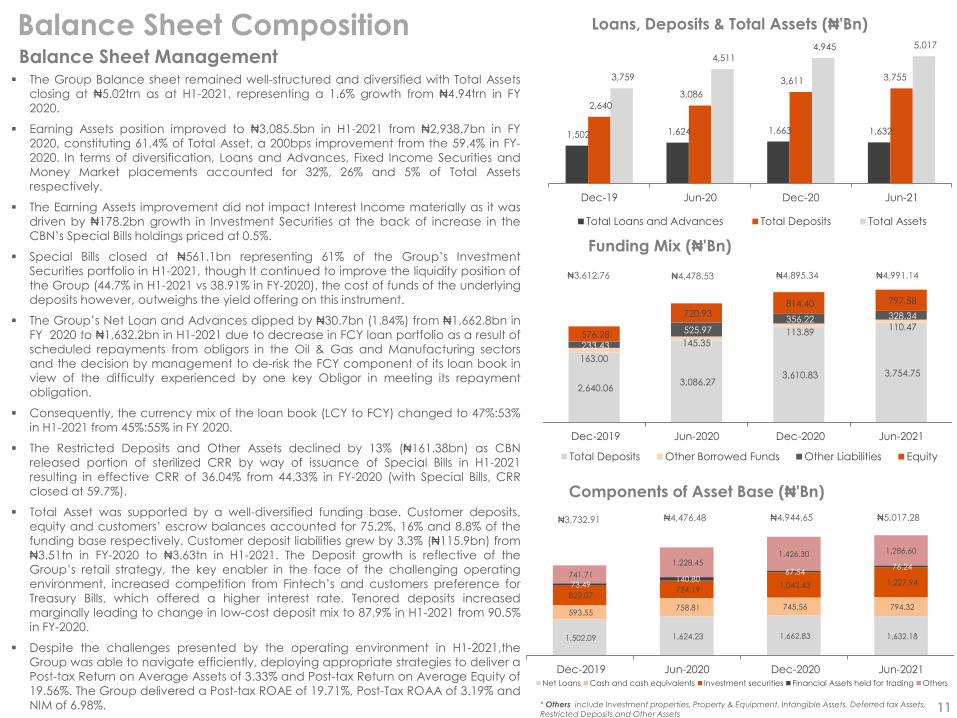
Balance Sheet Composition Loans, Deposits & Total Assets (₦'Bn)
Components of Asset Base (₦'Bn)
Balance Sheet Management
₦3,732.91 ₦4,476.48 ₦4,944.65
₦3,612.76 ₦4,478.53 ₦4,895.34
11
₦5,017.28
₦4,991.14
* Others include Investment properties, Property & Equipment, Intangible Assets, Deferred tax Assets,
Restricted Deposits and Other Assets
1,502 1,624 1,663 1,632
2,640
3,086
3,611 3,755 3,759
4,511 4,945 5,017
Dec-19 Jun-20 Dec-20 Jun-21
Total Loans and Advances Total Deposits Total Assets
▪ The Group Balance sheet remained well-structured and diversified with Total Assets
closing at ₦5.02trn as at H1-2021, representing a 1.6% growth from ₦4.94trn in FY
2020.
▪ Earning Assets position improved to ₦3,085.5bn in H1-2021 from ₦2,938.7bn in FY
2020, constituting 61.4% of Total Asset, a 200bps improvement from the 59.4% in FY-
2020. In terms of diversification, Loans and Advances, Fixed Income Securities and
Money Market placements accounted for 32%, 26% and 5% of Total Assets
respectively.
▪ The Earning Assets improvement did not impact Interest Income materially as it was
driven by ₦178.2bn growth in Investment Securities at the back of increase in the
CBN’s Special Bills holdings priced at 0.5%.
▪ Special Bills closed at ₦561.1bn representing 61% of the Group’s Investment
Securities portfolio in H1-2021, though It continued to improve the liquidity position of
the Group (44.7% in H1-2021 vs 38.91% in FY-2020), the cost of funds of the underlying
deposits however, outweighs the yield offering on this instrument.
▪ The Group’s Net Loan and Advances dipped by ₦30.7bn (1.84%) from ₦1,662.8bn in
FY 2020 to ₦1,632.2bn in H1-2021 due to decrease in FCY loan portfolio as a result of
scheduled repayments from obligors in the Oil & Gas and Manufacturing sectors
and the decision by management to de-risk the FCY component of its loan book in
view of the difficulty experienced by one key Obligor in meeting its repayment
obligation.
▪ Consequently, the currency mix of the loan book (LCY to FCY) changed to 47%:53%
in H1-2021 from 45%:55% in FY 2020.
▪ The Restricted Deposits and Other Assets declined by 13% (₦161.38bn) as CBN
released portion of sterilized CRR by way of issuance of Special Bills in H1-2021
resulting in effective CRR of 36.04% from 44.33% in FY-2020 (with Special Bills, CRR
closed at 59.7%).
▪ Total Asset was supported by a well-diversified funding base. Customer deposits,
equity and customers’ escrow balances accounted for 75.2%, 16% and 8.8% of the
funding base respectively. Customer deposit liabilities grew by 3.3% (₦115.9bn) from
₦3.51tn in FY-2020 to ₦3.63tn in H1-2021. The Deposit growth is reflective of the
Group’s retail strategy, the key enabler in the face of the challenging operating
environment, increased competition from Fintech’s and customers preference for
Treasury Bills, which offered a higher interest rate. Tenored deposits increased
marginally leading to change in low-cost deposit mix to 87.9% in H1-2021 from 90.5%
in FY-2020.
▪ Despite the challenges presented by the operating environment in H1-2021,the
Group was able to navigate efficiently, deploying appropriate strategies to deliver a
Post-tax Return on Average Assets of 3.33% and Post-tax Return on Average Equity of
19.56%. The Group delivered a Post-tax ROAE of 19.71%, Post-Tax ROAA of 3.19% and
NIM of 6.98%.
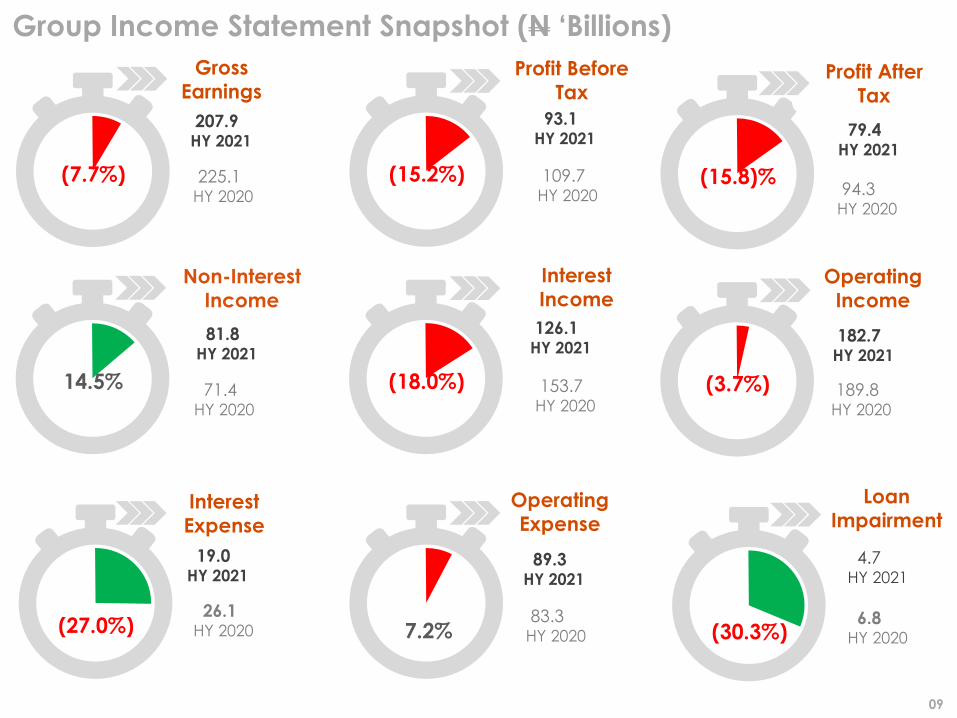
Group Income Statement Snapshot (N ‘Billions)
09
(7.7%) (15.2%) (15.8)%
Gross
EarningsProfit After
Tax
Profit Before
Tax
14.5% (18.0%) (3.7%)
Non-Interest
IncomeOperating
Income
Interest
Income
(27.0%) 7.2% (30.3%)
Interest
Expense
Loan
Impairment Operating
Expense
207.9 HY 2021
225.1 HY 2020
93.1 HY 2021
109.7 HY 2020
79.4 HY 2021
94.3 HY 2020
182.7 HY 2021
189.8 HY 2020
126.1 HY 2021
153.7 HY 2020
81.8 HY 2021
71.4 HY 2020
4.7 HY 2021
6.8 HY 2020
89.3 HY 2021
83.3 HY 2020
19.0 HY 2021
26.1 HY 2020
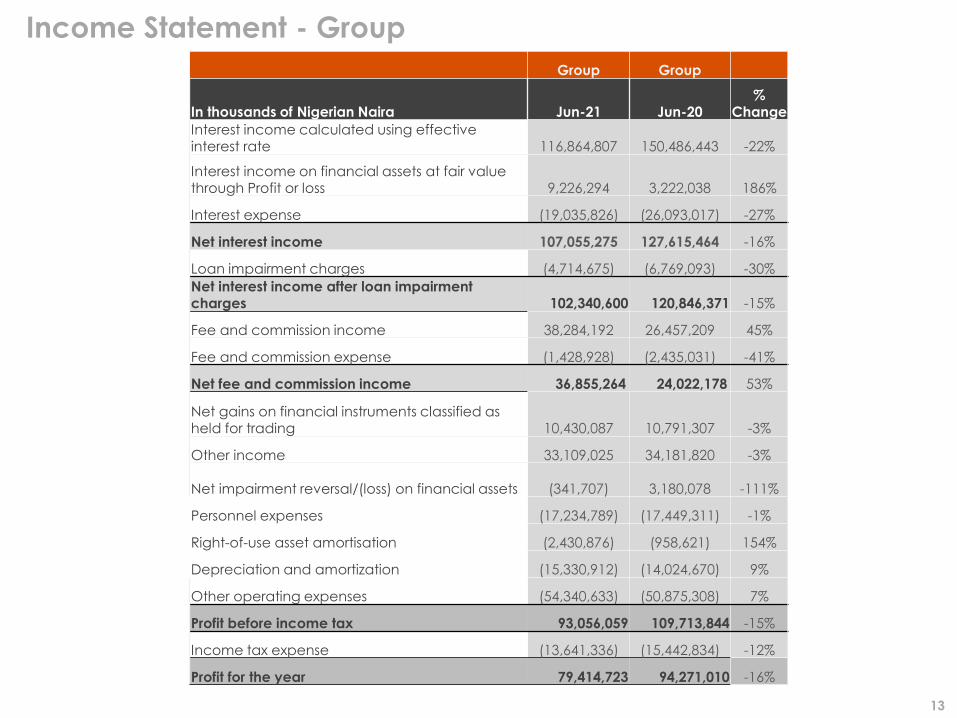
Income Statement - Group
13
Group Group
In thousands of Nigerian Naira Jun-21 Jun-20%
Change
Interest income calculated using effective interest rate 116,864,807 150,486,443 -22%
Interest income on financial assets at fair value through Profit or loss 9,226,294 3,222,038 186%
Interest expense (19,035,826) (26,093,017) -27%
Net interest income 107,055,275 127,615,464 -16%
Loan impairment charges (4,714,675) (6,769,093) -30%
Net interest income after loan impairment charges 102,340,600 120,846,371 -15%
Fee and commission income 38,284,192 26,457,209 45%
Fee and commission expense (1,428,928) (2,435,031) -41%
Net fee and commission income 36,855,264 24,022,178 53%
Net gains on financial instruments classified as held for trading 10,430,087 10,791,307 -3%
Other income 33,109,025 34,181,820 -3%
Net impairment reversal/(loss) on financial assets (341,707) 3,180,078 -111%
Personnel expenses (17,234,789) (17,449,311) -1%
Right-of-use asset amortisation (2,430,876) (958,621) 154%
Depreciation and amortization (15,330,912) (14,024,670) 9%
Other operating expenses (54,340,633) (50,875,308) 7%
Profit before income tax 93,056,059 109,713,844 -15%
Income tax expense (13,641,336) (15,442,834) -12%
Profit for the year 79,414,723 94,271,010 -16%
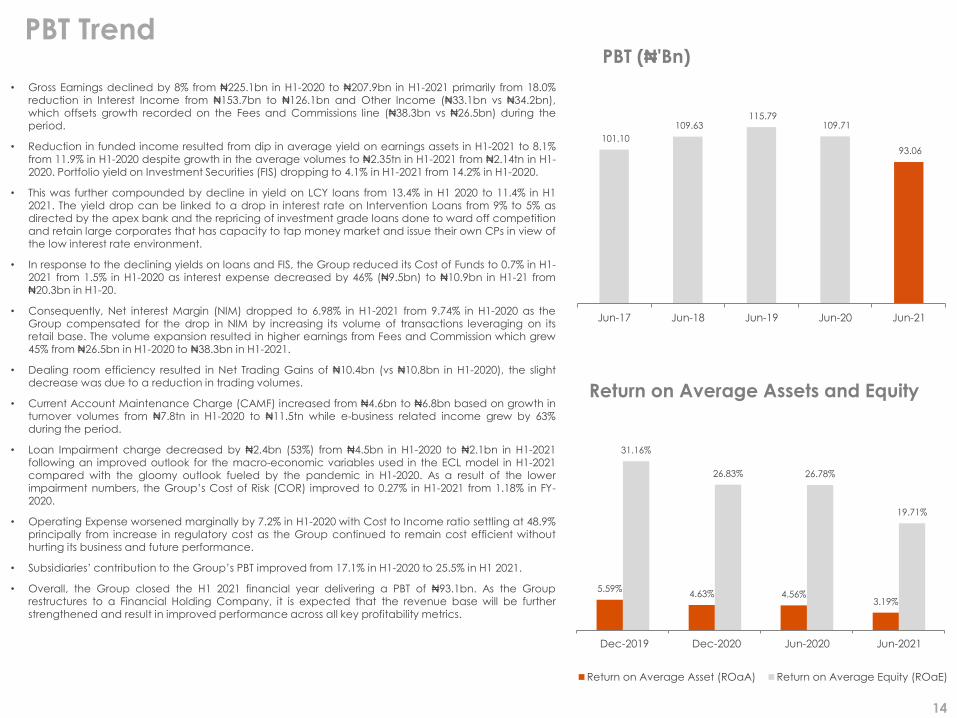
PBT Trend
Return on Average Assets and Equity
PBT (₦'Bn)
14
5.59%4.63% 4.56%
3.19%
31.16%
26.83% 26.78%
19.71%
Dec-2019 Dec-2020 Jun-2020 Jun-2021
Return on Average Asset (ROaA) Return on Average Equity (ROaE)
101.10
109.63 115.79
109.71
93.06
Jun-17 Jun-18 Jun-19 Jun-20 Jun-21
• Gross Earnings declined by 8% from ₦225.1bn in H1-2020 to ₦207.9bn in H1-2021 primarily from 18.0%reduction in Interest Income from ₦153.7bn to ₦126.1bn and Other Income (₦33.1bn vs ₦34.2bn),which offsets growth recorded on the Fees and Commissions line (₦38.3bn vs ₦26.5bn) during theperiod.
• Reduction in funded income resulted from dip in average yield on earnings assets in H1-2021 to 8.1%from 11.9% in H1-2020 despite growth in the average volumes to ₦2.35tn in H1-2021 from ₦2.14tn in H1-2020. Portfolio yield on Investment Securities (FIS) dropping to 4.1% in H1-2021 from 14.2% in H1-2020.
• This was further compounded by decline in yield on LCY loans from 13.4% in H1 2020 to 11.4% in H12021. The yield drop can be linked to a drop in interest rate on Intervention Loans from 9% to 5% asdirected by the apex bank and the repricing of investment grade loans done to ward off competitionand retain large corporates that has capacity to tap money market and issue their own CPs in view ofthe low interest rate environment.
• In response to the declining yields on loans and FIS, the Group reduced its Cost of Funds to 0.7% in H1-2021 from 1.5% in H1-2020 as interest expense decreased by 46% (₦9.5bn) to ₦10.9bn in H1-21 from₦20.3bn in H1-20.
• Consequently, Net interest Margin (NIM) dropped to 6.98% in H1-2021 from 9.74% in H1-2020 as theGroup compensated for the drop in NIM by increasing its volume of transactions leveraging on itsretail base. The volume expansion resulted in higher earnings from Fees and Commission which grew45% from ₦26.5bn in H1-2020 to ₦38.3bn in H1-2021.
• Dealing room efficiency resulted in Net Trading Gains of ₦10.4bn (vs ₦10.8bn in H1-2020), the slightdecrease was due to a reduction in trading volumes.
• Current Account Maintenance Charge (CAMF) increased from ₦4.6bn to ₦6.8bn based on growth inturnover volumes from ₦7.8tn in H1-2020 to ₦11.5tn while e-business related income grew by 63%during the period.
• Loan Impairment charge decreased by ₦2.4bn (53%) from ₦4.5bn in H1-2020 to ₦2.1bn in H1-2021following an improved outlook for the macro-economic variables used in the ECL model in H1-2021compared with the gloomy outlook fueled by the pandemic in H1-2020. As a result of the lowerimpairment numbers, the Group’s Cost of Risk (COR) improved to 0.27% in H1-2021 from 1.18% in FY-2020.
• Operating Expense worsened marginally by 7.2% in H1-2020 with Cost to Income ratio settling at 48.9%principally from increase in regulatory cost as the Group continued to remain cost efficient withouthurting its business and future performance.
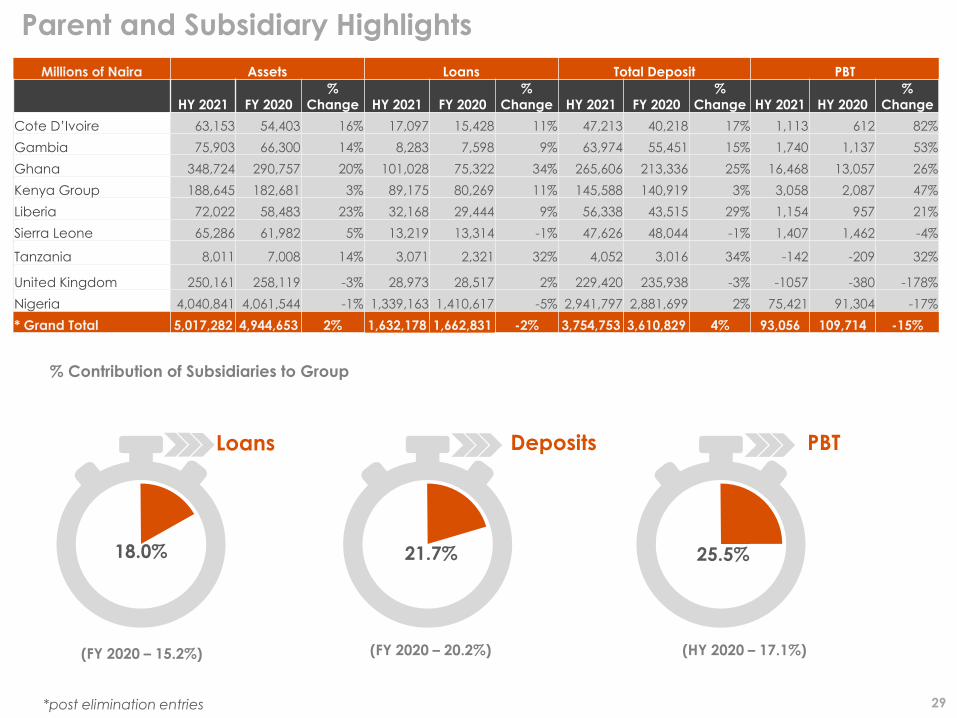
• Subsidiaries’ contribution to the Group’s PBT improved from 17.1% in H1-2020 to 25.5% in H1 2021.
• Overall, the Group closed the H1 2021 financial year delivering a PBT of ₦93.1bn. As the Grouprestructures to a Financial Holding Company, it is expected that the revenue base will be furtherstrengthened and result in improved performance across all key profitability metrics.
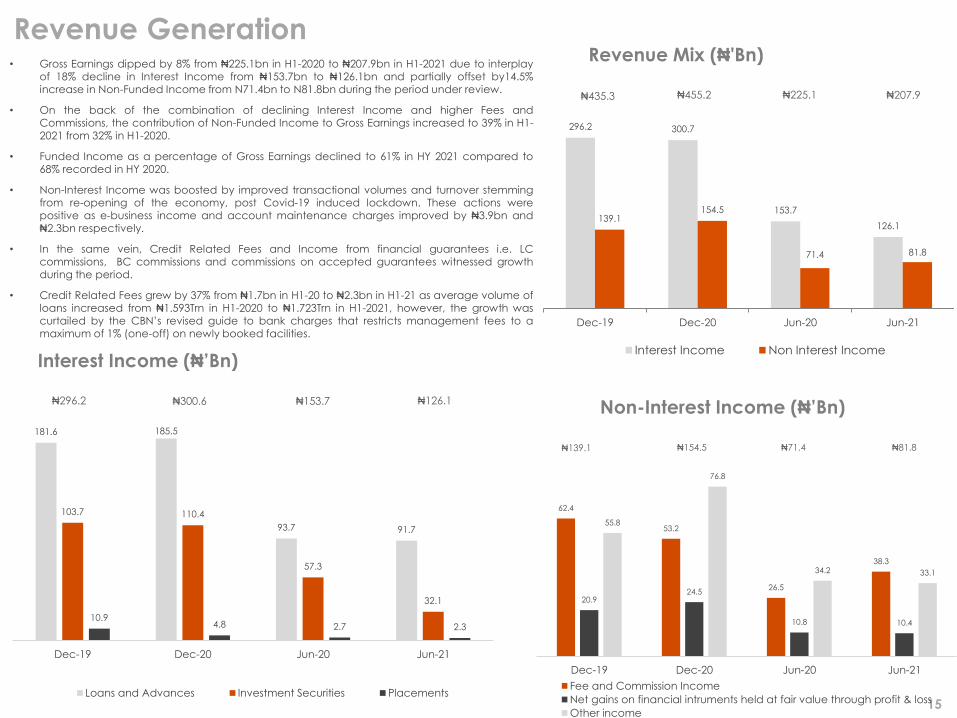
Revenue Mix (₦'Bn)Revenue Generation
Interest Income (₦’Bn)
76% 24% 63% 37% 52% 48%
77% 23%
Non-Interest Income (₦’Bn) ₦300.6₦296.2
₦139.1 ₦154.5 ₦71.4
₦435.3 ₦455.2 ₦225.1
₦153.7
15
₦207.9
₦81.8
₦126.1
62.4
53.2
26.5
38.3
20.924.5
10.8 10.4
55.8
76.8
34.2 33.1
Dec-19 Dec-20 Jun-20 Jun-21
Fee and Commission Income
Net gains on financial intruments held at fair value through profit & loss
Other income
181.6 185.5
93.7 91.7
103.7 110.4
57.3
32.1
10.94.8 2.7 2.3
Dec-19 Dec-20 Jun-20 Jun-21
Loans and Advances Investment Securities Placements
296.2 300.7
153.7
126.1139.1
154.5
71.4 81.8
Dec-19 Dec-20 Jun-20 Jun-21
Interest Income Non Interest Income
• Gross Earnings dipped by 8% from ₦225.1bn in H1-2020 to ₦207.9bn in H1-2021 due to interplayof 18% decline in Interest Income from ₦153.7bn to ₦126.1bn and partially offset by14.5%increase in Non-Funded Income from N71.4bn to N81.8bn during the period under review.
• On the back of the combination of declining Interest Income and higher Fees andCommissions, the contribution of Non-Funded Income to Gross Earnings increased to 39% in H1-2021 from 32% in H1-2020.
• Funded Income as a percentage of Gross Earnings declined to 61% in HY 2021 compared to68% recorded in HY 2020.
• Non-Interest Income was boosted by improved transactional volumes and turnover stemmingfrom re-opening of the economy, post Covid-19 induced lockdown. These actions werepositive as e-business income and account maintenance charges improved by ₦3.9bn and₦2.3bn respectively.
• In the same vein, Credit Related Fees and Income from financial guarantees i.e. LCcommissions, BC commissions and commissions on accepted guarantees witnessed growthduring the period.
• Credit Related Fees grew by 37% from ₦1.7bn in H1-20 to ₦2.3bn in H1-21 as average volume ofloans increased from ₦1.593Trn in H1-2020 to ₦1.723Trn in H1-2021, however, the growth wascurtailed by the CBN’s revised guide to bank charges that restricts management fees to amaximum of 1% (one-off) on newly booked facilities.
Margin Metrics
Net Interest Margin
Cost of Funds
Sustained Competitive Margins
Yields on Interest Earning Assets
16
9.28%9.74%
9.26%
6.98%
Dec-2019 Jun-2020 Dec-2020 Jun-2021
2.30%
1.51%
1.19%
0.67%
Dec-2019 Jun-2020 Dec-2020 Jun-2021
11.92% 11.86%11.06%
8.14%
Dec-2019 Jun-2020 Dec-2020 Jun-2021
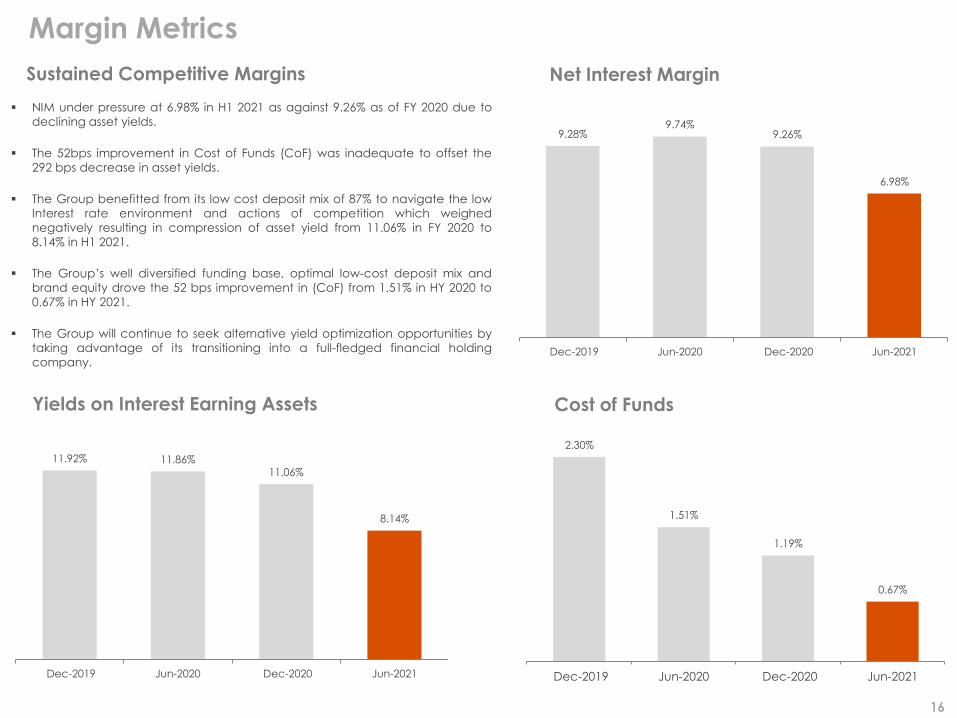
▪ NIM under pressure at 6.98% in H1 2021 as against 9.26% as of FY 2020 due to
declining asset yields.
▪ The 52bps improvement in Cost of Funds (CoF) was inadequate to offset the
292 bps decrease in asset yields.
▪ The Group benefitted from its low cost deposit mix of 87% to navigate the low
Interest rate environment and actions of competition which weighed
negatively resulting in compression of asset yield from 11.06% in FY 2020 to
8.14% in H1 2021.
▪ The Group’s well diversified funding base, optimal low-cost deposit mix and
brand equity drove the 52 bps improvement in (CoF) from 1.51% in HY 2020 to
0.67% in HY 2021.
▪ The Group will continue to seek alternative yield optimization opportunities by
taking advantage of its transitioning into a full-fledged financial holding
company.
Cost Efficiency
Overview of Expenses (₦'Bn)
Cost to Income (CIR)
Operating Expenses (OPEX) (₦'Bn)
Efficient Cost Management
₦130.97 ₦147.44 ₦83.31
₦203.70 ₦118.61₦220.33
17
₦114.52
₦89.34
36.11%38.24%
43.16%
48.98%
Dec-19 Dec-20 Jun-20 Jun-21
37.28 37.61
17.45 17.23
2.11 2.11
0.96 2.43
68.88 78.68
50.88 54.34
22.69
29.05
14.02 15.33
Dec-19 Dec-20 Jun-20 Jun-21
Depreciation and Amortization Other Operating Expenses
Operating Lease Expense/Right-of-Use Asset Amortisation Personnel Expenses
130.97
147.44
83.31 89.34
64.84
47.07
26.09 19.04
4.91
19.57
6.77 4.71 2.98 6.24
2.44 1.43
Dec-19 Dec-20 Jun-20 Jun-21
Operating Expenses Interest expense Loan impairment Fee and Commission Expense
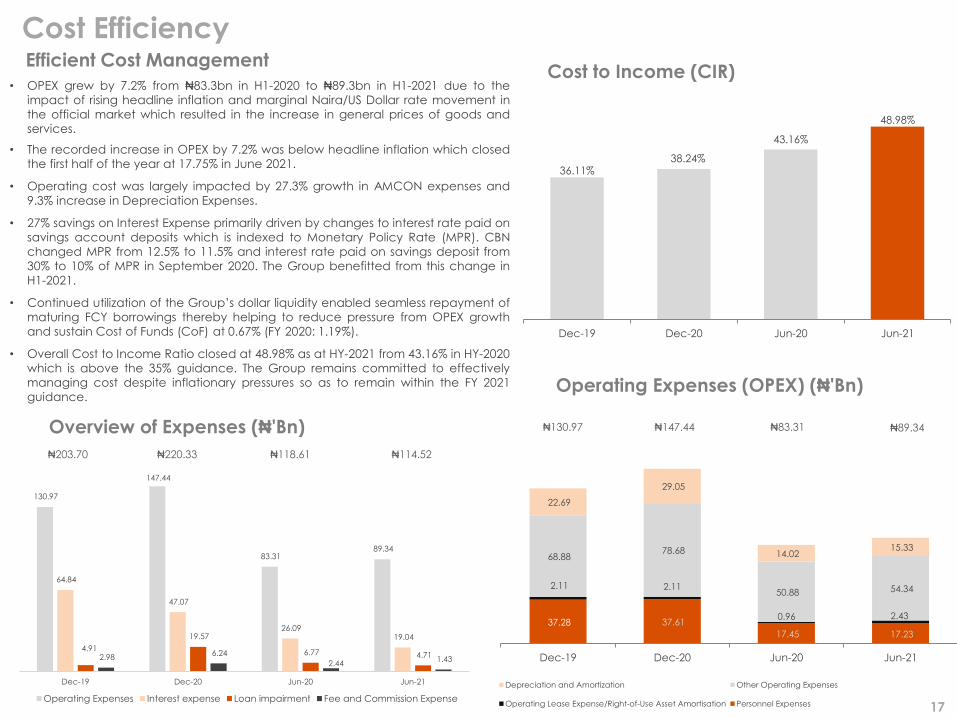
• OPEX grew by 7.2% from ₦83.3bn in H1-2020 to ₦89.3bn in H1-2021 due to the
impact of rising headline inflation and marginal Naira/US Dollar rate movement in
the official market which resulted in the increase in general prices of goods and
services.
• The recorded increase in OPEX by 7.2% was below headline inflation which closed
the first half of the year at 17.75% in June 2021.
• Operating cost was largely impacted by 27.3% growth in AMCON expenses and
9.3% increase in Depreciation Expenses.
• 27% savings on Interest Expense primarily driven by changes to interest rate paid on
savings account deposits which is indexed to Monetary Policy Rate (MPR). CBN
changed MPR from 12.5% to 11.5% and interest rate paid on savings deposit from
30% to 10% of MPR in September 2020. The Group benefitted from this change in
H1-2021.
• Continued utilization of the Group’s dollar liquidity enabled seamless repayment of
maturing FCY borrowings thereby helping to reduce pressure from OPEX growth
and sustain Cost of Funds (CoF) at 0.67% (FY 2020: 1.19%).
• Overall Cost to Income Ratio closed at 48.98% as at HY-2021 from 43.16% in HY-2020
which is above the 35% guidance. The Group remains committed to effectively
managing cost despite inflationary pressures so as to remain within the FY 2021
guidance.
OPEX Drivers
OPEX Drivers
Group Group
In billions of Naira June 2021 June 2020 Change (Y-o-Y) % Change (Y-o-Y)
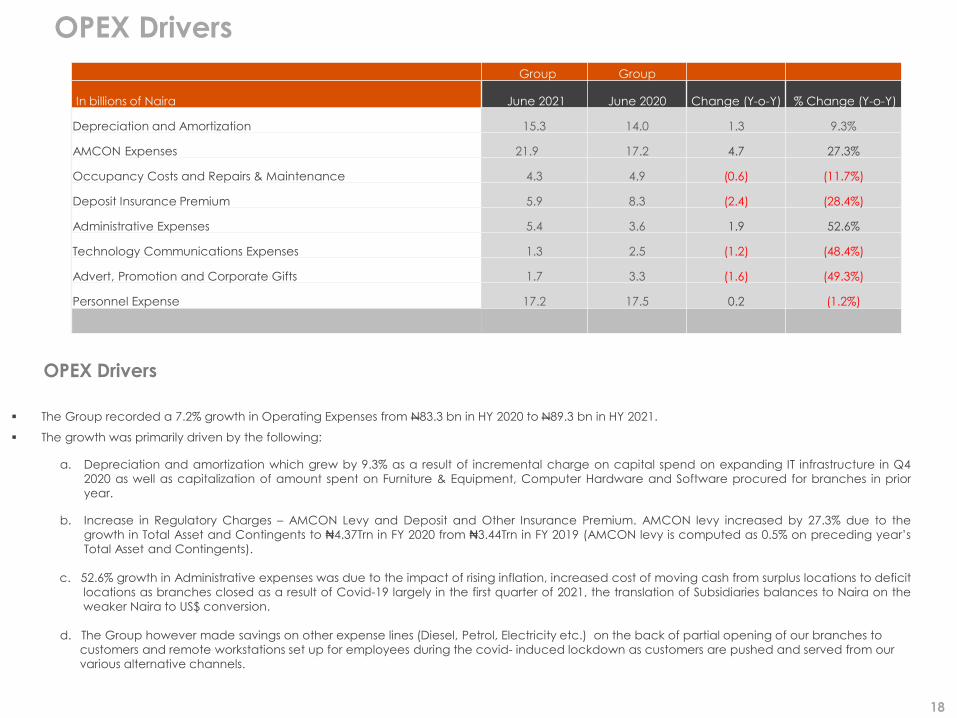
Depreciation and Amortization 15.3 14.0 1.3 9.3%
AMCON Expenses 21.9 17.2 4.7 27.3%
Occupancy Costs and Repairs & Maintenance 4.3 4.9 (0.6) (11.7%)
Deposit Insurance Premium 5.9 8.3 (2.4) (28.4%)
Administrative Expenses 5.4 3.6 1.9 52.6%
Technology Communications Expenses 1.3 2.5 (1.2) (48.4%)
Advert, Promotion and Corporate Gifts 1.7 3.3 (1.6) (49.3%)
Personnel Expense 17.2 17.5 0.2 (1.2%)
18
▪ The Group recorded a 7.2% growth in Operating Expenses from N83.3 bn in HY 2020 to N89.3 bn in HY 2021.
▪ The growth was primarily driven by the following:
a. Depreciation and amortization which grew by 9.3% as a result of incremental charge on capital spend on expanding IT infrastructure in Q4
2020 as well as capitalization of amount spent on Furniture & Equipment, Computer Hardware and Software procured for branches in prior
year.
b. Increase in Regulatory Charges – AMCON Levy and Deposit and Other Insurance Premium. AMCON levy increased by 27.3% due to the
growth in Total Asset and Contingents to ₦4.37Trn in FY 2020 from ₦3.44Trn in FY 2019 (AMCON levy is computed as 0.5% on preceding year’s
Total Asset and Contingents).
c. 52.6% growth in Administrative expenses was due to the impact of rising inflation, increased cost of moving cash from surplus locations to deficit
locations as branches closed as a result of Covid-19 largely in the first quarter of 2021, the translation of Subsidiaries balances to Naira on the
weaker Naira to US$ conversion.
d. The Group however made savings on other expense lines (Diesel, Petrol, Electricity etc.) on the back of partial opening of our branches to
customers and remote workstations set up for employees during the covid- induced lockdown as customers are pushed and served from our
various alternative channels.
Risk Asset Mix
Gross Loans by Industry
* Includes Fashion & Design, Religious Organizations, Hospitality, Clubs, co-operative societies, Unions, Engineering services etc.
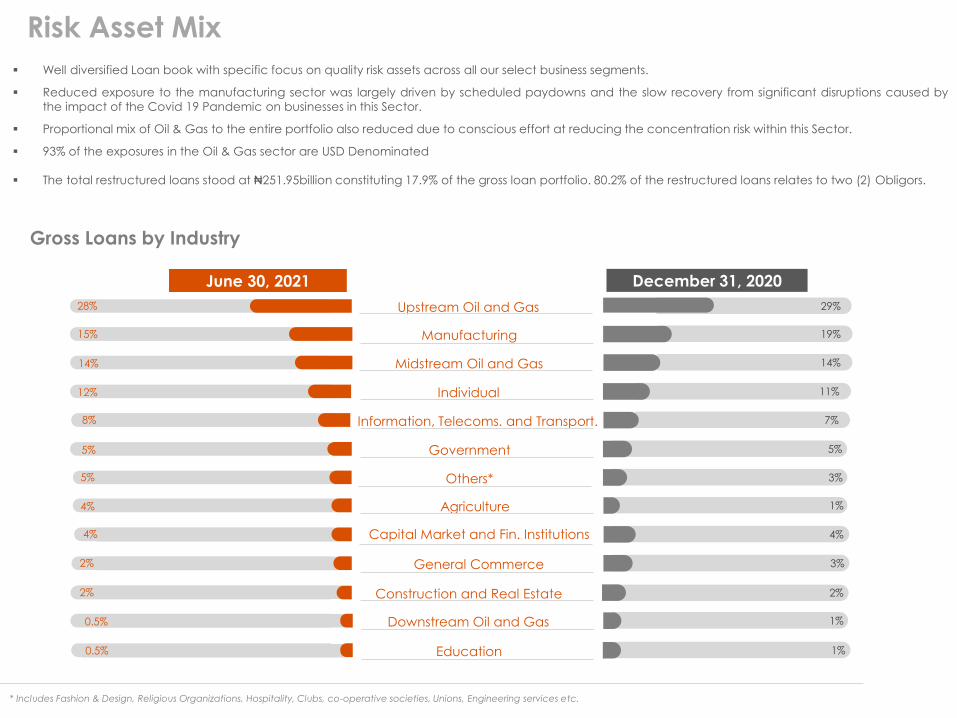
Upstream Oil and Gas 29%28%
Manufacturing 19%15%
Midstream Oil and Gas 14%14%
Individual 11%12%
Information, Telecoms. and Transport. 7%8%
Government 5%5%
Others* 3%5%
Agriculture 1%4%
Capital Market and Fin. Institutions 4%4%
General Commerce 3%2%
Construction and Real Estate 2%2%
Downstream Oil and Gas 1%0.5%
Education 1%0.5%
June 30, 2021 December 31, 2020
▪ Well diversified Loan book with specific focus on quality risk assets across all our select business segments.
▪ Reduced exposure to the manufacturing sector was largely driven by scheduled paydowns and the slow recovery from significant disruptions caused by
the impact of the Covid 19 Pandemic on businesses in this Sector.
▪ Proportional mix of Oil & Gas to the entire portfolio also reduced due to conscious effort at reducing the concentration risk within this Sector.
▪ 93% of the exposures in the Oil & Gas sector are USD Denominated
▪ The total restructured loans stood at ₦251.95billion constituting 17.9% of the gross loan portfolio. 80.2% of the restructured loans relates to two (2) Obligors.
6.53% 6.39%6.80%
6.75%
0.34%
1.18%
0.41% 0.27%
Dec-2019 Dec-2020 Jun-2020 Jun-2021
NPL/Total Loans Cost of Risk
NPL and CoverageAsset Quality
NPL by Industry NPL by Currency
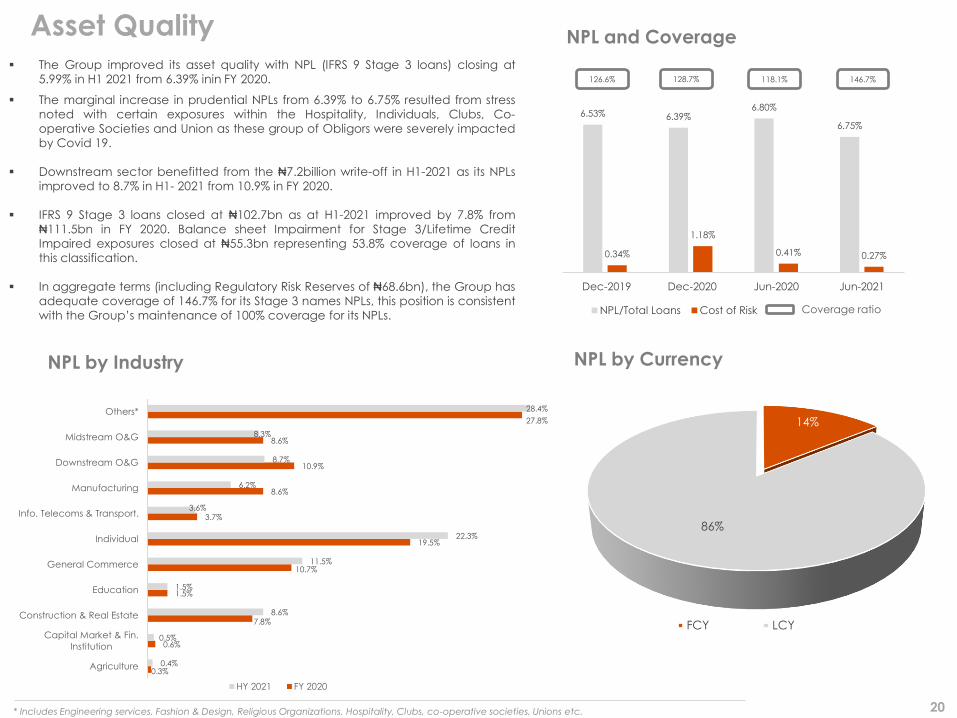
* Includes Engineering services, Fashion & Design, Religious Organizations, Hospitality, Clubs, co-operative societies, Unions etc.
Coverage ratio
118.1%128.7% 146.7%
20
14%
86%
FCY LCY
126.6%
0.3%
0.6%
7.8%
1.5%
10.7%
19.5%
3.7%
8.6%
10.9%
8.6%
27.8%
0.4%
0.5%
8.6%
1.5%
11.5%
22.3%
3.6%
6.2%
8.7%
8.3%
28.4%
Agriculture
Capital Market & Fin.
Institution
Construction & Real Estate
Education
General Commerce
Individual
Info. Telecoms & Transport.
Manufacturing
Downstream O&G
Midstream O&G
Others*
HY 2021 FY 2020
▪ The Group improved its asset quality with NPL (IFRS 9 Stage 3 loans) closing at
5.99% in H1 2021 from 6.39% inin FY 2020.
▪ The marginal increase in prudential NPLs from 6.39% to 6.75% resulted from stress
noted with certain exposures within the Hospitality, Individuals, Clubs, Co-
operative Societies and Union as these group of Obligors were severely impacted
by Covid 19.
▪ Downstream sector benefitted from the ₦7.2billion write-off in H1-2021 as its NPLs
improved to 8.7% in H1- 2021 from 10.9% in FY 2020.
▪ IFRS 9 Stage 3 loans closed at ₦102.7bn as at H1-2021 improved by 7.8% from
₦111.5bn in FY 2020. Balance sheet Impairment for Stage 3/Lifetime Credit
Impaired exposures closed at ₦55.3bn representing 53.8% coverage of loans in
this classification.
▪ In aggregate terms (including Regulatory Risk Reserves of ₦68.6bn), the Group has
adequate coverage of 146.7% for its Stage 3 names NPLs, this position is consistent
with the Group’s maintenance of 100% coverage for its NPLs.
Group
In Millions of Naira
Transitional IFRS 9
ImpactFull IFRS 9 Imapct
Jun. 21 Dec. 20 Jun. 21 Dec. 20
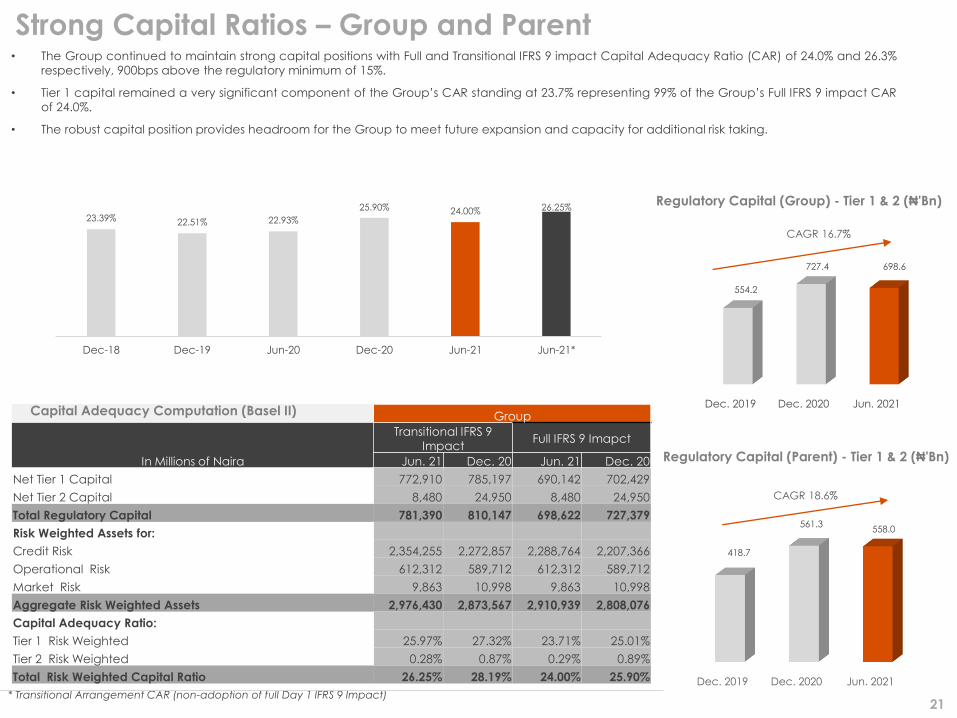
Net Tier 1 Capital 772,910 785,197 690,142 702,429
Net Tier 2 Capital 8,480 24,950 8,480 24,950
Total Regulatory Capital 781,390 810,147 698,622 727,379
Risk Weighted Assets for:
Credit Risk 2,354,255 2,272,857 2,288,764 2,207,366
Operational Risk 612,312 589,712 612,312 589,712
Market Risk 9,863 10,998 9,863 10,998
Aggregate Risk Weighted Assets 2,976,430 2,873,567 2,910,939 2,808,076
Capital Adequacy Ratio:
Tier 1 Risk Weighted 25.97% 27.32% 23.71% 25.01%
Tier 2 Risk Weighted 0.28% 0.87% 0.29% 0.89%
Total Risk Weighted Capital Ratio 26.25% 28.19% 24.00% 25.90% Dec. 2019 Dec. 2020 Jun. 2021
418.7
561.3558.0
Dec. 2019 Dec. 2020 Jun. 2021
554.2
727.4 698.6
Regulatory Capital (Group) - Tier 1 & 2 (₦'Bn)
Strong Capital Ratios – Group and Parent
Regulatory Capital (Parent) - Tier 1 & 2 (₦'Bn)
Capital Adequacy Computation (Basel II)
* Transitional Arrangement CAR (non-adoption of full Day 1 IFRS 9 Impact)
CAGR 16.7%
CAGR 18.6%
21
23.39% 22.51% 22.93%
25.90% 24.00% 26.25%
Dec-18 Dec-19 Jun-20 Dec-20 Jun-21 Jun-21*
• The Group continued to maintain strong capital positions with Full and Transitional IFRS 9 impact Capital Adequacy Ratio (CAR) of 24.0% and 26.3%
respectively, 900bps above the regulatory minimum of 15%.
• Tier 1 capital remained a very significant component of the Group’s CAR standing at 23.7% representing 99% of the Group’s Full IFRS 9 impact CAR
of 24.0%.
• The robust capital position provides headroom for the Group to meet future expansion and capacity for additional risk taking.
Liquidity Ratio
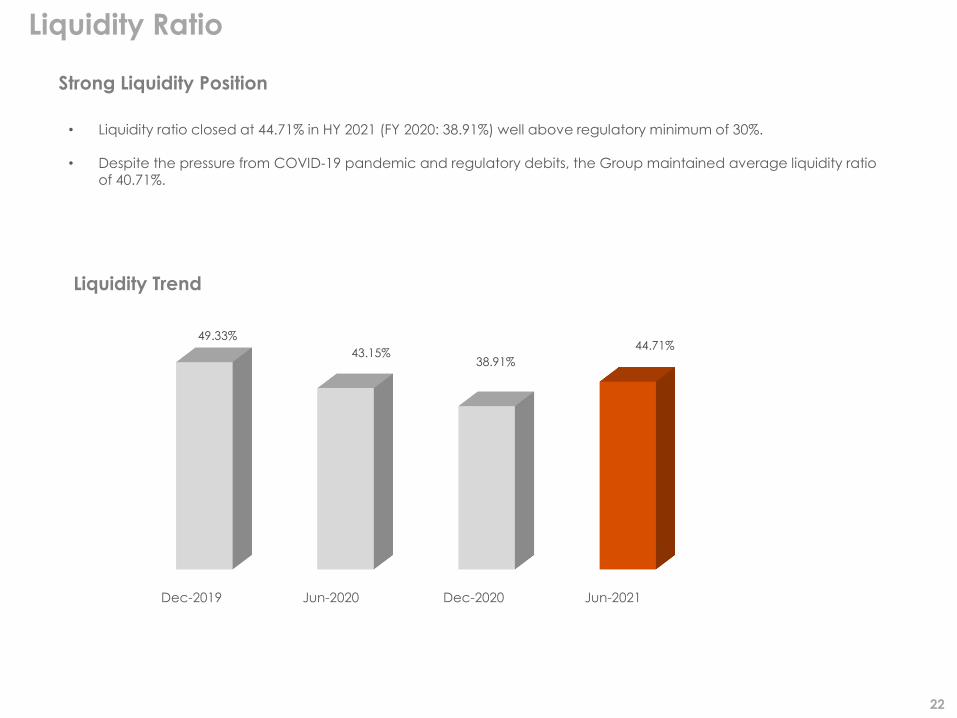
Strong Liquidity Position
Liquidity Trend
22
Dec-2019 Jun-2020 Dec-2020 Jun-2021
49.33%
43.15%38.91%
44.71%
• Liquidity ratio closed at 44.71% in HY 2021 (FY 2020: 38.91%) well above regulatory minimum of 30%.
• Despite the pressure from COVID-19 pandemic and regulatory debits, the Group maintained average liquidity ratioof 40.71%.
Digital Banking Performance (USSD)
USSD Value (in billions of Naira) USSD Volume (in millions)
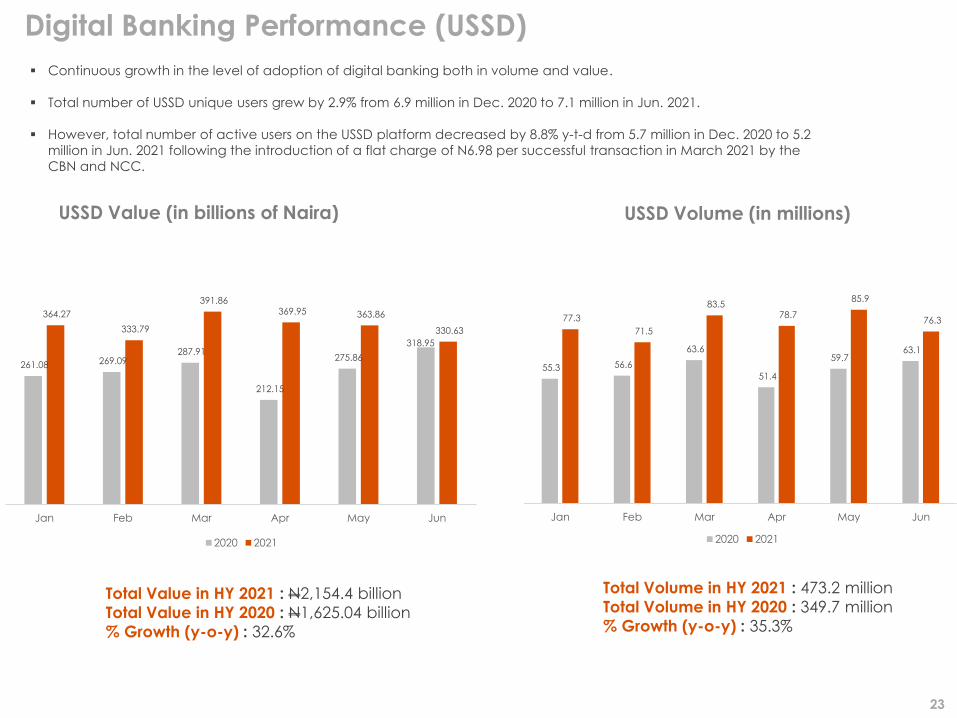
Total Volume in HY 2021 : 473.2 million
Total Volume in HY 2020 : 349.7 million
% Growth (y-o-y) : 35.3%
Total Value in HY 2021 : N2,154.4 billion
Total Value in HY 2020 : N1,625.04 billion
% Growth (y-o-y) : 32.6%
▪ Continuous growth in the level of adoption of digital banking both in volume and value.
▪ Total number of USSD unique users grew by 2.9% from 6.9 million in Dec. 2020 to 7.1 million in Jun. 2021.
▪ However, total number of active users on the USSD platform decreased by 8.8% y-t-d from 5.7 million in Dec. 2020 to 5.2
million in Jun. 2021 following the introduction of a flat charge of N6.98 per successful transaction in March 2021 by the
CBN and NCC.
23
55.3 56.6
63.6
51.4
59.7 63.1
77.3
71.5
83.5 78.7
85.9
76.3
Jan Feb Mar Apr May Jun
2020 2021
261.08 269.09 287.91
212.15
275.86
318.95
364.27
333.79
391.86 369.95 363.86
330.63
Jan Feb Mar Apr May Jun
2020 2021
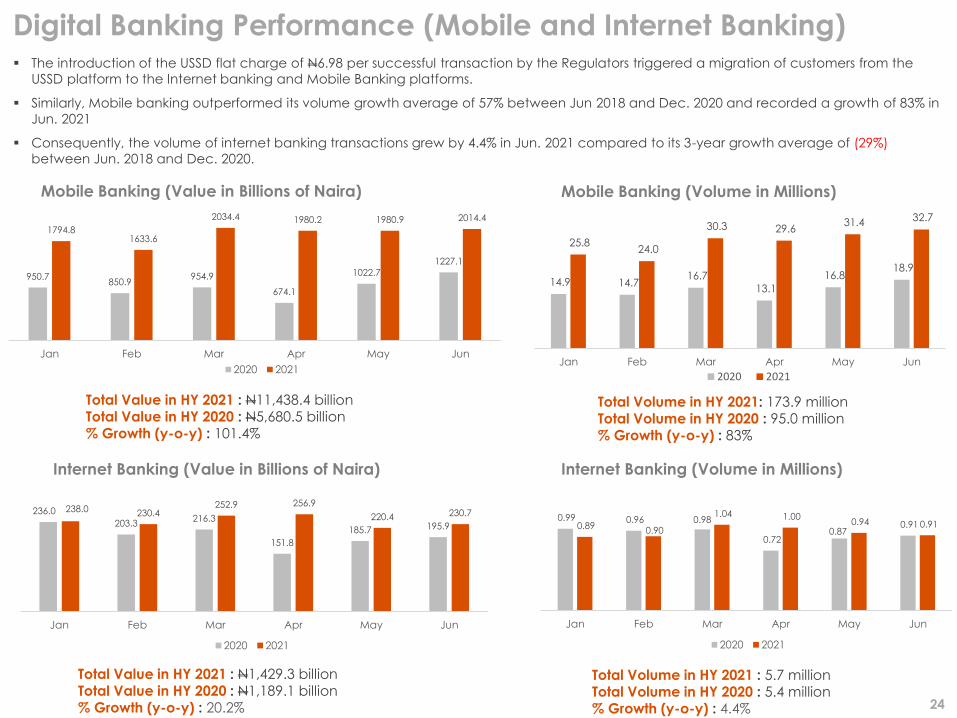
Digital Banking Performance (Mobile and Internet Banking)
Total Volume in HY 2021: 173.9 millionTotal Volume in HY 2020 : 95.0 million% Growth (y-o-y) : 83%
Total Value in HY 2021 : N11,438.4 billionTotal Value in HY 2020 : N5,680.5 billion% Growth (y-o-y) : 101.4%
Total Volume in HY 2021 : 5.7 millionTotal Volume in HY 2020 : 5.4 million% Growth (y-o-y) : 4.4%
Total Value in HY 2021 : N1,429.3 billionTotal Value in HY 2020 : N1,189.1 billion% Growth (y-o-y) : 20.2%
Mobile Banking (Value in Billions of Naira) Mobile Banking (Volume in Millions)
Internet Banking (Volume in Millions)Internet Banking (Value in Billions of Naira)
24
0.99 0.96 0.98
0.72 0.87
0.91 0.89 0.90
1.04 1.00 0.94 0.91
Jan Feb Mar Apr May Jun
2020 2021
236.0
203.3216.3
151.8
185.7 195.9
238.0 230.4252.9 256.9
220.4 230.7
Jan Feb Mar Apr May Jun
2020 2021
14.9 14.7 16.7
13.1
16.8 18.9
25.8 24.0
30.3 29.6 31.4 32.7
Jan Feb Mar Apr May Jun
2020 2021
950.7850.9
954.9
674.1
1022.7
1227.1
1794.81633.6
2034.4 1980.2 1980.9 2014.4
Jan Feb Mar Apr May Jun
2020 2021
▪ The introduction of the USSD flat charge of N6.98 per successful transaction by the Regulators triggered a migration of customers from the
USSD platform to the Internet banking and Mobile Banking platforms.
▪ Similarly, Mobile banking outperformed its volume growth average of 57% between Jun 2018 and Dec. 2020 and recorded a growth of 83% in
Jun. 2021
▪ Consequently, the volume of internet banking transactions grew by 4.4% in Jun. 2021 compared to its 3-year growth average of (29%)
between Jun. 2018 and Dec. 2020.

Business Segments &
Subsidiary Review
Description Loans Deposits PBT
75.9%*
Public
Sector
Retail
SME
Commercial
Institutional and
Wholesale
Public Sector
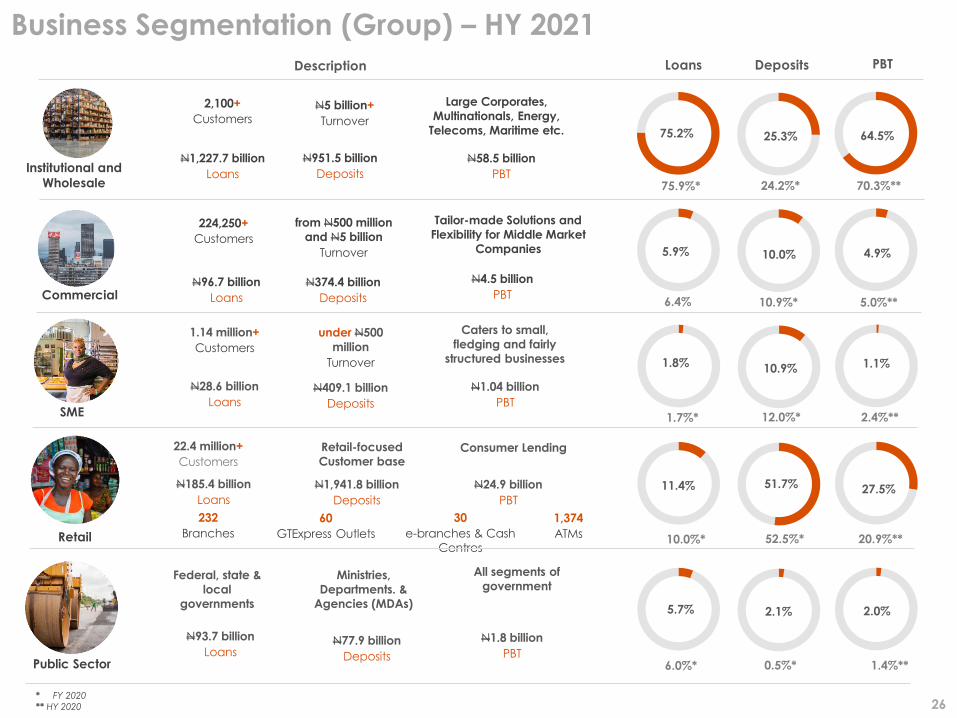
Business Segmentation (Group) – HY 2021
2,100+
CustomersN5 billion+
Turnover
N1,227.7 billion
Loans
N951.5 billion
Deposits
N58.5 billion
PBT
Large Corporates,
Multinationals, Energy,
Telecoms, Maritime etc.
224,250+
Customers
from N500 million
and N5 billion
Turnover
N96.7 billion
Loans
N374.4 billion
Deposits
N4.5 billion
PBT
Tailor-made Solutions and
Flexibility for Middle Market
Companies
1.14 million+
Customers
under N500
million
Turnover
Caters to small,
fledging and fairly
structured businesses
N28.6 billion
Loans
N409.1 billion
Deposits
N1.04 billion
PBT
Retail
22.4 million+
Customers
Retail-focused
Customer base
N185.4 billion
Loans
N1,941.8 billion
Deposits
N24.9 billion
PBT
232
Branches
60
GTExpress Outlets
30
e-branches & Cash
Centres
1,374
ATMs
Ministries,
Departments. &
Agencies (MDAs)
All segments of
government
N93.7 billion
LoansN77.9 billion
Deposits
N1.8 billion
PBT
24.2%* 70.3%**
6.4% 10.9%* 5.0%**
1.7%* 12.0%* 2.4%**
10.0%* 52.5%* 20.9%**
6.0%* 0.5%* 1.4%**
* FY 2020
** HY 2020
Consumer Lending
26
Federal, state &
local
governments
5.9% 10.0% 4.9%
1.8% 10.9% 1.1%
75.2% 25.3% 64.5%
11.4% 51.7% 27.5%
5.7% 2.1% 2.0%
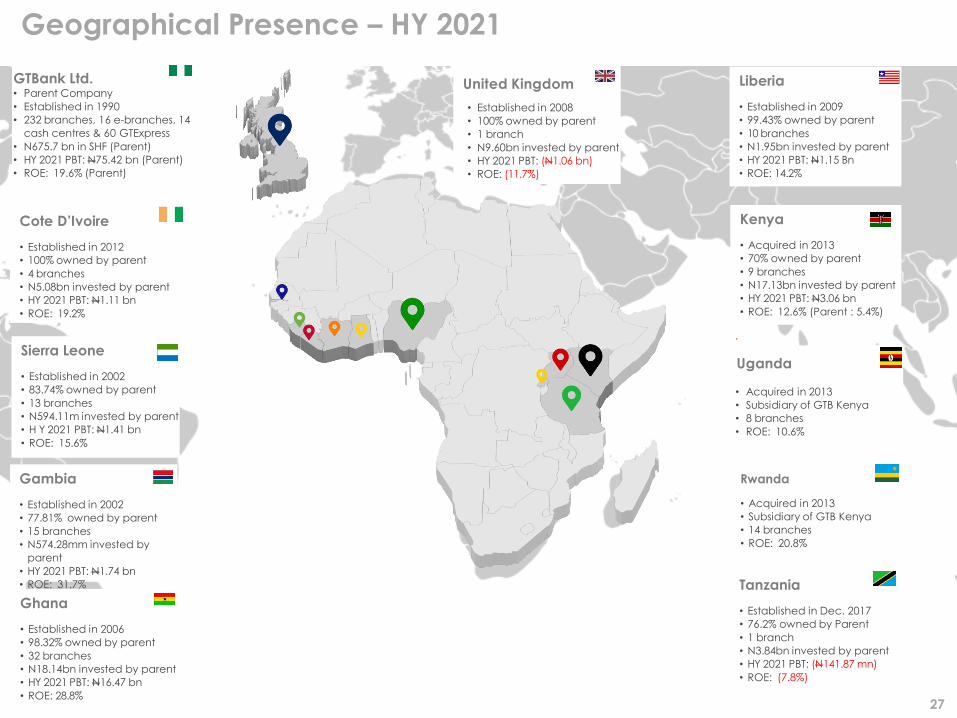
Geographical Presence – HY 2021
27
Cote D’Ivoire
• Established in 2012
• 100% owned by parent
• 4 branches
• N5.08bn invested by parent
• HY 2021 PBT: N1.11 bn
• ROE: 19.2%
United Kingdom
• Established in 2008
• 100% owned by parent
• 1 branch
• N9.60bn invested by parent
• HY 2021 PBT: (N1.06 bn)
• ROE: (11.7%)
Kenya
• Acquired in 2013
• 70% owned by parent
• 9 branches
• N17.13bn invested by parent
• HY 2021 PBT: N3.06 bn
• ROE: 12.6% (Parent : 5.4%)
Uganda
• Acquired in 2013
• Subsidiary of GTB Kenya
• 8 branches
• ROE: 10.6%
Rwanda
• Acquired in 2013
• Subsidiary of GTB Kenya
• 14 branches
• ROE: 20.8%
Tanzania
• Established in Dec. 2017
• 76.2% owned by Parent
• 1 branch
• N3.84bn invested by parent
• HY 2021 PBT: (N141.87 mn)
• ROE: (7.8%)
Ghana
• Established in 2006
• 98.32% owned by parent
• 32 branches
• N18.14bn invested by parent
• HY 2021 PBT: N16.47 bn
• ROE: 28.8%
Gambia
• Established in 2002
• 77.81% owned by parent
• 15 branches
• N574.28mm invested by
parent
• HY 2021 PBT: N1.74 bn
• ROE: 31.7%
Sierra Leone
• Established in 2002
• 83.74% owned by parent
• 13 branches
• N594.11m invested by parent
• H Y 2021 PBT: N1.41 bn
• ROE: 15.6%
GTBank Ltd.• Parent Company
• Established in 1990
• 232 branches, 16 e-branches, 14
cash centres & 60 GTExpress
• N675.7 bn in SHF (Parent)
• HY 2021 PBT: N75.42 bn (Parent)
• ROE: 19.6% (Parent)
Liberia
• Established in 2009
• 99.43% owned by parent
• 10 branches
• N1.95bn invested by parent
• HY 2021 PBT: N1.15 Bn
• ROE: 14.2%
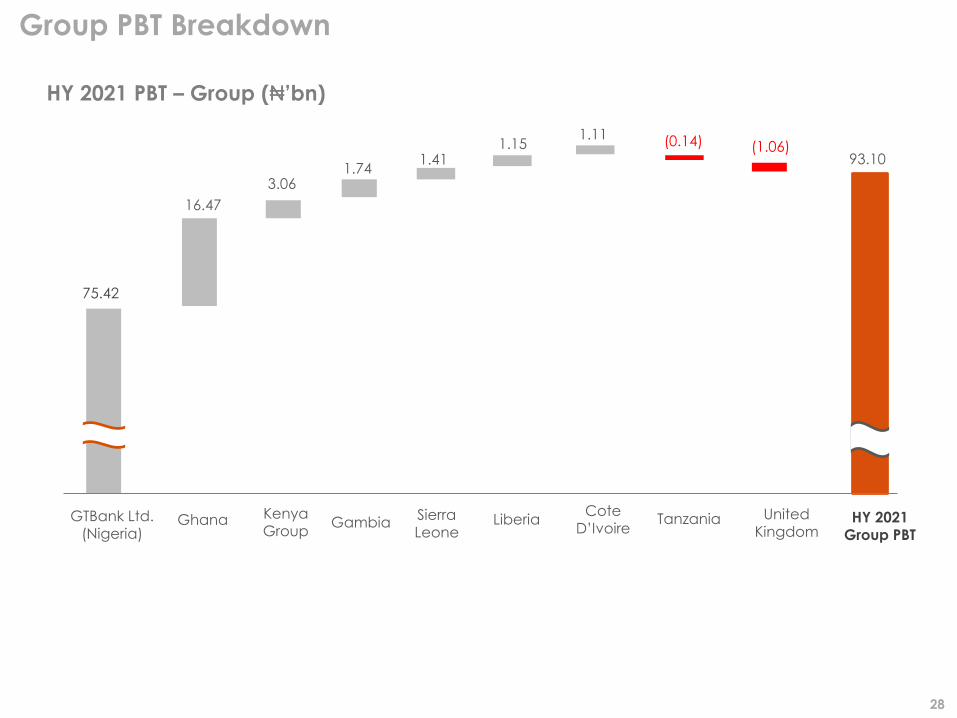
75.42
16.47
1.741.41
3.06
1.15 (0.14)1.11
GTBank Ltd. (Nigeria)
Ghana Sierra Leone
Kenya Group
Gambia Liberia United Kingdom
Cote D’Ivoire
HY 2021 Group PBT
93.10
HY 2021 PBT – Group (₦’bn)
Group PBT Breakdown
Tanzania
(1.06)
28
*post elimination entries
Parent and Subsidiary Highlights
% Contribution of Subsidiaries to Group
(FY 2020 – 15.2%) (FY 2020 – 20.2%) (HY 2020 – 17.1%)
Loans Deposits PBT
25.5%21.7%18.0%
29
Millions of Naira Assets Loans Total Deposit PBT
HY 2021 FY 2020
%
Change HY 2021 FY 2020
%
Change HY 2021 FY 2020
%
Change HY 2021 HY 2020
%
Change
Cote D’Ivoire 63,153 54,403 16% 17,097 15,428 11% 47,213 40,218 17% 1,113 612 82%
Gambia 75,903 66,300 14% 8,283 7,598 9% 63,974 55,451 15% 1,740 1,137 53%
Ghana 348,724 290,757 20% 101,028 75,322 34% 265,606 213,336 25% 16,468 13,057 26%
Kenya Group 188,645 182,681 3% 89,175 80,269 11% 145,588 140,919 3% 3,058 2,087 47%
Liberia 72,022 58,483 23% 32,168 29,444 9% 56,338 43,515 29% 1,154 957 21%
Sierra Leone 65,286 61,982 5% 13,219 13,314 -1% 47,626 48,044 -1% 1,407 1,462 -4%
Tanzania 8,011 7,008 14% 3,071 2,321 32% 4,052 3,016 34% -142 -209 32%
United Kingdom 250,161 258,119 -3% 28,973 28,517 2% 229,420 235,938 -3% -1057 -380 -178%
Nigeria 4,040,841 4,061,544 -1% 1,339,163 1,410,617 -5% 2,941,797 2,881,699 2% 75,421 91,304 -17%
* Grand Total 5,017,282 4,944,653 2% 1,632,178 1,662,831 -2% 3,754,753 3,610,829 4% 93,056 109,714 -15%
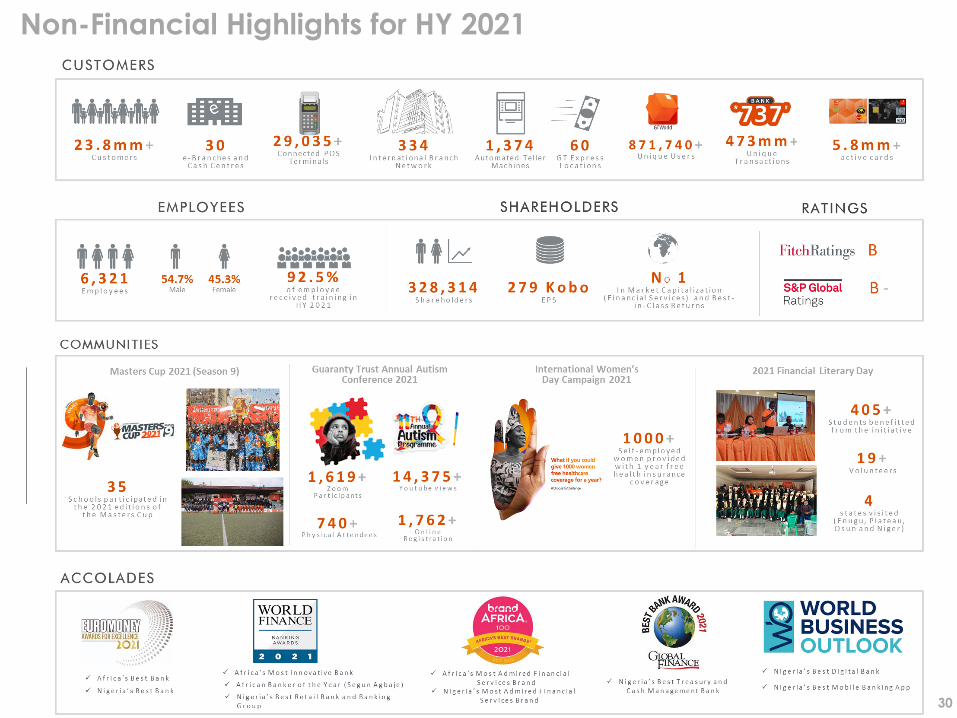
Non-Financial Highlights for HY 2021
30
Guidance and
Plans for FY 2021
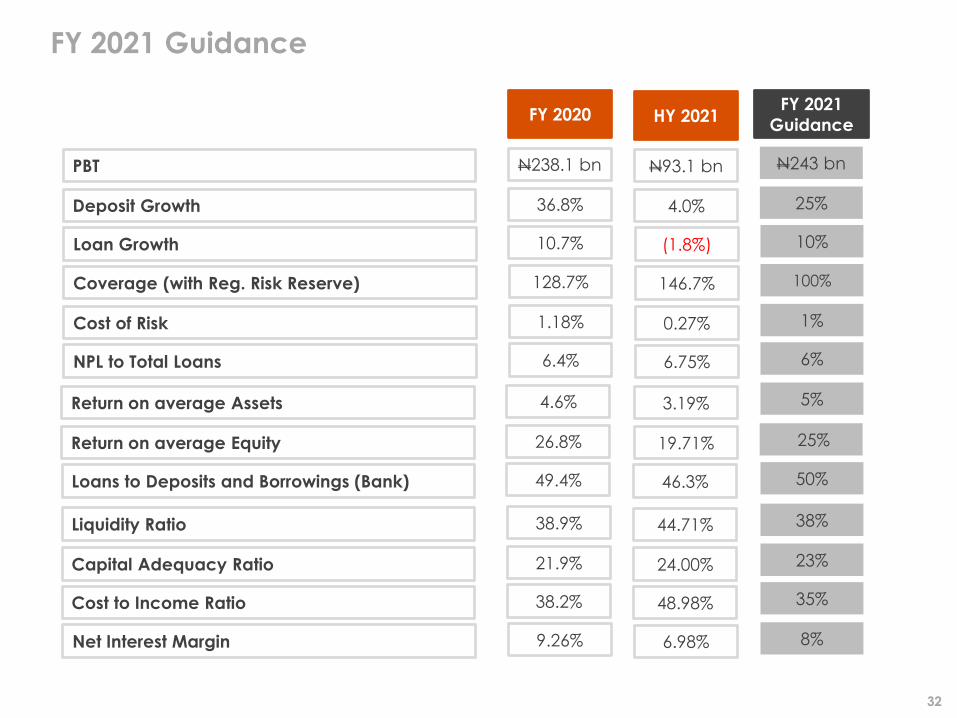
FY 2021 Guidance
FY 2021
GuidanceHY 2021FY 2020
PBT N243 bn
Deposit Growth 25%
Loan Growth 10%
Coverage (with Reg. Risk Reserve) 100%
Cost of Risk 1%
NPL to Total Loans 6%
N93.1 bn
4.0%
(1.8%)
146.7%
0.27%
6.75%
N238.1 bn
36.8%
10.7%
128.7%
1.18%
6.4%
Return on average Assets 5%
Return on average Equity 25%
Loans to Deposits and Borrowings (Bank) 50%
Liquidity Ratio 38%
Capital Adequacy Ratio 23%
Cost to Income Ratio 35%
3.19%
19.71%
46.3%
44.71%
24.00%
48.98%
4.6%
26.8%
49.4%
38.9%
21.9%
38.2%
Net Interest Margin 8%6.98%9.26%
32

This presentation is based on Guaranty Trust Holding Company Plc (“GTCO” or “Group”)’s audited financialresults for the half year ended June 30, 2021 prepared in accordance with International Financial ReportingStandards (“IFRS”) as issued by the International Accounting Standards Board (IASB). The Group has also obtainedcertain information in this presentation from sources it believes to be reliable. Although GTCo has taken allreasonable care to ensure that such external information are accurate and correct, the Group makes norepresentation or warranty, express or implied, as to the accuracy, correctness or completeness of suchinformation.Furthermore, GTCo makes no representation or warranty, express or implied, that its future operating, financial orother results will be consistent with results implied, directly or indirectly, by information contained herein or withGTCo's past operating, financial or other results. Any information herein is as of the date of this presentation andmay change without notice. GTCo undertakes no obligation to update the information in this presentation. Inaddition, some of the information in this presentation may be condensed or incomplete, and this presentationmay not contain all material information in respect of GTCo.
This presentation may also contain “forward-looking statements” that relate to, among other things, GTCo’splans, objectives, goals, strategies, future operations and performance. Such forward-looking statements may becharacterised using words such as “estimates,” “aims,” “expects,” “projects,” “believes,” “intends,” “plans,” “may,”“will” and “should” and other similar expressions which are not the exclusive means of identifying such statements.Such forward-looking statements involve known and unknown risks, uncertainties and other important factors thatcould cause GTCo’s operating, financial or other results to be materially different from the operating, financial orother results expressed or implied by such statements. Furthermore, GTCo makes no representation or warranty,express or implied, that the operating, financial or other results anticipated by such forward-looking statements willbe achieved. Such forward-looking statements represent, in each case, only one of many possible scenariosand should not be viewed as the most likely or standard scenario. GTCo undertakes no obligation to update theforward-looking statements in this presentation.
Disclaimer
33

Thank You


![Investors/Analysts' Presentation [Company Update]](https://img.pdfslide.us/doc/110x75/577c7e161a28abe054a08404/investorsanalysts-presentation-company-update.jpg)


![Revised Investors & Analysts Presentation [Company Update]](https://img.pdfslide.us/doc/110x75/577c7ad21a28abe05496456b/revised-investors-analysts-presentation-company-update.jpg)
![Analysts/ Institutional Investors Presentation [Company Update]](https://img.pdfslide.us/doc/110x75/577ca7741a28abea748c67cb/analysts-institutional-investors-presentation-company-update.jpg)