Embed Size (px)
Citation preview

Office of the New York State Comp-troller
Thomas P. DiNapoli
Office of the New York State ComptrollerThomas P. DiNapoli
New York State and Local Retirement System A pension trust fund of the State of New York
2021 For Fiscal Year Ended March 31, 2021
COMPREHENSIVE ANNUAL FINANCIAL REPORT
NYSLRS1921–2021A Century of Pension Security
NYSLRSNYSLRS
New York State and Local Retirement System
Prepared by the staff of the
New York State and Local Retirement SystemEmployees’ Retirement System
Police and Fire Retirement System
A pension trust fund of the State of New York
For Fiscal Year Ended March 31, 2021
2021 COMPREHENSIVE ANNUAL FINANCIAL REPORT
2 Contents New York State and Local Retirement System
CONTENTS
INTRODUCTIONProfessional Awards ............................................................................................................................. 9
Letter of Transmittal .......................................................................................................................... 11
Administrative Organization ................................................................................................................. 20
Advisory Committees ............................................................................................................. 20
New York State and Local Retirement System Organization Chart ....................................................... 25
Overview of the New York State and Local Retirement System ...................................................................... 26
By the Numbers ................................................................................................................................ 31
Members and Retirees ............................................................................................................ 31
Retirees in New York State ....................................................................................................... 32
Annual Benefit Payments Within New York State ........................................................................... 33
Annual Benefit Payments Within the United States ........................................................................ 34
Annual Benefit Payments Outside the United States ....................................................................... 34

Contents 2021 Comprehensive Annual Financial Report 3
FINANCIALIndependent Auditors’ Report .............................................................................................................. 37
Management’s Discussion and Analysis (Unaudited) .................................................................................. 39
Basic Financial Statements................................................................................................................... 44
Combining Basic Statement of Fiduciary Net Position ..................................................................... 44
Combining Basic Statement of Changes in Fiduciary Net Position ....................................................... 45
Notes to Basic Financial Statements .......................................................................................... 46
Required Supplementary Information (Unaudited) .................................................................................... 74
Schedule of Changes in the Employers’ Net Pension Liability and Related Ratios (Unaudited) ................... 74
Schedule of Employer Contributions (Unaudited) .......................................................................... 78
Schedule of Investment Returns (Unaudited) ................................................................................ 78
Notes to Required Supplementary Information (Unaudited) ............................................................. 79
Other Supplementary Information (Unaudited) ............................................................................................................. 80
Schedule of Administrative Expenses (Unaudited) ......................................................................... 80
Schedule of Investment Expenses (Unaudited) .............................................................................. 81
Schedule of Consulting Fees (Unaudited) ..................................................................................... 82
Independent Auditors’ Report on Internal Control Over Financial Reporting and on Compliance and Other Matters Based on an Audit of Financial Statements Performed in Accordance with Government Auditing Standards ............. 83
CONTENTS CONTINUED
4 Contents New York State and Local Retirement System
INVESTMENT Overview of Investments ..................................................................................................................... 87
Corporate Governance ...................................................................................................................... 100
Investment Results ........................................................................................................................... 104
Investment Summary ........................................................................................................................ 105
Asset Allocation — March 31, 2021 ....................................................................................................... 106
Public Equity Performance .................................................................................................................. 107
Public Equity Fund of Fund Performance ..................................................................................................................... 109
Domestic Equity Portfolio — Ten Largest Holdings .................................................................................... 110
Fixed Income Portfolio and Comparison ................................................................................................. 111
Fixed Income Performance ................................................................................................................. 112
Fixed Income Portfolio — Ten Largest Holdings ........................................................................................113
Real Estate Portfolio .......................................................................................................................... 114
Alternative Investments Summary ........................................................................................................ 115
Public Equity Management Fees .......................................................................................................... 116
Public Equity Commissions — Internally Managed .................................................................................... 117
Public Equity Commissions — Externally Managed ...................................................................................118
Global Fixed Income Management Fees ................................................................................................. 121
Long-Term Domestic Bond Transactions — Internally Managed ....................................................................122
Long-Term Domestic Bond Transactions — Externally Managed ...................................................................123
Short-Term Domestic Bond Transactions — Internally Managed ...................................................................124
Real Estate Management and Incentive Fees (Expensed) ............................................................................125
Real Estate Management and Incentive Fees (Capitalized) ..........................................................................126
Private Equity Management Fees (Expensed) .......................................................................................... 127
Private Equity Management Fees (Capitalized) ......................................................................................... 128
Private Equity — Fee, Expense and Carried Interest Analysis .......................................................................129
Opportunistic/Absolute Return Strategies Funds Management and Incentive Fees (Expensed) ............................130
Opportunistic Funds Management Fees (Capitalized) ................................................................................ 131
Real Assets Management Fees (Expensed) .............................................................................................. 132
Real Assets Management Fees (Capitalized) ............................................................................................ 133
Credit Management Fees (Expensed)........................................................................................................................... 134
Consultant and Advisor Fees ............................................................................................................... 135
CONTENTS CONTINUED

Contents 2021 Comprehensive Annual Financial Report 5
ACTUARIAL Statement of the Actuary ................................................................................................................... 139
Actuarial Cost Method and Valuation .................................................................................................... 141
Elements of the Actuarial Valuation ...................................................................................................... 143
Actuarial Valuation Balance Sheets ....................................................................................................... 147
Local Government Employers’ Final Contribution Rates for Select Plans .........................................................149
Contribution Rate Trends for Local Governments ..................................................................................... 151
Employer Contributions ..................................................................................................................... 154
Historical Trends (Rates as a Percentage of Salary, 1977 – 2022) ...................................................................156
Changes in Contributions ................................................................................................................... 157
Assets and Accrued Liabilities .............................................................................................................. 158
Solvency Test .................................................................................................................................. 159
Schedule of Active Member Data ......................................................................................................... 160
Schedule of Retired Members and Beneficiaries ....................................................................................... 161
CONTENTS CONTINUED

6 Contents New York State and Local Retirement System
STATISTICALSchedule of Additions to Fiduciary Net Position ....................................................................................... 165
Schedule of Investment Income/(Loss) ................................................................................................... 166
Schedule of Deductions from Fiduciary Net Position ................................................................................. 167
Schedule of Total Changes in Fiduciary Net Position .................................................................................. 168
Service Retirees — ERS ...................................................................................................................... 170
Service Retirees — PFRS..................................................................................................................... 172
Disability Retirees — ERS ................................................................................................................... 174
Disability Retirees — PFRS .................................................................................................................. 176
New Option Selections ...................................................................................................................... 178
Option Selections — Total Payments ..................................................................................................... 179
Average Pension Benefits Paid During Year Shown .................................................................................... 180
Average Benefit Pay Types .................................................................................................................. 181
New Benefits — Service Retirements by Age and Service ...........................................................................183
New Benefits — Accidental and Ordinary Death ....................................................................................... 184
Combined System Participants ............................................................................................................. 185
Membership by Age and Years of Service ............................................................................................... 186
Membership by Tier .......................................................................................................................... 187
Membership by Status ....................................................................................................................... 188
Number of Employers ....................................................................................................................... 189
Total Membership by Employer Type .................................................................................................... 190
Average Salary by Employer Type ......................................................................................................... 191
Members and Salaries by Plan — ERS .................................................................................................... 192
Members and Salaries by Plan — PFRS .................................................................................................. 194
Retirees and Beneficiaries by Age ......................................................................................................... 196
Retirees and Beneficiaries — ERS ......................................................................................................... 197
Retirees and Beneficiaries — PFRS ........................................................................................................ 198
Local Government Salaries and Billings — ERS ......................................................................................... 199
Local Government Salaries and Billings — PFRS........................................................................................201
Contributions Recorded 2012 – 2021 .................................................................................................... 203
20-Year Summary ............................................................................................................................. 204
Notes to 20-Year Summary ................................................................................................................. 206
CONTENTS CONTINUED

IntroductionSince January 1, 1921, NYSLRS employees have made it their mission to ensure that
members of the New York State and Local Retirement System receive responsive,
expert service. In addition, we have made it a top priority to make sure our members
and retirees understand their rights and benefits. From our plan publications and
web presentations, to our Call Center and automated phone line, to our self-service
website Retirement Online, we continually develop new and innovative ways to help
our members make important decisions about their retirement.
A Century of Service
NYSLRS1921–2021
SOURCE: NEW YORK STATE ARCHIVES. NEW YORK (STATE). DEPT. OF HEALTH. BUREAU OF COMMUNICATIONS.

8 Introduction 2021 Comprehensive Annual Financial Report
CONTENTS
Professional Awards ............................................................................................................................. 9
Letter of Transmittal .......................................................................................................................... 11
Administrative Organization ................................................................................................................. 20
Advisory Committees ............................................................................................................. 20
New York State and Local Retirement System Organization Chart ....................................................... 25
Overview of the New York State and Local Retirement System ...................................................................... 26
By the Numbers ................................................................................................................................ 31
Members and Retirees ............................................................................................................ 31
Retirees in New York State ....................................................................................................... 32
Annual Benefit Payments Within New York State ........................................................................... 33
Annual Benefit Payments Within the United States ........................................................................ 34
Annual Benefit Payments Outside the United States ....................................................................... 34
Introduction 2021 Comprehensive Annual Financial Report 9
PROFESSIONAL AWARDS
Government Finance Officers Association
Certificate of Achievementfor Excellence
in Financial Reporting
Presented to
New York State Employees' Retirement System
For its Comprehensive AnnualFinancial Report
For the Fiscal Year Ended
March 31, 2020
Executive Director/CEO

10 Introduction 2021 Comprehensive Annual Financial Report
PROFESSIONAL AWARDS CONTINUED
Public Pension Coordinating Council
Public Pension Standards Award For Funding and Administration
2020
Presented to
New York State and Local Retirement System
In recognition of meeting professional standards for plan funding and administration as
set forth in the Public Pension Standards.
Presented by the Public Pension Coordinating Council, a confederation of
National Association of State Retirement Administrators (NASRA) National Conference on Public Employee Retirement Systems (NCPERS)
National Council on Teacher Retirement (NCTR)
Alan H. Winkle
Program Administrator
P CP C

Introduction 2021 Comprehensive Annual Financial Report 11
September 30, 2021
To the Governor, the State Legislature and the People of New York State:
I am pleased to present the Comprehensive Annual Financial Report for the New York State and Local Retirement System (the System or NYSLRS) for the fiscal year ended March 31, 2021.
We believe the enclosed financial statements and data are fairly presented in all material respects and are reported in a manner designed to present the financial position and results of the System’s operations accurately. This
report is intended to provide complete and reliable information as a basis for making management decisions, adhering to and complying with legal requirements, and ensuring responsible stewardship of the System’s assets.
Responsibility for the accuracy of the data, and the completeness and fairness of the report, including all disclosures, rests with the System. All disclosures required and necessary to enable the public and the financial community to gain an understanding of the System’s financial activities have been included. The Financial section of this report was prepared to conform with Generally Accepted Accounting Principles (GAAP) for governmental units, as set forth by the Governmental Accounting Standards Board (GASB), as well as the reporting requirements prescribed by the Government Finance Officers Association of the United States and Canada (GFOA). GAAP defines uniform minimum standards of, and guidelines for, financial accounting and reporting. These principles establish the framework within which financial transactions are recorded and reported, resulting in financial statements that provide comparability between government entities, consistency between accounting periods, and reliability for both internal and external users of financial statements.
The System’s transactions are reported on the accrual basis of accounting. Sufficient internal accounting controls exist to provide reasonable assurance regarding the safekeeping of assets and the fair presentation of the financial statements and supporting schedules.
LETTER OF TRANSMITTAL
Phone: 1-866-805-0990 518-474-7736Web: www.osc.state.ny.us/retirement
NYSLRSNYSLRS
New York State and Local Retirement System110 State Street, Albany, New York 12244-0001
Office of the New York State ComptrollerThomas P. DiNapoli

12 Introduction 2021 Comprehensive Annual Financial Report
The Financial section features a Management’s Discussion and Analysis (MD&A). GASB requires that the System provide a narrative introduction, overview and analysis to accompany the basic financial statements in the form of an MD&A. This letter of transmittal complements the MD&A and should be read in conjunction with it. The MD&A can be found in the Financial section immediately following the report of the independent auditors.
I am proud that the System was awarded a Certificate of Achievement for Excellence in Financial Reporting from GFOA for its Comprehensive Annual Financial Report for the fiscal year ended March 31, 2020. The Certificate of Achievement is a prestigious national award recognizing excellence in the preparation of state and local government financial reports. GFOA awards these certificates to those governments whose comprehensive annual financial reports meet or exceed the Association’s strict criteria. To be awarded a Certificate of Achievement, a governmental unit must publish a comprehensive, easily readable and efficiently organized annual financial report that conforms to program standards and that satisfies both generally accepted accounting principles and applicable legal requirements.
The System has received this respected award for each of the past 17 years. We believe that our current report continues to meet the Certificate of Achievement program requirements and are submitting it to GFOA for consideration again this year.
NYSLRS administers two distinct systems. They are the New York State and Local Employees’ Retirement System (ERS) and the New York State and Local Police and Fire Retirement System (PFRS). The assets of ERS and PFRS are held in the New York State Common Retirement Fund (Fund) and managed by the Division of Pension Investment and Cash Management in the Office of the State Comptroller.
With more than one million participants, the System is one of the largest public retirement systems in the nation.
The System offers service retirement benefits for members who reach specific ages or have completed a specified number of years of service, depending on the system and plan in which they are enrolled, as well as disability retirement and death benefits. At the end of fiscal year 2020-21, the System had a total of 1,172,147 members, retirees and beneficiaries, and 2,967 participating employers.
The following highlights some of the System’s operations for the 2020-21 fiscal year.
LETTER OF TRANSMITTAL CONTINUED

Introduction 2021 Comprehensive Annual Financial Report 13
NYSLRS’ CENTENNIAL
I have the honor of being Comptroller during a special time in our retirement system’s history, its 100th anniversary. On January 1, 1921, what was originally called the New York State Employees’ Retirement System, began helping New York’s public employees achieve financial security in retirement.
In 1920, the State Commission on Pensions presented Governor Al Smith a report showing that, though there were already pension plans covering 8,300 State employees, 10,175 State employees were not covered. The Commission called for establishing a system that would always have funds on hand sufficient to pay benefits to all State employees. On May 11, 1920, Governor Smith signed the legislation creating what would later become NYSLRS.
On June 30, 1921, the pension fund was valued at more than $8.2 million and provided pensions to 43 retirees. The total amount of their pensions was $17,420.16. Today, the Fund is valued at an audited $258.1 billion, and there are 496,628 retirees and beneficiaries. During fiscal year ending 2020-21, NYSLRS paid out $14.02 billion in retirement and death benefits.
One hundred years after first opening our doors, NYSLRS’ mission remains the same: to provide secure pensions to New York’s public employees. This has been our promise since 1921, and that promise will continue far into the future.
COVID-19
The COVID-19 pandemic has upended all our lives. Many New Yorkers continue to struggle, and many of our communities and local governments have experienced serious financial hardships while demands for public services have grown.
Helping our members, retirees and beneficiaries through this painful time became one of our top priorities. At my request, an executive order was issued in April 2020 waiving the standard 15-day waiting period from the time a member applies for retirement and the actual retirement date. This waiver protected the families of members who died during the waiting period, ensuring that beneficiaries would receive a monthly pension benefit instead of a one-time death benefit payment. (This executive order is no longer in effect.)
My staff worked with the State Legislature on a new law to protect the families of our front-line public workers who died from contracting COVID-19 on the job. This law helped alleviate financial hardships by providing eligible beneficiaries with a monthly pension instead of a one-time death benefit payment.
Many NYSLRS retirees, such as healthcare professionals and other essential staff, returned to work when coronavirus cases surged and critical workforce shortages occurred. Normally, public retirees under the age of 65 cannot earn more than $35,000 per year from a public employer. This statutory earnings limit
LETTER OF TRANSMITTAL CONTINUED

14 Introduction 2021 Comprehensive Annual Financial Report
was suspended by executive order to protect these retirees from reductions in their pensions while they filled critical needs in our communities.
To help New Yorkers overcome the ongoing challenges of the pandemic, my office created a COVID-19 Financial Survival Toolkit. This online toolkit offers useful resources that give New York’s residents, non-profits, government entities and businesses easy access to the vital assistance and information they need.
Employers also struggled as they dealt with a financial crisis, as well as a public health crisis. Legislation to help alleviate the financial difficulties of local governments and school districts was introduced at my request and signed into law in August 2020. The law provides greater financial and budgetary flexibility, easing the burdens local governments and school districts will face until our economy fully recovers.
Federal aid totaling nearly $24 billion that was part of the American Rescue Plan will help our State, cities, towns and counties, as will the New York State budget for fiscal year 2021-22, which will bring some welcome relief to school districts and municipalities.
FUNDING
The Fund’s assets come from three main sources: employee (or member) contributions, employer contributions and investment income. The System is committed to meeting its long-term benefit obligations prudently and fairly. Member contributions are fixed by law. Annual employer contributions are actuarially determined. Employer contributions are the greater of a minimum contribution of 4.5 percent of member payroll, or the actuarially determined contributions.
In September 2020, the System announced the fiscal year 2021-22 average contribution rates for participating employers. The ERS average rate will increase from 14.6 percent of payroll to 16.2 percent of payroll. The PFRS average rate will increase from 24.4 percent of payroll to 28.3 percent of payroll.
Demographic factors, such as longer life expectancies and higher rates of service retirement, combined with slightly lower than expected investment results averaged over the last five years, were the key reasons for the increase in the rates.
Because we adhere to our funding policy of collecting what we bill our employers, and we follow sound actuarial principles in the determination of required contribution rates, we continue to be among the best-funded public pension plans in the nation. For the fiscal year ended March 31, 2021, fiduciary net position represented 99.95 percent of total pension liability for ERS and 95.79 percent for PFRS. This is an increase from fiscal year ended March 31, 2020, when fiduciary net position represented 86.39 percent of total pension liability for ERS and 84.86 percent for PFRS. The funded ratios for ERS and PFRS can be found in the Actuarial section, which also provides a detailed discussion of the System’s funding.
LETTER OF TRANSMITTAL CONTINUED

Introduction 2021 Comprehensive Annual Financial Report 15
INVESTMENTS
The Fund’s primary objective is to provide the means to pay benefits to the participants and beneficiaries of the System through an investment program designed to protect and enhance the long-term value of the assets within our risk framework. Fund investments are made consistent with the “prudence” and “exclusive benefit” fiduciary standards of investment. Additionally, we have adopted policies and practices to ensure that the Fund is managed with high levels of ethical conduct and transparency. In fact, the most recent independent fiduciary and conflict of interest review conducted in 2019-20 by Duff and Phelps found that the Fund “is demonstrating a high level of operational transparency and in many cases appears to be in the vanguard of industry standards in this area.” Additionally, the report found “the Comptroller and the CRF staff manage the Fund to the highest level of ethical standards.”
In addition to providing the means to pay benefits, the Fund is responsible for implementing an asset allocation strategy with an appropriate balance of risk and return. As of March 31, 2021, our long-term target allocation for the investment portfolio is 23 percent in fixed income assets (cash, bonds, mortgages and Treasury Inflation-Protected Securities or “TIPS”), 47 percent in public equities, including domestic and international public equities, and 30 percent in alternative investments, including private equity, real estate, real assets, credit and opportunistic and absolute return strategy funds.
Despite the pandemic, we have maintained our status as one of the strongest public funds in the nation. For the State fiscal year 2020-2021, the Fund’s overall time-weighted investment return was 33.55 percent, reflecting the financial markets’ dramatic rebound from lows reached during the pandemic, and increasing the Fund’s audited value to $258.1 billion.
While the Fund enjoyed the largest one-year investment return in its history, the markets remain unpredictable. I will continue to manage the Fund with prudence, and focus on stable, long-term results that ensure continued retirement security for our members and retirees.
LETTER OF TRANSMITTAL CONTINUED
16 Introduction 2021 Comprehensive Annual Financial Report
LETTER OF TRANSMITTAL CONTINUED
SUSTAINABLE INVESTING AND STEWARDSHIP
The Fund continues to be a leader in sustainable investing because it is essential to protecting the Fund’s long-term value. Last December, the Fund adopted a goal to transition its portfolio to net zero greenhouse gas emissions by 2040. This goal will put the Fund in a strong position as the world moves toward net zero greenhouse gas emissions targets.
The Fund’s transition process will include a review of investments in energy sector companies using minimum standards to assess transition readiness and climate-related investment risk. This review will help ensure the Fund invests in companies that will have the ability to provide strong investment returns in light of the global consensus on climate change. Companies that fail to meet our minimum standards may be removed from our portfolio. While divestment is a last resort, it is a tool we can use to address companies that consistently put the Fund’s long-term value at risk.
We also called on five companies, including Domino’s Pizza, to set targets to reduce their greenhouse gas emissions, adopt new energy efficiency measures and increase their use of renewable energy.
In order to protect the value of our holdings, we utilize some of the most robust corporate engagement initiatives of any public pension fund in the country. In February 2021, the Fund launched a multi-faceted initiative to hold publicly-traded corporations and their top executives accountable for their diversity, equity and inclusion policies and practices.
Corporate America must reject racial injustice and confront institutional racism. I have called on companies to eradicate racial inequality, just as they would any other systemic problem that compromises their long-term success, and I promise to vote against any directors of our portfolio companies whose boards are not diverse.
In response to reports of racial discrimination, accusations of discriminatory wages, and the sale of products that promote hatred, I asked for an independent audit to assess Amazon’s policies and practices on civil rights, equity, diversity and inclusion, and how they affect the company’s business. Among our successes in this area is McDonald’s, which has agreed to disclose its workforce diversity data and tie executive compensation to its ability to foster inclusion.
When companies’ corporate practices or policies are perceived to be discriminatory, their bottom lines are impacted. That is, in part, what I said when I delivered testimony this past March before the U.S. House Committee on Financial Services Subcommittee on Diversity and Inclusion. Companies that develop a culture of equity and belonging are more likely to outperform their less diverse peers.

Introduction 2021 Comprehensive Annual Financial Report 17
LETTER OF TRANSMITTAL CONTINUED
ACCOUNTING PRACTICES
My staff is responsible for identifying control objectives for the protection of assets and the proper recording of all transactions in order to permit the preparation of financial statements in accordance with GAAP. The objective of internal controls is to provide reasonable, rather than absolute, assurance that the financial statements are free of material misstatements. We have designed, implemented and maintained adequate internal controls to provide reasonable assurance that our control objectives are achieved.
The concept of reasonable assurance recognizes that the cost of a control should not exceed the benefits likely to be derived, and that the valuation of costs and benefits requires estimates and judgments by management. An internal control system includes the organization plan, the appropriate segregation of duties and responsibilities, the implementation of sound practices in the performance of duties, and the employment of personnel whose capabilities are commensurate with their responsibilities.
The System’s financial information and internal controls are subject to examination by the New York State Department of Financial Services. Additionally, KPMG LLP, an independent, certified public accountant, audits the System’s financial statements. KPMG’s opinion appears on page 37 of this report. Lastly, pursuant to the New York State Government Accountability, Audit and Internal Control Act, the System is subject to an audit of its internal controls every three years.
We believe the internal controls in effect during the fiscal year ended March 31, 2021 adequately safeguard the System’s assets and provide reasonable assurance regarding the proper recording of financial transactions.
18 Introduction 2021 Comprehensive Annual Financial Report
LETTER OF TRANSMITTAL CONTINUED
FIGHTING PENSION FRAUD
One of my priorities since taking office has been to detect and prevent pension fraud. This year, I continued to work closely with district attorneys and law enforcement officials to uncover fraud, recoup money stolen from NYSLRS members and retirees and ensure the Fund is reimbursed.
Among our efforts was the conviction last September of two Westchester sisters previously arrested for stealing over $22,000 in pension benefits by concealing their late mother’s death. At their sentencing this past February, they were ordered to repay the full amount they had stolen.
Last July, a NYSLRS member from Rockland County was arrested for allegedly stealing $3,880 from NYSLRS. The member falsely claimed that a check for the loan he requested was lost. After we stopped payment on the check and issued a replacement check, the member attempted to cash both the original check and the replacement.
These arrests, convictions and recoveries are warnings — pension fraud will not be tolerated. When we identify it, we will work with law enforcement to hold those responsible accountable and ensure money stolen from the Fund is recouped.
NYSLRS SYSTEMS UPGRADES
This year NYSLRS has continued work on our multiyear project to upgrade the computer systems we use to calculate benefits and administer accounts. Since Retirement Online was first launched in January 2017, we have added new features that give our members and retirees a convenient way to conduct business with NYSLRS online. During fiscal year 2021, we expanded Retirement Online features to include tools that allow members to estimate their pension benefit using current account information and to file for retirement online. New features for our participating employers include a billing dashboard, where employers can access all their billing information, such as estimated, projected and annual invoices, from one location in Retirement Online.
As of March 31, 2021, over 345,700 members and retirees had registered for Retirement Online. That represents a 33.3 percent increase over the previous fiscal year when there were 259,300 registered members and retirees.
More information about this, as well as other key programs and initiatives, can be found in the Overview of the New York State & Local Retirement System on page 26 and the Overview of Investments on page 87.

Introduction 2021 Comprehensive Annual Financial Report 19
LETTER OF TRANSMITTAL CONTINUED
ACKNOWLEDGMENTS
I wish to thank the dedicated staff of the Office of the State Comptroller for doing the important work of our agency day in and day out. Like all of New York’s public employees, they showed tremendous strength, resolve and flexibility as they dealt with the challenges created by the COVID-19 pandemic, often providing critical help to members who were ill with the coronavirus.
NYSLRS staff provided essential services to our customers without interruption. They found new ways of doing business, limited in-person contact and put new safety protocols in place. I am extremely proud of their commitment to serving our members, retirees, beneficiaries and employers.
I also wish to thank the members of the Advisory Council for the Retirement System, the Investment Advisory Committee, the Real Estate Advisory Committee, the Actuarial Advisory Committee and the Audit Advisory Committee for their commitment to the System’s members, retirees and beneficiaries. We are deeply indebted to them for their continued support and counsel. Lastly, I would like to thank the staff in our Division of Retirement Services and our Division of Pension Investment and Cash Management, who are responsible for preparing this report. Their professionalism and dedication are greatly appreciated.
I am confident you will find this report to be a complete and reliable accounting of the System.
Sincerely,
Thomas P. DiNapoliState Comptroller
20 Introduction 2021 Comprehensive Annual Financial Report
ADMINISTRATIVE ORGANIZATION
P re s i den t New York State Troopers Police Benevolent Association
Mi chae l O ’Mea ra President New York State Association of Police Benevolent Associations
And rew Pa l l o t t a President New York State United Teachers
Mi chae l Powe r s President New York State Correctional Officers & Police Benevolent Association
Raymond San tande r Assistant Director AFSCME District Council 37
Robe r t S chne i de r Executive Director New York State School Boards Association
Wayne Spen ce President New York State Public Employees Federation
Rona l d J . Wa l sh , J r. President Council 82, AFSCME
R i cha rd We l l s President Police Conference of New York, Inc.
Barba ra Za ron President New York State Organization of Management Confidential Employees
ADVISORY COMMITTEESAdvisory Council for the Retirement System
The Advisory Council for the Retirement System, appointed by the Comptroller pursuant to regulations of the Comptroller (2 NYCRR Part 320), advises and makes recommendations to the Comptroller on the formulation of policies in relation to the administration and management of the Common Retirement Fund and the Retirement System. At the annual meetings of the Council, the Comptroller and senior staff also exchange information and insights with the Council to help stakeholders understand the status and challenges of the Common Retirement Fund and the Retirement System.
Hono rab l e Pe t e r J . Abba t e , J r. Chair Assembly Governmental Employees Committee New York State Assembly
S t ephen J . A cqua r i o Executive Director New York State Association of Counties
Pe t e r A . Bayne s Executive Director New York State Conference of Mayors
Hea the r B r i c c e t t i President & CEO Business Council of New York State, Inc.
Mar i o C i l en t o President New York State AFL-CIO
Sam F r e s i na President New York State Professional Fire Fighters Association
Ger r y Ge i s t Executive Director Association of Towns of the State of New York
Hono rab l e And rew Gouna rde s Chair Senate Civil Service and Pensions Committee New York State Senate
D iana H in ch c l i f f President Retired Public Employees Association, Inc.
Don Ke l l y Director of Research Civil Service Employees Association Local 1000, AFSCME
Br yan t Ko l ne r President Alliance of Public Retiree Organizations of New York
Introduction 2021 Comprehensive Annual Financial Report 21
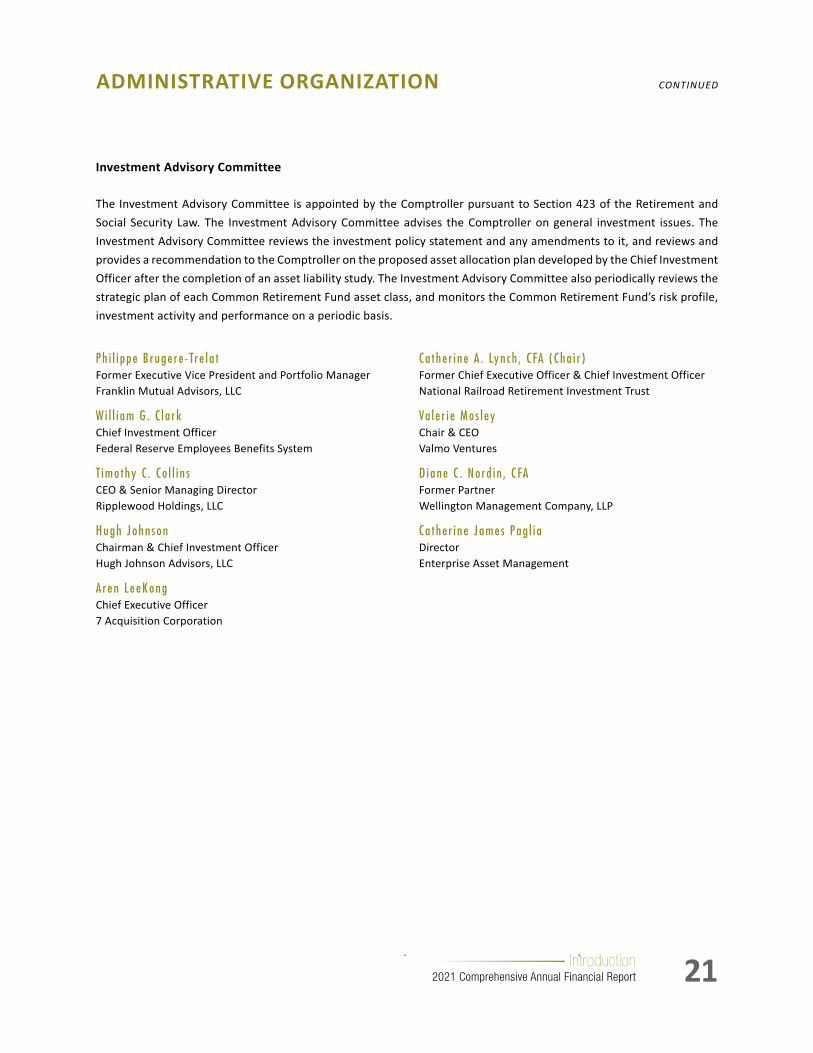
Investment Advisory Committee
The Investment Advisory Committee is appointed by the Comptroller pursuant to Section 423 of the Retirement and Social Security Law. The Investment Advisory Committee advises the Comptroller on general investment issues. The Investment Advisory Committee reviews the investment policy statement and any amendments to it, and reviews and provides a recommendation to the Comptroller on the proposed asset allocation plan developed by the Chief Investment Officer after the completion of an asset liability study. The Investment Advisory Committee also periodically reviews the strategic plan of each Common Retirement Fund asset class, and monitors the Common Retirement Fund’s risk profile, investment activity and performance on a periodic basis.
ADMINISTRATIVE ORGANIZATION CONTINUED
Ph i l i ppe B ruge re - Tr e l a t Former Executive Vice President and Portfolio Manager Franklin Mutual Advisors, LLC
Wi l l i am G . C l a rk Chief Investment Officer Federal Reserve Employees Benefits System
T imo thy C . Co l l i n s CEO & Senior Managing Director Ripplewood Holdings, LLC
Hugh John son Chairman & Chief Investment Officer Hugh Johnson Advisors, LLC
Aren LeeKong Chief Executive Officer 7 Acquisition Corporation
Ca the r i ne A . Lyn ch , C FA ( Cha i r ) Former Chief Executive Officer & Chief Investment Officer National Railroad Retirement Investment Trust
Va l e r i e Mos l ey Chair & CEO Valmo Ventures
D iane C . No rd i n , C FA Former Partner Wellington Management Company, LLP
Ca the r i ne James Pag l i a Director Enterprise Asset Management

22 Introduction 2021 Comprehensive Annual Financial Report
Real Estate Advisory Committee
The Real Estate Advisory Committee is appointed by the Comptroller, with the consent of the Investment Advisory Committee, pursuant to Section 423 of the Retirement and Social Security Law. The Real Estate Advisory Committee reviews proposed mortgage and real estate investments. In the event the Real Estate Advisory Committee disapproves of a proposed mortgage or real estate investment, the investment will not be presented to the Comptroller and cannot be made by the Common Retirement Fund.
ADMINISTRATIVE ORGANIZATION CONTINUED
Lou i s M . Dub i n Managing Partner Redbrick LMD
G . Ga i l E dwa rd s Independent Director
Mi chae l G i l i b e r t o S. Michael Giliberto & Company, Inc.
James M . Go t t s t i n e Chief Operating Officer Ciminelli Real Estate Corporation
Jo Ann Han son President Church Investment Group
L . Duane Ja ck son Managing Member Alinea Capital Partners, LLC
Rosey M i l l e r Chief Executive Officer Regional Investment & Management
Dav i d H . Pe i r e z , E s q . ( Cha i r ) Senior Partner Reisman Peirez Reisman & Capobianco, LLP
Debo rah Ra tne r Sa l zbe rg Partner RMS Investment Group
Pe t e r T i l l e s Developer

Introduction 2021 Comprehensive Annual Financial Report 23
ADMINISTRATIVE ORGANIZATION CONTINUED
Actuarial Advisory Committee
The Actuarial Advisory Committee, appointed by the Comptroller pursuant to regulation (11 NYCRR 136-2), reviews and advises the Comptroller on the actuarial soundness and financial condition of the Retirement System and the Common Retirement Fund, and annually reviews the proposed actuarial assumptions and employer contributions.
Edward W. B rown (Retired)
Armand de Pa l o (Retired)
Mi chae l He l l e r (Retired)
Mark T. Koehne (Retired)
S tan l ey Ta l b i (Retired)

24 Introduction 2021 Comprehensive Annual Financial Report
ADMINISTRATIVE ORGANIZATION CONTINUED
Audit Advisory Committee
The Audit Advisory Committee, appointed by the Comptroller pursuant to regulation (11 NYCRR 136-2), reviews and reports to the Comptroller on the annual internal and external audit process related to the Retirement System, the Common Retirement Fund and the Comprehensive Annual Financial Report.
J enn i f e r Mu l l i gan ( Cha i r ) Business Office Manager/Controller Questar III BOCES
Ruben Ca rdona Partner WithumSmith + Brown, PC
A lan Lub i n (Retired)
Ju l i e McDonne l l Schenectady County Auditor
Pau l Moo re Past President Retired Public Employees Association, Inc.
Introduction 2021 Comprehensive Annual Financial Report 25
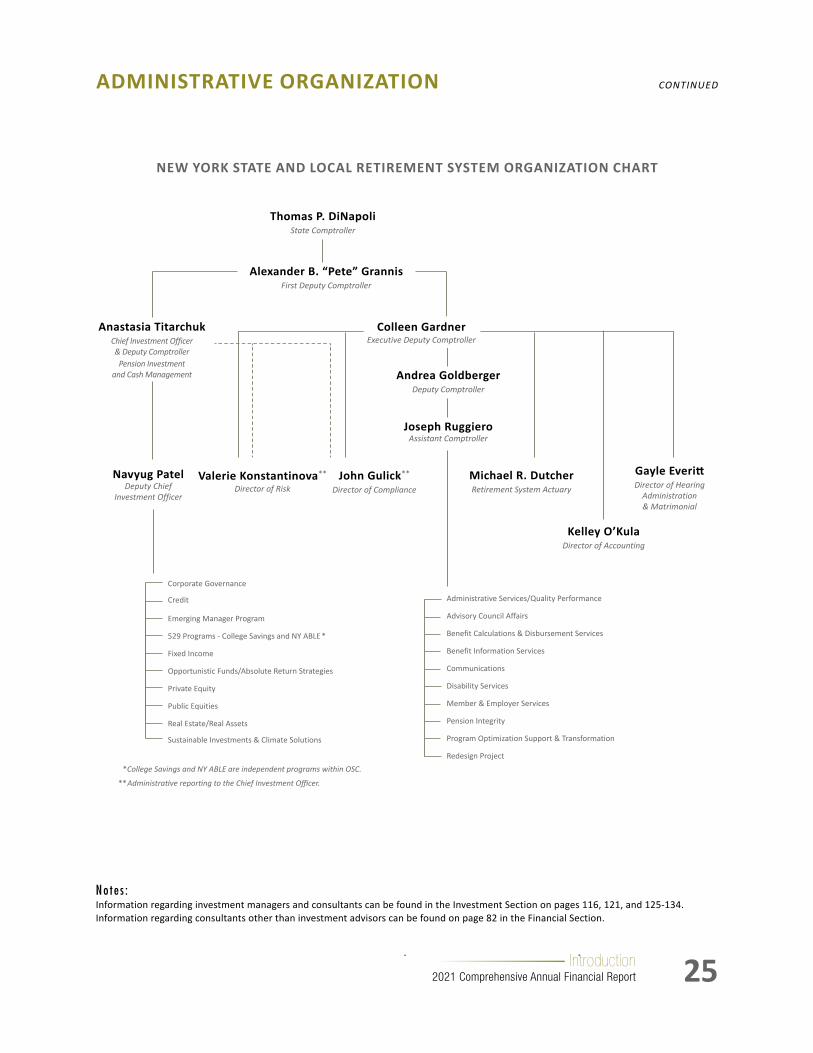
NEW YORK STATE AND LOCAL RETIREMENT SYSTEM ORGANIZATION CHART
No te s : Information regarding investment managers and consultants can be found in the Investment Section on pages 116, 121, and 125-134. Information regarding consultants other than investment advisors can be found on page 82 in the Financial Section.
ADMINISTRATIVE ORGANIZATION CONTINUED
Thomas P. DiNapoliState Comptroller
Alexander B. “Pete” GrannisFirst Deputy Comptroller
Navyug PatelDeputy Chief
Investment Officer
Corporate Governance
Credit
Emerging Manager Program
529 Programs - College Savings and NY ABLE *
Fixed Income
Opportunistic Funds/Absolute Return Strategies
Private Equity
Public Equities
Real Estate/Real Assets
Sustainable Investments & Climate Solutions
Anastasia TitarchukChief Investment Officer & Deputy Comptroller
Pension Investment and Cash Management Andrea Goldberger
Deputy Comptroller
Joseph RuggieroAssistant Comptroller
*College Savings and NY ABLE are independent programs within OSC.
** Administrative reporting to the Chief Investment Officer.
Michael R. DutcherRetirement System Actuary
Valerie Konstantinova**
Director of Risk
Kelley O’KulaDirector of Accounting
Administrative Services/Quality Performance
Advisory Council Affairs
Benefit Calculations & Disbursement Services
Benefit Information Services
Communications
Disability Services
Member & Employer Services
Pension Integrity
Program Optimization Support & Transformation
Redesign Project
Colleen GardnerExecutive Deputy Comptroller
John Gulick**
Director of Compliance
Gayle EverittDirector of Hearing
Administration & Matrimonial

26 Introduction 2021 Comprehensive Annual Financial Report
OVERVIEW OF THE NEW YORK STATE AND LOCAL RETIREMENT SYSTEMReport from Executive Deputy Comptroller Colleen Gardner
I am proud of the work NYSLRS has accomplished during the 2020-21 State fiscal year, and I am pleased to share highlights of that work with you.
NYSLRS’ CENTENNIAL
This year marked the 100th anniversary of NYSLRS. Originally called the New York State Employees’ Retirement System, we first opened our doors on January 1, 1921.
By June 30, 1921, NYSLRS had 4,500 members and provided pension benefits to 43 State retirees and beneficiaries. The pension fund held just over $8 million dollars. Today, we are one of the largest and best-funded public retirement systems in the country. As of March 31, 2021, NYSLRS had 675,519 members and provided pension benefits to 496,628 retirees and beneficiaries. The Fund’s audited value at the end of State fiscal year 2020-21 was $258.1 billion.
Over the last 100 years, NYSLRS has lived up to its mission to properly fund and deliver secure pensions through sound actuarial practices and an efficient administration of benefits. We are dedicated to fulfilling our mission for years to come.
RESPONSE TO THE PANDEMIC
The 2020-21 State fiscal year was one of our most challenging as we dealt with the COVID-19 health care crisis, but our staff met those challenges with determination, flexibility and an unwavering commitment to our members, retirees, beneficiaries and employers.
It became critically important for our customers to understand their benefits and know what steps to take if they became seriously ill. We created a COVID-19 Help Center on our website so customers could find essential information in one convenient location. The resources featured in the Help Center included information about new laws and policies such as the COVID-19 accidental death benefit and the waiver of the 15-day filing period for service retirements. We provided detailed information about filing for disability retirement, enrolling in direct deposit and filing a power of attorney.
We helped members, retirees and employers transition to Retirement Online, our self-service application, so they could do business with us efficiently and safely from home. With Retirement Online, members and retirees can view benefit information, update contact information, and view and update beneficiaries. Members can also apply for a loan, estimate their pension, request to purchase service credit and apply for retirement.
Our Call Center remained open, with staff working remotely, but face-to-face consultations with NYSLRS representatives were not possible. Instead, our Call Center offered phone consultations by appointment. In addition to providing members with personalized meetings, these phone consultations allowed us to serve more members than in-person consultations. More than 25,000 members took advantage of this service.
Instead of conducting in-person retirement presentations for employers and members, we used video conferencing. Administrative hearings for members and outreach and training for employers were also held virtually. We used emails, blog posts and social media to help make sure customers had up-to-date information. Newsletters were published electronically instead of distributing hard copy versions through our employers, whose offices were generally closed.

Introduction 2021 Comprehensive Annual Financial Report 27
While continuing to provide important information and services to our customers was essential, we were also mindful of ensuring the health and safety of our staff.
Most NYSLRS staff members worked remotely during the past year, but it was necessary for certain essential staff to carry out their critical duties from the office. For example, our Scanning unit scanned 1.79 million paper documents while working on site in our Menands and Albany offices, allowing other staff to complete their work from home. NYSLRS implemented strict guidelines to help ensure the safety of our essential staff.
Our success with telecommuting was a tremendous accomplishment done under extraordinary circumstances. We are grateful to all our staff, whose dedication and commitment enabled NYSLRS to continue to provide benefits to our customers without interruption.
It seems likely that the COVID-19 public health emergency will continue for the foreseeable future. Whatever challenges 2021-22 holds, our members and retirees can count on us to provide them with the benefits they have earned.
RETIREMENT ONLINE
We first launched Retirement Online in 2017. Since day one, we have been proud to provide our members and retirees with a new, convenient way to access their benefit information and do business with us.
As of March 31, 2021, more than 345,700 members and retirees had enrolled in Retirement Online, an increase of 33.3 percent over the year before. The growth in enrollments and online transactions is due, in part, to the pandemic. Retirement Online provided a safe and secure way for our customers to continue to do business with us.
One of the most popular features in Retirement Online is our benefit calculator, which gives members the ability to create a customized pension benefit estimate. Although our members’ annual statements can now be viewed in Retirement Online, the pension estimates in the statement reflect a specific point in time — the end of the fiscal year. Retirement Online gives members the ability to calculate a pension estimate anytime using current account information. Members can also enter different retirement dates, beneficiaries, earnings and service credit amounts to see the effect on their potential benefit.
Over the last fiscal year, more than 318,726 benefit estimates were calculated in Retirement Online.
In addition, 77 percent of loan requests and 17 percent of new service credit purchase requests are now being made through Retirement Online. During fiscal year 2020-21, we received 33,098 loan applications, of which 25,492 were submitted online. We also received 18,584 new service credit purchase requests, of which 3,113 were submitted online.
Overall, 12,188 members have applied for retirement using Retirement Online, and 32,917 beneficiary updates have been made. At fiscal year end, half of retirement applications were submitted online.
Work is now underway on the final phase of our redesign project, which focuses on pension payments and disbursements, post-retirement employment, matrimonial review and legal review. New features for retirees will include the ability to manage direct deposit information, update federal tax withholding and view and print 1099-R tax forms.
When the project is complete, we will have a comprehensive system that will enhance service to our customers and streamline the work we do.
OVERVIEW OF THE NEW YORK STATE AND LOCAL RETIREMENT SYSTEMReport from Executive Deputy Comptroller Colleen Gardner CONTINUED

28 Introduction 2021 Comprehensive Annual Financial Report
OUR EMPLOYER PARTNERSHIP
Our participating employers are key partners in our mission to provide accurate retirement benefits to our members. Those benefits are based on the earnings and service information employers report to us, so it’s essential that we provide the tools employers need to complete their retirement-related work more efficiently. Enhanced reporting in Retirement Online does just that.
Launched in 2020, enhanced reporting streamlines monthly reporting and automates member enrollments. With enhanced reporting, employers provide more member data upfront, reducing the number of inquiries they receive from us and eliminating the need to provide additional information when an employee retires.
To help employers with the transition to enhanced reporting, we provide them customized training and support, as well as reference tools and training resources on our website. By the end of fiscal year 2020-21, 429 employers had transitioned to enhanced reporting while another 281 were in the process of transitioning, representing nearly 24 percent of our employers.
This past year, we also introduced the Retirement Online billing dashboard. Now, employers can access all the billing information they need from one location in Retirement Online. The dashboard is where they can find their annual and estimated invoices, the fiscal year earnings they reported to us, prior years’ adjustments, the Governmental Accounting Standards Board (GASB) report and other financial information.
We have made tremendous advances in the online tools we offer our employers because, by focusing on providing better service to them, we also provide better service to our members.
CUSTOMER SERVICE
NYSLRS puts a high premium on customer satisfaction. To ensure we are on track to achieve our customer service goals, each year we measure key business elements and compare them to those of peer public retirement systems. This allows us to see where our work is paying off and reflect on areas that need improvement. Ultimately, we use this feedback to better serve our customers and apply best practices.
Our phone system’s automatic call back feature continues to be very popular and we are working towards implementing an estimated wait time feature. These improvements, developed as a result of feedback, are designed to provide better call experiences for our customers.
Last spring and fall we continued our efforts to increase direct deposit enrollment by writing to retirees who receive their pension by paper check and encouraging them to take advantage of this service. Direct deposit was essential during the pandemic as it gave retirees access to their monthly pension payment without going to a bank. Our efforts reduced the number of retirees who receive checks by more than 10,000. Over 95 percent of our retirees now receive pension payments electronically.
Throughout the year, we have worked diligently to reduce our inventory of open cases and decrease processing times. For example, we receive approximately 2,200 power of attorney documents each year, and retirement legal services staff must review each request to ensure it meets all New York State requirements. As of the end of the fiscal year, the power of attorney review is current.
Going forward, we will continue to look for ways to improve our customers’ experience, by expanding their access to services, improving communication and anticipating their needs.
OVERVIEW OF THE NEW YORK STATE AND LOCAL RETIREMENT SYSTEMReport from Executive Deputy Comptroller Colleen Gardner CONTINUED

Introduction 2021 Comprehensive Annual Financial Report 29
FIGHTING FRAUD
We take preventing and detecting pension fraud very seriously. Identifying unreported retiree and beneficiary deaths to uncover overpayments is one way we detect fraud. During the last fiscal year, NYSLRS recovered nearly $356,000 in inappropriate pension overpayments.
One of the duties of our Pension Integrity Bureau is to audit retirement data to verify that it has been reported accurately. Since retirement benefits are based in part on reported data, these audits help ensure that appropriate benefits are paid. The bureau also continually monitors Retirement Online for instances of online fraud, and ensures the appropriate internal controls are in place so the system and the data it contains are protected.
We will continue to search out unreported retiree deaths and online fraud. When inappropriate payments are identified, we will pursue full restitution.
NEW LAWS ENACTED IN THE PAST YEAR THAT IMPACT NYSLRS
Special Accidental Death Benefits Increased
Chapter 58 of the Laws of 2020 increases certain special accidental death benefits paid to widows, widowers or children of police officers and firefighters killed in the line of duty.
World Trade Center Sick Leave Bill Amended
Chapter 60 of the Laws of 2020 relates to sick leave for officers and employees with a qualifying World Trade Center condition. It clarifies requirements for those who participated in the World Trade Center rescue and cleanup efforts, extends eligibility to those who filed a notice of participation under the Workers’ Compensation Law, specifies that the President of the Civil Service Commission reviews claims and clarifies the appeals process.
COVID-19 Accidental Death Benefit Presumption Established
Chapter 89 of the Laws of 2020 establishes a coronavirus disease (COVID-19) presumption for accidental death benefits for certain public employees.
September 11 Workers Protection Task Force Act Amended
Chapter 169 of the Laws of 2020 revises and extends the September 11th Workers Protection Task Force, as created in the 2005 World Trade Center Presumption Law. It requires new appointments to the task force, establishes a biannual meeting requirement, expands areas of study to include more recently raised issues, resets the deadline for an annual report and extends the provisions of the act to June 10, 2025.
OVERVIEW OF THE NEW YORK STATE AND LOCAL RETIREMENT SYSTEMReport from Executive Deputy Comptroller Colleen Gardner CONTINUED

30 Introduction 2021 Comprehensive Annual Financial Report
COVID-19 Accidental Death Benefit Presumption Extended
Chapter 78 of the Laws of 2021 extends the coronavirus disease 2019 (COVID-19) presumption for public employee accidental death benefits for an additional two years.
Power of Attorney Requirements Changed
Chapter 84 of the Laws of 2021 adds a requirement that two disinterested witnesses sign the power of attorney form. It also specifies the time period for review of a statutory short form power of attorney and makes technical changes to the statutory short form sections relating to the designation of multiple agents.
Although many initiatives designed to improve customer service were realized in fiscal year 2020-21, moving forward, we will continue to look for more ways to provide responsive and dependable service to our members, retirees, beneficiaries and employers. I look forward to reporting the results of our efforts in our next Comprehensive Annual Financial Report.
OVERVIEW OF THE NEW YORK STATE AND LOCAL RETIREMENT SYSTEMReport from Executive Deputy Comptroller Colleen Gardner CONTINUED

Introduction 2021 Comprehensive Annual Financial Report 31
BY THE NUMBERS
0
400,000
800,000
1,200,000
2020 2021201920182017201620152014201320122011
Members Retirees & Beneficiaries
Num
ber o
f Par
ticip
ants
Fiscal Year
MEMBERS AND RETIREES
There are 1,172,147 participants in the System, including 675,519 members and 496,628 retirees and beneficiaries.
The number of retirees is increasing more quickly than members. For example, in 2001 retirees and beneficiaries represented approximately 32 percent of the System’s participants. By fiscal year 2021, that number had increased to approximately 42 percent.
Benefit payments continue to rise, reflecting improvements in final average salaries over the past decades, cost-of-living adjustment (COLA) payments and benefit improvements enacted over the years.

32 Introduction 2021 Comprehensive Annual Financial Report
RETIREES IN NEW YORK STATE
Of the 496,628 retirees and beneficiaries in the System, 391,454 (approximately 79 percent) remain New York State residents. As such, benefit payments surpassing $11.3 billion this year alone reach the State’s communities and businesses, representing a significant stimulus to the State’s economy.
BY THE NUMBERS CONTINUED
= Less than $50 million
Bene�t Payments by County
= $200 million or more
= $150 – $199.9 million
= $100 – $149.9 million
= $50 – $99.9 million
CONTINUED

Introduction 2021 Comprehensive Annual Financial Report 33
ANNUAL BENEFIT PAYMENTS WITHIN NEW YORK STATE
As of March 31, 2021.
County Annuitants Annual Payments
Albany 19,827 $ 665,881,846
Allegany 1,763 35,293,673
Bronx 3,827 114,248,067
Broome 8,367 180,953,195
Cattaraugus 3,652 81,804,240
Cayuga 3,517 87,885,595
Chautauqua 5,113 113,431,121
Chemung 3,877 98,870,158
Chenango 2,312 45,850,036
Clinton 4,778 132,000,962
Columbia 3,226 91,103,201
Cortland 1,891 41,187,756
Delaware 1,922 41,041,649
Dutchess 10,631 334,730,244
Erie 32,696 914,709,249
Essex 2,165 50,843,305
Franklin 3,434 88,166,559
Fulton 2,372 52,700,990
Genesee 2,578 61,823,633
Greene 2,646 72,716,288
Hamilton 496 11,084,595
Herkimer 2,615 56,326,920
Jefferson 3,968 96,847,481
Kings 6,206 202,725,854
Lewis 1,345 26,730,631
Livingston 3,190 76,726,471
Madison 2,739 61,126,867
Monroe 18,467 443,304,706
Montgomery 2,533 61,209,247
NY Military 10 191,637
Nassau 25,114 927,876,864
New York 4,533 163,243,788
County Annuitants Annual Payments
Niagara 6,854 $ 171,182,809
Oneida 10,561 273,502,480
Onondaga 14,808 369,011,313
Ontario 3,881 91,618,433
Orange 9,988 295,202,572
Orleans 1,695 38,211,805
Oswego 4,660 100,081,178
Otsego 2,324 47,002,534
Putnam 2,655 91,288,629
Queens 6,537 220,495,786
Rensselaer 9,759 306,508,336
Richmond 2,552 90,339,057
Rockland 7,220 245,168,288
Saratoga 11,829 364,400,290
Schenectady 9,077 281,662,803
Schoharie 1,764 43,716,168
Schuyler 891 19,878,796
Seneca 1,549 34,837,393
St. Lawrence 5,765 143,550,831
Steuben 3,597 80,527,290
Suffolk 37,707 1,343,054,505
Sullivan 3,116 83,524,612
Tioga 1,819 36,477,641
Tompkins 2,914 65,237,469
Ulster 6,536 169,492,414
Warren 3,174 80,015,011
Washington 2,971 72,503,424
Wayne 3,575 77,090,236
Westchester 16,696 590,227,708
Wyoming 2,271 55,565,288
Yates 899 19,164,466
Total 391,454 11,333,176,394
BY THE NUMBERS CONTINUED
Note: The objective of this chart is to show the relative amounts paid to annuitants in the various locations within New York State. The numbers do not match the figures in the basic financial statements because the financial statement figures represent the sum of all benefit payments (including death benefits) made during the fiscal year, in accordance with Generally Accepted Accounting Principles (GAAP). The above numbers represent the sum of the annual benefits payable to all annuitants actively collecting as of the end of the fiscal year. The figures in the chart are easier to organize by county, as compared to figures found in the financial statements.
34 Introduction 2021 Comprehensive Annual Financial Report
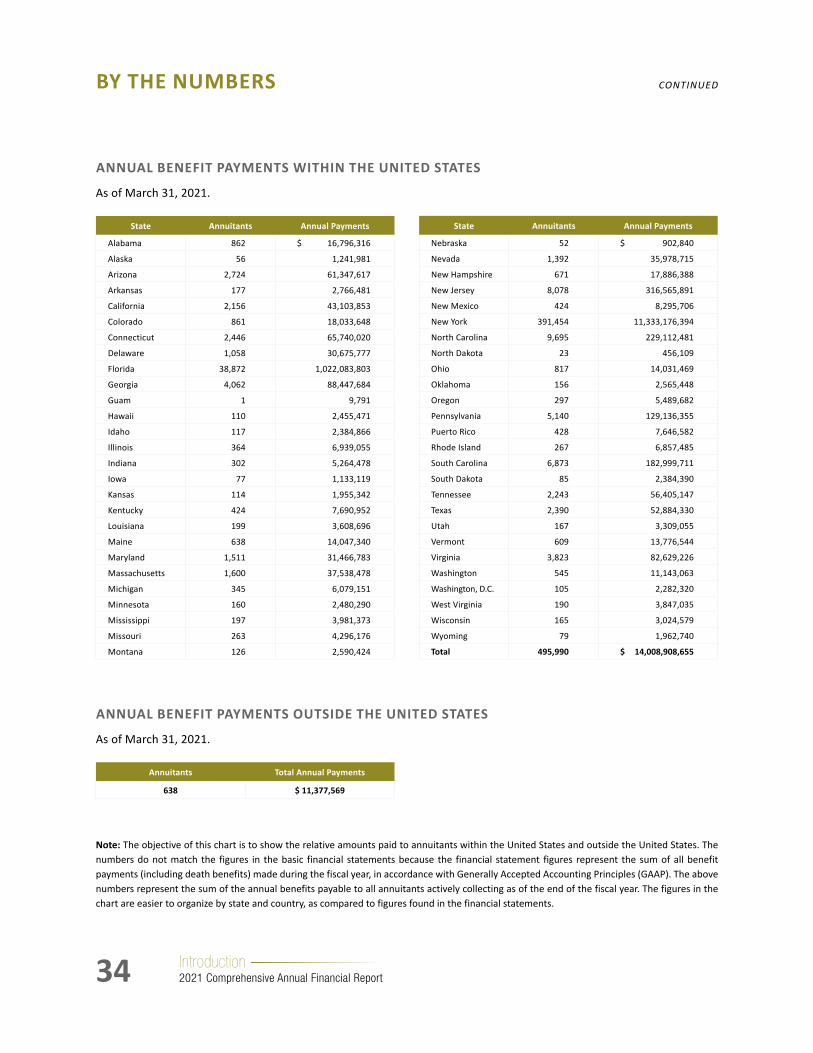
ANNUAL BENEFIT PAYMENTS WITHIN THE UNITED STATES
As of March 31, 2021.
State Annuitants Annual Payments
Alabama 862 $ 16,796,316
Alaska 56 1,241,981
Arizona 2,724 61,347,617
Arkansas 177 2,766,481
California 2,156 43,103,853
Colorado 861 18,033,648
Connecticut 2,446 65,740,020
Delaware 1,058 30,675,777
Florida 38,872 1,022,083,803
Georgia 4,062 88,447,684
Guam 1 9,791
Hawaii 110 2,455,471
Idaho 117 2,384,866
Illinois 364 6,939,055
Indiana 302 5,264,478
Iowa 77 1,133,119
Kansas 114 1,955,342
Kentucky 424 7,690,952
Louisiana 199 3,608,696
Maine 638 14,047,340
Maryland 1,511 31,466,783
Massachusetts 1,600 37,538,478
Michigan 345 6,079,151
Minnesota 160 2,480,290
Mississippi 197 3,981,373
Missouri 263 4,296,176
Montana 126 2,590,424
State Annuitants Annual Payments
Nebraska 52 $ 902,840
Nevada 1,392 35,978,715
New Hampshire 671 17,886,388
New Jersey 8,078 316,565,891
New Mexico 424 8,295,706
New York 391,454 11,333,176,394
North Carolina 9,695 229,112,481
North Dakota 23 456,109
Ohio 817 14,031,469
Oklahoma 156 2,565,448
Oregon 297 5,489,682
Pennsylvania 5,140 129,136,355
Puerto Rico 428 7,646,582
Rhode Island 267 6,857,485
South Carolina 6,873 182,999,711
South Dakota 85 2,384,390
Tennessee 2,243 56,405,147
Texas 2,390 52,884,330
Utah 167 3,309,055
Vermont 609 13,776,544
Virginia 3,823 82,629,226
Washington 545 11,143,063
Washington, D.C. 105 2,282,320
West Virginia 190 3,847,035
Wisconsin 165 3,024,579
Wyoming 79 1,962,740
Total 495,990 $ 14,008,908,655
ANNUAL BENEFIT PAYMENTS OUTSIDE THE UNITED STATES
As of March 31, 2021.
Annuitants Total Annual Payments
638 $ 11,377,569
BY THE NUMBERS CONTINUED
Note: The objective of this chart is to show the relative amounts paid to annuitants within the United States and outside the United States. The numbers do not match the figures in the basic financial statements because the financial statement figures represent the sum of all benefit payments (including death benefits) made during the fiscal year, in accordance with Generally Accepted Accounting Principles (GAAP). The above numbers represent the sum of the annual benefits payable to all annuitants actively collecting as of the end of the fiscal year. The figures in the chart are easier to organize by state and country, as compared to figures found in the financial statements.

FinancialWe are committed to providing our membership with an accurate picture of the
Fund’s health. In addition to conducting our own reviews, independent auditors
are called on to review our work. In this way, we ensure that NYSLRS’ financial
statements and reports continue to meet the highest program standards expected
of public retirement systems.
A Century of Checks & Balances
NYSLRS1921–2021

36 Financial 2021 Comprehensive Annual Financial Report
CONTENTS
Independent Auditors’ Report .............................................................................................................. 37
Management’s Discussion and Analysis (Unaudited) .................................................................................. 39
Basic Financial Statements................................................................................................................... 44
Combining Basic Statement of Fiduciary Net Position ..................................................................... 44
Combining Basic Statement of Changes in Fiduciary Net Position ....................................................... 45
Notes to Basic Financial Statements .......................................................................................... 46
Required Supplementary Information (Unaudited) .................................................................................... 74
Schedule of Changes in the Employers’ Net Pension Liability and Related Ratios (Unaudited) ................... 74
Schedule of Employer Contributions (Unaudited) .......................................................................... 78
Schedule of Investment Returns (Unaudited) ................................................................................ 78
Notes to Required Supplementary Information (Unaudited) ............................................................. 79
Other Supplementary Information (Unaudited) ............................................................................................................. 80
Schedule of Administrative Expenses (Unaudited) ......................................................................... 80
Schedule of Investment Expenses (Unaudited) .............................................................................. 81
Schedule of Consulting Fees (Unaudited) ..................................................................................... 82
Independent Auditors’ Report on Internal Control Over Financial Reporting and on Compliance and Other Matters Based on an Audit of Financial Statements Performed in Accordance with Government Auditing Standards ............. 83

37Financial 2021 Comprehensive Annual Financial Report
INDEPENDENT AUDITORS’ REPORT
Independent Auditors' Report
The Trustee New York State and Local Retirement System:
Report on the Financial Statements We have audited the accompanying financial statements of the New York State and Local Retirement System (the System) as of and for the year ended March 31, 2021, and the related notes to the financial statements, which collectively comprise the System’s basic financial statements for the year then ended as listed in the table of contents.
Management’s Responsibility for the Financial Statements
Management is responsible for the preparation and fair presentation of these financial statements inaccordance with U.S. generally accepted accounting principles; this includes the design, implementation, and maintenance of internal control relevant to the preparation and fair presentation of financial statements that are free from material misstatement, whether due to fraud or error.
Auditors’ Responsibility
Our responsibility is to express an opinion on these financial statements based on our audit. We conducted our audit in accordance with auditing standards generally accepted in the United States of America and thestandards applicable to financial audits contained in Government Auditing Standards issued by the Comptroller General of the United States. Those standards require that we plan and perform the audit to obtain reasonable assurance about whether the financial statements are free from material misstatement.
An audit involves performing procedures to obtain audit evidence about the amounts and disclosures in thefinancial statements. The procedures selected depend on the auditors’ judgement, including the assessment ofthe risks of material misstatement of the financial statements, whether due to fraud or error. In making those risk assessments, the auditor considers internal control relevant to the entity’s preparation and fair presentationof the financial statements in order to design audit procedures that are appropriate in the circumstances, but not for the purpose of expressing an opinion on the effectiveness of the entity’s internal control. Accordingly, we express no such opinion. An audit also includes evaluating the appropriateness of accounting policies used and the reasonableness of significant accounting estimates made by management, as well as evaluating the overall presentation of the financial statements.
We believe that the audit evidence we have obtained is sufficient and appropriate to provide a basis for our audit opinion.
Opinion
In our opinion, the financial statements referred to above present fairly in all material respects, the fiduciary netposition of the System as of March 31, 2021, and the changes in its fiduciary net position for the year then ended in accordance with U.S. generally accepted accounting principles.
KPMG LLP515 BroadwayAlbany, NY 12207-2974
KPMG LLP, a Delaware limited liability partnership and a member firm of the KPMG global organization of independent member firms affiliated with KPMG International Limited, a private English company limited by guarantee.

38 Financial 2021 Comprehensive Annual Financial Report
INDEPENDENT AUDITORS’ REPORT CONTINUED
2
Other Matters
Required Supplementary Information
U.S. generally accepted accounting principles require that the management’s discussion and analysis and required supplementary information listed in the accompanying table of contents be presented to supplement the basic financial statements. Such information, although not a part of the basic financial statements, is required by the Governmental Accounting Standards Board who considers it to be an essential part of financial reporting for placing the basic financial statements in an appropriate operational, economic, or historical context. We have applied certain limited procedures to the required supplementary information in accordance with auditing standards generally accepted in the United States of America, which consisted of inquiries of management about the methods of preparing the information and comparing the information for consistency with management’s responses to our inquiries, the basic financial statements, and other knowledge we obtained during our audit of the basic financial statements. We do not express an opinion or provide any assurance on the information because the limited procedures do not provide us with sufficient evidence to express an opinion or provide any assurance.
Supplementary and Other Information
Our audit was conducted for the purpose of forming an opinion on the financial statements that collectivelycomprise the System’s basic financial statements. The schedules of administrative expenses, investment expenses and consulting fees on pages 80-82, as well as the introduction, investment, actuarial and statistical sections are presented for purposes of additional analysis and are not a required part of the basic financial statements.
The schedules of administrative expenses, investment expenses and consulting fees are the responsibility of management and were derived from and relate directly to the underlying accounting and other records used to prepare the basic financial statements. Such information has been subjected to the auditing procedures applied in the audit of the basic financial statements and certain additional procedures, including comparing and reconciling such information directly to the underlying accounting and other records used to prepare the basic financial statements or to the basic financial statements themselves, and other additional procedures in accordance with auditing standards generally accepted in the United States of America. In our opinion, the schedules of administrative expenses, investment expenses and consulting fees are fairly stated in all material respects in relation to the basic financial statements as a whole.
The introduction, investment, actuarial, and statistical sections have not been subjected to the auditing procedures applied in the audit of the basic financial statements, and accordingly, we do not express an opinion or provide any assurance on them.
Other Reporting Required by Government Auditing StandardsIn accordance with Government Auditing Standards, we have also issued our report dated July 28, 2021 on our consideration of the System’s internal control over financial reporting and on our tests of its compliance with certain provisions of laws, regulations, contracts, and grant agreements and other matters. The purpose of that report is solely to describe the scope of our testing of internal control over financial reporting and compliance and the results of that testing, and not to provide an opinion on the effectiveness of the System’s internal control over financial reporting or on compliance. That report is an integral part of an audit performed in accordance with Government Auditing Standards in considering the System s internal control over financial reporting andcompliance.
July 28, 2021, except as to note 2 (h), which is as of August 13, 2021

39Financial 2021 Comprehensive Annual Financial Report
MANAGEMENT’S DISCUSSION AND ANALYSIS (UNAUDITED)
March 31, 2021
The following overview of the financial activity of the New York State and Local Retirement System (the System) for the fiscal year ended March 31, 2021 is intended to provide the reader with an analysis of the System’s overall financial position. The System is comprised of the New York State and Local Employees’ Retirement System (ERS) and the New York State and Local Police and Fire Retirement System (PFRS). The net position of the System is held in the New York State Common Retirement Fund (the Fund), which was established to hold all assets and record changes in fiduciary net position allocated to the System. This management’s discussion and analysis should be read in conjunction with the basic financial statements of the System, which follow.
FINANCIAL HIGHLIGHTS
The fiduciary net position of the System held in trust to pay pension benefits was $260.08 billion as of March 31, 2021 and $198.08 billion as of March 31, 2020. This amount reflects an increase of $62.00 billion from the prior fiscal year. This change is primarily the result of the net appreciation of the fair value of the investment portfolio. The Fund continues to diversify and monitor downside risks. Net appreciation (depreciation) in fair value of investments for the fiscal years ended March 31, 2021 and 2020 was $67.6 billion and ($12.14) billion, respectively.
• The System’s investments reported a positive money weighted rate of return, net of investment expense, of 33.43 percent for the fiscal year ended March 31, 2021 and a negative money weighted rate of return, net of investment expense, of 2.64 percent for the fiscal year ended March 31, 2020.
• Retirement and death benefits paid during the fiscal year ended March 31, 2021 to 496,628 annuitants totaled $14.02 billion, as compared to $13.25 billion paid to 487,407 annuitants for the fiscal year ended March 31, 2020. The increase is primarily due to the number of new retirees.
• Contributions from employers increased to $5.03 billion for the fiscal year ended March 31, 2021, from $4.78 billion for the fiscal year ended March 31, 2020. The increase in employer contributions was related to an increase in covered employee payroll from the previous year.
• The Net Pension Liability (NPL) for ERS was $99.6 million for the measurement period ended March 31, 2021 as compared to $26.48 billion for the measurement period ended March 31, 2020. The fiduciary net position, restricted for pension benefits as of March 31, 2021, was $220.58 billion, which represents 99.95 percent of the calculated total pension liability for ERS. This NPL is allocated to participating employers and reported in their financial statements pursuant to Governmental Accounting Standards Board (GASB) Statement 68.
• The NPL for PFRS was $1.73 billion for the measurement period ended March 31, 2021 as compared to $5.34 billion for the measurement period ended March 31, 2020. The fiduciary net position, restricted for pension benefits as of March 31, 2021, was $39.50 billion, which represents 96 percent of the calculated total pension liability for PFRS. This NPL is allocated to participating employers and reported in their financial statements pursuant to GASB Statement 68.
40 Financial 2021 Comprehensive Annual Financial Report
OVERVIEW OF THE FINANCIAL STATEMENTS
The financial statements consist of the combining basic statement of fiduciary net position, the combining basic statement of changes in fiduciary net position, and the notes to the basic financial statements. The required supplementary information that appears after the notes to the basic financial statements is not a required part of the basic financial statements, but is supplementary information required by the GASB. The other supplementary information following the required supplementary information is not required, but management has chosen to include such information to increase transparency.
The combining basic statement of fiduciary net position reflects the resources available to pay members, retirees and beneficiaries at the close of the System’s fiscal year. This statement also provides information about the fair value and composition of the System’s fiduciary net position.
The combining basic statement of changes in fiduciary net position presents the changes to the System’s fiduciary net position for the fiscal year, including net investment income (loss), which includes net appreciation (depreciation) in fair value of the investment portfolio, and contributions from members and employers. Benefits and administrative expenses paid by the System are included under the deductions section of the statement.
The notes to the basic financial statements are an integral part of the basic financial statements and provide additional information about the plans, policies, and performance of the System.
The required supplementary information includes: Management’s Discussion and Analysis, Schedule of Changes in the Employers’ Net Pension Liability and Related Ratios, Schedule of Employer Contributions and Schedule of Investment Returns and related notes to the required supplementary information.
The additional supplementary information includes: Schedule of Administrative Expenses, Schedule of Investment Expenses, and Schedule of Consulting Fees.
ANALYSIS OF THE OVERALL FINANCIAL POSITION OF THE SYSTEM
The purpose of the System’s investments is to provide for long term growth, while also ensuring a reliable cash flow that meets the funding requirements of the near term pension obligations. To achieve these goals, the investments are allocated to a variety of asset types and strategies in order to meet the System’s current funding needs as well as future growth requirements. Equity related investments are included for their long term return and growth characteristics. While a majority of fixed income and debt related investments are generally included in the allocation for their ability to control investment risk and provide for a reliable cash flow that meets the funding requirements, a portion is strategically invested in more actively traded markets. It is important to note that the change from year to year is due not only to changes in fair values but also to purchases, sales, and redemptions. Tables 1, 2, and 3 summarize and compare financial data for the current and prior years.
MANAGEMENT’S DISCUSSION AND ANALYSIS (UNAUDITED) CONTINUED

41Financial 2021 Comprehensive Annual Financial Report
Table 1
Summary schedule of fiduciary net position as of March 31, 2021, as compared to March 31, 2020:
(Dollars in Thousands) Percentage Change2021 2020 Dollar Change
Assets:
Investments $ 258,135,801 $ 194,317,163 $ 63,818,638 32.8 %
Securities lending collateral — invested 16,923,148 6,865,125 10,058,023 146.5
Receivables and other assets 3,317,830 4,633,762 (1,315,932) (28.4 )
Total assets 278,376,779 205,816,050 72,560,729 35.3
Liabilities:
Securities lending obligations 16,930,860 6,880,350 10,050,510 146.1
Payables and other liabilities 1,364,836 855,938 508,898 59.5
Total liabilities 18,295,696 7,736,288 10,559,408 136.5
Net position, restricted for pension benefits $ 260,081,083 $ 198,079,762 $ 62,001,321 31.3%
The fiduciary net position of the System totaled $260.1 billion as of March 31, 2021, an increase of $62.0 billion from the prior fiscal year, primarily attributable to the net appreciation of invested assets.
Table 2
Schedule of invested assets as of March 31, 2021, as compared to March 31, 2020:
(Dollars in Thousands) Percentage Change2021 2020 Dollar Change
Domestic equity $ 90,263,828 $ 62,548,268 $ 27,715,560 44.3%
Global fixed income 47,722,955 45,410,315 2,312,640 5.1
International equity 43,480,400 30,673,634 12,806,766 41.8
Private equity 29,470,165 20,314,177 9,155,988 45.1
Real estate 17,647,993 15,693,661 1,954,332 12.5
Short-term investments 11,082,651 5,697,690 5,384,961 94.5
Real assets 3,929,594 3,085,682 843,912 27.3
Opportunistic funds/ARS investments 5,016,078 9,881,892 (4,865,814 ) (49.2 )
Mortgage loans 1,043,621 1,011,844 31,777 3.1
Credit 8,478,516 — 8,478,516 —
Total investments $ 258,135,801 $ 194,317,163 $ 63,818,638 32.8%
MANAGEMENT’S DISCUSSION AND ANALYSIS (UNAUDITED) CONTINUED

42 Financial 2021 Comprehensive Annual Financial Report
The largest percentage increases to the invested assets were in short-term investments and private equity, which represent 4.29 percent and 11.42 percent of the total portfolio, respectively. In the short-term investment portfolio the growth largely reflected temporary liquidity needs for funding new mandates. In the private equity portfolio the increase was due to a moderate increase in activity and a sharp increase in asset values from the prior year.
The largest percentage decrease to the invested assets was in Opportunistic/ARS investments, which represents 1.94 percent of the total portfolio. The decrease reflects redemptions in the ARS portfolio and a reclassification of assets into the Credit portfolio, which was established in the new asset allocation policy.
Table 3
Summary schedule of changes in fiduciary net position for the year ended March 31, 2021, as compared to the year ended March 31, 2020:
(Dollars in Thousands) Percentage Change2021 2020 Dollar Change
Additions:
Net investment (loss) income $ 70,649,606 $ (8,798,771) $ 79,448,377 902.9%
Total contributions 5,638,783 ) 5,383,166 255,617 4.7
Total additions 76,288,389 (3,415,605) 79,703,994 2,333.5
Deductions:
Total benefits paid 14,121,971 13,311,136 810,835 6.1
Administrative expenses 165,097 139,050 26,047 18.7
OPEB expense — 223,608 (223,608) —
Total deductions 14,287,068 13,673,794 613,274 4.5
Net (decrease) increase 62,001,321 (17,089,399) 79,090,720 462.8
Net position, restricted for pension benefits — beginning of year 198,079,762 215,169,161 (17,089,399 ) (7.9)
Net position, restricted for pension benefits — end of year $ 260,081,083 $ 198,079,762 $ 62,001,321 31.3%
The change in net investment income is primarily attributable to the net appreciation in fair value of investments from 2020 to 2021. The increase in total benefits paid is attributable to the number of new retirees.
MANAGEMENT’S DISCUSSION AND ANALYSIS (UNAUDITED) CONTINUED
43Financial 2021 Comprehensive Annual Financial Report
ECONOMIC FACTORS AND RATES OF RETURN
The Fund announced a positive investment performance for the fiscal year ended March 31, 2021, with a time-weighted rate of return of positive 33.55 percent with equity markets rebounding sharply as the governments across the globe provided unprecedented amounts of monetary and fiscal support. All asset classes performed well in a “risk on” environment. Despite this, uncertainties remain across asset classes, particularly in real estate. The COVID-19 pandemic continues to affect countries across the globe with the long-term implications still uncertain. We continue to monitor inflation, potential earnings erosion, tensions with China, the political climate domestically and other potential risks.
REQUESTS FOR INFORMATION
This financial report is designed to provide a general overview of the System’s finances for all interested parties. Questions concerning any of the information provided in this report or requests for additional financial information should be addressed to the New York State and Local Retirement System, 110 State Street, Albany, New York 12244-0001. The report can also be accessed on the Comptroller’s website at: www.osc.state.ny.us/retirement/resources/financial-statements-and-supplementary-information.
MANAGEMENT’S DISCUSSION AND ANALYSIS (UNAUDITED) CONTINUED

44 Financial 2021 Comprehensive Annual Financial Report
BASIC FINANCIAL STATEMENTS
COMBINING BASIC STATEMENT OF FIDUCIARY NET POSITION
Year Ended March 31, 2021
(Dollars in Thousands)
Employees’ Retirement System
Police and Fire Retirement System
Total
Assets:
Investments (notes 2(b), 4, 5, 8, and 11):
Domestic equity $ 76,558,006 $ 13,705,822 $ 90,263,828
Global fixed income 40,476,616 7,246,339 47,722,955
International equity 36,878,258 6,602,142 43,480,400
Private equity 24,995,362 4,474,803 29,470,165
Real estate 14,968,290 2,679,703 17,647,993
Opportunistic/ARSy investments 4,254,428 761,650 5,016,078
Short-term investments 9,399,841 1,682,810 11,082,651
Real assets 3,332,917 596,677 3,929,594
Credit 7,191,123 1,287,393 8,478,516
Mortgage loans 885,156 158,465 1,043,621
Total investments 218,939,997 39,195,804 258,135,801
Securities lending collateral — invested (notes 7 and 8) 14,353,507 2,569,641 16,923,148
Forward foreign exchange contracts (notes 6 and 8) 58,388 10,453 68,841
Receivables:
Employers’ contributions 662,316 266,847 929,163
Members’ contributions 5,336 617 5,953
Member loans 916,146 6,807 922,953
Investment income 294,396 52,704 347,100
Investment sales 281,386 50,375 331,761
Other 153,670 26,069 179,739
Total receivables 2,313,250 403,419 2,716,669
Capital assets, at cost, net of accumulated depreciation 451,491 80,829 532,320
Total assets 236,116,633 42,260,146 278,376,779
Liabilities:
Securities lending obligations (notes 7 and 8) 14,360,048 2,570,812 16,930,860
Forward foreign exchange contracts (notes 6 and 8) 58,338 10,444 68,782
Accounts payable — investments 570,758 102,180 672,938
Benefits payable 125,644 11,641 137,285
Other liabilities (note 2(f)) 421,262 64,569 485,831
Total liabilities 15,536,050 2,759,646 18,295,696
Net position, restricted for pension benefits $ 220,580,583 $ 39,500,500 $ 260,081,083
See accompanying notes to basic financial statements.

45Financial 2021 Comprehensive Annual Financial Report
COMBINING BASIC STATEMENT OF CHANGES IN FIDUCIARY NET POSITION
Year Ended March 31, 2021
(Dollars in Thousands)
Employees’ Retirement System
Police and Fire Retirement System
Total
Additions:
Income from investing activities:
Interest income $ 1,015,078 $ 180,883 $ 1,195,961
Dividend income 1,321,312 235,453 1,556,765
Other income 987,386 175,949 1,163,335
Less: investment expenses (767,490 ) (136,764) (904,254 )
Net appreciation in fair value of investments 57,377,655 10,224,678 67,602,333
Total income from investing activities 59,933,941 10,680,199 70,614,140
Income from securities lending activities:
Securities lending income 40,225 7,168 47,393
Less: securities lending rebates (7,601 ) (1,354 ) (8,955 )
Less: securities lending management fees (2,522 ) (450 ) (2,972 )
Total income from securities lending activities 30,102 5,364 35,466
Total net investment income 59,964,043 10,685,563 70,649,606
Contributions:
Employers 4,062,302 967,488 5,029,790
Members 427,032 65,309 492,341
Interest on accounts receivable 63,096 12,529 75,625
Other, net 40,845 182 41,027
Total contributions 4,593,275 1,045,508 5,638,783
Total additions 64,557,318 11,731,071 76,288,389
Deductions:
Benefits paid:
Retirement benefits 11,606,094 2,158,674 13,764,768
Death benefits 244,443 13,556 257,999
Other, net 97,646 1,558 99,204
Total benefits paid 11,948,183 2,173,788 14,121,971
Administrative expenses 144,234 20,863 165,097
Total deductions 12,092,417 2,194,651 14,287,068
Net increase 52,464,901 9,536,420 62,001,321
Net position, restricted for pension benefits — beginning of year 168,115,682 29,964,080 198,079,762
Net position, restricted for pension benefits — end of year $ 220,580,583 $ 39,500,500 $ 260,081,083
See accompanying notes to basic financial statements.
BASIC FINANCIAL STATEMENTS CONTINUED

46 Financial 2021 Comprehensive Annual Financial Report
NOTES TO BASIC FINANCIAL STATEMENTS
March 31, 2021
1. DESCRIPTION OF PLANS
The Office of the New York State Comptroller administers the following plans: the New York State and Local Employees’ Retirement System (ERS) and the New York State and Local Police and Fire Retirement System (PFRS), which are collectively referred to as the New York State and Local Retirement System (the System). The net position of the System is held in the New York State Common Retirement Fund (the Fund), which was established to hold all assets and record changes in fiduciary net position allocated to the System.
The Comptroller of the State of New York serves as the trustee of the Fund and is the administrative head of the System. The Comptroller is an elected official determined in a direct statewide election and serves a four year term. Thomas P. DiNapoli has served as Comptroller since February 7, 2007. In November 2018, he was elected for a new term commencing January 1, 2019.
The external advisory committees appointed by the Comptroller meet periodically throughout the year and provide independent, expert assistance in guiding the Fund. These committees include: the Advisory Council for the Retirement System; the Investment Advisory Committee; the Real Estate Advisory Committee; the Actuarial Advisory Committee; and the Audit Advisory Committee.
System benefits are established under the provisions of the New York State Retirement and Social Security Law (RSSL). Once a public employer elects to participate in the System, the election is irrevocable. The New York State Constitution provides that pension membership is a contractual relationship and plan benefits cannot be diminished or impaired. Benefits can be changed for future members only by enactment of a State statute. Generally, members of the System are employees, other than teachers, of the State and its municipalities, other than New York City.
ERS and PFRS are cost sharing, multiple employer, defined benefit pension plans. The System is included in the State of New York’s financial report as a pension trust fund. The Public Employees’ Group Life Insurance Plan (GLIP) provides death benefits in the form of life insurance. In these statements, GLIP amounts are apportioned to and included in ERS and PFRS.
As of March 31, 2021, the number of participating employers for ERS and PFRS consisted of the following:
ERS PFRS
State 1 1
Counties 86 4
Cities 72 61
Towns 937 169
Villages 487 299
Other 763 37
School districts 706 —
Total 3,052 571
BASIC FINANCIAL STATEMENTS CONTINUED

47Financial 2021 Comprehensive Annual Financial Report
As of March 31, 2021, the System membership for ERS and PFRS consisted of the following:
ERS PFRS
Retirees and beneficiaries currently receiving benefits 458,261 38,367
Active members 469,968 31,922
Inactive members* 170,613 3,016
Total members and benefit recipients 1,098,842 73,305
* Includes vested members not currently receiving benefits and nonvested members.
(a) Membership Tiers
Pension legislation enacted in 1973, 1976, 1983, 2009 and 2012 established distinct classes of membership. For convenience, the System uses a tier concept to distinguish these groups, generally:
ERS
Tier 1 Those persons who last became members before July 1, 1973.
Tier 2 Those persons who last became members on or after July 1, 1973, but before July 27, 1976.
Tier 3 Generally, those persons who are State correction officers who last became members on or after July 27, 1976, but before January 1, 2010, and all others who last became members on or after July 27, 1976, but before September 1, 1983.
Tier 4 Generally, except for correction officers, those persons who last became members on or after September 1, 1983, but before January 1, 2010.
Tier 5 Those persons who last became members on or after January 1, 2010, but before April 1, 2012.
Tier 6 Those persons who first became members on or after April 1, 2012.
PFRS
Tier 1 Those persons who last became members before July 31, 1973.
Tier 2 Those persons who last became members on or after July 31, 1973, but before July 1, 2009.
Tier 3 Those persons who last became members on or after July 1, 2009, but before January 9, 2010.
Tier 4 Not Applicable
Tier 5 Those persons who last became members on or after January 9, 2010, but before April 1, 2012, or who were previously PFRS Tier 3 members who elected to become Tier 5.
Tier 6 Those persons who first became members on or after April 1, 2012.
BASIC FINANCIAL STATEMENTS CONTINUED
Notes to Basic Financial Statements

48 Financial 2021 Comprehensive Annual Financial Report
(b) Vesting
Members who joined the System prior to January 1, 2010 need five years of service to be 100 percent vested. Members who joined on or after January 1, 2010 (ERS) or January 9, 2010 (PFRS) require ten years of service credit to be 100 percent vested.
(c) Employer Contributions
Participating employers are required under the RSSL to contribute to the System at an actuarially determined rate adopted annually by the Comptroller. The average contribution rate for ERS for the fiscal year ended March 31, 2021 was approximately 14.6 percent of covered employee payroll. The average contribution rate for PFRS for the fiscal year ended March 31, 2021 was approximately 24.4 percent of covered employee payroll. Delinquent annual bills for employer contributions accrue interest at the actuarial interest rate applicable during the year. For the fiscal year ended March 31, 2021, the applicable interest rate was 6.8 percent.
(d) Member Contributions
Generally, Tier 3, 4, and 5 members must contribute 3 percent of their salary to the System. As a result of Article 19 of the RSSL, eligible Tier 3 and 4 employees, with a membership date on or after July 27, 1976, who have ten or more years of membership or credited service with the System, are not required to contribute. Members cannot be required to begin making contributions or to make increased contributions beyond what was required when membership began. For Tier 6 members, the contribution rate varies from 3 percent to 6 percent depending on salary. Generally, Tier 5 and 6 members are required to contribute for all years of service.
BASIC FINANCIAL STATEMENTS CONTINUED
Notes to Basic Financial Statements

49Financial 2021 Comprehensive Annual Financial Report
(e) Benefits
Tiers 1 and 2
Eligibility: Tier 1 members, with the exception of those retiring under special retirement plans, must be at least age 55 to be eligible to collect a retirement benefit. There is no minimum service requirement for Tier 1 members. Tier 2 members, with the exception of those retiring under special retirement plans, must have five years of service and be at least age 55 to be eligible to collect a retirement benefit. The age at which full benefits may be collected for Tier 1 is 55, and the full benefit age for Tier 2 is 62.
BenefitCalculation: Generally, the benefit is 1.67 percent of final average salary for each year of service if the member retires with less than 20 years. If the member retires with 20 or more years of service, the benefit is 2 percent of final average salary for each year of service. Tier 2 members with five or more years of service can retire as early as age 55 with reduced benefits. Tier 2 members age 55 or older with 30 or more years of service can retire with no reduction in benefits. As a result of Article 19 of the RSSL, Tier 1 and Tier 2 members who worked continuously from April 1, 1999 through October 1, 2000 received an additional month of service credit for each year of credited service they have at retirement, up to a maximum of 24 additional months.
Final average salary is the average of the wages earned in the three highest consecutive years of employment. For Tier 1 members who joined on or after June 17, 1971, each year’s compensation used in the final average salary calculation is limited to no more than 20 percent greater than the previous year. For Tier 2 members, each year of final average salary is limited to no more than 20 percent greater than the average of the previous two years.
Tiers 3, 4, and 5
Eligibility: Tier 3 and 4 members, with the exception of those retiring under special retirement plans, must have five years of service and be at least age 55 to be eligible to collect a retirement benefit. Tier 5 members, with the exception of those retiring under special retirement plans, must have ten years of service and be at least age 55 to be eligible to collect a retirement benefit. The full benefit age for Tiers 3, 4 and 5 is 62.
BenefitCalculation:Generally, the benefit is 1.67 percent of final average salary for each year of service if the member retires with less than 20 years. If a member retires with between 20 and 30 years of service, the benefit is 2 percent of final average salary for each year of service. If a member retires with more than 30 years of service, an additional benefit of 1.5 percent of final average salary is applied for each year of service over 30 years. Tier 3 and 4 members with five or more years of service and Tier 5 members with ten or more years of service can retire as early as age 55 with reduced benefits. Tier 3 and 4 members age 55 or older with 30 or more years of service can retire with no reduction in benefits.
Final average salary is the average of the wages earned in the three highest consecutive years of employment. For Tier 3, 4 and 5 members, each year’s compensation used in the final average salary calculation is limited to no more than 10 percent greater than the average of the previous two years.
BASIC FINANCIAL STATEMENTS CONTINUED
Notes to Basic Financial Statements

50 Financial 2021 Comprehensive Annual Financial Report
Tier 6
Eligibility: Tier 6 members, with the exception of those retiring under special retirement plans, must have ten years of service and be at least age 55 to be eligible to collect a retirement benefit. The full benefit age for Tier 6 is 63 for ERS members and 62 for PFRS members.
BenefitCalculation: Generally, the benefit is 1.67 percent of final average salary for each year of service if the member retires with less than 20 years. If a member retires with 20 years of service, the benefit is 1.75 percent of final average salary for each year of service. If a member retires with more than 20 years of service, an additional benefit of 2 percent of final average salary is applied for each year of service over 20 years. Tier 6 members with ten or more years of service can retire as early as age 55 with reduced benefits.
Final average salary is the average of the wages earned in the five highest consecutive years of employment. For Tier 6 members, each year’s compensation used in the final average salary calculation is limited to no more than 10 percent greater than the average of the previous four years.
BASIC FINANCIAL STATEMENTS CONTINUED
Notes to Basic Financial Statements

51Financial 2021 Comprehensive Annual Financial Report
Special Plans
The 25 Year Plans allow a retirement after 25 years of service with a benefit of one half of final average salary, and the 20 Year Plans allow a retirement after 20 years of service with a benefit of one half of final average salary. These plans are available to certain PFRS members, sheriffs, and correction officers.
Disability Retirement Benefits
Disability retirement benefits are available to ERS and PFRS members unable to perform their job duties because of permanent physical or mental incapacity. There are three general types of disability benefits: ordinary, performance of duty, and accidental disability benefits. Eligibility, benefit amounts, and other rules such as any offsets of other benefits depend on a member’s tier, years of service, and plan.
Ordinary Death Benefits
Death benefits are payable upon the death, before retirement, of a member who meets eligibility requirements as set forth by law. The first $50,000 of an ordinary death benefit is paid in the form of group term life insurance. The benefit is generally three times the member’s annual salary. For most members, there is also a reduced post-retirement ordinary death benefit available.
Post-Retirement Benefit Increases
A cost of living adjustment is provided annually to: (i) all retirees who have attained age 62 and have been retired for five years; (ii) all retirees who have attained age 55 and have been retired for ten years; (iii) all disability retirees, regardless of age, who have been retired for five years; (iv) ERS recipients of an accidental death benefit, regardless of age, who have been receiving such benefit for five years; and (v) the spouse of a deceased retiree receiving a lifetime benefit under an option elected by the retiree at retirement. An eligible spouse is entitled to one half the cost of living adjustment amount that would have been paid to the retiree when the retiree would have met the eligibility criteria. This cost of living adjustment is a percentage of the annual retirement benefit of the eligible retiree as computed on a base benefit amount not to exceed $18,000 of the annual retirement benefit. The cost of living percentage shall be 50 percent of the annual Consumer Price Index as published by the U.S. Bureau of Labor, but cannot be less than 1 percent or exceed 3 percent.
BASIC FINANCIAL STATEMENTS CONTINUED
Notes to Basic Financial Statements
52 Financial 2021 Comprehensive Annual Financial Report
2. SUMMARY OF SIGNIFICANT ACCOUNTING POLICIES
(a) Basis of Accounting
The System maintains records and accounts, and prepares financial statements using the accrual basis of accounting. Employer contributions are recognized when legally due, pursuant to statutory requirements, in accordance with the terms of each plan. Member contributions are based on earned member salaries and are recognized when due. Benefits, expenses, and refunds are recognized when due and payable.
(b) Investments
Investments are recorded on a trade date basis and reported at fair value. Fair value is defined as the amount that can reasonably be expected to be received for an investment in a current sale between a willing buyer and a willing seller. Due to the nature of investments, it is reasonable that changes in the value of investments will occur in the near future, and such changes could materially affect the amounts reported. The amounts reported as investments on the financial statements are allocated between ERS and PFRS based on each system’s monthly average equity in the Fund. See note 4(c) for detailed information on the System’s policy on investment valuation and note 8 for more detail regarding the methods used to measure the fair value of investments.
(c) Member Loan Programs
Members who joined prior to January 1, 2018 are entitled to participate in a loan program that allows them to borrow up to 75 percent of their member contributions or $50,000, whichever is less. Members who joined on or after January 1, 2018, may borrow up to 50 percent of their contribution balance or $50,000, whichever is less. Repayment of outstanding amounts is generally made through payroll deductions within five years. The interest rate charged for COESC Member Loans is fixed at 1 percent below the actuarial interest rate at the time the loan is granted. The rate for loans issued during the fiscal year ended March 31, 2021 was 6.0 percent.
(d) Capital Assets
Capital assets are capitalized at cost and depreciated on a straight line basis over the related assets estimated useful lives.
During the fiscal year ended March 31, 2014, the System began capitalizing outlays associated with the redesign of its pension administration system. As of March 31, 2021, capitalized outlays for the project total $483.6 million. This project is currently ongoing and is expected to be completed in the period ending July 31, 2022, at which time depreciation of the capitalized costs will begin.
BASIC FINANCIAL STATEMENTS CONTINUED
Notes to Basic Financial Statements

53Financial 2021 Comprehensive Annual Financial Report
(e) Contributions Receivable
Employers’ contributions receivable are presented net of withdrawals, refunds, advance employer payments, and credits due employers. Receivable amounts from participating employers include $20.7 million for amortization of retirement incentives, new plan adoptions, and retroactive membership. The RSSL includes several provisions related to the amortization of employer contribution amounts. These include:
• Chapter 57 of the Laws of 2010 authorized the State and local employers to amortize a portion of their annual pension costs during periods when actuarial contribution rates exceed thresholds established by the statute. Amortized amounts will be paid in equal annual installments over a ten year period including a rate of interest set by the Comptroller annually. Employers may prepay these amounts at any time without penalty. The first payment will be due in the fiscal year following the decision to amortize. Chapter 57 further provides that when contribution rates fall below legally specified levels and all outstanding amortizations have been paid, employers that elected to amortize will be required to pay additional moneys into reserve funds, specific to each employer, which will be used to offset their contributions in the future. These reserve funds will be invested separately from pension assets.
The following represents the amortized receivable balance from the State and Local participating employers as of March 31, 2021, including the statutory amortization threshold and interest rate, for each respective fiscal year:
CHAPTER 57, LAWS OF 2010
Year(Percentage of Payroll)
Interest (Dollars in Millions)
ERS PFRS State Local
2012 10.5% 18.5% 3.75% $ — $ 18.5
2013 11.5 19.5 3.00 23.3 68.9
2014 12.5 20.5 3.67 36.8 58
2015 13.5 21.5 3.15 41.1 57.6
2016 14.5 22.5 3.21 32.2 34.8
2017 15.1 23.5 2.33 — 3.8
2018 14.9 24.3 2.84 — 3.2
2019 14.4 23.5 3.64 — 3.5
$ 133.4 $ 248.3
BASIC FINANCIAL STATEMENTS CONTINUED
Notes to Basic Financial Statements

54 Financial 2021 Comprehensive Annual Financial Report
• The fiscal year 2014 Enacted Budget included an alternate contribution program (the Alternate Contribution Stabilization Program) that provided certain participating employers with a one time election to amortize slightly more of their required contributions than would be available for amortization under the 2010 legislation. In addition, the maximum payment period was increased from ten years to twelve years. The election was available to: counties, cities, towns, villages, BOCES, school districts and the four public health care centers operated in the counties of Nassau, Westchester and Erie. The State was not eligible to participate in the Alternate Contribution Stabilization Program.
The following represents the amortized receivable balance from Local participating employers as of March 31, 2021, including the statutory amortization threshold and interest rate, for each respective fiscal year:
CHAPTER 57, LAWS OF 2013
Year(Percentage of Payroll)
Interest(Dollars in Millions)
ERS PFRS Local
2014 12.0% 20.0% 3.76% $ 64.5
2015 12.0 20.0 3.50 97.7
2016 12.5 20.5 3.31 76.7
2017 13.0 21.0 2.63 59.9
2018 13.5 21.5 3.31 58.9
2019 14.0 22.0 3.99 21.7
2020 14.2 22.5 2.87 18.1
2021 14.1 23.0 1.60 45.1
$ 442.6
BASIC FINANCIAL STATEMENTS CONTINUED
Notes to Basic Financial Statements

55Financial 2021 Comprehensive Annual Financial Report
(f) Postemployment Benefits Other than Pensions
Employees of the System participate in a Postemployment Benefits Other than Pensions (OPEB) Plan administered by the State. The State administers the OPEB plan on a pay-as-you-go basis. Substantially all of the System’s employees may become eligible for postemployment benefits if they reach retirement age while working for the System. The costs of providing the postemployment benefits, which primarily consists of health insurance coverage, are shared between the System and the retired employee.
The System’s total OPEB liability was measured as of March 31, 2020 and was determined by an actuarial valuation as of April 1, 2019 rolled forward to March 31, 2020. The total OPEB liability and related OPEB amounts were allocated to the System based on the percentage of the System’s full-time equivalents to the total full-time equivalents of the State. The OPEB amounts recorded by the System include the total OPEB liability ($275.1 million), deferred outflows of resources ($37.4 million), deferred inflows of resources ($15.3 million) and OPEB expense ($35.2 million). OPEB expense is recorded as part of administrative expenses on the combining statement of changes in fiduciary net position. Due to immateriality of the OPEB amounts to the System as a whole, the total OPEB liability, deferred outflows of resources and deferred inflows of resources are netted and included in other liabilities on the combining statement of fiduciary net position. Additionally, due to immateriality, the System has not presented all disclosures and required supplementary information prescribed by GASB Statement No. 75. For the fiscal year ended March 31, 2021, the System paid $7.9 million in benefit payments.
(g) Use of Estimates
The preparation of financial statements in conformity with U.S. generally accepted accounting principles requires management to make estimates and assumptions that affect the reported amounts of assets and liabilities and the disclosure of contingencies. These estimates are subject to a certain amount of uncertainty in the near term, which could result in changes in the values reported for those assets in the combined statement of fiduciary net position. Estimates also affect the reported amounts of income/additions and expenses/deductions during the reporting period. Actual results could differ from these estimates.
(h) Immaterial Correction of an Error
The System corrected an immaterial error in the combining statement of changes in fiduciary net position by reducing member contributions and other deductions by approximately $872 million.
BASIC FINANCIAL STATEMENTS CONTINUED
Notes to Basic Financial Statements
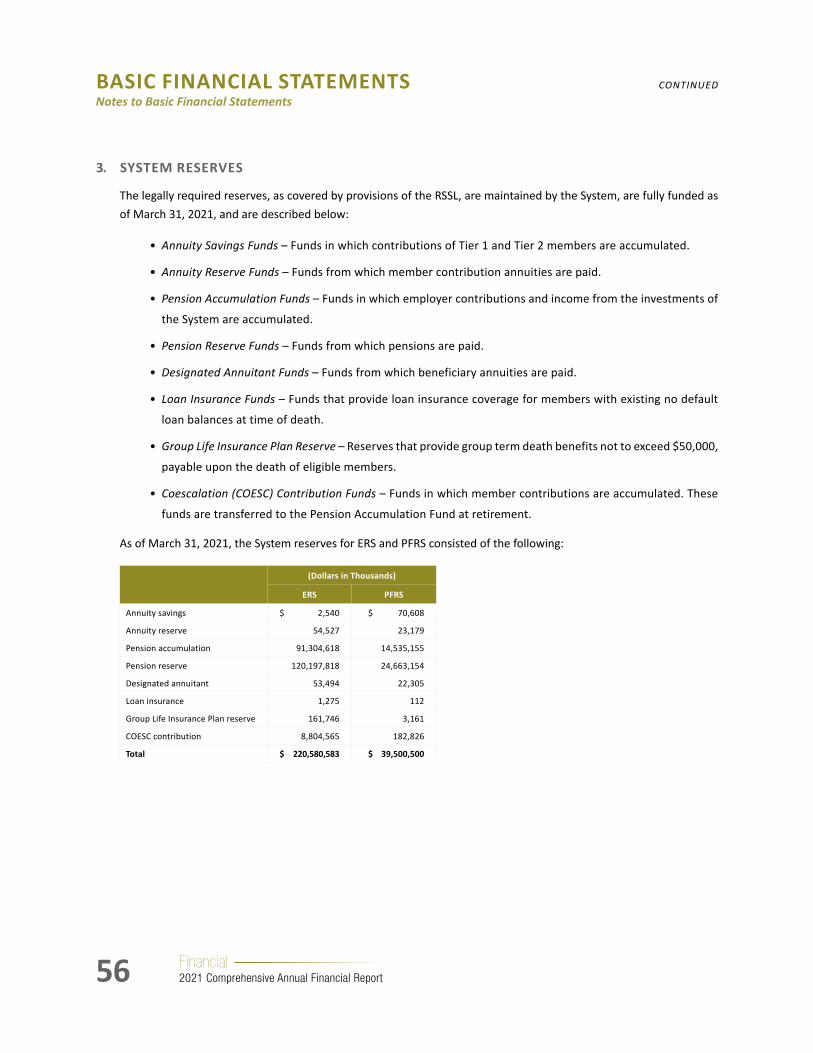
56 Financial 2021 Comprehensive Annual Financial Report
3. SYSTEM RESERVES
The legally required reserves, as covered by provisions of the RSSL, are maintained by the System, are fully funded as of March 31, 2021, and are described below:
• Annuity Savings Funds – Funds in which contributions of Tier 1 and Tier 2 members are accumulated.
• Annuity Reserve Funds – Funds from which member contribution annuities are paid.
• Pension Accumulation Funds – Funds in which employer contributions and income from the investments of
the System are accumulated.
• Pension Reserve Funds – Funds from which pensions are paid.
• Designated Annuitant Funds – Funds from which beneficiary annuities are paid.
• Loan Insurance Funds – Funds that provide loan insurance coverage for members with existing no default
loan balances at time of death.
• Group Life Insurance Plan Reserve – Reserves that provide group term death benefits not to exceed $50,000,
payable upon the death of eligible members.
• Coescalation (COESC) Contribution Funds – Funds in which member contributions are accumulated. These
funds are transferred to the Pension Accumulation Fund at retirement.
As of March 31, 2021, the System reserves for ERS and PFRS consisted of the following:
(Dollars in Thousands)
ERS PFRS
Annuity savings $ 2,540 $ 70,608
Annuity reserve 54,527 23,179
Pension accumulation 91,304,618 14,535,155
Pension reserve 120,197,818 24,663,154
Designated annuitant 53,494 22,305
Loan insurance 1,275 112
Group Life Insurance Plan reserve 161,746 3,161
COESC contribution 8,804,565 182,826
Total $ 220,580,583 $ 39,500,500
BASIC FINANCIAL STATEMENTS CONTINUED
Notes to Basic Financial Statements
57Financial 2021 Comprehensive Annual Financial Report
4. INVESTMENTS
(a) Investment Policy
The State Comptroller, currently Comptroller Thomas P. DiNapoli, is Trustee of the Fund. He is directly accountable for the investment of Fund assets and for the oversight and management of the Fund. Comptroller DiNapoli is responsible for implementing an asset allocation with an appropriate balance of risk and return. The Trustee has put in place investment policies and practices designed to ensure that investments are made for the exclusive benefit of the participants and beneficiaries of the System, on whose behalf the assets of the Fund are invested, and that Fund investments are made with the care that a prudent person serving in a like capacity and familiar with such matters would use in the conduct of an enterprise of like character and with like aims – the “prudence” and “exclusive benefit” fiduciary standards of investment. Additionally, the Trustee has adopted policies and practices to ensure that the Fund is managed with high levels of ethical conduct and transparency.
The Comptroller seeks the input of a wide range of internal and external advisors to determine the allocation of assets and the appropriate investment choices for the Fund. The Comptroller appoints a Chief Investment Officer to oversee the Division of Pension Investment and Cash Management (PICM) operations, manage staff, and supervise investments on a day to day basis. The Fund also relies on advice from a network of outside advisors, consultants, and legal counsel, as well as the members of independent external advisory committees appointed by the Comptroller. Outside advisors and internal investment staff are part of the chain of approval that must recommend all investment decisions before they reach the Comptroller for final approval.
The asset allocation is not intended to be an absolute limit on the type of investments that can be made by the Comptroller or considered by staff. The Comptroller is expressly permitted to invest the assets of the Fund pursuant to various provisions of State law, including, among others, Article 4-A of the RSSL, which also contains limitations on the amount and quality of investments the Fund may hold in certain asset categories. Investments purchased pursuant to these provisions are so called “legal list” investments. In addition to the foregoing, section 177(9) of the RSSL contains a provision that currently provides that up to 25 percent of the Fund’s assets may be placed in investments not specifically authorized by any other provision of law. In making investments under this provision, the Comptroller is subject to the exclusive benefit and prudence standards in the statute. Subject to such standards, investments made under this provision must also, to the extent reasonably possible, benefit the overall economic health of the State. Investments made pursuant to section 177(9) of the RSSL are so called “basket clause” investments.
BASIC FINANCIAL STATEMENTS CONTINUED
Notes to Basic Financial Statements

58 Financial 2021 Comprehensive Annual Financial Report
(b) Asset Allocation
The following was the adopted asset allocation policy as of March 31, 2021:
Asset Class Target Allocation
Domestic equity 32.0 %
International equity 15.0
Private equity 10.0
Real estate 9.0
Opportunistic/Absolute Return Strategy 3.0
Credit 4.0
Real assets 3.0
Fixed Income 23.0
Cash 1.0
100.0 %
(c) Methods Used to Value Investments
Equity securities traded on a national or international exchange are reported at current quoted fair values.
Bonds and other fixed income assets are primarily reported at fair values obtained from independent pricing services.
Mortgages are valued on the basis of future principal and interest payments and are discounted at prevailing interest rates for similar instruments.
Direct investments in real estate are valued based on independent appraisals made every three years or according to the contract.
Real estate partnerships, global fixed income funds, commingled international equity funds and various alternative investments (private equity, opportunistic/ARS funds, real assets, and credit) are reported at net asset values as provided by the general partners or investment managers.
Information on securities lending is available in note 7. Information on foreign currency risks and derivative financial instruments can be found in note 5(f) and note 6, respectively.
The Fund trades in foreign exchange contracts in the normal course of its investing activities in order to manage exposure to market risks. Such contracts, which are generally for a period of less than one year, are used to purchase and sell foreign currency at a guaranteed future price. These contracts are recorded at fair value using foreign currency exchange rates.
BASIC FINANCIAL STATEMENTS CONTINUED
Notes to Basic Financial Statements
59Financial 2021 Comprehensive Annual Financial Report
(d) Rates of Return
In accordance with U.S. generally accepted accounting principles, the money weighted rate of return on plan investments, net of investment expenses, was 33.43 percent for the year ended March 31, 2021. For internal purposes, the System evaluates investment performance using the time weighted rate of return, gross of certain investment fees, which was 33.55 percent for the year ended March 31, 2021.
5. DEPOSIT AND INVESTMENT RISK DISCLOSURE
(a) Custodial Credit Risk for Investments
Investment securities are exposed to custodial credit risk if the securities are not registered in the name of the Fund, or are held either by the counterparty or the counterparty’s trust department or agent, but not in the name of the Fund.
Equity and fixed income investments owned directly by the Fund, which trade in the United States (U.S.) markets, are generally held by the Fund’s custodian, in separate accounts, in the name of the Comptroller of the State of New York in Trust for the Fund. These securities are typically held in electronic form through the Federal Book Entry System and by the Depository Trust Company (DTC) and its subsidiaries acting as an agent of the Fund’s custodian bank. Securities held directly by the Fund that trade in markets outside the U.S. are held by a subsidiary of the Fund’s custodian bank in the local market, a bank performing custodial services in the local market acting as an agent for the Fund’s custodian bank, and in some foreign markets, the securities are held in electronic form by a DTC subsidiary or an organization similar to DTC.
Equity investments held indirectly by the Fund via limited partnerships, commingled investment funds, joint ventures, and other similar vehicles are held in custody by an organization contracted by the general partner and/or the investment management firm responsible for the management of each investment organization.
Title to real estate invested in by the Fund is held either by a real estate holding company or a real estate investment fund. Ownership of mortgage assets is documented by the Fund’s holding of original mortgage and note documents by the Office of the State Comptroller’s PICM.
(b) Custodial Credit Risk for Deposits
Deposits are exposed to custodial credit risk if the deposits are not covered by depository insurance or the deposits are uncollateralized, collateralized with securities held by the pledging financial institution, or collateralized with securities held by the pledging institution’s trust department or agent, but not in the name of the Fund.
In accordance with existing policies and procedures, the PICM in the Office of the State Comptroller monitors deposit balances for the purpose of determining collateralization levels. Collateral sufficient to cover all uninsured deposits is held at the State’s custodial bank.
BASIC FINANCIAL STATEMENTS CONTINUED
Notes to Basic Financial Statements

60 Financial 2021 Comprehensive Annual Financial Report
(c) Interest Rate Risk
The System is subject to interest rate risk, which is the risk that changes in market interest rates will adversely affect the fair value of the Fund’s fixed income securities. Pursuant to the Fund’s investment policies and procedures and to address changing economic factors and their impact on various sectors of the economy, PICM staff meets regularly to discuss the investment strategy for the fixed income portfolio. Several factors are taken into account when formulating this strategy, including sector weightings and the current duration of the portfolio.
The price volatility of the Fund’s fixed income holdings is measured by duration. Effective duration is a measure of the price sensitivity of a bond to interest rate movements. Effective duration follows the concept that interest rates and bond prices move in opposite directions.
As of March 31, 2021, the duration of the fixed income portfolio is as follows (dollars in thousands):
Category Fair Value Percentage of Portfolio
Effective Duration (In Years)
Global fixed income:
Core Portfolio:
Treasury $ 13,439,002 28.2 % 10.93
Treasury Inflation-Protected Securities (TIPS) 2,110,359 4.4 3.33
Federal agency 698,271 1.5 4.64
Corporate 15,301,141 32.1 6.84
Asset-backed 1,819,641 3.8 3.05
Commercial mortgage-backed 1,830,010 3.8 3.11
Mortgage-backed 6,888,716 14.4 4.22
Collateralized loan obligations 2,898,394 6.1 0.10
Municipal bonds 612,624 1.3 11.64
Core Portfolio 45,598,158 95.6 6.17
Externally managed funds:
Advent Capital 480,884 1.0 2.76
Calvert Research and Management 254,105 0.5 5.93
DoubleLine Capital 283,264 0.6 15.65
New Century Advisors 531,805 1.1 5.60
Semper Capital 315,934 0.7 3.20
Teachers Advisors (Nuveen) 258,805 0.5 6.14
Total global fixed income $ 47,722,955 100.0 %
Mortgage loans:
Berkadia 552,872 53.0 4.19
CPC 490,749 47.0 6.38
Total Mortgage loans $ 1,043,621 100.0 %
Total $ 48,766,576
BASIC FINANCIAL STATEMENTS CONTINUED
Notes to Basic Financial Statements
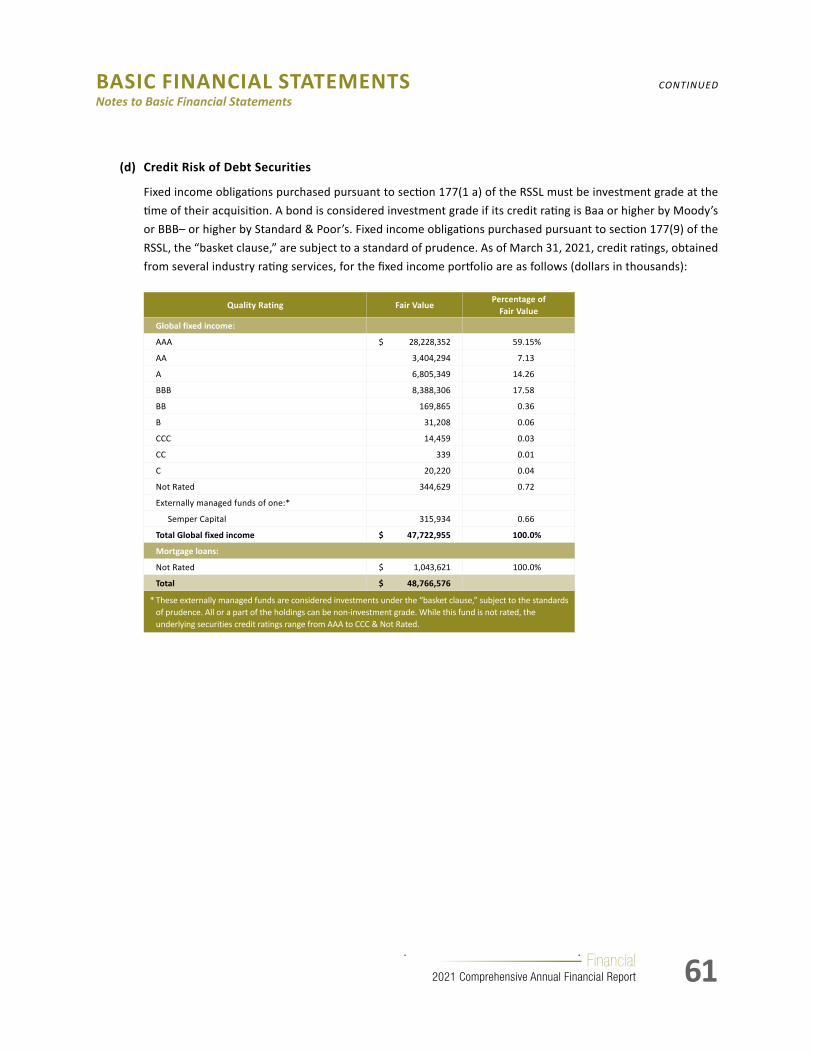
61Financial 2021 Comprehensive Annual Financial Report
(d) Credit Risk of Debt Securities
Fixed income obligations purchased pursuant to section 177(1 a) of the RSSL must be investment grade at the time of their acquisition. A bond is considered investment grade if its credit rating is Baa or higher by Moody’s or BBB– or higher by Standard & Poor’s. Fixed income obligations purchased pursuant to section 177(9) of the RSSL, the “basket clause,” are subject to a standard of prudence. As of March 31, 2021, credit ratings, obtained from several industry rating services, for the fixed income portfolio are as follows (dollars in thousands):
Quality Rating Fair ValuePercentage of
Fair ValueGlobal fixed income:
AAA $ 28,228,352 59.15 %
AA 3,404,294 7.13
A 6,805,349 14.26
BBB 8,388,306 17.58
BB 169,865 0.36
B 31,208 0.06
CCC 14,459 0.03
CC 339 0.01
C 20,220 0.04
Not Rated 344,629 0.72
Externally managed funds of one:*
Semper Capital 315,934 0.66
Total Global fixed income $ 47,722,955 100.0%
Mortgage loans:
Not Rated $ 1,043,621 100.0 %
Total $ 48,766,576
* These externally managed funds are considered investments under the “basket clause,” subject to the standards of prudence. All or a part of the holdings can be non-investment grade. While this fund is not rated, the underlying securities credit ratings range from AAA to CCC & Not Rated.
BASIC FINANCIAL STATEMENTS CONTINUED
Notes to Basic Financial Statements
62 Financial 2021 Comprehensive Annual Financial Report
(e) Concentration of Credit Risk
Concentration of credit risk is the risk of loss attributed to the magnitude of the Fund’s investment in a single issuer.
As of March 31, 2021, the System did not hold any investments in any one issuer that totaled 5 percent or more of the pension plan’s fiduciary net position. Investments issued or explicitly guaranteed by the U.S. government and pooled investments are excluded.
Issuer limits for investments held by the Fund are established by law and by policy guidelines adopted by the PICM.
Short term fixed income investments not purchased pursuant to section 177(9) of the RSSL are generally limited to the following investment types maturing in one year or less:
• Obligations for which the full faith and credit of the U.S. government is pledged to provide payment of interest and principal.
• Obligations issued by any Federal Home Loan Bank or obligations fully guaranteed as to principal and interest by the Federal National Mortgage Association or the Federal Home Loan Mortgage Corporation.
• Commercial paper that has received the highest rating from two nationally recognized rating services. A maximum of $1 billion of the short term portfolio may be invested in any one commercial paper issuer.
• Simultaneous purchase and sale of U.S. Treasury obligations may be executed with Primary Government dealers. A maximum of $200 million may be invested with any one Primary Government dealer.
• Corporate and asset backed securities (ABS) that are rated investment grade by two nationally recognized rating services. ABS must have a weighted average life of one year or less.
BASIC FINANCIAL STATEMENTS CONTINUED
Notes to Basic Financial Statements

63Financial 2021 Comprehensive Annual Financial Report
Fixed income investments not purchased pursuant to section 177(9) of the RSSL are generally limited to the following investment types with maturities longer than one year:
• Obligations for which the full faith and credit of the U.S. government is pledged to provide payment of principal and interest.
• Obligations payable in U.S. dollars issued by any department, agency, or political subdivision of the U.S. government or issued by any corporation, company, or other issuer of any kind or description created or existing under the laws of the U.S., any state of the U.S., the District of Columbia, or the Commonwealth of Puerto Rico, and obligations payable in U.S. funds of Canada or any province or city of Canada, provided each obligation at the time of investment shall be rated investment grade by two nationally recognized rating services (or by one nationally recognized rating service in the event only one such service rates such obligation). The aggregate investment by the Fund in the obligations of any one issuer shall not exceed 2 percent of the assets of the Fund or 5 percent of the direct liabilities of the issuer.
• Interest bearing obligations payable in U.S. funds, which at the time of investment are rated in one of the three highest rating grades by each rating service approved by the New York State Department of Financial Services that has rated such obligations. The aggregate amount invested in the obligations of any single issuer may not exceed 1 percent of the assets of the Fund.
• Bonds issued or guaranteed by the State of Israel and approved by the United States Comptroller of the Currency, payable in U.S. dollars, not to exceed 5 percent of the assets of the Fund.
• Obligations issued or guaranteed by the International Bank for Reconstruction and Development (not to exceed 5 percent of the assets of the Fund), the Inter American Development Bank, the Asian Development Bank, or the African Development Bank.
Fixed income investments purchased pursuant to section 177(9) of the RSSL are subject to standards of prudence and the exclusion benefit rules. Subject to such standards, investments made under section 177(9) must, to the extent reasonably possible, benefit the overall economic health of the State.
(f) Foreign Currency Risk
Foreign currency risk is the risk that changes in exchange rates will adversely affect the fair value of an investment or a deposit. The Fund has exposure through direct investments in international equities, international equity commingled funds, international real estate investments, international private equity investments, international opportunistic/ARS funds, international real asset funds and international credit funds. The Fund’s asset allocation and investment policies allow for active and passive investments in international securities. The Fund permits the managers of direct investments in international equities to use forward currency contracts to manage their exposure to foreign currencies relative to the U.S. dollar. Where the Fund participates in commingled funds, limited partnerships, or other investment arrangements, the decision whether or not to use forward currency contracts to manage their foreign currency exposure is left up to the individual investment managers. To address the impact of changes in exchange rates, only forward foreign exchange contracts of one year or less are allowed when used to lessen portfolio volatility or hedge the portfolio’s currency exposure.
BASIC FINANCIAL STATEMENTS CONTINUED
Notes to Basic Financial Statements
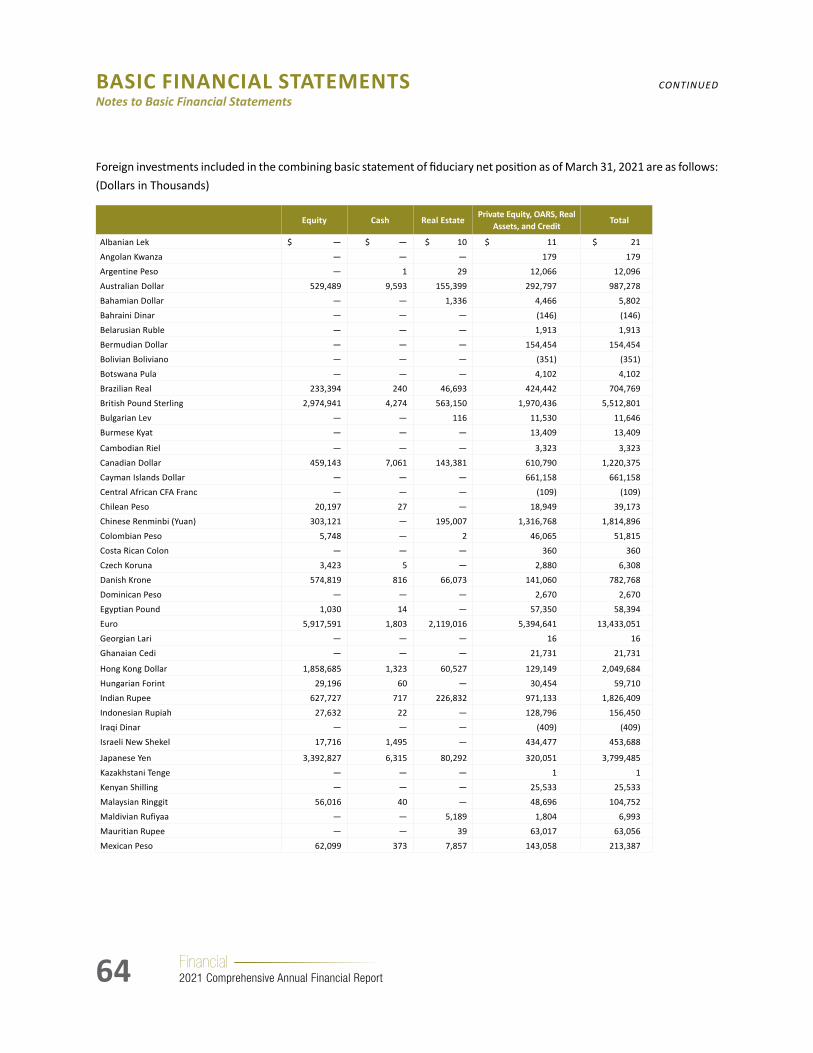
64 Financial 2021 Comprehensive Annual Financial Report
Foreign investments included in the combining basic statement of fiduciary net position as of March 31, 2021 are as follows: (Dollars in Thousands)
Equity Cash Real EstatePrivate Equity, OARS, Real
Assets, and CreditTotal
Albanian Lek $ — $ — $ 10 $ 11 $ 21 Angolan Kwanza — — — 179 179 Argentine Peso — 1 29 12,066 12,096 Australian Dollar 529,489 9,593 155,399 292,797 987,278 Bahamian Dollar — — 1,336 4,466 5,802 Bahraini Dinar — — — (146) (146) Belarusian Ruble — — — 1,913 1,913 Bermudian Dollar — — — 154,454 154,454 Bolivian Boliviano — — — (351) (351) Botswana Pula — — — 4,102 4,102 Brazilian Real 233,394 240 46,693 424,442 704,769 British Pound Sterling 2,974,941 4,274 563,150 1,970,436 5,512,801 Bulgarian Lev — — 116 11,530 11,646 Burmese Kyat — — — 13,409 13,409
Cambodian Riel — — — 3,323 3,323 Canadian Dollar 459,143 7,061 143,381 610,790 1,220,375 Cayman Islands Dollar — — — 661,158 661,158 Central African CFA Franc — — — (109) (109) Chilean Peso 20,197 27 — 18,949 39,173 Chinese Renminbi (Yuan) 303,121 — 195,007 1,316,768 1,814,896 Colombian Peso 5,748 — 2 46,065 51,815 Costa Rican Colon — — — 360 360 Czech Koruna 3,423 5 — 2,880 6,308 Danish Krone 574,819 816 66,073 141,060 782,768 Dominican Peso — — — 2,670 2,670 Egyptian Pound 1,030 14 — 57,350 58,394 Euro 5,917,591 1,803 2,119,016 5,394,641 13,433,051 Georgian Lari — — — 16 16 Ghanaian Cedi — — — 21,731 21,731
Hong Kong Dollar 1,858,685 1,323 60,527 129,149 2,049,684 Hungarian Forint 29,196 60 — 30,454 59,710 Indian Rupee 627,727 717 226,832 971,133 1,826,409 Indonesian Rupiah 27,632 22 — 128,796 156,450 Iraqi Dinar — — — (409) (409) Israeli New Shekel 17,716 1,495 — 434,477 453,688
Japanese Yen 3,392,827 6,315 80,292 320,051 3,799,485 Kazakhstani Tenge — — — 1 1 Kenyan Shilling — — — 25,533 25,533 Malaysian Ringgit 56,016 40 — 48,696 104,752 Maldivian Rufiyaa — — 5,189 1,804 6,993 Mauritian Rupee — — 39 63,017 63,056 Mexican Peso 62,099 373 7,857 143,058 213,387
BASIC FINANCIAL STATEMENTS CONTINUED
Notes to Basic Financial Statements

65Financial 2021 Comprehensive Annual Financial Report
Equity Cash Real EstatePrivate Equity, OARS, Real
Assets, and CreditTotal
Moroccan Dirham $ — $ — $ — $ 8,172 $ 8,172 Mozambican Metical — — — 1,246 1,246 New Taiwan Dollar 799,382 97 135 19,107 818,721 New Zealand Dollar 22,245 512 — 66,573 89,330 Nigerian Naira — — — 41,714 41,714 Norwegian Krone 126,197 1,031 3,116 105,914 236,258 Omani Rial — — — (310) (310) Pakistan Rupee 2,470 — — — 2,470 Panamanian Balboa — — — (319) (319) Peruvian Sol — 1 — 70,916 70,917 Philippine Peso 11,470 5 — 35,001 46,476 Polish Zloty 25,141 85 65,956 365,199 456,381 Qatari Riyal 6,003 — — 515 6,518 Romanian Leu — — — 26,058 26,058 Russian Ruble — — 2,679 107,909 110,588 Saudi Riyal 17,068 17 — (4,924) 12,161 Serbian Dinar — — 19 1,594 1,613 Singapore Dollar 217,271 3,188 92,428 177,943 490,830 South African Rand 140,876 1,676 — 90,005 232,557 South Korean Won 990,120 77 23,689 152,927 1,166,813 Sri Lankan Rupee — — — 4,492 4,492 Swedish Krona 870,903 5,556 39,761 954,475 1,870,695
Swiss Franc 1,142,357 1,798 11 289,312 1,433,478 Tanzanian Shilling — — — 2,785 2,785 Thai Baht 68,065 — — 31,583 99,648 Tunisian Dinar — — — 35 35 Turkish Lira 44,320 1,016 — 61,618 106,954 Ugandan Shilling — — — 1,581 1,581 Ukrainian Hryvnia — — 3,042 12,945 15,987 United Arab Emirates Dirham 5,274 — 8,193 63,979 77,446 Uruguayan Peso — — — (949) (949) Venezuelan Bolívar Soberano — — — 2,537 2,537 Vietnamese Dong — — 116 45,292 45,408 West African CFA Franc — — — 9,637 9,637 Zambian Kwacha — — — 196 196 Other — — 23,372 89 23,461 Total subject to foreign currency risk 21,583,956 49,238 3,933,465 16,207,567 41,774,226 Commingled international equity in U.S. Dollars 15,545,326 — — — 15,545,326 Foreign investments in U.S. Dollars 6,351,118 — 470 7,831,621 14,183,209 Total foreign investments $ 43,480,400 $ 49,238 $ 3,933,935 $ 24,039,188 $ 71,502,761
BASIC FINANCIAL STATEMENTS CONTINUED
Notes to Basic Financial Statements

66 Financial 2021 Comprehensive Annual Financial Report
6. DERIVATIVES
A derivative is generally defined as an investment contract or security with a value that depends on, or is derived from, the value of an underlying asset, reference rate, or financial index.
Forward Currency Contracts
The System may enter into forward currency contracts to manage exposure to fluctuations in foreign currency exchange rates on portfolio holdings. The System also enters into forward exchange contracts to settle future obligations. A forward exchange contract is a commitment to purchase or sell a foreign currency at a future date at a negotiated forward rate. A contract is classified as a forward contract when the settlement date is more than two days after the trade date. Risk associated with such contracts includes movement in the value of a foreign currency relative to the U.S. dollar. The contracts are valued at forward exchange rates and include net appreciation/depreciation in the combining statement of fiduciary net position. Realized gain or loss on forward currency contracts is the difference between the original contract and the closing value of such contract and is included in the combining basic statement of changes in fiduciary net position.
The table below summarizes the fair value of foreign currency contracts as of March 31, 2021 (dollars in thousands):
Currency Forward Currency Contracts Spot Currency Contracts Totals
Australian Dollar $ (725 ) $ (1,077 ) $ (1,802 )
Brazilian Real — (118 ) (118 )
British Pound 886 1,733 2,619
Canadian Dollar (4,057 ) (4,475 ) (8,532 )
Chinese Yuan Renminbi — 2,244 2,244
Czech Koruna 229 — 229
Danish Krone 4,960 — 4,960
Euro 20,327 (3,947 ) 16,380
Hong Kong Dollar (3,964 ) 1,272 (2,692 )
Indonesia Rupiah — (923 ) (923 )
Israeli Shekel — (99 ) (99 )
Japanese Yen (9,202 ) 9,674 472
Mexican Peso 112 — 112
New Taiwan Dollar — (358 ) (358 )
New Zealand Dollar — (467 ) (467 )
Norwegian Krone (70 ) — (70 )
Polish Zloty 1,595 — 1,595
Singapore Dollar (326 ) 614 288
South African Rand (855 ) — (855 )
South Korean Won — 341 341
Swedish Krona (875 ) — (875 )
Swiss Franc 5,006 (1,365 ) 3,641
Thai Baht — (224 ) (224 )
U.S. Dollar (12,982 ) (2,828 ) (15,810 )
Total $ 59 $ (3 ) $ 56
BASIC FINANCIAL STATEMENTS CONTINUED
Notes to Basic Financial Statements
67Financial 2021 Comprehensive Annual Financial Report
7. SECURITIES LENDING PROGRAM
Section 177 d of the RSSL authorizes the Fund to enter into security loan agreements with broker/dealers and state or national banks. The Fund has two providers to manage a securities lending program. These programs are subject to written contracts between the Fund and the Contractor who acts as securities lending agent for the Fund. The custodian is authorized to lend securities within the borrower limits and guidelines established by the Fund. Types of collateral received from borrowers for securities loaned are cash, government securities, and obligations of federal agencies. The securities lending providers are authorized to invest the cash collateral in short term investments that are legal for the Fund. These include domestic corporate and bank notes, U.S. Treasury obligations, obligations of federal agencies, repurchase agreements, and specific asset backed securities. All rights of ownership to securities pledged as collateral remain with the borrower except in the event of default. As of March 31, 2021, there were no violations of legal or contractual provisions. The Fund has not experienced any losses resulting from the default of a borrower or lending agent during the year ended March 31, 2021.
The Fund lends fixed income, domestic equity, and international equity securities to approved brokers/dealers. Collateral for securities loaned equals 102 percent of fair market value for domestic securities and 105 percent for international securities. Credit risk associated with the investment of cash collateral pledged by borrowers is mitigated by the maturity restrictions, percentage limitations, and rating requirements for individual asset classes included in the Fund’s reinvestment guidelines. Each Contractor acknowledges responsibility to reimburse the Fund for losses that might arise from managing the program in a manner inconsistent with the contract. The Fund manages its market risk by recording investments at market value daily and maintaining the value of the collateral held by the Fund in excess of the value of the securities loaned. As of March 31, 2021, the fair value of securities on loan was $19.55 billion. The associated collateral was $19.96 billion, of which $17.34 billion was cash collateral and $2.62 billion was securities. The cash collateral has been reinvested in other instruments, which had a fair value of $16.92 billion as of March 31, 2021. The securities lending obligations were $16.93 billion. The unrealized loss in invested cash collateral on March 31, 2021 was $7.71 million, which is reported in the combining basic statement of changes in fiduciary net position as part of “Net appreciation in fair value of investments.”
All open security loans can be terminated on demand by either the Fund or the borrower. To provide sufficient liquidity, the policy of the Fund is to maintain a minimum of 10 percent collateral in overnight investments. While the Fund’s Securities Lending Investment Guidelines allow investments up to a maximum of three years for U.S. Treasury and federal agency obligations and one year for all other investments, the average term of open security loans at March 31, 2021 was 39 days. All loans were open loans. There were no direct matching loans.
The collateral pool is valued at fair value obtained from independent pricing services.
BASIC FINANCIAL STATEMENTS CONTINUED
Notes to Basic Financial Statements

68 Financial 2021 Comprehensive Annual Financial Report
8. FAIR VALUE MEASUREMENT
The System’s investments, measured and reported at fair value, including securities lending collateral and obligations and forward foreign exchange contracts, are classified according to the following hierarchy in which the levels are based on the nature of inputs used to measure the fair value of the investment:
Level 1 – Investment fair values based on prices quoted or published in active markets for identical assets.
Level 2 – Investment fair values based on observable inputs for the assets either directly or indirectly, other than those considered Level 1 inputs, which may include quoted or published prices for identical assets in markets that are not considered to be active, and quoted or published prices of similar assets in active or inactive markets.
Level 3 – Investment fair values based on unobservable inputs.
The categorization of investments within the hierarchy above is based solely upon the objectivity of the inputs used in the measurement of the fair value of the investments and does not reflect the level of risk associated with the investments.
Investments classified in Level 1 of the fair value hierarchy are valued from predetermined external pricing vendors or primary dealers who source quoted or published prices in active markets which are readily attainable exit values of these securities. Investments classified in Level 2 are subject to alternative pricing sources, including a combination of price sources, descriptive data and pricing models based on attributes such as spread data, sector, quality, duration, and prepayment characteristics. Investments classified as Level 3 are valued using best available sources such as property appraisals, discounted cash flow models and public market comparables of similar assets where applicable. The values are supplied by advisors or general partners who hold those or similar assets in investment vehicles they oversee. These pricing sources may or may not be indicative of realizable exit values attainable for the assets.
BASIC FINANCIAL STATEMENTS CONTINUED
Notes to Basic Financial Statements

69Financial 2021 Comprehensive Annual Financial Report
The table below summarizes assets and liabilities carried at fair value based on levels from the fair value hierarchy as of March 31, 2021, with certain assets carried at net asset value (NAV) and cost also included to allow reconciliation to the statement of fiduciary net position (dollars in thousands):
Total Level 1 Level 2 Level 3
Assets:
Investments by fair value level:
Fixed income securities:
Short-term instruments $ 10,475,420 $ — $ 10,475,420 $ — Global fixed income securities 47,407,021 588,256 46,818,765 —
Total fixed income securities 57,882,441 588,256 57,294,185 —Equity securities:
Domestic equities 84,941,220 84,941,032 — 188
International equities 40,356,404 40,355,685 460 259
Total equity securities 125,297,624 125,296,717 460 447
Mortgages 1,043,621 — — 1,043,621
Private equity 364,292 — — 364,292
Credit 12,601 — — 12,601
Real estate 1,116,584 — — 1,116,584
Securities lending collateral 13,799,671 — 13,799,671 —
Forward foreign exchange contracts 68,841 — 68,841 —
Total investment assets by fair value level $ 199,585,675 $ 125,884,973 $ 71,163,157 $ 2,537,545
Investments measured at cost:
Securities lending collateral $ 3,123,477
Total investments measured at cost $ 3,123,477
Investments measured at Net Asset Value (NAV):
Global fixed income securities1 $ 315,934
Domestic equities2 5,322,608
International equities3 3,123,996
Alternative investments:4
Private equity 29,105,873
Opportunistic/ARS 5,016,078
Real assets 3,929,594
Credit 8,465,915
Real estate 16,531,409
Total alternative investments 63,048,869
Total investments measured at NAV $ 71,811,407
Investment related cash and cash equivalents not included in above 607,231
Total investment assets $ 275,127,790
Liabilities:
Investments by fair value level:
Forward foreign exchange contracts (68,782) — (68,782) —
Total investment liabilities by fair value level $ (68,782) $ — $ (68,782) $ —
BASIC FINANCIAL STATEMENTS CONTINUED
Notes to Basic Financial Statements

70 Financial 2021 Comprehensive Annual Financial Report
The table below summarizes liquidity information for investments valued at NAV (dollars in thousands):
Investments measured at NAV AmountUnfunded
CommitmentsRedemption Frequency Notice Period
Global fixed income funds1 $ 315,934 $ N/A Daily N/A
Domestic equities2 5,322,608 N/A N/A, Weekly, Monthly, Annually N/A, 2-90 days
International equities3 3,123,996 N/A Daily, Monthly, Quarterly, 15-120 days
Alternative investments4
Private equity 29,105,873 15,270,166 N/A N/A
Opportunistic/ARS 5,016,078 1,030,820 N/A, Monthly, Quarterly, Annually, Semi-annually
NA, 5-120 days
Real assets 3,929,594 4,606,983 N/A N/A
Credit 8,465,915 2,931,703 N/A N/A
Real estate 16,531,409 5,765,474 N/A N/A
Total investments measured at NAV $ 71,811,407 $ 29,605,146
1 Global fixed income consists of one fund for which the System is the only investor. This fund invests primarily in both privately and publicly issued global fixed income securities. The investments are valued at the net asset value of units held at the end of the period based upon the fair value of the underlying investments.
2 Domestic equities consist of two commingled investment vehicles and one fund for which the System is the only investor. The funds invest primarily in publicly traded domestic equity securities. The investments are valued at the net asset value of units held at the end of the period based upon the fair value of the underlying investments.
3 International equities consist of six commingled investment vehicles and one fund for which the System is the only investor. The funds invest primarily in publicly traded international equity securities. The investments are valued at the net asset value of units held at the end of the period based upon the fair value of the underlying investments.
4 Alternative investments include private equity, opportunistic/ARS funds, real assets, credit and real estate through various fund structures. Private equity (10.7 percent* at March 31, 2021) consists of buyout, co-investments, distressed debt and turnaround funds, fund of funds, growth equity, special situations, and venture capital. Opportunistic/ARS (1.8 percent* at March 31, 2021) consists of investments in strategies including hedged equity, credit, global macro, closed-end funds, and investments that don’t fit the mandates of the other asset classes. Real assets (1.4 percent* at March 31, 2021) consist of commodities, farmland, inflation-linked bonds, infrastructure, and renewables. Credit (3.1 percent* at March 31, 2021) consists of non-investment grade public and private credit strategies in direct lending, distressed and special situations, specialty finance, structured credit and real assets credit through closed-end and open-end funds, co-investments, separately managed accounts and fund-of-funds. Real estate (6.4 percent* at March 31, 2021) consists of investments in closed-end, open-end, and fund of funds. The fair values of the alternative investments have been determined using the NAV per share (or its equivalent) of the System’s ownership interest in partner’s capital. NAV is used as a practical expedient to estimate fair value. Private equity, opportunistic, real assets, and real estate are not eligible for redemption. Distributions are received as underlying investments within the funds are liquidated, which on average can occur over a span of 5-10 years.
See note 7 for detailed securities lending information and note 6 for detail forward foreign currency information.
* Percentages are stated relative to total investments and securities lending collateral invested.
BASIC FINANCIAL STATEMENTS CONTINUED
Notes to Basic Financial Statements
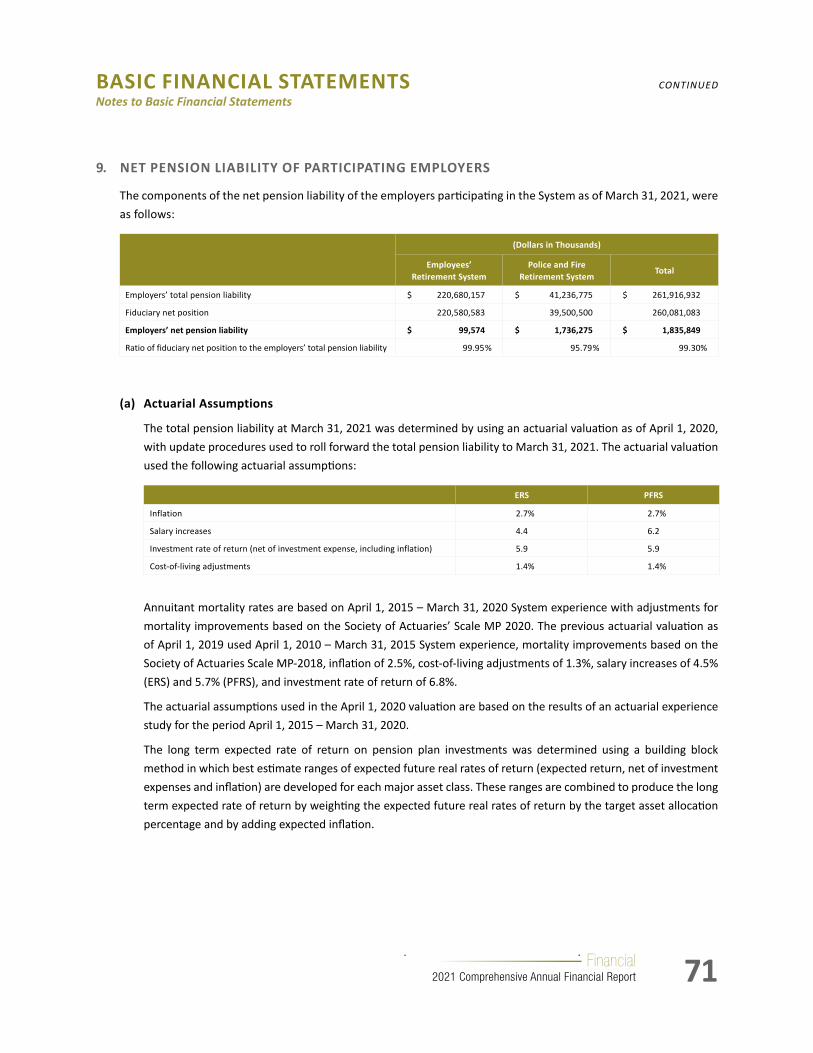
71Financial 2021 Comprehensive Annual Financial Report
9. NET PENSION LIABILITY OF PARTICIPATING EMPLOYERS
The components of the net pension liability of the employers participating in the System as of March 31, 2021, were as follows:
(Dollars in Thousands)
Employees’ Retirement System
Police and Fire Retirement System
Total
Employers’ total pension liability $ 220,680,157 $ 41,236,775 $ 261,916,932
Fiduciary net position 220,580,583 39,500,500 260,081,083
Employers’ net pension liability $ 99,574 $ 1,736,275 $ 1,835,849
Ratio of fiduciary net position to the employers’ total pension liability 99.95% 95.79% 99.30%
(a) Actuarial Assumptions
The total pension liability at March 31, 2021 was determined by using an actuarial valuation as of April 1, 2020, with update procedures used to roll forward the total pension liability to March 31, 2021. The actuarial valuation used the following actuarial assumptions:
ERS PFRS
Inflation 2.7 % 2.7 %
Salary increases 4.4 6.2
Investment rate of return (net of investment expense, including inflation) 5.9 5.9
Cost-of-living adjustments 1.4 % 1.4 %
Annuitant mortality rates are based on April 1, 2015 – March 31, 2020 System experience with adjustments for mortality improvements based on the Society of Actuaries’ Scale MP 2020. The previous actuarial valuation as of April 1, 2019 used April 1, 2010 – March 31, 2015 System experience, mortality improvements based on the Society of Actuaries Scale MP-2018, inflation of 2.5%, cost-of-living adjustments of 1.3%, salary increases of 4.5% (ERS) and 5.7% (PFRS), and investment rate of return of 6.8%.
The actuarial assumptions used in the April 1, 2020 valuation are based on the results of an actuarial experience study for the period April 1, 2015 – March 31, 2020.
The long term expected rate of return on pension plan investments was determined using a building block method in which best estimate ranges of expected future real rates of return (expected return, net of investment expenses and inflation) are developed for each major asset class. These ranges are combined to produce the long term expected rate of return by weighting the expected future real rates of return by the target asset allocation percentage and by adding expected inflation.
BASIC FINANCIAL STATEMENTS CONTINUED
Notes to Basic Financial Statements

72 Financial 2021 Comprehensive Annual Financial Report
BASIC FINANCIAL STATEMENTS CONTINUED
Notes to Basic Financial Statements
Best estimates of arithmetic real rates of return for each major asset class included in the target asset allocation as of March 31, 2021 (see Investment policy – note 4(a)) are summarized below:
Asset ClassLong-Term Expected Real Rate of Return
Domestic equity 4.05 %
International equity 6.30
Private equity 6.75
Real estate 4.95
Opportunistic/ARS portfolio 4.50
Credit 3.63
Real assets 5.95
Fixed income 0.00
Cash 0.50
The real rate of return is net of the long-term inflation assumption of 2.00 percent.
(b) Discount Rate
The discount rate used to calculate the total pension liability was 5.9 percent. The projection of cash flows used to determine the discount rate assumes that contributions from plan members will be made at the current contribution rates and that contributions from employers will be made at statutorily required rates, actuarially. Based upon the assumptions, the System’s fiduciary net position was projected to be available to make all projected future benefit payments of current plan members. Therefore, the long term expected rate of return on pension plan investments was applied to all periods of projected benefit payments to determine the total pension liability.
(c) Sensitivity of the Net Pension Liability to the Discount Rate Assumption
The following presents the current period net pension liability of the employers calculated using the current period discount rate assumption of 5.9 percent, as well as what the net pension liability would be if it were calculated using a discount rate that is one percentage point lower (4.9 percent) or one percentage point higher (6.9 percent) than the current assumption (dollars in thousands):
One Percent Decrease (4.9%) Current Assumption (5.9%) One Percent Increase (6.9%)
ERS net pension liability (asset) $ 27,637,884 $ 99,574 $ (25,297,194)
PFRS net pension liability (asset) $ 7,383,622 $ 1,736,275 $ (2,938,270)

73Financial 2021 Comprehensive Annual Financial Report
BASIC FINANCIAL STATEMENTS CONTINUED
Notes to Basic Financial Statements
10. FEDERAL INCOME TAX STATUS
ERS and PFRS are qualified defined benefit retirement plans under section 401(a) of the Internal Revenue Code (IRC) and are exempt from federal income taxes under section 501(a) of the IRC. ERS and PFRS last received favorable determination letters from the Internal Revenue Service dated August 28, 2014 stating that ERS and PFRS are in compliance with the applicable requirements of the Internal Revenue Code. Therefore, no provision for income taxes has been included in the System’s financial statements.
11. COMMITMENTS
As of March 31, 2021, the System had contractual commitments totaling $17.41 billion to fund future private equity investments, $6.65 billion to fund future real estate investments, $1.43 billion to fund future investments in opportunistic/ARS funds, $5.75 billion to fund future real asset investments and $3.27 million to fund future credit investments. When compared to note 8 the variances that exist are due to the above representing total commitments of the investment type inclusive of investments measured at fair value and net asset value. Future commitments will be funded over the commitment period through transaction income including distributions, redemptions, and maturities.
12. CONTINGENCIES
The System is a defendant in litigation proceedings involving individual benefit payments, participant eligibility, and other issues arising from its normal activities. Management of the System believes there will be no material adverse effect on the basic financial statements as a result of the outcome of these matters.
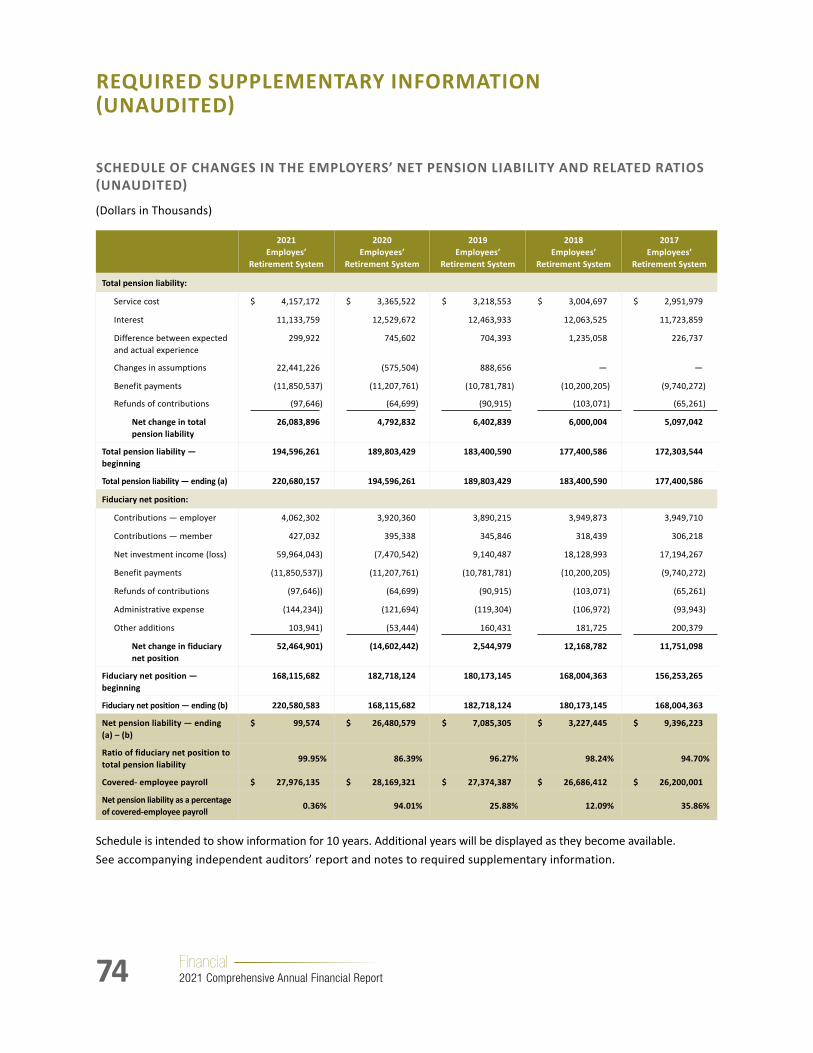
74 Financial 2021 Comprehensive Annual Financial Report
SCHEDULE OF CHANGES IN THE EMPLOYERS’ NET PENSION LIABILITY AND RELATED RATIOS (UNAUDITED)
(Dollars in Thousands)
2021Employes’
Retirement System
2020Employees’
Retirement System
2019Employees’
Retirement System
2018Employees’
Retirement System
2017Employees’
Retirement System
Total pension liability:
Service cost $ 4,157,172 $ 3,365,522 $ 3,218,553 $ 3,004,697 $ 2,951,979
Interest 11,133,759 12,529,672 12,463,933 12,063,525 11,723,859
Difference between expected and actual experience
299,922 745,602 704,393 1,235,058 226,737
Changes in assumptions 22,441,226 (575,504 ) 888,656 — —
Benefit payments (11,850,537 ) (11,207,761 ) (10,781,781 ) (10,200,205 ) (9,740,272 )
Refunds of contributions (97,646 ) (64,699 ) (90,915) (103,071 ) (65,261 )
Net change in total pension liability
26,083,896 4,792,832 6,402,839 6,000,004 5,097,042
Total pension liability — beginning
194,596,261 189,803,429 183,400,590 177,400,586 172,303,544
Total pension liability — ending (a) 220,680,157 194,596,261 189,803,429 183,400,590 177,400,586
Fiduciary net position:
Contributions — employer 4,062,302 3,920,360 3,890,215 3,949,873 3,949,710
Contributions — member 427,032 395,338 345,846 318,439 306,218
Net investment income (loss) 59,964,043 ) (7,470,542 ) 9,140,487 18,128,993 17,194,267
Benefit payments (11,850,537) ) (11,207,761 ) (10,781,781) (10,200,205 ) (9,740,272 )
Refunds of contributions (97,646) ) (64,699 ) (90,915) (103,071 ) (65,261 )
Administrative expense (144,234) ) (121,694 ) (119,304) (106,972 ) (93,943 )
Other additions 103,941 ) (53,444 ) 160,431 181,725 200,379
Net change in fiduciary net position
52,464,901 ) (14,602,442 ) 2,544,979 12,168,782 11,751,098
Fiduciary net position — beginning
168,115,682 182,718,124 180,173,145 168,004,363 156,253,265
Fiduciary net position — ending (b) 220,580,583 168,115,682 182,718,124 180,173,145 168,004,363
Net pension liability — ending (a) – (b)
$ 99,574 $ 26,480,579 $ 7,085,305 $ 3,227,445 $ 9,396,223
Ratio of fiduciary net position to total pension liability
99.95% 86.39% 96.27% 98.24% 94.70%
Covered- employee payroll $ 27,976,135 $ 28,169,321 $ 27,374,387 $ 26,686,412 $ 26,200,001
Net pension liability as a percentage of covered-employee payroll
0.36% 94.01% 25.88% 12.09% 35.86%
Schedule is intended to show information for 10 years. Additional years will be displayed as they become available.See accompanying independent auditors’ report and notes to required supplementary information.
REQUIRED SUPPLEMENTARY INFORMATION (UNAUDITED)

75Financial 2021 Comprehensive Annual Financial Report
SCHEDULE OF CHANGES IN THE EMPLOYERS’ NET PENSION LIABILITY AND RELATED RATIOS (UNAUDITED)
(Dollars in Thousands)
2016Employees’
Retirement System
2015Employees’
Retirement System
Total pension liability:
Service cost $ 2,916,374 $ 2,989,807
Interest 11,198,823 11,581,437
Difference between expected and actual experience
(2,378,116 ) 135,177
Changes in assumptions 5,350,157 —
Benefit payments (9,224,904 ) (8,829,751 )
Refunds of contributions (150,294 ) (77,388 )
Net change in total pension liability
7,712,040 5,799,282
Total pension liability — beginning
164,591,504 158,792,222
Total pension liability — ending (a) 172,303,544 164,591,504
Fiduciary net position:
Contributions — employer 4,347,619 4,893,110
Contributions — member 289,332 272,004
Net investment income (loss) (327,068 ) 10,582,102 )
Benefit payments (9,224,904 ) (8,829,751 )
Refunds of contributions (150,294 ) (77,388 )
Administrative expense (93,012 ) (93,357 )
Other additions 198,333 ) 193,176
Net change in fiduciary net position
(4,959,994 ) 6,939,896
Fiduciary net position — beginning
161,213,259 154,273,363
Fiduciary net position — ending (b) 156,253,265 161,213,259
Net pension liability — ending (a) – (b)
$ 16,050,279 $ 3,378,245
Ratio of fiduciary net position to total pension liability
90.68% 97.95%
Covered- employee payroll $ 25,644,078 $ 24,480,045
Net pension liability as a percentage of covered-employee payroll
62.59% 13.80%
Schedule is intended to show information for 10 years. Additional years will be displayed as they become available.See accompanying independent auditors’ report and notes to required supplementary information.
REQUIRED SUPPLEMENTARY INFORMATION (UNAUDITED) CONTINUED

76 Financial 2021 Comprehensive Annual Financial Report
REQUIRED SUPPLEMENTARY INFORMATION (UNAUDITED) CONTINUED
SCHEDULE OF CHANGES IN THE EMPLOYERS’ NET PENSION LIABILITY AND RELATED RATIOS (UNAUDITED)
(Dollars in Thousands)
2021Police and Fire
Retirement System
2020Police and Fire
Retirement System
2019Police and Fire
Retirement System
2018Police and Fire
Retirement System
2017Police and Fire
Retirement System
Total pension liability:
Service cost $ 970,797 $ 743,762 $ 713,480 $ 674,079 657,407
Interest 2,020,024 2,252,536 2,236,527 2,154,117 2,065,752
Difference between expected and actual experience
180,496 76,209 106,384 241,387 302,375
Changes in assumptions 4,930,229 147,086 ) 118,521 — —
Benefit payments (2,172,230 ) (2,038,392 ) (1,959,831 ) (1,827,136 ) (1,708,410 )
Refunds of contributions (1,558 ) (284 ) (1,404 ) 1,493 5,632 )
Net change in total pension liability
5,927,758 1,180,917 1,213,677 1,243,940 1,322,756
Total pension liability — beginning
35,309,017 34,128,100 32,914,423 31,670,483 30,347,727
Total pension liability — ending (a) 41,236,775 35,309,017 34,128,100 32,914,423 31,670,483
Fiduciary net position:
Contributions — employer 967,488 862,346 854,094 873,434 837,253
Contributions — member 65,309 58,360 40,673 30,950 22,609
Net investment income (loss) 10,685,563 ) (1,328,229 ) 1,621,289 3,209,040 3,030,977
Benefit payments (2,172,230 ) (2,038,392 ) (1,959,831 ) (1,827,136 ) (1,708,410 )
Refunds of contributions (1,558) (284 ) (1,404 ) 1,493 5,631 )
Administrative expense (20,863 ) (17,356 ) (17,173 ) (15,834 ) (13,191 )
Other additions/deductions 12,711 ) (23,402 ) 9,723 33,889 36,021
Net change in fiduciary net position
9,536,420 ) (2,486,957 ) 547,371 2,305,836 2,210,890
Fiduciary net position — beginning
29,964,080 32,451,037 31,903,666 29,597,830 27,386,940
Fiduciary net position — ending (b) 39,500,500 29,964,080 32,451,037 31,903,666 29,597,830
Net pension liability — ending (a) – (b)
$ 1,736,275 $ 5,344,937 $ 1,677,063 $ 1,010,757 $ 2,072,653
Ratio of fiduciary net position to total pension liability
95.79% 84.86% 95.09% 96.93% 93.46%
Covered- employee payroll $ 3,862,735 $ 4,024,660 $ 3,730,337 $ 3,683,960 $ 3,633,237
Net pension liability as a percentage of covered-employee payroll
44.95% 132.80% 44.96% 27.44% 57.05%
Schedule is intended to show information for 10 years. Additional years will be displayed as they become available.See accompanying independent auditors’ report and notes to required supplementary information.
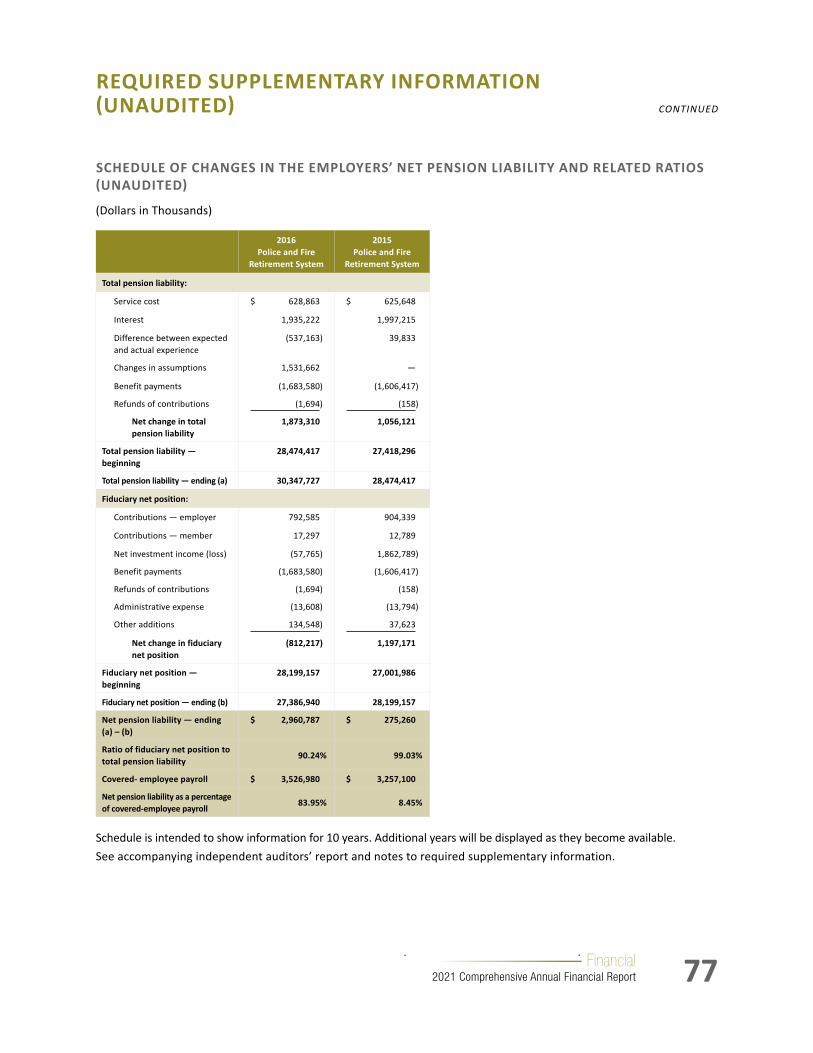
77Financial 2021 Comprehensive Annual Financial Report
SCHEDULE OF CHANGES IN THE EMPLOYERS’ NET PENSION LIABILITY AND RELATED RATIOS (UNAUDITED)
(Dollars in Thousands)
2016Police and Fire
Retirement System
2015Police and Fire
Retirement System
Total pension liability:
Service cost $ 628,863 $ 625,648
Interest 1,935,222 1,997,215
Difference between expected and actual experience
(537,163 ) 39,833
Changes in assumptions 1,531,662 —
Benefit payments (1,683,580 ) (1,606,417 )
Refunds of contributions (1,694 ) (158 )
Net change in total pension liability
1,873,310 1,056,121
Total pension liability — beginning
28,474,417 27,418,296
Total pension liability — ending (a) 30,347,727 28,474,417
Fiduciary net position:
Contributions — employer 792,585 904,339
Contributions — member 17,297 12,789
Net investment income (loss) (57,765 ) 1,862,789 )
Benefit payments (1,683,580 ) (1,606,417 )
Refunds of contributions (1,694 ) (158 )
Administrative expense (13,608 ) (13,794 )
Other additions 134,548 ) 37,623
Net change in fiduciary net position
(812,217 ) 1,197,171
Fiduciary net position — beginning
28,199,157 27,001,986
Fiduciary net position — ending (b) 27,386,940 28,199,157
Net pension liability — ending (a) – (b)
$ 2,960,787 $ 275,260
Ratio of fiduciary net position to total pension liability
90.24% 99.03%
Covered- employee payroll $ 3,526,980 $ 3,257,100
Net pension liability as a percentage of covered-employee payroll
83.95% 8.45%
Schedule is intended to show information for 10 years. Additional years will be displayed as they become available.See accompanying independent auditors’ report and notes to required supplementary information.
REQUIRED SUPPLEMENTARY INFORMATION (UNAUDITED) CONTINUED
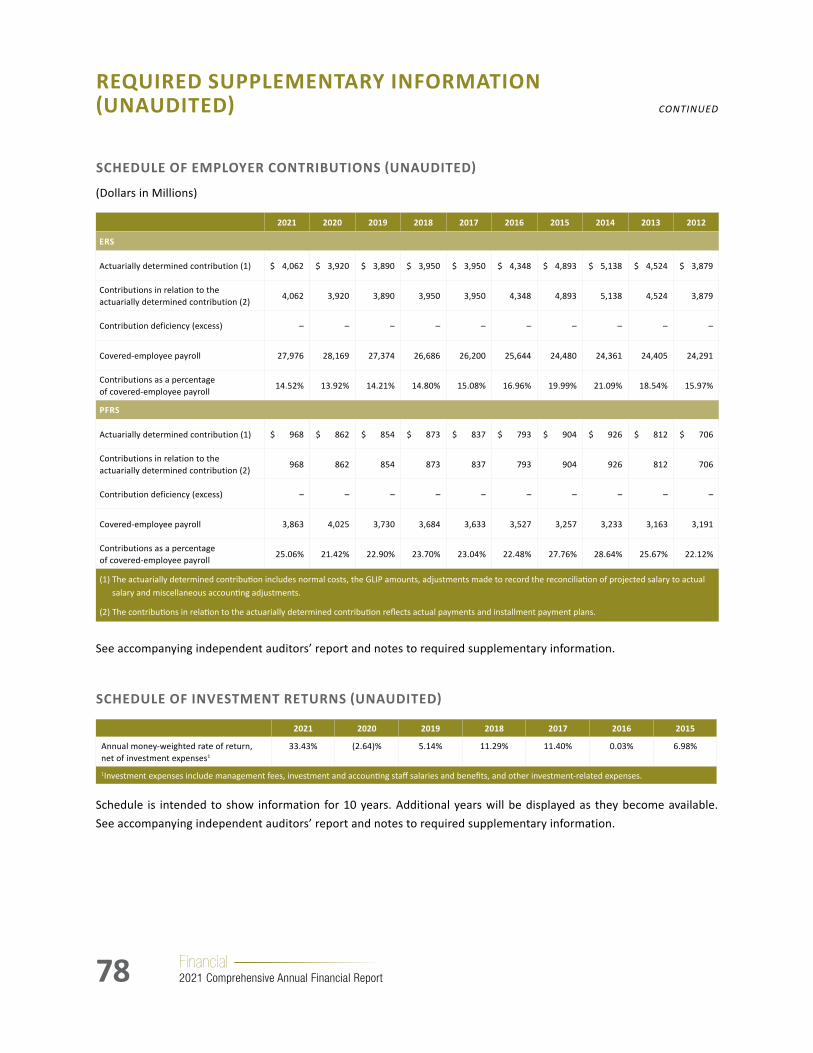
78 Financial 2021 Comprehensive Annual Financial Report
REQUIRED SUPPLEMENTARY INFORMATION (UNAUDITED) CONTINUED
SCHEDULEOFEMPLOYERCONTRIBUTIONS(UNAUDITED)
(Dollars in Millions)
2021 2020 2019 2018 2017 2016 2015 2014 2013 2012
ERS
Actuarially determined contribution (1) $ 4,062 $ 3,920 $ 3,890 $ 3,950 $ 3,950 $ 4,348 $ 4,893 $ 5,138 $ 4,524 $ 3,879
Contributions in relation to the actuarially determined contribution (2)
4,062 3,920 3,890 3,950 3,950 4,348 4,893 5,138 4,524 3,879
Contribution deficiency (excess) – – – – – – – – – –
Covered-employee payroll 27,976 28,169 27,374 26,686 26,200 25,644 24,480 24,361 24,405 24,291
Contributions as a percentage of covered-employee payroll
14.52% 13.92% 14.21% 14.80% 15.08% 16.96% 19.99% 21.09% 18.54% 15.97%
PFRS
Actuarially determined contribution (1) $ 968 $ 862 $ 854 $ 873 $ 837 $ 793 $ 904 $ 926 $ 812 $ 706
Contributions in relation to the actuarially determined contribution (2)
968 862 854 873 837 793 904 926 812 706
Contribution deficiency (excess) – – – – – – – – – –
Covered-employee payroll 3,863 4,025 3,730 3,684 3,633 3,527 3,257 3,233 3,163 3,191
Contributions as a percentage of covered-employee payroll
25.06% 21.42% 22.90% 23.70% 23.04% 22.48% 27.76% 28.64% 25.67% 22.12%
(1) The actuarially determined contribution includes normal costs, the GLIP amounts, adjustments made to record the reconciliation of projected salary to actual salary and miscellaneous accounting adjustments.
(2) The contributions in relation to the actuarially determined contribution reflects actual payments and installment payment plans.
See accompanying independent auditors’ report and notes to required supplementary information.
SCHEDULEOFINVESTMENTRETURNS(UNAUDITED)
2021 2020 2019 2018 2017 2016 2015
Annual money-weighted rate of return, net of investment expenses1
33.43% (2.64)% 5.14% 11.29% 11.40% 0.03% 6.98%
1Investment expenses include management fees, investment and accounting staff salaries and benefits, and other investment-related expenses.
Schedule is intended to show information for 10 years. Additional years will be displayed as they become available. See accompanying independent auditors’ report and notes to required supplementary information.
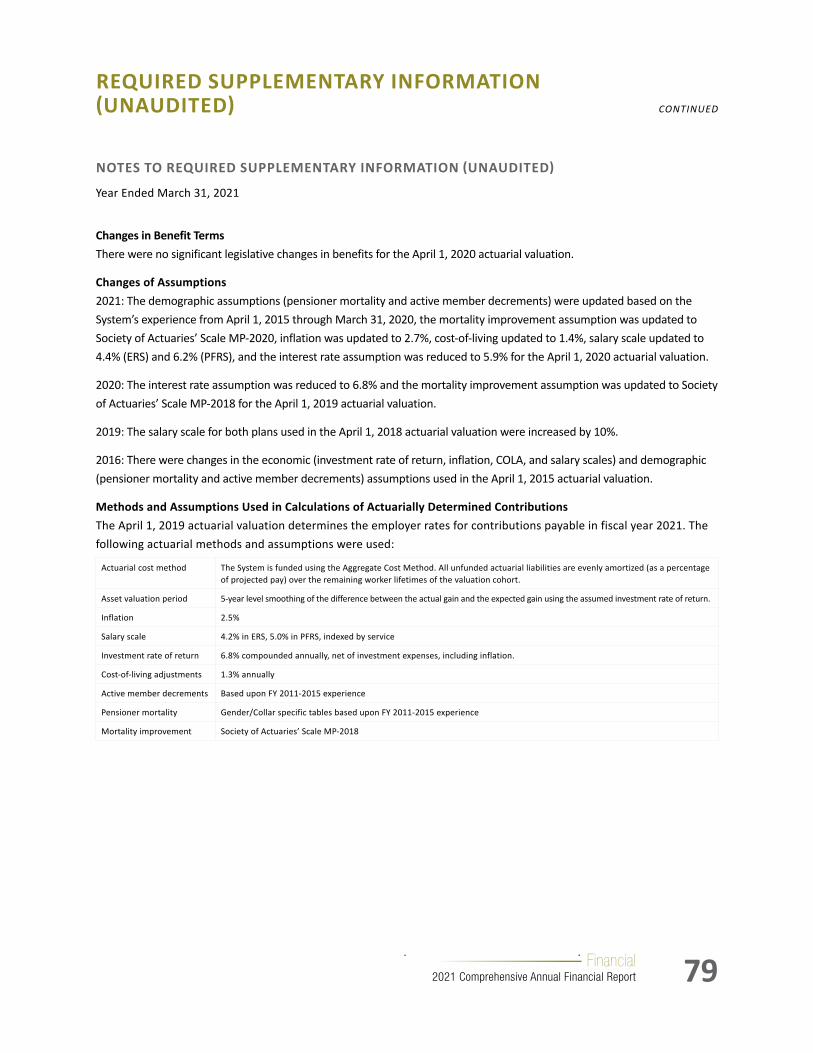
79Financial 2021 Comprehensive Annual Financial Report
NOTESTOREQUIREDSUPPLEMENTARYINFORMATION(UNAUDITED)
Year Ended March 31, 2021
Changes in Benefit Terms There were no significant legislative changes in benefits for the April 1, 2020 actuarial valuation.
Changes of Assumptions 2021: The demographic assumptions (pensioner mortality and active member decrements) were updated based on the System’s experience from April 1, 2015 through March 31, 2020, the mortality improvement assumption was updated to Society of Actuaries’ Scale MP-2020, inflation was updated to 2.7%, cost-of-living updated to 1.4%, salary scale updated to 4.4% (ERS) and 6.2% (PFRS), and the interest rate assumption was reduced to 5.9% for the April 1, 2020 actuarial valuation.
2020: The interest rate assumption was reduced to 6.8% and the mortality improvement assumption was updated to Society of Actuaries’ Scale MP-2018 for the April 1, 2019 actuarial valuation.
2019: The salary scale for both plans used in the April 1, 2018 actuarial valuation were increased by 10%.
2016: There were changes in the economic (investment rate of return, inflation, COLA, and salary scales) and demographic (pensioner mortality and active member decrements) assumptions used in the April 1, 2015 actuarial valuation.
Methods and Assumptions Used in Calculations of Actuarially Determined Contributions The April 1, 2019 actuarial valuation determines the employer rates for contributions payable in fiscal year 2021. The following actuarial methods and assumptions were used:
Actuarial cost method The System is funded using the Aggregate Cost Method. All unfunded actuarial liabilities are evenly amortized (as a percentage of projected pay) over the remaining worker lifetimes of the valuation cohort.
Asset valuation period 5-year level smoothing of the difference between the actual gain and the expected gain using the assumed investment rate of return.
Inflation 2.5%
Salary scale 4.2% in ERS, 5.0% in PFRS, indexed by service
Investment rate of return 6.8% compounded annually, net of investment expenses, including inflation.
Cost-of-living adjustments 1.3% annually
Active member decrements Based upon FY 2011-2015 experience
Pensioner mortality Gender/Collar specific tables based upon FY 2011-2015 experience
Mortality improvement Society of Actuaries’ Scale MP-2018
REQUIRED SUPPLEMENTARY INFORMATION (UNAUDITED) CONTINUED
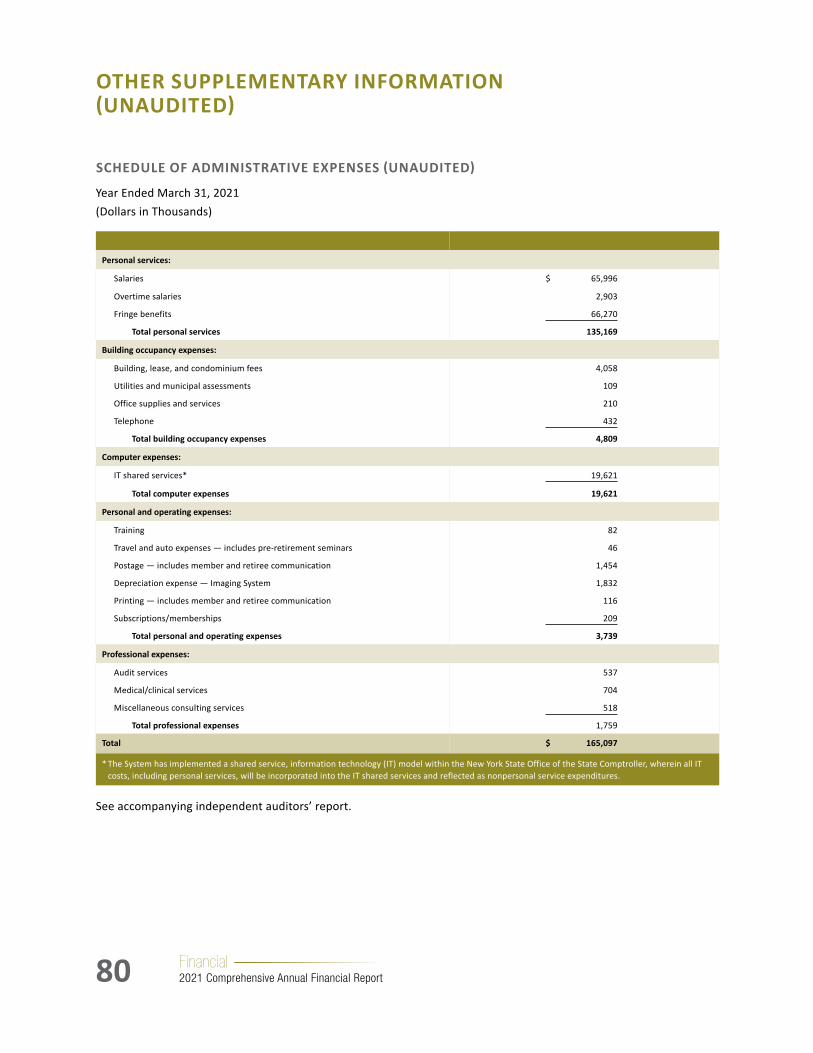
80 Financial 2021 Comprehensive Annual Financial Report
OTHER SUPPLEMENTARY INFORMATION (UNAUDITED)
SCHEDULEOFADMINISTRATIVEEXPENSES(UNAUDITED)
Year Ended March 31, 2021(Dollars in Thousands)
Personal services:
Salaries $ 65,996
Overtime salaries 2,903
Fringe benefits 66,270
Total personal services 135,169
Building occupancy expenses:
Building, lease, and condominium fees 4,058
Utilities and municipal assessments 109
Office supplies and services 210
Telephone 432
Total building occupancy expenses 4,809
Computer expenses:
IT shared services* 19,621
Total computer expenses 19,621
Personal and operating expenses:
Training 82
Travel and auto expenses — includes pre-retirement seminars 46
Postage — includes member and retiree communication 1,454
Depreciation expense — Imaging System 1,832
Printing — includes member and retiree communication 116
Subscriptions/memberships 209
Total personal and operating expenses 3,739
Professional expenses:
Audit services 537
Medical/clinical services 704
Miscellaneous consulting services 518
Total professional expenses 1,759
Total $ 165,097
* The System has implemented a shared service, information technology (IT) model within the New York State Office of the State Comptroller, wherein all IT costs, including personal services, will be incorporated into the IT shared services and reflected as nonpersonal service expenditures.
See accompanying independent auditors’ report.

81Financial 2021 Comprehensive Annual Financial Report
SCHEDULEOFINVESTMENTEXPENSES(UNAUDITED)
Year Ended March 31, 2021(Dollars in Thousands)
Investment expenses:
Investment management and incentive fees:
Private equity $ 256,901
International equity 177,121
Absolute return strategy funds (ARS) 137,558
Real estate 75,243
Credit assets 71,929
Opportunistic funds 20,390
Domestic equity 80,368
Real assets 43,189
Fixed income 5,223
Total investment management and incentive fees 867,922
Investment-related expenses:
Data processing expenses/licenses 7,108
Custodial fees 5,104
Mortgage loan servicing fees 3,406
Legal fees 4,469
Compliance/Risk monitoring 2,009
Private equity consulting and monitoring 2,125
General consulting 1,049
Opportunistic consulting and monitoring 600
Miscellaneous expenses 6,209
Administrative expenses 955
Research services 912
Real assets consulting and monitoring 440
Real estate consulting and monitoring 1,118
Global equity consulting 282
Fixed income consulting 263
Audit and audit-related fees 122
Emerging manager program consulting and monitoring 82
Domestic equity consulting and monitoring 79
Total investment-related expenses 36,332
Total investment expenses $ 904,254
See accompanying independent auditors’ report.
OTHER SUPPLEMENTARY INFORMATION(UNAUDITED) CONTINUED
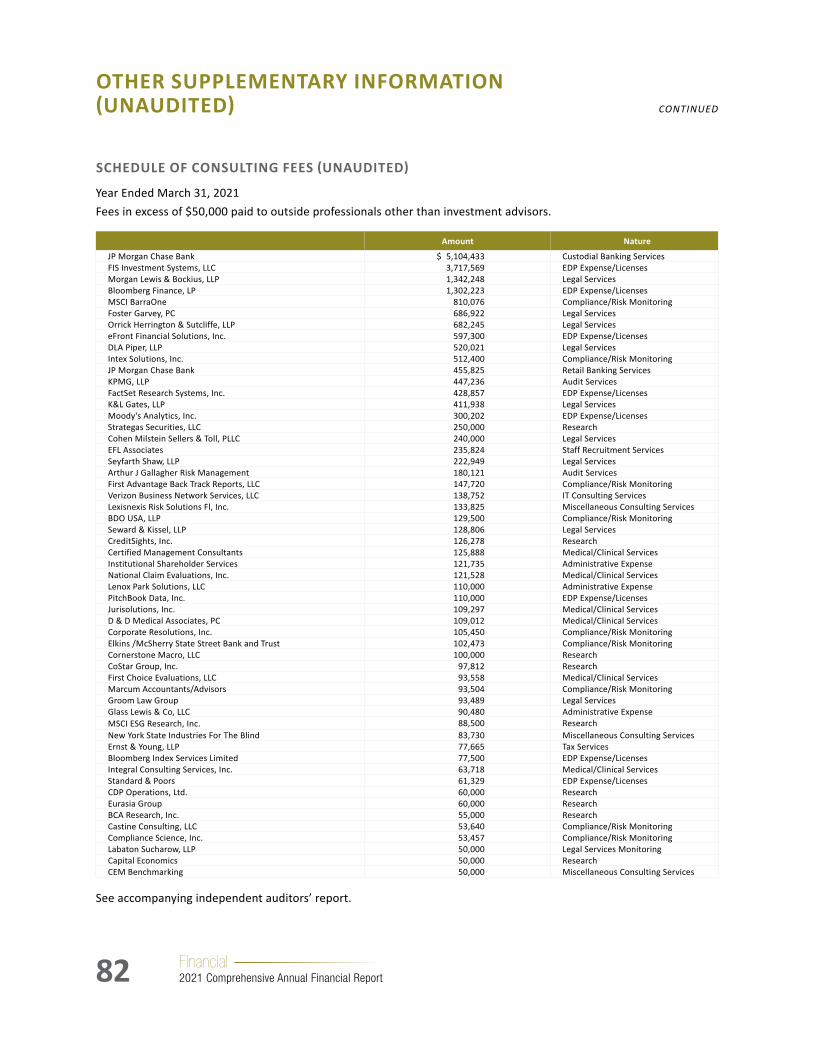
82 Financial 2021 Comprehensive Annual Financial Report
SCHEDULEOFCONSULTINGFEES(UNAUDITED)
Year Ended March 31, 2021Fees in excess of $50,000 paid to outside professionals other than investment advisors.
Amount Nature
JP Morgan Chase Bank $ 5,104,433 Custodial Banking ServicesFIS Investment Systems, LLC 3,717,569 EDP Expense/LicensesMorgan Lewis & Bockius, LLP 1,342,248 Legal ServicesBloomberg Finance, LP 1,302,223 EDP Expense/LicensesMSCI BarraOne 810,076 Compliance/Risk MonitoringFoster Garvey, PC 686,922 Legal ServicesOrrick Herrington & Sutcliffe, LLP 682,245 Legal ServiceseFront Financial Solutions, Inc. 597,300 EDP Expense/LicensesDLA Piper, LLP 520,021 Legal ServicesIntex Solutions, Inc. 512,400 Compliance/Risk MonitoringJP Morgan Chase Bank 455,825 Retail Banking ServicesKPMG, LLP 447,236 Audit ServicesFactSet Research Systems, Inc. 428,857 EDP Expense/LicensesK&L Gates, LLP 411,938 Legal ServicesMoody's Analytics, Inc. 300,202 EDP Expense/LicensesStrategas Securities, LLC 250,000 ResearchCohen Milstein Sellers & Toll, PLLC 240,000 Legal ServicesEFL Associates 235,824 Staff Recruitment ServicesSeyfarth Shaw, LLP 222,949 Legal ServicesArthur J Gallagher Risk Management 180,121 Audit ServicesFirst Advantage Back Track Reports, LLC 147,720 Compliance/Risk MonitoringVerizon Business Network Services, LLC 138,752 IT Consulting ServicesLexisnexis Risk Solutions Fl, Inc. 133,825 Miscellaneous Consulting ServicesBDO USA, LLP 129,500 Compliance/Risk MonitoringSeward & Kissel, LLP 128,806 Legal ServicesCreditSights, Inc. 126,278 ResearchCertified Management Consultants 125,888 Medical/Clinical ServicesInstitutional Shareholder Services 121,735 Administrative ExpenseNational Claim Evaluations, Inc. 121,528 Medical/Clinical ServicesLenox Park Solutions, LLC 110,000 Administrative ExpensePitchBook Data, Inc. 110,000 EDP Expense/LicensesJurisolutions, Inc. 109,297 Medical/Clinical ServicesD & D Medical Associates, PC 109,012 Medical/Clinical ServicesCorporate Resolutions, Inc. 105,450 Compliance/Risk MonitoringElkins /McSherry State Street Bank and Trust 102,473 Compliance/Risk MonitoringCornerstone Macro, LLC 100,000 ResearchCoStar Group, Inc. 97,812 ResearchFirst Choice Evaluations, LLC 93,558 Medical/Clinical ServicesMarcum Accountants/Advisors 93,504 Compliance/Risk MonitoringGroom Law Group 93,489 Legal ServicesGlass Lewis & Co, LLC 90,480 Administrative ExpenseMSCI ESG Research, Inc. 88,500 ResearchNew York State Industries For The Blind 83,730 Miscellaneous Consulting ServicesErnst & Young, LLP 77,665 Tax ServicesBloomberg Index Services Limited 77,500 EDP Expense/LicensesIntegral Consulting Services, Inc. 63,718 Medical/Clinical ServicesStandard & Poors 61,329 EDP Expense/LicensesCDP Operations, Ltd. 60,000 ResearchEurasia Group 60,000 ResearchBCA Research, Inc. 55,000 ResearchCastine Consulting, LLC 53,640 Compliance/Risk MonitoringCompliance Science, Inc. 53,457 Compliance/Risk MonitoringLabaton Sucharow, LLP 50,000 Legal Services MonitoringCapital Economics 50,000 ResearchCEM Benchmarking 50,000 Miscellaneous Consulting Services
See accompanying independent auditors’ report.
OTHER SUPPLEMENTARY INFORMATION (UNAUDITED) CONTINUED

83Financial 2021 Comprehensive Annual Financial Report
INDEPENDENT AUDITORS’ REPORT ON INTERNAL CONTROL
Independent Auditors’ Report on Internal Control Over Financial Reporting and on Compliance and Other Matters Based on an Audit of Financial Statements Performed in Accordance With Government
Auditing Standards
The Trustee New York State and Local Retirement System:
We have audited, in accordance with the auditing standards generally accepted in the United States of America and the standards applicable to financial audits contained in Government Auditing Standards, issued by the Comptroller General of the United States, the financial statements of the New York State and Local Retirement System (the System), which comprise the combining basic statement of fiduciary net position as of March 31, 2021, and the related combining basic statement of changes in fiduciary net position for the year then ended, and the related notes to the basic financial statements, and have issued our report thereon dated July 28, 2021, except as to note 2(h), which is as of August 13, 2021.
Internal Control Over Financial Reporting In planning and performing our audit of the (consolidated) financial statements, we considered the System’s internal control over financial reporting (internal control) as a basis for designing audit procedures that are appropriate in the circumstances for the purpose of expressing our opinion on the basic financial statements, but not for the purpose of expressing an opinion on the effectiveness of the System’s internal control. Accordingly, we do not express an opinion on the effectiveness of the System’s internal control.
A deficiency in internal control exists when the design or operation of a control does not allow management or employees, in the normal course of performing their assigned functions, to prevent, or detect and correct, misstatements on a timely basis. A material weakness is a deficiency, or a combination of deficiencies, in internal control such that there is a reasonable possibility that a material misstatement of the entity’s financial statements will not be prevented, or detected and corrected, on a timely basis. A significant deficiency is a deficiency, or a combination of deficiencies, in internal control that is less severe than a material weakness, yet important enough to merit attention by those charged with governance.
Our consideration of internal control was for the limited purpose described in the first paragraph of this section and was not designed to identify all deficiencies in internal control that might be material weaknesses or significant deficiencies and therefore, material weaknesses or significant deficiencies may exist that have not been identified. Given these limitations, during our audit we did not identify any deficiencies in internal control that we consider to be material weaknesses. We did identify a deficiency in internal control described below that we consider to be a significant deficiency.
Internal Controls over Year-end Reserve Fund Transfers
After the release of the March 31, 2021 audited financial statements, the System discovered an immaterial error in amounts reported on the statement of changes in fiduciary net position for member contributions and other deductions. The immaterial error was due to a deficiency in internal controls over financial reporting relating to inadequate oversight of annual internal transfers between System reserve funds. The System corrected the immaterial error and re-issued the March 31, 2021 audited financial statements. We recommend management strengthen internal controls to ensure annual internal transfers to System reserve funds are accurate.
KPMG LLP515 BroadwayAlbany, NY 12207-2974
KPMG LLP, a Delaware limited liability partnership and a member firm of the KPMG global organization of independent member firms affiliated with KPMG International Limited, a private English company limited by guarantee.

84 Financial 2021 Comprehensive Annual Financial Report
INDEPENDENT AUDITORS’ REPORT ON INTERNAL CONTROL CONTINUED
47
System’s Response:
Training and procedures will be reviewed with General Ledger staff to ensure their comprehension of the proper accounting for internal transfers. Management will review annual internal transfers to System reserve funds more closely and look for opportunities to automate the journal entries in the future.
Compliance and Other Matters As part of obtaining reasonable assurance about whether the System’s basic financial statements are free from material misstatement, we performed tests of its compliance with certain provisions of laws, regulations, contracts, and grant agreements, noncompliance with which could have a direct and material effect on the financial statements. However, providing an opinion on compliance with those provisions was not an objective of our audit, and accordingly, we do not express such an opinion. The results of our tests disclosed no instances of noncompliance or other matters that are required to be reported under Government Auditing Standards.
The System’s Response to the Finding The System’s response to the finding identified in our audit is described previously. The System’s response was not subjected to the auditing procedures applied in the audit of the basic financial statements and, accordingly, we express no opinion on the response.
Purpose of this Report The purpose of this report is solely to describe the scope of our testing of internal control and compliance and the results of that testing, and not to provide an opinion on the effectiveness of the System’s internal control or on compliance. This report is an integral part of an audit performed in accordance with Government Auditing Standards in considering the System’s internal control and compliance. Accordingly, this communication is not suitable for any other purpose.
July 28, 2021, except as to note 2(h), which is as of August 13, 2021

InvestmentWe are considered one of the best-managed and best-funded public pension plans
in the nation thanks to a strategic, long term investment philosophy that looks to
the future. With the pension security of our members and retirees in mind, we seek
out diverse and stable investments that provide solid returns, keeping the Fund’s
performance strong. We also look for sustainable investment opportunities to
support the environmental well-being of our planet.
A Century of Steady Growth
NYSLRS1921–2021
86 Investment 2021 Comprehensive Annual Financial Report
CONTENTS
Overview of Investments ..................................................................................................................... 87
Corporate Governance ...................................................................................................................... 100
Investment Results ........................................................................................................................... 104
Investment Summary ........................................................................................................................ 105
Asset Allocation — March 31, 2021 ....................................................................................................... 106
Public Equity Performance .................................................................................................................. 107
Public Equity Fund of Fund Performance ..................................................................................................................... 109
Domestic Equity Portfolio — Ten Largest Holdings .................................................................................... 110
Fixed Income Portfolio and Comparison ................................................................................................. 111
Fixed Income Performance ................................................................................................................. 112
Fixed Income Portfolio — Ten Largest Holdings ........................................................................................113
Real Estate Portfolio .......................................................................................................................... 114
Alternative Investments Summary ........................................................................................................ 115
Public Equity Management Fees .......................................................................................................... 116
Public Equity Commissions — Internally Managed .................................................................................... 117
Public Equity Commissions — Externally Managed ...................................................................................118
Global Fixed Income Management Fees ................................................................................................. 121
Long-Term Domestic Bond Transactions — Internally Managed ....................................................................122
Long-Term Domestic Bond Transactions — Externally Managed ...................................................................123
Short-Term Domestic Bond Transactions — Internally Managed ...................................................................124
Real Estate Management and Incentive Fees (Expensed) ............................................................................125
Real Estate Management and Incentive Fees (Capitalized) ..........................................................................126
Private Equity Management Fees (Expensed) .......................................................................................... 127
Private Equity Management Fees (Capitalized) ......................................................................................... 128
Private Equity — Fee, Expense and Carried Interest Analysis .......................................................................129
Opportunistic/Absolute Return Strategies Funds Management and Incentive Fees (Expensed) ............................130
Opportunistic Funds Management Fees (Capitalized) ................................................................................ 131
Real Assets Management Fees (Expensed) .............................................................................................. 132
Real Assets Management Fees (Capitalized) ............................................................................................ 133
Credit Management Fees (Expensed)........................................................................................................................... 134
Consultant and Advisor Fees ............................................................................................................... 135

87Investment 2021 Comprehensive Annual Financial Report
OVERVIEW OF INVESTMENTS
OVERALL OBJECTIVES AND PERFORMANCE
The Division of Pension Investment and Cash Management (PICM) in the Office of the State Comptroller (OSC) is responsible for the management of the assets of the New York State Common Retirement Fund (Fund or CRF). The Fund’s primary objective is to provide the means to pay benefits to the participants in the New York State and Local Retirement System (System or NYSLRS) through an investment program designed to protect and enhance the long-term value of the assets. We are responsible for implementing an asset allocation strategy with an appropriate balance of risk and return. Investments in equities, although historically volatile, provide superior long-term performance and growth characteristics, while fixed income investments provide less volatility and more predictable cash flow to meet the System’s funding requirements and pension obligations. Alternative investments provide diversification and incremental returns.
The Fund’s investment performance for the fiscal year ended March 31, 2021 was 33.55 percent gross of certain investment fees. All asset classes contributed to the positive return in a “risk-on” environment. With ample liquidity and low rates, equity markets soared to new heights with other asset classes following to relative degrees. Despite this, uncertainties remain, particularly in pockets of the global economy especially as it relates to commercial real estate, business travel and other slow to recover post COVID sectors. COVID continues to hit countries across the globe with the long-term implications still uncertain. We continue to monitor inflation, potential earnings erosion, tensions with China, political unrest, climate concerns and other risks.
The Fund’s positive performance reflects gains across all asset classes. The equity portfolio returned 60.07 percent, the fixed income portfolio returned 2.61 percent, the real estate portfolio returned 2.19 percent, the private equity portfolio returned 23.83 percent, the opportunistic/absolute return strategies portfolio returned 19.69 percent, the credit portfolio returned 20.38 percent and real assets returned 7.34 percent.
The investment performance information provided in this section of the Comprehensive Annual Financial Report was calculated by the Fund’s custodian, J.P. Morgan, using a daily time-weighted rate of return based on the market value of assets.
PENSION RISK MANAGEMENT
Risk Oversight
Prudent risk-taking in line with strategic priorities is fundamental to providing adequate returns and affordable pension plan funding. The primary objective of risk management is to provide an investment risk framework for the Fund as a whole, and across asset classes, to help maintain the economic viability of the System. Pension Risk Management (PRM) also works to monitor liquidity and other non-investment risks, to the extent that these risks may affect the overall objectives of the Fund. The Fund’s risk management framework is based on transparency, management accountability and independent oversight. CRF’s approach to risk taking is supported by the following principles:
• Establish a clear risk appetite that sets out the types and levels of risk we are prepared to take;
• Have in place risk management and compliance policies that set out authorities and responsibilities for taking and managing risk across CRF and its asset classes;
• Seek to establish resilient risk constraints that promote multiple perspectives on risk; and
• Actively monitor risks and take mitigating actions when they fall outside of acceptable levels.
88 Investment 2021 Comprehensive Annual Financial Report
Central to the Fund’s risk framework is the Risk Appetite Statement, which was approved by the Fund’s Trustee, Comptroller DiNapoli, in 2018:
The CRF is dedicated to providing a secure pension for generations of NYSLRS members, retirees and beneficiaries. In the pursuit of this mission, the CRF is committed to the highest standards of ethics and prudent investment management. In their decision making, the Trustee and staff of the CRF may take prudent investment risks when compensated by higher expected returns in order to generate stronger long-term performance. Regardless of potential returns, the CRF endeavors to avoid the risk of a loss of asset value that could compromise the economic viability of the current plan structure or call into question the integrity and responsibility of the CRF or its staff. Therefore, the CRF diligently seeks to identify and avoid such risk.
Risk Governance
Effective governance sets a solid foundation for comprehensive risk management discipline. CRF’s risk governance is based on the “Three Lines of Defense” model, where each line has a specific role within defined responsibilities and works in close collaboration to identify, assess and mitigate risks.
The First Line of Defense is the hands-on, active risk management that portfolio management teams practice during day-to-day management of a portfolio or trading position. Examples of first-line risk activities include analyzing risks in support of investment decisions, adjusting portfolio positions in anticipation of developing risks, or analyzing all aspects of risks in support of written investment proposals. First-line activities are generally restricted to one portfolio or to one asset class and are put into practice by personnel whose collective, routine function is to make investment decisions.
The Second Line of Defense includes functions such as Risk Management and Compliance which are a step removed from active asset management. The functions within the second line articulate standards and expectations for the effective management of risk and controls, including providing institutional leadership on CRF-wide risk issues, and advising on, establishing and maintaining related policies. They are responsible for producing an independent risk assessment and risk reporting for senior management and regulatory authorities. Risk Management and Compliance is also responsible for articulating and designing the risk appetite framework across CRF.
The Third Line of Defense is an audit function. This function monitors the effectiveness of risk management, compliance and governance practices.
CRF’s operations, financial information and internal controls are subject to examination by the New York State Department of Financial Services. Additionally, KPMG LLP, an independent, certified public accountant, audits the System’s financial statements annually. The Comptroller’s Office of Internal Audit also regularly reviews various aspects of PICM’s operations, investment procedures, and internal controls.
CRF’s governance includes a committee structure and a comprehensive set of policies which are reviewed and approved by the Comptroller and his respective committees in accordance with their responsibilities and level of authority.
OVERVIEW OF INVESTMENTS CONTINUED

89Investment 2021 Comprehensive Annual Financial Report
The Fund’s Trustee
The Comptroller, as the Fund’s Trustee, is responsible for our strategic direction, supervision and control, and for defining our overall tolerance for risk. In particular, the Comptroller approves the risk management framework and sets overall risk appetite among other responsibilities.
Investment Advisory Committee
The Investment Advisory Committee advises the Comptroller on general investment issues. The Investment Advisory Committee periodically reviews the strategic plan and monitors the CRF’s risk profile. The Director of Risk is a participant at each Investment Advisory Committee meeting and provides a formal presentation to the Investment Advisory Committee on liquidity and market risk on an annual basis. Investment Advisory Committee members also receive quarterly risk updates in conjunction with the Investment Advisory Committee meeting.
Risk Committee
The Director of Risk has responsibilities for advising the Chief Investment Officer (CIO), the Executive Deputy Comptroller for Retirement Services (EDCRS) and the Comptroller on risk issues and making formal recommendations to the CIO, the EDCRS and the Comptroller on investment risk and investment-related risk issues. In addition, recognizing that risk is multidimensional and that risk cannot be reduced to a single measure or be fully encompassed by any one professional discipline, the Director of Risk seeks advice from the Committee. The purposes of the Committee are (1) to provide support and advice to the Director of Risk on risk issues and (2) to provide multidisciplinary advice on risk and risk management programs at PICM. In addition, the Committee provides a forum for the discussion of CRF risk issues that may be raised by PICM staff and other stakeholders.
Rebalance Committee
The Rebalance Committee, chaired by the Director of Risk, makes sure the CRF’s invested exposure is aligned with its approved asset allocation targets. The Rebalance Committee meets at least monthly to review and analyze the Fund’s current asset allocation, cash flow projections including benefit payments and capital calls, and current capital markets conditions and outlook. In addition, the Rebalance Committee ensures that CRF’s short-term liquidity needs are adequate. The Rebalance Committee may also discuss the basket bill position, as necessary for the purposes of monitoring the overall allocation per statutory guidelines.
Risk Organization
To ensure functional independence, the Director of Risk reports functionally to the Executive Deputy Comptroller of the Retirement System (EDCRS) and administratively reports to the Chief Investment Officer (CIO). The purpose of the administrative reporting line is to facilitate the ongoing coordination between the risk management and investment management functions, and to provide the physical and financial resources that are necessary for effective risk governance.
PICM’s risk organization continues to evolve to support efforts to drive strategic and sustainable returns that reflect the risk appetite of the Fund.
OVERVIEW OF INVESTMENTS CONTINUED

90 Investment 2021 Comprehensive Annual Financial Report
COMPLIANCE
The Compliance Office for the Fund is headed by the Director of Compliance, who reports to the EDCRS and administratively reports to the CIO. The primary purpose of the Compliance Program is to monitor compliance by PICM staff and external managers with applicable statutes, policies and procedures, guidelines, conflict of interest and other ethical standards governing the Fund. In an effort to meet this objective, the activities of the Compliance Office primarily include the reporting, development or monitoring of: the Fund’s investment-related policies and procedures; statutory and policy mandates for equity and fixed income trading by both internal staff and external managers; personal trading activities of employees pursuant to the “Insider Trading Policies;” background investigation reports and Annual Compliance Questionnaires for external managers, broker-dealers and consultants; PICM operational risk assessment process; and regulatory filings required under Section 13 of the Securities and Exchange Act of 1934.
PUBLIC EQUITIES
The role of the Fund’s public equities portfolio is to provide the largest source of returns in the Fund’s portfolio over the long-term through diversified, global equity market exposure. For the fiscal year ended March 31, 2021, the $134.6 billion Common Retirement Fund global public equity portfolio posted a positive 60.07 percent return, outperforming the MSCI All Country World Index (ACWI) benchmark, which rose 54.60 percent. The Fund continues to benefit from its long-term overweight to U.S. equities, with a five-year return for the total public equity portfolio of positive 15.17 percent. For the fiscal year ended March 31, 2021, the domestic equity portfolio rose 61.40 percent, underperforming the benchmark Russell 3000 return of 62.53 percent. The U.S. portfolio trailed the benchmark as smart beta and defensive portfolios trailed sharply higher markets and small cap active managers had difficulty keeping pace with the Russell 2000, which rose 94.85 percent. Those small cap active managers over a five-year period rose 19.69 percent beating the index return of 16.35 percent. The U.S. equity portfolio was valued at $85.6 billion at the end of the fiscal year. U.S. stocks rebounded sharply on expectations for a recovering U.S. economy and a rebound in corporate earnings as the U.S. economy led the world in restarting after the COVID shutdown the previous year.
International equity markets also recovered with the Fund’s $34.8 billion non-U.S. equity portfolio posting higher returns for the fiscal year, up 54.57 percent, outperforming the MSCI ACWI ex U.S. IMI benchmark, which rose 51.94 percent. The Fund’s $14.3 billion global portfolio, in which active managers allocate between U.S. and international equities, outperformed the benchmark returning 64.58 percent, compared to the MSCI ACWI return of 54.60 percent. The Fund’s emerging markets (EM) portfolio rose 57.62 percent, but, underperformed the MSCI EM benchmark of 58.39 percent.
The public equities program continues to rely on broad passive index funds in the more efficient segments of the equity markets. This allows the Fund to maintain exposure to market returns at very low costs. The staff continues to employ active manager mandates in less efficient markets where active management is likely to outperform.
The Fund’s equity brokers undergo a complete review every five years, last conducted in 2018. Staff additionally reviews the broker list annually and makes adjustments as necessary. The Fund now has 18 approved broker-dealer firms to execute trades for the internally managed public equity portfolio. Five of the trading partners are women-owned or minority-owned (MWBE firms), accounting for 38 percent of the internally managed public equity commissions for the fiscal year.
OVERVIEW OF INVESTMENTS CONTINUED

91Investment 2021 Comprehensive Annual Financial Report
FIXED INCOME
The fixed income portfolio is designed to provide a consistent source of funds to help address the cash flow needs of the Fund. Additionally, these assets provide downside protection against the volatility of the overall portfolio’s equity-like strategies, while achieving efficiency in the risk/return profile for fixed income. The Fund accomplishes these goals by investing internally in long-term and short-term assets, while external managers focus on increasing returns and diversification, primarily through higher-yielding fixed income investments. The short-term fixed income portfolio offers liquidity to meet monthly pension fund liabilities, as well as providing funding for the other asset classes within the Fund.
The core fixed income portfolio uses the Bloomberg Barclays U.S. Aggregate Bond Index as a benchmark and seeks to add value through sector allocation and security selection. The long-term core fixed income portfolio consists primarily of U.S. Treasury securities, government-sponsored agency debentures, corporate bonds, commercial mortgage-backed securities, mortgage-backed securities, asset-backed securities, collateralized loan obligations, and municipal bonds. For the internal fixed income accounts, the Fund does not invest in securities that are below investment grade. The externally managed fixed income allocation consists primarily of higher yielding credit-focused investments. The Fund also has a large allocation to Treasury Inflation-Protected Securities (TIPS). The Fund’s short-term fixed income portfolio may be invested in high quality commercial paper, U.S. Treasury bills, bank certificates of deposit, and agency discount notes, as well as short-term corporate bonds and asset-backed securities.
The Fund’s core long-term fixed income portfolio returned 2.61 percent for the year as compared to 0.71 percent for the Bloomberg Barclays U.S. Aggregate Bond Index. The outperformance was largely attributable to significant spread tightening in corporate bonds, commercial mortgage-backed securities, asset-backed securities, and collateralized loan obligations, ABS, and CLO’s, as the fixed income markets recovered from the extreme dislocation seen in March 2020, which resulted from the onset of the coronavirus pandemic. The average credit quality of the core portfolio remains at AA2/AA-, in line with the credit quality of the portfolio’s benchmark.
Short-term cash investments returned 0.51 percent for the fiscal year. Externally managed fixed income returned 9.83 percent for the fiscal year, as higher-yielding fixed income securities also had a meaningful recovery from the market dislocations seen in the spring of 2020. The external managers provided a meaningful contribution to the overall outperformance of 190 basis points in core fixed income.
The Fund conducts a complete broker review every five years to create a new approved broker list. Annually, the Fund considers additional brokers and may make changes to the approved broker list as the team deems necessary. The Fund now has 24 approved broker-dealer firms to execute trades in the long-term and short-term fixed income portfolios. Thirteen percent of these trading partners are MWBEs, while firms owned by disabled American veterans represent another 4 percent. Women-owned and minority-owned firms continue to play a central role in the Fund’s long-term and short-term fixed income strategy, executing 11.9 percent of all long-term trades and 15.0 percent of all short-term broker trades during the past fiscal year.
The Fund participates in a securities lending program, whereby the custodian bank loans a portion of the fixed income and equity securities to qualified counterparties, providing incremental income. For the fiscal year ended March 31, 2021, the securities lending program earned the Fund $35.5 million in revenue, net of management fees and rebates.
OVERVIEW OF INVESTMENTS CONTINUED

92 Investment 2021 Comprehensive Annual Financial Report
REAL ESTATE
The Real Estate Bureau seeks to create a diversified real estate portfolio by investing across different property types, geographic markets, and investment strategies to minimize portfolio risk and maximize the potential for long-term steady growth. The real estate allocation’s mandate to the overall Fund is to provide a steady stream of income through less risky, core investments and capture excess returns through riskier, core-plus/value-add, and opportunistic investments. While the past fiscal year has seen an environment of uncertainty, Real Estate has focused on managing volatility while meeting its long-term investment objectives over the past several years.
The Real Estate Group mainly invests through four primary investment structures: wholly owned, joint ventures, separately managed accounts, and commingled funds (closed-end, open-end, and fund-of-funds). For wholly owned assets, the Fund works with external advisors and third-party service providers to manage properties. For all other structures, CRF invests alongside a sponsor, or general partner, whose interests are aligned to the Fund’s via shared risk and incentive.
As of March 31, 2021, equity real estate represented 6.75 percent of total Fund assets, producing a total return of 2.19 percent for the fiscal year compared to the custom real estate benchmark of 1.11 percent. The custom real estate benchmark is an asset-weighted blend of quarter-lagged benchmarks, including the NCREIF NFI ODCE (Net) Index. Over the long term, the real estate portfolio exhibits sustained, strong net performance relative to its benchmark. Looking forward, the Fund will continue to structure and manage a balanced real estate portfolio that is capable of weathering economic cycles through its broad diversification across property types, markets, and risk profiles.
Core strategies include investing in fully leased, trophy properties located in top markets in the U.S. The primary objective of core investing is to provide the Fund a reliable source of current income and moderate value appreciation with limited downside. Core assets are found in highly liquid, gateway cities, often in irreplaceable locations with strong tenant demand. Currently, a significant percentage of the real estate portfolio is being allocated to core properties.
Core-plus/value-add investments may include under-managed properties with existing vacancy or near-term tenant rollover or opportunities for light-to-moderate renovations, allowing an asset to be repositioned and re-leased to create value. Opportunistic investments include strategies such as ground-up development or substantial renovation that can deliver enhanced yield; however, they also carry the increased risk of construction and exposure to changing market conditions.
The Fund manages risk within the real estate portfolio through maintaining strong relationships and diversifying investments by property type, geography, investment strategy, and capital pacing. To achieve long-term appreciation and sustainable returns, the Real Estate Group will seek to continue to leverage existing relationships, and, when starting new relationships, selecting best-in-class sponsors, joint venture partners, consultants and advisors. In addition, the Fund recognizes the importance (and value) of investing with smaller firms and MWBE real estate managers, and through dedicated programs, and will look to capitalize on their talent and expertise.
OVERVIEW OF INVESTMENTS CONTINUED

93Investment 2021 Comprehensive Annual Financial Report
AFFORDABLE HOUSING PERMANENT LOAN PROGRAM
In 1991, the Fund developed a program to support the rehabilitation and development of affordable housing in New York State. Under the program, the Fund’s designated manager, the Community Preservation Corporation (CPC), originates affordable long-term housing mortgages across New York State. CPC provides the construction financing, and when construction is completed, CPC sells the permanent loans to the Fund. All mortgages are 100 percent insured by the State of New York Mortgage Agency (SONYMA).
Through this program with CPC, the Fund has provided moderate-income and low-income families across the State with the opportunity to rent affordable housing. By purchasing permanent mortgages, the Fund provides for the production of affordable new multi-family housing and the revitalization of deteriorated or obsolete housing units.
Since the inception of this program, 21,578 units representing $942.5 million have been completed; 1,665 more are in the pipeline. In the 2020-21 fiscal year, the fund invested in affordable housing throughout the state, including Albany, Dutchess, Erie, Monroe, Rockland, Ontario and Orange counties. The Fund remains dedicated to working with CPC and SONYMA to provide New York State residents with opportunities in affordable housing, as long as the investment structures and potential returns fulfill the fiduciary mandate of the Fund to the beneficiaries and retirees.
HELPING NY/EQUITY REAL ESTATE INVESTMENTS
Alongside the CPC program, the Fund also invests in New York State commercial real estate properties through a mix of investment structures such as joint ventures, commingled funds, and club fund investments, as well as wholly owned properties. The Fund owns, in whole or in part, shopping centers, office buildings, residential properties and hotels. Through these investment vehicles, the Fund has been able to acquire, develop, re-lease and reposition properties that are in need of upgrading with the goal of increasing jobs, helping the community and increasing property values. In line with these goals, the Fund completed a major redevelopment of an office building in New York City and has co-invested in a multi-family sidecar vehicle that focuses on affordable housing in the State.
ALTERNATIVE INVESTMENTS
Private Equity
The Fund’s private equity portfolio is designed to generate long-term returns that exceed those of public equities. As of March 31, 2021, the private equity program generated a one-year total return of 23.83 percent, as compared to the Cambridge U.S. Private Equity Index benchmark (1Q Lag) of 22.93 percent.
The Fund seeks to participate in private equity investments primarily through partnerships consisting of pooled funds managed by specialized investment managers for the purpose of investing in private companies. The Fund seeks to partner with the very best private equity investors, including emerging and diverse managers, across various investment strategies. Private equity investments are generally held for long-term appreciation and are less liquid than publicly traded securities.
The Fund will commit capital to private equity at a disciplined pace to ensure the diversification of the portfolio over time. In addition, the Fund seeks to commit capital across various geographies, including international managers who have the expertise to source attractive investment opportunities in global markets and, more locally, to managers who focus their
OVERVIEW OF INVESTMENTS CONTINUED

94 Investment 2021 Comprehensive Annual Financial Report
investments in New York State (In-State Investment program). The Fund also seeks to commit capital to industry sectors, such as technology, that show high potential for economic growth and capital appreciation, and that will further enhance the diversification of the portfolio.
Because private equity investments involve long-term contractual commitments to a manager, the Fund seeks to invest with managers who have the ability to consistently deliver superior returns. The Fund can better achieve such superior returns through active portfolio monitoring, which requires frequent and direct interaction with investment managers to monitor performance and ensure proper alignment of interests between manager and investor.
The private equity program seeks to exploit those long-term commitments and alignments of interests by making co-investments alongside select managers on improved economic terms. During the past fiscal year, the Fund made 33 co-investments totaling over $557 million in invested capital in portfolio companies alongside Fund managers. The Fund has established equity co-investment programs focused on opportunities sourced from its core private equity portfolio, the emerging manager program, the In-State Investment program and its Israel investment program. The In-State program also has the capability to make credit co-investments, and two credit co-investments totaling approximately $17.5 million have been made during the past fiscal year in companies in New York State, and are included in the co-investment totals above.
Opportunistic Funds/ Absolute Return Strategy Funds
The Opportunistic/ARS (OARS) portfolio invests across a broad range of investment strategies that do not fit neatly into the definition of traditional asset classes or that share characteristics of multiple asset classes. The portfolio includes investments across the capital structures of both public and private companies and assets that are distinguished from the mandates of the other asset classes by their history, investment structures, terms, duration, risk/return profiles, or other relevant characteristics. The role of the OARS asset class is to add alpha (excess return) to the Fund’s overall return with a relatively low correlation to other asset classes. Additionally, the portfolio seeks to invest in unique opportunities by identifying skilled external managers who can generate excess returns in all market environments.
The portfolio’s objectives are accomplished by investing in opportunities such as market dislocations, regulatory reforms, capital shortages, structural changes, and stress or distress among asset owners. The OARS team allocates capital into investments that may not fit neatly into existing asset classes or span multiple asset classes.
The OARS portfolio allows the Fund to capture returns in advance of heavy institutional asset flows (early mover advantage) or to take a preferential position in situations that are capacity constrained. The portfolio also allows the Fund to invest more flexibly across asset classes, geographies, and capital structures.
The structures of these investments will vary greatly depending on the opportunity. They may range from broad strategic partnerships, where the Fund’s staff can leverage an institution’s resources to invest across many asset classes or strategies, to a more targeted approach that may include investments focused on sectors, asset types, or geographies. OARS investments span multiple fund structures including open-ended, closed-ended, and evergreen funds. In addition to commingled funds, separate accounts, and minority investment stakes, the OARS team may also seed new investment platforms or take an anchor position in new investment strategies with existing managers.
OVERVIEW OF INVESTMENTS CONTINUED

95Investment 2021 Comprehensive Annual Financial Report
The OARS portfolio performed well during fiscal year 2021. The performance was primarily due to rapid recovery across most asset classes following the COVID-19-driven downturn in March of 2020. The largest attribution to returns came from event-driven managers, specialty finance, and healthcare investments during this period.
As of March 31, 2021, the portfolio has generated a one-year total return of 19.69 percent compared to 8.80 percent for the benchmark.
Credit
The Credit asset class’s mandate is to significantly outperform CRF’s actuarial return target while maintaining relatively low correlation to other asset classes outside of the fixed income market. To accomplish this objective, the team invests across the fixed income universe and seeks attractive risk-adjusted returns using a diverse set of investments.
In general, the Credit team seeks investments that will be broadly focused on credit opportunities that exist for the following reasons:
• Opportunities that are driven by a lack of availability of credit due to inefficient markets or market dislocations;
• An investment may seek to take advantage of structural market changes;
• Investments may become available given a mispricing either with a market or an industry; and
• An investment may seek out an ability to capture an illiquidity premium relative to liquid market investments.
The Credit team divides its investments into core and non-core portfolios. Core investments generally take the form of large investments in external managers, while non-core investments are generally smaller ticket investments in niche managers and direct investments into attractive opportunities.
The current portfolio is dominated by liquid credit mandates, which performed extremely well in the past fiscal year, participating in the post-pandemic rebound. The focus of the Credit Team is to increase exposure to relatively illiquid private market strategies, largely due to its less correlated nature to listed equities. In the meantime, existing private market mandates also exceeded return expectations.
As of March 31, 2021, the portfolio has generated a one-year total return of 20.38 percent compared to 23.74 percent for the benchmark.
Real Assets
The Real Assets portfolio was first launched in 2014 and continues to develop. The long-term allocation of the portfolio is 3 percent, and the strategic benchmark is the Consumer Price Index (CPI) plus 500 basis points. Sector allocations include investments in agriculture, capital assets, energy transition, infrastructure, and timber. As of March 31, 2021, the portfolio returned 7.34 percent compared to 7.86 percent for the benchmark. The portfolio has an annualized return of 7.53 and 8.90 percent over three and five years, respectively. Both periods exceeded the benchmark return. The portfolio has begun to outpace its benchmark as allocation ratios move closer to a range typical of mature portfolios and the “J” curve impact normalizes.
OVERVIEW OF INVESTMENTS CONTINUED

96 Investment 2021 Comprehensive Annual Financial Report
OVERVIEW OF INVESTMENTS CONTINUED
The Real Assets portfolio’s objectives are to add alpha to the Fund’s overall portfolio return and offer inflation participation opportunities while maintaining a low correlation to traditional asset classes over time. The portfolio also seeks to benefit from investment themes that will play out over multiple economic cycles. The performance of the asset class is primarily driven by broad, macroeconomic factors, including resource demand, demographics, inflation, and idiosyncratic supply shocks.
As we invest within the asset class, we seek to source best-in-class real asset fund managers with strong and sustainable track records. To date, we have invested approximately $3.93 billion across numerous real assets strategies. The real assets portfolio’s allocation was 1.54 percent at fiscal year-end. The relative weight is still modest but will grow as the portfolio evolves. Total capital committed exceeds $8 billion. These commitments include allocations to emerging, secondary, and energy transition managers.
Geographically, the portfolio is diversified across the United States, Organization for Economic Cooperation and Development (OECD) countries, and emerging markets.
Pursuit
The Fund seeks to diversify its investments and achieve a risk-adjusted rate of return through a commitment to Pursuit, formerly known as the New York Business Development Corporation (NYBDC). Pursuit underwrites loans to small businesses in New York State, often with guarantees from the U.S. Small Business Administration, for working capital, equipment, the acquisition of real property, capital improvements and the refinancing of existing loans. Pursuit has successfully completed loans to a wide range of business enterprises, including retailers, restaurants, small manufacturers and a variety of other service businesses across the State. By focusing exclusively on small business lending, Pursuit can frequently offer more favorable terms than other lenders. Pursuit has an active Veteran’s Loan Program where New York business owners who serve in the National Guard or Reserve, along with honorably discharged former active duty members, can access small business loans.
Pursuit also has a goal of making at least 25 percent of its loans to MWBEs. In the 2020 calendar year, 18 percent of Pursuit loans that were due to Fund investments were made to women-owned businesses and 25 percent were made to minority-owned businesses.
The Common Retirement Fund has been an investor in NYBDC since 1987, with commitments totaling $500 million. In 2018, the Fund approved a fifth $100 million commitment to support NYBDC’s small business loan program. Since this program began in 1987, NYBDC has made 1,212 loans totaling $449 million to businesses that employ over 24,900 New Yorkers. During the fiscal year ended March 31, 2021, Pursuit made 16 loans totaling $11.8 million.
Financing for Businesses in New York State
In 2000, the Fund initiated the New York (In-State) Private Equity Investment Program. The In-State Program is designed to generate a market rate of return consistent with the risk of private equity while increasing the diversification of the Fund’s investment portfolio and expanding the availability of capital for New York State businesses. By making sound strategic investments in new and expanding New York companies, and making equity and debt capital available to small businesses often overlooked by investment professionals in this asset class, the program is also proving to be an important contributor to the State’s economy. The In-State Program provides a model for how the pension fund can identify profitable investment opportunities and generate market rate returns, while supporting business development and job growth in New York State.

97Investment 2021 Comprehensive Annual Financial Report
OVERVIEW OF INVESTMENTS CONTINUED
On March 31, 2021, the Fund’s private equity portfolio included investments in over 416 New York businesses with a market value of $2.2 billion. This figure reflects only the Fund’s share of these investments; the total value of New York companies held by the Fund’s partnerships was more than $34.0 billion as of December 31, 2020 (the most recent data available). Included in the Fund’s New York State portfolio are: LeverPoint in Clifton Park, DeIorios in Utica, Corelle Brands in Corning, Movable Ink in New York City, AeroSafe in Rochester and ACV Auctions in Buffalo.
As of March 31, 2021, the Fund had over $600 million of remaining commitments available for investment in the In-State Program. Commitments to this program totaled $2.1 billion. These commitments are devoted exclusively to New York State investment opportunities. The 18 managers in the program are:
• Armory Square Ventures, an early-stage venture capital fund located in Syracuse.
• Ascent Biomedical Ventures NY, a New York City-based venture capital fund focusing on life sciences.
• Grosvenor Capital Management, a fund that makes investments alongside other private equity funds investing in New York State.
• Contour Venture Partners, an early-stage venture fund based in New York City.
• DeltaPoint Capital, a growth equity fund located in Rochester.
• Gotham Ventures (fka DFJ Gotham), a New York City-based fund focused on early-stage venture capital investments.
• Easton Hunt Capital Partners, a New York City-based fund that pursues a broad strategy of investing in companies in a wide range of industries and stages of development.
• Founders Equity, a New York City-based fund that makes growth equity investments.
• Graycliff Partners, a New York City-based fund that targets buyout and growth equity investments.
• Tribeca Venture Partners, a New York City-based early-stage applied technology venture firm focused on investing in business information and technology-enabled services companies.
• Primary Venture Partners (fka High Peaks Ventures), an early-stage venture capital fund based in New York City and Albany.
• Hamilton Lane, three special situations funds that make equity and credit investments alongside other private equity managers investing in New York State.
• Activate Venture Partners (fka Milestone Venture Partners), a New York City-based fund that focuses on companies providing technology-enhanced businesses services.
• Paladin Homeland Security Fund (NY), a Washington, D.C.-based fund that opened a New York office to invest in companies that address a broad range of government and commercial security needs.
• SoftBank Capital NY, a New York City and Buffalo-based fund that invests in digital media and technologies that leverage broadband.
• Summer Street Capital Partners, a growth equity investment fund located in Buffalo.
• Trillium Lakefront Partners NY, a Rochester-based fund that focuses on investing in technology companies in upstate New York.
• Wheatley Partners, a technology venture fund with a focus on information and medical technology located in New York City and Long Island.

98 Investment 2021 Comprehensive Annual Financial Report
OVERVIEW OF INVESTMENTS CONTINUED
EMERGING MANAGER PROGRAM
The goal of the Emerging Manager Program is to identify newer and smaller investment managers that have the potential to add value to the CRF’s investment portfolio across all asset classes. Due to the size of assets under management, these managers would not typically be identified as an investment opportunity in the CRF’s standard institutional investment manager search process. The Emerging Manager Program also provides the CRF with opportunities to invest with qualified business enterprises that are majority owned or are substantially owned and operated by women or minority managers (MWBEs).
Smaller investment management funds may generate superior performance returns because of their entrepreneurial nature and increased investment flexibility. Historically, several CRF emerging managers have outperformed their more established peers, a trend the CRF staff expects to continue. Graduates of the Emerging Manager Program are a natural source of new relationships for the CRF’s investment portfolio, allowing the program to organically structure and form new relationships that can evolve to meet institutional investment mandates.
The CRF has established a policy framework for the Emerging Manager Program’s operational guidelines and procedures in order to achieve the following objectives:
• To increase the CRF’s utilization of emerging managers, including MWBE managers, consistent with applicable investment and fiduciary standards;
• To proactively identify best-in-class emerging managers who demonstrate the capacity and return profile to become viable long-term partners of the Fund;
• To employ prudent selection processes and practices consistent with the high fiduciary standards for all the CRF’s investment management decisions and processes;
• To maintain guidelines and funding strategies that will encourage inclusion and ongoing support for the development of emerging managers;
• To generate appropriate risk-adjusted investment returns by identifying new investment opportunities with the potential for strong performance and by further diversifying the portfolio; and
• To cultivate, develop and incubate the next generation of external portfolio managers that would be candidates for transition into the CRF’s core pool of investment managers.
As of March 31, 2021, the Fund currently has approximately $27 billion invested with or committed to minority-owned or women-owned firms. MWBEs now represent approximately 21.5 percent of our externally managed active mandates.

99Investment 2021 Comprehensive Annual Financial Report
OVERVIEW OF INVESTMENTS CONTINUED
SUSTAINABLE INVESMENTS AND CLIMATE SOLUTIONS PROGRAM
Sustainable Investments and Climate Solutions Program (SICS) is a thematic, multi-asset class investment program designed to strengthen CRF’s portfolio by capitalizing on investment opportunities that advance one or more of nine themes split equally into three categories: Resources & Environment, Human Rights & Social Inclusion, and Economic Development. The themes are closely aligned to the United Nations Sustainable Development Goals (SDGs). Led by a Director reporting to the Chief Investment Officer, the SICS program works across asset classes to source, identify, and assess sustainable investment opportunities. Investments attributed to SICS will be subject to the same fiduciary and risk and return requirements applicable to investments in the subject asset classes.
CRF SICS THEMES
Resources and Environment Human Rights and Social Inclusion Economic Development
Climate and Environment Education Financial inclusion
Resource efficiency Demographic empowerment Sustainable infrastructure
Pollution and waste management Health and wellbeing Affordable housing
Sustainable investments have catalytic capability to augment financial performance by focusing on long-term value creation. The SICS Program improves the diversification of the CRF portfolio and is intended to enhance risk-adjusted returns by both reducing financial risks and seizing investment opportunities.
In its November 2020 Financial Stability Report, the Federal Reserve Board illustrates financial system vulnerabilities caused by climate change. Awareness of various risks (disclosure, physical, and transition risks) has become an increasing expectation of modern fiduciaries. For example, inadequate disclosures can lead to regulatory investigations and shareholder claims; assets can become damaged by weather and climate-related events; and resource-based assets can become devalued due to low-carbon norms.
SICS is a key component of the Fund’s plan to position its portfolio for a low-carbon economy. SICS builds on the Fund’s initial $10 billion commitment to sustainable investment strategies, with a new total goal of $20 billion to be realized over the next decade, which includes a $4 billion investment in a low-carbon index that has a 75 percent lower carbon emissions intensity than its benchmark, achieved by underweighting investments in high emitters.
SICS provides CRF with a systematic platform to opportunistically expand investment opportunities across assets that are consistent with the goals of the Climate Action Plan. As of March 31, 2021, CRF has committed over $11 billion to investments in SICS including green bonds, clean and green infrastructure, green buildings, renewable energy, and climate indices.

100 Investment 2021 Comprehensive Annual Financial Report
Corporate Governance Program and Environmental, Social and Governance (ESG) Strategy
The Fund’s investment philosophy requires the consideration of environmental, social, and governance (ESG) factors in the investment process because they can influence both risks and returns. Assessing company and external manager performance with respect to ESG factors and encouraging both to embrace ESG best practices can help protect the long-term value of the Fund’s investments.
During the 2020–21 fiscal year, the Fund released its first ESG Strategy which delineates its ESG beliefs, practices, and key factors, and outlines expectations for asset managers and public equity portfolio companies. The Fund’s ESG Strategy can be accessed on the Comptroller’s website at www.osc.state.ny.us/files/common-retirement-fund/2020/pdf/ ESG-strategy-report-2020.pdf.
The Fund’s Corporate Governance Program is tasked with executing the Fund’s ESG Strategy, with a focus on the following key ESG factors:
• Environment (E): climate risks and opportunities, natural resource and raw material usage, and pollution and waste management.
• Social (S): human capital management, labor relations, human rights, health and safety, supply chain labor standards, privacy and data security, product safety and quality, and community impact.
• Governance (G): risk oversight, board and governance practices, corporate strategy and capital allocation, executive compensation, inclusion and diversity, and lobbying and political spending.
Implementation of the Fund’s ESG commitment and priorities includes promoting sound ESG practices through active ownership — using the CRF’s voice and votes to address investment risks. The Fund’s active ownership work takes many forms, including voting on nearly 30,000 proxy ballot items annually, engaging directly with portfolio companies, conducting external manager ESG due diligence and risk assessments, and advocating for public policies that will help protect the long-term value of our investments.
Proxy voting at public equity portfolio companies’ meetings is an effective means of engaging and communicating with boards of directors and management about the Fund’s ESG priorities and can be a powerful tool for enhancing long-term value. The Fund’s independent proxy voting is an important fiduciary obligation that is executed pursuant to its ESG Principles and Proxy Voting Guidelines, which are updated biennially. Not only do these principles and guidelines provide direction for our voting decisions, they also guide other corporate engagements and policy initiatives, articulating to the capital markets the Fund’s view of what constitutes good corporate governance and ESG best practices. Voting guidelines can be accessed on the Comptroller’s website at www.osc.state.ny.us/files/common-retirement-fund/corporate-governance/pdf/proxy-voting-guidelines-2020.pdf.
CORPORATE GOVERNANCE

101Investment 2021 Comprehensive Annual Financial Report
Stewardship, in its many forms, can serve to protect and enhance the value of the Fund’s investments. The Fund’s stewardship work utilizes various engagement strategies, including shareholder proposals, written correspondence, investor statements, press strategies and private dialogues. The Fund engaged with over 1,700 portfolio companies, 40 percent of companies in the domestic public equity portfolio, during the 2020-21 fiscal year and this stewardship work resulted in companies providing improved disclosures and taking important actions to enhance ESG policies and practices. A recap of the Fund’s 2020 stewardship work can be accessed on the Comptroller’s website at www.osc.state.ny.us/files/reports/special-topics/pdf/2020-corporate-governance-stewardship-report.pdf.
ESG Integration incorporates ESG factors into the Fund’s analysis of investment risk and manager performance. Risk assessments that evaluate material ESG factors are systematically applied across all asset classes. Due diligence of external managers includes an assessment of their ESG policies, and in the last year those assessments have been customized for each asset class. In addition, annual surveys of and engagements with the Fund’s managers can provide updated information about their ESG policies and practices. The Fund has expanded the staff resources dedicated to the Fund’s ESG integration program to implement its multi-year strategic ESG integration plan.
Public Policy and Advocacy supports policies, laws and regulations that promote the overall stability, transparency and functionality of financial markets and the economy generally, which can improve returns and reduce risks for the Fund. The Fund’s public policy activities take many forms, including meetings and correspondence with elected representatives, regulators and other public officials, testimony at hearings and forums, comments on regulatory and legislative proposals, and participation in State, national, and international forums and initiatives.
Climate-Related Financial Disclosures
The purpose of this section is to report on the Fund’s efforts to address climate risk in accordance with the recommendations of the Task Force on Climate-related Financial Disclosures (TCFD), an organization established by the Financial Stability Board of the G2O (a forum convened by 19 leading industrial nations and the European Union) to guide the financial community in its understanding and reporting of climate risks. The Fund supports the TCFD recommendations.
1. Governance
As Trustee, the Comptroller is responsible for the prudent investment of the Fund. The Comptroller believes that climate change presents significant risks to the Fund’s investments, as well as unique investment opportunities. The Fund’s CIO formulates an overall investment strategy for the Comptroller, including climate-related strategy, with the assistance of investment, risk and corporate governance staff, consultants, and external advisory committees. With leadership and direction from the Comptroller, the Fund has established a team to implement its Climate Action Plan, which was published in 2019. This team includes the Chief Investment Officer, investment professionals representing all asset classes, the Corporate Governance unit, the Director of the Sustainable Investment and Climate Solutions Program, and legal, risk, and operations staff. The team is tasked with developing action plans and executing strategies to address climate risks and identify investment opportunities for the Fund. The Fund also calls upon the office’s environmental policy expert to help inform its climate strategies. In fiscal year 2020-21, the Fund expanded the Corporate Governance unit’s dedicated climate staff, and contracted consultants and data providers who can provide unique research and analysis services.
CORPORATE GOVERNANCE CONTINUED

102 Investment 2021 Comprehensive Annual Financial Report
2. Strategy
The Fund recognizes that there are different short-, medium-, and long-term risks posed by climate change. Because the Fund expects to exist in perpetuity, it must consider all of these time horizons. The transition to a low-carbon economy is already underway and accelerating globally; it is likely to affect virtually every investment in the Fund’s broadly diversified portfolio.
The Fund has identified significant short- and medium-term transition risks in developed markets due to implementation of the Paris Agreement, technological advances and changing market demand. In 2015, the Fund released a tailored climate change scenario analysis, produced in partnership with Mercer Consulting, describing transition risks under a variety of scenarios, and in fiscal year 2020-21 laid the groundwork for a value-at-risk analysis that incorporates different carbon pricing scenarios.
The Fund also believes physical risks are significant in all time frames. Extreme weather events are already affecting businesses around the world and pose a growing threat to the Fund’s investments. Measuring these risks is challenging due to difficulties in accurately projecting weather events at the local level, but the Fund expects that better climate, weather and financial modeling will allow for improved assessments in the near term. The Fund expects to see greater physical risks in the long run if the world fails to limit temperature rise.
3. Risk Management
The 2019 Climate Action Plan provides a framework for the Fund to formally integrate climate considerations into risk assessments, investment decision making, engagements, and public policy advocacy. The Fund’s staff reviews studies to stay informed about the science associated with climate change, and actively seeks to identify advanced climate risk assessments to inform investment strategies.
Pursuant to the Climate Action Plan, the Fund established an assessment framework and minimum standards to evaluate 27 thermal coal mining companies, which resulted in the May 2020 divestment of 22 coal companies that could not demonstrate readiness for the transition to the low carbon economy. In the fall of 2020, the Fund established an assessment framework and minimum standards to review nine oil sands companies and committed to assessing the transition readiness of shale oil and gas and integrated oil and gas companies next.
In early 2021, the Fund updated the ESG scorecards it uses to evaluate prospective investments with external managers, incorporating new climate-specific criteria into this key risk assessment tool. The criteria used to evaluate each manager’s climate capabilities include governance, risk assessments, engagements, proxy voting, and climate reporting in line with TCFD recommendations. In addition, the Fund has been engaging with existing mangers regarding these criteria to better understand their approach to addressing climate risks, investing in climate opportunities, and aligning with the goals of the Paris agreement. The Fund also continues to utilize the Global Real Estate Sustainability Benchmark (GRESB) to measure the sustainability performance of the Fund’s real estate and infrastructure assets in areas such as energy, greenhouse gas and water.
The Sustainable Investment and Climate Solutions (SICS) Program is a key component of the Fund’s plan to position its portfolio for a low-carbon economy. To date, the Fund has committed more than $11 billion toward its total $20 billion goal to specific investment opportunities in the SICS Program across all asset classes, including actively and passively managed public equity strategies, green bonds, clean and green infrastructure funds, and private equity, as well as green building real estate funds.
CORPORATE GOVERNANCE CONTINUED

103Investment 2021 Comprehensive Annual Financial Report
The Fund has undertaken significant corporate engagement as described in its annual Corporate Governance Stewardship Report. This includes filing over 150 climate-change-related shareholder resolutions since 2008 and reaching more than 70 agreements with portfolio companies on climate issues such as setting greenhouse gas (GHG) emissions reduction targets and renewable energy and energy efficiency goals. The Fund continues to engage with high-risk companies directly and in collaboration with other investors through the global Climate Action 100+ initiative. In 2020, the Fund enhanced its proxy voting guidelines by adding criteria on how the Fund reviews low-carbon transition preparedness and delineating situations that would prompt the Fund to withhold support from director nominees for failing to manage climate risks.
Finally, the Fund continues to provide public policy leadership at the international, federal, and state levels on climate change issues that may impact its returns on a variety of issues, including implementation of the Paris Agreement, the Clean Power Plan, tax credits for solar and wind power, low-carbon fuel standards, carbon pricing, the Regional Greenhouse Gas Initiative, and Securities and Exchange Commission requirements for corporate disclosure of material carbon risks.
4. Metrics and Targets
In December 2020, the Fund announced its goal to reduce greenhouse gas emissions from the Fund’s entire portfolio to net-zero by 2040.
The Fund currently uses the following metrics to assess climate risks and opportunities:
• Annual average weighted emissions intensity assessment of public equity holdings (including Scope 1 and 2 greenhouse gas emissions). In 2020, the Fund’s emissions intensity was 16.6 percent lower than its benchmark (72 percent Russell 3000/28 percent MSCI ACWI ex-US). It was 18.3 percent lower than its 2019 intensity. The Fund believes that this metric is useful in assessing transition risks, especially regulatory risks, but does not capture trends over time or the future direction of companies. The Fund also recognizes the significance of Scope 3 emissions as a risk metric in investment analyses but faces challenges in assessing these emissions due to the limited availability of accurate data.
• Portfolio exposure to assets that are significantly affected by climate change and the low-carbon transition as recommended by the TCFD.
• Capital allocation to the SICS Program. The Fund has committed $20 billion in total to the SICS Program and has deployed more than $11 billion toward that goal to date.
• Transition assessment and minimum standards to evaluate companies in the high impact sectors recommended by the TCFD. The Fund has established the transition framework and minimum standards for the thermal coal industry to evaluate companies’ transition readiness.
CORPORATE GOVERNANCE CONTINUED

104 Investment 2021 Comprehensive Annual Financial Report
INVESTMENT RESULTS
Based on Fair Market Values as of March 31, 2021.
Annualized Rate of Return(1)
1 Year 3 Years 5 Years 10 Years
Total Fund 33.55% 11.00% 11.17% 9.19%
Public Equity 60.07 14.61 15.17 11.55
MSCI All Country World Index 54.60 12.07 13.21 9.14
Private Equity(2) 23.83 14.96 14.22 12.66
Cambridge U.S. Private Equity Index (1Q Lag)(3) 22.93 15.54 15.59 14.07
Real Estate(2) 2.19 3.86 6.24 10.12
Real Estate Benchmark(4) 1.11 4.31 5.56 8.82
Credit(2) 20.38 6.23 6.93 –
Credit Suisse Leveraged Loan Index + 2.5% 23.74 6.73 7.93 –
Opportunistic/Absolute Return Strategy Funds (O/ARS)(2) 19.69 5.57 6.16 3.45
CRF Actuarial Return + 2% 8.80 8.80 8.88 9.14
Real Assets(2) 7.34 7.53 8.90 –
U.S. CPI + 5% 7.86 7.12 7.35 –
Fixed Income(2) 2.61 4.72 3.67 3.64
Bloomberg Barclays Aggregate Bond Index 0.71 4.65 3.10 3.44
Short-Term Investments 0.51 1.83 1.61 1.04
(1) Investment return calculations were prepared by the Custodian using a time-weighted rate of return. These figures are for investment management purposes and may not agree with audited statements. Due to reporting timing differences, actual results may differ from reported results.
(2) Generally, Private Equity, Real Estate and Real Assets are reported on a three-month lag (adjusted by cash flows); Opportunistic Funds and Absolute Return Strategy are reported on a one-month lag (adjusted by cash flows). Alternative asset classes and non-core fixed income are generally reported net of fees.
(3) The vendor’s official results are presented as annualized Internal Rate of Return (IRRs). However, the Custodian reports the vendor’s index as quarterly delinked returns on a three-month lag. This time-weighted and lagged methodology is most comparable to the Custodian returns for the Private Equity composite.
(4) Effective April 1, 2019, the Real Estate benchmark is an asset-weighted blend of quarter lagged benchmarks. Core Real Estate is proxied to the NCREIF NFI ODCE (Net) Index. Non-Core Real Estate is proxied to the same index with a 100 basis point annual premium. The Real Estate benchmark returns prior to April 1, 2019 follow the NCREIF Property (Gross) Index on a one-quarter lag.

105Investment 2021 Comprehensive Annual Financial Report
INVESTMENT SUMMARY
The following table summarizes the fair values of Fund investments by asset type for March 31, 2021 and 2020. (Dollars in Thousands)
Asset TypeFair Value
March 31, 2021Percentage of
Total Fair ValueFair Value
March 31, 2020Percentage of
Total Fair Value
Domestic Equity $ 90,263,828 35.0% $ 62,548,268 32.2%
Global Fixed Income 47,722,955 18.5 45,410,315 23.4
International Equity 43,480,400 16.9 30,673,634 15.8
Private Equity 29,470,165 11.4 20,314,177 10.5
Real Estate 17,647,993 6.8 15,693,661 8.0
Short-Term Investments 11,082,651 4.3 5,697,690 2.9
Opportunistic/ARS 5,016,078 1.9 9,881,892 5.1
Real Assets 3,929,594 1.5 3,085,682 1.6
Mortgage Loans 1,043,621 0.4 1,011,844 0.5
Credit 8,478,516 3.3 - -
Total Investments $ 258,135,801 100.0% $ 194,317,163 100.0%
Note: This table reflects percentages derived from financial statement figures and may differ slightly from the asset allocation figures because certain investments have been reclassified.

106 Investment 2021 Comprehensive Annual Financial Report
ASSETALLOCATION—MARCH31,2021
The Fund diversifies its assets among various classes including domestic and international equity, fixed income, private equity, real estate, opportunistic and absolute return strategy funds, credit and real assets.
Asset liability studies, conducted periodically with help from an investment consultant, identify the optimal mix of assets to meet the growth requirements of pension obligations while controlling risk as measured by return volatility. In the fiscal year ended March 31, 2020, the Fund conducted an asset liability analysis and adopted a Long-Term Policy Allocation which was implemented on April 1, 2020.
The Fund has formal rebalancing guidelines which ensure a disciplined process for meeting asset allocation goals, as well as allocation ranges for individual asset classes which minimize unnecessary turnover.
Asset Type Allocation as of March 31, 2021 Long-Term Policy Allocation
Equity
Domestic Equity 36.79% 32.0%
International Equity 16.03 15.0
Alternative Assets
Private Equity 10.57% 10.0%
Real Estate 6.75 9.0
Opportunistic/Absolute Return Strategy 1.97 3.0
Credit 3.26 4.0
Real Assets 1.49 3.0
Fixed Income 20.82% 23.0%
Cash 2.32% 1.0%
Note: A detailed listing of the New York State and Local Retirement System’s assets as of March 31, 2021, is on our website at www.osc.state.ny.us.

107Investment 2021 Comprehensive Annual Financial Report
PUBLIC EQUITY PERFORMANCE
For the Fiscal Year Ending March 31, 2021.
Total Assets (Dollars in Millions)
Annualized Rate of ReturnPortfolio
Since InceptionBenchmark
Since Inception*Inception
Date1 Year 3 Years 5 Years 10 Years
Total Public Equity $ 134,634.6 60.07% 14.61% 15.17% 11.55%
MSCI All Country World Index 54.60% 12.07% 13.21% 9.14%
Total Large Cap Composite $ 63,163.2 56.20% 17.84% 17.06% 14.24% 11.81% 11.83% 2/1/83
CRF Large Cap Index Fund 46,829.2 56.05 18.28 17.40 14.42 12.15 12.12 8/1/78
CRF High Efficiency Defensive Index Fund 4,572.3 48.28 17.36 16.11 – 16.20 16.06 1/1/16
CRF Low Emission Index Fund 6,761.6 60.13 17.73 16.76 – 16.11 16.22 1/1/16
AQR Capital Management 3,504.2 56.03 – – – 12.85 17.23 6/1/18
Eagle Capital Management 1,495.8 68.29 17.46 18.05 – 13.93 13.19 9/1/14
Russell Top 200 (S&P 500 To 1/1/16) 56.30% 18.30% 17.42% 14.39%
Russell 1000 Index 60.59% 17.31% 16.66% 13.97%
Total Mid Cap Composite $ 11,513.6 74.11% 14.58% 14.55% 11.70% 12.00% 12.54% 7/1/91
CRF Midcap Index Fund 9,969.5 73.08 14.66 14.61 11.99 12.22 12.23 11/1/91
Fiera Capital 837.6 100.12 21.40 21.06 15.11 14.31 12.95 3/1/08
Iridian Asset Management 619.8 80.22 10.35 11.33 – 8.82 11.79 1/8/15
RockCreek Midcap 86.7 56.18 – – – 56.18 73.64 4/1/20
Russell Midcap (S&P 400 Midcap To 1/1/16) 73.64% 14.73% 14.67% 11.90%
Total Small Cap Composite $ 9,015.7 86.73% 17.16% 18.50% 13.30% 11.38% 10.70% 7/1/91
CRF Small Cap Index Fund 2,513.8 94.39 14.76 16.23 12.50 10.18 10.08 10/1/05
Artisan Partners 1,015.7 82.49 28.44 27.31 – 18.59 13.49 8/26/13
Brown Capital Management 1,844.9 62.02 19.69 22.94 17.64 15.98 9.92 9/1/94
Channing Capital Management 395.5 104.29 12.92 14.60 – 10.27 9.70 4/1/15
EARNEST Partners 1,552.4 85.23 14.03 16.26 12.93 11.33 9.23 6/1/01
Leading Edge Investment Advisors 679.2 106.04 18.85 18.70 – 13.42 11.53 4/1/15
Palisade Capital Management 426.0 84.46 – – – 13.47 12.97 6/1/18
PENN Capital Management 588.2 139.77 17.57 18.28 – 10.26 11.48 9/27/13
Russell 2000 Index 94.85% 14.76% 16.35% 11.68%
Total Long-Only Alpha Composite $ 1,818.4 54.32% 13.50% 11.69% – 13.21% 7.81% 9/1/11
Trian Partners Strategic Investment Fund-N, LP 1,049.6 46.01 14.46 10.53 – 10.01 6.89 2/1/15
ValueAct Capital Partners II, LP 768.8 66.85 13.31 13.23 – 13.61 7.81 9/1/11
HFRI Event Driven Activist Index 64.76% 8.80% 8.28% –
Total Domestic Transition Accounts $ 100.8
* Benchmarks for all accounts will vary according to mandate.

108 Investment 2021 Comprehensive Annual Financial Report
For the Fiscal Year Ending March 31, 2021.
Total Assets (Dollars in Millions)
Annualized Rate of Return Portfolio Since
Inception
Benchmark Since
Inception*
Inception Date1 Year 3 Years 5 Years 10 Years
Total Non U.S. Equity Composite $ 34,754.3 54.57% 8.42% 11.42% 6.13% 6.52% 5.60% 10/1/89
MSCI ACWI Ex U.S. IMI (MSCI ACWI Ex U.S. to 1/1/17) 51.94% 6.51% 9.98% 5.27%
Total Non U.S. Passive Composite $ 11,775.4 52.27% 7.04% 10.17% 5.21% 6.64% 6.40% 11/1/04
BlackRock ACWI Ex U.S. IMI 11,775.4 52.27 6.89 10.20 5.27 6.68 6.40 11/1/04
Total Active ACWI Ex U.S. Composite $ 9,108.8 58.30% 11.80% 14.27% 7.87% 8.24% 6.36% 11/1/04
Acadian Asset Management 2,142.8 55.49 7.12 12.29 7.39 7.96 6.36 11/1/04
Ariel Investments 341.2 26.10 – – – 7.41 12.91 11/1/18
Baillie Gifford 3,199.5 67.68 15.03 15.16 10.24 7.55 4.80 2/1/99
GQG Partners 700.1 39.85 13.48 – – 13.48 6.51 4/1/18
LSV Asset Management 673.9 – – – – 35.02 31.83 10/1/20
Wellington Management 2,051.3 55.55 12.47 15.24 – 16.23 13.44 3/1/16
MSCI ACWI Ex U.S. 49.41% 6.51% 9.76% 4.93%
Total EAFE Composite $ 7,248.5 49.17% 8.64% 10.72% 6.84% 6.47% 4.82% 10/1/89
Capital Group 2,423.5 52.82 13.37 14.17 8.53 8.11 4.96 9/1/89
Fiera International 635.6 45.81 – – – 18.15 10.83 10/30/19
Mondrian Investment Partners 1,906.8 39.48 3.76 6.66 5.21 6.58 5.22 1/1/98
Xponance 1,127.6 – – – – 5.74 4.59 2/1/21
Total EAFE Small Cap Composite $ 1,153.0 61.38% – – – 8.47% 7.53% 7/1/18
Acadian Asset Management 386.6 73.31 – – – 10.59 7.53 7/1/18
Barings International 371.1 52.71 – – – 7.14 7.51 8/1/18
Global Alpha Capital Management 395.3 59.12 8.30 13.30 – 12.41 8.20 10/1/13
MSCI EAFE Index 44.57% 6.02% 8.85% 5.52%
Total Emerging Markets Composite $ 5,315.8 57.62% 6.44% 12.22% 4.01% 8.67% 7.73% 1/1/92
Genesis Investment Management 1,055.7 59.73 8.90 13.29 – 6.70 4.70 3/1/12
Martin Currie 726.7 65.92 – – – 28.87 22.88 10/8/19
Morgan Stanley 1,404.3 60.28 5.52 11.00 4.68 7.63 6.43 11/1/93
Quantitative Management Associates 1,020.4 58.34 4.55 11.19 – 5.56 5.29 2/1/12
RockCreek Group 781.2 42.90 7.37 14.96 – 6.11 6.54 10/18/13
Wellington Management 327.5 – – – – 7.47 2.70 1/1/21
MSCI Emerging Markets Index 58.39% 6.48% 12.07% 3.65%
Cevian Capital II, LP $ 1,305.9 74.10% 9.97% 11.00% – 10.49% 7.81% 9/1/11
HFRI Event Driven Activist Index 64.76% 8.80% 8.28% –
Total Global Equity Composite $ 14,268.2 64.58% 14.29% 15.47% 11.34% 9.23% 7.91% 9/1/94
CRF FTSE Environmental Technology 50 $ 276.3 120.64% 27.89% 20.91% 10.38% 10.00% 10.19% 11/1/09
Brandes Investment Partners 1,660.7 62.25 8.03 10.02 8.00 7.12 5.73 11/1/99
Generation Investment Management 2,360.8 72.96 20.28 21.84 16.41 18.99 12.89 4/8/09
Goldman Sachs Asset Management 3,920.4 58.05 14.80 15.56 – 12.29 10.33 1/1/15
RockCreek Global 840.5 63.32 – – – 63.32 54.60 4/1/20
Rockefeller & Company Asset Management 530.7 57.80 12.01 13.72 – 10.11 9.57 2/23/15
T. Rowe Price 2,603.1 84.90 25.15 24.98 16.39 16.34 9.64 3/1/11
Templeton Investments 2,074.2 48.53 5.32 8.74 7.87 7.78 9.64 3/1/11
MSCI All Country World Index 54.60% 12.07% 13.21% 9.14%
Global Transition Account $ 0.4
* Benchmarks for all accounts will vary according to mandate. Composite market values include transition accounts and accrued management fees.
PUBLIC EQUITY PERFORMANCE CONTINUED

109Investment 2021 Comprehensive Annual Financial Report
For the Fiscal Year Ending March 31, 2021.
Total Assets (Dollars in Millions)
Annualized Rate of Return Portfolio Since
Inception
Benchmark Since
Inception*
Inception Date1 Year 3 Years 5 Years 10 Years
Total RockCreek Midcap Composite $ 86.7 56.18% – – – 56.18% 73.64% 4/1/20
Lisanti Capital 87.1 95.47 26.30% 25.31% – 18.15 14.40 7/1/14
Russell Midcap Index 73.64% 14.73% 14.67% –
Total RockCreek Global Composite $ 840.5 63.32% – – – 63.32% 54.60% 4/1/20
ARGA Investment Management 132.3 93.84 13.98% – – 13.83 12.60 5/1/17
Ativo Capital Management 123.4 49.98 13.23 – – 14.17 12.88 5/1/17
Bell Asset Management 110.4 48.43 15.40 – – 14.79 12.88 5/1/17
QTRON Investments 109.3 56.94 – – – 18.53 17.76 5/22/19
Strategic Global Advisors 212.2 49.39 10.02 – – 11.35 12.88 5/1/17
Trinity Alps Capital 154.1 95.69 – – – 28.67 20.14 1/8/19
MSCI All Country World Index 54.60% 12.07% – –
Total Xponance EAFE Composite $ 1,127.6 – – – – 5.74% 4.59% 2/1/21
Applied Research Investments 171.4 – – – – (1.59) 4.59 2/1/21
ARGA Investment Mgmt. 166.8 80.41% – – – 29.68 13.27 8/5/19
Foresight Global Investors 112.1 – – – – 5.01 4.59 2/1/21
Frontier Global 195.0 60.97 – – – 23.85 13.36 8/5/19
Martin Investment Management 164.9 – – – – 3.79 4.59 2/1/21
Osmosis 202.4 44.63 4.10% 8.84% – 7.55 6.95 11/1/15
Trinity Alps 116.1 – – – – 8.51 4.59 2/1/21
MSCI EAFE Index 44.57% 6.02% 8.85% –
Total Leading Edge Investment Advisors Composite $ 679.2 106.04% 18.85% 18.70% – 13.42% 11.53% 4/1/15
Altravue Capital 63.7 – – – – 46.96 62.86 7/29/20
Bridge City Capital 67.7 84.64 – – – 40.82 33.98 2/28/20
Denali Advisors 82.7 97.34 – – – 26.04 24.70 8/28/19
Granahan Investment Management 141.7 125.10 36.67 – – 36.14 16.47 9/29/17
Granite Investment Partners 106.5 105.33 22.04 21.58 – 15.49 11.53 4/1/15
Nicholas Investment Partners 64.7 120.43 27.67 25.76 – 17.01 12.89 4/1/15
Palisades Investment Partners 74.7 123.65 25.53 22.47 – 17.00 11.53 4/1/15
Phocas Financial Corporation 78.4 101.34 10.48 12.56 – 9.12 9.70 4/1/15
Russell 2000 Index 94.85% 14.76% 16.35% –
Total GSAM Composite $ 3,920.4 58.05% 14.80% 15.56% – 12.29% 10.33% 1/1/15
GSAM AIMS Global Account Cayuga 529.0 59.87 19.41 19.79 – 16.80 9.80 12/23/14
GSAM AIMS Global Account Iroquois 460.0 73.83 18.70 20.27 – 15.48 9.61 11/20/14
GSAM AIMS Global Account Mohawk 389.6 83.25 10.69 11.63 – 7.31 9.70 11/26/14
GSAM AIMS Global Account Mohican 447.1 42.03 11.35 – – 11.91 12.93 7/22/16
GSAM AIMS Global Account Onondaga 593.1 46.52 16.09 15.97 – 13.55 10.76 12/17/14
GSAM AIMS Global Account Seneca 491.5 31.52 14.41 14.10 – 12.26 10.49 1/30/15
GSAM AIMS Global Account Shinnecock 515.3 72.56 – – – 29.47 19.85 10/21/19
GSAM AIMS Global Account Tuscarora 494.9 74.77 10.55 12.94 – 9.91 10.12 12/22/14
MSCI World Index 54.03% 12.81% 13.36% –
* Benchmarks for all accounts will vary according to mandate. Composite market values include transition accounts and accrued management fees.
PUBLIC EQUITY FUND OF FUND PERFORMANCE
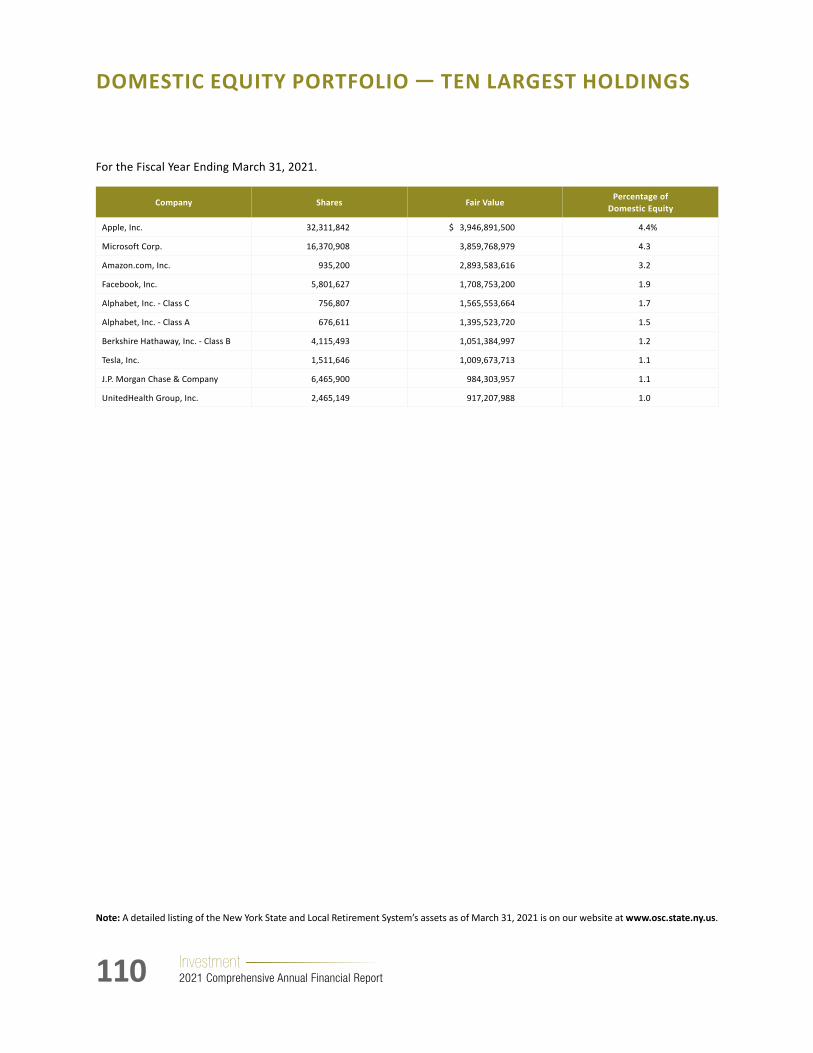
110 Investment 2021 Comprehensive Annual Financial Report
DOMESTICEQUITYPORTFOLIO—TENLARGESTHOLDINGS
For the Fiscal Year Ending March 31, 2021.
Company Shares Fair ValuePercentage of
Domestic Equity
Apple, Inc. 32,311,842 $ 3,946,891,500 4.4%
Microsoft Corp. 16,370,908 3,859,768,979 4.3
Amazon.com, Inc. 935,200 2,893,583,616 3.2
Facebook, Inc. 5,801,627 1,708,753,200 1.9
Alphabet, Inc. - Class C 756,807 1,565,553,664 1.7
Alphabet, Inc. - Class A 676,611 1,395,523,720 1.5
Berkshire Hathaway, Inc. - Class B 4,115,493 1,051,384,997 1.2
Tesla, Inc. 1,511,646 1,009,673,713 1.1
J.P. Morgan Chase & Company 6,465,900 984,303,957 1.1
UnitedHealth Group, Inc. 2,465,149 917,207,988 1.0
Note: A detailed listing of the New York State and Local Retirement System’s assets as of March 31, 2021 is on our website at www.osc.state.ny.us.
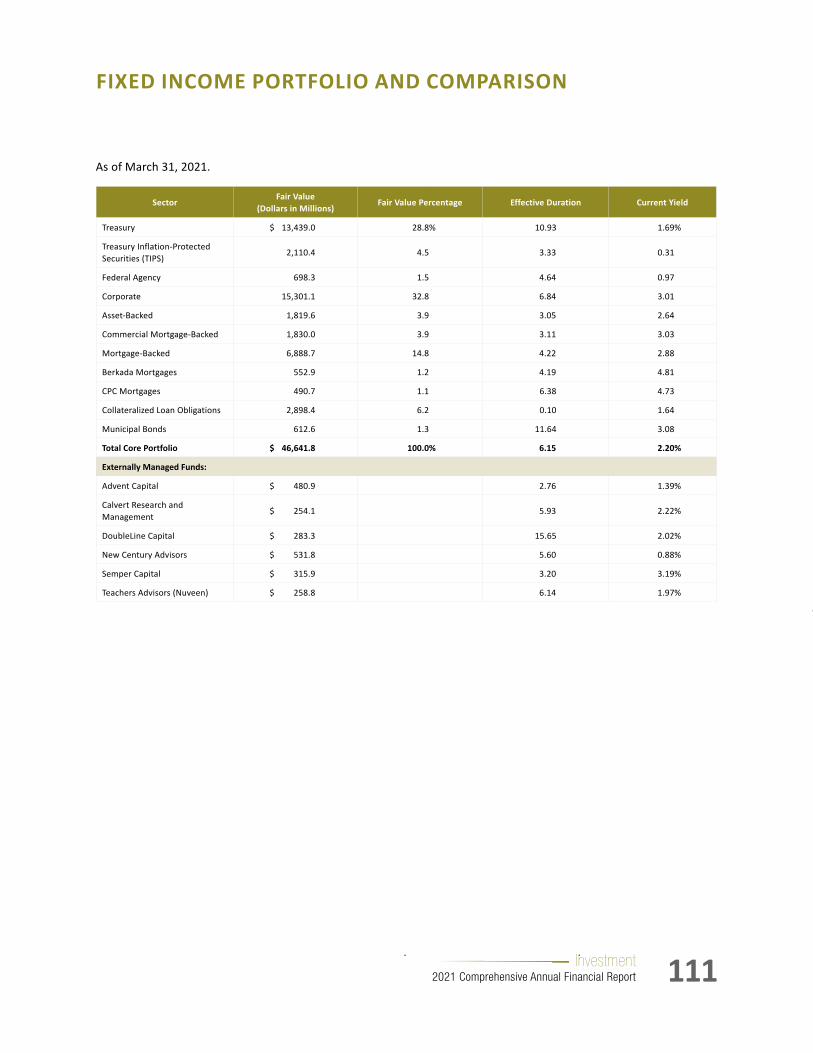
111Investment 2021 Comprehensive Annual Financial Report
FIXED INCOME PORTFOLIO AND COMPARISON
As of March 31, 2021.
SectorFair Value
(Dollars in Millions)Fair Value Percentage Effective Duration Current Yield
Treasury $ 13,439.0 28.8% 10.93 1.69%
Treasury Inflation-Protected Securities (TIPS)
2,110.4 4.5 3.33 0.31
Federal Agency 698.3 1.5 4.64 0.97
Corporate 15,301.1 32.8 6.84 3.01
Asset-Backed 1,819.6 3.9 3.05 2.64
Commercial Mortgage-Backed 1,830.0 3.9 3.11 3.03
Mortgage-Backed 6,888.7 14.8 4.22 2.88
Berkada Mortgages 552.9 1.2 4.19 4.81
CPC Mortgages 490.7 1.1 6.38 4.73
Collateralized Loan Obligations 2,898.4 6.2 0.10 1.64
Municipal Bonds 612.6 1.3 11.64 3.08
Total Core Portfolio $ 46,641.8 100.0% 6.15 2.20%
Externally Managed Funds:
Advent Capital $ 480.9 2.76 1.39%
Calvert Research and Management
$ 254.1 5.93 2.22%
DoubleLine Capital $ 283.3 15.65 2.02%
New Century Advisors $ 531.8 5.60 0.88%
Semper Capital $ 315.9 3.20 3.19%
Teachers Advisors (Nuveen) $ 258.8 6.14 1.97%

112 Investment 2021 Comprehensive Annual Financial Report
FIXED INCOME PERFORMANCE
As of March 31, 2021.
Annualized Rate of Return
1 Year 3 Years 5 Years
Common Retirement Fund — Internal Core 2.32% 4.67% 3.64%
Treasuries (8.81 ) 3.87 1.82
Treasury Inflation-Protected Securities (TIPS) 5.70 N/A N/A
Agencies (0.73 ) 2.85 1.85
Corporate Bonds 9.52 6.31 5.18
Municipal Bonds 4.93 6.04 5.30
Asset-Backed 13.78 3.56 3.12
Commercial Mortgage-Backed 8.36 5.05 3.48
Mortgage-Backed 1.26 3.78 2.73
Collateralized Loan Obligations 13.12 3.14 4.11
Bloomberg Barclays U.S. Aggregate Bond Index 0.71% 4.65% 3.10%
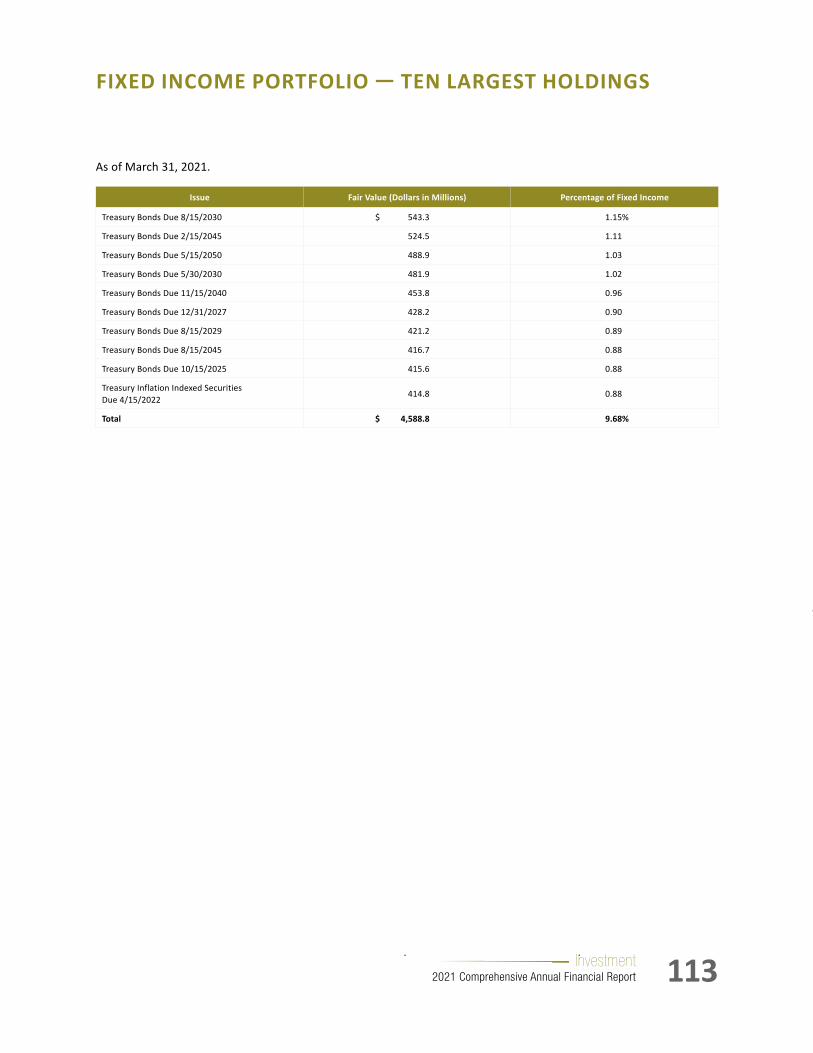
113Investment 2021 Comprehensive Annual Financial Report
FIXEDINCOMEPORTFOLIO—TENLARGESTHOLDINGS
As of March 31, 2021.
Issue Fair Value (Dollars in Millions) Percentage of Fixed Income
Treasury Bonds Due 8/15/2030 $ 543.3 1.15%
Treasury Bonds Due 2/15/2045 524.5 1.11
Treasury Bonds Due 5/15/2050 488.9 1.03
Treasury Bonds Due 5/30/2030 481.9 1.02
Treasury Bonds Due 11/15/2040 453.8 0.96
Treasury Bonds Due 12/31/2027 428.2 0.90
Treasury Bonds Due 8/15/2029 421.2 0.89
Treasury Bonds Due 8/15/2045 416.7 0.88
Treasury Bonds Due 10/15/2025 415.6 0.88
Treasury Inflation Indexed Securities Due 4/15/2022
414.8 0.88
Total $ 4,588.8 9.68%

114 Investment 2021 Comprehensive Annual Financial Report
REAL ESTATE PORTFOLIO
As of March 31, 2021.
Equity Amount* Percentage Mortgage Amount* Percentage
Property Diversification
Industrial/R&D $ 4,105,863,258 23.3% $ – 0.0%
Land for Development 42,115,706 0.2 - 0.0
Lodging 426,480,987 2.4 - 0.0
Office 4,772,822,481 27.1 93,585,779 9.0
Other* 3,135,331,062 17.9 - 0.0
Residential 2,139,259,460 12.2 490,748,578 47.0
Retail 2,969,537,396 16.9 459,286,707 44.0
Total $ 17,591,410,351 100.0% $ 1,043,621,064 100.0%
Regional Diversification
Northeast $ 3,440,951,824 19.6% $ 1,043,621,064 100.0%
Mideast 1,290,147,614 7.3 – 0.0
Southeast 1,166,742,386 6.6 – 0.0
Southwest 1,581,077,097 9.0 – 0.0
Midwest 929,392,618 5.3 – 0.0
Mountain 445,022,846 2.5 – 0.0
Pacific 4,597,563,026 26.1 – 0.0
Non-U.S. 4,140,512,939 23.6 – 0.0
Total $ 17,591,410,351 100.0% $ 1,043,621,064 100.0%
Note: Equity and mortgage amounts are based on the fair value of the Fund’s full real estate portfolio.
* Other includes alternative property types (e.g., self storage, medical offices, data centers, student housing).
These figures may not agree with the audited statements due to timing and classification differences made for investment management purposes.
OPPORTUNISTIC REAL ESTATE
Number of Active Partnerships
Capital Committed (Dollars in Millions)
Capital Contributed (Dollars in Millions)
Current Fair Value (Dollars in Millions)
Cumulative Distributions
(Dollars in Millions)
Total Value / Exposure (Dollars in Millions)
91 $20,700.5 $ 13,802.9 $ 6,641.2 $ 11,273.7 $ 17,914.9
These figures may not agree with the audited statements due to timing and classification differences made for investment management purposes.

115Investment 2021 Comprehensive Annual Financial Report
ALTERNATIVE INVESTMENTS SUMMARY
As of March 31, 2021.
Number of Partnerships
Capital Committed
Capital Contributed
Fair Value
Cumulative Distributions
Total Value
Private Equity Funds
Corporate Finance/Buyout 153 $ 31,616,510,720 $ 25,778,125,276 $ 15,844,926,357 $ 25,713,553,067 $ 41,558,479,424
Co-Investment 26 5,321,582,009 3,180,450,628 2,593,595,509 2,166,257,453 4,759,852,962
Distressed/Turnaround 12 1,836,741,999 1,678,111,359 769,689,118 1,556,559,933 2,326,249,051
Fund of Funds 40 8,166,153,808 7,838,722,242 2,184,751,471 8,859,315,734 11,044,067,205
Growth Equity 40 6,286,986,340 5,499,569,969 4,266,596,053 4,725,705,461 8,992,301,514
Special Situations 28 5,219,717,159 4,568,442,299 2,129,247,481 3,723,324,537 5,852,572,018
Venture Capital 31 1,277,798,060 1,147,160,840 1,619,374,797 657,009,702 2,276,384,499
Other N/A N/A 61,984,590 61,984,590 N/A 61,984,590
Total Private Equity* 330 $ 59,725,490,095 $ 49,752,567,203 $ 29,470,165,376 $ 47,401,725,887 $ 76,871,891,263
Opportunistic/Absolute Return Strategy Funds (ARS)
Opportunistic Funds 18 $ 3,427,000,000 $ 2,120,281,027 $ 1,187,929,552 $ 1,573,706,790 $ 2,761,636,342
ARS Funds
Equity Long-Short 3 N/A N/A 454,093,684 N/A 454,093,684
Event and Merger 1 N/A N/A 63,501,487 N/A 63,501,487
Event Driven 11 N/A N/A 1,039,599,001 N/A 1,039,599,001
Fund of Funds 2 N/A N/A 116,172,453 N/A 116,172,453
Relative Value 2 N/A N/A 403,393,080 N/A 403,393,080
Structured Credit 3 N/A N/A 589,698,941 N/A 589,698,941
Tactical Trading 4 N/A N/A 1,161,690,321 N/A 1,161,690,320
Total ARS Funds 26 N/A N/A 3,828,148,967 N/A 3,828,148,967
Total Opportunistic/ Absolute Return Strategy
44 $ 3,427,000,000 $ 2,120,281,027 $ 5,016,078,519 $ 1,573,706,790 $ 6,589,785,309
Real Assets Funds 36 $ 9,751,375,000 $ 3,792,875,099 $ 3,929,593,932 $ 712,342,280 $ 4,641,936,212
Credit Funds 31 $ 10,286,974,386 $ 8,057,459,404 $ 8,478,516,272 $ 1,929,237,083 $ 10,407,753,355
*The total figures include the Fund’s private equity investments and other investments through Pursuit.

116 Investment 2021 Comprehensive Annual Financial Report
PUBLIC EQUITY MANAGEMENT FEES
For the Fiscal Year Ended March 31, 2021.
Manager Management Fees Incentive Fees Total
Acadian Asset Management, LLC $ 7,766,963 $ – $ 7,766,963
AQR Capital Management, LLC 3,195,102 – 3,195,102
Ariel Investments, LLC 1,624,639 – 1,624,639
Artisan Partners, LP 7,511,170 – 7,511,170
Baillie Gifford Overseas, Ltd. 7,515,216 – 7,515,216
Baring International Investment, Ltd. 1,963,915 – 1,963,915
BlackRock Institutional Trust Company, NA 4,555,351 – 4,555,351
Brandes Investment Partners, LP 3,190,889 – 3,190,889
Brown Capital Management, Inc. 13,260,412 – 13,260,412
Capital Guardian Trust Company 2,874,934 10,943,554 13,818,488
Cevian Capital, LLP 9,393,164 – 9,393,164
Channing Capital Management, LLC 1,054,601 – 1,054,601
Consilium Frontier Equity Fund, LP 124,216 – 124,216
Eagle Capital Management, LLC 7,934,754 – 7,934,754
EARNEST Partners, LLC 4,497,887 – 4,497,887
Fiera Capital, Inc. 7,106,702 – 7,106,702
Generation Investment Management, LLP 15,200,064 21,292,574 36,492,638
Genesis Investment Management, LLP 5,030,427 – 5,030,427
Global Alpha Capital Management, Ltd. 2,163,146 – 2,163,146
Goldman Sachs Asset Management 1,276,324 – 1,276,324
Goldman Sachs Asset Management * 20,808,288 3,361,699 24,169,987
GQG Partners, LLC 3,203,538 – 3,203,538
Iridian Asset Management, LLC 2,062,958 – 2,062,958
Leading Edge Investment Advisors, LP * 3,971,236 – 3,971,236
LSV Asset Management 1,252,713 – 1,252,713
Martin Currie, Inc. 2,868,657 – 2,868,657
Mondrian Investment Partners, Inc. 5,073,015 – 5,073,015
Morgan Stanley Emerging Markets Fund, Inc. 8,806,101 – 8,806,101
Palisade Capital Management, LLC 1,966,330 – 1,966,330
Penn Capital Management Company, Inc. 2,165,353 – 2,165,353
Progress Investment Management Company * 273,557 – 273,557
Quantitative Management Associates, LLC 2,019,266 – 2,019,266
Rock Creek Group, LP 2,527,391 – 2,527,391
Rock Creek Group, LP * 6,601,000 – 6,601,000
Rockefeller & Company Asset Management 2,814,420 – 2,814,420
Russell Investments Group, LLC 2,499,900 – 2,499,900
T. Rowe Price Associates, Inc. 8,805,358 – 8,805,358
Templeton Investment Counsel, LLC 909,399 – 909,399
Trian Fund Management, LP 6,834,449 (2,293,591) 4,540,858
ValueAct Capital Management, LP 6,446,722 10,026,767 16,473,489
Wellington Management Company, LLP 10,296,793 – 10,296,793
Xponance, Inc. * 4,711,998 – 4,711,998
Total $ 214,158,318 $ 43,331,003 $ 257,489,321
* Represents Fund of Funds relationship and includes sub-manager fee payments.

117Investment 2021 Comprehensive Annual Financial Report
PUBLICEQUITYCOMMISSIONS—INTERNALLYMANAGED
For the Fiscal Year Ended March 31, 2021.
Broker SharesCommission
$ U.S.
Bank of America Corp. 15,831,909 $ 158,319
Barclays Capital, Inc. 16,007,372 165,410
BTIG, LLC 18,519,624 55,511
Citigroup Global Markets, Inc. 15,813,350 158,134
Cowen and Company, LLC 15,645,344 156,453
Goldman Sachs & Company 16,602,471 166,025
Great Pacific Securities, Inc. 21,766,498 217,665
Guzman & Company 21,515,618 215,156
Instinet 15,940,608 159,406
J.P. Morgan Securities, LLC 19,839,753 173,722
Loop Capital Markets, LLC 22,387,563 223,876
Morgan Stanley & Company, Inc. 15,578,521 155,785
Penserra Securities, LLC 22,789,195 227,892
Piper Sandler Companies 15,876,385 158,764
Sanford C. Bernstein & Company, LLC 15,144,003 151,440
Siebert Williams Shank & Company, LLC 21,735,977 217,360
Virtu Americas, LLC 15,716,313 156,868
Total 306,710,504 $ 2,917,786

118 Investment 2021 Comprehensive Annual Financial Report
PUBLICEQUITYCOMMISSIONS— EXTERNALLY MANAGED
Broker SharesCommission
$ U.S.
China International Capital Corp., Ltd. 17,785,344 $ 32,889
CIBC World Markets Corp. 2,863,260 11,283
CIMB Securities 15,071,393 11,106
Citadel Securities Institutional, LLC 49,046 368
Citibank 141,511 1,883
Citigroup Global Markets, Inc. 304,513,658 711,315
CJS Securities, Inc. 273,506 10,035
CLSA, Ltd. 207,762,488 411,477
CM-CIC Market Solutions 37,160 2,379
Collins Stewart, LLC 776,188 24,067
Commerzbank AG 117,713 6,277
Compass Point Research & Trading, LLC 175,962 6,680
Concept Capital Markets, LLC 182,020 4,550
Cornerstone Macro, LLC 556,707 12,111
Cowen and Company, LLC 24,262,842 562,453
Craig-Hallum Capital Group, LLC 410,793 15,972
Credit Suisse Securities, Ltd. 479,551,993 1,061,447
Cuttone & Company, Inc. 39,400 394
D.A. Davidson & Company, Inc. 800,505 17,754
Daiwa Capital Markets America, Inc. 13,797,586 68,388
Danske Bank A/S 688,090 12,331
Davy Securities, Ltd. 338,790 5,035
DNB ASA 650,494 14,384
Dougherty & Company, LLC 15,522 621
Drexel Hamilton, LLC 25,500 446
Dundee Securities Corp. 16,312 67
Edelweiss Securities, Ltd. 634,277 31,069
Electronic Brokerage Systems, LLC 153,220 2,948
Equita SIM S.p.A. 710,972 5,136
Evercore ISI 12,507,409 324,332
Exane S.A. 13,734,295 159,021
FBN Securities, Inc. 8,612 258
FIS Brokerage & Securities Services, LLC 2,453,535 12,268
Gabelli & Company 38,537 1,769
Goldman Sachs & Company 151,846,359 634,140
Goodbody Stockbrokers 1,132,805 14,201
Great Pacific Securities, Inc. 767,300 7,673
For the Fiscal Year Ended March 31, 2021.
Broker SharesCommission
$ U.S.
Abel Noser, LLC 2,505,804 $ 101,919
ABG Sundal Collier ASA 719,208 11,736
Academy Securities, Inc. 10,400 193
Actinver Securities, Inc. 795,500 1,749
Allen & Company, Inc. 1,462 37
Atlantic Equities, LLP 6,006 110
Auerbach Grayson & Company, Inc. 1,360,144 25,356
Aviate Global, LLP 8,654 553
B. Riley FBR, Inc. 545,253 20,099
Baader Bank AG 47,250 2,882
Baird, Robert W. & Company, Inc. 5,295,102 156,910
Banca IMI S.p.A. 129,525 2,328
Banco Bilbao Vizcaya Argentaria S.A. 1,792,411 3,825
Banco Bradesco S.A. 946,226 9,119
Banco BTG Pactual S.A. 96,000 426
Banco Itau Unibanco S.A. 3,916,557 36,672
Banco Santander S.A. 3,168,129 8,370
Bancroft Capital, LLC 1,700 34
Bank of America Corp. 351,606,792 998,249
Bank of New York Mellon Corp. 22,083 431
Barclays Capital, Inc. 12,879,927 225,687
Bay Crest Partners, LLC 2,074,664 36,307
BCS Prime Brokerage, Ltd. 483,222 6,945
Berenberg Bank 6,175,914 119,982
Blair, William & Company 2,556,300 86,240
BMO Capital Markets Corp. 4,026,080 58,531
BNP Paribas Securities Corp. 46,671 2,170
Boenning & Scattergood, Inc. 16,844 674
BTIG, LLC 28,570,432 516,876
C.L. King & Associates, Inc. 1,595,640 54,409
Cabrera Capital Markets, Inc. 1,808,474 38,337
Canaccord Genuity Group, Inc. 633,352 10,734
Canadian Imperial Bank of Commerce 90,346 709
Cantor Fitzgerald & Company 2,897,695 67,365
Capital Institutional Services, Inc. 3,860,951 65,197
Carnegie Investment Bank AB 1,040,120 19,553
CastleOak Securities, LP 886,486 11,880

119Investment 2021 Comprehensive Annual Financial Report
Broker SharesCommission
$ U.S.
Guggenheim Securities, LLC 895,654 $ 27,459
Guzman & Company 1,286,149 2,268
Haitong International Securities Company, Ltd.
76,900 3,070
Helvea S.A. 87,202 4,223
Hilltop Securities, Inc. 13,664 547
HSBC Securities, Inc. 312,421,430 421,808
ICBC International Securities, Ltd. 15,300 2,269
ICICI Brokerage Services Mumbai 7,715 201
India Infoline, Ltd. 752,504 13,736
Instinet 122,519,088 375,854
Intermonte SIM S.p.A. 21,700 1,099
INTL FCStone Financial, Inc. 624,963 4,727
Investec Group 1,009,265 7,230
J & E Davy 487,887 9,820
J.P. Morgan Securities, LLC 348,855,992 1,084,207
Janney Montgomery Scott, Inc. 100,311 3,736
Jefferies & Company, Inc. 113,336,279 761,537
JM Financial Institutional Securities, Ltd. 117,674 1,504
JMP Securities, LLC 810,606 20,338
JNK Securities, Inc. 52,260 1,919
Johnson Rice & Company, LLC 317,260 9,413
JonesTrading Institutional Services, LLC 23,312,161 802,622
Jupiter Securities Sdn Berhad 935,300 881
KB Securities Company, Ltd. 4,683 221
KBC Securities N.V. 2,694 165
Keefe Bruyette & Wood, Inc. 1,858,564 44,503
Kempen & Company N.V. 336,530 2,264
Kepler Cheuvreux S.A. 12,159,430 55,954
KeyBanc Capital Markets, Inc. 1,820,281 63,516
Korea Investment & Securities Company 153,606 7,724
Kotak Securities, Ltd. 545,962 7,282
Liberum Capital, Ltd. 1,306,861 15,619
Liquidnet, Inc. 55,478,110 692,654
Loop Capital Markets, LLC 34,019,893 495,733
Luminex Trading & Analytics, LLC 2,549,132 24,426
M.M. Warburg & Company 20,365 823
Broker SharesCommission
$ U.S.
Macquarie Group, Ltd. 60,599,641 $ 272,558
Mainfirst Bank AG 488,828 10,049
Maxim Group, LLC 12,472,915 142,304
Maybank Kim Eng Holdings, Ltd. 1,799,715 12,725
Mediobanca S.p.A. 457,068 4,291
Mirabaud Securities, LLP 112,646 10,447
Mischler Financial Group, Inc. 1,257,243 17,396
Mitsubishi UFJ Securities Holdings Company, Ltd.
581,300 22,443
Mizuho Securities 99,737,463 540,852
MKM Partners, LLC 1,979,597 37,418
Monness, Crespi, Hardt & Company, Inc. 134,836 5,936
Morgan Stanley & Company, Inc. 518,814,029 1,287,018
Motilal Oswal Financial Services, Ltd. 42,000 3,284
National Bank Financial, Inc. 59,400 881
National Financial Services, LLC 278,932 3,876
Needham & Company, LLC 2,542,670 101,817
NH Investment & Securities Company, Ltd. 11,109 789
Nomura Securities International, Inc. 2,342,362 31,169
Nordea Bank AB 603,691 11,046
North South Capital, LLC 1,048,416 46,823
Northcoast Research Partners, LLC 91,224 3,649
Northern Trust Company 42,254 3,098
Numis Securities, Ltd. 1,694,444 15,515
Oddo Securities Corp. 388,463 10,097
Olivetree Financial, LLC 15,073,760 24,282
O'Neil, William & Company, Inc. 29,589 888
Oppenheimer & Company, Inc. 1,670,649 41,629
Outset Global, LLP 1,912,758 7,686
Panmure Gordon & Company 10,864 24
Pavilion Global Markets, Ltd. 632,200 8,897
Peel Hunt, LLP 5,203,506 6,601
Penserra Securities, LLC 76,438,695 136,084
Pershing, LLC 1,108,381 648
Pickering Energy Partners 48,163 1,927
Pictet 309,120 10,999
Piper Sandler Companies 3,135,074 73,414
PUBLICEQUITYCOMMISSIONS— EXTERNALLY MANAGED CONTINUED
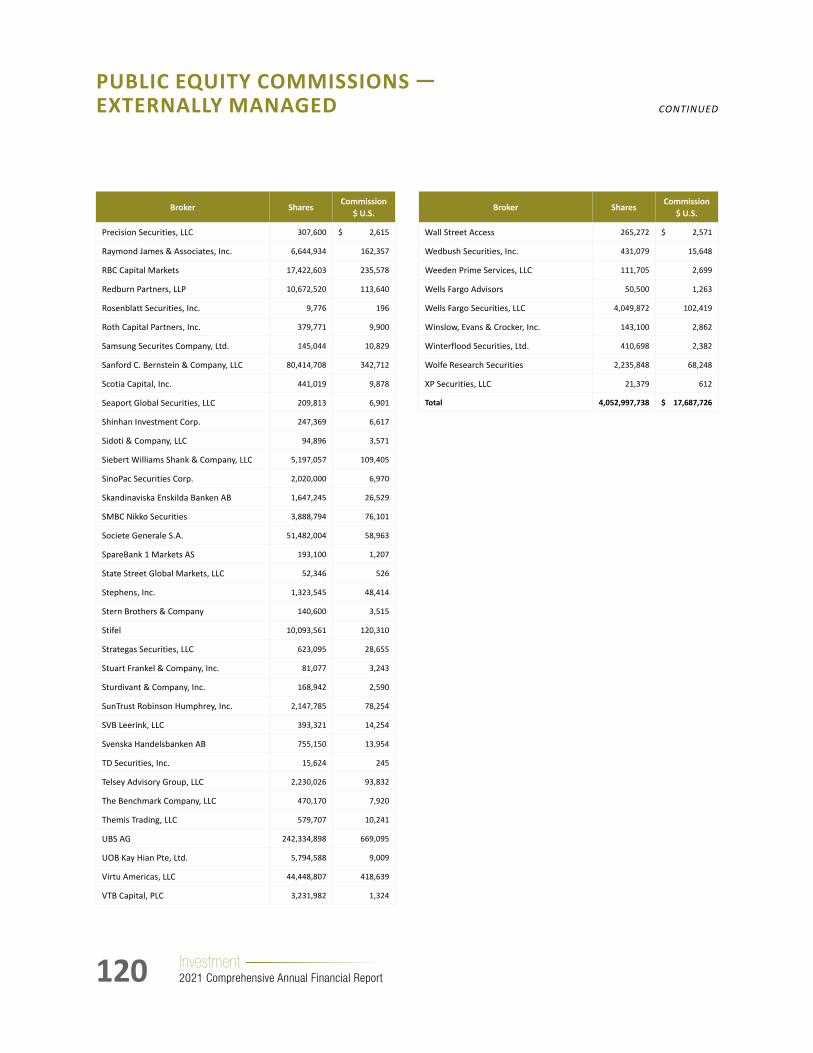
120 Investment 2021 Comprehensive Annual Financial Report
Broker SharesCommission
$ U.S.
Precision Securities, LLC 307,600 $ 2,615
Raymond James & Associates, Inc. 6,644,934 162,357
RBC Capital Markets 17,422,603 235,578
Redburn Partners, LLP 10,672,520 113,640
Rosenblatt Securities, Inc. 9,776 196
Roth Capital Partners, Inc. 379,771 9,900
Samsung Securites Company, Ltd. 145,044 10,829
Sanford C. Bernstein & Company, LLC 80,414,708 342,712
Scotia Capital, Inc. 441,019 9,878
Seaport Global Securities, LLC 209,813 6,901
Shinhan Investment Corp. 247,369 6,617
Sidoti & Company, LLC 94,896 3,571
Siebert Williams Shank & Company, LLC 5,197,057 109,405
SinoPac Securities Corp. 2,020,000 6,970
Skandinaviska Enskilda Banken AB 1,647,245 26,529
SMBC Nikko Securities 3,888,794 76,101
Societe Generale S.A. 51,482,004 58,963
SpareBank 1 Markets AS 193,100 1,207
State Street Global Markets, LLC 52,346 526
Stephens, Inc. 1,323,545 48,414
Stern Brothers & Company 140,600 3,515
Stifel 10,093,561 120,310
Strategas Securities, LLC 623,095 28,655
Stuart Frankel & Company, Inc. 81,077 3,243
Sturdivant & Company, Inc. 168,942 2,590
SunTrust Robinson Humphrey, Inc. 2,147,785 78,254
SVB Leerink, LLC 393,321 14,254
Svenska Handelsbanken AB 755,150 13,954
TD Securities, Inc. 15,624 245
Telsey Advisory Group, LLC 2,230,026 93,832
The Benchmark Company, LLC 470,170 7,920
Themis Trading, LLC 579,707 10,241
UBS AG 242,334,898 669,095
UOB Kay Hian Pte, Ltd. 5,794,588 9,009
Virtu Americas, LLC 44,448,807 418,639
VTB Capital, PLC 3,231,982 1,324
Broker SharesCommission
$ U.S.
Wall Street Access 265,272 $ 2,571
Wedbush Securities, Inc. 431,079 15,648
Weeden Prime Services, LLC 111,705 2,699
Wells Fargo Advisors 50,500 1,263
Wells Fargo Securities, LLC 4,049,872 102,419
Winslow, Evans & Crocker, Inc. 143,100 2,862
Winterflood Securities, Ltd. 410,698 2,382
Wolfe Research Securities 2,235,848 68,248
XP Securities, LLC 21,379 612
Total 4,052,997,738 $ 17,687,726
PUBLICEQUITYCOMMISSIONS— EXTERNALLY MANAGED CONTINUED
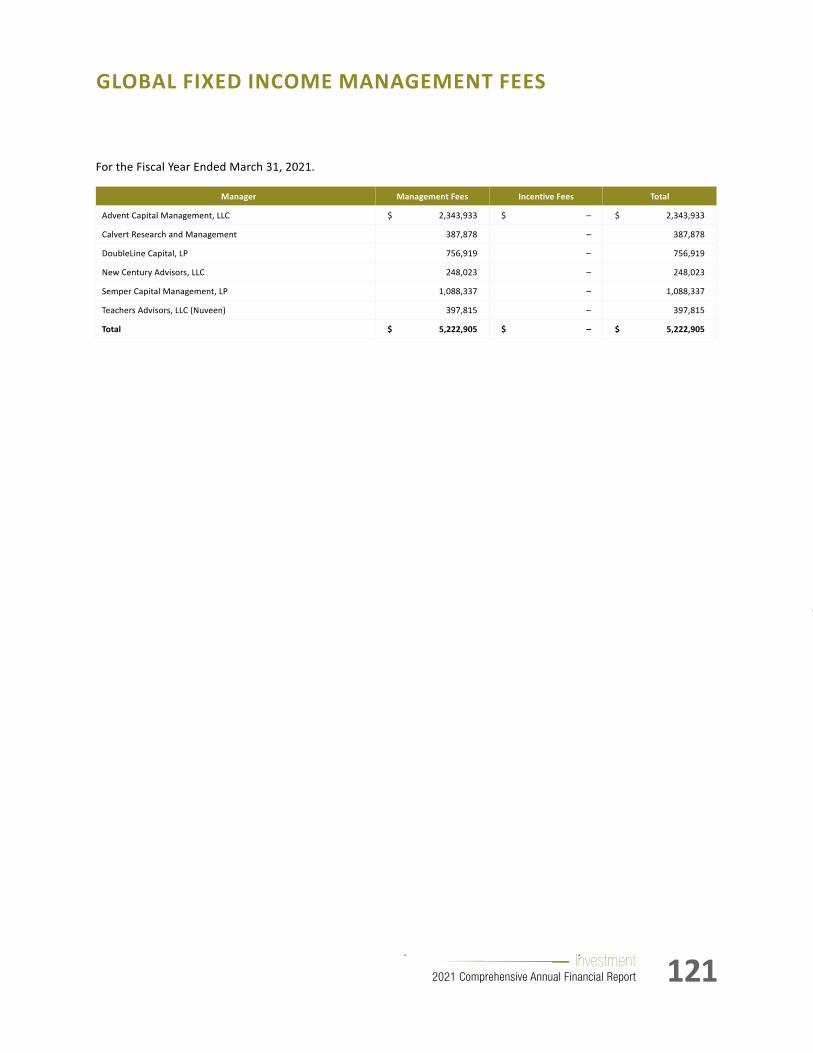
121Investment 2021 Comprehensive Annual Financial Report
For the Fiscal Year Ended March 31, 2021.
Manager Management Fees Incentive Fees Total
Advent Capital Management, LLC $ 2,343,933 $ – $ 2,343,933
Calvert Research and Management 387,878 – 387,878
DoubleLine Capital, LP 756,919 – 756,919
New Century Advisors, LLC 248,023 – 248,023
Semper Capital Management, LP 1,088,337 – 1,088,337
Teachers Advisors, LLC (Nuveen) 397,815 – 397,815
Total $ 5,222,905 $ – $ 5,222,905
GLOBAL FIXED INCOME MANAGEMENT FEES

122 Investment 2021 Comprehensive Annual Financial Report
LONG-TERMDOMESTICBONDTRANSACTIONS— INTERNALLY MANAGED
For the Fiscal Year Ended March 31, 2021.Summarized by Broker or Direct Issuer.
Long-Term Broker Par $ U.S.
Barclays Capital, Inc. $ 778,773,000
BMO Capital Markets Corp. 207,554,128
BofA Securities, Inc. 2,230,352,850
Citigroup Global Markets, Inc. 2,198,781,084
Credit Suisse Securities, Ltd. 611,402,353
Deutsche Bank Securities, Inc. 917,129,000
Development Corp. for Israel 100,000,000
Goldman Sachs & Company 2,190,023,000
Great Pacific Securities, Inc. 2,580,290,000
HSBC Securities, Inc. 447,000,000
J.P. Morgan Securities, LLC 3,964,487,200
Jefferies & Company, Inc. 596,838,000
Mischler Financial Group, Inc. 673,025,000
Morgan Stanley & Company, Inc. 2,118,171,663
RBC Capital Markets 1,252,876,000
Samuel A. Ramirez & Company, Inc. 192,500,000
Scotia Capital (USA), Inc. 190,000,000
Siebert Williams Shank & Company, LLC 126,250,000
Toronto Dominion Securities (USA), Inc. 572,961,000
Truist Securities, Inc. 415,937,000
UBS Securities, LLC 1,323,700,000
Wells Fargo Securities, LLC 725,270,764
Total $ 24,413,322,042

123Investment 2021 Comprehensive Annual Financial Report
LONG-TERMDOMESTICBONDTRANSACTIONS— EXTERNALLY MANAGED
Long-Term Broker Par $ U.S.
Mischler Financial Group, Inc. $ 9,620,000
Mitsubishi UFJ Securities (USA), Inc. 22,348,306
Mizuho Securities USA, Inc. 23,970,730
MKM Partners, LLC 245,000
Morgan Stanley & Company, Inc. 227,903,871
MTS Markets International, Inc. 117,000
NatAlliance Securities, LLC 123,750
National Bank of Canada Financial, Inc. 2,285,000
Natixis Securities Americas, LLC 1,000,000
NatWest Markets Securities, Inc. 18,545,000
Nomura Securities International, Inc. 129,936,792
Odeon Capital Group, LLC 76,819,475
Oppenheimer & Company, Inc. 1,468,000
Performance Trust Capital Partners, LLC 125,000
PNC Capital Markets, LLC 1,029,041
R.W. Pressprich & Company 4,627,019
Raymond James & Associates, Inc. 11,081,189
RBC Capital Markets 129,978,000
Samuel A. Ramirez & Company, Inc. 1,505,000
Santander Investment Securities, Inc. 2,145,000
Scotia Capital (USA), Inc. 5,239,000
Seaport Global Securities, LLC 1,774,000
SG Americas Securities, LLC 85,408,771
SMBC Nikko Securities America, Inc. 1,720,000
Standard Chartered Securities North America, LLC 1,000,000
Stifel Nicolaus & Company, Inc. 3,431,336
StoneX Financial, Inc. 6,527,230
Sumridge Partners, LLC 793,000
Susquehanna Financial Group, LLLP 6,990,000
Toronto Dominion Securities (USA), Inc. 98,993,633
Truist Securities, Inc. 10,682,620
Trumid Financial, LLC 414,000
U.S. Bancorp Investments, Inc. 7,463,000
UBS Securities, LLC 156,946,000
Wells Fargo Securities, LLC 343,227,480
Total $ 4,753,218,621
For the Fiscal Year Ended March 31, 2021.Summarized by Broker or Direct Issuer.
Long-Term Broker Par $ U.S.
Amherst Pierpont Securities, LLC $ 36,404,599
Baird, Robert W. & Company, Inc. 6,152,400
Barclays Capital, Inc. 389,026,991
BCP Securities, LLC 2,143,000
BMO Capital Markets Corp. 100,950,076
BNP Paribas Securities Corp. 146,933,896
BNY Mellon Capital Markets, LLC 62,737,000
BofA Securities, Inc. 484,463,351
BOK Financial Securities, Inc. 13,821,342
Brean Capital, LLC 802,448
BTIG, LLC 23,885,000
Cabrera Capital Markets, Inc. 79,895,000
Cantor Fitzgerald & Company 2,001,911
CIBC World Markets Corp. 18,195,000
Citadel Securities Institutional, LLC 49,996,700
Citigroup Global Markets, Inc. 693,387,016
Credit Agricole Securities (USA), Inc. 8,982,000
Credit Suisse Securities, Ltd. 122,678,074
Daiwa Capital Markets America, Inc. 10,264,387
Deutsche Bank Securities, Inc. 166,703,000
FHN Financial Securities Corp. 1,212,000
GMP Securities, LLC 3,124,000
Goldman Sachs & Company 198,258,161
Guggenheim Securities, LLC 4,223,900
Hilltop Securities, Inc. 790,000
HSBC Securities, Inc. 252,626,000
ICE Bonds Securities Corp. 119,000
Imperial Capital, LLC 442,000
J.P. Morgan Securities, LLC 363,639,126
Jane Street Execution Services, LLC 7,840,000
Jefferies & Company, Inc. 91,985,000
KeyBanc Capital Markets, Inc. 7,566,000
Liquidnet, Inc. 183,000
Lloyds Securities, Inc. 1,319,000
MarketAxess Corp. 4,197,000
Mesirow Financial, Inc. 470,000
Millennium Advisors, LLC 318,000
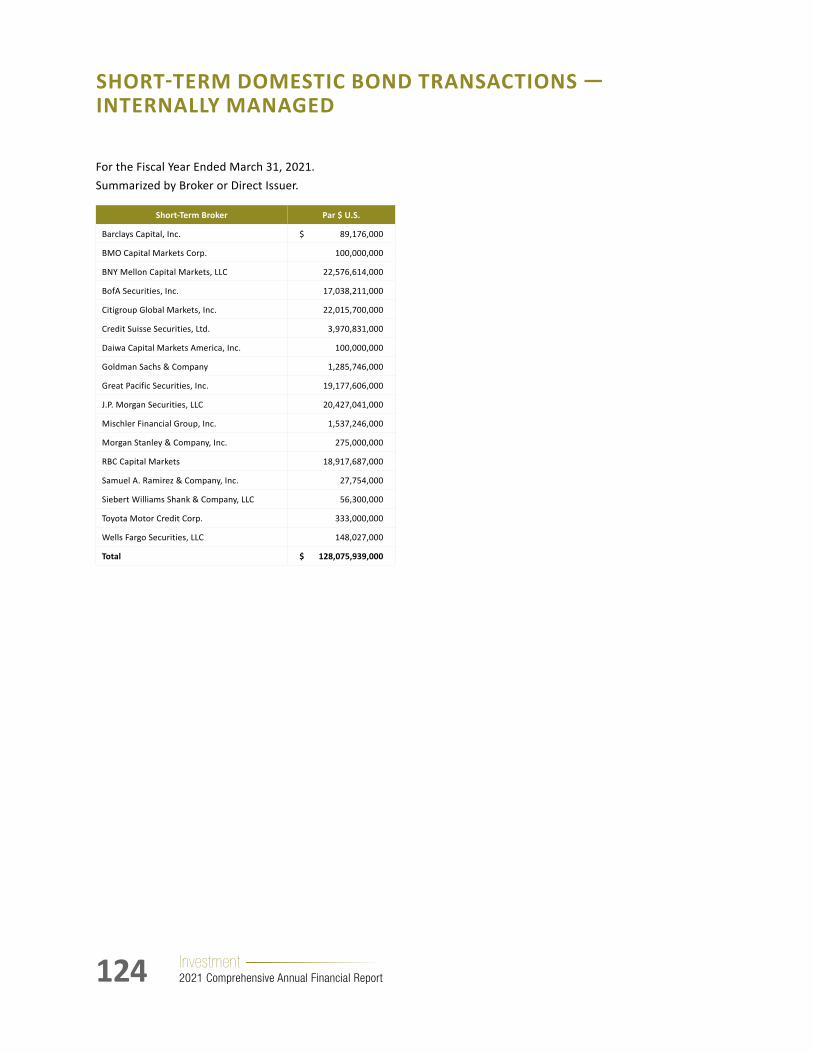
124 Investment 2021 Comprehensive Annual Financial Report
For the Fiscal Year Ended March 31, 2021.Summarized by Broker or Direct Issuer.
Short-Term Broker Par $ U.S.
Barclays Capital, Inc. $ 89,176,000
BMO Capital Markets Corp. 100,000,000
BNY Mellon Capital Markets, LLC 22,576,614,000
BofA Securities, Inc. 17,038,211,000
Citigroup Global Markets, Inc. 22,015,700,000
Credit Suisse Securities, Ltd. 3,970,831,000
Daiwa Capital Markets America, Inc. 100,000,000
Goldman Sachs & Company 1,285,746,000
Great Pacific Securities, Inc. 19,177,606,000
J.P. Morgan Securities, LLC 20,427,041,000
Mischler Financial Group, Inc. 1,537,246,000
Morgan Stanley & Company, Inc. 275,000,000
RBC Capital Markets 18,917,687,000
Samuel A. Ramirez & Company, Inc. 27,754,000
Siebert Williams Shank & Company, LLC 56,300,000
Toyota Motor Credit Corp. 333,000,000
Wells Fargo Securities, LLC 148,027,000
Total $ 128,075,939,000
SHORT-TERMDOMESTICBONDTRANSACTIONS— INTERNALLY MANAGED
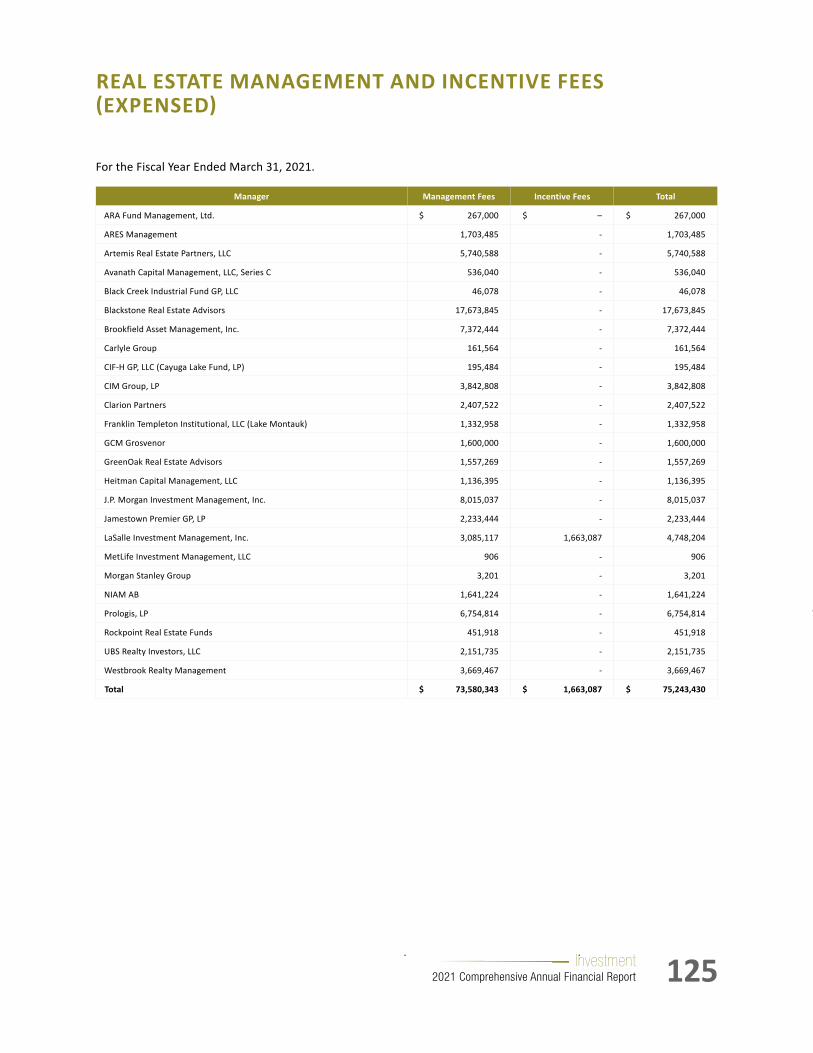
125Investment 2021 Comprehensive Annual Financial Report
REAL ESTATE MANAGEMENT AND INCENTIVE FEES (EXPENSED)
For the Fiscal Year Ended March 31, 2021.
Manager Management Fees Incentive Fees Total
ARA Fund Management, Ltd. $ 267,000 $ – $ 267,000
ARES Management 1,703,485 - 1,703,485
Artemis Real Estate Partners, LLC 5,740,588 - 5,740,588
Avanath Capital Management, LLC, Series C 536,040 - 536,040
Black Creek Industrial Fund GP, LLC 46,078 - 46,078
Blackstone Real Estate Advisors 17,673,845 - 17,673,845
Brookfield Asset Management, Inc. 7,372,444 - 7,372,444
Carlyle Group 161,564 - 161,564
CIF-H GP, LLC (Cayuga Lake Fund, LP) 195,484 - 195,484
CIM Group, LP 3,842,808 - 3,842,808
Clarion Partners 2,407,522 - 2,407,522
Franklin Templeton Institutional, LLC (Lake Montauk) 1,332,958 - 1,332,958
GCM Grosvenor 1,600,000 - 1,600,000
GreenOak Real Estate Advisors 1,557,269 - 1,557,269
Heitman Capital Management, LLC 1,136,395 - 1,136,395
J.P. Morgan Investment Management, Inc. 8,015,037 - 8,015,037
Jamestown Premier GP, LP 2,233,444 - 2,233,444
LaSalle Investment Management, Inc. 3,085,117 1,663,087 4,748,204
MetLife Investment Management, LLC 906 - 906
Morgan Stanley Group 3,201 - 3,201
NIAM AB 1,641,224 - 1,641,224
Prologis, LP 6,754,814 - 6,754,814
Rockpoint Real Estate Funds 451,918 - 451,918
UBS Realty Investors, LLC 2,151,735 - 2,151,735
Westbrook Realty Management 3,669,467 - 3,669,467
Total $ 73,580,343 $ 1,663,087 $ 75,243,430

126 Investment 2021 Comprehensive Annual Financial Report
REAL ESTATE MANAGEMENT AND INCENTIVE FEES (CAPITALIZED)
For the Fiscal Year Ended March 31, 2021.
Manager Management Fees
ACA Advisors (Aetos) $ 33,051
ARA Fund Management, Ltd. 327,269
ARES Management 3,666,370
Asana Partners, LP 2,785,089
Avanath Capital Management, LLC, Series C 72,828
BCP Strategic Partners (Beacon) 39,975
Blackstone Real Estate Advisors 9,614,274
Cherokee Advisers, LLC 158,045
Clarion Partners 1,814,764
Colony Advisors, LLC 47,670
Cortland Partners, LLC 681,266
Exeter Europe 2,361,541
Heitman Capital Management, LLC 1,717,958
J.P. Morgan Investment Management, Inc. 1,095,665
Kimex 56,791
Landmark 549,674
Mesa West Capital 73,701
MetLife Investment Advisors, LLC 6,143,087
NIAM AB 1,952,834
NREP 4,896,806
PGIM Fund Management, Ltd. 1,455,792
Stockbridge Real Estate Funds 540,701
Total $ 40,085,151

127Investment 2021 Comprehensive Annual Financial Report
PRIVATEEQUITYMANAGEMENTFEES(EXPENSED)
Manager Management Fees
IK Investment Partners $ 3,631,083
Insight Partners, LLC 3,500,000
J.P. Morgan Partners, LLC 911,727
KKR & Company, LP 13,526,383
KSL Capital Partners, LLC 3,590,904
Leonard Green & Partners, LP 2,561,008
Lindsay Goldberg & Company, LLC 4,011,297
Lion Capital, LLP 75,914
Muller & Monroe Asset Management, LLC 1,615,849
Neuberger Berman Group, LLC 3,032,579
Nordic Capital 1,337,988
Paladin Capital Group 39,909
Palladium Equity Partners 2,427,466
Performance Equity Management, LLC 737,341
Pine Brook Road Partners, LLC 1,388,313
Primary Venture Partners 213,827
Providence Equity Partners, LLC 2,866,387
Quadrangle Group, LLC 140,637
RRJ Capital 1,457,744
Searchlight Capital Partners 6,726,815
Siris Capital Group, LLC 3,528,404
Snow Phipps Group, LLC 4,200,516
SoftBank Capital 607,151
Stepstone Group, LP 46,341
Summer Street Capital Partners, LLC 99,745
TA Associates Management, LP 9,960,799
Thoma Bravo, LLC 2,592,161
Towerbrook Capital Partners 3,660,063
TPG Capital, LP 15,822,663
Tribeca Venture Partners 289,356
Trillium Group, LLC 101,773
Vista Equity Partners, LLC 32,587,811
Warburg Pincus, LLC 3,704,652
Total $ 256,900,704
For the Fiscal Year Ended March 31, 2021.
Manager Management Fees
57 Stars, LLC $ 825,676
Access Capital Advisors, LLC 231,116
ACON Investments, LLC 2,432,390
Affinity Equity Partners 6,551,704
African Capital Alliance Limited 2,048,675
Apollo Management, LP 11,383,616
Ares Management, LP 3,653,667
Armory Square Ventures, LP 187,500
Ascent Biomedical Ventures 120,317
Asia Alternatives Management, LLC 2,895,721
Blackstone Group, LP 8,089,798
Bridgepoint Capital, Ltd. 8,964,919
Brookfield Asset Management 6,705,245
CCMP Capital Advisors 887,752
Centerbridge Partners, LP 2,234,994
Cinven Capital Management 5,269,647
Clearlake Capital Group, LP 2,755,476
Contour Venture Partners 1,225,000
CVC Capital Partners 16,254,019
DeltaPoint Capital Management, LLC 126,933
Dyal Capital Partners 5,329,108
EQT Partners 6,749,630
Fairview Capital Partners, Inc. 202,615
Farol Asset Management, LP 1,386,960
Founders Equity, Inc. 370,000
FountainVest Partners (Asia), Ltd. 281,473
Francisco Partners, L.P. 1,353,261
Freeman, Spogli & Company 3,087,714
GCM Grosvenor 297,111
GenNx360 Capital Partners 4,541,012
Hamilton Lane Advisors, LLC 5,052,156
HarbourVest Partners, LLC 2,210,680
Helios Investment Partners 1,891,430
Hellman & Friedman Investors, Inc. 2,612,638
High Peaks Venture Partners 631,843
Hony Capital 5,865,670
ICV Partners, LLC 1,198,632

128 Investment 2021 Comprehensive Annual Financial Report
PRIVATEEQUITYMANAGEMENTFEES(CAPITALIZED)
For the Fiscal Year Ended March 31, 2021.
Manager Management Fees
Activate Venture Partners $ 138,009
Bridgepoint Capital, Ltd. 75,400
Cerberus Capital Management, LP 439
Francisco Partners Management, LP 754,948
Gilde, LP 69,725
Hamilton Lane Advisors, LLC 967,719
HarbourVest Partners, LLC 531,030
Institutional Venture Partners 454,494
JMI Equity 393,180
Leonard Green & Partners, LP (22,683)
NCH Capital, Inc. 928,069
Oaktree Capital Management, LP 7,797,642
RRJ Capital 1,195,403
SAIF Partners 3,045,301
SoftBank Capital 300,000
Summer Street Capital Partners, LLC 257,268
Tribeca Venture Partners, LLC 598,905
VCFA Group 252,624
Warburg Pincus, LLC 375,986
Total $ 18,113,459

129Investment 2021 Comprehensive Annual Financial Report
PRIVATEEQUITY— FEE, EXPENSE AND CARRIED INTEREST ANALYSIS
For the Fiscal Year Ended March 31, 2021.
Total Expenses
Net Management Fees $ 275,014,163
Partnership Expenses 96,612,710
Total Expenses $ 371,626,873
Ratio — Total Expenses/Total Private Equity Allocation 0.72%
Total Profit Sharing (Carried Interest)
Profit Sharing (Carried Interest) $ 393,022,317
Total Profit Sharing $ 393,022,317
Ratio — Total Profit Sharing/Total Actively Invested Private Equity Allocation 1.14%
Total Expenses + Profit Sharing (Carried Interest)
Total Expenses $ 371,626,873
Total Profit Sharing 393,022,317
Total Expenses and Profit Sharing (Carried Interest) $ 764,649,190
Total Private Equity Allocation
Unfunded Capital Commitments $ 17,344,992,969
Net Asset Value (NAV) as of 3/31/2021 29,470,165,376
Distributions for FY 2021 4,995,524,488
Total Private Equity Allocation $ 51,810,682,833
Ratio — Total Expenses + Profit Sharing/Total Private Equity Allocation 1.48%
Total Actively Invested Private Equity Allocation
Net Asset Value (NAV) as of 3/31/2021 $ 29,470,165,376
Distributions for FY 2021 4,995,524,488
Total Actively Invested Private Equity Allocation $ 34,465,689,864
Ratio — Total Expenses + Profit Sharing/Total Actively Invested Private Equity Allocation 2.22%
Note: The profit sharing and partnership expenses were compiled based on information provided directly by the General Partner or calculated by the Fund’s consultant applying the Fund’s pro-rata ownership to carried interest and/or distribution and expense information provided in the Audited Financial Statements and Quarterly Financial Statements. Materials provided by General Partners consist of partners’ capital statements, Institutional Limited Partners Association (ILPA) templates, and/or templates the consultant provided for the purposes of this analysis.

130 Investment 2021 Comprehensive Annual Financial Report
OPPORTUNISTIC/ABSOLUTE RETURN STRATEGIES FUNDS MANAGEMENT AND INCENTIVE FEES (EXPENSED)
For the Fiscal Year Ended March 31, 2021.
Manager Management Fees Incentive Fees Total
ADV Partners Capital Management, Ltd $ 4,369,220 $ – $ 4,369,220
Angelo, Gordon & Company, LP 10,752 9,413 20,165
Bain Capital Public Equity, LP 184,004 1,314,790 1,498,794
BCK Capital Management, LP 940,656 620,338 1,560,994
Bridgewater Associates, LP 1,625,590 - 1,625,590
Brigade Capital Management, LLC 1,376,538 - 1,376,538
Caspian Capital, LP 3,792,937 4,377,870 8,170,807
Cowen Investment Management, LLC 5,067,766 - 5,067,766
D.E. Shaw and Company, LP 19,491,103 50,913,038 70,404,141
Fortress Investment Group, LLC 206,143 526,832 732,975
Graticule Asset Management Asia, LP 966,900 - 966,900
HBK Capital Management, LP 3,670,812 5,399,234 9,070,046
Highland Capital Management, LP 173 - 173
Hollis Park Partners, LP 503,021 - 503,021
Horizon Asset, LLP 1,883,504 - 1,883,504
Insight Venture Management, LLC 290,421 - 290,421
King Street Capital Management, LP 2,586,943 4,328,734 6,915,677
Knighthead Capital Management, LLC 2,691,541 - 2,691,541
Landmark Partners, LLC 3,500,000 - 3,500,000
Lansdowne Partners, Ltd 562,397 - 562,397
Mariner Investment Group, LLC 1,054,485 - 1,054,485
Marshall Wace, LLP 5,622,366 8,948,363 14,570,729
Mezzacappa Management, LLC 5,836 - 5,836
Pacific Alternative Asset Management Company, LLC 78,152 - 78,152
Pharo Management, LLC 3,628,752 5,208,858 8,837,610
Rock Creek Group, LP 164,423 - 164,423
Schultze Asset Management, LLC 61,585 4,277 65,862
Stellex Capital Management, LP 3,391,817 - 3,391,817
Systematica Investments, Ltd 970,507 60,761 1,031,268
Tilden Park Capital Management, LP 4,347,525 - 4,347,525
Varde Management, LP 1,872,537 - 1,872,537
Vivo Capital, LLC 1,316,721 - 1,316,721
Total $ 76,235,127 $ 81,712,508 $ 157,947,635

131Investment 2021 Comprehensive Annual Financial Report
OPPORTUNISTIC FUNDS MANAGEMENT FEES (CAPITALIZED)
For the Fiscal Year Ended March 31, 2021.
Manager Management Fees
Landmark Partners, LLC $ 2,954,884
Stellex Capital Management, LP 11,397
Total $ 2,966,281

132 Investment 2021 Comprehensive Annual Financial Report
REALASSETSMANAGEMENTFEES(EXPENSED)
For the Fiscal Year Ended March 31, 2021.
Manager Management Fees
Blackstone Group, LP $ 2,499,833
Brookfield Asset Management 7,117,449
EQT Fund Management S.a.r.l. 1,742,000
Excelsior Capital 3,565,068
Global Infrastructure Management, LLC 6,047,411
Grain Management, LLC 3,650,010
GSO Capital Partners 1,191,079
I Squared Capital Advisors (US), LLC 1,881,175
ITE Management 113,218
Kayne Anderson Capital Advisors, LP 1,692,506
KKR & Company, LP 5,834,563
Meridiam Infrastructure North America Corporation
2,400,000
Morgan Stanley Investment Management, Ltd. 748,452
Patria Investments, Ltd. 1,545,216
Stonepeak Partners, LP 3,160,809
Total $ 43,188,789

133Investment 2021 Comprehensive Annual Financial Report
REALASSETSMANAGEMENTFEES(CAPITALIZED)
For the Fiscal Year Ended March 31, 2021.
Manager Management Fees
Castlelake, LP $ 364,681
IFM Investors, Ltd. 4,402,375
ITE Management, LP 28,305
Nuveen 2,959,588
Pantheon Ventures, LP 2,425,905
Total $ 10,180,854

134 Investment 2021 Comprehensive Annual Financial Report
CREDITMANAGEMENTFEES(EXPENSED)
For the Fiscal Year Ended March 31, 2021.
Manager Management Fees Incentive Fees Total
Ares SSG Capital Management $ 4,215,061 $ 234,029 $ 4,449,090
Avenue Capital Group 333,948 - 333,948
Blackrock Inc. 8,936,922 - 8,936,922
Blackstone Group, LP 6,961,833 8,511,503 15,473,336
Blantyre Capital, Ltd. 1,696,168 - 1,696,168
Bridgepoint Capital, Ltd. 640,942 - 640,942
Brightwood Capital Advisors, LLC 231,265 - 231,265
Clearlake Capital Group, LP 784,281 8,625,785 9,410,066
Hollis Park Partners, LP 2,000,944 - 2,000,944
Neuberger Berman Group, LLC 4,717,870 3,445,556 8,163,426
Oak Hill Advisors, LP 2,069,441 1,509,126 3,578,567
Orchard Global Asset Management, LLP 1,756,235 - 1,756,235
Pearl Diver Capital, LLP 1,000,000 - 1,000,000
Sixth Street Partners, LLC 7,457,683 3,909,489 11,367,172
Strategic Value Partners, LLC 2,190,864 - 2,190,864
Whitehorse Liquidity Partners 700,000 - 700,000
Total $ 45,693,457 $ 26,235,488 $ 71,928,945
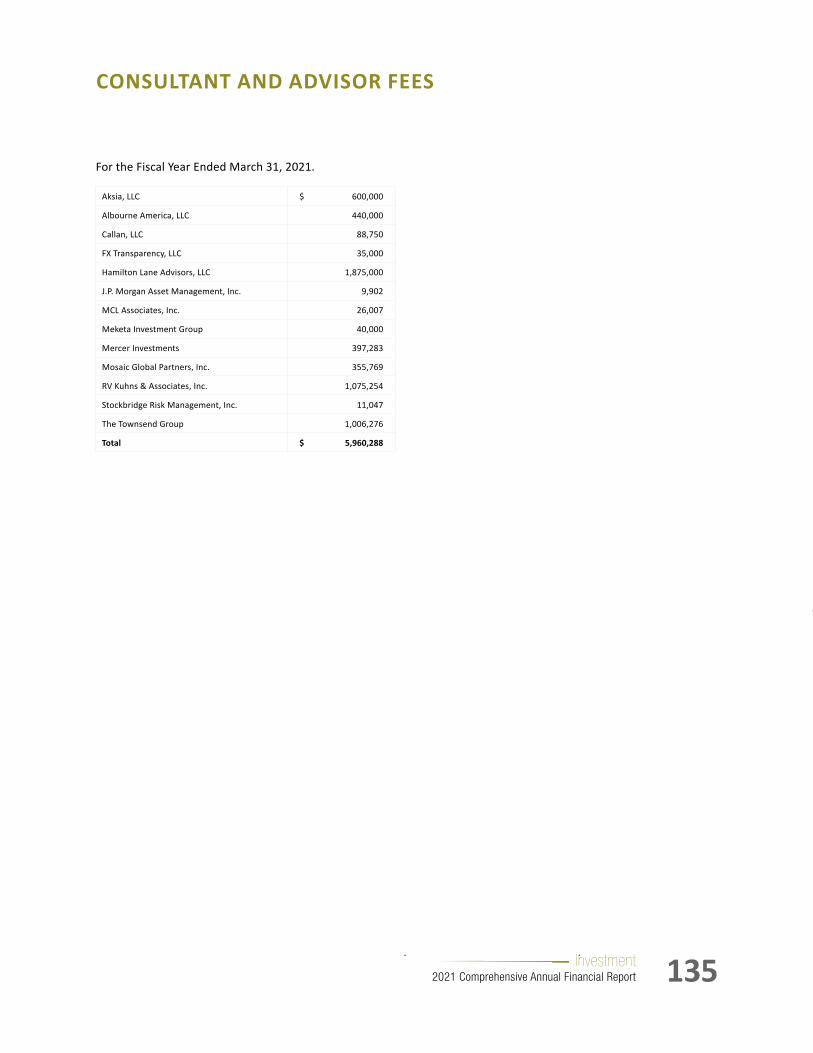
135Investment 2021 Comprehensive Annual Financial Report
CONSULTANT AND ADVISOR FEES
For the Fiscal Year Ended March 31, 2021.
Aksia, LLC $ 600,000
Albourne America, LLC 440,000
Callan, LLC 88,750
FX Transparency, LLC 35,000
Hamilton Lane Advisors, LLC 1,875,000
J.P. Morgan Asset Management, Inc. 9,902
MCL Associates, Inc. 26,007
Meketa Investment Group 40,000
Mercer Investments 397,283
Mosaic Global Partners, Inc. 355,769
RV Kuhns & Associates, Inc. 1,075,254
Stockbridge Risk Management, Inc. 11,047
The Townsend Group 1,006,276
Total $ 5,960,288

136 Investment 2021 Comprehensive Annual Financial Report
This page intentionally left blank.

ActuarialOur team of actuaries meticulously plan for the future, a trait that consistently
helps the Fund maintain its financial stability. NYSLRS actuaries reduce risk by
calculating the assets the Fund will need to pay current and future benefits, keeping
our members and retirees at the center of the equation.
A Century of Managing Risk
NYSLRS1921–2021
REPRODUCTION BY PERMISSION OF THE BUFFALO & ERIE COUNTY PUBLIC LIBRARY, BUFFALO, NEW YORK
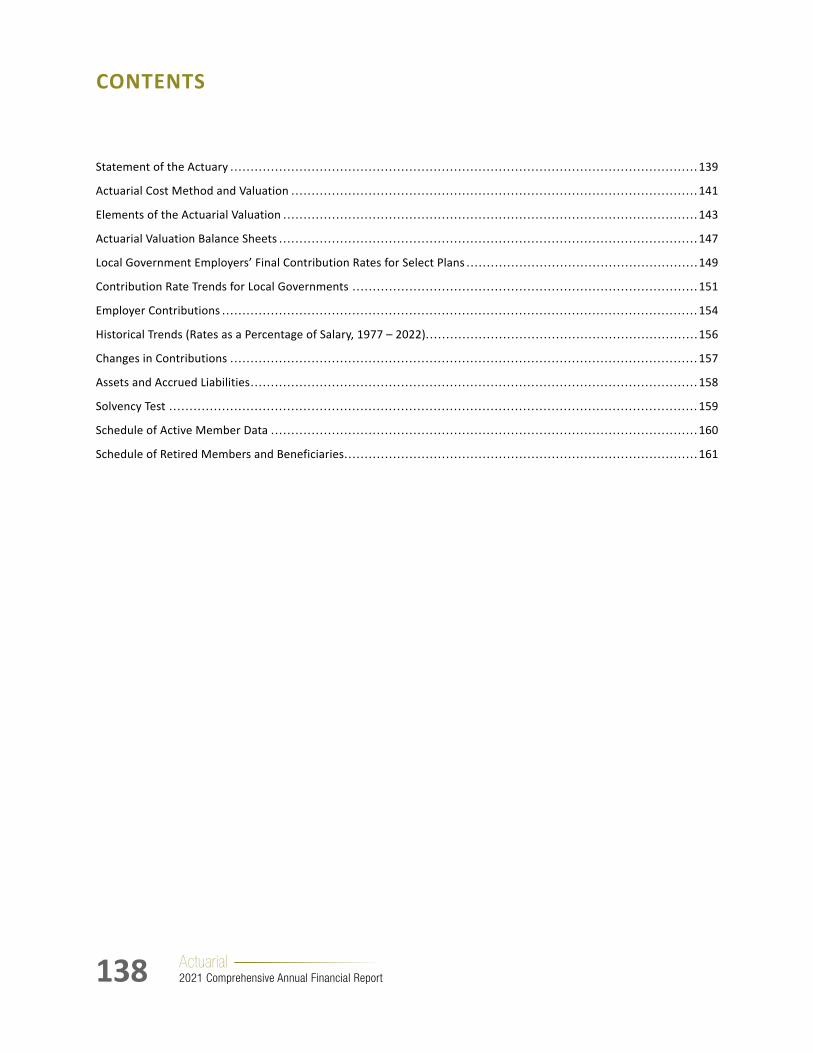
138 Actuarial 2021 Comprehensive Annual Financial Report
CONTENTS
Statement of the Actuary ................................................................................................................... 139
Actuarial Cost Method and Valuation .................................................................................................... 141
Elements of the Actuarial Valuation ...................................................................................................... 143
Actuarial Valuation Balance Sheets ....................................................................................................... 147
Local Government Employers’ Final Contribution Rates for Select Plans .........................................................149
Contribution Rate Trends for Local Governments ..................................................................................... 151
Employer Contributions ..................................................................................................................... 154
Historical Trends (Rates as a Percentage of Salary, 1977 – 2022) ...................................................................156
Changes in Contributions ................................................................................................................... 157
Assets and Accrued Liabilities .............................................................................................................. 158
Solvency Test .................................................................................................................................. 159
Schedule of Active Member Data ......................................................................................................... 160
Schedule of Retired Members and Beneficiaries ....................................................................................... 161
139Actuarial 2021 Comprehensive Annual Financial Report
STATEMENT OF THE ACTUARY
September 30, 2021
As the Actuary for the Employees’ Retirement System (ERS) and the Police and Fire Retirement System (PFRS), it is
my duty to ensure that the New York State and Local Retirement System (the System) properly funds the benefits of
members, retirees, and beneficiaries. A discussion of the plan provisions can be found at the beginning of the Notes to
Basic Financial Statements. The System’s funding policy is established by New York State Retirement and Social Security
Law. The System has a funding objective of employer contributions that, over time, are a level percentage of payroll, and
accumulate assets over an employee’s working lifetime sufficient to pay benefits as they become due.
The Actuarial Bureau annually generates actuarial valuations which determine the annual contributions required of
employers. The most recent valuation was for valuation date April 1, 2020 and determined the employer contribution
rates for February 1, 2022. A valuation relies on valuation date data for active members, retirees, and beneficiaries. Data
for active members includes date of birth, salary, credited service, tier, and plan. For retired members and beneficiaries,
data includes date of birth, monthly benefits and benefit option. In preparation for the valuation, we extensively validate
the System’s data by running reasonableness tests and accounting for every individual on a year-to-year basis. We also
review the information contained in the financial statements.
For active members, the valuation projects expected benefits at retirement, death, disablement, and withdrawal based
on estimated pay and service, as well as the member’s plan benefit formula. For payees, the valuation determines the
present value of payments expected to be made for the lifetimes of retirees and beneficiaries.
Proper funding requires that liabilities and employer contribution rates be determined based on reasonable actuarial
assumptions and methods. The types of assumptions that must be made include both demographic (rates of employee
mortality, disability, turnover, and retirement) and economic (interest rates, inflation, and salary growth). Therefore,
valuations include assumptions about these uncertainties.
The Actuary performs annual experience studies, ascertaining how closely the System’s experience is conforming to the
assumptions. If significant differences occur that the Actuary believes may indicate permanent shifts, the Actuary may
recommend assumption changes.
The System retains an external auditor to independently review its financial records every year. Furthermore, an Actuarial
Advisory Committee meets annually to review the actuarial assumptions and the results of the actuarial valuation. The
System also engages the services of an outside actuarial consultant to perform a review every five years; similarly, every
five years, the System is audited by the New York State Department of Financial Services. Lastly, the Comptroller of
the State of New York, in his role as sole trustee of the System, established an Office of Internal Audit to help fulfill his
fiduciary objectives.

140 Actuarial 2021 Comprehensive Annual Financial Report
The April 1, 2019 valuation for determining the February 1, 2021 employer contribution rates found in this report was
performed under my direction and supervision, using the assumptions adopted by the Comptroller, a summary of which
is included later in this section. The assumptions and methods used for funding purposes meet the parameters set by
Actuarial Standards of Practice.
I am responsible for all of the valuation results and other actuarial calculations contained in this report. In the Notes
to Basic Financial Statements, I prepared the Net Pension Liability of Participating Employers. While I prepared the
employer contribution rates that determined the 2021 employer billing, I did not prepare the Schedule of Employer
Contributions. I prepared the following schedules in the Actuarial section: Actuarial Valuation Balance Sheets, Local
Government Employers’ Final Contribution Rates for Select Plans, Contribution Rate Trends for Local Governments,
Employer Contributions, Historical Trends, Changes in Contributions, Assets and Accrued Liabilities, Solvency Test,
Schedule of Active Member Data, and Schedule of Retired Members and Beneficiaries.
In addition to the funding valuation report for ERS and PFRS, separate reports are issued to provide financial reporting for
the System in accordance with Governmental Accounting Standard Board (GASB) Statement No. 67. Reports containing
the actuarial results of the financial reporting valuations are based upon the measurement date of March 31, 2021.
On the basis of the foregoing, I hereby certify that, to the best of my knowledge and belief, this report is complete and
accurate and has been prepared in accordance with generally recognized and accepted actuarial practices which are
consistent with the principles prescribed by the Actuarial Standards Board as well as the Code of Professional Conduct
and Qualification Standards for Public Statements of Actuarial Opinion of the American Academy of Actuaries, of which
I am a member.
Michael Dutcher, E.A., A.S.A., M.A.A.A.ActuaryNew York State and Local Employees’ Retirement SystemNew York State and Local Police and Fire Retirement System
STATEMENT OF THE ACTUARY CONTINUED

141Actuarial 2021 Comprehensive Annual Financial Report
ACTUARIAL COST METHOD AND VALUATION
ACTUARIAL COST METHOD
An actuarial cost method is a procedure for allocating the costs of a retirement system to particular time periods. It does not determine how much a system will ultimately cost; rather, it determines the portion of the estimated total cost that is to be allocated to a particular year.
For 70 years, by virtue of applying the definition of normal cost found in New York State Retirement and Social Security Law, the actuarial funding method used by the System was the aggregate method (AGG). Chapter 210 of the Laws of 1990 changed the funding method to a modified projected unit credit (PUC) method beginning in the fiscal year ending March 31, 1991 (referred to as fiscal year 1991). This law was challenged and the challenge was upheld by the New York State Supreme Court. On appeal, both the Appellate Division and the New York State Court of Appeals unanimously agreed with the New York State Supreme Court. These decisions allowed the Comptroller to return to the aggregate funding method beginning with the 1995 fiscal year. To ease the transition in the ERS and to help prevent budget crises among participating employers, the Comptroller devised a plan to phase in non-GLIP (New York State Public Employees’ Group Life Insurance Plan) rates beginning in the 1995 fiscal year when the rates were zero. The rates increased by 1.5 percent per year until 1999, when the transition would cease. However, due to excellent investment gains and favorable experience, almost all ERS employer bills were below the transition rates in 1997, and in 1998 all were below the transition rates, so the transition ceased in 1998.
The aggregate method is ultimately an amortization policy. All valuation gains and losses are amortized evenly over the remaining working lifetimes of the active membership. The fact that the method does not allow arbitrary amortization periods or increasing payments is useful in a public setting as budgetary pressures can inspire a temptation to fund benefits over time frames that extend beyond the working lifetimes of the benefit recipients, and/or with back-loaded payments, which is not prudent and compromises intergenerational equity.
A perceived shortcoming of the aggregate cost method is that it defines the accrued liability to be the actuarial value of assets. Thus the unfunded accrued liability is always zero, and the system’s funded ratio is always 100 percent. This “drawback” is overcome by using the entry age normal cost method for purposes of financial disclosures. In this report, the reader should assume that any funding data provided is under the aggregate cost method unless otherwise noted as under the entry age normal method. The actuarial assumptions used are the same under either method.
142 Actuarial 2021 Comprehensive Annual Financial Report
ACTUARIAL VALUATION
At the beginning of the fiscal year, the Actuary, by law, determines the System’s actuarial assets and liabilities. The actuarial valuation is important since it determines the rates of employer contributions. Chapter 49 of the Laws of 2003 mandates that the actuarial valuation undertaken on the first day of a fiscal year be used to determine contribution rates for the next succeeding fiscal year, to be applied to salaries as of the end of that fiscal year. Chapter 94 of the Laws of 2015 changed the billable salary to compensation earned during the previous fiscal year.
Each valuation differs markedly from the March 31, point-in-time snapshot of the System provided by the Financial Statements. The two measurements serve different purposes and use different techniques.
Two examples help make this clear:
• The actuarial assets for valuation purposes include the current value of all the future contributions employers and employees will make on behalf of current members. The Financial Statement balance sheet asset figure includes only contributions previously received and invested.
• The actuarial assets smooth out the investment performance by using a multiyear smoothing procedure. Techniques like this are widely practiced and professionally recommended to protect employers from volatile contribution rates. The Financial Statements, on the other hand, simply present fair values of assets on the last day of the fiscal year.
AGGREGATE ACTUARIAL FUNDING METHOD
Actuarial liabilities are the valuation date values (called the actuarial present values) of the benefits the Retirement System expects to pay to current members, retirees, and beneficiaries. The actuarial present value of benefits is calculated by projecting the amount of future service retirement, death, and disability benefits (based on past and future service, salary, and plan) to be paid, and then discounting for assumed investment earnings, employee turnover, and other contingencies.
The actuarial present value of the contributions that employers must make to the System to fund the projected benefit payment is equal to the actuarial liabilities, minus the sum of the actuarial value of present assets and the present value of employee contributions.
Under the aggregate funding method, the actuarial present value of the contributions that employers must make to the System is funded as a level percentage of salary over the projected future working lifetimes of current members.
ACTUARIAL COST METHOD AND VALUATION CONTINUED

143Actuarial 2021 Comprehensive Annual Financial Report
ELEMENTS OF THE ACTUARIAL VALUATION
ACTUARIAL ASSUMPTIONS
The actuarial assumptions for employer contribution rates for the fiscal year ending 2021 were adopted effective April 1, 2015. These assumptions and their predecessors are shown below. All assumptions presume ongoing systems.
Fiscal Year Ended 3/31
Salary Scale* Interest RateMultiple-Decrement Tables Based on Systems’ Experience
1987 – 88 Inflation Productivity & Merit
5.00% 2.30%
7.30%
8.00% 4/1/81– 3/31/86 experience
1989 – 92 Inflation Productivity & Merit
5.00% 2.00%
7.00%
8.75% 4/1/81– 3/31/86 experience
1993 – 96 Inflation Productivity & Merit
5.00% 2.00%
7.00%
8.75% 4/1/86 – 3/31/91 experience
ERS PFRS
1997 – 98 Inflation Productivity & Merit
4.75% 1.25%
6.00%
4.75% 1.75%
6.50%
8.50% 4/1/90 – 3/31/95 experience
1999 – 2000 Inflation Productivity & Merit
3.50% 2.50%
6.00%
3.50% 3.00%
6.50%
8.50% 4/1/90 – 3/31/95 experience
2001 Inflation Productivity & Merit
3.00% 2.50%
5.50%
3.00% 3.00%
6.00%
8.00% 4/1/90 – 3/31/95 experience
2002 – 04 Inflation Productivity & Merit
3.00% 2.90%
5.90%
3.00% 3.90%
6.90%
8.00% 4/1/95 – 3/31/00 experience
2005 Inflation Productivity & Merit
3.00% 2.40%
5.40%
3.00% 3.90%
6.90%
8.00% 4/1/95 – 3/31/00 experience
2006 Inflation Productivity & Merit
3.00% 2.40%
5.40%
3.00% 3.90%
6.90%
8.00% 4/1/95 – 3/31/00 experience with subsequent adjustments
2007 – 11 Inflation Productivity & Merit
3.00% 2.40%
5.40%
3.00% 3.70%
6.70%
8.00% 4/1/00 – 3/31/05 experience with subsequent adjustments
2012 – 16 Inflation Productivity & Merit
2.70% 2.20%
4.90%
2.70% 3.30%
6.00%
7.50% 4/1/05 – 3/31/10 experience with subsequent adjustments
2017 – 19 Inflation Productivity & Merit
2.50% 1.30%
3.80%
2.50% 2.00%
4.50%
7.00% 4/1/10 – 3/31/15 experience with subsequent adjustments
2020 Inflation Productivity & Merit
2.50% 1.70%
4.20%
2.50% 2.50%
5.00%
7.00% 4/1/10 – 3/31/15 experience with subsequent adjustments
2021 Inflation Productivity & Merit
2.50% 1.70%
4.20%
2.50% 2.50%
5.00%
6.80% 4/1/10 – 3/31/15 experience with subsequent adjustments
* This is an approximate value. Salary scales vary by age and plan and are based on each System’s experience.
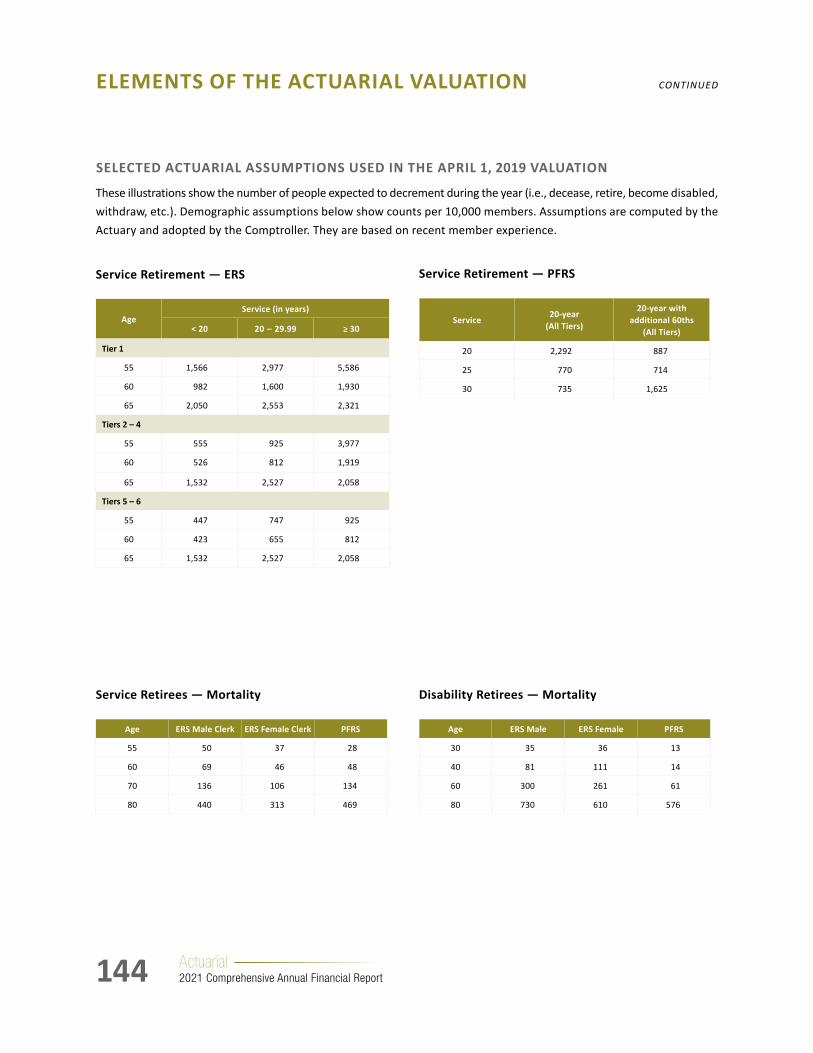
144 Actuarial 2021 Comprehensive Annual Financial Report
SELECTED ACTUARIAL ASSUMPTIONS USED IN THE APRIL 1, 2019 VALUATION
These illustrations show the number of people expected to decrement during the year (i.e., decease, retire, become disabled, withdraw, etc.). Demographic assumptions below show counts per 10,000 members. Assumptions are computed by the Actuary and adopted by the Comptroller. They are based on recent member experience.
Service Retirement — ERS
AgeService (in years)
< 20 20 – 29.99 ≥ 30
Tier 1
55 1,566 2,977 5,586
60 982 1,600 1,930
65 2,050 2,553 2,321
Tiers 2 – 4
55 555 925 3,977
60 526 812 1,919
65 1,532 2,527 2,058
Tiers 5 – 6
55 447 747 925
60 423 655 812
65 1,532 2,527 2,058
ELEMENTS OF THE ACTUARIAL VALUATION CONTINUED
Service Retirement — PFRS
Service20-year
(All Tiers)
20-year with additional 60ths
(All Tiers)
20 2,292 887
25 770 714
30 735 1,625
Service Retirees — Mortality
Age ERS Male Clerk ERS Female Clerk PFRS
55 50 37 28
60 69 46 48
70 136 106 134
80 440 313 469
Disability Retirees — Mortality
Age ERS Male ERS Female PFRS
30 35 36 13
40 81 111 14
60 300 261 61
80 730 610 576
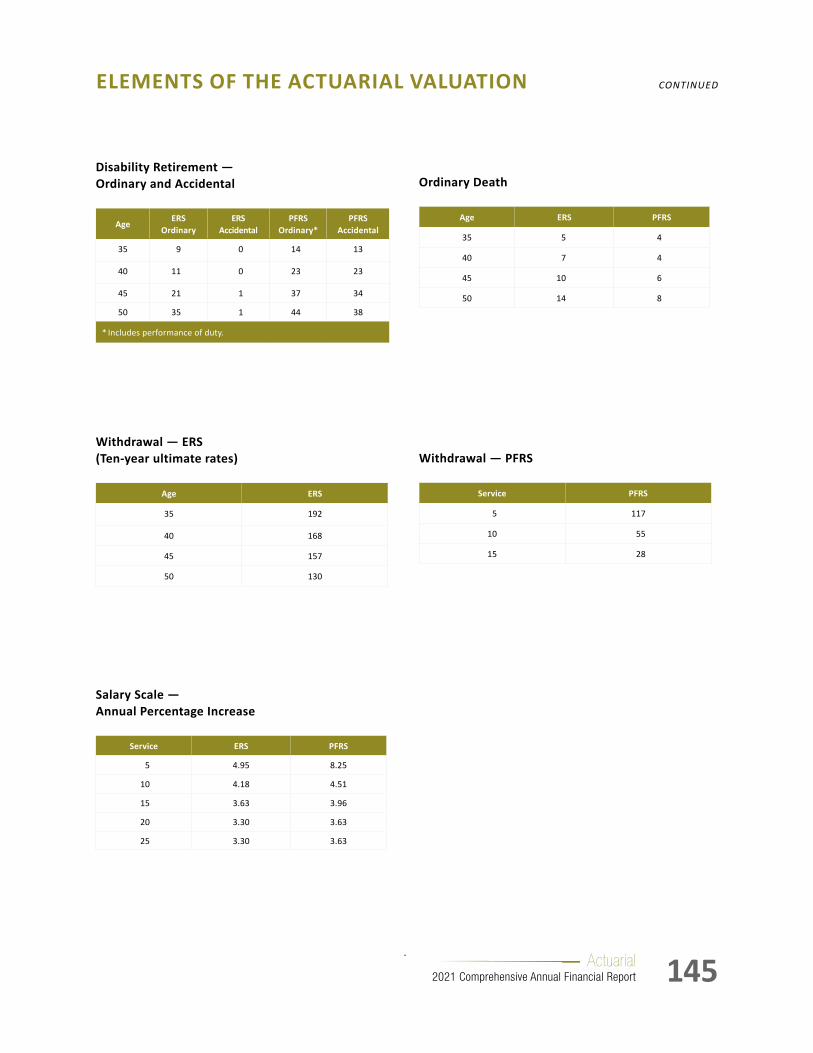
145Actuarial 2021 Comprehensive Annual Financial Report
Disability Retirement — Ordinary and Accidental
AgeERS
OrdinaryERS
AccidentalPFRS
Ordinary*PFRS
Accidental
35 9 0 14 13
40 11 0 23 23
45 21 1 37 34
50 35 1 44 38
* Includes performance of duty.
ELEMENTS OF THE ACTUARIAL VALUATION CONTINUED
Withdrawal — ERS (Ten-year ultimate rates)
Age ERS
35 192
40 168
45 157
50 130
Ordinary Death
Age ERS PFRS
35 5 4
40 7 4
45 10 6
50 14 8
Withdrawal — PFRS
Service PFRS
5 117
10 55
15 28
Salary Scale — Annual Percentage Increase
Service ERS PFRS
5 4.95 8.25
10 4.18 4.51
15 3.63 3.96
20 3.30 3.63
25 3.30 3.63

146 Actuarial 2021 Comprehensive Annual Financial Report
ACTUARIAL VALUE OF ASSETS
The actuarial asset values are determined by applying the assumed return on investments (6.8 percent for the April 1, 2019 valuation) to the financial statement plan net position with adjustments for cash flow (contributions and deductions). This smoothing method expects and immediately recognizes the assumed return on assets while phasing in unexpected gains and losses over a five-year period. The method treats realized and unrealized gains in the same manner. The Group Term Life Insurance Plan assets appreciate at the same rate as our short-term investment pool.
In the April 1, 2019 valuation of the System and Group Life Insurance Plan (GLIP) for fiscal year 2021, the difference between market and actuarial values of smoothed investments was:
Investments (Dollars in Millions)
Actuarial Value Market Value
$ 208,370 210,524
Difference $ (2,154 )
ADMINISTRATIVE EXPENSES
The cost of administering the System is borne by the State and local employers on a current disbursement basis.
GROUPLIFEINSURANCEPLAN(GLIP)
GLIP provides for up to $50,000 of member death benefits and certain post-retirement death benefits to be paid as life insurance. All benefits provided are on a one-year term insurance basis. Participating employers are billed each year based on the aggregate of anticipated claims for the plan year. Premiums are set so that the reserve will, at its lowest amount during any year, be approximately equal to payables. Payables is an estimate of the amount of claims currently being processed, plus claims incurred but not yet reported.
DEFICIENCY COSTS
An employer may also have a deficiency contribution. When a new employer joins a System, any past service liability is paid for by separate annual payments over a period of up to 25 years. These payments are not affected by the funding method.
RATE AND CONTRIBUTION COMPARABILITY
Unless stated otherwise, rates and contributions assume a payment date of February 1, before the fiscal year end, to provide for comparability of State and local government rates and costs.
ELEMENTS OF THE ACTUARIAL VALUATION CONTINUED
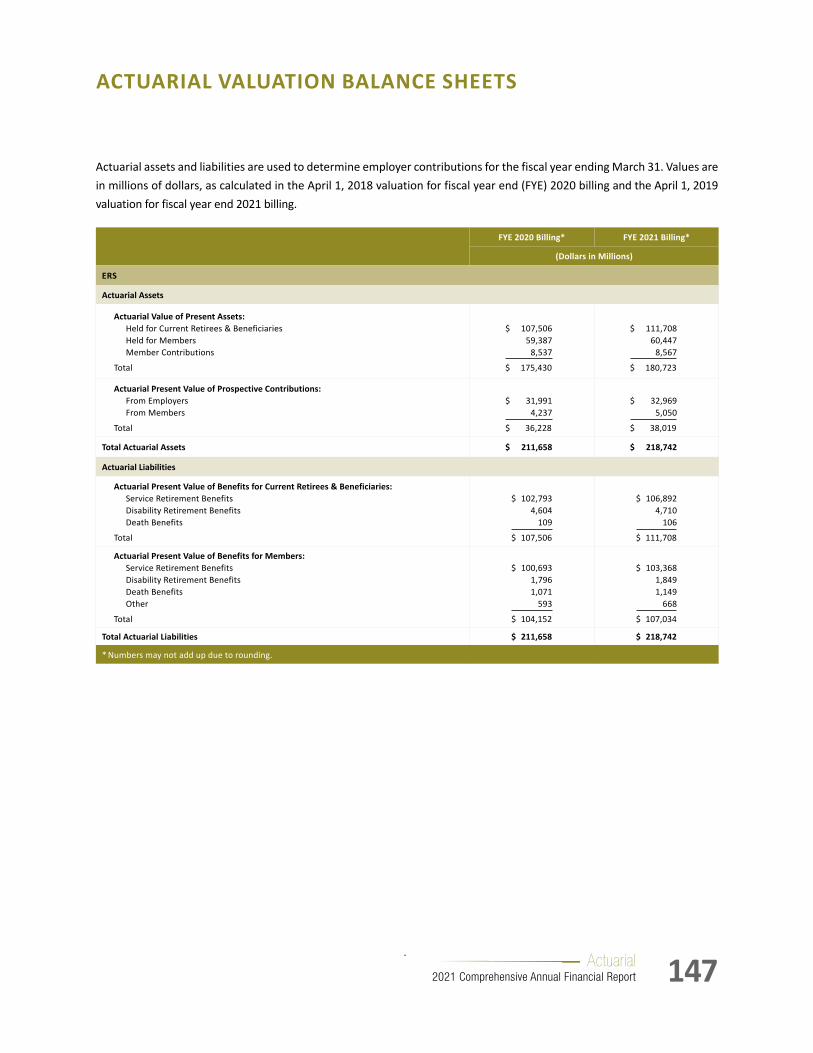
147Actuarial 2021 Comprehensive Annual Financial Report
Actuarial assets and liabilities are used to determine employer contributions for the fiscal year ending March 31. Values are in millions of dollars, as calculated in the April 1, 2018 valuation for fiscal year end (FYE) 2020 billing and the April 1, 2019 valuation for fiscal year end 2021 billing.
FYE 2020 Billing* FYE 2021 Billing*
(Dollars in Millions)
ERS
Actuarial Assets
Actuarial Value of Present Assets: Held for Current Retirees & Beneficiaries Held for Members Member Contributions
Total
$ 107,506
59,387 8,537
$ 175,430
$ 111,708
60,447 8,567
$ 180,723
Actuarial Present Value of Prospective Contributions: From Employers From Members
Total
$ 31,991
4,237
$ 36,228
$ 32,969
5,050
$ 38,019
Total Actuarial Assets $ 211,658 $ 218,742
Actuarial Liabilities
Actuarial Present Value of Benefits for Current Retirees & Beneficiaries: Service Retirement Benefits Disability Retirement Benefits Death Benefits
Total
$ 102,793
4,604 109
$ 107,506
$ 106,892
4,710 106
$ 111,708
Actuarial Present Value of Benefits for Members: Service Retirement Benefits Disability Retirement Benefits Death Benefits Other
Total
$ 100,693
1,796 1,071
593
$ 104,152
$ 103,368
1,849 1,149
668
$ 107,034
Total Actuarial Liabilities $ 211,658 $ 218,742
* Numbers may not add up due to rounding.
ACTUARIAL VALUATION BALANCE SHEETS
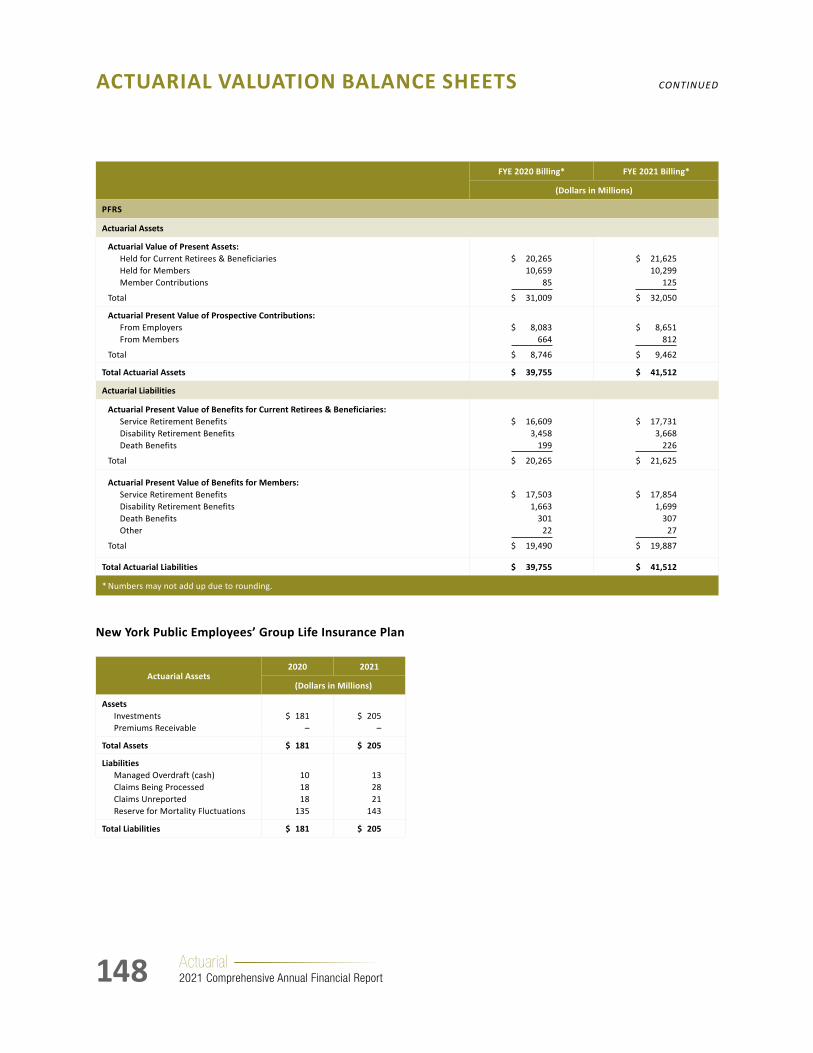
148 Actuarial 2021 Comprehensive Annual Financial Report
FYE 2020 Billing* FYE 2021 Billing*
(Dollars in Millions)
PFRS
Actuarial Assets
Actuarial Value of Present Assets: Held for Current Retirees & Beneficiaries Held for Members Member Contributions
Total
$ 20,265
10,659 85
$ 31,009
$ 21,625
10,299 125
$ 32,050
Actuarial Present Value of Prospective Contributions: From Employers From Members
Total
$ 8,083
664
$ 8,746
$ 8,651
812
$ 9,462
Total Actuarial Assets $ 39,755 $ 41,512
Actuarial Liabilities
Actuarial Present Value of Benefits for Current Retirees & Beneficiaries: Service Retirement Benefits Disability Retirement Benefits Death Benefits
Total
$ 16,609
3,458 199
$ 20,265
$ 17,731
3,668 226
$ 21,625
Actuarial Present Value of Benefits for Members: Service Retirement Benefits Disability Retirement Benefits Death Benefits Other
Total
$ 17,503
1,663 301
22
$ 19,490
$ 17,854
1,699 307 27
$ 19,887
Total Actuarial Liabilities $ 39,755 $ 41,512
* Numbers may not add up due to rounding.
New York Public Employees’ Group Life Insurance Plan
Actuarial Assets2020 2021
(Dollars in Millions)
Assets Investments Premiums Receivable
$ 181
–
$ 205
–
Total Assets $ 181 $ 205
Liabilities Managed Overdraft (cash) Claims Being Processed Claims Unreported Reserve for Mortality Fluctuations
10 18 18
135
13 28 21
143
Total Liabilities $ 181 $ 205
ACTUARIAL VALUATION BALANCE SHEETS CONTINUED

149Actuarial 2021 Comprehensive Annual Financial Report
LOCAL GOVERNMENT EMPLOYERS’ FINAL CONTRIBUTION RATES FOR SELECT PLANS
The following contribution rates are for the fiscal year ending March 31, 2021 and assume a February 1, 2021 payment date.
All rates exclude any contribution rates due to amortization payments, prior years’ adjustments, deficiency costs, retirement incentive programs and certain benefits electable by local governments, such as credit for unused sick leave or one-year final average salary. All rates include Group Life Insurance.
Plan IDPercentage of Payroll
Tier 1 Tier 2 Tiers 3 & 4 Tier 5 Tier 6
ERS
Age-based plans
Basic, Age 55, Age 60 Contributory 71-a 10.6 9.8 n/a n/a n/a
Article 14 A14 n/a n/a 16.0 n/a n/a
Article 15 A15 n/a n/a 16.0 13.3 9.5
Guaranteed Benefits 75-e 19.4 17.5 n/a n/a n/a
Career 75-g 20.6 18.7 n/a n/a n/a
New Career 75-h/75-i 21.4 19.5 n/a n/a n/a
25-year plans
Sheriffs and Deputies 89-a 24.3 22.8 n/a n/a n/a
Article 14B Sheriffs — 25-year 551 22.8 22.5 20.6 18.2 13.4
Article 14B Sheriffs — 25-year + 1/60th 551-e 24.1 23.9 22.0 19.8 15.0
full service for 1/60th 551-ee 25.0 24.8 22.8 20.5 15.6
County Law Enforcement 89-e, etc. 24.8 24.5 18.7 16.2 11.6
20-year plans
Sheriffs and Deputies 89-b 27.6 22.5 n/a n/a n/a
additional 1/60th 89-b(m) 27.8 23.8 n/a n/a n/a
Article 14B Sheriffs — 20-year 552 28.1 27.9 25.5 23.1 18.2
Article 14B Sheriffs — 20-year + 1/60th 553 28.1 27.9 26.1 24.0 19.4
full service for 1/60th 553b 29.2 29.0 27.1 24.9 20.1
Detective Investigators 89-d 27.0 26.8 n/a n/a n/a
additional 1/60th 89-d(m) 27.1 26.9 n/a n/a n/a

150 Actuarial 2021 Comprehensive Annual Financial Report
Plan IDPercentage of Payroll
Tier 1 Tier 2 Tier 3 Tier 5* Tier 6*
PFRS
Age-based plans
Basic, Age 55, Age 60 Contributory 371-a 12.7 11.1 11.1 7.5 3.4
Guaranteed Benefits 375-e 20.0 16.5 16.5 12.6 8.0
Career 375-g 21.9 18.1 18.1 14.0 9.3
New Career 375-i 22.6 18.6 18.6 14.5 9.6
Improved Career 375-j 22.6 18.6 18.6 14.5 9.6
25-year plans
Contributory 384 n/a n/a n/a 17.3 12.2
additional 1/60th 384(f) n/a n/a n/a 18.8 13.6
Non-Contributory 384 22.5 21.6 21.6 20.7 18.7
additional 1/60th 384(f) 23.6 23.4 23.4 22.3 20.2
20-year plans
Contributory 384-d n/a n/a n/a 21.0 15.7
additional 1/60th 384-e n/a n/a n/a 21.9 16.4
Non-Contributory 384-d 26.4 25.6 25.7 24.5 22.2
additional 1/60th 384-e 26.7 26.6 25.7 25.3 23.0
* Age-based plans in Tier 5 and Tier 6 are contributory.
There is no Tier 4 in PFRS.
LOCAL GOVERNMENT EMPLOYERS’ FINAL CONTRIBUTION RATES FOR SELECT PLANS CONTINUED

151Actuarial 2021 Comprehensive Annual Financial Report
Contribution rates are based on a February 1 payment date. Each rate is applied to the salary of members covered by that particular plan. Rates were calculated under the aggregate method. All rates include Group Life Insurance and administrative rates.
Actual costs borne by employers are shown in the Statistical Section.
Plan Name (Section)Percentage of Payroll
2012 2013 2014 2015 2016 2017 2018 2019 2020 2021
ERS
Guaranteed Benefits (75-e)
Tier 1 19.4 22.9 25.8 24.8 22.6 19.6 19.5 19.4 19.2 19.4
Tier 2 17.5 20.7 23.3 22.5 20.5 17.6 17.5 17.4 17.3 17.5
Career (75-g)
Tier 1 20.4 24.1 27.3 26.3 24.0 20.7 20.7 20.5 20.4 20.6
Tier 2 18.6 22.0 24.9 24.0 21.9 18.7 18.7 18.6 18.5 18.7
New Career (75-i)
Tier 1 21.3 25.2 28.5 27.4 25.0 21.6 21.5 21.4 21.2 21.4
Tier 2 19.5 23.0 26.0 25.1 22.9 19.6 19.5 19.4 19.3 19.5
Article 14/15 — Tier 3 15.6 18.4 20.8 20.1 18.6 15.8 15.8 15.7 15.7 16.0
Article 15 — Tier 4 15.6 18.4 20.8 20.1 18.6 15.8 15.8 15.7 15.7 16.0
Article 15 — Tier 5 12.6 14.9 16.7 16.4 15.3 13.0 13.0 12.9 13.1 13.3
Article 15 — Tier 6 — 9.9 11.3 10.8 10.4 9.2 9.2 9.2 9.2 9.5
CONTRIBUTION RATE TRENDS FOR LOCAL GOVERNMENTS
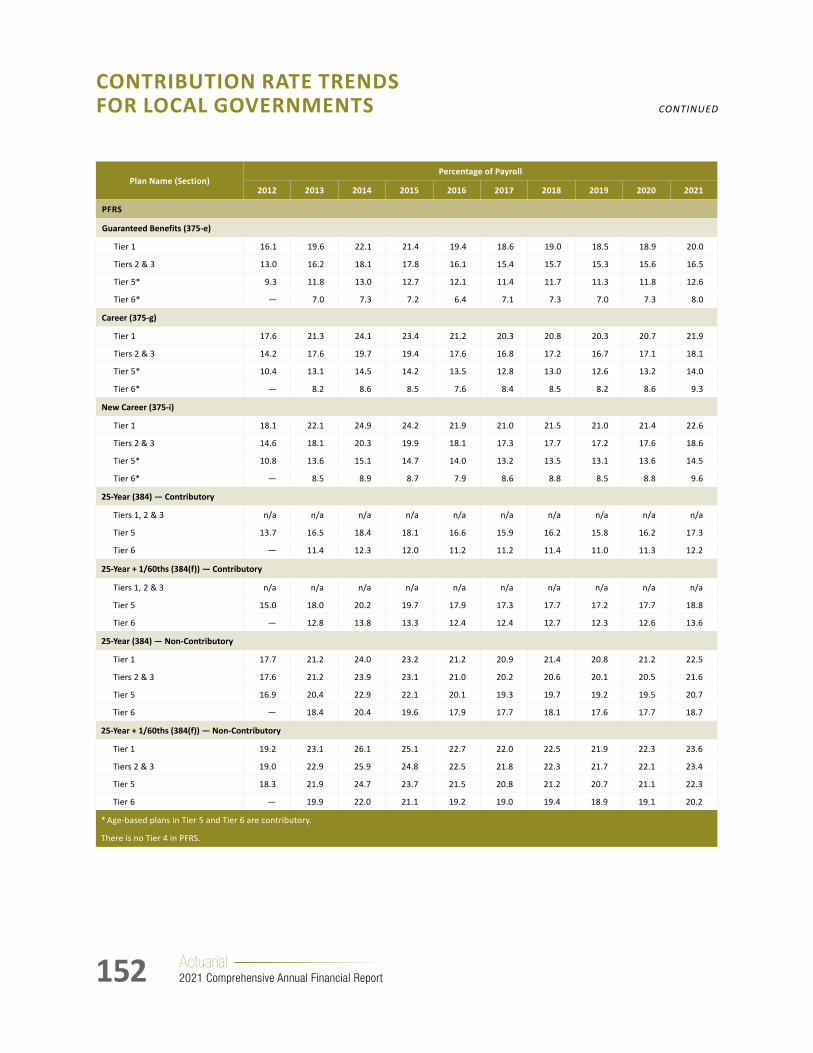
152 Actuarial 2021 Comprehensive Annual Financial Report
Plan Name (Section)Percentage of Payroll
2012 2013 2014 2015 2016 2017 2018 2019 2020 2021
PFRS
Guaranteed Benefits (375-e)
Tier 1 16.1 19.6 22.1 21.4 19.4 18.6 19.0 18.5 18.9 20.0
Tiers 2 & 3 13.0 16.2 18.1 17.8 16.1 15.4 15.7 15.3 15.6 16.5
Tier 5* 9.3 11.8 13.0 12.7 12.1 11.4 11.7 11.3 11.8 12.6
Tier 6* — 7.0 7.3 7.2 6.4 7.1 7.3 7.0 7.3 8.0
Career (375-g)
Tier 1 17.6 21.3 24.1 23.4 21.2 20.3 20.8 20.3 20.7 21.9
Tiers 2 & 3 14.2 17.6 19.7 19.4 17.6 16.8 17.2 16.7 17.1 18.1
Tier 5* 10.4 13.1 14.5 14.2 13.5 12.8 13.0 12.6 13.2 14.0
Tier 6* — 8.2 8.6 8.5 7.6 8.4 8.5 8.2 8.6 9.3
New Career (375-i)
Tier 1 18.1 22.1 24.9 24.2 21.9 21.0 21.5 21.0 21.4 22.6
Tiers 2 & 3 14.6 18.1 20.3 19.9 18.1 17.3 17.7 17.2 17.6 18.6
Tier 5* 10.8 13.6 15.1 14.7 14.0 13.2 13.5 13.1 13.6 14.5
Tier 6* — 8.5 8.9 8.7 7.9 8.6 8.8 8.5 8.8 9.6
25-Year (384) — Contributory
Tiers 1, 2 & 3 n/a n/a n/a n/a n/a n/a n/a n/a n/a n/a
Tier 5 13.7 16.5 18.4 18.1 16.6 15.9 16.2 15.8 16.2 17.3
Tier 6 — 11.4 12.3 12.0 11.2 11.2 11.4 11.0 11.3 12.2
25-Year + 1/60ths (384(f)) — Contributory
Tiers 1, 2 & 3 n/a n/a n/a n/a n/a n/a n/a n/a n/a n/a
Tier 5 15.0 18.0 20.2 19.7 17.9 17.3 17.7 17.2 17.7 18.8
Tier 6 — 12.8 13.8 13.3 12.4 12.4 12.7 12.3 12.6 13.6
25-Year (384) — Non-Contributory
Tier 1 17.7 21.2 24.0 23.2 21.2 20.9 21.4 20.8 21.2 22.5
Tiers 2 & 3 17.6 21.2 23.9 23.1 21.0 20.2 20.6 20.1 20.5 21.6
Tier 5 16.9 20.4 22.9 22.1 20.1 19.3 19.7 19.2 19.5 20.7
Tier 6 — 18.4 20.4 19.6 17.9 17.7 18.1 17.6 17.7 18.7
25-Year + 1/60ths (384(f)) — Non-Contributory
Tier 1 19.2 23.1 26.1 25.1 22.7 22.0 22.5 21.9 22.3 23.6
Tiers 2 & 3 19.0 22.9 25.9 24.8 22.5 21.8 22.3 21.7 22.1 23.4
Tier 5 18.3 21.9 24.7 23.7 21.5 20.8 21.2 20.7 21.1 22.3
Tier 6 — 19.9 22.0 21.1 19.2 19.0 19.4 18.9 19.1 20.2
* Age-based plans in Tier 5 and Tier 6 are contributory.
There is no Tier 4 in PFRS.
CONTRIBUTION RATE TRENDS FOR LOCAL GOVERNMENTS CONTINUED

153Actuarial 2021 Comprehensive Annual Financial Report
Plan Name (Section)Percentage of Payroll
2012 2013 2014 2015 2016 2017 2018 2019 2020 2021
20-Year (384-d) — Contributory
Tiers 1, 2 & 3 n/a n/a n/a n/a n/a n/a n/a n/a n/a n/a
Tier 5 16.7 20.1 22.7 22.0 20.1 19.5 19.9 19.4 19.8 21.0
Tier 6 — 14.6 16.0 15.4 14.3 14.5 14.8 14.4 14.6 15.7
20-Year + 1/60ths (384-e) — Contributory
Tiers 1, 2 & 3 n/a n/a n/a n/a n/a n/a n/a n/a n/a n/a
Tier 5 17.0 20.5 23.0 22.3 20.4 20.2 20.6 20.1 20.6 21.9
Tier 6 — 14.9 16.3 15.6 14.5 15.1 15.4 15.0 15.3 16.4
20-Year (384-d) — Non-Contributory
Tier 1 21.5 25.7 29.2 28.0 25.4 24.7 25.2 24.6 25.0 26.4
Tier 2 20.9 25.1 28.4 27.3 24.7 24.1 24.6 24.0 24.3 25.6
Tier 3 20.4 24.2 27.5 26.1 24.4 23.8 24.3 23.7 24.2 25.7
Tier 5 20.0 24.1 27.1 26.1 23.6 22.9 23.4 22.9 23.2 24.5
Tier 6 — 21.6 24.1 23.1 21.0 21.0 21.5 20.9 21.0 22.2
20-Year + 1/60ths (384-e) — Non-Contributory
Tier 1
1990-1998 elections (avg.) 21.8 26.1 29.6 28.4 25.8 25.0 25.6 25.0 25.3 26.7
all other years 21.8 26.1 29.6 28.4 25.8 25.0 25.6 25.0 25.3 26.7
Tier 2
1990-1998 elections (avg.) 21.2 25.4 28.8 27.6 25.1 24.8 25.3 24.7 25.1 26.6
all other years 21.2 25.4 28.8 27.6 25.1 24.8 25.3 24.7 25.1 26.6
Tier 3 20.4 24.2 27.5 26.1 24.4 23.8 24.3 23.7 24.2 25.7
Tier 5 20.3 24.4 27.5 26.3 23.9 23.7 24.2 23.6 24.0 25.3
Tier 6 — 22.0 24.4 23.3 21.3 21.7 22.1 21.6 21.7 23.0
There is no Tier 4 in PFRS.
CONTRIBUTION RATE TRENDS FOR LOCAL GOVERNMENTS CONTINUED

154 Actuarial 2021 Comprehensive Annual Financial Report
Contributions reported here may differ from those appearing elsewhere in the Actuarial Section because these tables deal only with the contributions attributable to the fiscal year shown. Actual contributions may include adjustments due to previous years, such as amortization payments or credits and reconciliation of other years’ bills. Employers who opted into either of the Contribution Stabilization Programs (Chapter 57 of the Laws of 2010 and Chapter 57 of the Laws of 2013) are allowed to amortize a portion of their contribution. The following amounts show their total obligation. The average rates below are for normal, administrative and Group Life Insurance contributions.
COMPARISON OF EMPLOYER CONTRIBUTIONS*
For fiscal years ending 2020 and 2021. (Dollars in Millions)
2021 Contribution 2020 Contribution
Salary Contribution Average Rate Salary Contribution Average Rate
ERS
Tier 1 $ 67 $ 15 21.6% $ 87 $ 19 21.4%
Tier 2 82 16 19.7 108 21 19.5
Tiers 3 & 4 17,314 2,866 16.6 18,417 2,998 16.3
Tier 5 1,564 217 13.9 1,568 214 13.7
Tier 6 8,948 897 10.0 7,989 779 9.7
Total $ 27,976 $ 4,011 14.3% $ 28,169 $ 4,031 14.3%
PFRS
Tier 1 $ 2 $ - 30.6% $ 2 $ 1 29.1%
Tier 2 2,613 705 27.0 2,916 743 25.5
Tier 3 21 5 24.4 20 5 22.9
Tier 5 196 44 22.5 186 39 20.9
Tier 6 1,031 170 16.4 901 138 15.3
Total $ 3,863 $ 924 23.9% $ 4,025 $ 925 23.0%
There is no Tier 4 in PFRS.
Deficiency contributions for Fiscal Year 2021 (as of February 1, 2021) totaled $1,367,275.
* Numbers may not add up due to rounding.
EMPLOYER CONTRIBUTIONS

155Actuarial 2021 Comprehensive Annual Financial Report
FINAL EMPLOYER CONTRIBUTIONS BY EMPLOYER TYPE*
Attributable to fiscal year 2021 costs only. (Dollars in Millions)
Employer Normal Administrative GLIP Total
ERS
State $ 1,584 $ 58 $ 51 $ 1,694
Counties 674 24 20 717
Cities 96 4 4 104
Towns 218 8 8 234
Villages 71 3 3 76
Miscellaneous 614 24 24 663
Schools 485 19 19 522
Total $ 3,742 $ 140 $ 129 $ 4,011
PFRS
State $ 188 $ 5 $ - $ 193
Counties 195 5 - 200
Cities 248 6 - 254
Towns 94 2 - 97
Villages 77 2 - 79
Miscellaneous 99 3 - 101
Total $ 901 $ 23 $ - $ 924
* Numbers may not add up due to rounding.
EMPLOYER CONTRIBUTIONS BY TIER*
(Dollars in Millions)
2021 (as of February 1, 2021) 2020 (as of February 1, 2020)
Employer Contributions Attributable to Year
PercentageEmployer Contributions
Attributable to YearPercentage
ERS
Tier 1 $ 15 0.4% $ 19 0.5%
Tier 2 16 0.4 21 0.5
Tiers 3 & 4 2,866 71.5 2,998 74.4
Tier 5 217 5.4 214 5.3
Tier 6 897 22.4 779 19.3
Total $ 4,011 100.0% $ 4,031 100.0%
PFRS
Tier 1 $ 0 0.1% $ 1 0.1%
Tier 2 705 76.3 743 80.3
Tier 3 5 0.6 5 0.5
Tier 5 44 4.8 39 4.2
Tier 6 170 18.3 138 14.9
Total $ 924 100.0% $ 925 100.0%
There is no Tier 4 in PFRS.
* Numbers may not add up due to rounding.
EMPLOYER CONTRIBUTIONS CONTINUED
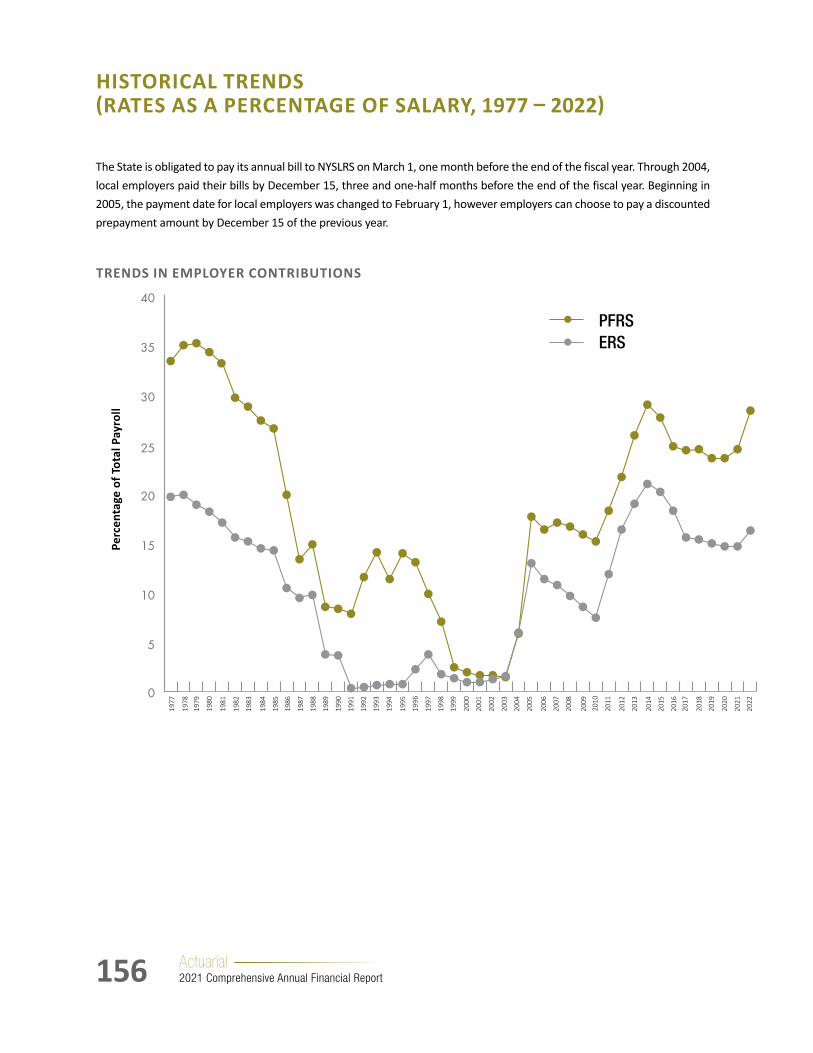
156 Actuarial 2021 Comprehensive Annual Financial Report
The State is obligated to pay its annual bill to NYSLRS on March 1, one month before the end of the fiscal year. Through 2004, local employers paid their bills by December 15, three and one-half months before the end of the fiscal year. Beginning in 2005, the payment date for local employers was changed to February 1, however employers can choose to pay a discounted prepayment amount by December 15 of the previous year.
TRENDS IN EMPLOYER CONTRIBUTIONS
0
5
10
15
20
25
30
35
40
2016
2015
2014
2013
2012
2011
2010
2009
2008
2007
2006
2005
2004
2003
2002
2001
2000
1999
1998
1997
1996
1995
1994
1993
1992
1991
1990
1989
1988
1987
1986
1985
1984
1983
1982
1981
1980
1979
1978
1977
2018
2017
2019
2020
2021
2022
ERSPFRS
HISTORICAL TRENDS (RATESASAPERCENTAGEOFSALARY,1977–2022)
Perc
enta
ge o
f Tot
al P
ayro
ll

157Actuarial 2021 Comprehensive Annual Financial Report
The System’s experience in many areas (employee salary growth or decrease, investment return, legislative enactment of benefits) is assessed and quantified yearly. Each element can exert an increasing or decreasing pressure, or have no impact on contributions to be charged for that year.
ANALYSISOFCHANGES(BYSOURCE)
Experience during one fiscal year produces the increase or decrease in contributions for the following year.(Dollars in Millions)
Fiscal Year Valuation Date
Fiscal Year Bill Date
Contributions for Preceding Fiscal Year Bill
Salary Growth
Return on Investments
Assumption Changes
Changes in Benefits
Other Adjustments
Projected Contributions for
Fiscal Year Shown*
ERS
2011 2013 3,948 15 570 202 n/a (81) 4,654
2012 2014 4,627 119 870 (9) n/a (343) 5,264
2013 2015 5,243 97 521 (539) n/a (182) 5,140
2014 2016 5,143 (24) (937) 633 n/a (187) 4,628
2015 2017 4,515 35 (396) 273 n/a (433) 3,994
2016 2018 3,995 85 120 22 n/a (195) 4,027
2017 2019 4,005 108 (123) 131 n/a (111) 4,010
2018 2020 3,977 39 (210) 298 n/a (123) 3,981
2019 2021 3,998 128 50 105 n/a (166) 4,115
2020 2022 4,113 120 511 246 n/a (308) 4,682
PFRS
2011 2013 693 18 93 (8) n/a 53 849
2012 2014 827 25 142 (1) n/a (36) 957
2013 2015 936 3 79 (83) n/a (18) 917
2014 2016 917 23 (143) 52 n/a (7) 842
2015 2017 809 1 (70) 161 n/a (73) 828
2016 2018 857 60 17 36 n/a (75) 895
2017 2019 888 31 (21) 12 n/a (19) 891
2018 2020 866 (3) (34) 49 n/a 8 886
2019 2021 875 12 6 53 n/a (15) 931
2020 2022 981 136 85 133 n/a (115) 1,220
* This is an estimated figure. Minor adjustments, mostly salary-related, result in the final contribution figure for the year as shown in the Contributions for Preceding Fiscal Year Bill column.
Note: Chapter 94 of the Laws of 2015 changed the definition of billing salary beginning with fiscal year 2016. The billing rates are now applied to salaries as of the end of the previous fiscal year, rather than the end of the fiscal year when the contributions are made.
The Projected Contributions for Fiscal Year Shown is now based on one year of salary projection (previously a two-year projection) and the Contributions for Preceding Fiscal Year Bill is based on known salaries from the previous fiscal year (previously a one-year projection). This explains the large decrease in contributions from the projected to the actual amount for fiscal year 2016.
CHANGES IN CONTRIBUTIONS
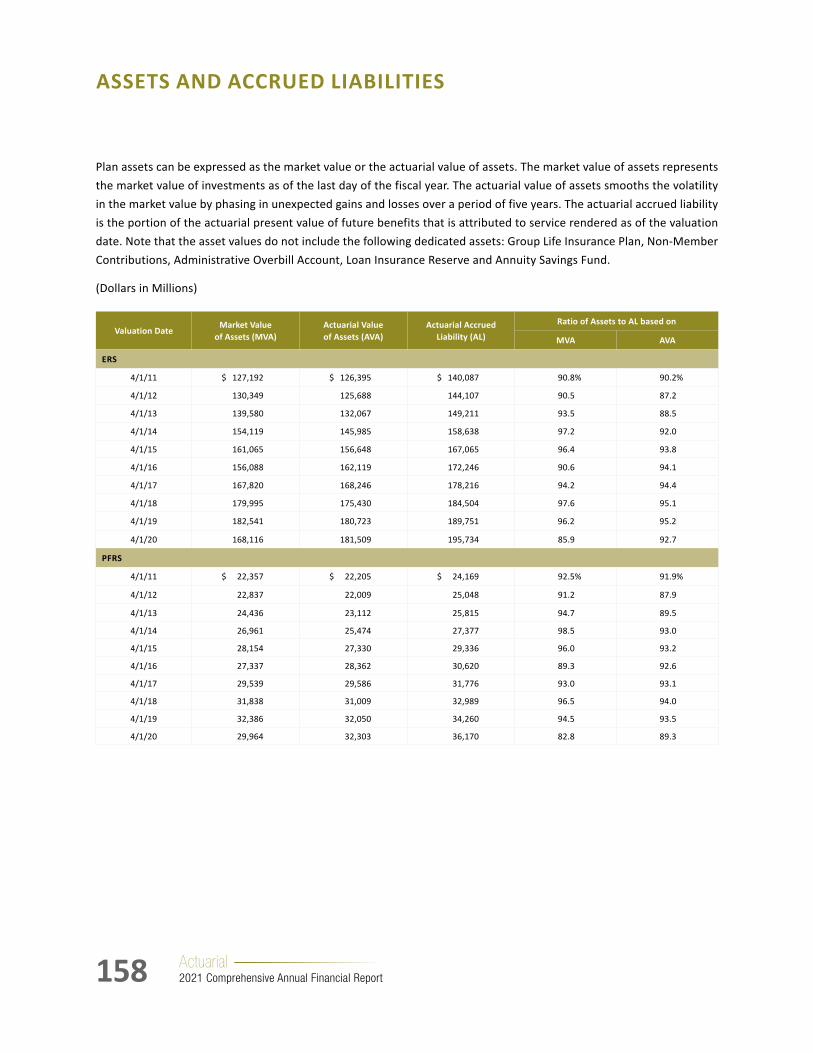
158 Actuarial 2021 Comprehensive Annual Financial Report
ASSETS AND ACCRUED LIABILITIES
Plan assets can be expressed as the market value or the actuarial value of assets. The market value of assets represents the market value of investments as of the last day of the fiscal year. The actuarial value of assets smooths the volatility in the market value by phasing in unexpected gains and losses over a period of five years. The actuarial accrued liability is the portion of the actuarial present value of future benefits that is attributed to service rendered as of the valuation date. Note that the asset values do not include the following dedicated assets: Group Life Insurance Plan, Non-Member Contributions, Administrative Overbill Account, Loan Insurance Reserve and Annuity Savings Fund.
(Dollars in Millions)
Valuation DateMarket Value
of Assets (MVA)Actuarial Value of Assets (AVA)
Actuarial Accrued Liability (AL)
Ratio of Assets to AL based on
MVA AVA
ERS
4/1/11 $ 127,192 $ 126,395 $ 140,087 90.8% 90.2%
4/1/12 130,349 125,688 144,107 90.5 87.2
4/1/13 139,580 132,067 149,211 93.5 88.5
4/1/14 154,119 145,985 158,638 97.2 92.0
4/1/15 161,065 156,648 167,065 96.4 93.8
4/1/16 156,088 162,119 172,246 90.6 94.1
4/1/17 167,820 168,246 178,216 94.2 94.4
4/1/18 179,995 175,430 184,504 97.6 95.1
4/1/19 182,541 180,723 189,751 96.2 95.2
4/1/20 168,116 181,509 195,734 85.9 92.7
PFRS
4/1/11 $ 22,357 $ 22,205 $ 24,169 92.5% 91.9%
4/1/12 22,837 22,009 25,048 91.2 87.9
4/1/13 24,436 23,112 25,815 94.7 89.5
4/1/14 26,961 25,474 27,377 98.5 93.0
4/1/15 28,154 27,330 29,336 96.0 93.2
4/1/16 27,337 28,362 30,620 89.3 92.6
4/1/17 29,539 29,586 31,776 93.0 93.1
4/1/18 31,838 31,009 32,989 96.5 94.0
4/1/19 32,386 32,050 34,260 94.5 93.5
4/1/20 29,964 32,303 36,170 82.8 89.3

159Actuarial 2021 Comprehensive Annual Financial Report
The System is funded in accordance with the aggregate method. The following solvency test is one means of checking the System’s funding progress. In this test, the System’s actuarial value of assets is compared to:
(1) the required member contributions on deposit;
(2) the liabilities for future benefits to persons who have retired; and
(3) the employer-financed liabilities for service already rendered by active members.
The accrued liabilities in this chart are calculated in accordance with the entry age normal method.
Valuation Date
Accrued Liability(Dollars in Millions) Actuarial
Assets(Dollars in Millions)
Portion of Actuarial Accrued Liabilities Covered by Actuarial Assets
Member Contributions
(1) Retiree
(2)Active
(3)Total
(1) + (2) + (3) (1) (2) (3)
ERS
4/1/11 $ 8,214 $ 67,412 $ 64,461 $ 140,087 $ 126,395 100.0% 100.0% 78.8%
4/1/12 8,168 75,210 60,729 144,107 125,688 100.0 100.0 69.7
4/1/13 8,328 78,743 62,140 149,211 132,067 100.0 100.0 72.4
4/1/14 8,462 85,528 64,648 158,638 145,985 100.0 100.0 80.4
4/1/15 8,608 90,163 68,294 167,065 156,648 100.0 100.0 84.7
4/1/16 8,635 95,102 68,509 172,246 162,119 100.0 100.0 85.2
4/1/17 8,666 100,320 69,230 178,216 168,246 100.0 100.0 85.6
4/1/18 8,537 107,506 68,461 184,504 175,430 100.0 100.0 86.7
4/1/19 8,567 111,708 69,476 189,751 180,723 100.0 100.0 87.0
4/1/20 8,273 116,711 70,750 195,734 181,509 100.0 100.0 79.9
PFRS
4/1/11 $ 29 $ 13,383 $ 10,757 $ 24,169 $ 22,205 100.0% 100.0% 81.7%
4/1/12 2 14,060 10,986 25,048 22,009 100.0 100.0 72.3
4/1/13 5 14,948 10,862 25,815 23,112 100.0 100.0 75.1
4/1/14 10 15,958 11,409 27,377 25,474 100.0 100.0 83.3
4/1/15 20 17,072 12,244 29,336 27,330 100.0 100.0 83.6
4/1/16 34 17,599 12,987 30,620 28,362 100.0 100.0 82.6
4/1/17 55 18,920 12,801 31,776 29,586 100.0 100.0 82.9
4/1/18 85 20,265 12,639 32,989 31,009 100.0 100.0 84.3
4/1/19 125 21,625 12,510 34,260 32,050 100.0 100.0 82.3
4/1/20 175 23,038 12,957 36,170 32,303 100.0 100.0 70.2
SOLVENCY TEST
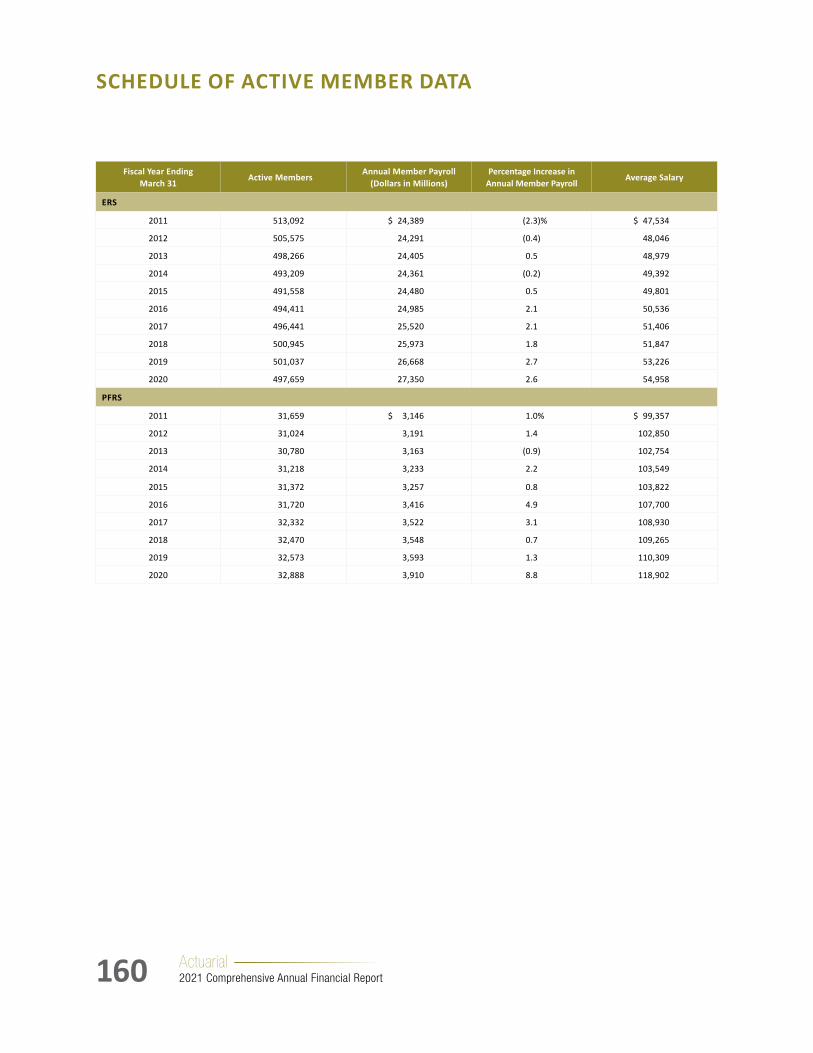
160 Actuarial 2021 Comprehensive Annual Financial Report
Fiscal Year Ending March 31
Active MembersAnnual Member Payroll
(Dollars in Millions)Percentage Increase in
Annual Member PayrollAverage Salary
ERS
2011 513,092 $ 24,389 (2.3)% $ 47,534
2012 505,575 24,291 (0.4) 48,046
2013 498,266 24,405 0.5 48,979
2014 493,209 24,361 (0.2) 49,392
2015 491,558 24,480 0.5 49,801
2016 494,411 24,985 2.1 50,536
2017 496,441 25,520 2.1 51,406
2018 500,945 25,973 1.8 51,847
2019 501,037 26,668 2.7 53,226
2020 497,659 27,350 2.6 54,958
PFRS
2011 31,659 $ 3,146 1.0% $ 99,357
2012 31,024 3,191 1.4 102,850
2013 30,780 3,163 (0.9) 102,754
2014 31,218 3,233 2.2 103,549
2015 31,372 3,257 0.8 103,822
2016 31,720 3,416 4.9 107,700
2017 32,332 3,522 3.1 108,930
2018 32,470 3,548 0.7 109,265
2019 32,573 3,593 1.3 110,309
2020 32,888 3,910 8.8 118,902
SCHEDULE OF ACTIVE MEMBER DATA

161Actuarial 2021 Comprehensive Annual Financial Report
Fiscal Year
Number of Retired Members and Beneficiaries
Annual Benefits of Retired Members and Beneficiaries Total Number
of Retired Members and Beneficiaries
Total Annual Benefit
Percentage Increase in
Total Annual Benefits
Average Annual BenefitAdded
During the Year
Removed During
the Year
Added During
the Year
Removed During
the Year
ERS
2011 22,733 13,899 $ 683,435,574 $ 186,508,676 353,940 $ 7,302,355,926 7.30% $ 20,632
2012 31,906 14,378 990,541,993 198,660,208 371,468 8,094,237,711 10.84 21,790
2013 23,424 13,993 627,992,358 207,014,141 380,899 8,515,215,928 5.20 22,356
2014 23,320 14,931 636,672,277 229,131,028 389,288 8,922,757,178 4.79 22,921
2015 21,832 14,339 615,594,488 225,462,412 396,781 9,312,889,254 4.37 23,471
2016 25,517 15,186 764,025,727 247,047,150 407,112 9,829,867,831 5.55 24,145
2017 25,828 15,441 783,795,021 260,190,707 417,499 10,353,472,145 5.33 24,799
2018 31,709 14,655 974,084,983 248,074,441 434,553 11,079,482,687 7.01 25,496
2019 26,559 16,393 860,370,424 283,931,808 444,719 11,655,921,302 5.20 26,210
2020 25,018 19,931 824,249,961 318,809,092 449,806 12,161,362,171 4.34 27,037
PFRS
2011 1,184 790 $ 80,517,204 $ 24,073,826 31,091 $ 1,349,973,282 4.36% $ 43,420
2012 1,403 788 97,599,791 23,890,471 31,706 1,423,682,602 5.46 44,903
2013 1,629 798 120,115,279 25,836,637 32,537 1,517,961,244 6.62 46,653
2014 1,431 851 99,767,882 27,650,778 33,117 1,590,078,348 4.75 48,014
2015 1,222 812 89,763,321 27,980,968 33,527 1,651,860,701 3.89 49,270
2016 1,163 859 90,801,381 30,667,776 33,831 1,711,994,306 3.64 50,604
2017 2,028 903 157,020,746 32,764,190 34,956 1,836,250,862 7.26 52,530
2018 2,027 940 162,851,223 34,346,639 36,043 1,964,755,446 7.00 54,511
2019 2,011 978 169,652,095 37,229,104 37,076 2,097,178,437 6.74 55,564
2020 1,763 1,238 146,089,459 59,162,270 37,601 2,184,105,626 4.14 58,086
For both systems, annual benefits are based on option 0 benefits (prior to option selection and partial lump sum distribution) plus cost-of-living adjustments (COLA).
SCHEDULE OF RETIRED MEMBERS AND BENEFICIARIESAdded to and Removed from Benefit Payroll

162 Actuarial 2021 Comprehensive Annual Financial Report
This page intentionally left blank.

StatisticalWe are accountable to our membership. Our members and retirees rely on us
to manage the Fund responsibly and keep their future benefits secure. By being
transparent about our financial health and reporting practices, NYSLRS members
can remain confident that their pensions will be there for them in retirement.
A Century of Accountability
NYSLRS1921–2021

164 Statistical 2021 Comprehensive Annual Financial Report
CONTENTS
Schedule of Additions to Fiduciary Net Position ....................................................................................... 165
Schedule of Investment Income/(Loss) ................................................................................................... 166
Schedule of Deductions from Fiduciary Net Position ................................................................................. 167
Schedule of Total Changes in Fiduciary Net Position .................................................................................. 168
Service Retirees — ERS ...................................................................................................................... 170
Service Retirees — PFRS..................................................................................................................... 172
Disability Retirees — ERS ................................................................................................................... 174
Disability Retirees — PFRS .................................................................................................................. 176
New Option Selections ...................................................................................................................... 178
Option Selections — Total Payments ..................................................................................................... 179
Average Pension Benefits Paid During Year Shown .................................................................................... 180
Average Benefit Pay Types .................................................................................................................. 181
New Benefits — Service Retirements by Age and Service ...........................................................................183
New Benefits — Accidental and Ordinary Death ....................................................................................... 184
Combined System Participants ............................................................................................................. 185
Membership by Age and Years of Service ............................................................................................... 186
Membership by Tier .......................................................................................................................... 187
Membership by Status ....................................................................................................................... 188
Number of Employers ....................................................................................................................... 189
Total Membership by Employer Type .................................................................................................... 190
Average Salary by Employer Type ......................................................................................................... 191
Members and Salaries by Plan — ERS .................................................................................................... 192
Members and Salaries by Plan — PFRS .................................................................................................. 194
Retirees and Beneficiaries by Age ......................................................................................................... 196
Retirees and Beneficiaries — ERS ......................................................................................................... 197
Retirees and Beneficiaries — PFRS ........................................................................................................ 198
Local Government Salaries and Billings — ERS ......................................................................................... 199
Local Government Salaries and Billings — PFRS........................................................................................201
Contributions Recorded 2012 – 2021 .................................................................................................... 203
20-Year Summary ............................................................................................................................. 204
Notes to 20-Year Summary ................................................................................................................. 206

165Statistical 2021 Comprehensive Annual Financial Report
SCHEDULE OF ADDITIONS TO FIDUCIARY NET POSITION
(Dollars in Thousands)
Year EndingMember
ContributionsEmployer
ContributionsOther
Income*Investment
Income/(Loss)Total
2021 $ 492,341 $ 5,029,790 $ 116,652 $ 70,649,606 $ 76,288,389
ERS 427,032 4,062,302 103,941 59,964,043 64,557,318
PFRS 65,309 967,488 12,711 10,685,563 11,731,071
2020 $ 453,698 $ 4,782,706 $ 146,762 $ (8,798,771 ) $ (3,415,605 )
ERS 395,338 3,920,360 138,859 (7,470,542) (3,015,985)
PFRS 58,360 862,346 7,903 (1,328,229) (399,620)
2019 $ 386,519 $ 4,744,309 $ 170,154 $ 10,761,776 $ 16,062,758
ERS 345,846 3,890,215 160,431 9,140,487 13,536,979
PFRS 40,673 854,094 9,723 1,621,289 2,525,779
2018 $ 349,389 $ 4,823,307 $ 215,614 $ 21,338,033 $ 26,726,343
ERS 318,439 3,949,873 181,725 18,128,993 22,579,030
PFRS 30,950 873,434 33,889 3,209,040 4,147,313
2017 $ 328,827 $ 4,786,963 $ 236,401 $ 20,225,244 $ 25,577,435
ERS 306,218 3,949,710 200,379 17,194,267 21,650,574
PFRS 22,609 837,253 36,022 3,030,977 3,926,861
2016 $ 306,631 $ 5,140,204 $ 332,880 $ (384,834 ) $ 5,394,881
ERS 289,333 4,347,619 198,332 (327,069) 4,508,215
PFRS 17,298 792,585 134,548 (57,765) 886,666
2015 $ 284,793 $ 5,797,449 $ 230,799 $ 12,444,891 $ 18,757,932
ERS 272,004 4,893,110 193,176 10,582,102 15,940,392
PFRS 12,789 904,339 37,623 1,862,789 2,817,540
2014 $ 281,398 $ 6,064,133 $ 192,581 $ 20,598,593 $ 27,136,705
ERS 273,545 5,137,935 175,677 17,496,541 23,083,698
PFRS 7,853 926,198 16,904 3,102,052 4,053,007
2013 $ 269,134 $ 5,336,045 $ 131,853 $ 14,717,622 $ 20,454,654
ERS 264,788 4,524,395 122,931 12,496,378 17,408,492
PFRS 4,346 811,650 8,922 2,221,244 3,046,162
2012 $ 273,247 $ 4,585,178 $ 157,625 $ 7,868,313 $ 12,884,363
ERS 268,545 3,878,717 134,821 6,681,603 10,963,686
PFRS 4,702 706,461 22,804 1,186,710 1,920,677
* Includes interest earned on member loans, interest on accounts receivable and transfers from other systems.
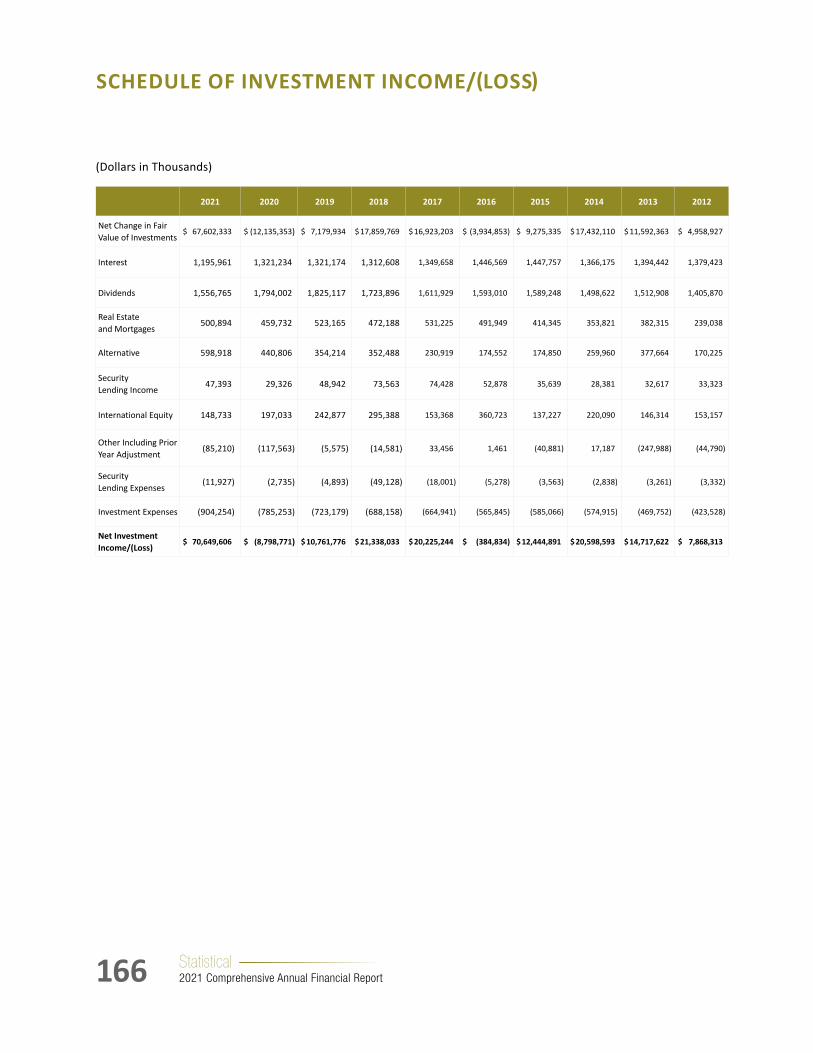
166 Statistical 2021 Comprehensive Annual Financial Report
SCHEDULEOFINVESTMENTINCOME/(LOSS)
(Dollars in Thousands)
2021 2020 2019 2018 2017 2016 2015 2014 2013 2012
Net Change in Fair Value of Investments
$ 67,602,333 $ (12,135,353) $ 7,179,934 $ 17,859,769 $ 16,923,203 $ (3,934,853) $ 9,275,335 $ 17,432,110 $ 11,592,363 $ 4,958,927
Interest 1,195,961 1,321,234 1,321,174 1,312,608 1,349,658 1,446,569 1,447,757 1,366,175 1,394,442 1,379,423
Dividends 1,556,765 1,794,002 1,825,117 1,723,896 1,611,929 1,593,010 1,589,248 1,498,622 1,512,908 1,405,870
Real Estate and Mortgages
500,894 459,732 523,165 472,188 531,225 491,949 414,345 353,821 382,315 239,038
Alternative 598,918 440,806 354,214 352,488 230,919 174,552 174,850 259,960 377,664 170,225
Security Lending Income
47,393 29,326 48,942 73,563 74,428 52,878 35,639 28,381 32,617 33,323
International Equity 148,733 197,033 242,877 295,388 153,368 360,723 137,227 220,090 146,314 153,157
Other Including Prior Year Adjustment
(85,210) (117,563) (5,575) (14,581) 33,456 1,461 (40,881) 17,187 (247,988) (44,790)
Security Lending Expenses
(11,927) (2,735) (4,893) (49,128) (18,001) (5,278) (3,563) (2,838) (3,261) (3,332)
Investment Expenses (904,254) (785,253) (723,179) (688,158) (664,941) (565,845) (585,066) (574,915) (469,752) (423,528)
Net Investment Income/(Loss)
$ 70,649,606 $ (8,798,771) $ 10,761,776 $ 21,338,033 $ 20,225,244 $ (384,834) $ 12,444,891 $ 20,598,593 $ 14,717,622 $ 7,868,313
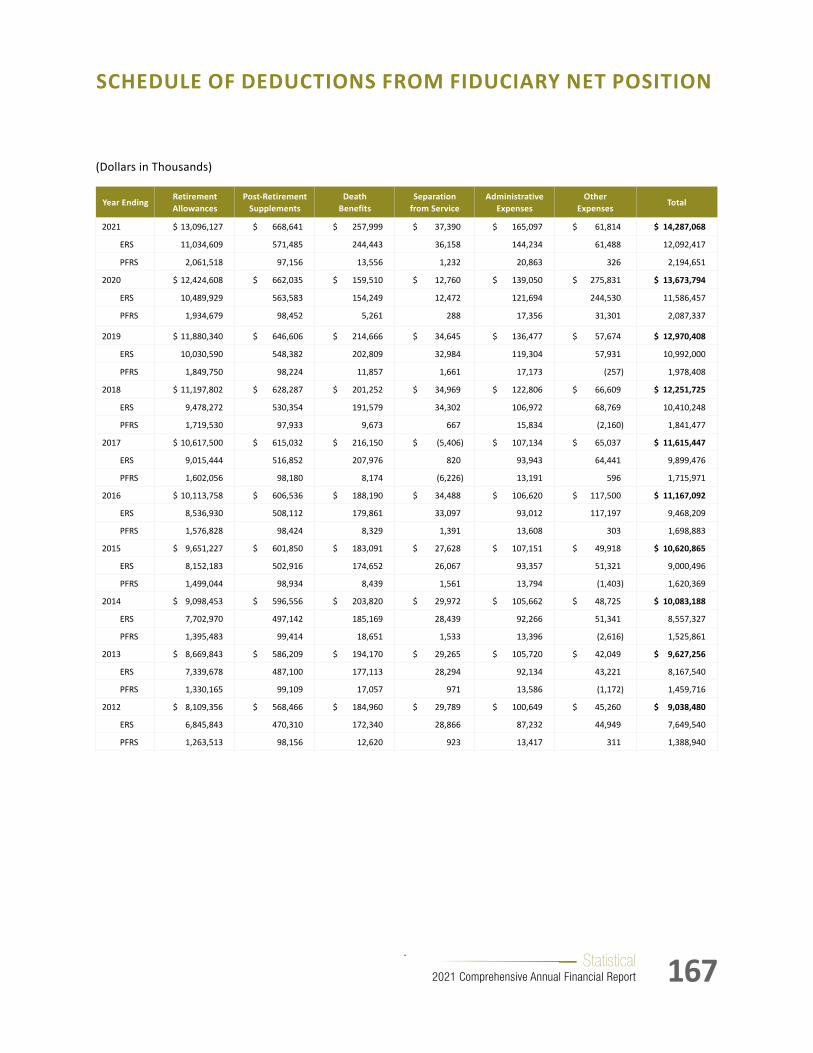
167Statistical 2021 Comprehensive Annual Financial Report
SCHEDULE OF DEDUCTIONS FROM FIDUCIARY NET POSITION
(Dollars in Thousands)
Year EndingRetirement Allowances
Post-Retirement Supplements
Death Benefits
Separation from Service
Administrative Expenses
Other Expenses
Total
2021 $ 13,096,127 $ 668,641 $ 257,999 $ 37,390 $ 165,097 $ 61,814 $ 14,287,068
ERS 11,034,609 571,485 244,443 36,158 144,234 61,488 12,092,417
PFRS 2,061,518 97,156 13,556 1,232 20,863 326 2,194,651
2020 $ 12,424,608 $ 662,035 $ 159,510 $ 12,760 $ 139,050 $ 275,831 $ 13,673,794
ERS 10,489,929 563,583 154,249 12,472 121,694 244,530 11,586,457
PFRS 1,934,679 98,452 5,261 288 17,356 31,301 2,087,337
2019 $ 11,880,340 $ 646,606 $ 214,666 $ 34,645 $ 136,477 $ 57,674 $ 12,970,408
ERS 10,030,590 548,382 202,809 32,984 119,304 57,931 10,992,000
PFRS 1,849,750 98,224 11,857 1,661 17,173 (257) 1,978,408
2018 $ 11,197,802 $ 628,287 $ 201,252 $ 34,969 $ 122,806 $ 66,609 $ 12,251,725
ERS 9,478,272 530,354 191,579 34,302 106,972 68,769 10,410,248
PFRS 1,719,530 97,933 9,673 667 15,834 (2,160) 1,841,477
2017 $ 10,617,500 $ 615,032 $ 216,150 $ (5,406) $ 107,134 $ 65,037 $ 11,615,447
ERS 9,015,444 516,852 207,976 820 93,943 64,441 9,899,476
PFRS 1,602,056 98,180 8,174 (6,226) 13,191 596 1,715,971
2016 $ 10,113,758 $ 606,536 $ 188,190 $ 34,488 $ 106,620 $ 117,500 $ 11,167,092
ERS 8,536,930 508,112 179,861 33,097 93,012 117,197 9,468,209
PFRS 1,576,828 98,424 8,329 1,391 13,608 303 1,698,883
2015 $ 9,651,227 $ 601,850 $ 183,091 $ 27,628 $ 107,151 $ 49,918 $ 10,620,865
ERS 8,152,183 502,916 174,652 26,067 93,357 51,321 9,000,496
PFRS 1,499,044 98,934 8,439 1,561 13,794 (1,403) 1,620,369
2014 $ 9,098,453 $ 596,556 $ 203,820 $ 29,972 $ 105,662 $ 48,725 $ 10,083,188
ERS 7,702,970 497,142 185,169 28,439 92,266 51,341 8,557,327
PFRS 1,395,483 99,414 18,651 1,533 13,396 (2,616) 1,525,861
2013 $ 8,669,843 $ 586,209 $ 194,170 $ 29,265 $ 105,720 $ 42,049 $ 9,627,256
ERS 7,339,678 487,100 177,113 28,294 92,134 43,221 8,167,540
PFRS 1,330,165 99,109 17,057 971 13,586 (1,172) 1,459,716
2012 $ 8,109,356 $ 568,466 $ 184,960 $ 29,789 $ 100,649 $ 45,260 $ 9,038,480
ERS 6,845,843 470,310 172,340 28,866 87,232 44,949 7,649,540
PFRS 1,263,513 98,156 12,620 923 13,417 311 1,388,940

168 Statistical 2021 Comprehensive Annual Financial Report
(Dollars in Thousands)
Year Ending Member Contributions Employer Contributions Other IncomeInvestment
Income/(Loss)Total Additions
Retirement Allowances
Post-Retirement Supplement
Death Benefits
Separation from Service
Administrative Expenses
Other Expenses
Total DeductionsNet Increase /
Decrease
2021 $ 492,341 $ 5,029,790 $ 116,652 $ 70,649,606 $ 76,288,389 $ 13,096,127 $ 668,641 $ 257,999 $ 37,390 $ 165,097 $ 61,814 $ 14,287,068 $ 62,001,321
ERS 427,032 4,062,302 103,941 59,964,043 64,557,318 11,034,609 571,485 244,443 36,158 144,234 61,488 12,092,417 52,464,901
PFRS 65,309 967,488 12,711 10,685,563 11,731,071 2,061,518 97,156 13,556 1,232 20,863 326 2,194,651 9,536,420
2020 $ 453,698 $ 4,782,706 $ 146,762 $ (8,798,771) $ (3,415,605 ) $ 12,424,608 $ 662,035 $ 159,510 $ 12,760 $ 139,050 $ 275,831 $ 13,673,794 $ (17,089,399 )
ERS 395,338 3,920,360 138,859 (7,470,542) (3,015,985) 10,489,929 563,583 154,249 12,472 121,694 244,530 11,586,457 (14,602,442)
PFRS 58,360 862,346 7,903 (1,328,229) (399,620) 1,934,679 98,452 5,261 288 17,356 31,301 2,087,337 (2,486,957)
2019 $ 386,519 $ 4,744,309 $ 170,154 $ 10,761,776 $ 16,062,758 $ 11,880,340 $ 646,606 $ 214,666 $ 34,645 $ 136,477 $ 57,674 $ 12,970,408 $ 3,092,350
ERS 345,846 3,890,215 160,431 9,140,487 13,536,979 10,030,590 548,382 202,809 32,984 119,304 57,931 10,992,000 2,544,979
PFRS 40,673 854,094 9,723 1,621,289 2,525,779 1,849,750 98,224 11,857 1,661 17,173 (257) 1,978,408 547,371
2018 $ 349,389 $ 4,823,307 $ 215,614 $ 21,338,033 $ 26,726,343 $ 11,197,802 $ 628,287 $ 201,252 $ 34,969 $ 122,806 $ 66,609 $ 12,251,725 $ 14,474,618
ERS 318,439 3,949,873 181,725 18,128,993 22,579,030 9,478,272 530,354 191,579 34,302 106,972 68,769 10,410,248 12,168,782
PFRS 30,950 873,434 33,889 3,209,040 4,147,313 1,719,530 97,933 9,673 667 15,834 (2,160) 1,841,477 2,305,836
2017 $ 328,827 $ 4,786,963 $ 236,401 $ 20,225,244 $ 25,577,435 $ 10,617,500 $ 615,032 $ 216,150 $ (5,406) $ 107,134 $ 65,037 $ 11,615,447 $ 13,961,988
ERS 306,218 3,949,710 200,379 17,194,267 21,650,574 9,015,444 516,852 207,976 820 93,943 64,441 9,899,476 11,751,098
PFRS 22,609 837,253 36,022 3,030,977 3,926,861 1,602,056 98,180 8,174 (6,226) 13,191 596 1,715,971 2,210,890
2016 $ 306,631 $ 5,140,204 $ 332,880 $ (384,834) $ 5,394,881 $ 10,113,758 $ 606,536 $ 188,190 $ 34,488 $ 106,620 $ 117,500 $ 11,167,092 $ (5,772,211)
ERS 289,333 4,347,619 198,332 (327,069) 4,508,215 8,536,930 508,112 179,861 33,097 93,012 117,197 9,468,209 (4,959,994)
PFRS 17,298 792,585 134,548 (57,765) 886,666 1,576,828 98,424 8,329 1,391 13,608 303 1,698,883 (812,217)
2015 $ 284,793 $ 5,797,449 $ 230,799 $ 12,444,891 $ 18,757,932 $ 9,651,227 $ 601,850 $ 183,091 $ 27,628 $ 107,151 $ 49,918 $ 10,620,865 $ 8,137,067
ERS 272,004 4,893,110 193,176 10,582,102 15,940,392 8,152,183 502,916 174,652 26,067 93,357 51,321 9,000,496 6,939,896
PFRS 12,789 904,339 37,623 1,862,789 2,817,540 1,499,044 98,934 8,439 1,561 13,794 (1,403) 1,620,369 1,197,171
2014 $ 281,398 $ 6,064,133 $ 192,581 $ 20,598,593 $ 27,136,705 $ 9,098,453 $ 596,556 $ 203,820 $ 29,972 $ 105,662 $ 48,725 $ 10,083,188 $ 17,053,517
ERS 273,545 5,137,935 175,677 17,496,541 23,083,698 7,702,970 497,142 185,169 28,439 92,266 51,341 8,557,327 14,526,371
PFRS 7,853 926,198 16,904 3,102,052 4,053,007 1,395,483 99,414 18,651 1,533 13,396 (2,616) 1,525,861 2,527,146
2013 $ 269,134 $ 5,336,045 $ 131,853 $ 14,717,622 $ 20,454,654 $ 8,669,843 $ 586,209 $ 194,170 $ 29,265 $ 105,720 $ 42,049 $ 9,627,256 $ 10,827,398
ERS 264,788 4,524,395 122,931 12,496,378 17,408,492 7,339,678 487,100 177,113 28,294 92,134 43,221 8,167,540 9,240,952
PFRS 4,346 811,650 8,922 2,221,244 3,046,162 1,330,165 99,109 17,057 971 13,586 (1,172) 1,459,716 1,586,446
2012 $ 273,247 $ 4,585,178 $ 157,625 $ 7,868,313 $ 12,884,363 $ 8,109,356 $ 568,466 $ 184,960 $ 29,789 $ 100,649 $ 45,260 $ 9,038,480 $ 3,845,883
ERS 268,545 3,878,717 134,821 6,681,603 10,963,686 6,845,843 470,310 172,340 28,866 87,232 44,949 7,649,540 3,314,146
PFRS 4,702 706,461 22,804 1,186,710 1,920,677 1,263,513 98,156 12,620 923 13,417 311 1,388,940 531,737
SCHEDULE OF TOTAL CHANGES IN FIDUCIARY NET POSITION

169Statistical 2021 Comprehensive Annual Financial Report
SCHEDULE OF TOTAL CHANGES IN FIDUCIARY NET POSITION CONTINUED
(Dollars in Thousands)
Year Ending Member Contributions Employer Contributions Other IncomeInvestment
Income/(Loss)Total Additions
Retirement Allowances
Post-Retirement Supplement
Death Benefits
Separation from Service
Administrative Expenses
Other Expenses
Total DeductionsNet Increase /
Decrease
2021 $ 492,341 $ 5,029,790 $ 116,652 $ 70,649,606 $ 76,288,389 $ 13,096,127 $ 668,641 $ 257,999 $ 37,390 $ 165,097 $ 61,814 $ 14,287,068 $ 62,001,321
ERS 427,032 4,062,302 103,941 59,964,043 64,557,318 11,034,609 571,485 244,443 36,158 144,234 61,488 12,092,417 52,464,901
PFRS 65,309 967,488 12,711 10,685,563 11,731,071 2,061,518 97,156 13,556 1,232 20,863 326 2,194,651 9,536,420
2020 $ 453,698 $ 4,782,706 $ 146,762 $ (8,798,771) $ (3,415,605 ) $ 12,424,608 $ 662,035 $ 159,510 $ 12,760 $ 139,050 $ 275,831 $ 13,673,794 $ (17,089,399 )
ERS 395,338 3,920,360 138,859 (7,470,542) (3,015,985) 10,489,929 563,583 154,249 12,472 121,694 244,530 11,586,457 (14,602,442)
PFRS 58,360 862,346 7,903 (1,328,229) (399,620) 1,934,679 98,452 5,261 288 17,356 31,301 2,087,337 (2,486,957)
2019 $ 386,519 $ 4,744,309 $ 170,154 $ 10,761,776 $ 16,062,758 $ 11,880,340 $ 646,606 $ 214,666 $ 34,645 $ 136,477 $ 57,674 $ 12,970,408 $ 3,092,350
ERS 345,846 3,890,215 160,431 9,140,487 13,536,979 10,030,590 548,382 202,809 32,984 119,304 57,931 10,992,000 2,544,979
PFRS 40,673 854,094 9,723 1,621,289 2,525,779 1,849,750 98,224 11,857 1,661 17,173 (257) 1,978,408 547,371
2018 $ 349,389 $ 4,823,307 $ 215,614 $ 21,338,033 $ 26,726,343 $ 11,197,802 $ 628,287 $ 201,252 $ 34,969 $ 122,806 $ 66,609 $ 12,251,725 $ 14,474,618
ERS 318,439 3,949,873 181,725 18,128,993 22,579,030 9,478,272 530,354 191,579 34,302 106,972 68,769 10,410,248 12,168,782
PFRS 30,950 873,434 33,889 3,209,040 4,147,313 1,719,530 97,933 9,673 667 15,834 (2,160) 1,841,477 2,305,836
2017 $ 328,827 $ 4,786,963 $ 236,401 $ 20,225,244 $ 25,577,435 $ 10,617,500 $ 615,032 $ 216,150 $ (5,406) $ 107,134 $ 65,037 $ 11,615,447 $ 13,961,988
ERS 306,218 3,949,710 200,379 17,194,267 21,650,574 9,015,444 516,852 207,976 820 93,943 64,441 9,899,476 11,751,098
PFRS 22,609 837,253 36,022 3,030,977 3,926,861 1,602,056 98,180 8,174 (6,226) 13,191 596 1,715,971 2,210,890
2016 $ 306,631 $ 5,140,204 $ 332,880 $ (384,834) $ 5,394,881 $ 10,113,758 $ 606,536 $ 188,190 $ 34,488 $ 106,620 $ 117,500 $ 11,167,092 $ (5,772,211)
ERS 289,333 4,347,619 198,332 (327,069) 4,508,215 8,536,930 508,112 179,861 33,097 93,012 117,197 9,468,209 (4,959,994)
PFRS 17,298 792,585 134,548 (57,765) 886,666 1,576,828 98,424 8,329 1,391 13,608 303 1,698,883 (812,217)
2015 $ 284,793 $ 5,797,449 $ 230,799 $ 12,444,891 $ 18,757,932 $ 9,651,227 $ 601,850 $ 183,091 $ 27,628 $ 107,151 $ 49,918 $ 10,620,865 $ 8,137,067
ERS 272,004 4,893,110 193,176 10,582,102 15,940,392 8,152,183 502,916 174,652 26,067 93,357 51,321 9,000,496 6,939,896
PFRS 12,789 904,339 37,623 1,862,789 2,817,540 1,499,044 98,934 8,439 1,561 13,794 (1,403) 1,620,369 1,197,171
2014 $ 281,398 $ 6,064,133 $ 192,581 $ 20,598,593 $ 27,136,705 $ 9,098,453 $ 596,556 $ 203,820 $ 29,972 $ 105,662 $ 48,725 $ 10,083,188 $ 17,053,517
ERS 273,545 5,137,935 175,677 17,496,541 23,083,698 7,702,970 497,142 185,169 28,439 92,266 51,341 8,557,327 14,526,371
PFRS 7,853 926,198 16,904 3,102,052 4,053,007 1,395,483 99,414 18,651 1,533 13,396 (2,616) 1,525,861 2,527,146
2013 $ 269,134 $ 5,336,045 $ 131,853 $ 14,717,622 $ 20,454,654 $ 8,669,843 $ 586,209 $ 194,170 $ 29,265 $ 105,720 $ 42,049 $ 9,627,256 $ 10,827,398
ERS 264,788 4,524,395 122,931 12,496,378 17,408,492 7,339,678 487,100 177,113 28,294 92,134 43,221 8,167,540 9,240,952
PFRS 4,346 811,650 8,922 2,221,244 3,046,162 1,330,165 99,109 17,057 971 13,586 (1,172) 1,459,716 1,586,446
2012 $ 273,247 $ 4,585,178 $ 157,625 $ 7,868,313 $ 12,884,363 $ 8,109,356 $ 568,466 $ 184,960 $ 29,789 $ 100,649 $ 45,260 $ 9,038,480 $ 3,845,883
ERS 268,545 3,878,717 134,821 6,681,603 10,963,686 6,845,843 470,310 172,340 28,866 87,232 44,949 7,649,540 3,314,146
PFRS 4,702 706,461 22,804 1,186,710 1,920,677 1,263,513 98,156 12,620 923 13,417 311 1,388,940 531,737

170 Statistical 2021 Comprehensive Annual Financial Report
SERVICERETIREES—ERS
This table shows the number (Number), average final average salary (Avg FAS), and average annual pension benefit prior to option selection, including any cost-of-living adjustment (Avg Pen), of surviving Employees’ Retirement System service retirees on March 31, 2021. Groupings are based on years of service and age, with a breakdown by category of employer.
Years of Service
Nearest Age
Under 55 55 – 64 65 – 74 75 – 84 85 & Over
Number Avg FAS Avg Pen Number Avg FAS Avg Pen Number Avg FAS Avg Pen Number Avg FAS Avg Pen Number Avg FAS Avg Pen
State
Under 10 - - - 1,041 45,175 4,249 2,332 45,688 5,442 1,235 38,717 5,294 368 27,071 4,281
10 – 14 - - - 3,074 47,681 7,488 8,472 43,396 8,366 5,004 36,270 7,810 2,543 28,672 7,457
15 – 19 - - - 2,126 54,225 12,152 5,332 52,931 14,234 3,800 42,544 12,929 2,126 32,524 12,045
20 – 24 - - - 2,649 67,499 24,744 7,878 64,003 27,242 6,123 50,685 23,689 3,077 37,480 20,597
25 – 29 795 96,861 48,155 6,462 80,475 39,400 10,582 70,081 37,100 6,669 54,557 31,805 2,541 41,591 27,778
30 – 34 57 109,333 54,459 11,363 82,940 50,527 15,234 73,795 47,188 6,906 57,064 39,317 1,864 45,480 34,998
35 & Over - - - 6,368 78,550 54,417 19,372 73,059 55,875 8,889 64,613 52,423 1,994 55,555 48,600
Total 852 97,696 48,577 33,083 74,067 39,116 69,202 65,630 37,108 38,626 52,648 30,793 14,513 39,177 23,583
Counties
Under 10 - - - 872 41,218 3,907 2,062 38,134 4,395 1,133 34,658 4,552 308 25,198 4,010
10 – 14 - - - 1,884 43,704 6,844 5,269 38,958 7,471 3,288 32,848 7,050 1,702 25,079 6,522
15 – 19 1 70,627 35,313 1,258 48,890 10,791 3,415 45,198 12,115 2,566 39,119 11,859 1,419 29,055 10,800
20 – 24 313 91,699 47,578 2,030 60,768 24,371 5,270 54,873 23,554 3,587 45,031 21,334 1,658 33,526 18,210
25 – 29 537 93,395 48,500 2,386 79,864 39,468 4,762 61,613 32,693 2,808 49,428 28,782 1,189 37,047 24,692
30 – 34 29 115,388 71,332 4,666 75,997 47,473 5,746 63,870 41,075 2,407 52,693 36,473 624 40,512 30,894
35 & Over - - - 1,969 73,643 51,835 6,357 68,707 52,765 2,493 62,171 50,608 547 49,131 42,869
Total 880 93,490 48,909 15,065 65,935 32,996 32,881 55,491 28,620 18,282 45,389 23,524 7,447 32,693 17,448
Cities
Under 10 - - - 118 36,169 3,285 322 34,073 3,980 168 29,262 3,802 57 21,568 3,199
10 – 14 - - - 316 41,501 6,329 824 35,333 6,748 523 30,148 6,582 248 21,441 5,616
15 – 19 - - - 193 45,947 10,530 589 43,902 11,835 356 34,184 10,492 207 25,441 9,605
20 – 24 1 84,593 42,297 241 58,464 21,721 709 53,242 22,332 468 40,828 19,259 220 28,099 15,379
25 – 29 - - - 227 61,717 28,060 662 58,007 30,585 419 45,618 26,913 201 32,583 22,441
30 – 34 - - - 869 67,383 42,068 1,056 59,459 38,199 438 48,154 33,644 155 36,416 28,739
35 & Over - - - 419 68,603 48,177 1,331 62,351 48,078 488 50,606 41,518 133 39,826 36,000
Total 1 84,593 42,297 2,383 59,442 30,536 5,493 52,407 28,076 2,860 40,861 22,064 1,221 29,062 16,953
Towns
Under 10 - - - 267 37,754 3,646 794 31,092 3,707 600 28,041 3,682 140 20,735 2,992
10 – 14 - - - 518 45,973 7,411 1,462 39,935 7,765 1,074 30,538 6,551 491 23,250 5,903
15 – 19 - - - 409 49,806 11,350 1,194 45,029 12,203 865 36,846 11,120 447 27,477 9,853
20 – 24 - - - 552 59,329 21,836 1,519 55,625 23,712 1,093 43,978 20,523 486 33,720 18,128
25 – 29 1 82,713 41,356 389 64,056 29,620 1,266 61,830 32,796 820 49,105 28,426 337 37,563 24,251
30 – 34 - - - 1,580 78,467 48,911 1,504 66,266 42,488 716 51,277 35,105 216 40,666 30,301
35 & Over - - - 931 85,840 60,327 2,203 74,088 57,263 762 59,707 48,327 189 43,710 37,519
Total 1 82,713 41,356 4,646 67,978 35,832 9,942 56,577 29,819 5,930 42,502 21,343 2,306 31,523 16,626

171Statistical 2021 Comprehensive Annual Financial Report
Years of Service
Nearest Age
Under 55 55 – 64 65 – 74 75 – 84 85 & Over
Number Avg FAS Avg Pen Number Avg FAS Avg Pen Number Avg FAS Avg Pen Number Avg FAS Avg Pen Number Avg FAS Avg Pen
Villages
Under 10 - - - 88 36,902 3,685 220 32,492 3,675 168 28,759 3,775 49 19,887 2,725
10 – 14 - - - 176 44,611 6,959 467 38,161 7,385 325 31,065 6,584 173 23,300 5,786
15 – 19 - - - 98 53,213 12,053 356 44,036 12,109 253 40,181 11,973 153 26,162 9,799
20 – 24 1 87,276 48,074 174 57,403 21,130 442 59,360 25,160 308 47,528 22,094 168 31,060 16,805
25 – 29 - - - 113 68,718 32,499 340 62,970 33,039 246 49,861 28,940 129 35,692 22,864
30 – 34 - - - 415 77,659 48,576 478 63,030 40,109 243 49,616 34,189 75 36,537 28,160
35 & Over - - - 238 83,526 58,501 600 70,031 53,834 236 59,066 48,076 69 45,081 39,378
Total 1 87,276 48,074 1,302 66,187 33,918 2,903 55,267 28,383 1,779 43,841 22,137 816 30,247 16,220
Miscellaneous
Under 10 - - - 790 50,896 4,917 1,702 48,364 5,468 875 40,448 5,218 163 33,262 5,010
10 – 14 - - - 1,650 56,173 8,907 3,716 49,973 9,543 2,068 41,229 8,766 909 29,149 7,383
15 – 19 - - - 1,236 59,789 13,142 2,767 58,409 15,592 1,690 46,356 13,920 620 33,252 11,768
20 – 24 - - - 1,393 69,651 25,184 4,097 65,035 27,184 2,227 54,933 25,178 743 37,151 19,661
25 – 29 - - - 937 76,909 35,456 3,277 72,205 37,851 1,751 59,839 33,847 545 44,177 28,714
30 – 34 - - - 3,378 91,272 56,954 3,942 81,293 51,737 1,353 65,315 43,994 431 48,753 36,281
35 & Over - - - 1,532 92,325 64,726 3,670 81,642 62,349 1,628 73,885 59,309 443 59,475 50,719
Total - - - 10,916 75,635 36,156 23,171 67,014 32,631 11,592 54,759 27,401 3,854 39,329 21,585
School Districts
Under 10 - - - 1,220 24,684 2,378 3,107 22,958 2,684 1,944 19,807 2,605 589 13,370 2,082
10 – 14 - - - 2,334 31,619 5,172 5,826 29,500 5,723 4,228 24,509 5,250 2,465 17,489 4,512
15 – 19 - - - 1,848 36,071 8,394 5,181 34,012 9,267 3,605 28,838 8,724 2,027 20,816 7,760
20 – 24 1 86,642 45,747 2,337 44,192 16,694 7,914 42,376 18,242 4,716 34,752 16,439 2,324 22,992 12,675
25 – 29 3 73,913 36,706 1,212 51,319 24,179 5,391 46,592 24,859 3,441 37,118 21,758 1,629 25,548 17,224
30 – 34 - - - 2,197 64,927 40,334 3,765 52,423 33,494 2,026 40,492 27,798 763 29,888 22,659
35 & Over - - - 1,007 70,785 49,924 2,242 59,281 45,306 1,229 46,732 37,564 398 35,856 31,456
Total 4 77,095 38,966 12,155 45,247 19,555 33,426 39,976 17,823 21,189 31,959 14,800 10,195 22,100 11,319
SERVICERETIREES—ERS CONTINUED

172 Statistical 2021 Comprehensive Annual Financial Report
This table shows the number (Number), average final average salary (Avg FAS), and average annual pension benefit prior to option selection, including any cost-of-living adjustment (Avg Pen), of surviving Police and Fire Retirement System service retirees on March 31, 2021. Groupings are based on years of service and age, with a breakdown by category of employer.
Years of Service
Nearest Age
Under 40 40 – 49 50 – 59 60 – 69 70 & Over
Number Avg FAS Avg Pen Number Avg FAS Avg Pen Number Avg FAS Avg Pen Number Avg FAS Avg Pen Number Avg FAS Avg Pen
State
Under 10 - - - - - - 14 43,328 5,887 5 52,803 20,459 8 19,124 2,643
10 – 14 - - - - - - 21 56,339 11,338 31 42,184 8,703 24 20,692 5,002
15 – 19 - - - - - - 7 79,309 23,101 20 76,560 25,104 22 35,543 13,705
20 – 24 - - - 159 140,579 73,489 482 123,248 65,834 351 84,936 46,733 767 38,127 27,695
25 – 29 - - - 14 155,448 89,591 496 141,429 86,558 344 111,745 69,034 381 58,719 40,798
30 – 34 - - - - - - 398 153,308 104,658 496 134,631 92,294 459 76,254 55,438
35 & Over - - - - - - 13 169,511 117,884 176 143,898 99,575 245 86,246 66,896
Total - - - 173 141,782 74,792 1,431 136,352 82,693 1,423 114,869 73,315 1,906 57,281 41,482
Counties
Under 10 - - - - - - 5 66,974 8,137 4 62,594 8,416 2 21,473 2,784
10 – 14 - - - - - - 6 76,992 15,724 13 72,575 14,418 23 29,787 7,071
15 – 19 - - - - - - 6 122,927 35,026 3 74,125 25,057 17 42,256 14,691
20 – 24 - - - 54 177,127 92,411 381 161,354 85,382 246 124,228 66,899 1,078 61,730 39,324
25 – 29 - - - 13 210,860 123,548 429 188,197 115,509 332 164,004 102,411 445 95,481 62,905
30 – 34 - - - - - - 391 206,979 141,997 527 187,268 129,578 795 124,824 90,090
35 & Over - - - - - - 37 229,537 159,821 172 207,327 147,743 681 151,547 116,570
Total - - - 67 183,672 98,453 1,255 185,792 114,632 1,297 170,221 111,375 3,041 102,900 72,939
Cities
Under 10 - - - - - - 20 42,553 4,883 14 37,467 4,949 11 42,128 8,277
10 – 14 - - - - - - 21 51,550 10,181 70 38,033 7,999 77 22,943 5,936
15 – 19 - - - - - - 14 71,765 19,302 47 48,635 14,009 38 33,791 12,517
20 – 24 - - - 322 118,586 60,307 1,702 99,423 51,117 1,359 77,367 41,284 1,732 42,886 28,177
25 – 29 - - - 34 153,231 86,158 639 116,065 67,621 833 99,177 59,518 829 59,983 39,166
30 – 34 - - - - - - 350 132,745 86,927 796 114,562 76,061 1,080 71,794 51,603
35 & Over - - - - - - 18 132,602 86,214 322 113,636 76,604 791 87,117 67,158
Total - - - 356 121,895 62,776 2,764 106,791 58,889 3,441 93,290 55,851 4,558 60,107 41,937
Towns
Under 10 - - - - - - 18 36,503 3,777 24 32,821 3,901 35 24,330 3,925
10 – 14 - - - - - - 12 57,394 11,594 35 42,102 8,756 54 28,651 7,012
15 – 19 - - - - - - 6 73,015 19,350 24 52,483 14,676 24 33,882 13,365
20 – 24 - - - 145 127,208 64,197 543 107,404 54,692 429 83,735 44,154 403 51,392 32,311
25 – 29 - - - 9 151,338 84,553 177 126,701 71,973 201 104,536 60,098 129 68,660 41,803
30 – 34 - - - - - - 113 160,462 103,059 191 129,412 84,394 224 90,052 63,386
35 & Over - - - - - - 7 166,749 109,132 134 149,427 100,310 168 107,795 81,788
Total - - - 154 128,618 65,386 876 116,244 62,979 1,038 101,345 59,090 1,037 68,526 45,506
SERVICERETIREES—PFRS
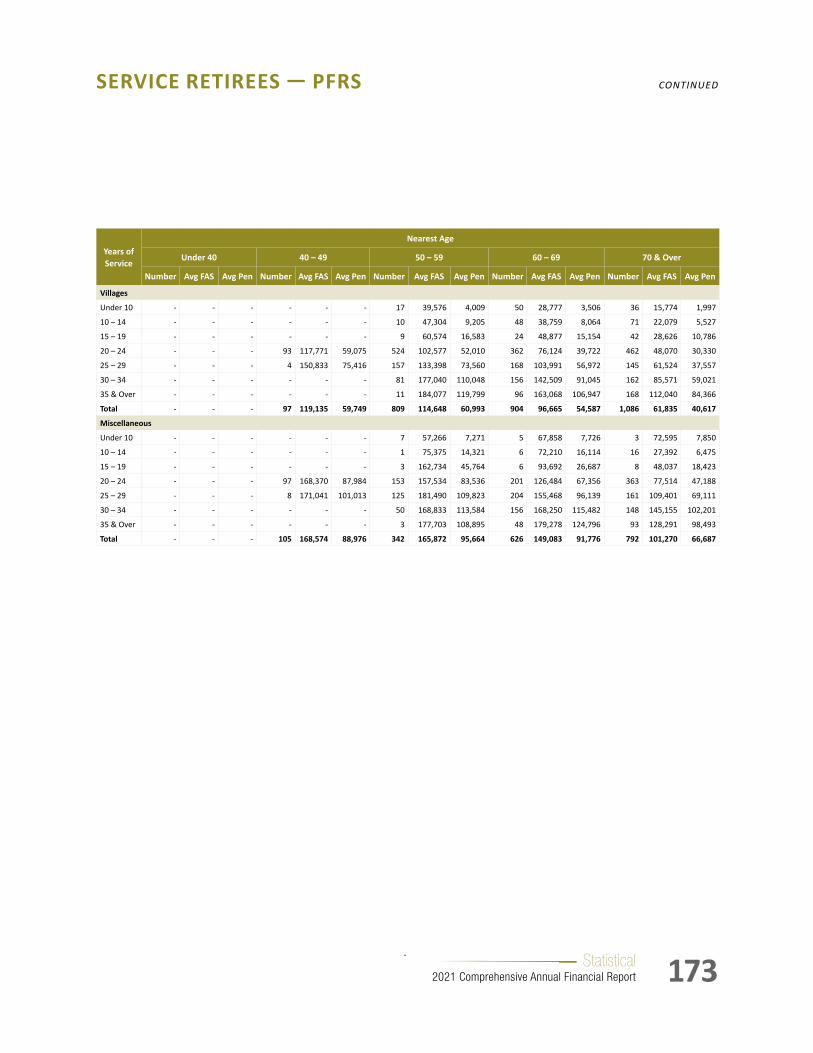
173Statistical 2021 Comprehensive Annual Financial Report
Years of Service
Nearest Age
Under 40 40 – 49 50 – 59 60 – 69 70 & Over
Number Avg FAS Avg Pen Number Avg FAS Avg Pen Number Avg FAS Avg Pen Number Avg FAS Avg Pen Number Avg FAS Avg Pen
Villages
Under 10 - - - - - - 17 39,576 4,009 50 28,777 3,506 36 15,774 1,997
10 – 14 - - - - - - 10 47,304 9,205 48 38,759 8,064 71 22,079 5,527
15 – 19 - - - - - - 9 60,574 16,583 24 48,877 15,154 42 28,626 10,786
20 – 24 - - - 93 117,771 59,075 524 102,577 52,010 362 76,124 39,722 462 48,070 30,330
25 – 29 - - - 4 150,833 75,416 157 133,398 73,560 168 103,991 56,972 145 61,524 37,557
30 – 34 - - - - - - 81 177,040 110,048 156 142,509 91,045 162 85,571 59,021
35 & Over - - - - - - 11 184,077 119,799 96 163,068 106,947 168 112,040 84,366
Total - - - 97 119,135 59,749 809 114,648 60,993 904 96,665 54,587 1,086 61,835 40,617
Miscellaneous
Under 10 - - - - - - 7 57,266 7,271 5 67,858 7,726 3 72,595 7,850
10 – 14 - - - - - - 1 75,375 14,321 6 72,210 16,114 16 27,392 6,475
15 – 19 - - - - - - 3 162,734 45,764 6 93,692 26,687 8 48,037 18,423
20 – 24 - - - 97 168,370 87,984 153 157,534 83,536 201 126,484 67,356 363 77,514 47,188
25 – 29 - - - 8 171,041 101,013 125 181,490 109,823 204 155,468 96,139 161 109,401 69,111
30 – 34 - - - - - - 50 168,833 113,584 156 168,250 115,482 148 145,155 102,201
35 & Over - - - - - - 3 177,703 108,895 48 179,278 124,796 93 128,291 98,493
Total - - - 105 168,574 88,976 342 165,872 95,664 626 149,083 91,776 792 101,270 66,687
SERVICERETIREES—PFRS CONTINUED

174 Statistical 2021 Comprehensive Annual Financial Report
DISABILITYRETIREES—ERS
This table shows the number (Number), average final average salary (Avg FAS), and average annual pension benefit prior to option selection, including any cost-of-living adjustment (Avg Pen), of surviving Employees’ Retirement System disability retirees on March 31, 2021. Groupings are based on years of service and age, with a breakdown by category of employer.
Years of Service
Nearest Age
Under 55 55 – 64 65 – 74 75 – 84 85 & Over
Number Avg FAS Avg Pen Number Avg FAS Avg Pen Number Avg FAS Avg Pen Number Avg FAS Avg Pen Number Avg FAS Avg Pen
State
Under 10 108 46,481 27,999 263 31,677 14,469 363 24,112 12,342 263 18,660 10,831 143 15,507 8,713
10 – 14 356 56,662 25,637 881 44,213 16,515 905 37,169 14,513 431 29,632 13,123 125 24,587 12,593
15 – 19 291 63,234 28,416 858 50,706 20,403 972 40,896 18,069 431 33,319 17,110 108 25,822 17,287
20 – 24 128 69,730 35,459 762 56,673 25,585 797 44,970 22,363 368 35,847 22,847 42 28,809 24,348
25 – 29 72 80,239 48,414 646 65,990 38,132 433 50,075 29,142 189 37,460 25,190 18 31,067 30,427
30 – 34 12 72,444 38,803 162 70,116 43,285 193 46,341 30,326 72 38,649 29,493 10 29,563 27,852
35 & Over - - - 29 53,828 29,070 64 48,693 31,145 8 36,896 26,166 1 24,445 21,327
Total 967 61,184 29,897 3,601 52,631 24,394 3,727 40,710 19,712 1,762 31,435 17,809 447 22,749 14,670
Counties
Under 10 39 71,054 46,855 53 37,319 19,687 63 27,474 14,290 53 18,369 10,268 43 14,703 9,104
10 – 14 177 63,979 32,664 333 48,945 21,536 343 37,307 14,019 187 29,879 12,360 39 20,365 10,427
15 – 19 166 74,806 37,877 377 53,628 23,738 327 44,313 20,215 174 31,280 14,862 44 24,734 14,879
20 – 24 85 80,179 43,354 318 68,146 34,699 281 47,959 25,293 100 38,414 25,158 15 35,496 28,108
25 – 29 22 91,184 57,447 210 73,379 43,290 156 51,380 30,392 38 40,198 28,826 9 31,131 29,490
30 – 34 6 62,145 31,932 43 79,313 49,749 58 57,508 37,687 8 43,461 32,521 2 36,590 32,708
35 & Over - - - 5 66,354 41,940 16 57,112 38,085 - - - 1 19,429 4,689
Total 495 72,136 38,459 1,339 59,236 29,603 1,244 44,018 21,675 560 31,643 16,630 153 22,353 14,444
Cities
Under 10 4 51,732 17,766 11 29,096 11,674 17 24,906 11,351 14 17,703 9,913 16 17,636 10,238
10 – 14 16 55,830 19,061 62 41,325 14,076 79 35,793 11,651 25 29,965 11,771 5 23,722 10,923
15 – 19 14 53,714 17,976 62 46,107 15,914 80 38,035 14,689 38 31,906 13,610 5 23,968 11,120
20 – 24 10 62,651 22,216 49 51,160 19,360 52 37,938 17,536 20 33,266 19,812 4 31,345 30,482
25 – 29 8 52,841 22,746 35 51,346 22,862 50 39,330 22,004 15 32,538 22,272 3 21,475 17,441
30 – 34 1 69,093 37,713 12 64,150 33,300 16 39,917 24,957 2 27,620 19,388 - - -
35 & Over - - - 2 71,083 41,836 1 40,615 27,765 - - - - - -
Total 53 56,048 20,180 233 47,025 18,111 295 36,991 16,026 114 29,983 15,082 33 21,528 13,584
Towns
Under 10 12 39,067 16,278 11 33,369 13,537 16 31,439 16,013 18 19,026 11,377 7 12,794 9,123
10 – 14 31 57,175 19,561 98 45,031 14,961 88 37,615 13,345 38 30,297 14,845 13 20,319 7,794
15 – 19 31 58,178 19,969 121 50,466 17,619 105 42,235 16,327 36 34,510 14,893 6 31,492 14,361
20 – 24 27 63,368 23,603 91 61,186 23,199 87 45,287 22,511 26 39,510 27,969 8 36,519 31,636
25 – 29 7 72,716 31,952 63 65,534 30,376 49 45,615 24,172 25 40,985 31,611 - - -
30 – 34 2 89,912 47,443 16 73,776 39,426 31 50,060 31,932 7 41,252 34,263 2 28,738 28,308
35 & Over - - - 3 46,266 23,319 7 55,448 33,731 1 60,147 48,728 - - -
Total 110 58,586 21,605 403 54,348 21,024 383 42,723 19,618 151 34,019 20,603 36 24,786 15,585

175Statistical 2021 Comprehensive Annual Financial Report
Years of Service
Nearest Age
Under 55 55 – 64 65 – 74 75 – 84 85 & Over
Number Avg FAS Avg Pen Number Avg FAS Avg Pen Number Avg FAS Avg Pen Number Avg FAS Avg Pen Number Avg FAS Avg Pen
Villages
Under 10 2 49,803 16,955 5 32,822 13,674 5 25,417 11,846 7 18,142 11,870 2 12,386 11,520
10 – 14 15 55,017 18,737 32 44,227 15,128 26 36,949 14,134 13 27,053 11,888 - - -
15 – 19 13 52,886 17,842 31 55,334 18,949 27 43,060 17,460 12 35,562 17,663 4 17,509 11,678
20 – 24 7 62,337 23,018 28 59,198 23,116 22 40,253 19,810 5 36,856 24,769 1 19,619 34,179
25 – 29 7 70,769 30,727 22 72,202 32,675 13 45,068 22,832 8 38,453 25,693 1 14,979 24,334
30 – 34 1 68,368 37,477 7 72,241 38,355 8 61,098 37,027 5 35,275 24,474 1 28,768 27,834
35 & Over - - - - - - - - - - - - - - -
Total 45 58,055 21,347 125 56,371 22,196 101 41,689 19,079 50 31,474 18,027 9 17,575 17,344
Miscellaneous
Under 10 12 42,178 14,751 32 38,938 14,628 40 31,841 14,202 24 25,032 11,094 10 17,149 12,662
10 – 14 52 50,905 17,337 184 47,147 15,371 217 44,882 14,795 77 35,648 12,422 24 25,278 11,757
15 – 19 43 57,393 19,337 173 53,971 18,785 228 44,111 16,016 69 36,009 15,446 10 24,623 11,945
20 – 24 25 62,563 22,065 157 57,255 21,617 122 51,406 20,715 29 44,220 22,461 6 25,397 18,338
25 – 29 10 71,951 31,101 116 61,350 27,596 68 50,221 26,803 13 39,347 27,315 3 39,690 33,436
30 – 34 1 50,108 25,711 37 63,394 33,263 32 59,554 36,778 7 41,734 30,207 2 49,944 45,606
35 & Over - - - 4 56,488 26,943 9 50,958 30,340 1 28,043 22,488 - - -
Total 143 55,628 19,569 703 53,962 20,597 716 46,259 18,478 220 36,111 16,040 55 25,377 15,087
School Districts
Under 10 4 31,650 11,409 22 27,083 10,169 57 20,322 8,888 45 14,935 6,855 49 11,641 6,967
10 – 14 67 38,400 13,162 304 33,771 11,003 350 29,261 9,241 206 24,804 8,691 42 21,241 7,874
15 – 19 40 48,703 16,529 282 39,244 13,148 317 33,880 11,837 154 29,459 11,262 23 20,668 13,376
20 – 24 22 44,015 16,163 185 44,041 16,650 136 35,610 15,371 57 27,866 14,358 8 21,135 13,815
25 – 29 9 70,458 30,998 93 51,064 23,082 69 40,522 20,190 31 32,872 21,239 4 33,129 27,999
30 – 34 3 72,350 37,589 30 52,984 28,515 22 45,255 26,299 2 64,539 46,491 - - -
35 & Over - - - 3 64,842 39,853 4 48,920 31,747 - - - - - -
Total 145 44,600 16,110 919 39,837 14,666 955 32,429 12,233 495 26,373 10,915 126 17,774 9,542
DISABILITYRETIREES—ERS CONTINUED

176 Statistical 2021 Comprehensive Annual Financial Report
DISABILITYRETIREES—PFRS
This table shows the number (Number), average final average salary (Avg FAS), and average annual pension benefit prior to option selection, including any cost-of-living adjustment (Avg Pen), of surviving Police and Fire Retirement System disability retirees on March 31, 2021. Groupings are based on years of service and age, with a breakdown by category of employer.
Years of Service
Nearest Age
Under 40 40 – 49 50 – 59 60 – 69 70 & Over
Number Avg FAS Avg Pen Number Avg FAS Avg Pen Number Avg FAS Avg Pen Number Avg FAS Avg Pen Number Avg FAS Avg Pen
State
Under 10 3 95,244 55,300 14 79,433 52,435 41 49,396 31,739 35 30,458 21,826 69 20,199 20,128
10 – 14 2 109,304 82,158 10 103,829 61,363 34 74,014 43,404 27 42,787 27,225 43 22,899 23,709
15 – 19 - - - 14 121,245 71,087 45 93,122 59,831 39 58,625 34,667 67 30,728 27,744
20 – 24 - - - 10 135,361 89,378 55 116,474 76,840 30 79,287 53,192 75 43,590 34,333
25 – 29 - - - - - - 31 137,339 92,077 25 107,946 74,112 45 61,998 44,505
30 – 34 - - - - - - 5 139,927 100,332 17 128,495 93,284 22 77,633 59,795
35 & Over - - - - - - - - - 3 122,525 84,708 12 85,471 67,051
Total 5 100,868 66,044 48 108,362 67,431 211 95,239 61,857 176 68,960 46,248 333 39,729 32,928
Counties
Under 10 1 89,295 67,547 9 86,309 57,005 32 78,549 47,762 17 49,866 37,461 50 27,508 28,341
10 – 14 3 137,754 68,937 31 135,041 88,295 80 102,375 71,970 39 68,612 48,142 102 35,733 36,294
15 – 19 - - - 35 151,390 104,116 107 121,122 86,116 37 89,746 63,760 214 50,180 44,701
20 – 24 - - - 16 176,953 116,566 126 145,430 98,872 78 120,006 84,318 252 64,825 53,891
25 – 29 - - - 3 175,345 118,260 71 170,313 121,777 43 146,292 100,630 82 82,625 64,734
30 – 34 - - - - - - 17 205,747 155,184 24 171,857 126,974 42 113,065 85,875
35 & Over - - - - - - - - - 3 158,072 90,908 23 132,740 102,726
Total 4 125,640 68,590 94 144,883 96,959 433 132,974 92,939 241 112,423 79,243 765 61,009 51,690
Cities
Under 10 9 74,367 42,035 22 72,166 45,405 56 55,372 36,621 47 39,404 27,576 44 21,155 18,012
10 – 14 13 90,482 53,902 53 83,921 50,606 130 67,576 42,453 95 45,380 30,909 84 25,686 25,287
15 – 19 1 79,930 26,823 60 96,287 57,537 172 77,239 48,680 116 57,362 38,871 146 35,003 29,895
20 – 24 - - - 13 102,321 62,317 178 99,844 60,817 165 73,329 48,452 250 43,233 35,103
25 – 29 - - - - - - 72 105,863 67,251 117 86,823 55,995 145 51,031 39,101
30 – 34 - - - - - - 11 141,422 86,740 51 92,766 62,200 83 62,324 45,682
35 & Over - - - - - - - - - 9 128,002 92,783 29 63,212 45,108
Total 23 83,717 48,081 148 88,803 53,671 619 84,202 52,608 600 68,263 45,491 781 42,782 34,349
Towns
Under 10 1 89,005 66,754 15 82,134 54,471 25 57,529 36,960 21 42,476 28,933 17 19,863 16,350
10 – 14 4 103,777 59,008 25 100,625 61,134 42 75,868 49,894 35 58,109 35,521 34 32,599 29,440
15 – 19 1 138,901 69,450 21 119,073 75,432 56 95,900 62,095 27 61,968 41,560 45 39,642 35,379
20 – 24 - - - 7 116,137 83,346 67 116,326 77,593 65 81,440 55,918 65 50,896 40,046
25 – 29 - - - - - - 26 127,243 77,984 32 102,882 70,384 21 65,639 51,592
30 – 34 - - - - - - 6 160,946 101,616 16 146,000 100,171 16 82,709 60,060
35 & Over - - - - - - - - - 1 120,255 60,128 5 104,791 80,909
Total 6 107,169 62,039 68 103,840 66,366 222 99,383 64,562 197 79,396 53,415 203 48,098 39,029

177Statistical 2021 Comprehensive Annual Financial Report
Years of Service
Nearest Age
Under 40 40 – 49 50 – 59 60 – 69 70 & Over
Number Avg FAS Avg Pen Number Avg FAS Avg Pen Number Avg FAS Avg Pen Number Avg FAS Avg Pen Number Avg FAS Avg Pen
Villages
Under 10 3 95,070 71,303 9 66,389 46,385 22 59,986 38,634 23 36,825 25,738 23 19,413 20,575
10 – 14 1 179,606 134,704 18 92,798 48,028 44 81,869 55,045 32 52,632 32,920 36 29,449 27,241
15 – 19 - - - 10 102,453 64,290 69 91,414 58,546 42 67,076 43,385 55 42,594 36,150
20 – 24 - - - 6 144,942 84,961 52 110,257 69,923 43 81,627 53,276 52 51,912 42,005
25 – 29 - - - 1 132,173 66,087 19 156,878 96,275 16 103,689 69,588 21 71,695 52,952
30 – 34 - - - - - - 2 168,326 86,997 13 135,450 89,093 9 85,007 65,258
35 & Over - - - - - - - - - 4 140,837 76,286 7 78,591 48,747
Total 4 116,204 87,153 44 97,596 56,834 208 97,501 62,264 173 74,229 48,180 203 46,155 37,768
Miscellaneous
Under 10 2 94,099 56,698 13 89,133 62,572 12 67,007 41,988 14 49,970 33,846 10 48,557 39,154
10 – 14 - - - 24 113,099 70,983 37 112,613 77,620 22 71,005 47,894 17 54,837 38,305
15 – 19 - - - 10 126,149 82,427 26 123,154 82,978 29 93,973 65,591 38 58,451 46,447
20 – 24 - - - 9 158,813 99,835 31 153,160 104,094 76 121,231 84,532 40 87,628 67,127
25 – 29 - - - - - - 9 155,680 106,378 37 143,664 105,573 18 100,070 73,191
30 – 34 - - - - - - 1 177,397 136,222 10 153,756 112,482 4 120,005 88,898
35 & Over - - - - - - - - - - - - 5 140,180 109,099
Total 2 94,099 56,698 56 117,213 75,711 116 124,993 84,946 188 111,987 79,176 132 76,714 58,419
DISABILITYRETIREES—PFRS CONTINUED

178 Statistical 2021 Comprehensive Annual Financial Report
NEW OPTION SELECTIONS
This table shows the number of new retirees (Number), and the total amount paid to new retirees in annual benefits after option selection and any partial lump sum distribution* ($ Amount), during the given fiscal year. Groupings are based on option selected, with breakdowns by retirement system and member gender.
Options2017 2018 2019 2020 2021
Number $ Amount Number $ Amount Number $ Amount Number $ Amount Number $ Amount
ERS Females
Single Life Allowance** 7,413 183,872,745 8,852 209,575,192 7,072 175,527,699 7,494 193,955,163 8,077 213,349,680
Cash Refund 7 234,374 16 580,262 3 116,424 8 255,096 3 238,208
Joint Allowance — Full 803 13,434,417 1,050 16,771,815 867 14,305,912 606 11,590,002 843 17,598,093
Joint Allowance — Half 131 3,357,590 147 4,065,239 164 4,603,746 135 3,982,328 199 5,438,576
Five Year Certain 109 2,729,206 142 3,612,207 122 3,271,204 92 2,756,281 109 2,911,558
Ten Year Certain 361 8,035,482 439 9,949,556 390 8,617,407 298 7,529,028 294 8,230,932
Pop-Up — Full 1,696 40,354,572 2,413 58,537,182 1,922 49,174,363 2,103 54,882,652 1,932 50,079,503
Pop-Up — Half 789 25,869,734 1,046 34,464,128 862 30,449,620 848 29,941,152 829 28,910,032
Other (Option 4) 660 22,628,793 776 28,321,409 676 24,896,907 764 29,259,512 1,402 51,651,839
Total 11,969 300,516,917 14,881 365,876,993 12,078 310,963,285 12,348 334,151,218 13,688 378,408,424
ERS Males
Single Life Allowance** 3,397 108,315,670 4,416 135,424,027 3,489 112,196,278 3,501 118,808,585 3,578 123,212,184
Cash Refund 6 242,131 8 95,032 2 89,243 2 45,768 1 132,310
Joint Allowance — Full 1,742 54,862,090 2,300 71,932,738 1,740 55,387,988 1,409 50,905,250 1,641 62,449,602
Joint Allowance — Half 219 9,282,560 303 12,609,739 239 9,581,695 213 9,828,230 249 11,298,867
Five Year Certain 66 1,910,993 89 2,895,753 55 1,895,058 35 1,258,873 55 2,096,271
Ten Year Certain 206 5,973,927 321 10,313,589 229 6,929,664 148 4,733,889 161 6,148,667
Pop-Up — Full 2,452 83,670,111 3,237 113,230,443 2,559 93,913,676 2,740 102,742,477 2,341 91,433,789
Pop-Up — Half 741 31,599,049 894 41,086,014 728 33,166,966 715 32,589,400 685 32,704,597
Other (Option 4) 886 39,641,518 1,040 47,525,434 956 46,899,818 972 48,802,333 1,288 60,908,507
Total 9,715 335,498,055 12,608 435,112,773 9,997 360,060,391 9,735 369,714,808 9,999 390,384,798
PFRS Females
Single Life Allowance** 85 6,071,215 75 5,769,780 66 4,677,275 83 6,433,337 60 4,520,475
Cash Refund – – – – – – – – - -
Joint Allowance — Full 4 288,938 5 329,517 6 296,999 4 301,195 3 179,244
Joint Allowance — Half 3 259,007 1 88,083 1 77,433 – – 5 511,519
Five Year Certain 2 220,344 1 89,883 1 77,829 1 116,993 - -
Ten Year Certain 6 406,985 6 395,390 6 464,880 6 496,751 11 1,107,545
Pop-Up — Full 13 878,840 12 629,577 18 1,049,748 19 1,396,329 15 1,056,648
Pop-Up — Half 9 654,009 8 416,178 8 531,088 8 632,727 11 936,944
Other (Option 4) 8 714,073 1 115,472 9 762,431 9 695,924 14 1,251,756
Total 130 9,493,415 109 7,833,885 115 7,937,687 130 10,073,259 119 9,564,134
PFRS Males
Single Life Allowance** 499 35,551,463 433 31,209,987 421 29,947,306 391 31,485,743 449 36,727,925
Cash Refund – – – – – – 1 71,591 - -
Joint Allowance — Full 232 16,971,860 272 20,499,283 244 18,881,698 173 13,985,544 247 20,403,913
Joint Allowance — Half 84 7,826,713 46 3,635,453 52 4,741,723 40 3,776,545 63 6,339,285
Five Year Certain 6 387,703 9 514,073 6 469,869 3 137,439 3 303,062
Ten Year Certain 39 2,722,041 33 2,622,059 47 3,861,153 19 1,560,943 45 3,986,930
Pop-Up — Full 399 25,316,535 468 33,096,113 430 30,376,811 428 30,749,752 456 34,128,873
Pop-Up — Half 185 15,082,654 146 11,290,976 174 14,765,782 142 12,705,827 141 13,414,969
Other (Option 4) 222 19,064,090 229 19,787,409 247 22,890,719 223 21,908,590 298 28,192,059
Total 1,666 122,923,063 1,636 122,655,356 1,621 125,935,066 1,420 116,381,978 1,702 143,497,020
* In 2021, 11 ERS retirees selected partial lump sums which totaled $1,641,202 and 158 PFRS retirees selected partial lump sums which totaled $31,498,247. There was also one new retiree whose gender was unknown and whose annual benefits totaled $63,109.
** Includes Single Life Allowance and Option ½.
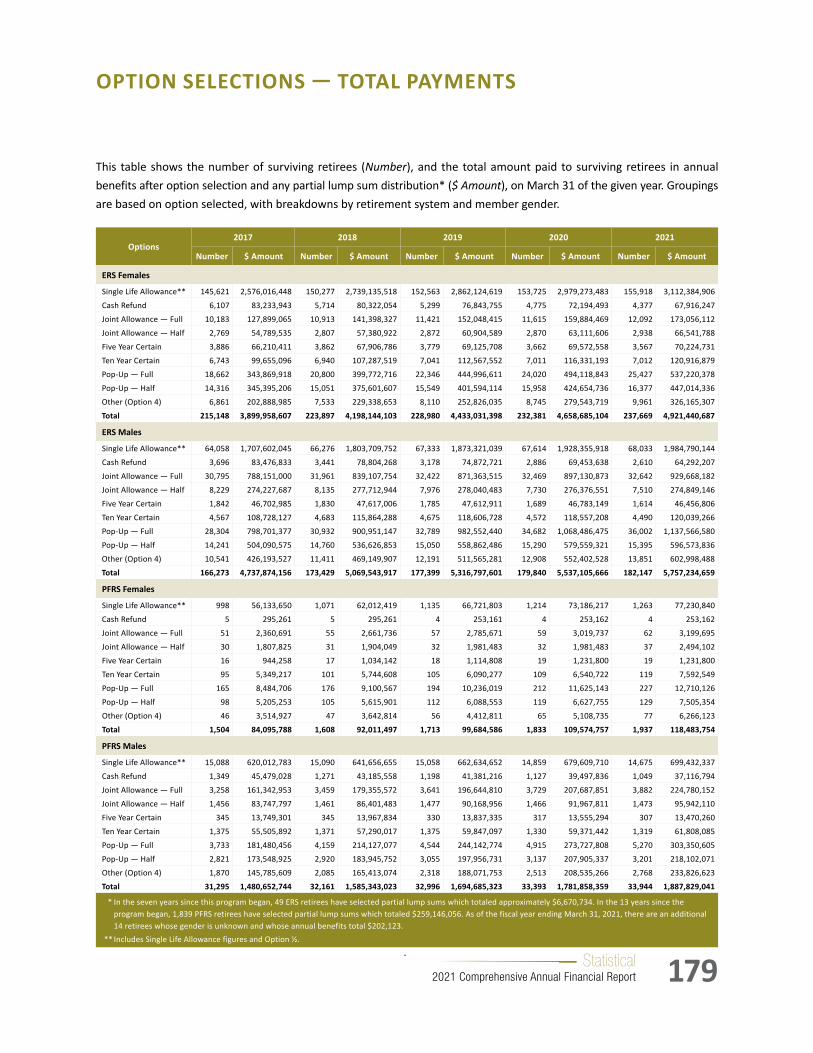
179Statistical 2021 Comprehensive Annual Financial Report
OPTIONSELECTIONS—TOTALPAYMENTS
This table shows the number of surviving retirees (Number), and the total amount paid to surviving retirees in annual benefits after option selection and any partial lump sum distribution* ($ Amount), on March 31 of the given year. Groupings are based on option selected, with breakdowns by retirement system and member gender.
Options2017 2018 2019 2020 2021
Number $ Amount Number $ Amount Number $ Amount Number $ Amount Number $ Amount
ERS Females
Single Life Allowance** 145,621 2,576,016,448 150,277 2,739,135,518 152,563 2,862,124,619 153,725 2,979,273,483 155,918 3,112,384,906
Cash Refund 6,107 83,233,943 5,714 80,322,054 5,299 76,843,755 4,775 72,194,493 4,377 67,916,247
Joint Allowance — Full 10,183 127,899,065 10,913 141,398,327 11,421 152,048,415 11,615 159,884,469 12,092 173,056,112
Joint Allowance — Half 2,769 54,789,535 2,807 57,380,922 2,872 60,904,589 2,870 63,111,606 2,938 66,541,788
Five Year Certain 3,886 66,210,411 3,862 67,906,786 3,779 69,125,708 3,662 69,572,558 3,567 70,224,731
Ten Year Certain 6,743 99,655,096 6,940 107,287,519 7,041 112,567,552 7,011 116,331,193 7,012 120,916,879
Pop-Up — Full 18,662 343,869,918 20,800 399,772,716 22,346 444,996,611 24,020 494,118,843 25,427 537,220,378
Pop-Up — Half 14,316 345,395,206 15,051 375,601,607 15,549 401,594,114 15,958 424,654,736 16,377 447,014,336
Other (Option 4) 6,861 202,888,985 7,533 229,338,653 8,110 252,826,035 8,745 279,543,719 9,961 326,165,307
Total 215,148 3,899,958,607 223,897 4,198,144,103 228,980 4,433,031,398 232,381 4,658,685,104 237,669 4,921,440,687
ERS Males
Single Life Allowance** 64,058 1,707,602,045 66,276 1,803,709,752 67,333 1,873,321,039 67,614 1,928,355,918 68,033 1,984,790,144
Cash Refund 3,696 83,476,833 3,441 78,804,268 3,178 74,872,721 2,886 69,453,638 2,610 64,292,207
Joint Allowance — Full 30,795 788,151,000 31,961 839,107,754 32,422 871,363,515 32,469 897,130,873 32,642 929,668,182
Joint Allowance — Half 8,229 274,227,687 8,135 277,712,944 7,976 278,040,483 7,730 276,376,551 7,510 274,849,146
Five Year Certain 1,842 46,702,985 1,830 47,617,006 1,785 47,612,911 1,689 46,783,149 1,614 46,456,806
Ten Year Certain 4,567 108,728,127 4,683 115,864,288 4,675 118,606,728 4,572 118,557,208 4,490 120,039,266
Pop-Up — Full 28,304 798,701,377 30,932 900,951,147 32,789 982,552,440 34,682 1,068,486,475 36,002 1,137,566,580
Pop-Up — Half 14,241 504,090,575 14,760 536,626,853 15,050 558,862,486 15,290 579,559,321 15,395 596,573,836
Other (Option 4) 10,541 426,193,527 11,411 469,149,907 12,191 511,565,281 12,908 552,402,528 13,851 602,998,488
Total 166,273 4,737,874,156 173,429 5,069,543,917 177,399 5,316,797,601 179,840 5,537,105,666 182,147 5,757,234,659
PFRS Females
Single Life Allowance** 998 56,133,650 1,071 62,012,419 1,135 66,721,803 1,214 73,186,217 1,263 77,230,840
Cash Refund 5 295,261 5 295,261 4 253,161 4 253,162 4 253,162
Joint Allowance — Full 51 2,360,691 55 2,661,736 57 2,785,671 59 3,019,737 62 3,199,695
Joint Allowance — Half 30 1,807,825 31 1,904,049 32 1,981,483 32 1,981,483 37 2,494,102
Five Year Certain 16 944,258 17 1,034,142 18 1,114,808 19 1,231,800 19 1,231,800
Ten Year Certain 95 5,349,217 101 5,744,608 105 6,090,277 109 6,540,722 119 7,592,549
Pop-Up — Full 165 8,484,706 176 9,100,567 194 10,236,019 212 11,625,143 227 12,710,126
Pop-Up — Half 98 5,205,253 105 5,615,901 112 6,088,553 119 6,627,755 129 7,505,354
Other (Option 4) 46 3,514,927 47 3,642,814 56 4,412,811 65 5,108,735 77 6,266,123
Total 1,504 84,095,788 1,608 92,011,497 1,713 99,684,586 1,833 109,574,757 1,937 118,483,754
PFRS Males
Single Life Allowance** 15,088 620,012,783 15,090 641,656,655 15,058 662,634,652 14,859 679,609,710 14,675 699,432,337
Cash Refund 1,349 45,479,028 1,271 43,185,558 1,198 41,381,216 1,127 39,497,836 1,049 37,116,794
Joint Allowance — Full 3,258 161,342,953 3,459 179,355,572 3,641 196,644,810 3,729 207,687,851 3,882 224,780,152
Joint Allowance — Half 1,456 83,747,797 1,461 86,401,483 1,477 90,168,956 1,466 91,967,811 1,473 95,942,110
Five Year Certain 345 13,749,301 345 13,967,834 330 13,837,335 317 13,555,294 307 13,470,260
Ten Year Certain 1,375 55,505,892 1,371 57,290,017 1,375 59,847,097 1,330 59,371,442 1,319 61,808,085
Pop-Up — Full 3,733 181,480,456 4,159 214,127,077 4,544 244,142,774 4,915 273,727,808 5,270 303,350,605
Pop-Up — Half 2,821 173,548,925 2,920 183,945,752 3,055 197,956,731 3,137 207,905,337 3,201 218,102,071
Other (Option 4) 1,870 145,785,609 2,085 165,413,074 2,318 188,071,753 2,513 208,535,266 2,768 233,826,623
Total 31,295 1,480,652,744 32,161 1,585,343,023 32,996 1,694,685,323 33,393 1,781,858,359 33,944 1,887,829,041
* In the seven years since this program began, 49 ERS retirees have selected partial lump sums which totaled approximately $6,670,734. In the 13 years since the program began, 1,839 PFRS retirees have selected partial lump sums which totaled $259,146,056. As of the fiscal year ending March 31, 2021, there are an additional 14 retirees whose gender is unknown and whose annual benefits total $202,123.
** Includes Single Life Allowance figures and Option ½.

180 Statistical 2021 Comprehensive Annual Financial Report
AVERAGE PENSION BENEFITS PAID DURING YEAR SHOWN
This table shows the average annual benefit payments to all retirees and beneficiaries receiving benefits during the given fiscal year compared with average annual benefit payments to new retirees during the year. The benefit consists of actual payments after option selection and any partial lump sum distribution, plus any cost-of-living adjustment. A breakdown is provided by retirement system. The marked line graph (below) shows the trend in these benefit payments over the past 10 years.
YearERS PFRS
All Retirees & Beneficiaries New Retirees All Retirees & Beneficiaries New Retirees
2012 $ 20,241 $ 29,636 $ 42,259 $ 62,535
2013 20,766 24,756 43,844 68,197
2014 21,285 25,588 45,074 65,256
2015 21,788 26,941 46,207 68,414
2016 22,415 28,364 47,397 71,603
2017 23,026 29,331 49,123 73,729
2018 23,680 29,139 50,922 74,779
2019 24,345 30,397 52,804 77,116
2020 25,105 31,872 54,684 81,584
2021 25,783 32,458 56,695 84,053
10,000
20,000
30,000
40,000
50,000
60,000
70,000
80,000
90,000
New PFRS Retirees
All PFRS Retirees and Beneficiaries
New ERS Retirees
Dolla
rs
All ERS Retirees and Beneficiaries
2021202020192018201720162015201420132012

181Statistical 2021 Comprehensive Annual Financial Report
AVERAGE BENEFIT PAY TYPES
NEW BENEFITS: ERS
This table shows the number of retirements granted (Number), the average monthly retirement allowance prior to option selection or any partial lump sum distribution (Monthly Allowance), and the average final average salary (Average FAS) of members retiring during the fiscal year ending March 31, 2021. Groupings are based on years of service, with a breakdown by retirement type.
Years of Service Number Monthly Allowance Average FAS
Service Retirements
Under 5 3 $ 3,994 $ 77,5595 – 9 1,012 346 37,850 10 – 14 3,247 787 50,360 15 – 19 2,725 1,191 54,252 20 – 24 4,536 2,200 63,803 25 – 29 3,233 3,263 76,242 30 – 34 5,595 4,322 84,062 35 – 39 2,327 5,073 88,211 40 & Over 781 6,055 92,791 Total 23,459 $ 2,873 $ 69,647
Ordinary Disability Retirements
Under 5 1 $ 884 $ 32,5075 – 9 2 2,034 75,052 10 – 14 38 1,414 54,370 15 – 19 69 1,612 59,778 20 – 24 25 2,112 71,183 25 – 29 26 2,605 71,683 30 – 34 13 3,066 71,353 35 – 39 2 3,068 63,064 40 & Over - - - Total 176 $ 1,911 $ 62,900
Performance of Duty Disability Retirements
Under 5 2 $ 3,060 $ 48,9945 – 9 5 4,150 66,518 10 – 14 14 5,079 83,371 15 – 19 8 5,135 82,404 20 – 24 16 6,212 99,720 25 – 29 4 5,253 84,787 30 – 34 - - - 35 – 39 - - - 40 & Over - - - Total 49 $ 5,295 $ 85,544
Accidental Disability Retirements
Under 5 - $ - $ - 5 – 9 - - - 10 – 14 1 5,061 80,981 15 – 19 - - - 20 – 24 2 5,174 83,462 25 – 29 1 8,251 132,021 30 – 34 - - - 35 – 39 - - - 40 & Over - - - Total 4 $ 5,915 $ 94,981
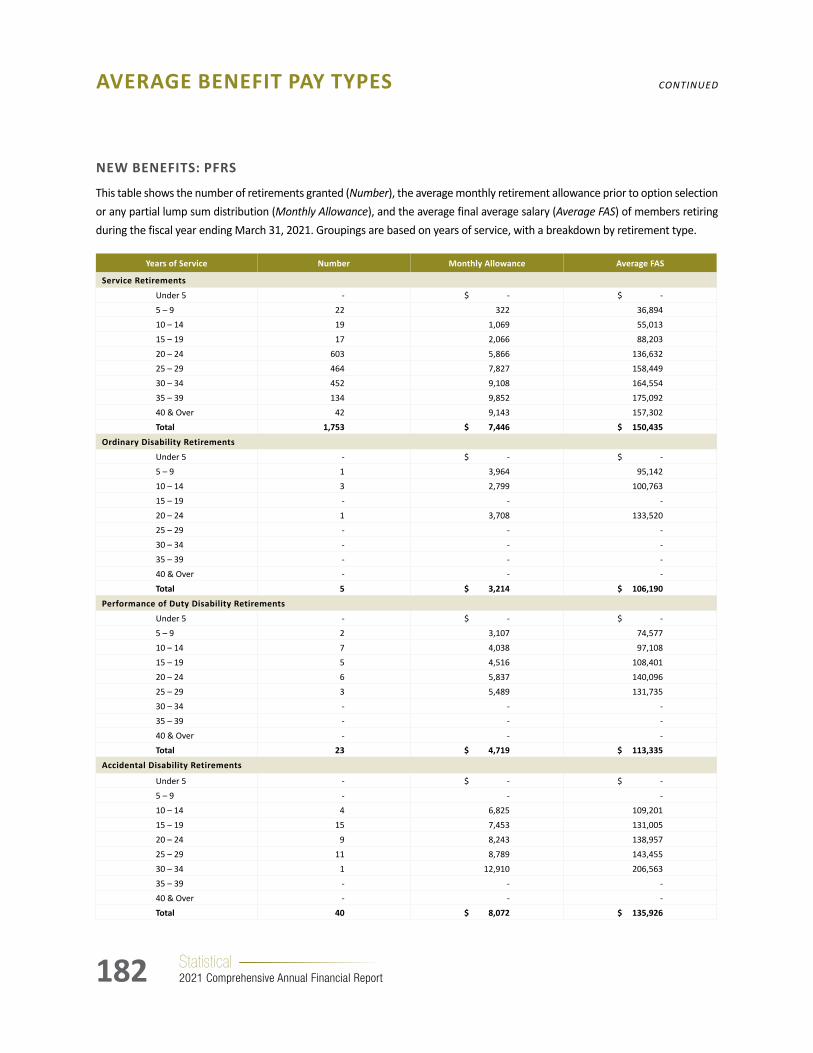
182 Statistical 2021 Comprehensive Annual Financial Report
NEW BENEFITS: PFRS
This table shows the number of retirements granted (Number), the average monthly retirement allowance prior to option selection or any partial lump sum distribution (Monthly Allowance), and the average final average salary (Average FAS) of members retiring during the fiscal year ending March 31, 2021. Groupings are based on years of service, with a breakdown by retirement type.
Years of Service Number Monthly Allowance Average FAS
Service Retirements
Under 5 - $ - $ - 5 – 9 22 322 36,894 10 – 14 19 1,069 55,013 15 – 19 17 2,066 88,203 20 – 24 603 5,866 136,632 25 – 29 464 7,827 158,449 30 – 34 452 9,108 164,554 35 – 39 134 9,852 175,092 40 & Over 42 9,143 157,302 Total 1,753 $ 7,446 $ 150,435
Ordinary Disability Retirements
Under 5 - $ - $ - 5 – 9 1 3,964 95,142 10 – 14 3 2,799 100,763 15 – 19 - - - 20 – 24 1 3,708 133,520 25 – 29 - - - 30 – 34 - - - 35 – 39 - - - 40 & Over - - - Total 5 $ 3,214 $ 106,190
Performance of Duty Disability Retirements
Under 5 - $ - $ - 5 – 9 2 3,107 74,577 10 – 14 7 4,038 97,108 15 – 19 5 4,516 108,401 20 – 24 6 5,837 140,096 25 – 29 3 5,489 131,735 30 – 34 - - - 35 – 39 - - - 40 & Over - - - Total 23 $ 4,719 $ 113,335
Accidental Disability Retirements
Under 5 - $ - $ - 5 – 9 - - - 10 – 14 4 6,825 109,201 15 – 19 15 7,453 131,005 20 – 24 9 8,243 138,957 25 – 29 11 8,789 143,455 30 – 34 1 12,910 206,563 35 – 39 - - - 40 & Over - - - Total 40 $ 8,072 $ 135,926
AVERAGE BENEFIT PAY TYPES CONTINUED

183Statistical 2021 Comprehensive Annual Financial Report
NEWBENEFITS— SERVICE RETIREMENTS BY AGE AND SERVICE
This table shows the number of retirements granted (Number), the average annual retirement allowance prior to option selection or any partial lump sum distribution (Allowance), and the average allowance as a percentage of the average final average salary (%) of new service retirees during the fiscal year ending March 31, 2021. Groupings are based on years of service and age at retirement, within each retirement system.
Years of Service
Age at Retirement
50 – 59 60 – 64 65 – 69 70 & Over
Number Allowance % Number Allowance % Number Allowance % Number Allowance %
ERS
Under 5 - $ - - 1 $ 2,256 10 - $ - - 2 $ 74,655 62
5 – 9 234 3,830 9 336 4,235 11 307 4,277 11 135 4,236 12
10 – 14 664 7,609 15 1,092 9,623 19 1,057 9,997 20 434 10,499 20
15 – 19 527 11,165 21 950 14,550 27 848 15,526 28 400 15,212 28
20 – 24 773 23,502 35 1,797 26,675 42 1,398 27,604 43 568 26,592 43
25 – 29 841 41,945 46 1,275 38,091 52 795 38,123 54 322 38,654 54
30 – 34 2,793 52,959 62 1,851 51,427 62 659 50,690 63 292 46,885 63
35 – 39 957 57,654 68 875 63,246 69 330 60,752 70 165 67,408 71
40 & Over 26 57,035 75 290 62,186 76 280 73,694 78 185 89,724 82
Total 6,815 $ 39,596 48 8,467 $ 34,348 46 5,674 $ 29,614 42 2,503 $ 32,091 43
Years of Service
Age at Retirement
40 – 49 50 – 54 55 – 59 60 & Over
Number Allowance % Number Allowance % Number Allowance % Number Allowance %
PFRS
Under 5 - $ - - – $ - - - $ - - - $ - -
5 – 9 - - - - - - 16 4,334 10 6 2,647 11
10 – 14 1 35,526 50 - - - 13 11,122 20 5 12,739 23
15 – 19 - - - - - - 13 25,857 26 4 21,356 38
20 – 24 308 69,804 51 203 72,898 52 65 69,785 51 27 59,890 50
25 – 29 48 92,771 56 217 92,698 58 170 95,588 60 29 95,303 59
30 – 34 - - - 98 108,570 64 266 112,521 67 88 100,408 66
35 – 39 - - - 1 151,924 70 51 133,150 68 82 108,529 66
40 & Over - - - - - - 1 172,333 70 41 108,192 85
Total 357 $ 72,796 52 519 $ 88,065 57 595 $ 97,865 60 282 $ 94,741 64

184 Statistical 2021 Comprehensive Annual Financial Report
NEWBENEFITS—ACCIDENTALANDORDINARYDEATH
ACCIDENTAL DEATH BENEFITS
During the fiscal year ending March 31, 2021, the Employees’ Retirement System approved 21 accidental death benefits which averaged $40,945 annually. The Police and Fire Retirement System approved six accidental death benefits, which averaged $81,447 annually.
ORDINARY DEATH BENEFITS
This table shows the number of ordinary death benefits granted (Number), the average benefit paid (Average Benefit), and the average benefit paid as a percentage of average final average salary (Percentage of Salary) of new ordinary death beneficiaries during the fiscal year ending March 31, 2021. Groupings are based on years of service, with a breakdown by retirement system.
Years of Service
ERS PFRS
Number Average Benefit
Percentage of Salary
Number Average Benefit
Percentage of Salary
Under 5 180 $ 41,058 95.1 4 $ 156,045 267.2
5 – 9 222 76,672 166.3 3 - -
10 – 14 223 108,009 224.7 2 110,500 301.3
15 – 19 185 143,928 247.6 2 275,500 300.2
20 – 24 100 161,444 264.5 3 743,237 568.7
25 – 29 72 195,344 274.8 2 961,936 736.0
30 – 34 47 211,263 287.8 1 2,050,009 822.8
35 – 39 22 201,502 267.4 1 1,202,295 601.1
40 & Over 12 209,900 301.2 - - -
Total 1,063 $ 114,972 207.1 18 $ 489,004 485.0

185Statistical 2021 Comprehensive Annual Financial Report
COMBINED SYSTEM PARTICIPANTS
This table shows participant counts for ERS and PFRS combined. Members represent those participants not currently collecting a benefit, while Retirees/Beneficiaries represent those currently collecting a benefit. The Total Participants column represents the sum of the member and retiree/beneficiary counts. The Percentage Changed column shows the percentage change increase or decrease in counts calculated on a year-over-year basis. The stacked line graph (below) shows the trends in these counts over the prior 20 years.
Fiscal Year MembersPercentage
ChangedRetirees/
BeneficiariesPercentage
Changed Total
ParticipantsPercentage
Changed
2002 637,896 2 306,604 3 944,500 22003 650,543 2 313,597 2 964,140 2 2004 641,721 (1) 328,357 5 970,078 1 2005 647,758 1 334,251 2 982,009 1 2006 653,291 1 342,245 2 995,536 1 2007 662,633 1 350,066 2 1,012,699 2 2008 677,321 2 358,109 2 1,035,430 2 2009 679,908 0 366,178 2 1,046,086 1 2010 679,217 0 375,803 3 1,055,020 1 2011 672,723 (1) 385,031 2 1,057,754 0 2012 656,224 (2) 403,174 5 1,059,398 0 2013 647,574 (1) 413,436 3 1,061,010 0 2014 643,659 (1) 422,405 2 1,066,064 0 2015 643,178 0 430,308 2 1,073,486 1 2016 647,399 1 440,943 2 1,088,342 12017 652,324 1 452,455 3 1,104,779 2
2018 652,030 0 470,596 4 1,122,626 2 2019 658,176 1 481,795 2 1,139,971 2 2020 673,336 2 487,407 1 1,160,743 22021 675,519 0 496,628 2 1,172,147 1
0
200,000
400,000
600,000
800,000
1,000,000
1,200,000
Retirees/Beneficiaries
Members
20212020201920182017201620152014201320122011201020092008200720062005200420032002

186 Statistical 2021 Comprehensive Annual Financial Report
MEMBERSHIP BY AGE AND YEARS OF SERVICE
This table shows membership counts (Number), and percentage of the system’s total membership count (Percentage), as of the fiscal year ending March 31, 2021. Groupings are based on age and years of service, with a breakdown by retirement system.
Age
Years of Service
Total 0 – 4 5 – 9 10 – 19 20 – 29 30 & Over
Number Percentage Number Percentage Number Percentage Number Percentage Number Percentage Number Percentage
ERS
Under 25 37,741 5.9 37,409 5.8 332 0.1 – – – – – –
25 – 34 120,304 18.8 90,441 14.1 25,190 3.9 4,673 0.7 – – – –
35 – 44 128,170 20.0 52,005 8.1 31,389 4.9 40,675 6.3 4,101 0.6 – –
45 – 54 157,631 24.6 39,925 6.2 29,996 4.7 49,871 7.8 32,131 5.0 5,708 0.9
55 – 64 157,578 24.6 27,483 4.3 25,394 4.0 51,021 8.0 35,947 5.6 17,733 2.8
65 & Over 39,157 6.1 6,853 1.1 6,708 1.0 12,505 2.0 8,179 1.3 4,912 0.8
Total 640,581 100.0 254,116 39.7 119,009 18.6 158,745 24.8 80,358 12.5 28,353 4.4
PFRS
Under 25 749 2.1 745 2.1 4 – – – – – – –
25 – 34 10,826 31.0 6,400 18.3 3,703 10.6 723 2.1 – – – –
35 – 44 11,358 32.5 1,574 4.5 2,589 7.4 6,612 18.9 583 1.7 – –
45 – 54 9,105 26.1 316 0.9 554 1.6 3,226 9.2 4,581 13.1 428 1.2
55 – 64 2,747 7.9 95 0.3 238 0.7 278 0.8 951 2.7 1,185 3.4
65 & Over 153 0.4 22 0.1 49 0.1 21 0.1 10 – 51 0.1
Total 34,938 100.0 9,152 26.2 7,137 20.4 10,860 31.1 6,125 17.5 1,664 4.8
Note: Percentages may not sum to 100% due to rounding.
ERS
Age 45 to 54 24.6%
Age 55 to 64 24.6%
Age 35 to 44 20.0%
Age 65 & over 6.1%
Under 25 Years Old5.9%
Age 25 to 3418.8%
PFRS
Age 65 & over 0.4% Under 25 Years Old
2.1%
Age 25 to 3431.0%
Age 35 to 44 32.5 %
Age 45 to 54 26.1 %
Age 55 to 64 7.9 %

187Statistical 2021 Comprehensive Annual Financial Report
MEMBERSHIP BY TIER
This table shows membership counts (Number), and percentage of the system’s total membership count (Percentage), as of the fiscal year ending March 31, 2021. Groupings are based on tier, with a breakdown by retirement system.
ERS PFRS Total
Number Percentage Number Percentage Number Percentage
Tier 1 1,305 0.2 19 0.1 1,324 0.2
Tier 2 1,364 0.2 18,763 53.7 20,127 3.0
Tiers 3 & 4* 289,329 45.2 233 0.7 289,562 42.9
Tier 5 37,114 5.8 1,967 5.6 39,081 5.8
Tier 6 311,469 48.6 13,956 39.9 325,425 48.2
Total 640,581 100.0 34,938 100.0 675,519 100.0
* There is no Tier 4 in the Police and Fire Retirement System.
Note: Percentages may not sum to 100% due to rounding.
ERS
Tier 55.8%
Tiers 3 & 445.2%
Tier 1 0.2%
Tier 6 48.6%
Tier 20.2%
PFRS Tier 2 53.7%
Tier 1 0.1%
Tier 6 39.9%
Tier 55.6%
Tier 30.7%
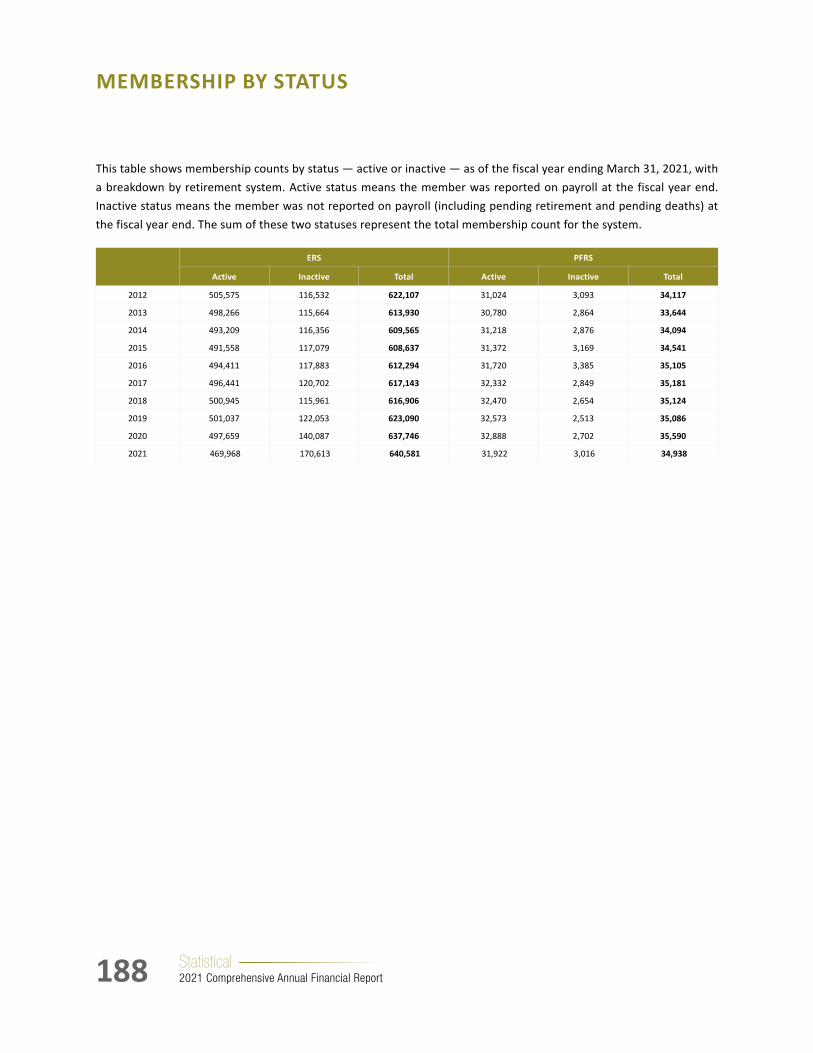
188 Statistical 2021 Comprehensive Annual Financial Report
MEMBERSHIP BY STATUS
This table shows membership counts by status — active or inactive — as of the fiscal year ending March 31, 2021, with a breakdown by retirement system. Active status means the member was reported on payroll at the fiscal year end. Inactive status means the member was not reported on payroll (including pending retirement and pending deaths) at the fiscal year end. The sum of these two statuses represent the total membership count for the system.
ERS PFRS
Active Inactive Total Active Inactive Total
2012 505,575 116,532 622,107 31,024 3,093 34,117
2013 498,266 115,664 613,930 30,780 2,864 33,644
2014 493,209 116,356 609,565 31,218 2,876 34,094
2015 491,558 117,079 608,637 31,372 3,169 34,541
2016 494,411 117,883 612,294 31,720 3,385 35,105
2017 496,441 120,702 617,143 32,332 2,849 35,181
2018 500,945 115,961 616,906 32,470 2,654 35,124
2019 501,037 122,053 623,090 32,573 2,513 35,086
2020 497,659 140,087 637,746 32,888 2,702 35,590
2021 469,968 170,613 640,581 31,922 3,016 34,938

189Statistical 2021 Comprehensive Annual Financial Report
NUMBER OF EMPLOYERS
As of March 31, 2021.
Category ERS PFRS
State 1 1
Counties 86 4
Cities 72 61
Towns 937 169
Villages 487 299
Miscellaneous 763 37
School Districts 706 0
Total* 3,052 571
* Please note that some ERS employers are also PFRS employers. Therefore the total of ERS employers and PFRS employers above will not equal the total number of NYSLRS participating employers.

190 Statistical 2021 Comprehensive Annual Financial Report
TOTAL MEMBERSHIP BY EMPLOYER TYPE
Note: Numbers may not add up due to rounding. A detailed listing of employers as of March 31, 2021 is available on our website at www.osc.state.ny.us/files/retirement/employers/pdf/participating-employers.pdf.
This table shows total and active membership counts, grouped by primary employer type as of the fiscal year ending March 31, 2021, with a breakdown by retirement system. Active status means the member was reported on payroll at the fiscal year end.
ERS PFRS Total
Total Active Total Active Total Active
State 206,913 156,266 6,493 5,914 213,406 162,180
Counties 105,523 78,464 5,149 5,031 110,672 83,495
Cities 18,530 13,493 11,654 10,819 30,184 24,312
Towns 48,351 33,158 4,108 3,669 52,459 36,827
Villages 15,543 10,646 4,181 3,357 19,724 14,003
Miscellaneous 103,731 73,361 3,353 3,132 107,084 76,493
School Districts 141,990 104,580 – – 141,990 104,580
Total 640,581 469,968 34,938 31,922 675,519 501,890
ERS
Cities2.9%
Towns7.5%
Villages2.4%
SchoolDistricts22.2%
Miscellaneous16.2%
Counties16.5%
State32.3%
ERS PFRS
State18.6%
Counties14.7%
Cities33.4%
Towns11.8%
Villages12.0%
Miscellaneous9.6%

191Statistical 2021 Comprehensive Annual Financial Report
AVERAGE SALARY BY EMPLOYER TYPE
This table shows the average salary (Average Salary), membership counts (Total Members*), and total salary (Total Salaries) for active members as of the fiscal year ending March 31, 2021. Groupings are based on primary employer type, with a breakdown by retirement system. Active status means the member was reported on payroll at the fiscal year end.
Average Salary Total Members* Total Salaries
ERS
State $ 71,685 156,266 $ 11,201,973,205
Counties 58,622 78,464 4,599,729,225
Cities 54,502 13,493 735,399,647
Towns 48,896 33,158 1,621,310,079
Villages 50,119 10,646 533,567,165
Miscellaneous 64,572 73,361 4,737,096,890
School Districts 34,853 104,580 3,644,876,140
Total $ 57,608 469,968 $ 27,073,952,351
PFRS
State $ 129,516 5,914 $ 765,956,462
Counties 153,531 5,031 772,412,449
Cities 95,506 10,819 1,033,283,000
Towns 106,840 3,669 391,997,753
Villages 99,987 3,357 335,656,943
Miscellaneous 133,961 3,132 419,565,946
Total $ 116,499 31,922 $ 3,718,872,552
* Active members receiving salary.
The bar graph below represents the average salary by retirement system for each primary employer type.
0
40,000
80,000
120,000
160,000
200,000
PFRSERS
School DistrictsMiscellaneousVillageTownCityCountyState

192 Statistical 2021 Comprehensive Annual Financial Report
MEMBERSANDSALARIESBYPLAN—ERS
These tables show membership counts (Members) and total salary (Total Salaries) for active members in the Employees’ Retirement System, as of the fiscal year ending March 31, 2021. Groupings are based on plan, with a breakdown by tier. Active status means the member was reported on payroll at the end of the fiscal year.
PlanTier 1 Tier 2
Members Total Salaries Members Total Salaries
Age 55/60 Contributory 1 $ 10,903 1 $ 60,105
Age 55 75-c 7 132,680 12 387,168
Age 55 75-e 1 43,300 2 89,133
Age 55 75-g 13 665,171 9 353,030
Age 55 75-h 322 28,679,601 353 33,158,479
Age 55 75-i 455 27,242,433 564 32,071,547
Regular Correction Officers/Security Hospital Treatment Asst. ¾ Disability - - - -
Correction Officers 89 2 192,336 2 276,001
Sheriffs 89-a 1 129,300 - -
Sheriffs 89-b - - - -
Sheriffs 89-b(m) - - - -
Investigators 89-d - - - -
Investigators 89-d(m) - - - -
Sheriffs — 551 - - - -
Sheriffs — 551e - - - -
Sheriffs — 552 - - - -
Sheriffs — 553 - - - -
Legislators 80-a 1 114,231 - -
Unified Court Peace Officers - - 7 947,707
25-Year Correction Officers/Sheriffs/Office of Mental Health 5 415,732 5 443,585
25-Year 1/60 Peace Officers, Amb Med Techs, Paramedics 1 123,846 1 139,864
Total 809 $ 57,749,532 956 $ 67,926,618

193Statistical 2021 Comprehensive Annual Financial Report
PlanTier 3 & 4 Tier 5 Tier 6
Members Total Salaries Members Total Salaries Members Total Salaries*
Article 14 & 15 211,108 $ 14,507,526,450 24,309 $ 1,372,024,668 194,560 $ 7,798,548,958
Regular Correction Officers/ Security Hospital Treatment Asst. ¾ Disability
337 34,852,359 26 1,992,605 174 12,309,749
Article 14 Correction Officers 9,782 923,406,758 848 65,866,830 8,324 570,177,957
Sheriffs — 551 184 17,773,819 11 770,914 76 4,682,123
Sheriffs — 551e 53 3,992,119 9 640,408 43 2,227,299
Sheriffs — 552 283 24,997,680 37 2,737,487 198 11,580,098
Sheriffs — 553 1,066 120,314,475 167 15,819,746 663 46,279,535
Unified Court Peace Officers 4,429 457,545,078 281 24,086,016 1,814 125,144,169
25-Year Correction Officers/Sheriffs/Office of Mental Health 5,029 501,115,286 648 57,589,118 3,514 215,757,366
25-Year 1/60 Peace Officers, Paramedics 10 687,099 1 50,445 7 165,863
20-Year 1/60 Investigators 12 2,263,241 1 187,349 4 226,564
Westchester County Criminal Investigators 23 3,273,550 1 147,906 5 562,725
25-Year 1/60 ¾ Accidental Disability Amb Med Techs 102 14,402,706 5 582,794 11 581,819
25-Year ¾ Accidental Disability Fire Marshals 32 4,157,187 5 485,596 11 742,289
Total 232,450 $ 16,616,307,807 26,349 $ 1,542,981,880 209,404 $ 8,788,986,514
* Reportable Tier 6 salary is capped at the Governor’s salary, which was $225,000 for fiscal year 2021.
There may be plans with no member count and salary greater than zero. Members who work for multiple employers may have salary under multiple plans but will only be counted once, under his/her primary plan.
MEMBERSANDSALARIESBYPLAN—ERS CONTINUED

194 Statistical 2021 Comprehensive Annual Financial Report
MEMBERSANDSALARIESBYPLAN—PFRS
These tables show membership counts (Members), and total salary (Total Salaries) for active members in the Police and Fire Retirement System, as of the fiscal year ending March 31, 2021. Groupings are based on plan, with a breakdown by tier and contributory status. Active status means the member was reported on payroll at the end of the fiscal year.
PlanTier 1 Tier 2 Tier 3
Members Total Salaries Members Total Salaries Members Total Salaries
Age 55/60 Basic – $ – 18 $ 219,298 – $ –
Age 55 375-c – – 78 2,235,798 2 74,262
Age 55 375-e – – 18 357,573 – -
Age 55 375-g – – 22 648,989 – -
Age 55 375-h – – 2 212,035 – -
Age 55 375-i 2 241,515 93 7,270,458 3 178,863
Age 55 375-j – – 7 1,042,180 – -
State Police 381-b – – 2,813 431,250,978 – -
Regional Park Police 383-a – – 131 13,539,853 – -
EnCon Police 383-b – – 191 21,043,520 1 77,817
Forest Ranger 383-c – – 84 9,318,152 2 163,093
SUNY Police 383-d – – 240 22,216,055 10 824,107
25-Year 384 – – 23 1,515,528 14 1,645,800
25-Year 384(f) – – 62 8,415,135 69 7,101,050
20-Year 384-d – – 5,035 610,347,835 – –
20-Year 1/60 384-e 4 857,248 8,534 1,341,236,435 – –
Article 14 Police and Fire – – – – 108 11,071,177
Total 6 $ 1,098,763 17,351 $ 2,470,869,821 209 $ 21,136,171

195Statistical 2021 Comprehensive Annual Financial Report
MEMBERSANDSALARIESBYPLAN—PFRS CONTINUED
There may be plans with no member count and salary greater than zero. A member who works for multiple employers may have salary under multiple plans but will only be counted once, under his/her primary plan.
PlanTier 5 Contributory Tier 5 Non-Contributory Tier 6 Contributory Tier 6 Non-Contributory
Members Total Salaries Members Total Salaries Members Total Salaries* Members Total Salaries*
Age 55/60 Basic 2 $ 38,205 – $ – 13 $ 71,670 – $ –
Age 55 375-c 6 110,125 – – 55 961,054 – –
Age 55 375-e 1 16,295 – – 35 429,142 – –
Age 55 375-g 2 32,019 – – 13 290,616 – –
Age 55 375-h - – – – 2 121,439 – –
Age 55 375-i 8 513,470 – – 25 1,958,412 – –
Age 55 375-j - – – – - – – –
State Police 381-b 116 14,680,906 – – 1,814 212,839,060 – –
Regional Park Police 383-a 3 331,393 – – 92 7,906,374 – –
EnCon Police 383-b 8 623,874 – – 102 8,886,589 – –
Forest Ranger 383-c 2 206,298 – – 42 3,702,649 – –
SUNY Police 383-d 46 3,723,049 – – 214 13,779,987 – –
25-Year 384 5 386,480 – – 30 1,737,115 – –
25-Year 384(f) 6 1,003,916 4 804,155 31 2,770,805 1 92,980
20-Year 384-d 574 57,004,798 137 12,220,589 4,156 289,887,868 – –
20-Year 1/60 384-e 754 86,859,657 156 17,714,590 5,859 477,632,145 42 6,430,075
Article 14 Police and Fire – – - – – – – –
Total 1,533 $ 165,530,486 297 $ 30,739,334 12,483 $ 1,022,974,922 43 $ 6,523,055
* Reportable Tier 6 salary is capped at the Governor’s salary, which was $225,000 for fiscal year 2021.
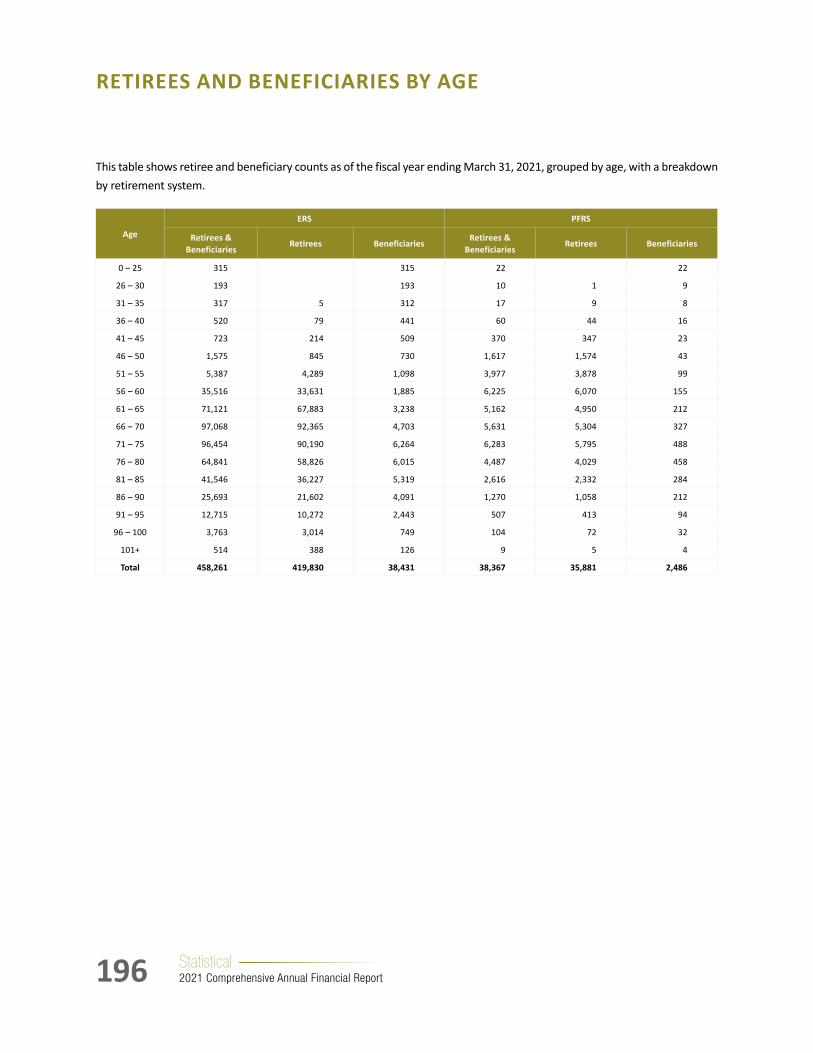
196 Statistical 2021 Comprehensive Annual Financial Report
RETIREES AND BENEFICIARIES BY AGE
This table shows retiree and beneficiary counts as of the fiscal year ending March 31, 2021, grouped by age, with a breakdown by retirement system.
Age
ERS PFRS
Retirees & Beneficiaries
Retirees BeneficiariesRetirees &
BeneficiariesRetirees Beneficiaries
0 – 25 315 315 22 22
26 – 30 193 193 10 1 9
31 – 35 317 5 312 17 9 8
36 – 40 520 79 441 60 44 16
41 – 45 723 214 509 370 347 23
46 – 50 1,575 845 730 1,617 1,574 43
51 – 55 5,387 4,289 1,098 3,977 3,878 99
56 – 60 35,516 33,631 1,885 6,225 6,070 155
61 – 65 71,121 67,883 3,238 5,162 4,950 212
66 – 70 97,068 92,365 4,703 5,631 5,304 327
71 – 75 96,454 90,190 6,264 6,283 5,795 488
76 – 80 64,841 58,826 6,015 4,487 4,029 458
81 – 85 41,546 36,227 5,319 2,616 2,332 284
86 – 90 25,693 21,602 4,091 1,270 1,058 212
91 – 95 12,715 10,272 2,443 507 413 94
96 – 100 3,763 3,014 749 104 72 32
101+ 514 388 126 9 5 4
Total 458,261 419,830 38,431 38,367 35,881 2,486

197Statistical 2021 Comprehensive Annual Financial Report
RETIREESANDBENEFICIARIES—ERS
Year of Retirement
Number
AverageOption 0 Benefit
w/o COLA*
Average COLA
Total
1956 – $ – $ – $ –
1957 - - - -
1958 - - - -
1959 1 3,518 10,282 13,800
1960 - - - -
1961 - - - -
1962 - - - -
1963 2 2,112 7,602 9,714
1964 - - - -
1965 1 2,284 3,943 6,227
1966 2 2,779 9,009 11,788
1967 - - - -
1968 2 1,476 1,947 3,423
1969 7 1,866 3,821 5,687
1970 7 2,481 3,548 6,029
1971 10 5,842 6,913 12,755
1972 17 5,775 6,675 12,450
1973 29 4,646 5,499 10,145
1974 38 7,838 8,286 16,124
1975 57 6,202 6,464 12,666
1976 117 5,780 5,690 11,470
1977 169 5,879 5,905 11,784
1978 215 6,220 5,599 11,818
1979 296 5,660 4,936 10,595
1980 400 5,991 4,533 10,524
1981 502 5,752 3,897 9,649
1982 656 6,934 4,019 10,953
1983 750 6,915 3,715 10,630
1984 1,105 9,114 4,340 13,454
1985 1,130 8,754 3,959 12,713
1986 1,610 9,241 3,928 13,169
1987 1,896 10,098 4,081 14,179
1988 2,036 11,083 4,047 15,130
* 8,420 of the 38,431 beneficiaries are not eligible for COLA and are not included in the above counts.
This table shows the number (Number), the average annual modified pension benefit prior to option selection and without any cost-of-living adjustment (Average Option 0 Benefit w/o COLA), and the average cost-of-living adjustment (Average COLA) of surviving Employees’ Retirement System retirees and beneficiaries* as of March 31, 2021. Groupings are based on the fiscal year of the member’s retirement. The modified pension benefit has been reduced for any partial lump sum distribution.
Year of Retirement
Number
AverageOption 0 Benefit
w/o COLA*
Average COLA
Total
1989 2,504 $ 11,954 $ 3,958 $ 15,912
1990 3,043 13,358 3,836 17,193
1991 5,227 17,620 4,193 21,813
1992 5,022 14,673 3,633 18,306
1993 4,366 15,564 3,451 19,015
1994 4,130 15,551 3,228 18,780
1995 5,213 16,385 3,220 19,605
1996 9,778 21,440 3,496 24,936
1997 9,234 19,791 3,125 22,915
1998 7,142 17,464 2,644 20,108
1999 8,040 17,246 2,484 19,730
2000 9,859 18,651 2,391 21,043
2001 10,906 22,033 2,425 24,458
2002 9,232 19,872 2,163 22,034
2003 20,710 28,801 2,286 31,087
2004 10,386 19,836 1,748 21,584
2005 12,734 22,039 1,660 23,699
2006 14,278 22,872 1,518 24,389
2007 14,974 25,332 1,427 26,759
2008 15,580 27,083 1,305 28,388
2009 14,551 27,027 1,141 28,168
2010 16,800 28,672 1,014 29,687
2011 26,232 34,894 933 35,827
2012 16,824 27,589 723 28,312
2013 17,026 27,245 584 27,829
2014 18,606 28,207 450 28,657
2015 19,705 29,476 290 29,766
2016 20,161 31,088 159 31,247
2017 20,522 31,844 - 31,844
2018 21,621 32,264 - 32,264
2019 21,014 33,188 - 33,188
2020 20,921 34,256 - 34,256
2021 22,445 $ 34,341 $ – $ 34,341
* 8,420 of the 38,431 beneficiaries are not eligible for COLA and are not included in the above counts.

198 Statistical 2021 Comprehensive Annual Financial Report
RETIREESANDBENEFICIARIES—PFRS
Year of Retirement
NumberAverage Option 0
w/o COLA*
Average COLA
Total
1989 658 $ 24,833 $ 7,263 $ 32,096
1990 706 27,744 6,611 34,355
1991 813 30,553 6,128 36,682
1992 884 34,809 5,536 40,345
1993 858 33,651 5,226 38,877
1994 786 32,958 4,756 37,714
1995 681 38,082 4,328 42,410
1996 684 36,647 4,091 40,737
1997 678 40,780 3,760 44,540
1998 649 39,078 3,346 42,423
1999 701 40,418 3,203 43,622
2000 826 47,177 2,874 50,051
2001 1,041 52,637 2,803 55,440
2002 903 53,926 2,571 56,497
2003 1,217 60,852 2,348 63,200
2004 1,157 58,571 2,165 60,736
2005 1,055 58,723 1,879 60,603
2006 1,067 59,642 1,650 61,292
2007 1,084 60,461 1,471 61,932
2008 1,102 62,737 1,233 63,970
2009 1,046 66,116 1,085 67,201
2010 1,086 68,211 904 69,115
2011 1,236 68,913 712 69,625
2012 1,199 70,695 514 71,209
2013 1,212 69,267 394 69,661
2014 1,208 72,414 290 72,704
2015 1,311 75,346 178 75,523
2016 1,267 78,452 92 78,544
2017 1,213 79,635 - 79,635
2018 1,518 84,436 - 84,436
2019 1,563 84,794 - 84,794
2020 1,442 86,822 - 86,822
2021 1,660 $ 88,915 $ - $ 88,915
* 458 of the 2,486 beneficiaries are not eligible for COLA and are not included in the above counts.
This table shows the number (Number), the average annual modified pension benefit prior to option selection and without any cost-of-living adjustment (Average Option 0 Benefit w/o COLA), and the average cost-of-living adjustment (Average COLA) of surviving Police and Fire Retirement System retirees and beneficiaries* as of March 31, 2021. Groupings are based on the fiscal year of the member’s retirement. The modified pension benefit has been reduced for any partial lump sum distribution.
Year of Retirement
NumberAverage Option 0
w/o COLA*
Average COLA
Total
1956 1 $ 3,614 $ 22,581 $ 26,195
1957 - - - -
1958 - - - -
1959 - - - -
1960 - - - -
1961 - - - -
1962 - - - -
1963 1 4,134 18,807 22,941
1964 - - - -
1965 1 6,492 22,168 28,660
1966 2 4,280 14,429 18,708
1967 4 5,204 14,179 19,383
1968 2 7,081 18,432 25,513
1969 4 5,070 11,938 17,008
1970 2 5,035 9,661 14,696
1971 9 8,443 13,780 22,223
1972 25 7,385 14,502 21,886
1973 35 7,475 13,308 20,782
1974 43 8,196 14,350 22,546
1975 32 8,963 12,986 21,949
1976 38 10,026 13,801 23,827
1977 106 10,682 13,238 23,921
1978 101 11,304 13,034 24,339
1979 143 11,240 11,891 23,131
1980 147 12,424 11,111 23,535
1981 149 13,439 9,850 23,289
1982 230 14,274 9,092 23,366
1983 242 15,550 8,781 24,331
1984 250 17,594 8,806 26,400
1985 299 19,480 8,420 27,901
1986 450 20,762 8,200 28,962
1987 472 22,660 8,173 30,833
1988 610 24,799 7,663 32,462
* 458 of the 2,486 beneficiaries are not eligible for COLA and are not included in the above counts.
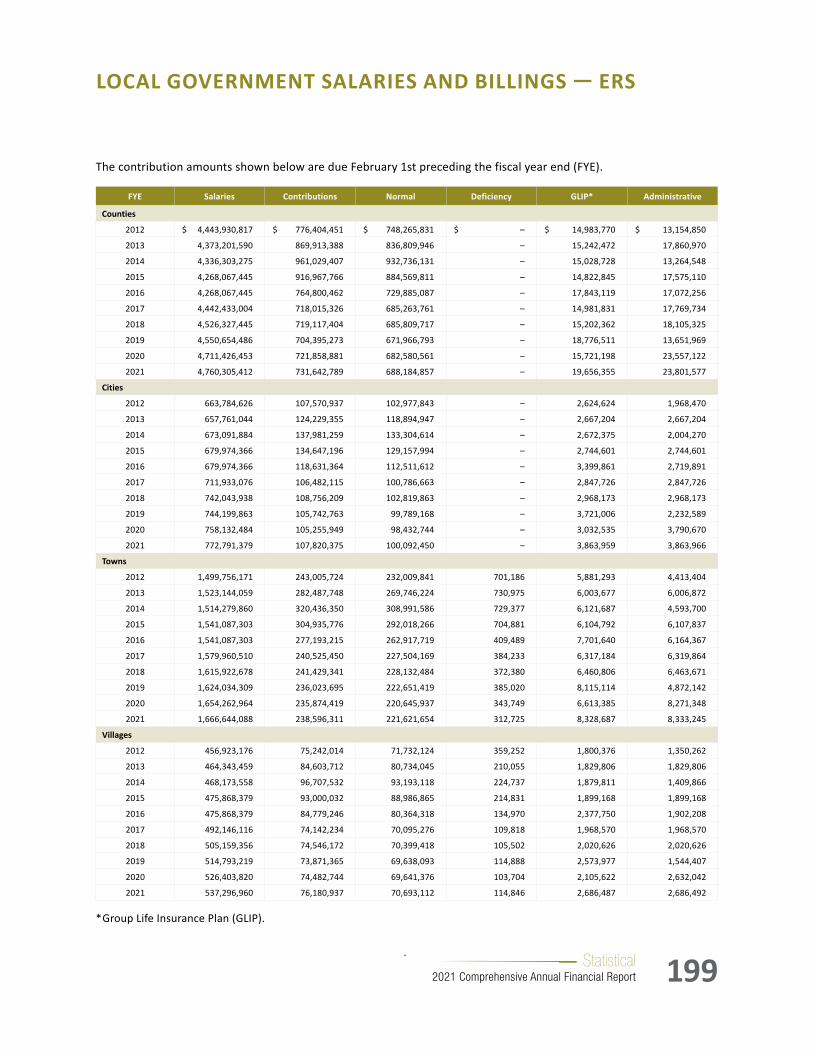
199Statistical 2021 Comprehensive Annual Financial Report
LOCALGOVERNMENTSALARIESANDBILLINGS—ERS
The contribution amounts shown below are due February 1st preceding the fiscal year end (FYE).
FYE Salaries Contributions Normal Deficiency GLIP* Administrative
Counties
2012 $ 4,443,930,817 $ 776,404,451 $ 748,265,831 $ – $ 14,983,770 $ 13,154,850
2013 4,373,201,590 869,913,388 836,809,946 – 15,242,472 17,860,970
2014 4,336,303,275 961,029,407 932,736,131 – 15,028,728 13,264,548
2015 4,268,067,445 916,967,766 884,569,811 – 14,822,845 17,575,110
2016 4,268,067,445 764,800,462 729,885,087 – 17,843,119 17,072,256
2017 4,442,433,004 718,015,326 685,263,761 – 14,981,831 17,769,734
2018 4,526,327,445 719,117,404 685,809,717 – 15,202,362 18,105,325
2019 4,550,654,486 704,395,273 671,966,793 – 18,776,511 13,651,969
2020 4,711,426,453 721,858,881 682,580,561 – 15,721,198 23,557,122
2021 4,760,305,412 731,642,789 688,184,857 – 19,656,355 23,801,577
Cities
2012 663,784,626 107,570,937 102,977,843 – 2,624,624 1,968,470
2013 657,761,044 124,229,355 118,894,947 – 2,667,204 2,667,204
2014 673,091,884 137,981,259 133,304,614 – 2,672,375 2,004,270
2015 679,974,366 134,647,196 129,157,994 – 2,744,601 2,744,601
2016 679,974,366 118,631,364 112,511,612 – 3,399,861 2,719,891
2017 711,933,076 106,482,115 100,786,663 – 2,847,726 2,847,726
2018 742,043,938 108,756,209 102,819,863 – 2,968,173 2,968,173
2019 744,199,863 105,742,763 99,789,168 – 3,721,006 2,232,589
2020 758,132,484 105,255,949 98,432,744 – 3,032,535 3,790,670
2021 772,791,379 107,820,375 100,092,450 – 3,863,959 3,863,966
Towns
2012 1,499,756,171 243,005,724 232,009,841 701,186 5,881,293 4,413,404
2013 1,523,144,059 282,487,748 269,746,224 730,975 6,003,677 6,006,872
2014 1,514,279,860 320,436,350 308,991,586 729,377 6,121,687 4,593,700
2015 1,541,087,303 304,935,776 292,018,266 704,881 6,104,792 6,107,837
2016 1,541,087,303 277,193,215 262,917,719 409,489 7,701,640 6,164,367
2017 1,579,960,510 240,525,450 227,504,169 384,233 6,317,184 6,319,864
2018 1,615,922,678 241,429,341 228,132,484 372,380 6,460,806 6,463,671
2019 1,624,034,309 236,023,695 222,651,419 385,020 8,115,114 4,872,142
2020 1,654,262,964 235,874,419 220,645,937 343,749 6,613,385 8,271,348
2021 1,666,644,088 238,596,311 221,621,654 312,725 8,328,687 8,333,245
Villages
2012 456,923,176 75,242,014 71,732,124 359,252 1,800,376 1,350,262
2013 464,343,459 84,603,712 80,734,045 210,055 1,829,806 1,829,806
2014 468,173,558 96,707,532 93,193,118 224,737 1,879,811 1,409,866
2015 475,868,379 93,000,032 88,986,865 214,831 1,899,168 1,899,168
2016 475,868,379 84,779,246 80,364,318 134,970 2,377,750 1,902,208
2017 492,146,116 74,142,234 70,095,276 109,818 1,968,570 1,968,570
2018 505,159,356 74,546,172 70,399,418 105,502 2,020,626 2,020,626
2019 514,793,219 73,871,365 69,638,093 114,888 2,573,977 1,544,407
2020 526,403,820 74,482,744 69,641,376 103,704 2,105,622 2,632,042
2021 537,296,960 76,180,937 70,693,112 114,846 2,686,487 2,686,492
* Group Life Insurance Plan (GLIP).

200 Statistical 2021 Comprehensive Annual Financial Report
FYE Salaries Contributions Normal Deficiency GLIP* Administrative
Miscellaneous
2012 $ 4,074,206,349 $ 705,637,232 $ 676,397,501 $ 1,117,975 $ 16,069,562 $ 12,052,194
2013 3,971,661,743 749,635,292 716,057,300 835,444 16,371,274 16,371,274
2014 3,968,529,764 826,997,637 797,752,084 791,616 16,258,823 12,195,114
2015 4,016,329,736 786,826,716 753,471,524 785,464 16,284,864 16,284,864
2016 4,016,329,736 692,441,164 656,011,033 285,120 20,080,556 16,064,455
2017 4,218,674,267 624,983,230 590,938,378 295,426 16,874,713 16,874,713
2018 4,400,266,244 636,996,945 601,504,023 292,092 17,600,415 17,600,415
2019 4,548,171,902 639,193,644 602,507,287 300,990 22,740,865 13,644,502
2020 4,769,848,444 656,970,743 613,752,143 289,923 19,079,412 23,849,265
2021 4,928,473,582 681,965,509 632,481,941 198,772 24,642,379 24,642,417
Schools
2012 3,363,257,728 530,456,512 507,067,857 433,238 13,117,370 9,838,047
2013 3,295,559,464 623,154,200 595,786,408 426,060 13,470,866 13,470,866
2014 3,295,866,762 685,241,928 661,805,954 135,753 13,314,400 9,985,821
2015 3,337,348,846 654,771,133 627,945,059 139,518 13,343,278 13,343,278
2016 3,337,348,846 593,311,380 563,142,438 134,423 16,685,833 13,348,686
2017 3,463,921,681 524,114,526 496,273,503 129,599 13,855,712 13,855,712
2018 3,591,452,866 533,074,424 504,209,323 133,487 14,365,807 14,365,807
2019 3,656,797,566 527,849,814 498,457,959 137,491 18,283,980 10,970,384
2020 3,739,951,074 528,865,706 495,064,555 141,616 14,959,764 18,699,771
2021 3,841,977,275 544,514,579 505,949,072 145,661 19,209,895 19,209,951
For the FYEs 2012-2015, the contribution amounts include the normal cost of benefits including supplemental pensions and, in some cases, the Retirement Incentive Program, Deficiency Contributions, the Group Life Insurance Plan (GLIP), and the administrative cost of the System for the fiscal year.
For FYE 2016, and all subsequent FYEs, the contribution amounts include the normal cost of benefits including supplemental pensions, Deficiency Contributions, GLIP, the administrative cost of the System for the fiscal year, and accounting adjustments. Accounting adjustments include prior year adjustments, prepayment discounts, and reconciliation of actual versus estimated salary amounts.
Legislation enacted in July 2015 (Chapter 94, Laws of 2015) requires the System to use prior year actual salaries rather than current year estimated salaries in the calculation of required contributions. This change eliminates the need for reconciliation of actual versus estimated salaries, the result of which is reflected in the FYE 2016 salaries.
LOCALGOVERNMENTSALARIESANDBILLINGS—ERS CONTINUED

201Statistical 2021 Comprehensive Annual Financial Report
LOCALGOVERNMENTSALARIESANDBILLINGS—PFRS
The contribution amounts shown below are due February 1st preceding the fiscal year end (FYE).
FYE Salaries Contributions Normal Deficiency GLIP Administrative
Counties
2012 $ 741,170,663 $ 165,977,875 $ 162,848,546 $ – $ – $ 3,129,329
2013 750,476,797 186,487,909 182,070,522 – 736,230 3,681,157
2014 742,952,940 215,606,426 212,605,235 – – 3,001,191
2015 748,062,218 204,532,593 200,811,227 – 744,273 2,977,093
2016 748,062,218 183,660,699 180,668,452 – – 2,992,247
2017 813,351,565 197,749,660 193,682,901 – – 4,066,759
2018 837,536,191 205,595,002 201,407,318 – 837,538 3,350,146
2019 826,111,820 194,974,879 192,496,544 – – 2,478,335
2020 829,447,380 197,111,060 192,963,822 – – 4,147,238
2021 820,311,457 204,533,703 199,611,831 – – 4,921,872
Cities
2012 919,665,789 202,376,328 198,704,804 – – 3,671,524
2013 904,451,691 242,732,696 237,147,463 – 930,870 4,654,363
2014 940,121,957 270,589,638 266,868,512 – – 3,721,126
2015 935,625,377 266,374,021 261,525,612 – 969,687 3,878,722
2016 935,625,377 220,521,730 216,779,231 – – 3,742,499
2017 1,012,327,983 244,289,630 239,227,991 – – 5,061,639
2018 1,032,008,361 249,454,963 244,294,924 – 1,032,013 4,128,026
2019 1,046,903,046 244,069,656 240,928,943 – – 3,140,713
2020 1,073,918,736 249,937,319 244,567,724 – – 5,369,595
2021 1,068,635,389 258,554,169 252,142,350 – – 6,411,819
Towns
2012 345,481,241 74,297,961 72,943,723 – – 1,354,238
2013 344,465,630 90,102,480 88,024,012 – 346,422 1,732,046
2014 351,821,273 101,830,050 100,430,452 – – 1,399,598
2015 361,105,021 99,600,409 97,809,899 – 358,100 1,432,410
2016 361,105,021 103,194,597 101,750,184 – – 1,444,413
2017 375,409,567 91,053,202 89,176,144 – – 1,877,058
2018 385,731,210 94,187,748 92,259,099 – 385,724 1,542,925
2019 386,276,966 90,799,386 89,640,559 – – 1,158,827
2020 396,084,139 92,527,775 90,547,356 – – 1,980,419
2021 406,409,795 98,904,597 96,466,136 – – 2,438,461
Villages
2012 288,899,267 61,448,733 60,286,366 – – 1,162,367
2013 289,479,125 72,871,202 71,130,551 – 290,108 1,450,543
2014 296,688,354 83,549,031 82,367,874 – – 1,181,157
2015 298,766,157 81,460,417 79,943,884 – 303,296 1,213,237
2016 298,766,157 69,981,037 68,788,007 – – 1,193,030
2017 316,804,801 73,308,396 71,724,373 – – 1,584,023
2018 323,473,812 75,751,635 74,134,267 – 323,456 1,293,912
2019 327,388,623 73,872,681 72,890,527 – – 982,154
2020 337,679,673 76,094,089 74,405,690 – – 1,688,399
2021 344,249,844 80,165,375 78,099,874 – – 2,065,501

202 Statistical 2021 Comprehensive Annual Financial Report
FYE Salaries Contributions Normal Deficiency GLIP Administrative
Miscellaneous
2012 $ 305,193,545 $ 60,344,419 $ 59,216,144 $ – $ – $ 1,128,275
2013 303,608,075 77,558,504 75,734,743 – 303,957 1,519,804
2014 324,198,568 88,966,389 87,744,530 – – 1,221,859
2015 322,131,168 89,840,321 88,189,827 – 330,099 1,320,395
2016 322,131,168 73,328,115 72,039,593 – – 1,288,522
2017 332,682,130 78,709,281 77,045,873 – – 1,663,408
2018 345,926,023 82,341,868 80,612,241 – 345,923 1,383,704
2019 355,303,151 81,963,609 80,897,700 – – 1,065,909
2020 368,595,543 84,573,906 82,730,930 – – 1,842,976
2021 612,045,010 147,894,883 144,222,611 – – 3,672,272
For the FYEs 2012-2015, the contribution amounts include the normal cost of benefits including supplemental pensions and, in some cases, the Retirement Incentive Program, Deficiency Contributions, the Group Life Insurance Plan (GLIP), and the administrative cost of the System for the fiscal year.
For FYE 2016, and all subsequent FYEs, the contribution amounts include the normal cost of benefits including supplemental pensions, Deficiency Contributions, GLIP, the administrative cost of the System for the fiscal year, and accounting adjustments. Accounting adjustments include prior year adjustments, prepayment discounts, and reconciliation of actual versus estimated salary amounts.
Legislation enacted in July 2015 (Chapter 94, Laws of 2015) requires the System to use prior year actual salaries rather than current year estimated salaries in the calculation of required contributions. This change eliminates the need for reconciliation of actual versus estimated salaries, the result of which is reflected in the FYE 2016 salaries.
LOCALGOVERNMENTSALARIESANDBILLINGS—PFRS CONTINUED
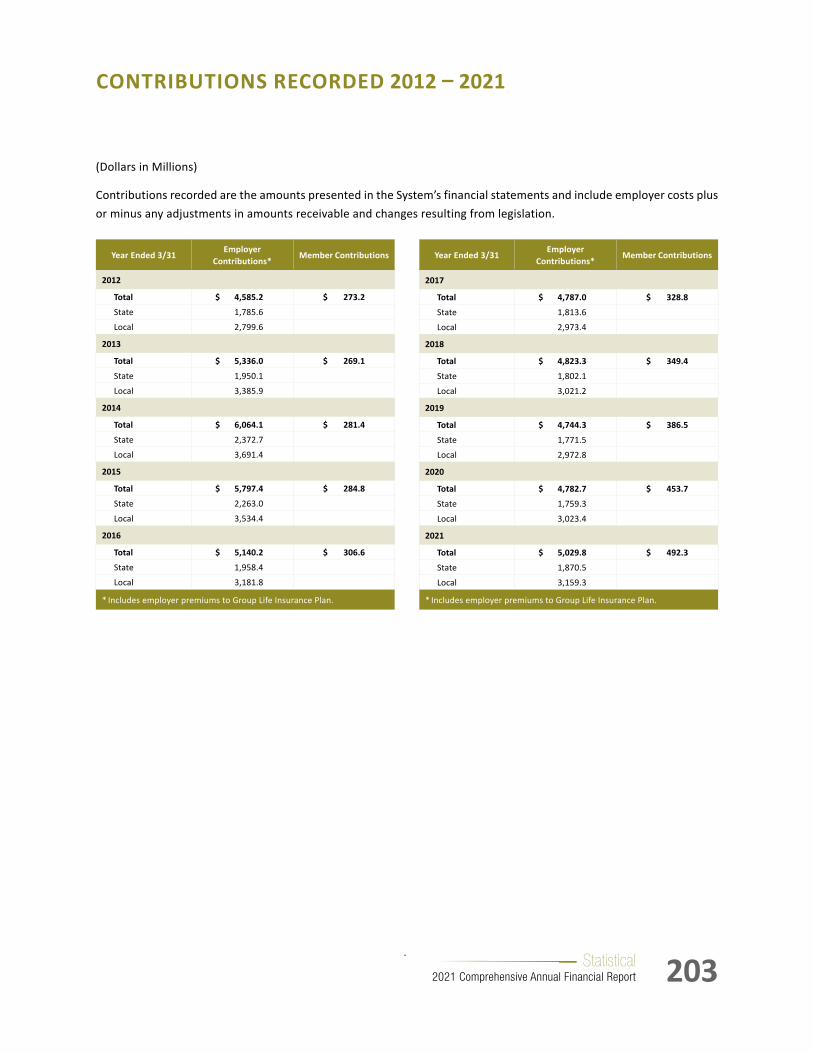
203Statistical 2021 Comprehensive Annual Financial Report
CONTRIBUTIONSRECORDED2012–2021
Year Ended 3/31Employer
Contributions*Member Contributions
2012
Total $ 4,585.2 $ 273.2
State 1,785.6
Local 2,799.6
2013
Total $ 5,336.0 $ 269.1
State 1,950.1
Local 3,385.9
2014
Total $ 6,064.1 $ 281.4
State 2,372.7
Local 3,691.4
2015
Total $ 5,797.4 $ 284.8
State 2,263.0
Local 3,534.4
2016
Total $ 5,140.2 $ 306.6
State 1,958.4
Local 3,181.8
* Includes employer premiums to Group Life Insurance Plan.
(Dollars in Millions)
Contributions recorded are the amounts presented in the System’s financial statements and include employer costs plus or minus any adjustments in amounts receivable and changes resulting from legislation.
Year Ended 3/31Employer
Contributions*Member Contributions
2017
Total $ 4,787.0 $ 328.8
State 1,813.6
Local 2,973.4
2018
Total $ 4,823.3 $ 349.4
State 1,802.1
Local 3,021.2
2019
Total $ 4,744.3 $ 386.5
State 1,771.5
Local 2,972.8
2020
Total $ 4,782.7 $ 453.7
State 1,759.3
Local 3,023.4
2021
Total $ 5,029.8 $ 492.3
State 1,870.5
Local 3,159.3
* Includes employer premiums to Group Life Insurance Plan.

204 Statistical 2021 Comprehensive Annual Financial Report
20-YEARSUMMARY*
2021 2020 2019 2018 2017 2016 2015 2014 2013 2012 2011 2010 2009 2008 2007 2006 2005 2004 2003 2002Total Participants 1,172,147 1,160,743 1,139,971 1,122,626 1,104,779 1,088,342 1,073,486 1,066,064 1,061,010 1,059,398 1,057,754 1,055,020 1,046,086 1,035,430 1,012,699 995,536 982,009 970,078 964,140 944,500Number of Members 675,519 673,336 658,176 652,030 652,324 647,399 643,178 643,659 647,574 656,224 672,723 679,217 679,908 677,321 662,633 653,291 647,758 641,721 650,543 637,896ERS (a) 640,581 637,746 623,090 616,906 617,143 612,294 608,637 609,565 613,930 622,107 637,921 643,875 643,700 641,119 626,923 617,989 612,410 606,155 614,555 602,428State 206,913 207,643 203,421 201,912 203,317 202,153 201,194 201,192 202,570 203,274 213,089 216,582 219,741 220,216 215,296 211,041 208,899 207,641 216,005 216,507Counties 105,523 105,939 103,965 103,438 104,452 104,756 105,582 106,688 108,302 111,051 114,111 115,722 116,515 117,084 115,944 115,472 118,006 117,514 119,319 118,318
Cities 18,530 18,583 18,251 18,138 18,146 18,048 18,079 18,182 18,176 18,420 18,667 18,897 18,893 18,992 18,843 18,891 18,979 18,933 19,637 19,671
Towns 48,351 47,833 46,611 45,897 45,608 45,450 44,826 44,676 44,407 44,644 44,416 44,361 43,403 43,203 41,989 41,393 40,561 39,841 39,395 38,063Villages 15,543 15,257 14,867 14,615 14,474 14,256 14,129 14,073 14,040 14,051 14,165 14,150 14,000 13,891 13,597 13,388 13,106 12,878 12,823 12,360Miscellaneous 103,731 101,807 99,042 98,035 97,376 95,759 94,341 94,396 95,199 97,225 98,115 97,960 97,272 95,601 92,736 90,879 86,791 85,732 85,708 81,752School Districts 141,990 140,684 136,933 134,871 133,770 131,872 130,486 130,358 131,236 133,442 135,358 136,203 133,876 132,132 128,518 126,925 126,068 123,616 121,668 115,757PFRS (a) 34,938 35,590 35,086 35,124 35,181 35,105 34,541 34,094 33,644 34,117 34,802 35,342 36,208 36,202 35,710 35,302 35,348 35,566 35,988 35,468State 6,493 6,785 6,712 6,606 6,596 6,309 6,009 5,792 5,630 5,548 5,779 5,973 6,222 6,223 6,219 5,955 6,038 5,898 5,802 5,679Counties 5,149 5,306 5,303 5,386 5,323 5,348 5,179 5,003 5,076 5,372 5,499 5,560 5,841 5,898 5,873 5,850 5,833 5,814 5,901 6,029Cities 11,654 11,745 11,659 11,757 11,880 12,018 11,856 11,812 11,868 11,974 12,137 12,289 12,433 12,414 12,206 12,147 12,113 12,374 12,541 12,612Towns 4,108 4,147 4,090 4,061 4,127 4,182 4,196 4,162 4,153 4,178 4,205 4,249 4,340 4,364 4,295 4,261 4,217 4,231 4,233 4,191
Villages 4,181 4,175 4,072 4,160 4,213 4,340 4,343 4,330 4,370 4,433 4,512 4,547 4,592 4,621 4,591 4,641 4,653 4,732 4,867 4,795
Miscellaneous 3,353 3,432 3,250 3,154 3,042 2,908 2,958 2,995 2,547 2,612 2,670 2,724 2,780 2,682 2,526 2,448 2,494 2,517 2,644 2,162Members by Tier (b)ERS Tier 1 1,305 1,552 1,937 2,313 3,241 3,809 4,520 5,249 6,230 7,551 10,718 13,395 16,829 20,513 25,053 29,492 34,980 39,622 50,032 56,541ERS Tier 2 1,364 1,762 2,278 2,817 3,668 4,420 5,375 6,297 7,538 9,222 12,911 15,651 18,097 20,315 22,458 24,263 25,938 27,398 30,122 31,981ERS Tiers 3 through 6 637,912 634,432 618,875 611,776 610,234 604,065 598,742 598,019 600,162 605,334 614,292 614,829 608,774 600,291 579,412 564,234 551,492 539,135 534,401 513,906PFRS Tier 1 19 24 27 40 54 77 92 123 172 230 304 393 576 745 924 1,143 1,503 2,076 2,597 3,260PFRS Tier 2 18,763 20,500 21,938 23,733 25,518 27,364 28,179 29,188 30,295 31,830 33,091 34,261 35,632 35,457 34,786 34,159 33,845 33,490 33,391 32,208PFRS Tiers 3, 5 & 6 16,156 15,066 13,121 11,351 9,609 7,664 6,270 4,783 3,177 2,057 1,407 688 0 0 0 0 0 0 0 0Retirees & Beneficiaries 496,628 487,407 481,795 470,596 452,455 440,943 430,308 422,405 413,436 403,174 385,031 375,803 366,178 358,109 350,066 342,245 334,251 328,357 313,597 306,604ERS 458,261 449,806 444,719 434,553 417,499 407,112 396,781 389,288 380,899 371,468 353,940 345,106 336,273 328,726 321,113 313,837 306,531 301,528 287,341 280,997PFRS 38,367 37,601 37,076 36,043 34,956 33,831 33,527 33,117 32,537 31,706 31,091 30,697 29,905 29,383 28,953 28,408 27,720 26,829 26,256 25,607Employers 3,623 3,616 3,692 3,044 3,040 3,040 3,032 3,027 3,029 3,040 3,039 3,035 3,026 3,021 3,010 3,001 2,993 2,985 2,968 2,922ERS 3,052 2,959 3,015 3,017 3,013 3,010 3,006 3,002 3,004 3,016 3,016 3,011 3,001 2,995 2,983 2,974 2,967 2,959 2,943 2,917PFRS 571 657 677 684 687 686 682 681 681 682 681 681 683 683 683 685 684 684 681 679Benefit Payments (c) $ 14,022.7 $ 13,246.1 $ 12,741.6 $ 12,027.3 $ 11,448.7 $ 10,908.5 $ 10,436.2 $ 9,898.8 $ 9,450.2 $ 8,862.8 $ 8,464.6 $ 7,663.1 $ 7,212.1 $ 6,835.6 $ 6,383.4 $ 6,028.9 $ 5,674.7 $ 5,347.5 $ 4,984.6 $ 4,488.3Retirement Allowances 13,096.1 12,424.6 11,880.3 11,197.8 10,617.5 10,113.8 9,651.2 9,098.4 8,669.8 8,109.3 7,717.0 6,931.8 6,497.1 6,142.8 5,722.9 5,388.6 5,041.0 4,722.1 4,373.3 3,872.0Death Benefits (Lump Sum) 258.0 159.5 214.7 201.2 216.2 188.2 183.1 203.8 194.2 185.0 192.3 183.0 180.5 181.7 164.6 161.2 161.9 157.3 148.4 151.8COLA Payments 668.6 662.0 646.6 628.3 615.0 606.5 601.9 596.6 586.2 568.5 555.3 548.3 534.5 511.1 495.9 479.1 471.8 468.1 462.9 464.5# of Service Retirements 25,212 23,159 22,928 28,312 22,762 21,984 18,039 19,702 19,962 28,259 19,092 19,193 17,979 17,261 16,390 16,827 14,533 23,655 16,078 17,499# of Death Benefits Paid 1,108 897 793 857 915 751 900 810 844 879 984 955 935 1,014 832 932 1,041 1,025 1,019 1,068# of Disability Retirements 297 477 883 922 718 626 720 963 1,026 1,161 844 1,421 1,020 950 1,227 1,267 1,463 1,103 1,064 1,038Employer Contributions $ 5,029.8 $ 4,782.7 $ 4,744.3 $ 4,823.3 $ 4,787.0 $ 5,140.2 $ 5,797.4 $ 6,064.1 $ 5,336.1 $ 4,585.2 $ 4,164.5 $ 2,344.2 $ 2,456.2 $ 2,648.4 $ 2,718.6 $ 2,782.2 $ 2,964.8 $ 1,286.5 $ 651.9 $ 263.8ERS 3,932.9 3,818.3 3,766.8 3,852.5 3,858.6 4,232.4 4,802.2 5,045.6 4,435.6 3,790.6 3,525.8 1,785.5 1,898.7 2,073.5 2,116.0 2,271.4 2,434.5 1,052.3 525.5 179.1PFRS 967.5 862.3 854.1 869.8 837.3 792.6 901.0 926.3 808.5 706.4 538.8 465.0 492.8 510.6 502.5 433.4 455.3 158.4 66.3 47.3Group Life Insurance Plan 129.4 102.1 123.4 101.0 91.1 115.2 94.2 92.2 92.0 88.2 99.9 93.7 64.7 64.3 100.1 77.3 75.0 75.8 60.1 37.4Rate (as a % of Salary) (d)ERS 14.6% 14.6% 14.9% 15.3% 15.5% 18.2% 20.1% 20.9% 18.9% 16.3% 11.9% 7.4% 8.5% 9.6% 10.7% 11.3% 12.9% 5.9% 1.5% 1.2%PFRS 24.4% 23.5% 23.5% 24.4% 24.3% 24.7% 27.6% 28.9% 25.8% 21.6% 18.2% 15.1% 15.8% 16.6% 17.0% 16.3% 17.6% 5.8% 1.4% 1.6%Employee Contributions $ 492.3 $ 453.7 $ 386.5 $ 349.4 $ 328.8 $ 306.6 $ 284.8 $ 281.4 $ 269.1 $ 273.2 $ 286.2 $ 284.3 $ 273.3 $ 265.7 $ 250.2 $ 241.2 $ 227.3 $ 221.9 $ 219.2 $ 210.2ERS 427.0 395.3 345.8 318.4 306.2 289.3 272.0 273.5 264.8 268.5 284.5 282.8 269.0 263.1 247.2 237.7 224.5 217.4 214.1 206.0PFRS 65.3 58.4 40.7 31.0 22.6 17.3 12.8 7.9 4.3 4.7 1.7 1.5 4.3 2.6 2.9 3.5 2.8 4.5 5.1 4.2Investments (e) $ 258,135.8 $ 194,317.2 $ 210,523.7 $ 207,416.0 $ 192,410.6 $ 178,639.7 $ 184,502.0 $ 176,835.1 $ 160,660.8 $ 150,658.9 $ 147,237.0 $ 132,500.2 $ 108,960.7 $ 153,877.7 $ 154,575.5 $ 140,453.3 $ 126,083.5 $ 119,245.0 $ 95,598.3 $ 111,168.5Equities 133,744.2 93,221.9 109,560.6 114,797.1 103,688.4 90,755.4 94,293.5 93,191.7 83,049.5 79,059.2 79,945.0 72,674.0 47,871.0 83,153.7 90,119.7 88,550.9 80,917.2 74,876.5 51,357.0 66,375.5Global Fixed Income 47,722.9 45,410.3 45,651.6 44,820.8 44,002.6 44,661.2 47,652.2 41,410.6 38,559.5 33,440.5 31,037.9 33,726.1 36,541.6 36,571.4 33,536.2 28,889.0 29,310.8 29,691.2 32,019.7 31,839.2Commercial Mortgages 1,043.6 1,011.8 897.0 843.4 800.3 796.4 852.9 853.9 812.7 803.0 851.3 845.7 710.2 772.4 889.7 1,162.7 1,281.9 1,530.0 1,723.6 1,628.7Short-Term Investments 11,082.7 5,697.7 6,119.0 3,366.6 5,653.3 5,578.8 5,252.5 6,592.8 6,461.3 7,397.7 8,360.2 3,086.1 3,826.7 6,443.1 8,551.1 6,619.3 2,602.5 1,879.1 771.2 1,429.0Private Equity 29,470.2 20,314.2 19,751.0 17,500.5 15,348.5 13,961.4 14,247.4 14,369.8 14,072.6 14,925.9 14,620.4 12,584.0 10,563.7 12,699.4 10,044.8 8,284.8 6,832.4 6,738.8 5,564.8 5,579.5Equity Real Estate 17,648.0 15,693.7 15,678.5 14,182.7 12,937.4 12,639.7 12,123.4 12,529.3 11,195.4 9,339.5 7,631.0 5,551.1 7,066.5 8,909.4 6,752.7 5,430.7 4,634.0 4,529.4 4,162.0 4,316.6Opportunistic/ Absolute Return Strategy 5,016.1 9,881.9 10,646.0 10,386.3 9,589.5 9,748.7 9,681.0 7,887.0 6,509.8 5,693.1 4,791.2 4,033.2 2,381.0 5,328.3 4,681.3 1,516.0 504.7 0.0 0.0 0.0
Credit 8,478.5 0.0 0.0 0.0 0.0 0.0 0.0 0.0 0.0 0.0 0.0 0.0 0.0 0.0 0.0 0.0 0.0 0.0 0.0 0.0Other 3,929.6 3,085.7 2,220.0 1,518.6 390.6 498.1 399.1 0.0 0.0 0.0 0.0 0.0 0.0 0.0 0.0 0.0 0.0 0.0 0.0 0.0Rate of Return (f) 33.6% (2.7)% 5.2% 11.4% 11.5% 0.2% 7.2% 13.0% 10.4% 6.0% 14.6% 25.9% (26.4)% 2.6% 12.6% 14.6% 8.5% 28.8% (10.2)% 2.8%Core Fixed Income 2.6% 7.4% 4.8% 2.1% 2.5% 1.8% 5.5% (0.5)% 4.7% 9.0% 8.0% 7.4% 2.4% 8.6% 6.0% 1.7% 3.0% 8.9% 16.8% 4.3%Equity Investments 44.2% (5.4)% 5.6% 14.5% 14.8% (0.4)% 8.3% 19.1% 12.5% 4.9% 17.1% 41.3% (30.8)% 0.9% 15.0% 19.1% 10.6% 42.8% (24.3)% 2.9%Administrative Cost $ 165.1 $ 139.1 $ 136.5 $ 122.8 $ 107.1 $ 106.6 $ 107.2 $ 105.7 $ 105.7 $ 100.6 $ 101.3 $ 100.0 $ 99.2 $ 90.3 $ 79.8 $ 78.5 $ 65.3 $ 69.6 $ 67.5 $ 66.6Financial Statement Assets $ 260,081.1 $ 198,079.8 $ 215,169.2 $ 212,076.8 $ 197,602.2 $ 183,640.2 $ 189,412.4 $ 181,275.3 $ 164,221.8 $ 153,394.4 $ 149,548.6 $ 134,251.7 $ 110,937.8 $ 155,845.9 $ 156,625.2 $ 142,620.1 $ 128,037.7 $ 120,799.0 $ 97,372.7 $ 112,724.9

205Statistical 2021 Comprehensive Annual Financial Report
20-YEARSUMMARY* CONTINUED
2021 2020 2019 2018 2017 2016 2015 2014 2013 2012 2011 2010 2009 2008 2007 2006 2005 2004 2003 2002Total Participants 1,172,147 1,160,743 1,139,971 1,122,626 1,104,779 1,088,342 1,073,486 1,066,064 1,061,010 1,059,398 1,057,754 1,055,020 1,046,086 1,035,430 1,012,699 995,536 982,009 970,078 964,140 944,500Number of Members 675,519 673,336 658,176 652,030 652,324 647,399 643,178 643,659 647,574 656,224 672,723 679,217 679,908 677,321 662,633 653,291 647,758 641,721 650,543 637,896ERS (a) 640,581 637,746 623,090 616,906 617,143 612,294 608,637 609,565 613,930 622,107 637,921 643,875 643,700 641,119 626,923 617,989 612,410 606,155 614,555 602,428State 206,913 207,643 203,421 201,912 203,317 202,153 201,194 201,192 202,570 203,274 213,089 216,582 219,741 220,216 215,296 211,041 208,899 207,641 216,005 216,507Counties 105,523 105,939 103,965 103,438 104,452 104,756 105,582 106,688 108,302 111,051 114,111 115,722 116,515 117,084 115,944 115,472 118,006 117,514 119,319 118,318
Cities 18,530 18,583 18,251 18,138 18,146 18,048 18,079 18,182 18,176 18,420 18,667 18,897 18,893 18,992 18,843 18,891 18,979 18,933 19,637 19,671
Towns 48,351 47,833 46,611 45,897 45,608 45,450 44,826 44,676 44,407 44,644 44,416 44,361 43,403 43,203 41,989 41,393 40,561 39,841 39,395 38,063Villages 15,543 15,257 14,867 14,615 14,474 14,256 14,129 14,073 14,040 14,051 14,165 14,150 14,000 13,891 13,597 13,388 13,106 12,878 12,823 12,360Miscellaneous 103,731 101,807 99,042 98,035 97,376 95,759 94,341 94,396 95,199 97,225 98,115 97,960 97,272 95,601 92,736 90,879 86,791 85,732 85,708 81,752School Districts 141,990 140,684 136,933 134,871 133,770 131,872 130,486 130,358 131,236 133,442 135,358 136,203 133,876 132,132 128,518 126,925 126,068 123,616 121,668 115,757PFRS (a) 34,938 35,590 35,086 35,124 35,181 35,105 34,541 34,094 33,644 34,117 34,802 35,342 36,208 36,202 35,710 35,302 35,348 35,566 35,988 35,468State 6,493 6,785 6,712 6,606 6,596 6,309 6,009 5,792 5,630 5,548 5,779 5,973 6,222 6,223 6,219 5,955 6,038 5,898 5,802 5,679Counties 5,149 5,306 5,303 5,386 5,323 5,348 5,179 5,003 5,076 5,372 5,499 5,560 5,841 5,898 5,873 5,850 5,833 5,814 5,901 6,029Cities 11,654 11,745 11,659 11,757 11,880 12,018 11,856 11,812 11,868 11,974 12,137 12,289 12,433 12,414 12,206 12,147 12,113 12,374 12,541 12,612Towns 4,108 4,147 4,090 4,061 4,127 4,182 4,196 4,162 4,153 4,178 4,205 4,249 4,340 4,364 4,295 4,261 4,217 4,231 4,233 4,191
Villages 4,181 4,175 4,072 4,160 4,213 4,340 4,343 4,330 4,370 4,433 4,512 4,547 4,592 4,621 4,591 4,641 4,653 4,732 4,867 4,795
Miscellaneous 3,353 3,432 3,250 3,154 3,042 2,908 2,958 2,995 2,547 2,612 2,670 2,724 2,780 2,682 2,526 2,448 2,494 2,517 2,644 2,162Members by Tier (b)ERS Tier 1 1,305 1,552 1,937 2,313 3,241 3,809 4,520 5,249 6,230 7,551 10,718 13,395 16,829 20,513 25,053 29,492 34,980 39,622 50,032 56,541ERS Tier 2 1,364 1,762 2,278 2,817 3,668 4,420 5,375 6,297 7,538 9,222 12,911 15,651 18,097 20,315 22,458 24,263 25,938 27,398 30,122 31,981ERS Tiers 3 through 6 637,912 634,432 618,875 611,776 610,234 604,065 598,742 598,019 600,162 605,334 614,292 614,829 608,774 600,291 579,412 564,234 551,492 539,135 534,401 513,906PFRS Tier 1 19 24 27 40 54 77 92 123 172 230 304 393 576 745 924 1,143 1,503 2,076 2,597 3,260PFRS Tier 2 18,763 20,500 21,938 23,733 25,518 27,364 28,179 29,188 30,295 31,830 33,091 34,261 35,632 35,457 34,786 34,159 33,845 33,490 33,391 32,208PFRS Tiers 3, 5 & 6 16,156 15,066 13,121 11,351 9,609 7,664 6,270 4,783 3,177 2,057 1,407 688 0 0 0 0 0 0 0 0Retirees & Beneficiaries 496,628 487,407 481,795 470,596 452,455 440,943 430,308 422,405 413,436 403,174 385,031 375,803 366,178 358,109 350,066 342,245 334,251 328,357 313,597 306,604ERS 458,261 449,806 444,719 434,553 417,499 407,112 396,781 389,288 380,899 371,468 353,940 345,106 336,273 328,726 321,113 313,837 306,531 301,528 287,341 280,997PFRS 38,367 37,601 37,076 36,043 34,956 33,831 33,527 33,117 32,537 31,706 31,091 30,697 29,905 29,383 28,953 28,408 27,720 26,829 26,256 25,607Employers 3,623 3,616 3,692 3,044 3,040 3,040 3,032 3,027 3,029 3,040 3,039 3,035 3,026 3,021 3,010 3,001 2,993 2,985 2,968 2,922ERS 3,052 2,959 3,015 3,017 3,013 3,010 3,006 3,002 3,004 3,016 3,016 3,011 3,001 2,995 2,983 2,974 2,967 2,959 2,943 2,917PFRS 571 657 677 684 687 686 682 681 681 682 681 681 683 683 683 685 684 684 681 679Benefit Payments (c) $ 14,022.7 $ 13,246.1 $ 12,741.6 $ 12,027.3 $ 11,448.7 $ 10,908.5 $ 10,436.2 $ 9,898.8 $ 9,450.2 $ 8,862.8 $ 8,464.6 $ 7,663.1 $ 7,212.1 $ 6,835.6 $ 6,383.4 $ 6,028.9 $ 5,674.7 $ 5,347.5 $ 4,984.6 $ 4,488.3Retirement Allowances 13,096.1 12,424.6 11,880.3 11,197.8 10,617.5 10,113.8 9,651.2 9,098.4 8,669.8 8,109.3 7,717.0 6,931.8 6,497.1 6,142.8 5,722.9 5,388.6 5,041.0 4,722.1 4,373.3 3,872.0Death Benefits (Lump Sum) 258.0 159.5 214.7 201.2 216.2 188.2 183.1 203.8 194.2 185.0 192.3 183.0 180.5 181.7 164.6 161.2 161.9 157.3 148.4 151.8COLA Payments 668.6 662.0 646.6 628.3 615.0 606.5 601.9 596.6 586.2 568.5 555.3 548.3 534.5 511.1 495.9 479.1 471.8 468.1 462.9 464.5# of Service Retirements 25,212 23,159 22,928 28,312 22,762 21,984 18,039 19,702 19,962 28,259 19,092 19,193 17,979 17,261 16,390 16,827 14,533 23,655 16,078 17,499# of Death Benefits Paid 1,108 897 793 857 915 751 900 810 844 879 984 955 935 1,014 832 932 1,041 1,025 1,019 1,068# of Disability Retirements 297 477 883 922 718 626 720 963 1,026 1,161 844 1,421 1,020 950 1,227 1,267 1,463 1,103 1,064 1,038Employer Contributions $ 5,029.8 $ 4,782.7 $ 4,744.3 $ 4,823.3 $ 4,787.0 $ 5,140.2 $ 5,797.4 $ 6,064.1 $ 5,336.1 $ 4,585.2 $ 4,164.5 $ 2,344.2 $ 2,456.2 $ 2,648.4 $ 2,718.6 $ 2,782.2 $ 2,964.8 $ 1,286.5 $ 651.9 $ 263.8ERS 3,932.9 3,818.3 3,766.8 3,852.5 3,858.6 4,232.4 4,802.2 5,045.6 4,435.6 3,790.6 3,525.8 1,785.5 1,898.7 2,073.5 2,116.0 2,271.4 2,434.5 1,052.3 525.5 179.1PFRS 967.5 862.3 854.1 869.8 837.3 792.6 901.0 926.3 808.5 706.4 538.8 465.0 492.8 510.6 502.5 433.4 455.3 158.4 66.3 47.3Group Life Insurance Plan 129.4 102.1 123.4 101.0 91.1 115.2 94.2 92.2 92.0 88.2 99.9 93.7 64.7 64.3 100.1 77.3 75.0 75.8 60.1 37.4Rate (as a % of Salary) (d)ERS 14.6% 14.6% 14.9% 15.3% 15.5% 18.2% 20.1% 20.9% 18.9% 16.3% 11.9% 7.4% 8.5% 9.6% 10.7% 11.3% 12.9% 5.9% 1.5% 1.2%PFRS 24.4% 23.5% 23.5% 24.4% 24.3% 24.7% 27.6% 28.9% 25.8% 21.6% 18.2% 15.1% 15.8% 16.6% 17.0% 16.3% 17.6% 5.8% 1.4% 1.6%Employee Contributions $ 492.3 $ 453.7 $ 386.5 $ 349.4 $ 328.8 $ 306.6 $ 284.8 $ 281.4 $ 269.1 $ 273.2 $ 286.2 $ 284.3 $ 273.3 $ 265.7 $ 250.2 $ 241.2 $ 227.3 $ 221.9 $ 219.2 $ 210.2ERS 427.0 395.3 345.8 318.4 306.2 289.3 272.0 273.5 264.8 268.5 284.5 282.8 269.0 263.1 247.2 237.7 224.5 217.4 214.1 206.0PFRS 65.3 58.4 40.7 31.0 22.6 17.3 12.8 7.9 4.3 4.7 1.7 1.5 4.3 2.6 2.9 3.5 2.8 4.5 5.1 4.2Investments (e) $ 258,135.8 $ 194,317.2 $ 210,523.7 $ 207,416.0 $ 192,410.6 $ 178,639.7 $ 184,502.0 $ 176,835.1 $ 160,660.8 $ 150,658.9 $ 147,237.0 $ 132,500.2 $ 108,960.7 $ 153,877.7 $ 154,575.5 $ 140,453.3 $ 126,083.5 $ 119,245.0 $ 95,598.3 $ 111,168.5Equities 133,744.2 93,221.9 109,560.6 114,797.1 103,688.4 90,755.4 94,293.5 93,191.7 83,049.5 79,059.2 79,945.0 72,674.0 47,871.0 83,153.7 90,119.7 88,550.9 80,917.2 74,876.5 51,357.0 66,375.5Global Fixed Income 47,722.9 45,410.3 45,651.6 44,820.8 44,002.6 44,661.2 47,652.2 41,410.6 38,559.5 33,440.5 31,037.9 33,726.1 36,541.6 36,571.4 33,536.2 28,889.0 29,310.8 29,691.2 32,019.7 31,839.2Commercial Mortgages 1,043.6 1,011.8 897.0 843.4 800.3 796.4 852.9 853.9 812.7 803.0 851.3 845.7 710.2 772.4 889.7 1,162.7 1,281.9 1,530.0 1,723.6 1,628.7Short-Term Investments 11,082.7 5,697.7 6,119.0 3,366.6 5,653.3 5,578.8 5,252.5 6,592.8 6,461.3 7,397.7 8,360.2 3,086.1 3,826.7 6,443.1 8,551.1 6,619.3 2,602.5 1,879.1 771.2 1,429.0Private Equity 29,470.2 20,314.2 19,751.0 17,500.5 15,348.5 13,961.4 14,247.4 14,369.8 14,072.6 14,925.9 14,620.4 12,584.0 10,563.7 12,699.4 10,044.8 8,284.8 6,832.4 6,738.8 5,564.8 5,579.5Equity Real Estate 17,648.0 15,693.7 15,678.5 14,182.7 12,937.4 12,639.7 12,123.4 12,529.3 11,195.4 9,339.5 7,631.0 5,551.1 7,066.5 8,909.4 6,752.7 5,430.7 4,634.0 4,529.4 4,162.0 4,316.6Opportunistic/ Absolute Return Strategy 5,016.1 9,881.9 10,646.0 10,386.3 9,589.5 9,748.7 9,681.0 7,887.0 6,509.8 5,693.1 4,791.2 4,033.2 2,381.0 5,328.3 4,681.3 1,516.0 504.7 0.0 0.0 0.0
Credit 8,478.5 0.0 0.0 0.0 0.0 0.0 0.0 0.0 0.0 0.0 0.0 0.0 0.0 0.0 0.0 0.0 0.0 0.0 0.0 0.0Other 3,929.6 3,085.7 2,220.0 1,518.6 390.6 498.1 399.1 0.0 0.0 0.0 0.0 0.0 0.0 0.0 0.0 0.0 0.0 0.0 0.0 0.0Rate of Return (f) 33.6% (2.7)% 5.2% 11.4% 11.5% 0.2% 7.2% 13.0% 10.4% 6.0% 14.6% 25.9% (26.4)% 2.6% 12.6% 14.6% 8.5% 28.8% (10.2)% 2.8%Core Fixed Income 2.6% 7.4% 4.8% 2.1% 2.5% 1.8% 5.5% (0.5)% 4.7% 9.0% 8.0% 7.4% 2.4% 8.6% 6.0% 1.7% 3.0% 8.9% 16.8% 4.3%Equity Investments 44.2% (5.4)% 5.6% 14.5% 14.8% (0.4)% 8.3% 19.1% 12.5% 4.9% 17.1% 41.3% (30.8)% 0.9% 15.0% 19.1% 10.6% 42.8% (24.3)% 2.9%Administrative Cost $ 165.1 $ 139.1 $ 136.5 $ 122.8 $ 107.1 $ 106.6 $ 107.2 $ 105.7 $ 105.7 $ 100.6 $ 101.3 $ 100.0 $ 99.2 $ 90.3 $ 79.8 $ 78.5 $ 65.3 $ 69.6 $ 67.5 $ 66.6Financial Statement Assets $ 260,081.1 $ 198,079.8 $ 215,169.2 $ 212,076.8 $ 197,602.2 $ 183,640.2 $ 189,412.4 $ 181,275.3 $ 164,221.8 $ 153,394.4 $ 149,548.6 $ 134,251.7 $ 110,937.8 $ 155,845.9 $ 156,625.2 $ 142,620.1 $ 128,037.7 $ 120,799.0 $ 97,372.7 $ 112,724.9

206 Statistical 2021 Comprehensive Annual Financial Report
NOTESTO20-YEARSUMMARY
* Combined Systems unless noted; dollars in millions; data as of March 31 fiscal year end.
(a) Includes active members and inactive members identified with their last employer.
(b) Tiers 3 through 6 membership statistics are combined. Tier 6 was enacted on April 1, 2012.
(c) Total does not include Employee Contributions Refunded or Other Benefits found in the Financial Statements.
(d) Beginning in the 2006 fiscal year, all rates assume a February 1 payment date prior to the close of the fiscal year. Previous years assume rates based on a December 15 payment date. Contributions include normal, administrative, retirement incentive and deficiency costs.
(e) Investments for 1995 and later years are shown at (and rate of return is calculated on) fair value as required by GASB 25, which the System adopted that year.
(f) Generally, the Rate of Return is calculated on a time-weighted, gross-of-fees, basis.

Office of the New York State ComptrollerThomas P. DiNapoli
NYSLRSNYSLRS