Embed Size (px)
Citation preview

2 0 2 1 C E R V I C A L C A N C E R E L I M I N A T I O N P R O G R E S S R E P O R T :Australia’s progress towards the elimination of cervical cancer as a public health problem
Prepared by the NHMRC Centre of Research Excellence in Cervical Cancer Control
This is a multi-institutional agreement in partnership with:
This report was prepared by members of the NHMRC Centre of Research Excellence in Cervical Cancer Control: Julia Brotherton, Dorothy Machalek, Megan Smith, Susan Yuill, Maddison Sherrah, Lisa Whop, Sue Evans, Deborah Bateson, Helen Marshall, Suzanne Garland, David Hawkes, David Wrede, Rebecca Guy, Claire Nightingale, John Kaldor, Marion Saville and Karen Canfell
Suggested citation: NHMRC Centre of Research Excellence in Cervical Cancer Control. 2021 Cervical Cancer Elimination Progress Report: Australia’s progress towards the elimination of cervical cancer as a public health problem. Published online 26/3/2021, Melbourne, Australia, at https://www.cervicalcancercontrol.org.au
Contact detailshttps://www.cervicalcancercontrol.org.auFor any enquiries about this report or the work of the CRE, please email Ms Tracey McDermott, Research and Administrative Support, NHMRC C4 Centre of Research Excellence in Cervical Cancer Control at [email protected]
AcknowledgementsWe would like to acknowledge the support of the Department of Health and the enthusiasm and encouragement of key stakeholders in cervical cancer prevention and control throughout Australia in supporting the need for and development of this report. We particularly acknowledge the work of the Cancer Screening Section of the Australian Institute of Health and Welfare, in particular Alison Budd and Fan Xiang, and the work of the National Centre for Immunisation Research and Surveillance, particularly Alexandra Hendry, Frank Beard, Aditi Dey and Brynley Hull, in preparing data for this report. We are fortunate to work in a community with such skilled and generous colleagues to support timely sharing of information to support public health. We also thank Luke Cuell for developing the timeline graphic and Tracey McDermott for her assistance with the preparation of this report.We hope these reports will help harness the political will, community support and our available resources to ensure elimination is achieved and that equity in outcomes for all remains front of mind. We look forward to a time in the near future when the report documents Australia’s achievement of the elimination of cervical cancer as a public health problem.
C4 acknowledges the people and the Elders of the Aboriginal and Torres Strait Islander Nations who are the Traditional Owners of the lands and seas of Australia
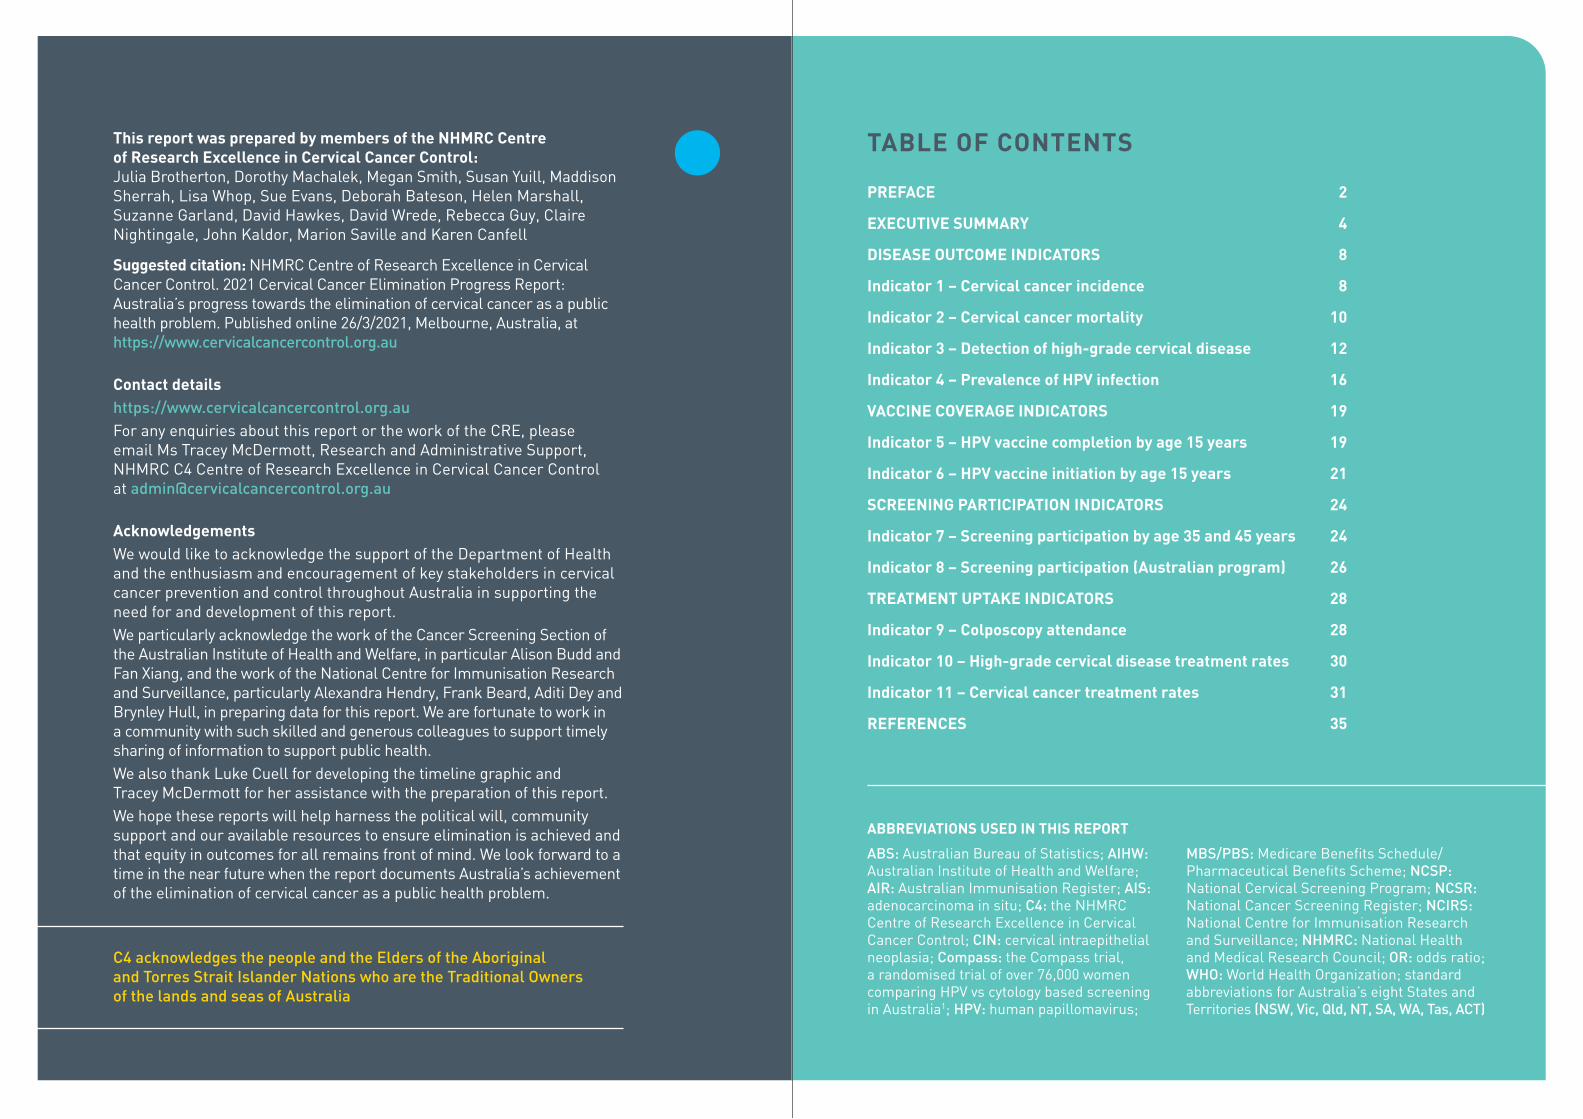
TABLE OF CONTENTS
PREFACE 2
EXECUTIVE SUMMARY 4
DISEASE OUTCOME INDICATORS 8
Indicator 1 – Cervical cancer incidence 8
Indicator 2 – Cervical cancer mortality 10
Indicator 3 – Detection of high-grade cervical disease 12
Indicator 4 – Prevalence of HPV infection 16
VACCINE COVERAGE INDICATORS 19
Indicator 5 – HPV vaccine completion by age 15 years 19
Indicator 6 – HPV vaccine initiation by age 15 years 21
SCREENING PARTICIPATION INDICATORS 24
Indicator 7 – Screening participation by age 35 and 45 years 24
Indicator 8 – Screening participation (Australian program) 26
TREATMENT UPTAKE INDICATORS 28
Indicator 9 – Colposcopy attendance 28
Indicator 10 – High-grade cervical disease treatment rates 30
Indicator 11 – Cervical cancer treatment rates 31
REFERENCES 35
ABBREVIATIONS USED IN THIS REPORT
ABS: Australian Bureau of Statistics; AIHW: Australian Institute of Health and Welfare; AIR: Australian Immunisation Register; AIS: adenocarcinoma in situ; C4: the NHMRC Centre of Research Excellence in Cervical Cancer Control; CIN: cervical intraepithelial neoplasia; Compass: the Compass trial, a randomised trial of over 76,000 women comparing HPV vs cytology based screening in Australia1; HPV: human papillomavirus;
MBS/PBS: Medicare Benefits Schedule/Pharmaceutical Benefits Scheme; NCSP: National Cervical Screening Program; NCSR: National Cancer Screening Register; NCIRS: National Centre for Immunisation Research and Surveillance; NHMRC: National Health and Medical Research Council; OR: odds ratio; WHO: World Health Organization; standard abbreviations for Australia’s eight States and Territories (NSW, Vic, Qld, NT, SA, WA, Tas, ACT)
2021 CERVICAL CANCER ELIMINATION PROGRESS REPORT – C42021 CERVICAL CANCER ELIMINATION PROGRESS REPORT – C4PAGE 2 PAGE 3
PREFACE
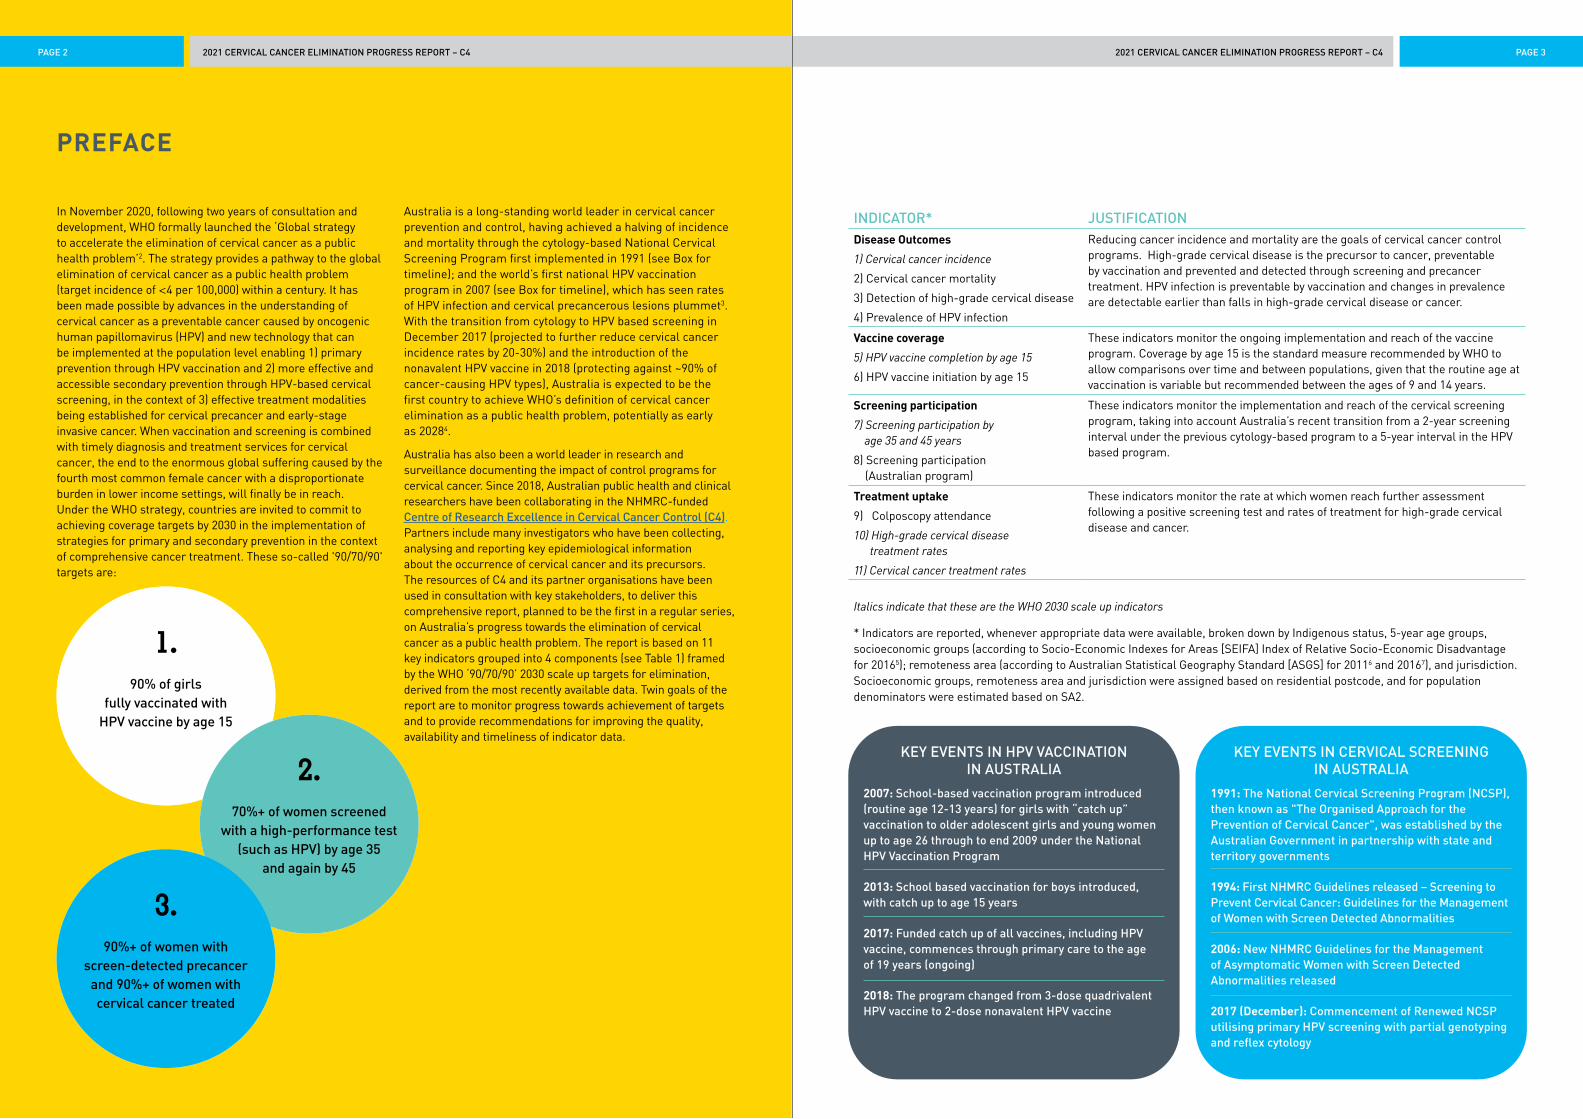
In November 2020, following two years of consultation and development, WHO formally launched the ‘Global strategy to accelerate the elimination of cervical cancer as a public health problem’2. The strategy provides a pathway to the global elimination of cervical cancer as a public health problem (target incidence of <4 per 100,000) within a century. It has been made possible by advances in the understanding of cervical cancer as a preventable cancer caused by oncogenic human papillomavirus (HPV) and new technology that can be implemented at the population level enabling 1) primary prevention through HPV vaccination and 2) more effective and accessible secondary prevention through HPV-based cervical screening, in the context of 3) effective treatment modalities being established for cervical precancer and early-stage invasive cancer. When vaccination and screening is combined with timely diagnosis and treatment services for cervical cancer, the end to the enormous global suffering caused by the fourth most common female cancer with a disproportionate burden in lower income settings, will finally be in reach. Under the WHO strategy, countries are invited to commit to achieving coverage targets by 2030 in the implementation of strategies for primary and secondary prevention in the context of comprehensive cancer treatment. These so-called '90/70/90' targets are:
Australia is a long-standing world leader in cervical cancer prevention and control, having achieved a halving of incidence and mortality through the cytology-based National Cervical Screening Program first implemented in 1991 (see Box for timeline); and the world’s first national HPV vaccination program in 2007 (see Box for timeline), which has seen rates of HPV infection and cervical precancerous lesions plummet3. With the transition from cytology to HPV based screening in December 2017 (projected to further reduce cervical cancer incidence rates by 20-30%) and the introduction of the nonavalent HPV vaccine in 2018 (protecting against ~90% of cancer-causing HPV types), Australia is expected to be the first country to achieve WHO’s definition of cervical cancer elimination as a public health problem, potentially as early as 20284.
Australia has also been a world leader in research and surveillance documenting the impact of control programs for cervical cancer. Since 2018, Australian public health and clinical researchers have been collaborating in the NHMRC-funded Centre of Research Excellence in Cervical Cancer Control (C4). Partners include many investigators who have been collecting, analysing and reporting key epidemiological information about the occurrence of cervical cancer and its precursors. The resources of C4 and its partner organisations have been used in consultation with key stakeholders, to deliver this comprehensive report, planned to be the first in a regular series, on Australia’s progress towards the elimination of cervical cancer as a public health problem. The report is based on 11 key indicators grouped into 4 components (see Table 1) framed by the WHO ‘90/70/90’ 2030 scale up targets for elimination, derived from the most recently available data. Twin goals of the report are to monitor progress towards achievement of targets and to provide recommendations for improving the quality, availability and timeliness of indicator data.
INDICATOR* JUSTIFICATIONDisease Outcomes
1) Cervical cancer incidence
2) Cervical cancer mortality
3) Detection of high-grade cervical disease
4) Prevalence of HPV infection
Reducing cancer incidence and mortality are the goals of cervical cancer control programs. High-grade cervical disease is the precursor to cancer, preventable by vaccination and prevented and detected through screening and precancer treatment. HPV infection is preventable by vaccination and changes in prevalence are detectable earlier than falls in high-grade cervical disease or cancer.
Vaccine coverage
5) HPV vaccine completion by age 15
6) HPV vaccine initiation by age 15
These indicators monitor the ongoing implementation and reach of the vaccine program. Coverage by age 15 is the standard measure recommended by WHO to allow comparisons over time and between populations, given that the routine age at vaccination is variable but recommended between the ages of 9 and 14 years.
Screening participation
7) Screening participation by age 35 and 45 years
8) Screening participation (Australian program)
These indicators monitor the implementation and reach of the cervical screening program, taking into account Australia’s recent transition from a 2-year screening interval under the previous cytology-based program to a 5-year interval in the HPV based program.
Treatment uptake
9) Colposcopy attendance
10) High-grade cervical disease treatment rates
11) Cervical cancer treatment rates
These indicators monitor the rate at which women reach further assessment following a positive screening test and rates of treatment for high-grade cervical disease and cancer.
Italics indicate that these are the WHO 2030 scale up indicators
* Indicators are reported, whenever appropriate data were available, broken down by Indigenous status, 5-year age groups, socioeconomic groups (according to Socio-Economic Indexes for Areas [SEIFA] Index of Relative Socio-Economic Disadvantage for 20165); remoteness area (according to Australian Statistical Geography Standard [ASGS] for 20116 and 20167), and jurisdiction. Socioeconomic groups, remoteness area and jurisdiction were assigned based on residential postcode, and for population denominators were estimated based on SA2.
90% of girls fully vaccinated with
HPV vaccine by age 15
1.
70%+ of women screened with a high-performance test
(such as HPV) by age 35 and again by 45
2.
90%+ of women with screen-detected precancer
and 90%+ of women with cervical cancer treated
3.
KEY EVENTS IN HPV VACCINATION IN AUSTRALIA
2007: School-based vaccination program introduced (routine age 12-13 years) for girls with “catch up” vaccination to older adolescent girls and young women up to age 26 through to end 2009 under the National HPV Vaccination Program
2013: School based vaccination for boys introduced, with catch up to age 15 years
2017: Funded catch up of all vaccines, including HPV vaccine, commences through primary care to the age of 19 years (ongoing)
2018: The program changed from 3-dose quadrivalent HPV vaccine to 2-dose nonavalent HPV vaccine
KEY EVENTS IN CERVICAL SCREENING IN AUSTRALIA
1991: The National Cervical Screening Program (NCSP), then known as "The Organised Approach for the Prevention of Cervical Cancer", was established by the Australian Government in partnership with state and territory governments
1994: First NHMRC Guidelines released – Screening to Prevent Cervical Cancer: Guidelines for the Management of Women with Screen Detected Abnormalities
2006: New NHMRC Guidelines for the Management of Asymptomatic Women with Screen Detected Abnormalities released
2017 (December): Commencement of Renewed NCSP utilising primary HPV screening with partial genotyping and reflex cytology

2021 CERVICAL CANCER ELIMINATION PROGRESS REPORT – C42021 CERVICAL CANCER ELIMINATION PROGRESS REPORT – C4PAGE 4 PAGE 5
EXECUTIVE SUMMARY
In this first data audit of Australia’s progress towards the elimination of cervical cancer as a public health problem, we have brought together the most recent data available across 11 indicators to paint a snapshot of our current status. In doing so we have not only identified how far we have come in cervical cancer prevention and control in Australia but additionally how much work there is still left to do, both in terms of public health action and necessary improvements in the way we gather and synthesise data to inform these actions.
Please note throughout this report we generally use the term ‘women’ to refer to people eligible for or attending cervical screening or experiencing cervical cancer. However, we respectfully acknowledge that some people with a cervix do not identify as women and are equally impacted by the risk of cervical cancer.
THE INDICATORS: WHERE ARE WE NOW?
Disease outcomes
The first four indicators cover disease outcomes including the target for elimination (incidence below 4 per 100,000 women). Indicator 1 Cervical cancer incidence and Indicator 2 Cervical cancer mortality are low by global standards (6.3 per 100,000 in 2011-2015 and 1.4 per 100,000 in 2014-2018) but substantial inequities remain, with the incidence rate in non-Indigenous women just below the threshold defining a rare cancer (at 5.7 per 100,000 in 2011-2015), whereas the incidence rate for Indigenous women was more than twice as high (at 12.1 per 100,000). Mortality rates were over three times higher in Indigenous women. In the final year of the cytology-based screening program (2017), the rate of Indicator 3 Detection of high-grade cervical disease (the precursor of cervical cancer detected through screening) was 7.1 per 1,000 women screened. This rate has been falling due to the downward trend in disease rates in young women following the HPV vaccination program. Indicator 4 Prevalence of HPV infection also documents the success of the HPV vaccination program, with HPV16 or 18 (the most serious cancer-causing types of HPV and prevented by vaccination) detected in only 2.0% of screened women across age groups, socioeconomic groups, remoteness areas and jurisdictions. Other cancer-causing types were detected in 6.5% of screened women.
HPV vaccination
The next two indicators monitor delivery of the HPV vaccine at a benchmark age by which adolescents have had the opportunity to be vaccinated. Indicator 5 HPV vaccine completion by age 15 found that 78.2% of 15 year olds in 2019 had completed the course (79.6% of females and 76.8% of males), with Indigenous adolescents having a lower completion rate of 68.5% (female 71.6%, male 65.4%). In contrast Indicator 6 HPV vaccine initiation by age 15 found equal coverage by Indigenous status (84.0% in Indigenous, 84.6% in non-Indigenous adolescents), with Indigenous females in NSW, the NT and Victoria the only groups with over 90% dose 1 coverage. HPV vaccination appears to be more equitably delivered than cervical screening and is at close to the rate predicted to be required for eventual elimination of vaccine preventable HPV types in a both-sex vaccination program (80%), although below the 90% WHO target for girls.
Screening participation
Two indicators monitor screening participation, with Indicator 7 Screening participation by age 35 and 45 years enabling assessment directly against the WHO scale up target for 2030 of 70% for the globally recommended minimum target of two screens with a high precision test (HPV test or better) in a lifetime. By age 35 in 2019, 54.9% of women had had an HPV test, with the same percentage having had an HPV test by age 45 and a previous cytology screen in the preceding 10 years. Women in the NT and very remote areas had lower participation. Indicator 8 Screening participation, Australian program monitors participation against the national program recommendations, with 52.4% of Australian women up to date with recommended screening by the end of 2019, two years into the renewed screening program, but inequities in participation were apparent by socioeconomic status and area of residence.
Treatment
The final three indicators relate to the third pillar of the elimination strategy which is treatment. Indicator 9 Colposcopy attendance suggested, within the limitations of likely under reporting, that most women do eventually have a colposcopy when indicated on the basis of their screening result (87.8% by 15 months for women referred in 2018) but that some women experienced suboptimal timeliness, with 60.8% of women having a colposcopy within three months, with variation by geography and socioeconomic status. Data for Indicator 10 High-grade cervical disease treatment rates, which will measure directly against the WHO 2030 scale up target of 90%+ of women receiving treatment, could not be reported due to a lack of available data at this time (this indicator requires comprehensive histopathology and treatment data from colposcopy reports). Similarly, limited data was available for Indicator 11 Cervical cancer treatment rates, with no national data available to assess against the WHO 2030 scale up target of 90%+ treatment. Queensland data from 2011-2014 indicated a treatment rate of 94% in metropolitan and regional areas and 92% in rural and remote areas. Two small studies suggested some potential underuse of chemotherapy and radiotherapy historically at one centre and that Indigenous women may be more likely to receive suboptimal treatment.
Data issues
Timeliness is an issue for both cancer incidence data and screening data, with no robust data available for the new program to determine rates of high-grade cervical disease since the move to HPV-based screening. The 4-5 year lag nationally in cancer incidence reporting has meant it is still unclear whether (as predicted by modelling8) HPV vaccination is already impacting cervical cancer rates in young women, whereas Sweden has already documented this impact with a population smaller than Australia’s with timely linked data9. HPV vaccination data reporting was also delayed following the integration of HPV vaccine doses into the Australian Immunisation Register but should now be included in routine coverage reports.
For the cervical screening related indicators, we were unable to report outcomes by Indigenous status. This remains a critical data gap, given the persisting higher incidence and mortality from cervical cancer amongst Indigenous Australians. Despite national indicators designed to ensure quality, safety and effectiveness of the program, only cervical incidence and mortality data have been reported by Indigenous status over the life of the program, derived from State and Territory cancer registries rather than cervical screening program data. Estimates of participation in the program and screening outcomes for Indigenous Australians have relied on data collection at the local level and data linkage studies, which have provided some estimates but an incomplete picture of the national situation. The move to a national registry system and program change to support the renewed program provided a tangible opportunity to correct this long standing data deficiency. Three years into the renewed program, data are still unable to be reported by Indigenous status. However, by the next report a more complete picture should be available, with consultation underway in 2021 to endorse a proposed methodology for reporting Indigenous status as held by the National Cancer Screening Register (NCSR). Such a methodology is likely necessary, given Indigenous status is under-reported to Medicare with variation by age group, gender and jurisdiction and, for last reported Indigenous status, 28% of screening participants recorded ‘not stated’ on the NCSR (Table A1.6,2020 AIHW monitoring report)3. Longstanding systemic barriers to the collection and reporting of Indigenous status need to be overcome, whilst also acknowledging the barriers experienced by many Indigenous Australians to self-disclosure of their Indigenous identity given the history of colonisation and intergenerational trauma.

2021 CERVICAL CANCER ELIMINATION PROGRESS REPORT – C42021 CERVICAL CANCER ELIMINATION PROGRESS REPORT – C4PAGE 6 PAGE 7
Recommendations
That persisting inequities in vaccination course completion and screening participation for Indigenous Australians are addressed by making reducing these inequalities a clear policy priority in the programs, addressing system level barriers to recording Indigenous status and by working with Indigenous Australians to develop and lead culturally appropriate solutions.
That data collection and availability are improved for those indicators for which we were unable to provide current estimates. In particular, the completeness of colposcopy and histopathology data within the cervical screening program should be a major focus and necessary steps taken to maximise the timely collection of accurate data through standardised coding, electronic data capture, strong engagement with service providers and prioritisation of these outcome data. Action to improve the timeliness of national cancer incidence data is also necessary if Australia wishes to know in close to real time when elimination has been achieved.
That a methodology is developed to monitor cervical cancer treatment rates. Likely challenges include the lack of routinely collected staging data, timeliness of cancer registry data, linking treatment related datasets and the complexity of assessing patient care against optimal care benchmarks in order to clarify whether there are existing inequities in access that require addressing. The emerging clinical quality registry for gynaecological cancers may have a role to play in addressing the need to monitor treatment in future.
We are optimistic that Australia can address the challenges identified in this first report and hope that this report can help inform a national strategy to ensure Australia’s progress towards the elimination of cervical cancer as a public health problem is on-track for all women.
EXECUTIVE SUMMARY (cont.) AUSTRALIA’S PROGRESS TOWARDS CERVICAL CANCER ELIMINATION AGAINST WHO TARGETS
INDICATOR WHO TARGET STATUS IN 2020 REPORT
Cervical cancer incidence
Treatment of cervical precancer
by 2030
Treatment of cervical cancer
by 2030
HPV vaccine coverage by 2030
Screening participation
by 2030
Fewer than 4 new cases per 100,000
90% of women with identified precancer
are treated
Management of 90% of women with invasive
cervical cancer
90% of girls fully vaccinated by the age of 15 years*
70% of women screened using a high-performance test# by age 35 years and again by age 45 years
6.3 new cases per 100,000 (2011-2015). Rates were at least twice as high as the elimination
target in Indigenous women, and women living in remote
or very remote areas
No routine data available to support this indicator
No national data available. Queensland data (2011-2014) show
94% of women in metropolitan/regional areas were treated and
92% in rural/remote areas
Completed course coverage was 78.2% by 15 years in 2019 (79.6% in females and 76.8% in males).
It was lower amongst Indigenous adolescents (68.5% overall, 71.6%
in females and 65.4% in males)
54.9% of women aged 35 had been screened at least once
with an HPV test by end 2019. HPV screening has not
been available long enough for women to have had two high-performance tests by age 45
* This target applies to girls only programs, which are the most cost-effective option for countries to achieve elimination2, where very high coverage is necessary. Modelling has suggested, for countries that have introduced both-sex vaccination, that elimination of vaccine-preventable types is likely achievable with 80% coverage.10
# A high-performance test refers to a test with performance characteristics at least as good as the HPV test.

2021 CERVICAL CANCER ELIMINATION PROGRESS REPORT – C42021 CERVICAL CANCER ELIMINATION PROGRESS REPORT – C4PAGE 8 PAGE 9
DISEASE OUTCOME INDICATORS
INDICATOR 1 – CERVICAL CANCER INCIDENCE
Rationale
Cervical cancer incidence is the measure used by the WHO to determine whether elimination has been achieved2.
Status of indicator
WHO target: Fewer than 4 new cases per 100,000
Status: Cervical cancer incidence was 6.3 per 100,000 in the period 2011-15 (most recent data available), so a 37% reduction is required to reach elimination. Rates were at least twice as high as the elimination target in Indigenous women, and women living in remote or very remote areas. Incidence rates increased with increasing area-level socioeconomic disadvantage.
In 2015, 821 women were diagnosed with cervical cancer in Australia. Nationally, cervical cancer incidence was 6.3 per 100,000 in 2011-2015 (Figure 1.1). Incidence varied between groups, and rates were three times as high as the elimination target in Indigenous women, and at least twice as high as the elimination target in women living in remote or very remote areas. There is a socioeconomic gradient in cervical cancer incidence, with the incidence rates becoming higher with increasing levels of socioeconomic disadvantage. A further 37% reduction from current rates is needed to achieve elimination at the national level; in Indigenous women, a 67% reduction is required to reach the elimination target.
Notes on methods
Source: AIHW Australian Cancer Database, published in AIHW 20203.
In order to report on cancer incidence across a range of population groups, data are reported across a 5-year period. Results by Indigenous status are based on four jurisdictions (NSW, Qld, WA and NT) where data quality was considered sufficient for analysis. Cervical cancer incidence reported here is based on age-specific rates published in AIHW reports9. Age-standardised rates are lower than in the AIHW report, because the age-standardising method and standard population recommended by WHO for measuring cervical cancer elimination has been used, to enable comparison with the WHO target and internationally2,8. Age-specific rates were not published when they were non-zero and based on a cell size that was less than five; for this reason, rates for TAS, ACT and NT are based on imputed cases or an assumption there were 2.5 cases in some age groups. In addition to this, rates for the ACT and NT are based on fewer than 100 cases over a 5-year period.
Interpretation, issues and challenges for this indicator
There is currently a delay of four to five years in the availability of national cancer incidence data in Australia, which limits our ability to conduct timely reporting of cervical cancer incidence in Australia against the primary WHO elimination target. More timely data have been published for Victoria11, but did not include age-specific rates (which are required in order to compare against the WHO target). These Victorian data to 2019 suggest cancer incidence is lower in women aged less than 25 than in the pre-vaccination period. A transient increase in cancer diagnoses is expected in future (from around 2018), as a result of Australia transitioning from 2-yearly cytology-based screening to 5-yearly primary HPV screening, which occurred on 1st December 20174. This anticipated increase would be due to the more sensitive screening test leading to the detection of some prevalent cancers and will represent a success of the new program (given that earlier detection leads to downstaging of cancer and improved survival).
Figure 1.1 – Cervical cancer incidence (2011-2015), per 100,000 females
0
2
4
6
8
10
12
14
Indi
geno
us
12.1 5.7 7.9 6.9 5.9 5.6 5.3 6.0 6.7 7.6 8.7 8.0 6.0 5.6 7.6 6.4 6.0 8.1 4.1 6.2
Non
-Ind
igen
ous
Cer
vica
l can
cer
inci
denc
e (p
er 1
00,0
00)
Maj
or c
ities
Inne
r re
gion
al
Out
er r
egio
nal
Rem
ote
Very
Rem
ote
NSW Vi
c
Qld
WA SA Tas
ACT
NT
Lowest Highest
Socioeconomic group
2011-2015
Remoteness area States and territories
1 2 3 4 5
WHO elimination targetAustralia (6.3)

2021 CERVICAL CANCER ELIMINATION PROGRESS REPORT – C42021 CERVICAL CANCER ELIMINATION PROGRESS REPORT – C4PAGE 10 PAGE 11
DISEASE OUTCOME INDICATORS (Cont.)
INDICATOR 2 – CERVICAL CANCER MORTALITY
Rationale
Reducing premature mortality from cervical cancer is the overarching aim of the WHO elimination strategy, so cervical cancer mortality has been identified as a key impact indicator in the global strategy to accelerate elimination2. Cervical cancer mortality will capture two things that will not be reflected in cervical cancer incidence rates: downstaging (due to screening) and the WHO target of treating 90% of women diagnosed with cervical cancer.
Status of indicator
WHO target: no target set
Status: Cervical cancer mortality was 1.4 per 100,000 women in the period 2014-2018 (most recent data), with an inverse socioeconomic gradient, and rates over three times as high in Indigenous women (3.5x) and very remote areas (3.0x), and twice as high in the NT.
In 2018, there were 232 deaths from cervical cancer. Cervical cancer mortality was 1.4 per 100,000 women in 2014-2018 with some variation in mortality across the population, most notably higher rates for Indigenous women, women living in very remote areas, and women in the NT; and a socioeconomic gradient (Figure 2.1).
Notes on methods
Source: AIHW Australian Cancer Database, published in AIHW 20203.
In order to report on cancer mortality across a range of population groups, data are reported across a 5-year period (the most recent 5-year period for which data are available). Age-specific rates were sourced from the most recent national report3. Age-standardisation is performed across all ages using the 2015 World Population, consistent with the methodology recommended for incidence as part of the WHO elimination strategy2. As a result of this difference in methodology, mortality rates in this report are not comparable to AIHW reports.
Interpretation, issues and challenges for this indicator
National mortality data are more timely than national cancer incidence data. Cervical cancer mortality is relatively low in many groups but many of the groups with higher rates correspond with those with a higher incidence (higher rates in Indigenous women and increasing rates with increasing level of socioeconomic disadvantage). There is considerable overlap in the groups identified as having the highest mortality rates (Indigenous women, women living in very remote areas, women living in the NT).
Reductions in cervical cancer mortality over time will reflect a range of factors, including improved prevention, earlier detection (downstaging), improvements to treatment, and providing more women with optimal treatment.
Figure 2.1 – Cervical cancer mortality (2014-2018), per 100,000 women
0
1
2
3
4
5
6
Indi
geno
us
Non
-Ind
igen
ous
Cer
vica
l can
cer
mor
talit
y (p
er 1
00,0
00)
Maj
or c
ities
Inne
r re
gion
al
Out
er r
egio
nal
Rem
ote
Very
Rem
ote
NSW Vi
c
Qld
WA SA Tas
ACT
NT
Lowest Highest
Socioeconomic group
2014-2018
Remoteness area States and territories
1 2 3 4 5
Australia (1.4)
5.0 1.3 2.1 1.6 1.5 1.1 0.9 1.3 1.6 1.8 1.4 4.3 1.3 1.3 1.8 1.4 1.6 1.8 1.0 2.8
2021 CERVICAL CANCER ELIMINATION PROGRESS REPORT – C42021 CERVICAL CANCER ELIMINATION PROGRESS REPORT – C4PAGE 12 PAGE 13
INDICATOR 3 – DETECTION OF HIGH-GRADE CERVICAL DISEASE
Rationale
Cervical screening aims to detect specific types of cervical disease (known as high-grade -see Methods below for details) that are considered to be the precursors of cervical cancer, so that women can have treatment to prevent progression to cancer.
This indicator measures the proportion of women screened who are found to have high-grade disease as defined by a positive result on biopsy. It will be determined by the underlying proportion with high-grade disease in the screened population, the accuracy of the screening method used, and the subsequent diagnostic steps and follow up undertaken with women found positive on the screening method.
Status of indicator
WHO target: no target set
Status: Nationally, detection of high-grade cervical disease in the cytology-based program was 7.1 per 1,000 screened women aged 20-69 years in the first 6 months of 2017, which is a significant decline from the peak rate of 8.5 in 2010 due to falling disease rates in young women following the national HPV vaccination program.
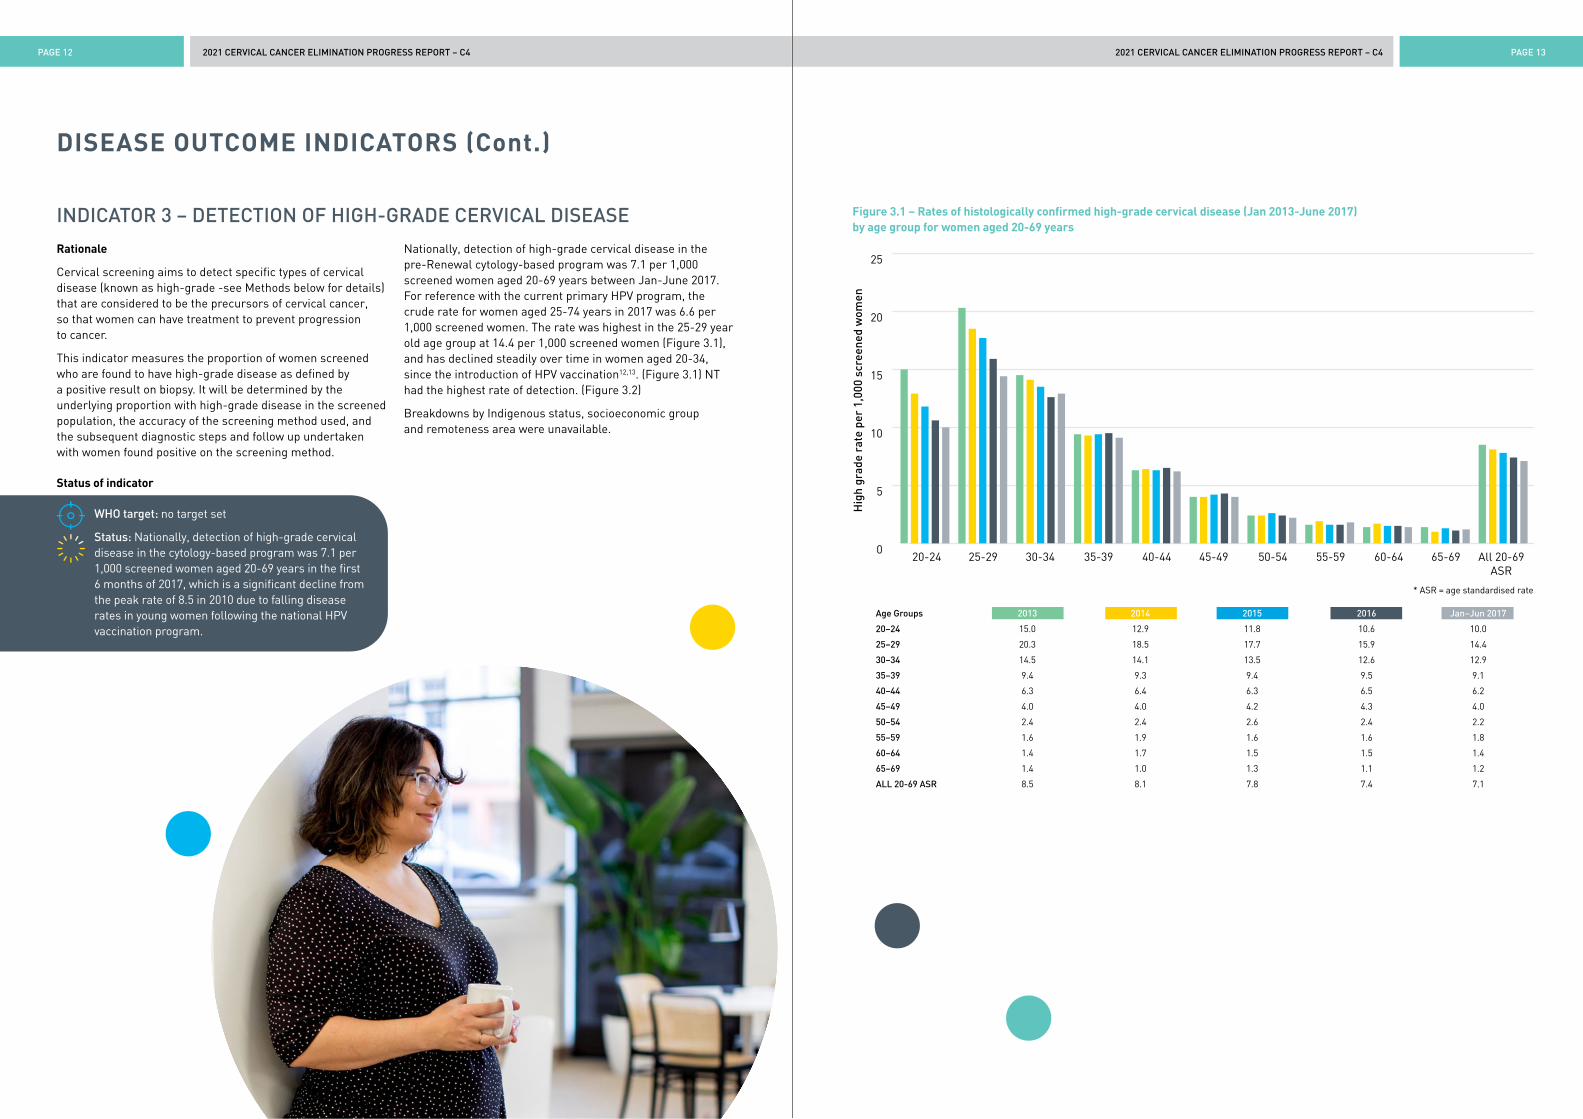
Nationally, detection of high-grade cervical disease in the pre-Renewal cytology-based program was 7.1 per 1,000 screened women aged 20-69 years between Jan-June 2017. For reference with the current primary HPV program, the crude rate for women aged 25-74 years in 2017 was 6.6 per 1,000 screened women. The rate was highest in the 25-29 year old age group at 14.4 per 1,000 screened women (Figure 3.1), and has declined steadily over time in women aged 20-34, since the introduction of HPV vaccination12,13. (Figure 3.1) NT had the highest rate of detection. (Figure 3.2)
Breakdowns by Indigenous status, socioeconomic group and remoteness area were unavailable.
DISEASE OUTCOME INDICATORS (Cont.)
Figure 3.1 – Rates of histologically confirmed high-grade cervical disease (Jan 2013-June 2017) by age group for women aged 20-69 years 2013 2014 2015 2016 Jan-Jun 2017
0
5
10
15
20
25
Hig
h gr
ade
rate
per
1,0
00 s
cree
ned
wom
en
20-24 30-3425-29 35-39 40-44 45-49 50-54 55-59 60-64 65-69 All 20-69ASR
* ASR = age standardised rate
Age Groups 2013 2014 2015 2016 Jan–Jun 2017
20–24 15.0 12.9 11.8 10.6 10.0
25–29 20.3 18.5 17.7 15.9 14.4
30–34 14.5 14.1 13.5 12.6 12.9
35–39 9.4 9.3 9.4 9.5 9.1
40–44 6.3 6.4 6.3 6.5 6.2
45–49 4.0 4.0 4.2 4.3 4.0
50–54 2.4 2.4 2.6 2.4 2.2
55–59 1.6 1.9 1.6 1.6 1.8
60–64 1.4 1.7 1.5 1.5 1.4
65–69 1.4 1.0 1.3 1.1 1.2
ALL 20-69 ASR 8.5 8.1 7.8 7.4 7.1

2021 CERVICAL CANCER ELIMINATION PROGRESS REPORT – C42021 CERVICAL CANCER ELIMINATION PROGRESS REPORT – C4PAGE 14 PAGE 15
Figure 3.2 – Rates of histologically confirmed high-grade cervical disease (Jan 2017-June 2017) per 1,000 screened women aged 20-69 years, by State and Territory of screening
0
2
4
6
8
10
12
14
Indi
geno
us
Non
-Ind
igen
ous
Hig
h gr
ade
rate
per
1,0
00 w
omen
scr
eene
d
Maj
or c
ities
Inne
r re
gion
al
Out
er r
egio
nal
Rem
ote
Very
Rem
ote
NSW Vi
c
Qld
WA SA Tas
ACT
NT
Lowest Highest
Socioeconomic group
Jan-June 2017
Remoteness area States and territories
1 2 3 4 5
Australia (7.1)
7.4 6.9 6.0 7.9 6.3 8.8 6.8 11.8
Notes on methods
Source: AIHW, Cervical screening in Australia 2019 data14.
Women who had been offered HPV vaccination were aged 20-32 in 2013, and 20-36 in 2017. Data presented used the methodology of the AIHW Cervical Screening in Australia reports for the former NCSP14. High-grade cervical disease was defined as a histology result of HS03 (CIN NOS, CIN II and CIN III) or HE03 (endocervical dysplasia and adenocarcinoma in situ). Age-standardised rates were the number of women with a high-grade abnormality detected by histology per 1,000 women screened, age-standardised to the Australian 2001 Standard Population15. These data exclude women who had opted off the jurisdictional cervical screening registers.
Interpretation, issues and challenges for this indicator
Due to known substantial under-enumeration of histopathology reports in the currently available NCSR data set (with updated data pending), we used data from 2017 for this report. We were concerned that the large number of missing reports would significantly underestimate the true high-grade detection rate. The AIHW report using these data estimated a provisional rate of 8.6 per 1,000 women screened in 20193.
Following the transition in 2017 to primary HPV- based screening, which is known to be more sensitive that cytology for the detection of high-grade cervical abnormalities, an increase in detection rates for both pre-cancer and cancer was anticipated8. The pilot phase results of the Compass trial, which is comparing cytology-based and HPV-based screening in Australia and serves as a sentinel evaluation of the new screening program, confirmed a higher rate of high-grade detection in the HPV based screening arms than in the cytology arm16.
The available data demonstrate the impact of the HPV vaccination program on overall rates of high-grade cervical disease in Australia. Although national data were not available for inclusion in the report, previous research in Qld, the NT and SA has demonstrated that Indigenous women had higher rates of high-grade disease at screening than non-Indigenous women (about twice as high, although with a closing of this gap in the most recent period in the NT, the jurisdiction with the largest proportion of the population who are Indigenous)17-19. Univariate analyses of national data indicated that women residing in the lowest socioeconomic quintile had higher rates than those in the highest and that women living in the remotest areas also had significantly higher rates detected20.
A particular challenge for this indicator is interpretation over time. Where the population effectively recruited to screening changes (for example, previously unscreened women are engaged), the rate may rise. The rate is also expected to be higher in certain years, due to the change in the screening interval from two years to five years: for example, women attending in 2020-2022 will either be overdue for screening or under surveillance, so the women attending for screening these years will be at higher risk, and there will also be far fewer of them8,21.
DISEASE OUTCOME INDICATORS (Cont.)
2021 CERVICAL CANCER ELIMINATION PROGRESS REPORT – C42021 CERVICAL CANCER ELIMINATION PROGRESS REPORT – C4PAGE 16 PAGE 17
DISEASE OUTCOME INDICATORS (Cont.)
INDICATOR 4 – PREVALENCE OF HPV INFECTION
Rationale
The ability to achieve cervical cancer elimination is dependent upon the reduction in prevalence of oncogenic HPV types through HPV vaccination. Monitoring infection prevalence, in settings where this is feasible, provides a direct measure of the extent to which this reduction is being achieved and sustained over time.
Status of indicator
WHO target: no target set
Status: The prevalence of HPV16 or 18 in 2019 was very low, reflecting the success of Australia’s HPV vaccination program. Other oncogenic HPV types are commonly detected among screening participants, especially those in the youngest age groups.
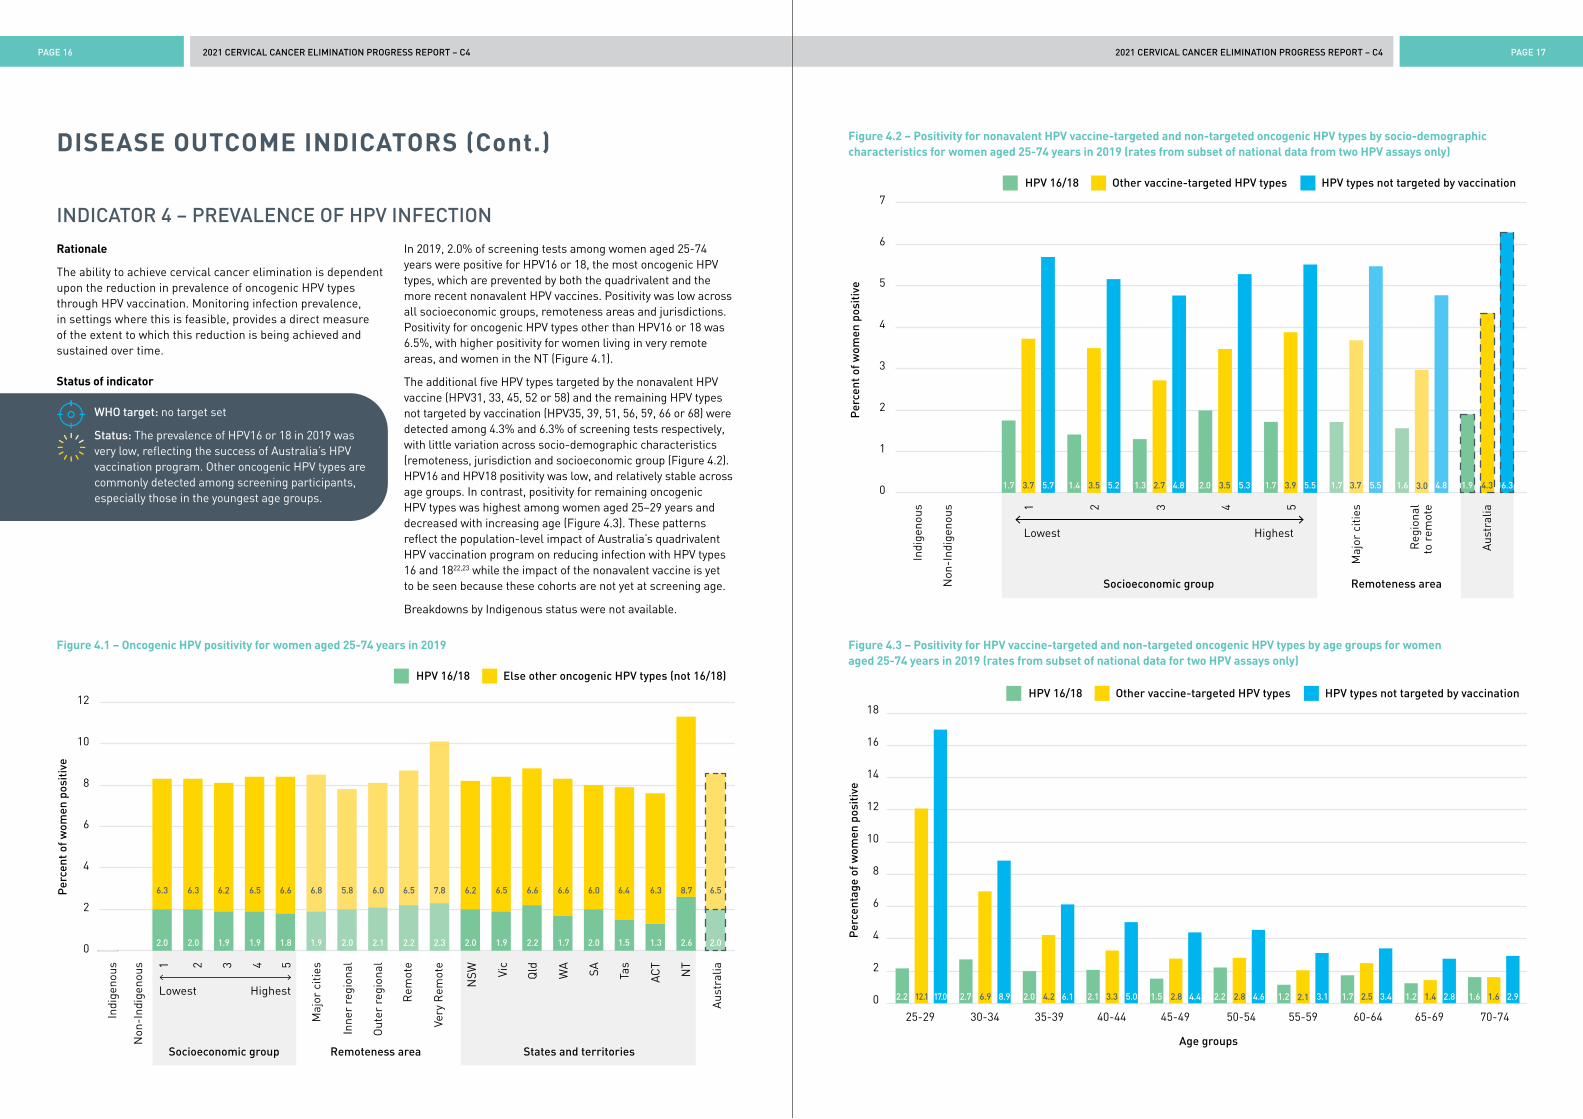
In 2019, 2.0% of screening tests among women aged 25-74 years were positive for HPV16 or 18, the most oncogenic HPV types, which are prevented by both the quadrivalent and the more recent nonavalent HPV vaccines. Positivity was low across all socioeconomic groups, remoteness areas and jurisdictions. Positivity for oncogenic HPV types other than HPV16 or 18 was 6.5%, with higher positivity for women living in very remote areas, and women in the NT (Figure 4.1).
The additional five HPV types targeted by the nonavalent HPV vaccine (HPV31, 33, 45, 52 or 58) and the remaining HPV types not targeted by vaccination (HPV35, 39, 51, 56, 59, 66 or 68) were detected among 4.3% and 6.3% of screening tests respectively, with little variation across socio-demographic characteristics (remoteness, jurisdiction and socioeconomic group (Figure 4.2). HPV16 and HPV18 positivity was low, and relatively stable across age groups. In contrast, positivity for remaining oncogenic HPV types was highest among women aged 25–29 years and decreased with increasing age (Figure 4.3). These patterns reflect the population-level impact of Australia’s quadrivalent HPV vaccination program on reducing infection with HPV types 16 and 1822,23 while the impact of the nonavalent vaccine is yet to be seen because these cohorts are not yet at screening age.
Breakdowns by Indigenous status were not available.
Figure 4.1 – Oncogenic HPV positivity for women aged 25-74 years in 2019
Figure 4.2 – Positivity for nonavalent HPV vaccine-targeted and non-targeted oncogenic HPV types by socio-demographic characteristics for women aged 25-74 years in 2019 (rates from subset of national data from two HPV assays only)
Figure 4.3 – Positivity for HPV vaccine-targeted and non-targeted oncogenic HPV types by age groups for women aged 25-74 years in 2019 (rates from subset of national data for two HPV assays only)
0
2
4
6
8
10
12
Indi
geno
us
Non
-Ind
igen
ous
Per
cent
of w
omen
pos
itiv
e
Maj
or c
ities
Inne
r re
gion
al
Out
er r
egio
nal
Rem
ote
Very
Rem
ote
NSW Vi
c
Qld WA SA Tas
ACT
NT
Aus
tral
ia
Lowest Highest
Socioeconomic group
HPV 16/18
Remoteness area States and territories
1 2 3 4 5
Else other oncogenic HPV types (not 16/18)
2.0 2.0 1.9 1.9 1.8 1.9 2.0 2.1 2.2 2.3 2.0 1.9 2.2 1.7 2.0 1.5 1.3 2.6 2.0 6.2
6.3 6.3 6.2 6.5 6.6 6.8 5.8 6.0 6.5 7.8 6.2 6.5 6.6 6.6 6.0 6.4 6.3 8.7 6.5
0
1
2
3
4
5
6
7
Indi
geno
us
Non
-Ind
igen
ous
Per
cent
of w
omen
pos
itiv
e
Maj
or c
ities
Reg
iona
lto
rem
ote
Aus
tral
ia
Lowest Highest
Socioeconomic group
HPV 16/18
Remoteness area
1 2 3 4 5
Other vaccine-targeted HPV types HPV types not targeted by vaccination
1.7 3.7 5.7 1.4 3.5 5.2 1.3 2.7 4.8 2.0 3.5 5.3 1.7 3.9 5.5 1.7 3.7 5.5 3.0 4.8 1.9 4.3 6.31.6
HPV 16/18 Other vaccine-targeted HPV types
Age groups
HPV types not targeted by vaccination
0
2
4
6
8
10
12
14
16
18
Per
cent
age
of w
omen
pos
itiv
e
25-29 30-34 35-39 40-44 45-49 50-54 55-59 60-64 65-69 70-74
2.2 12.1 17.0 2.7 6.9 8.9 2.0 4.2 6.1 2.1 3.3 5.0 1.5 2.8 4.4 2.2 2.8 4.6 2.1 3.1 1.7 2.5 3.4 1.2 1.4 2.8 1.6 1.6 2.91.2
2021 CERVICAL CANCER ELIMINATION PROGRESS REPORT – C42021 CERVICAL CANCER ELIMINATION PROGRESS REPORT – C4PAGE 18 PAGE 19
DISEASE OUTCOME INDICATORS (Cont.)
Notes on methods
Source: AIHW, Cervical screening in Australia 2020 data3, with additional analysis of NCSR data (NCSR RDE 3.4.0 25/09/2020) provided by AIHW.
Calculation of proportions in Figure 4.1 were based on national data reported to the NCSR. Data presented are based on the clinical management pathways of the NCSP: proportion of women with HPV16 and 18 (regardless of positivity for other types) versus proportion of women with other oncogenic types (in the absence of HPV16 and 18). Figure 4.2 and Figure 4.3 were derived from a small subset of results (n~34,000) from two assays that provided additional discrimination between vaccine-targeted and non-vaccine targeted HPV types. This group had similar overall HPV16 and 18 prevalence to the total national data albeit slightly lower (1.9% vs 2.0%). Results were derived using the standard method for calculating population prevalence: sum of women positive for a given HPV genotype divided by the total count of women with individual genotyping data.
Interpretation, issues and challenges for this indicator
Many HPV vaccinated women have now attained the age at which they are participating in cervical screening. Linkage between the NCSR and AIR will in future permit comparisons of prevalence of HPV infection detected at screening between vaccinated and unvaccinated women.
Surveys prior to the start of the vaccination program among women attending cervical screening suggested similar prevalence of HPV16/18 in Indigenous compared with non-Indigenous women at all ages, but a higher prevalence of other oncogenic types in middle age24. A survey conducted after the program had begun found declines in prevalence similar to those observed in non-Indigenous women, with an HPV16/18 prevalence among Indigenous women aged 18–26 of 1.4% in 2014-1525. A recent study of women 18-35 years found that the prevalence of HPV16/18 was very similar in Indigenous and non-Indigenous women (1.9% versus 1.6% respectively)26.
VACCINE COVERAGE INDICATORS
INDICATOR 5 – HPV VACCINE COMPLETION BY AGE 15 YEARS
Rationale
A high level of vaccine coverage sustained over many years, which will achieve population level control of vaccine targeted HPV types, is required in the long term for cervical cancer elimination2,27. For the purposes of monitoring coverage over time and comparing across countries, which vary in their age of vaccination within the range 9-14 years WHO recommends the use of the indicator ‘HPV vaccination coverage by age 15’.28
This indicator measures the proportion of the population turning 15 in the reporting year who have completed their HPV vaccine course coverage by age 15, noting that the number of (correctly spaced) doses required to complete the course has changed over time from 3 doses to 2 doses.
The WHO target relates to female-only programs, which are the most cost-effective option. Australia has a both-sex program, and modelling suggests the same effect could be achieved with less than 90% coverage10.
Status of indicator
WHO 2030 target: 90% of girls fully vaccinated by age 15 years
Status: HPV vaccination coverage with completed courses in both sexes was 78.2% (79.6% in females and 76.8% in males).
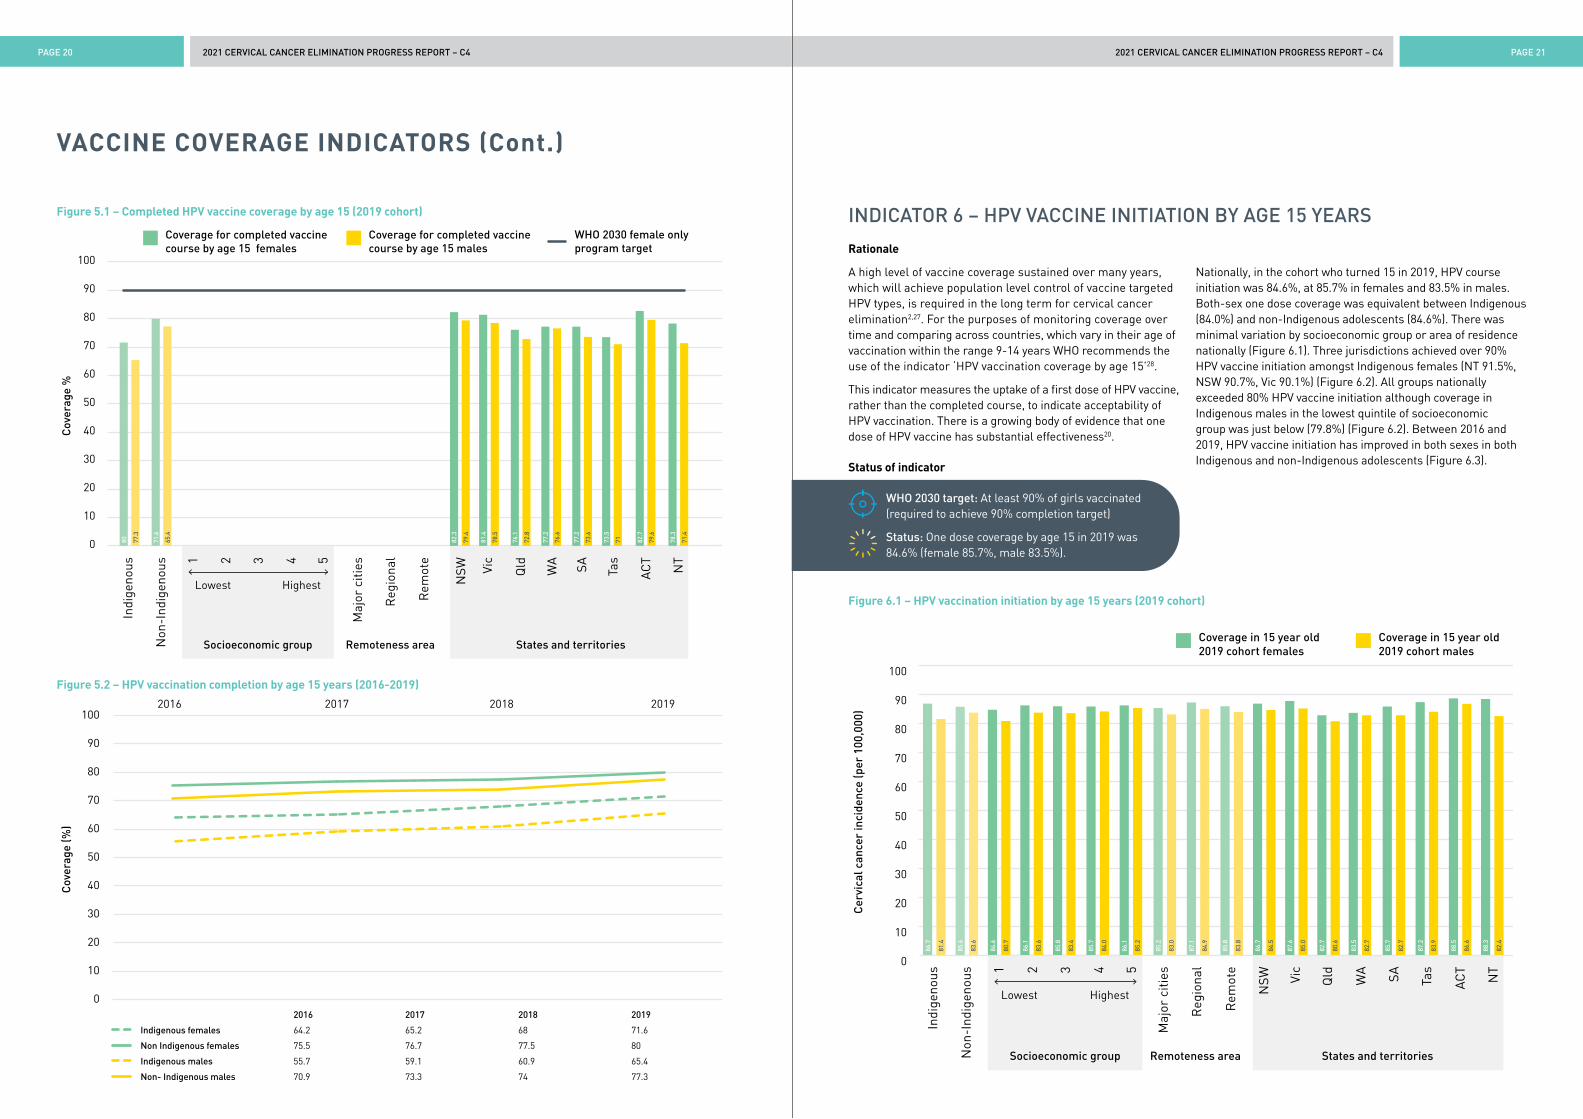
Nationally, in the cohort who turned 15 in 2019, HPV vaccination coverage with completed courses was 78.2% (79.6% in females and 76.8% in males). Coverage of completed courses was substantially lower amongst Indigenous adolescents at 68.5% (female 71.6%, male 65.4%) than non-Indigenous (78.6% overall; female 80.0%, male 77.3%). (Figure 5.1). Completion coverage overall was over 80% in NSW (80.8%) and the ACT (81.2%)(data not shown), over 80% in females in NSW, Vic and ACT but no jurisdiction achieved over 80% completed course coverage in males (Figure 5.1). Completed HPV vaccine course coverage has increased between 2016 and 2019 in both sexes in both Indigenous and non-Indigenous adolescents (Figure 5.2).
Data on completed course coverage by remoteness and socioeconomic group were not available - see Indicator 6 initiation.
Notes on methods
Source: Australian Immunisation Register (AIR) data, sourced from NCIRS analysis as published in NCIRS 202129.
Although the 2-dose schedule was not formally adopted until 2018, the 2019 cohort was the first to include some adolescents on a 2-dose schedule, due to early implementation of the schedule in NSW and a later average age of initiation in SA and WA. In the 2019 cohort, either two validly spaced doses (five months or more between doses) or three doses were considered to indicate course completion.
Interpretation, issues and challenges for this indicator
It should be noted that Australia has introduced both-sex vaccination and this provides additional herd immunity to non-vaccinated women (as has been well documented). Modelling has suggested, for countries that have introduced both-sex vaccination, that elimination of vaccine-preventable HPV types is likely achievable with a sustained coverage of 80%10. Additional investments into incremental improvements in vaccine coverage in Australia should therefore be supported by evidence of their cost-effectiveness. However, for countries that have not yet introduced or scaled up vaccination coverage, female-only vaccination is the most cost-effective option for achieving elimination2; thus the 90% target has been set by WHO for female coverage and should be the first focus for those countries.
Coverage estimates from the former National HPV Vaccination Program Register had suggested that female three dose coverage had already exceeded 80%. HPV vaccine doses are now held in AIR and coverage is estimated using a different denominator (Medicare enrolments) which has resulted in slightly lower coverage estimates for the same cohorts29. It is too early to tell whether the move from a 3-dose to a 2-dose schedule has improved coverage. Any benefit might be diminished by the requirement that the second dose be administered at the same time as the previous third dose (6 months after the first), so completion may still be affected by factors such as higher school absenteeism in the second half of the school year.
Despite gradually improving coverage over time, a large disparity remains between Indigenous adolescents and non-Indigenous adolescents in receipt of the final dose.
2021 CERVICAL CANCER ELIMINATION PROGRESS REPORT – C42021 CERVICAL CANCER ELIMINATION PROGRESS REPORT – C4PAGE 20 PAGE 21
VACCINE COVERAGE INDICATORS (Cont.)
INDICATOR 6 – HPV VACCINE INITIATION BY AGE 15 YEARS
Rationale
A high level of vaccine coverage sustained over many years, which will achieve population level control of vaccine targeted HPV types, is required in the long term for cervical cancer elimination2,27. For the purposes of monitoring coverage over time and comparing across countries, which vary in their age of vaccination within the range 9-14 years WHO recommends the use of the indicator ‘HPV vaccination coverage by age 15’28.
This indicator measures the uptake of a first dose of HPV vaccine, rather than the completed course, to indicate acceptability of HPV vaccination. There is a growing body of evidence that one dose of HPV vaccine has substantial effectiveness20.
Status of indicator
WHO 2030 target: At least 90% of girls vaccinated (required to achieve 90% completion target)
Status: One dose coverage by age 15 in 2019 was 84.6% (female 85.7%, male 83.5%).
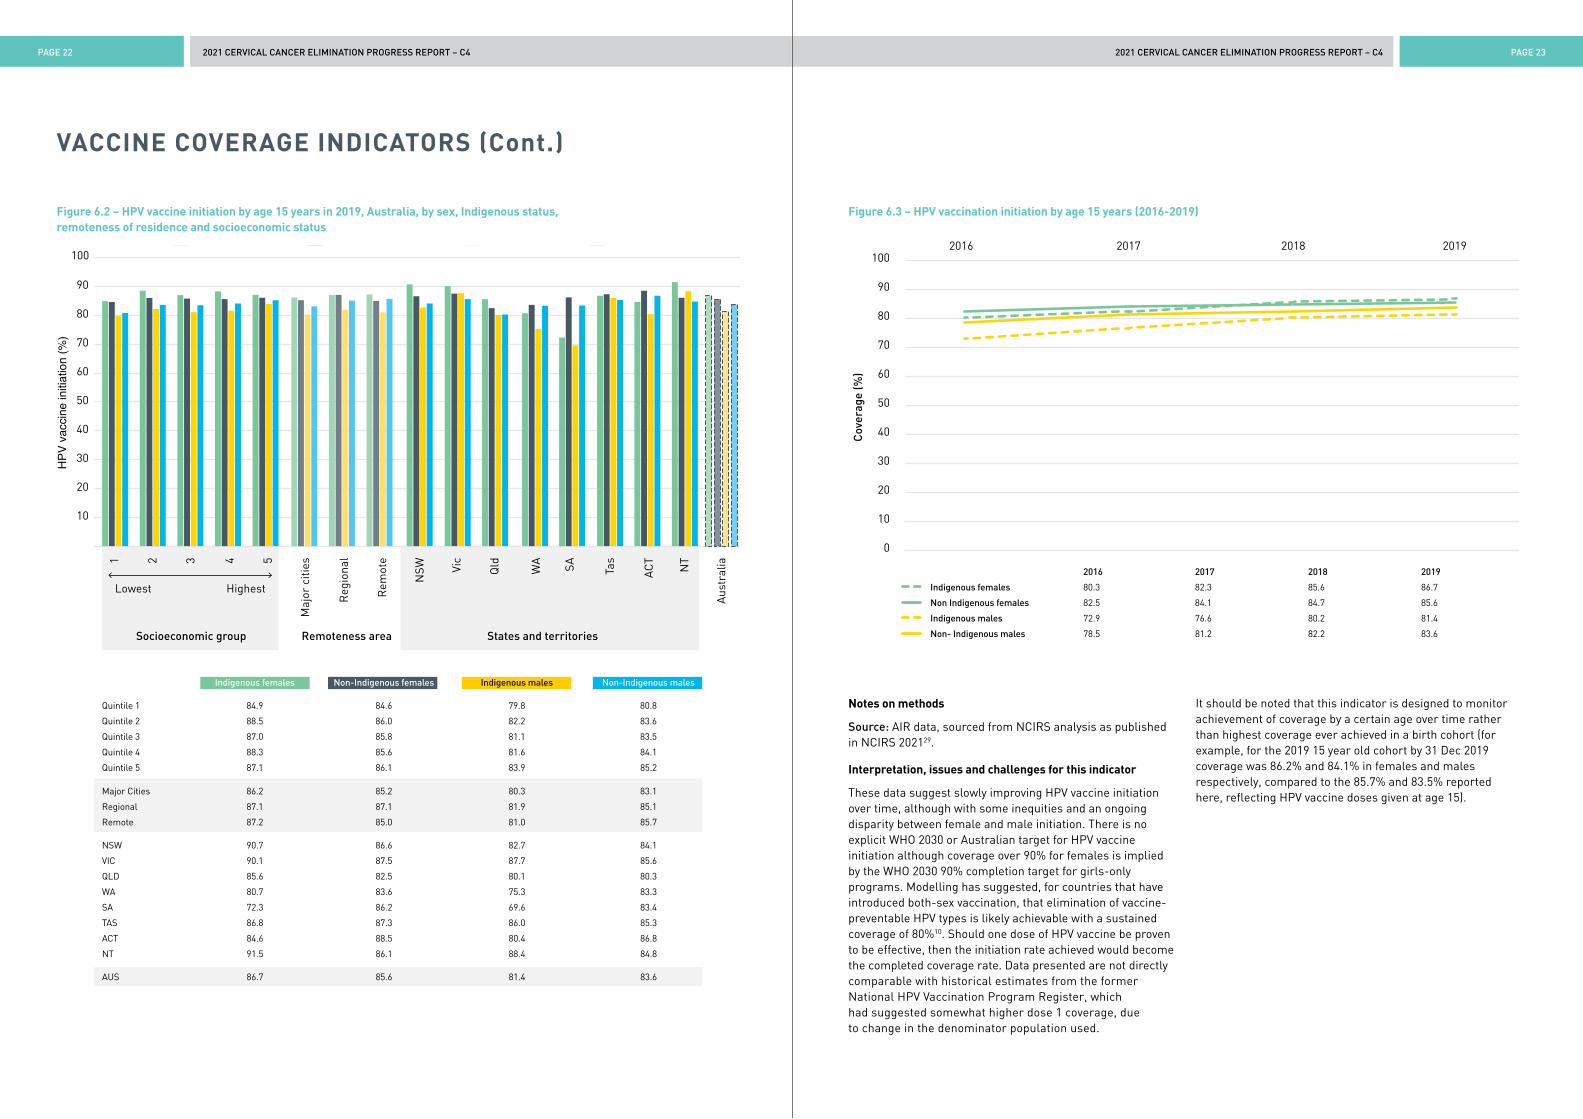
Nationally, in the cohort who turned 15 in 2019, HPV course initiation was 84.6%, at 85.7% in females and 83.5% in males. Both-sex one dose coverage was equivalent between Indigenous (84.0%) and non-Indigenous adolescents (84.6%). There was minimal variation by socioeconomic group or area of residence nationally (Figure 6.1). Three jurisdictions achieved over 90% HPV vaccine initiation amongst Indigenous females (NT 91.5%, NSW 90.7%, Vic 90.1%) (Figure 6.2). All groups nationally exceeded 80% HPV vaccine initiation although coverage in Indigenous males in the lowest quintile of socioeconomic group was just below (79.8%) (Figure 6.2). Between 2016 and 2019, HPV vaccine initiation has improved in both sexes in both Indigenous and non-Indigenous adolescents (Figure 6.3).
Figure 6.1 – HPV vaccination initiation by age 15 years (2019 cohort)
0
10
20
30
40
50
60
70
80
90
100
Indi
geno
us
Non
-Ind
igen
ous
Cer
vica
l can
cer
inci
denc
e (p
er 1
00,0
00)
Maj
or c
ities
Reg
iona
l
Rem
ote
NSW Vi
c
Qld
WA SA Tas
ACT
NT
Lowest Highest
Socioeconomic group
Coverage in 15 year old 2019 cohort females
Remoteness area States and territories
1 2 3 4 5
Coverage in 15 year old 2019 cohort males
86.7
81.4
85.6
83.6
84.6
80.7
86.1
83.6
85.8
83.4
85.7
84.0
86.1
85.2
85.2
83.0
87.1
84.9
85.8
83.8
86.7
84.5
87.6
85.0
82.7
80.6
83.5
82.7
85.7
82.7
87.2
83.9
88.5
86.6
88.3
82.4
Figure 5.2 – HPV vaccination completion by age 15 years (2016-2019)Indigenous females Non Indigenous females Indigenous males Non Indigenous males
0
10
20
30
40
50
60
70
80
90
100
Cov
erag
e (%
)
2016 2017 2018 2019
Figure 5.1 – Completed HPV vaccine coverage by age 15 (2019 cohort)
0
10
20
30
40
50
60
70
80
90
100
Indi
geno
us
Non
-Ind
igen
ous
Cov
erag
e %
Maj
or c
ities
Reg
iona
l
Rem
ote
NSW Vi
c
Qld
WA SA Tas
ACT
NT
Lowest Highest
Socioeconomic group
Coverage for completed vaccine course by age 15 females
Remoteness area States and territories
1 2 3 4 5
Coverage for completed vaccinecourse by age 15 males
WHO 2030 female only program target
2.2 12.1 17.080 77.3
71.6
65.4
82.3
79.4
81.4
78.5
76.1
72.8
77.2
76.6
77.2
73.6
73.5
71 82.7
79.6
78.3
71.4
2016 2017 2018 2019
Indigenous females 64.2 65.2 68 71.6
Non Indigenous females 75.5 76.7 77.5 80
Indigenous males 55.7 59.1 60.9 65.4
Non- Indigenous males 70.9 73.3 74 77.3
2021 CERVICAL CANCER ELIMINATION PROGRESS REPORT – C42021 CERVICAL CANCER ELIMINATION PROGRESS REPORT – C4PAGE 22 PAGE 23
VACCINE COVERAGE INDICATORS (Cont.)
Figure 6.2 – HPV vaccine initiation by age 15 years in 2019, Australia, by sex, Indigenous status, remoteness of residence and socioeconomic status
Figure 6.3 – HPV vaccination initiation by age 15 years (2016-2019)
Notes on methods
Source: AIR data, sourced from NCIRS analysis as published in NCIRS 202129.
Interpretation, issues and challenges for this indicator
These data suggest slowly improving HPV vaccine initiation over time, although with some inequities and an ongoing disparity between female and male initiation. There is no explicit WHO 2030 or Australian target for HPV vaccine initiation although coverage over 90% for females is implied by the WHO 2030 90% completion target for girls-only programs. Modelling has suggested, for countries that have introduced both-sex vaccination, that elimination of vaccine-preventable HPV types is likely achievable with a sustained coverage of 80%10. Should one dose of HPV vaccine be proven to be effective, then the initiation rate achieved would become the completed coverage rate. Data presented are not directly comparable with historical estimates from the former National HPV Vaccination Program Register, which had suggested somewhat higher dose 1 coverage, due to change in the denominator population used.
It should be noted that this indicator is designed to monitor achievement of coverage by a certain age over time rather than highest coverage ever achieved in a birth cohort (for example, for the 2019 15 year old cohort by 31 Dec 2019 coverage was 86.2% and 84.1% in females and males respectively, compared to the 85.7% and 83.5% reported here, reflecting HPV vaccine doses given at age 15).
Indigenous females Non Indigenous females Indigenous males Non Indigenous males
0
10
20
30
40
50
60
70
80
90
100
Cov
erag
e (%
)
2016 2017 2018 2019
10
20
30
40
50
60
70
80
90
100
HPV
vac
cine
initi
atio
n (%
)
Maj
or c
ities
Aus
tral
ia
Reg
iona
l
Rem
ote
NSW Vi
c
Qld
WA SA Tas
ACT
NT
Indigenous females
States and territories
Non-Indigenous females Indigenous males Non-Indigenous males
Remoteness area
1 2 3 4 5
Socioeconomic group
Lowest Highest
2016 2017 2018 2019
Indigenous females 80.3 82.3 85.6 86.7
Non Indigenous females 82.5 84.1 84.7 85.6
Indigenous males 72.9 76.6 80.2 81.4
Non- Indigenous males 78.5 81.2 82.2 83.6
Indigenous females Non-Indigenous females Indigenous males Non-Indigenous males
Quintile 1 84.9 84.6 79.8 80.8
Quintile 2 88.5 86.0 82.2 83.6
Quintile 3 87.0 85.8 81.1 83.5
Quintile 4 88.3 85.6 81.6 84.1
Quintile 5 87.1 86.1 83.9 85.2
Major Cities 86.2 85.2 80.3 83.1
Regional 87.1 87.1 81.9 85.1
Remote 87.2 85.0 81.0 85.7
NSW 90.7 86.6 82.7 84.1
VIC 90.1 87.5 87.7 85.6
QLD 85.6 82.5 80.1 80.3
WA 80.7 83.6 75.3 83.3
SA 72.3 86.2 69.6 83.4
TAS 86.8 87.3 86.0 85.3
ACT 84.6 88.5 80.4 86.8
NT 91.5 86.1 88.4 84.8
AUS 86.7 85.6 81.4 83.6
2021 CERVICAL CANCER ELIMINATION PROGRESS REPORT – C42021 CERVICAL CANCER ELIMINATION PROGRESS REPORT – C4PAGE 24 PAGE 25
SCREENING PARTICIPATION INDICATORS
INDICATOR 7 – SCREENING PARTICIPATION BY AGE 35 AND 45 YEARS
Rationale
Vaccination against HPV will take decades to reduce overall cervical cancer incidence, due to the time taken for vaccinated cohorts to reach the age at which they would have developed cancer and to make up a large enough proportion of the population to affect overall incidence rates. Cervical screening therefore is important to expedite elimination of cervical cancer2,30,31. The WHO strategy to accelerate the elimination of cervical cancer sets a target of screening women at least twice, at around age 35 and 45 years. Around half of the women diagnosed with cervical cancer in Australia had never been screened32, emphasising the importance of this indicator, even though more frequent screening is recommended in the NCSP.
Primary HPV screening has been recommended in Australia since 1st December 2017, not yet long enough for any women to have had a primary HPV test by age 35 and another by age 45. The second part of this indicator therefore reports on the proportion of women aged 45 who have been screened at least twice, including at least one primary HPV test and at least one cytology test prior to 1st December 2017 at least two years apart, as an interim measure.
Status of indicator
WHO 2030 target: 70% of women screened using a high-performance test (such as HPV) by 35 years of age and again by 45 years of age.^
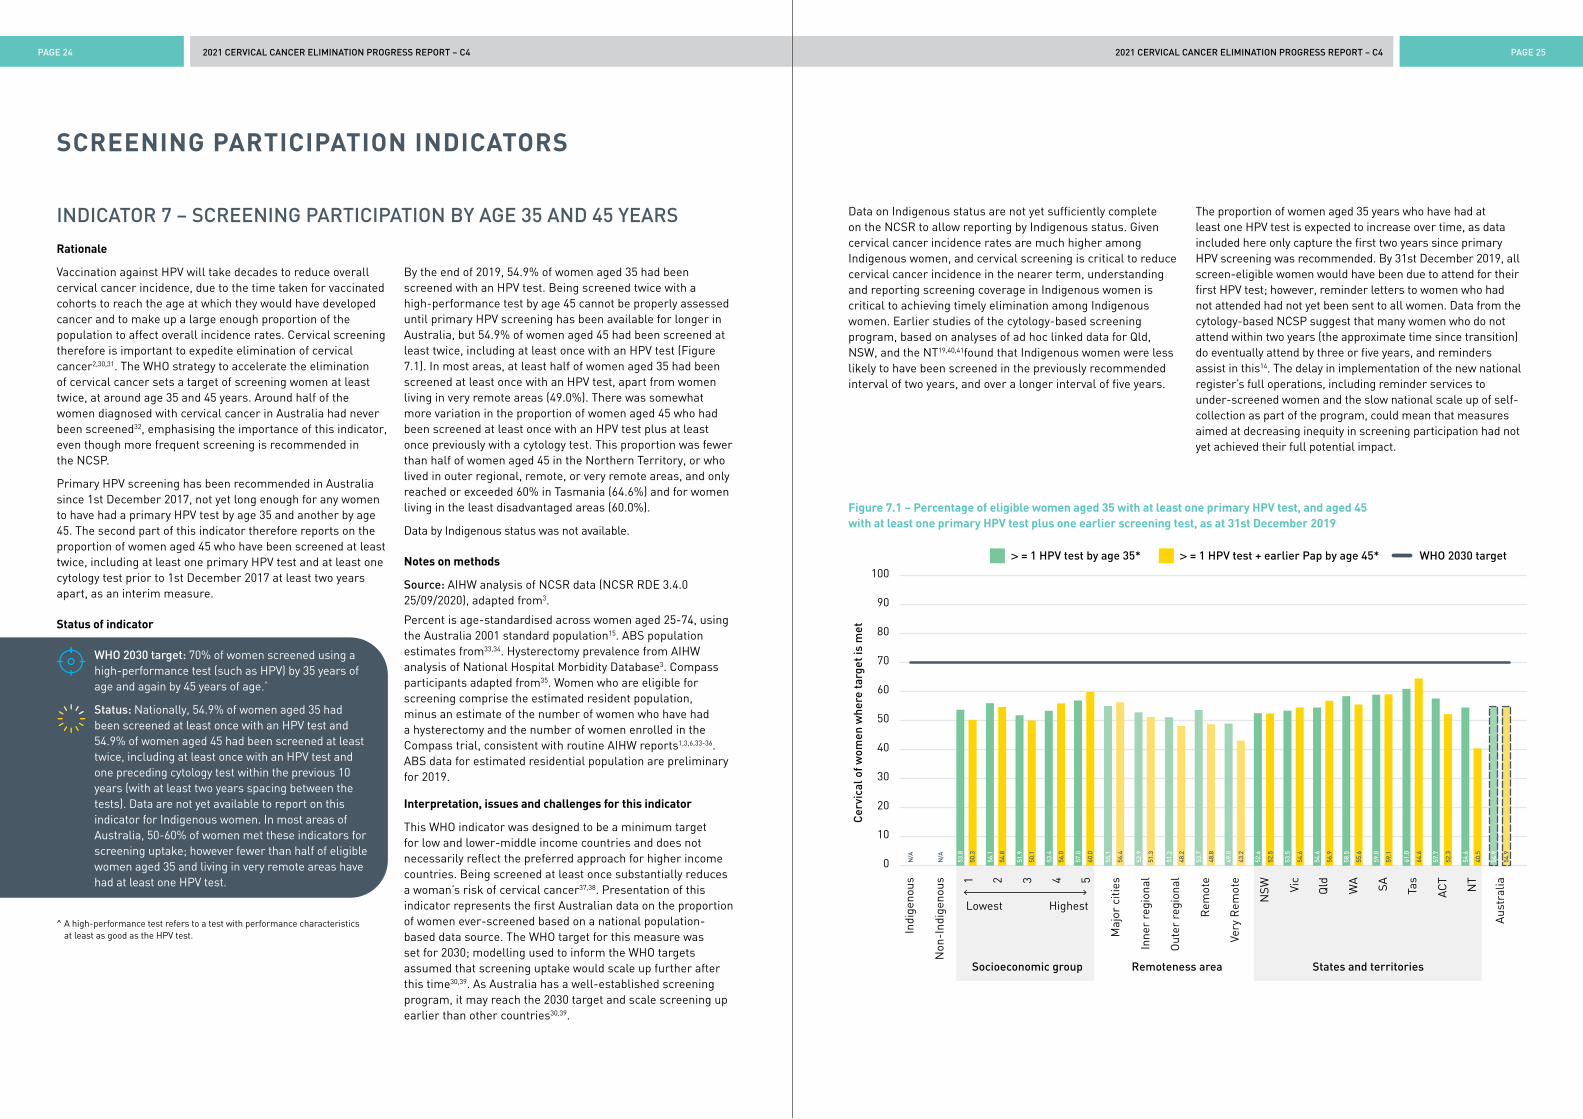
Status: Nationally, 54.9% of women aged 35 had been screened at least once with an HPV test and 54.9% of women aged 45 had been screened at least twice, including at least once with an HPV test and one preceding cytology test within the previous 10 years (with at least two years spacing between the tests). Data are not yet available to report on this indicator for Indigenous women. In most areas of Australia, 50-60% of women met these indicators for screening uptake; however fewer than half of eligible women aged 35 and living in very remote areas have had at least one HPV test.
By the end of 2019, 54.9% of women aged 35 had been screened with an HPV test. Being screened twice with a high-performance test by age 45 cannot be properly assessed until primary HPV screening has been available for longer in Australia, but 54.9% of women aged 45 had been screened at least twice, including at least once with an HPV test (Figure 7.1). In most areas, at least half of women aged 35 had been screened at least once with an HPV test, apart from women living in very remote areas (49.0%). There was somewhat more variation in the proportion of women aged 45 who had been screened at least once with an HPV test plus at least once previously with a cytology test. This proportion was fewer than half of women aged 45 in the Northern Territory, or who lived in outer regional, remote, or very remote areas, and only reached or exceeded 60% in Tasmania (64.6%) and for women living in the least disadvantaged areas (60.0%).
Data by Indigenous status was not available.
Notes on methods
Source: AIHW analysis of NCSR data (NCSR RDE 3.4.0 25/09/2020), adapted from3.
Percent is age-standardised across women aged 25-74, using the Australia 2001 standard population15. ABS population estimates from33,34. Hysterectomy prevalence from AIHW analysis of National Hospital Morbidity Database3. Compass participants adapted from35. Women who are eligible for screening comprise the estimated resident population, minus an estimate of the number of women who have had a hysterectomy and the number of women enrolled in the Compass trial, consistent with routine AIHW reports1,3,6,33-36. ABS data for estimated residential population are preliminary for 2019.
Interpretation, issues and challenges for this indicator
This WHO indicator was designed to be a minimum target for low and lower-middle income countries and does not necessarily reflect the preferred approach for higher income countries. Being screened at least once substantially reduces a woman’s risk of cervical cancer37,38. Presentation of this indicator represents the first Australian data on the proportion of women ever-screened based on a national population-based data source. The WHO target for this measure was set for 2030; modelling used to inform the WHO targets assumed that screening uptake would scale up further after this time30,39. As Australia has a well-established screening program, it may reach the 2030 target and scale screening up earlier than other countries30,39.
^ A high-performance test refers to a test with performance characteristics at least as good as the HPV test.
Figure 7.1 – Percentage of eligible women aged 35 with at least one primary HPV test, and aged 45 with at least one primary HPV test plus one earlier screening test, as at 31st December 2019
0
10
20
30
40
50
60
70
80
90
100
Indi
geno
us
Non
-Ind
igen
ous
Cer
vica
l of w
omen
whe
re ta
rget
is m
et
Maj
or c
ities
Inne
r re
gion
al
Out
er r
egio
nal
Rem
ote
Very
Rem
ote
NSW Vi
c
Qld
WA SA Tas
ACT
NT
Aus
tral
ia
Lowest Highest
Socioeconomic group
> = 1 HPV test by age 35*
Remoteness area States and territories1 2 3 4 5
> = 1 HPV test + earlier Pap by age 45* WHO 2030 target
53.8
50.3
N/A
N/A
56.1
54.8
51.9
50.1
53.4
56.0
57.0
60.0
55.1
56.4
52.9
51.3
51.2
48.2
53.7
48.8
49.0
43.2
52.6
52.5
53.5
54.6
54.6
56.9
58.5
55.6
59.0
59.1
61.0
64.6
57.7
52.3
54.6
40.5
54.9
54.9
Data on Indigenous status are not yet sufficiently complete on the NCSR to allow reporting by Indigenous status. Given cervical cancer incidence rates are much higher among Indigenous women, and cervical screening is critical to reduce cervical cancer incidence in the nearer term, understanding and reporting screening coverage in Indigenous women is critical to achieving timely elimination among Indigenous women. Earlier studies of the cytology-based screening program, based on analyses of ad hoc linked data for Qld, NSW, and the NT19,40,41found that Indigenous women were less likely to have been screened in the previously recommended interval of two years, and over a longer interval of five years.
The proportion of women aged 35 years who have had at least one HPV test is expected to increase over time, as data included here only capture the first two years since primary HPV screening was recommended. By 31st December 2019, all screen-eligible women would have been due to attend for their first HPV test; however, reminder letters to women who had not attended had not yet been sent to all women. Data from the cytology-based NCSP suggest that many women who do not attend within two years (the approximate time since transition) do eventually attend by three or five years, and reminders assist in this14. The delay in implementation of the new national register’s full operations, including reminder services to under-screened women and the slow national scale up of self-collection as part of the program, could mean that measures aimed at decreasing inequity in screening participation had not yet achieved their full potential impact.
2021 CERVICAL CANCER ELIMINATION PROGRESS REPORT – C42021 CERVICAL CANCER ELIMINATION PROGRESS REPORT – C4PAGE 26 PAGE 27
SCREENING PARTICIPATION INDICATORS (Cont.)
INDICATOR 8 – SCREENING PARTICIPATION (AUSTRALIAN PROGRAM)
Rationale
Cervical screening is important to expedite elimination of cervical cancer, as HPV vaccination requires several decades to have its full effects across the population. As Australia has a well-established screening program with screening recommended more frequently than in the WHO elimination strategy2, the proportion of women screened according to Australian recommendations is additionally reported. Since 1st December 2017, Australia has recommended 5-yearly primary HPV screening starting at age 25 and with an exit test for women aged 70-74 years; prior to this, 2-yearly cytology was recommended for women aged 20-69 years. Women were due to attend for their first HPV test two years after their last negative routine cytology test, or when they turned 25, whichever was later.
Status of indicator
WHO target: no target set
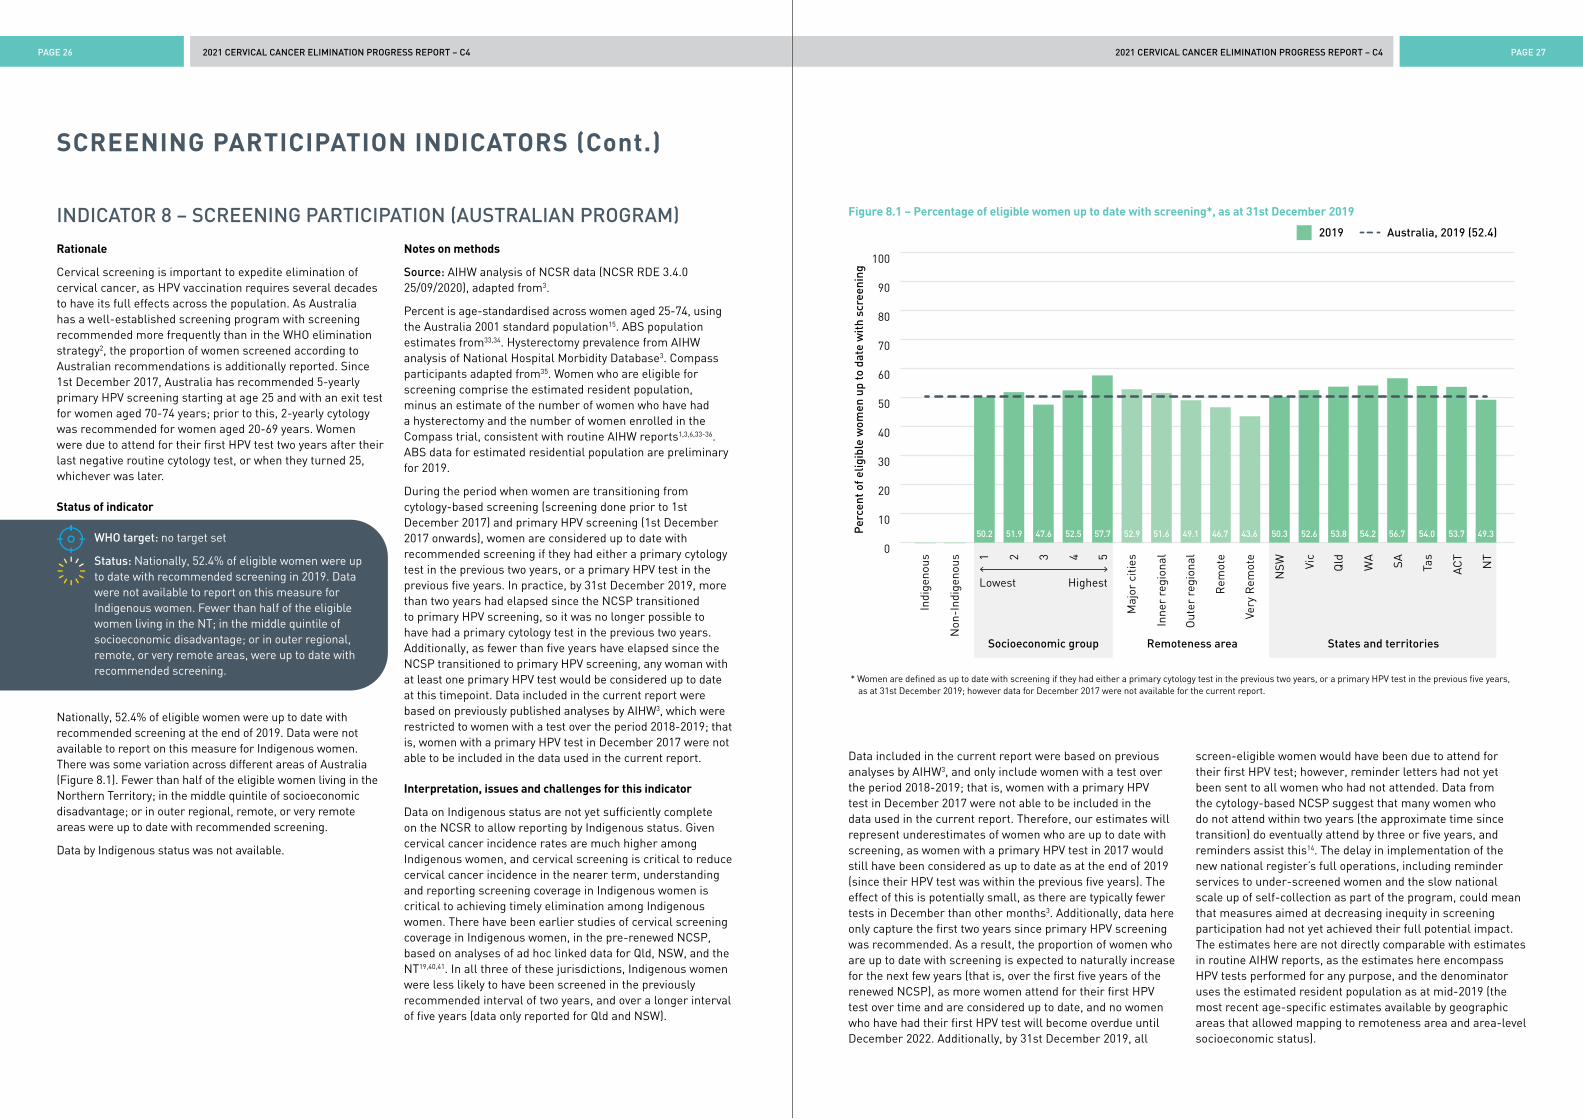
Status: Nationally, 52.4% of eligible women were up to date with recommended screening in 2019. Data were not available to report on this measure for Indigenous women. Fewer than half of the eligible women living in the NT; in the middle quintile of socioeconomic disadvantage; or in outer regional, remote, or very remote areas, were up to date with recommended screening.
Nationally, 52.4% of eligible women were up to date with recommended screening at the end of 2019. Data were not available to report on this measure for Indigenous women. There was some variation across different areas of Australia (Figure 8.1). Fewer than half of the eligible women living in the Northern Territory; in the middle quintile of socioeconomic disadvantage; or in outer regional, remote, or very remote areas were up to date with recommended screening.
Data by Indigenous status was not available.
Notes on methods
Source: AIHW analysis of NCSR data (NCSR RDE 3.4.0 25/09/2020), adapted from3.
Percent is age-standardised across women aged 25-74, using the Australia 2001 standard population15. ABS population estimates from33,34. Hysterectomy prevalence from AIHW analysis of National Hospital Morbidity Database3. Compass participants adapted from35. Women who are eligible for screening comprise the estimated resident population, minus an estimate of the number of women who have had a hysterectomy and the number of women enrolled in the Compass trial, consistent with routine AIHW reports1,3,6,33-36. ABS data for estimated residential population are preliminary for 2019.
During the period when women are transitioning from cytology-based screening (screening done prior to 1st December 2017) and primary HPV screening (1st December 2017 onwards), women are considered up to date with recommended screening if they had either a primary cytology test in the previous two years, or a primary HPV test in the previous five years. In practice, by 31st December 2019, more than two years had elapsed since the NCSP transitioned to primary HPV screening, so it was no longer possible to have had a primary cytology test in the previous two years. Additionally, as fewer than five years have elapsed since the NCSP transitioned to primary HPV screening, any woman with at least one primary HPV test would be considered up to date at this timepoint. Data included in the current report were based on previously published analyses by AIHW3, which were restricted to women with a test over the period 2018-2019; that is, women with a primary HPV test in December 2017 were not able to be included in the data used in the current report.
Interpretation, issues and challenges for this indicator
Data on Indigenous status are not yet sufficiently complete on the NCSR to allow reporting by Indigenous status. Given cervical cancer incidence rates are much higher among Indigenous women, and cervical screening is critical to reduce cervical cancer incidence in the nearer term, understanding and reporting screening coverage in Indigenous women is critical to achieving timely elimination among Indigenous women. There have been earlier studies of cervical screening coverage in Indigenous women, in the pre-renewed NCSP, based on analyses of ad hoc linked data for Qld, NSW, and the NT19,40,41. In all three of these jurisdictions, Indigenous women were less likely to have been screened in the previously recommended interval of two years, and over a longer interval of five years (data only reported for Qld and NSW).
Data included in the current report were based on previous analyses by AIHW3, and only include women with a test over the period 2018-2019; that is, women with a primary HPV test in December 2017 were not able to be included in the data used in the current report. Therefore, our estimates will represent underestimates of women who are up to date with screening, as women with a primary HPV test in 2017 would still have been considered as up to date as at the end of 2019 (since their HPV test was within the previous five years). The effect of this is potentially small, as there are typically fewer tests in December than other months3. Additionally, data here only capture the first two years since primary HPV screening was recommended. As a result, the proportion of women who are up to date with screening is expected to naturally increase for the next few years (that is, over the first five years of the renewed NCSP), as more women attend for their first HPV test over time and are considered up to date, and no women who have had their first HPV test will become overdue until December 2022. Additionally, by 31st December 2019, all
screen-eligible women would have been due to attend for their first HPV test; however, reminder letters had not yet been sent to all women who had not attended. Data from the cytology-based NCSP suggest that many women who do not attend within two years (the approximate time since transition) do eventually attend by three or five years, and reminders assist this14. The delay in implementation of the new national register’s full operations, including reminder services to under-screened women and the slow national scale up of self-collection as part of the program, could mean that measures aimed at decreasing inequity in screening participation had not yet achieved their full potential impact. The estimates here are not directly comparable with estimates in routine AIHW reports, as the estimates here encompass HPV tests performed for any purpose, and the denominator uses the estimated resident population as at mid-2019 (the most recent age-specific estimates available by geographic areas that allowed mapping to remoteness area and area-level socioeconomic status).
* Women are defined as up to date with screening if they had either a primary cytology test in the previous two years, or a primary HPV test in the previous five years, as at 31st December 2019; however data for December 2017 were not available for the current report.
Figure 8.1 – Percentage of eligible women up to date with screening*, as at 31st December 2019
0
10
20
30
40
50
60
70
80
90
100
Indi
geno
us
Non
-Ind
igen
ous
Per
cent
of e
ligib
le w
omen
up
to d
ate
wit
h sc
reen
ing
Maj
or c
ities
Inne
r re
gion
al
Out
er r
egio
nal
Rem
ote
Very
Rem
ote
NSW Vi
c
Qld
WA SA Tas
ACT
NT
Lowest Highest
Socioeconomic group
2019
Remoteness area States and territories
1 2 3 4 5
Australia, 2019 (52.4)
50.2 51.9 47.6 52.5 57.7 52.9 51.6 49.1 46.7 43.6 50.3 52.6 53.8 54.2 56.7 54.0 53.7 49.3
2021 CERVICAL CANCER ELIMINATION PROGRESS REPORT – C42021 CERVICAL CANCER ELIMINATION PROGRESS REPORT – C4PAGE 28 PAGE 29
TREATMENT UPTAKE INDICATORS
INDICATOR 9 – COLPOSCOPY ATTENDANCE
Rationale
In Australia, assessment by colposcopic examination of the cervix is an integral part of the diagnostic pathway once a person is deemed to be at a sufficient underlying risk of a high-grade cervical abnormality through the screening process. Factors that may impact an individual’s ability to follow the screening pathway through to diagnostic assessment include whether they received and understand their screening result, understand the need for further assessment and are referred in a timely way, their ability to access colposcopy (service availability, cost, transport, time) and the acceptability of the procedure to that person. Australia’s cervical screening registries have long played a role as a safety net to support participant and clinician’s awareness of results requiring further follow up through systematic reminders and escalating alerts where the recommended pathway has not been followed. Assessment at colposcopy is necessary to identify lesions (via biopsy of suspicious areas) requiring treatment, for which there is a 2030 WHO scale up target of 90% of identified lesions treated. High rates of colposcopy attendance in a timely way are needed to ensure that screening is effective in the Australian setting. Prior to the transition to HPV based screening in Australia, it was recognised that in the first screening round of the new program, a higher than historically observed rate of referral to colposcopy services would require services to scale up to meet this demand21.
Status of indicator
WHO target: no target set
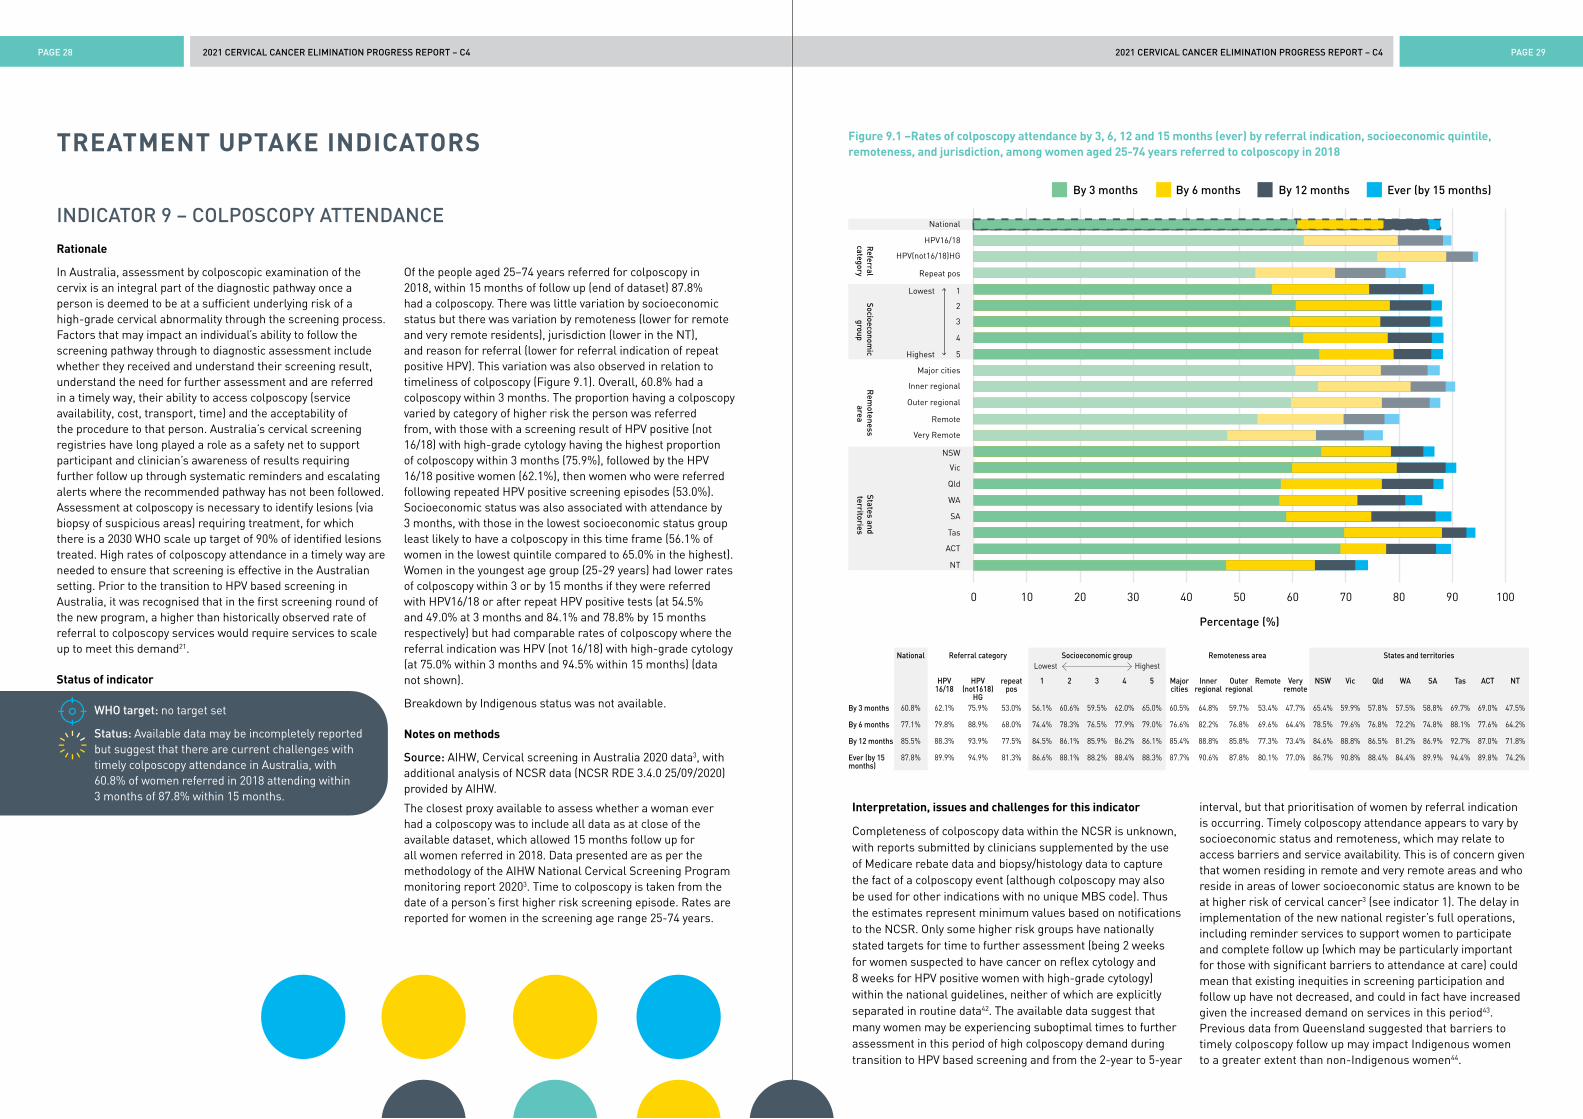
Status: Available data may be incompletely reported but suggest that there are current challenges with timely colposcopy attendance in Australia, with 60.8% of women referred in 2018 attending within 3 months of 87.8% within 15 months.
Of the people aged 25–74 years referred for colposcopy in 2018, within 15 months of follow up (end of dataset) 87.8% had a colposcopy. There was little variation by socioeconomic status but there was variation by remoteness (lower for remote and very remote residents), jurisdiction (lower in the NT), and reason for referral (lower for referral indication of repeat positive HPV). This variation was also observed in relation to timeliness of colposcopy (Figure 9.1). Overall, 60.8% had a colposcopy within 3 months. The proportion having a colposcopy varied by category of higher risk the person was referred from, with those with a screening result of HPV positive (not 16/18) with high-grade cytology having the highest proportion of colposcopy within 3 months (75.9%), followed by the HPV 16/18 positive women (62.1%), then women who were referred following repeated HPV positive screening episodes (53.0%). Socioeconomic status was also associated with attendance by 3 months, with those in the lowest socioeconomic status group least likely to have a colposcopy in this time frame (56.1% of women in the lowest quintile compared to 65.0% in the highest). Women in the youngest age group (25-29 years) had lower rates of colposcopy within 3 or by 15 months if they were referred with HPV16/18 or after repeat HPV positive tests (at 54.5% and 49.0% at 3 months and 84.1% and 78.8% by 15 months respectively) but had comparable rates of colposcopy where the referral indication was HPV (not 16/18) with high-grade cytology (at 75.0% within 3 months and 94.5% within 15 months) (data not shown).
Breakdown by Indigenous status was not available.
Notes on methods
Source: AIHW, Cervical screening in Australia 2020 data3, with additional analysis of NCSR data (NCSR RDE 3.4.0 25/09/2020) provided by AIHW.
The closest proxy available to assess whether a woman ever had a colposcopy was to include all data as at close of the available dataset, which allowed 15 months follow up for all women referred in 2018. Data presented are as per the methodology of the AIHW National Cervical Screening Program monitoring report 20203. Time to colposcopy is taken from the date of a person’s first higher risk screening episode. Rates are reported for women in the screening age range 25-74 years.
Figure 9.1 –Rates of colposcopy attendance by 3, 6, 12 and 15 months (ever) by referral indication, socioeconomic quintile, remoteness, and jurisdiction, among women aged 25-74 years referred to colposcopy in 2018
Interpretation, issues and challenges for this indicator
Completeness of colposcopy data within the NCSR is unknown, with reports submitted by clinicians supplemented by the use of Medicare rebate data and biopsy/histology data to capture the fact of a colposcopy event (although colposcopy may also be used for other indications with no unique MBS code). Thus the estimates represent minimum values based on notifications to the NCSR. Only some higher risk groups have nationally stated targets for time to further assessment (being 2 weeks for women suspected to have cancer on reflex cytology and 8 weeks for HPV positive women with high-grade cytology) within the national guidelines, neither of which are explicitly separated in routine data42. The available data suggest that many women may be experiencing suboptimal times to further assessment in this period of high colposcopy demand during transition to HPV based screening and from the 2-year to 5-year
interval, but that prioritisation of women by referral indication is occurring. Timely colposcopy attendance appears to vary by socioeconomic status and remoteness, which may relate to access barriers and service availability. This is of concern given that women residing in remote and very remote areas and who reside in areas of lower socioeconomic status are known to be at higher risk of cervical cancer3 (see indicator 1). The delay in implementation of the new national register’s full operations, including reminder services to support women to participate and complete follow up (which may be particularly important for those with significant barriers to attendance at care) could mean that existing inequities in screening participation and follow up have not decreased, and could in fact have increased given the increased demand on services in this period43. Previous data from Queensland suggested that barriers to timely colposcopy follow up may impact Indigenous women to a greater extent than non-Indigenous women44.
0 10 20 30 40 50 60 70 80 90 100
1
2
3
4
5
Lowest
Highest
National
HPV16/18
HPV(not16/18)HG
Repeat pos
Socioeconomic
groupR
eferralcategory
Major cities
Inner regional
Outer regional
Remote
Very Remote
Rem
oteness area
NSW
Vic
Qld
SA
WA
Tas
ACT
NT
States and territories
By 6 months
Percentage (%)
By 12 months Ever (by 15 months)By 3 months
National Referral category Socioeconomic group Lowest Highest
Remoteness area States and territories
HPV 16/18
HPV (not1618)
HG
repeat pos
1 2 3 4 5 Major cities
Inner regional
Outer regional
Remote Very remote
NSW Vic Qld WA SA Tas ACT NT
By 3 months 60.8% 62.1% 75.9% 53.0% 56.1% 60.6% 59.5% 62.0% 65.0% 60.5% 64.8% 59.7% 53.4% 47.7% 65.4% 59.9% 57.8% 57.5% 58.8% 69.7% 69.0% 47.5%
By 6 months 77.1% 79.8% 88.9% 68.0% 74.4% 78.3% 76.5% 77.9% 79.0% 76.6% 82.2% 76.8% 69.6% 64.4% 78.5% 79.6% 76.8% 72.2% 74.8% 88.1% 77.6% 64.2%
By 12 months 85.5% 88.3% 93.9% 77.5% 84.5% 86.1% 85.9% 86.2% 86.1% 85.4% 88.8% 85.8% 77.3% 73.4% 84.6% 88.8% 86.5% 81.2% 86.9% 92.7% 87.0% 71.8%
Ever (by 15 months)
87.8% 89.9% 94.9% 81.3% 86.6% 88.1% 88.2% 88.4% 88.3% 87.7% 90.6% 87.8% 80.1% 77.0% 86.7% 90.8% 88.4% 84.4% 89.9% 94.4% 89.8% 74.2%
2021 CERVICAL CANCER ELIMINATION PROGRESS REPORT – C42021 CERVICAL CANCER ELIMINATION PROGRESS REPORT – C4PAGE 30 PAGE 31
TREATMENT UPTAKE INDICATORS (Cont.)
INDICATOR 10 – HIGH-GRADE CERVICAL DISEASE TREATMENT RATES
Rationale
Cervical screening is important to expedite elimination of cervical cancer, as it will take decades for the impact of HPV vaccination to be reflected in overall cervical cancer incidence2,30. For screening to prevent cervical cancer, treatment of screen-detected high-grade abnormalities is essential.
A target has been set in the WHO strategy to accelerate elimination of cervical cancer5 for treatment of women with identified disease.
Status of indicator
WHO 2030 target: 90% of women with identified precancer are treated.
Status: No routine data available to support this indicator.
It was not possible to obtain sufficiently complete date from the NCSR to report on this indicator in the current report. Routine NCSP monitoring reports3,45 do not include an indicator for treatment of high-grade abnormalities, so could not be used as an interim measure for this report.
Notes on methods
High-grade abnormality is defined as HSIL NOS (S3.1), HSIL-CIN2 (S3.2), HSIL-CIN3 (S3.3), or AIS (E3.2, E3.3); a record of ablative or excisional treatment is identified through either colposcopy or histology records. Date of diagnosis is defined as the biopsy sample collection date and allows for treatment on the same date as biopsy.
This indicator will in future report on the proportion of women with a biopsy sample confirming a high-grade abnormality, who have a record of treatment within 8 weeks, 6 months, and 12 months of their diagnosis data.
Interpretation, issues and challenges for this indicator
Routinely published data are not available for reporting against this WHO indicator, so reporting relies on additional data requests, and on sufficiently complete reporting and recording of histology and colposcopy data on the NCSR. Sufficiently complete data were not available for inclusion in this report. It is considered likely that most women do receive treatment for a biopsy proven high-grade abnormality in Australia, in the context of the registry infrastructure which provides a safety net to alert women and their clinicians where a recommended pathway has not been completed and national linked data showing that most cervical cancer occurs in never or under screened women32,46.
The proportion of women treated will be reported for multiple timeframes. The 2030 WHO target does not stipulate a timeframe over which to measure whether treatment has occurred, so it is not clear to which of these timeframes the 90% target should apply. We will present results at multiple timepoints to enable better visibility of whether treatment does eventually occur (by 12 months) as well as whether it occurs in a shorter timeframe, more consistent with best practice (8 weeks; 6 months).
INDICATOR 11 – CERVICAL CANCER TREATMENT RATES
Rationale
Management of invasive cervical cancer in accordance with accepted guidelines is important as the cervical cancer incidence nationally was 6.3 per 100,000 from 2011-20153 despite the national cervical screening program. With the full impact of HPV vaccination on cervical cancer incidence decades away, continued screening as well as optimal stage-appropriate treatment of cervical cancer remain vital to reduce the mortality from invasive cervical cancer.
Status of indicator
WHO 2030 target: Management of 90% of women with invasive cervical cancer.
Status: No routine national data available to support this indicator. Queensland data for 2011-2014 reported that 94% of women with invasive cervical cancer in metropolitan and regional areas and 92% of women in rural and remote areas received treatment (defined as at least one of hysterectomy, radiotherapy or chemotherapy). Other data available are from small, published studies. Although it is likely that over 90% of cervical cancer patients in Australia receive treatment, the available data suggests that there may be disparities in care for Indigenous women.
In Queensland, a Cancer Quality Index was developed to track progress in delivering safe, quality cancer care within health care services using State level linked data47,48. Between the periods 2005-2009 and 2010-2014, age adjusted cervical cancer treatment rates (defined as at least one of hysterectomy, radiotherapy or chemotherapy) rose to over 90% regardless of area of residence (Table 11.1). Treatment rates were stable for cervical cancer using hysterectomy and radiotherapy and rose for IV systemic therapy (chemotherapy). Whilst the proportion of cervical cancer patients receiving multidisciplinary team review rose considerably, the number of patients receiving treatment within 30 days of diagnosis fell from 39% to 30%. In the 2010-2014 period, there was a large disparity in the proportion of patients receiving treatment within 30 days by use of public vs private facilities but no differences by remoteness or older age. The rate of treatment within 30 days was 24% for all Indigenous patients, compared to 21% and 51% for Non-Indigenous patients treated in public and private hospitals respectively. There was no difference in the proportion of patients treated within 30 days by socioeconomic status in public hospitals but there was a gradient observed in private hospitals. (Table 11.1)
A study of 385 women undergoing first treatment for diagnosed cervical cancer, between 1999-2008 at the Royal Women’s Hospital (RWH), a tertiary referral centre in Melbourne, compared observed treatment rates with modelled optimal treatment rates49. Optimal treatment was based on guidelines synthesised from local recommendations and international guidelines. As shown in Table 11.2, rates of surgery matched those predicted as the optimal rate, whereas rates of radiotherapy, chemotherapy and chemoradiotherapy were lower than predicted as optimal. A second study examined 105 women diagnosed with cervical cancer receiving care in public hospitals in Queensland between 1998–2004, to determine if being Indigenous and/or other factors were associated with receiving suboptimal care50, based on local clinical guidelines51. Indigenous women had seven times the odds of receiving suboptimal care than non-Indigenous women (unadjusted odds ratio [OR] 7.1, 95% confidence interval [CI] 1.5-33.3; OR 5.7, 95%CI 1.2-27.3 adjusted for stage)50 (Figure 11.1). Barriers for Indigenous women receiving gynaecological cancer care include difficulties accessing treatment, feeling disempowered, lack of culturally appropriate information, lack of financial and other supports, and cultural insensitivities52.

2021 CERVICAL CANCER ELIMINATION PROGRESS REPORT – C42021 CERVICAL CANCER ELIMINATION PROGRESS REPORT – C4PAGE 32 PAGE 33
Table 11.2 – The estimated percentage of patients with cervical cancer who should receive each treatment type according to the guidelines, compared with the observed rates from a pattern of care study at the Royal Women’s Hospital , Melbourne in 1999-200849
Table 11.1 – Selected measures from the Cancer Quality Index for women diagnosed with invasive cervical cancer, Queensland 2005-201447,48
FIGO stage** Baseline % (95% credible interval)
Surgery Radiotherapy Chemotherapy Chemo-radiotherapy
Optimal rates Observed rates Optimal rates Observed rates Optimal rates Observed rates Optimal rates Observed rates
Overall 63 (61–64) 63 (60–65) 52 (53–56) 49 (46–52) 36 (35–38) 27 (24–30) 36 (35–38) 25 (21–28)
IA1 98 (96–100) 99 (95–100) 2 (1–6) 1 (0–5) 0 (0–0) 0 (0–0) 0 (0–0) 0 (0–0)
IA2 100 (95–100) 100 (95–100) 0 (1–6) 0 (0–5) 0 (0–0) 0 (0–0) 0 (0–0) 0 (0–0)
IB-IIA (Overall) 81 (79–85) 77 (72–81) 52 (51–58) 52 (47–57) 19 (17–23) 22 (18–28) 19 (17–23) 20 (16–25)
IB-IIA (<4 cm) 100 (99–100) 89 (85–92) 35 (34–40) 40 (36–46) 0 (0–0) 13 (10–18) 0 (0–0) 11 (8–15)
IB-IIA (>4 cm) 28 (27–34) 43 (35–50) 100 (100–100) 84 (74–90) 72 (68–75) 48 (36–58) 72 (68–75) 48 (36–58)
IIB-IVA 0 (0–0) 9 (7–11) 100 (100–100) 87 (84–91) 100 (97–99) 60 (50–69) 100 (97–99) 56 (45–66)
IVB 0 (0–0) 0 (0–0) 100 (100–100) 80 (30–98) 50 (50–50) 40 (15–49) 50 (50–50) 40 (15–49)
Period 2005-2009 Period 2010-2014
Overall cervical cancer treatment rate*
Metropolitan 93% 94%
Regional 86% 94%
Rural and remote 89% 92%
Rate by treatment type
Hysterectomy 37% (median length of stay 5 days)
37% (median length of stay 3 days)
Radiotherapy 47% 48%
IV systemic therapy 30% 40%
Reviewed by multidisciplinary team** 2% 22%
Receipt of treatment within 30 days of diagnosis 39% 30%
Public hospitals 32% 21%
Private hospitals 53% 50%
By remoteness
Metropolitan 41% 30%
Regional 37% 30%
Rural and remote 36% 31%
By older age
<75 years 39% 30%
75 years or older 50% 29%
By Indigenous status
All Indigenous 27% 24%
Non-Indigenous public hospital 33% 21%
Non-Indigenous private hospital 53% 51%
By socioeconomic status***
Public hospital
Disadvantaged 28% 25%
Middle 34% 19%
Affluent 38% 23%
Private hospital
Disadvantaged 60% 39%
Middle 52% 50%
Affluent 54% 58%
** FIGO (International Federation of Gynecology and Obstetrics) stage refers to how far a cancer has spread at diagnosis. Stage I cancers are confined to the cervix, Stage 2 extend beyond the cervix but not into the pelvic wall, Stage 3 into the pelvic wall and Stage 4 beyond the pelvis. Details of current FIGO cervical cancer staging can be found in Bhatla et al 201853.
* At least one of hysterectomy, radiotherapy or systemic IV therapy (chemotherapy)** Known to be incompletely captured. *** Lowest quintile labelled as disadvantaged, middle three quintiles as middle and highest quintile
as affluent as per source report.
TREATMENT UPTAKE INDICATORS (Cont.)
Figure 11.1 – Percentage of women who received suboptimal care in 105 women diagnosed with cervical cancer in Queensland between 1998-200450
0
10
20
30
40
50
60
70
80
90
100
Indi
geno
us
Ove
rall
Non
-Ind
igen
ous
Per
cent
of w
omen
who
rec
ieve
d su
bopt
imal
trea
tmen
t
Loca
lised
Reg
iona
l/di
stan
t
14 23 4 7 24
2021 CERVICAL CANCER ELIMINATION PROGRESS REPORT – C42021 CERVICAL CANCER ELIMINATION PROGRESS REPORT – C4PAGE 34 PAGE 35
TREATMENT UPTAKE INDICATORS (Cont.)
Notes on methods
Source: There are no routinely published national data available reporting cervical cancer treatment rates. Therefore, data presented are from State level linked data (the Queensland Oncology Repository links patient data from the Queensland Cancer Register, Queensland Hospital Admitted Data Collection, on surgery, radiation therapy, and IV systemic therapy and data collected from multidisciplinary team meetings primarily in the public sector)47,48 and two small, published studies49,50.
Interpretation, issues and challenges for this indicator
Identification of suitable data sources and development of a methodology to routinely report treatment rates or ideally (as undertaken in the two in-depth studies detailed here) optimal care treatment rates, are now required in order for Australia to report against current practice and monitor against the WHO 2030 scale up treatment indicator.
Although it is likely that over 90% of cervical cancer patients in Australia receive treatment, and the Queensland data provide a notable precedent for both feasible methods and the importance of monitoring cancer care data, the available data suggests that it is not always optimal, and that there may be disparities in care for Indigenous women. Overall cervical cancer survival data for Australia show minor improvements over time, rising between the periods 1986-1990 and 2011-2015 from 69.5% to 73.5% 5-year relative survival54. Australian survival is in the higher range of international benchmarks, which generally show a range in 5-year survival between 50-70%55. However notably, consistent with the treatment data reported here, survival data also show disparities by Indigenous status, socioeconomic status and remoteness, which may be partially explained by diagnosis at a later stage14,46,56,57. Access to treatment and to culturally appropriate treatment may be substantial barriers for some patients58. It is unknown how many patients in Australia currently receive cervical cancer care in a tertiary referral centre or according to the optimal care pathway for cervical cancer59 which includes care informed by a multidisciplinary team.
Whilst some tertiary gynaeoncology centres do routinely publish numbers of cervical cancer patients seen, stage, demographics and some quality indicators60,61, particular challenges in developing a national method for monitoring cervical treatment rates and proportion receiving optimal care include:
1. Lack of collection of consistent staging information across cancer registries at a State and Territory level and delay in national cancer incidence data reporting
2. Lack of explicit national level guidelines for the treatment of cervical cancer against which to determine if optimal treatment by stage is being received
3. Lack of availability of existing national and State level linked data sets to map optimal care pathways against including cancer registry data, hospitalisation data, primary care data, palliative care data, MBS/PBS data, and radiotherapy data
Encouragingly the National Gynae-Oncology Registry, a clinical quality registry (https://ngor.org.au), is aiming to eventually invite all newly diagnosed cervical cancer patients to participate and may, in doing so, overcome many of the key barriers identified above62. This initiative may help facilitate the development of a high-quality measure to monitor cervical cancer treatment over time. Such a measure is required in order to identify and address any deficiencies and ensure optimal care is delivered equitably to cervical cancer patients across Australia.
1. Canfell K, Saville M, Caruana M, et al. Protocol for Compass: a randomised controlled trial of primary HPV testing versus cytology screening for cervical cancer in HPV-unvaccinated and vaccinated women aged 25-69 years living in Australia. BMJ open 2018; 8(1): e016700.
2. World Health Organization. Global strategy to accelerate the elimination of cervical cancer as a public health problem. 2020. Available at: https://www.who.int/publications/i/item/9789240014107.
3. Australian Institute of Health and Welfare. National Cervical Screening Program monitoring report 2020. Cancer series 130. Cat. no. CAN 138. Canberra: AIHW, 2020.
4. Hall MT, Simms KT, Lew JB, et al. The projected timeframe until cervical cancer elimination in Australia: a modelling study. Lancet Public Health 2019; 4(1): e19-e27.
5. Australian Bureau of Statistics. Socio-Economic Indexes for Areas (SEIFA). ABS Catalogue no. 2033.0.55.001. Canberra, 2013. Available at: https://www.abs.gov.au/AUSSTATS/[email protected]/DetailsPage/2033.0.55.0012016?OpenDocument.
6. Australian Bureau of Statistics. 1270.0.55.006 - Australian Statistical Geography Standard (ASGS): Correspondences, July 2011 2012 2013. Statistical Area Level 2 2011 to Remoteness Area 2011, Postcode 2012 to Remoteness Area 2011].Available at: https://www.abs.gov.au/AUSSTATS/[email protected]/DetailsPage/1270.0.55.006July%202011?OpenDocument.
7. Australian Bureau of Statistics. 1270.0.55.001 - Australian Statistical Geography Standard (ASGS): Volume 1 - Main Structure and Greater Capital City Statistical Areas, July 2016 2016. Correspondence, 2011 Statistical Area Level 2 to 2016 Statistical Area Level 2]. Available from: https://www.abs.gov.au/AUSSTATS/[email protected]/DetailsPage/1270.0.55.001July%202016?OpenDocument
8. Hall MT, Simms KT, Lew JB, et al. Projected future impact of HPV vaccination and primary HPV screening on cervical cancer rates from 2017-2035: Example from Australia. PLoS One 2018; 13(2): e0185332.
9. Lei J, Ploner A, Elfstrom KM, et al. HPV Vaccination and the Risk of Invasive Cervical Cancer. New England Journal of Medicine 2020; 383(14): 1340-8.
10. Brisson M, Benard E, Drolet M, et al. Population-level impact, herd immunity, and elimination after human papillomavirus vaccination: a systematic review and meta-analysis of predictions from transmission-dynamic models. Lancet Public Health 2016; 1(1): e8-e17.
11. Victorian Cancer Registry. Cancer in Victoria: Statistics & Trends 2019. Cancer Council Victoria, Melbourne, Victoria 2020. Available at: https://www.cancervic.org.au/downloads/cec/cancer-in-vic/Cancer-in-Victoria-statistics-and-trends-2019.pdf
12. Brotherton JM, Fridman M, May CL, et al. Early effect of the HPV vaccination programme on cervical abnormalities in Victoria, Australia: an ecological study. Lancet 2011; 377(9783): 2085-92.
13. Brotherton JM, Gertig DM, May C, et al. HPV vaccine impact in Australian women: ready for an HPV-based screening program. Medical Journal of Australia 2016; 204(5): 184-e1.
14. Australian Institute of Health and Welfare. Cervical screening in Australia 2019. Cancer series no. 123. Cat. no. CAN 124. Canberra, 2019.
15. Australian Bureau of Statistics. Australia 2001 Standard Population for Use in Age-Standardisation. 2003. AvaiLable at: https://www.abs.gov.au/AUSSTATS/[email protected]/DetailsPage/3101.0Mar%202013?OpenDocument
16. Canfell K, Caruana M, Gebski V, et al. Cervical screening with primary HPV testing or cytology in a population of women in which those aged 33 years or younger had previously been offered HPV vaccination: Results of the Compass pilot randomised trial. PLoS Medicine 2017; 14(9): e1002388.
17. Li M, Roder D, Whop LJ, et al. Aboriginal women have a higher risk of cervical abnormalities at screening; South Australia, 1993-2016. Journal of Medical Screening 2019; 26(2): 104-12.
18. Whop LJ, Baade P, Garvey G, et al. Cervical Abnormalities Are More Common among Indigenous than Other Australian Women: A Retrospective Record-Linkage Study, 2000-2011. PLoS One 2016; 11(4): e0150473.
19. Zhang X, Condon J. Cancer screening in the Northern Territory 2019. Department of Health, Darwin, 2019. Available at: https://digitallibrary.health.nt.gov.au/prodjspui/handle/10137/7938
20. Brotherton JM, Budd A, Rompotis C, et al. Is one dose of human papillomavirus vaccine as effective as three?: A national cohort analysis. Papillomavirus Research 2019; 8: 100177.
21. Smith MA, Gertig D, Hall M, et al. Transitioning from cytology-based screening to HPV-based screening at longer intervals: implications for resource use. BMC Health Services Research 2016; 16: 147.
22. Brotherton JM, Hawkes D, Sultana F, et al. Age-specific HPV prevalence among 116,052 women in Australia’s renewed cervical screening program: A new tool for monitoring vaccine impact. Vaccine 2019; 37(3): 412-6.
23. Machalek DA, Garland SM, Brotherton JML, et al. Very Low Prevalence of Vaccine Human Papillomavirus Types Among 18- to 35-Year Old Australian Women 9 Years Following Implementation of Vaccination. The Journal of Infectious Diseases 2018; 217(10): 1590-600.
REFERENCES
2021 CERVICAL CANCER ELIMINATION PROGRESS REPORT – C42021 CERVICAL CANCER ELIMINATION PROGRESS REPORT – C4PAGE 36 PAGE 37
24. Garland SM, Brotherton JM, Condon JR, et al. Human papillomavirus prevalence among indigenous and non-indigenous Australian women prior to a national HPV vaccination program. BMC Medicine 2011; 9: 104.
25. McGregor S, Saulo D, Brotherton JML, et al. Decline in prevalence of human papillomavirus infection following vaccination among Australian Indigenous women, a population at higher risk of cervical cancer: The VIP-I study. Vaccine 2018; 36(29): 4311-6.
26. Machalek D, Shilling H. Human papillomavirus prevalence in women attending health services across Australia 2015–2018: Short Report, Melbourne: The Royal Women’s Hospital; 2019. Available at: https://www.hpvimpact.com.au/wp-content/uploads/2019/10/IMPACT-Final-Report_Females_2015-2018.pdf
27. Simms KT, Steinberg J, Caruana M, et al. Impact of scaled up human papillomavirus vaccination and cervical screening and the potential for global elimination of cervical cancer in 181 countries, 2020-99: a modelling study. Lancet Oncology 2019; 20(3): 394-407.
28. Bruni L, Saura-Lazaro A, Montoliu A, et al. HPV vaccination introduction worldwide and WHO and UNICEF estimates of national HPV immunization coverage 2010-2019. Preventive Medicine 2020: 106399.
29. National Centre for Immunisation Research and Surveillance (NCIRS). Impact evaluation of Australian national human papillomavirus vaccination program. Feb 2021. Available at https://www.ncirs.org.au/reports
30. Brisson M, Kim JJ, Canfell K, et al. Impact of HPV vaccination and cervical screening on cervical cancer elimination: a comparative modelling analysis in 78 low-income and lower-middle-income countries. Lancet 2020; 395(10224): 575-90.
31. Burger EA, Smith MA, Killen J, et al. Projected time to elimination of cervical cancer in the USA: a comparative modelling study. Lancet Public Health, 2020. 5(4): p. e213-e222.
32. Australian Institute of Health and Welfare. Analysis of cervical cancer and abnormality outcomes in an era of cervical screening and HPV vaccination in Australia. Cancer series no. 126. Cat. no. CAN 129. Canberra, 2019.
33. Australian Bureau of Statistics. 3101.0 - Australian Demographic Statistics, Jun 2019. 2019. Available at: https://www.abs.gov.au/AUSSTATS/[email protected]/DetailsPage/3101.0Jun%202019?OpenDocument
34. Australian Bureau of Statistics. Population Projections, Australia, 2017-2066. 2020. [cited 2021 4th March 2021]; ERP by SA2 (ASGS 2016), Age and Sex, 2001 Onwards]. Available from: http://stat.data.abs.gov.au/Index.aspx?DataSetCode=POP_PROJ_2011#
35. Smith MA, Hall MT, Simms KT, et al. Modelled analysis of hypothetical impacts of COVID-19 related disruptions to the National Cervical Screening Program. 12th October 2020 2020. Available at: https://www.health.gov.au/resources/publications/modelled-analysis-of-hypothetical-impacts-of-covid-19-related-disruptions-to-the-national-cervical-screening-program
36. Australian Bureau of Statistics. SEIFA by Local Government Area (LGA) 2018. [cited 2021 4th March 2021]; SEIFA 2016 by Statistical Area 2, SEIFA 2016 by Postal Area (POA)]. Available from http://stat.data.abs.gov.au/Index.aspx?DataSetCode=ABS_SEIFA_LGA#
37. Smith M, Lew JB, Simms K, et al. Impact of HPV sample self-collection for underscreened women in the renewed Cervical Screening Program. Medical Journal of Australia 2016; 204(5): 194e1-e9.
38. Sankaranarayanan R, Nene BM, Shastri SS, et al. HPV screening for cervical cancer in rural India. New England Journal of Medicine 2009; 360(14): 1385-94.
39. Canfell K, Kim JJ, Brisson M, et al. Mortality impact of achieving WHO cervical cancer elimination targets: a comparative modelling analysis in 78 low-income and lower-middle-income countries. Lancet 2020; 395(10224): 591-603.
40. Whop LJ, Garvey G, Baade P, et al. The first comprehensive report on Indigenous Australian women’s inequalities in cervical screening: A retrospective registry cohort study in Queensland, Australia (2000–2011). Cancer 2016; 122(10): 1560-9.
41. Dasgupta P, Cramb S, Baade P, et al. Regional variation in cervical cancer screening participation & outcomes among Aboriginal and non-Aboriginal Australian women: New South Wales (2006-2013). 2018. Available at: https://apo.org.au/node/258511
42. Cancer Council Australia Cervical Cancer Screening Guidelines Working Party. National Cervical Screening Program: Guidelines for the management of screen-detected abnormalities, screening in specific populations and investigation of abnormal vaginal bleeding. Sydney: Cancer Council Australia. [Version URL: https://wiki.cancer.org.au/australiawiki/index.php?oldid=214429]. Available from: https://wiki.cancer.org.au/australia/Guidelines:Cervical_cancer/Screening
43. Smith M, Hammond I, Saville M. Lessons from the renewal of the National Cervical Screening Program in Australia. Public Health Research and Practice 2019; 29(2).
44. Whop LJ, Baade PD, Brotherton JM, et al. Time to clinical investigation for Indigenous and non-Indigenous Queensland women after a high-grade abnormal Pap smear, 2000-2009. Medical Journal of Australia 2017; 206(2): 73-7.
45. Australian Institute of Health and Welfare (AIHW) 2017. National Cervical Screening Program data dictionary. Version 1.0. Cancer series no. 103. Cat. no. CAN 102. Canberra: AIHW.
46. Australian Institute of Health and Welfare 2018. Analysis of cancer outcomes and screening behaviour for national cancer screening programs in Australia. Cancer series no. 111. Cat. no. CAN 115. Canberra: AIHW.
47. Queensland Government. Queensland Cancer Quality Index: Indicators of safe, quality cancer care. Cancer care in Public and Private Hospitals 2005-2014. Queensland Health, Brisbane, 2017. Available at https://cancerallianceqld.health.qld.gov.au/media/1593/queensland-cancer-quality-index-2005-2014.pdf
48. Walpole ET, Theile DE, Philpot S, et al, Cancer Alliance Queensland. Development and Implementation of a Cancer Quality Index in Queensland, Australia: A Tool for Monitoring Cancer Care. Journal of Oncology Practice 2019; 15:7, e636-e643.
49. Kang Y-J, O’Connell DL, Tan J, et al. Optimal uptake rates for initial treatments for cervical cancer in concordance with guidelines in Australia and Canada: Results from two large cancer facilities. Cancer Epidemiology 2015; 39(4): 600-11.
50. Whop LJ, Bernardes CM, Kondalsamy-Chennakesavan S, et al. Indigenous Australians with non-small cell lung cancer or cervical cancer receive suboptimal treatment. Asia-Pacific Journal of Clinical Oncology 2017; 13(5): e224-e31.
51. Greater Metropolitan Clinical Taskforce. NSW Department of Health. Best Clinical Practice Gynaecological Practice 2009. Sydney. 2009.
52. Marcusson-Rababi B, Anderson K, Whop LJ, et al. Does gynaecological cancer care meet the needs of Indigenous Australian women? Qualitative interviews with patients and care providers. BMC Health Services Research 2019; 19(1): 606.
53. Bhatla N, Berek JS, Cuello Fredes M, et al. Revised FIGO staging for carcinoma of the cervix uteri. International Journal of Gynaecology & Obstetrics 2019; 145(1): 129-35.
54. Australian Institute of Health and Welfare 2019. Cancer in Australia 2019. Cancer series no.119. Cat. no. CAN 123. Canberra: AIHW.
55. Allemani C, Matsuda T, Di Carlo V, et al. Global surveillance of trends in cancer survival 2000-14 (CONCORD-3): analysis of individual records for 37 513
025 patients diagnosed with one of 18 cancers from 322 population-based registries in 71 countries. Lancet. 2018; 391(10125): 1023-75.
56. Diaz A, Moore SP, Martin JH, et al. Factors associated with cancer-specific and overall survival among Indigenous and non-Indigenous gynecologic cancer patients in Queensland, Australia: a matched cohort study. International Journal of Gynecological Cancer 2015; 25(3): 542-7.
57. Diaz A, Baade PD, Valery PC, et al. Comorbidity and cervical cancer survival of Indigenous and non-Indigenous Australian women: A semi-national registry-based cohort study (2003-2012). PLoS One 2018; 13(5): e0196764.
58. Anderson K, Diaz A, Parikh DR, et al. Accessibility of cancer treatment services for Indigenous Australians in the Northern Territory: perspectives of patients and care providers. BMC Health Services Research 2021; 21(1): 95.
59. National Cancer Expert Reference Group(NCERG). Optimal care pathway for women with cervical cancer 2020. Available at: https://www.cancervic.org.au/downloads/resources/booklets/Optimal%20care%20pathway%20for%20women%20with%20cervical%20cancer.pdf.
60. Department of Gynaecological Oncology Annual Report 2019. Westmead Hospital, Western Sydney Local Health District. Available at: Avaiable at: https://www.anzgog.org.au/wp-content/uploads/2020/04/ANZGOG_AnnualReport2019_Final_Web_Apr2020.pdf
61. Gynaecology Tumour Stream 2016-2019 Triennial Report. March 2020. Melbourne, Victoria. Gynaecology Tumour Stream at Parkville, incorporating RWH, Peter Maccallum Cancer Centre, RMH and Sunshine Hospital.
62. Heriot N, Brand A, Cohen P, et al. Developing an Australian multi-module clinical quality registry for gynaecological cancers: a protocol paper. BMJ Open 2020; 10(2): e034579.

THE PATHWAY TO CERVICAL CANCER ELIMINATION IN AUSTRALIA
1989VCS created Australia’s first cervical screening register
2021Research: Australia could benefit by expanding the availability of HPV testing by self-collected sample within the NSCP
2015Research: Precancerous abnormalities have now dropped by 41% nationally in women aged 20-24 years
Evidence shows strong impact of HPV vaccination across all Australian women including indigenous women
2020World Health Organization launches global strategy for the elimination of cervical cancer as a public health problem. Australia played a key role in the development of the strategy.
2018Next generation nonavalent vaccine was introduced
Australian Immunisation Register incorporates HPV vaccination data from VCS HPV register
WHO: call for action toward achieving the global elimination of cervical cancer
2017Research: evidence demonstrates that primary HPV screening is more effective than cytology in Australia
NCSP shifts to HPV-based primary screening and introduces self-collection
2013Australia introduced vaccination for adolescent males
2011Research: Australian world first data shows a decline in precancerous cervical abnormalities
Research: Australian world first data shows a decline in HPV infections
2009Research: Australian world first data shows a decline in genital warts
2008HPV Vaccination Program Register established by VCS
2019Research: Published in Lancet Public Health Cervical Cancer likely to be eliminated in Australia within 20 years
2007Australia first to introduce a national HPV vaccination program
Routine school-based vaccination of adolescent girls; two-year catch up all women aged up to 26 years through GP
1991Australia introduces National Cervical Screening Program
Ian Frazer and Jian Zhao co-discovered the particle that makes HPV vaccine possible
2006Ian Frazer Australian of the Year for role in discovery of HPV vaccines
VCS Foundation, Cancer Council NSW, Australian Federal Government, World Health Organization
2021 CERVICAL CANCER ELIMINATION PROGRESS REPORT – C42021 CERVICAL CANCER ELIMINATION PROGRESS REPORT – C4PAGE 38 PAGE 39