Embed Size (px)
Citation preview

29 October 2021
2021 AGMPresentation

Disclaimer
The material in this presentation has been
prepared by carsales.com Limited (ASX:
CAR) ABN 91 074 444 018 (“carsales") and
is general background information about
carsales’ activities current as at the date of
this presentation. The information is given
in summary form and does not purport to
be complete. In particular you are
cautioned not to place undue reliance on
any forward looking statements regarding
our belief, intent or expectations with
respect to carsales’ businesses, market
conditions and/or results of operations, as
although due care has been used in the
preparation of such statements, actual
results may vary in a material manner.
Information in this presentation, including
forecast financial information, should not
be considered advice or a
recommendation to investors or potential
investors in relation to holding, purchasing
or selling securities. Before acting on any
information you should consider the
appropriateness of the information having
regard to these matters, any relevant offer
document and in particular, you should
seek independent financial advice.
Non-IFRS Financial Information
carsales' results are reported under
International Financial Reporting
Standards (IFRS). This presentation also
includes certain non-IFRS measures
including “adjusted”, “underlying”
“proforma” and “look-through”. These
measures are used internally by
management to assess the performance
of our business and our associates, make
decisions on the allocation of resources
and assess operational management.
Non-IFRS measures have not been subject
to audit or review. All numbers listed as
reported comply with IFRS.
Disclaimer and Non-IFRS Information
2

Performance & Market Summary
Financial Review
carsales Australia
carsales International
Strategy Update
FY22 Outlook
Appendix
4 – 7
8 – 14
15 – 20
21 – 28
29 – 38
39 – 40
41 – 47
Contents
3

Performance & Market Summary
0%
100%
200%
300%
400%
500%
600%
700%S&P ASX200 carsales
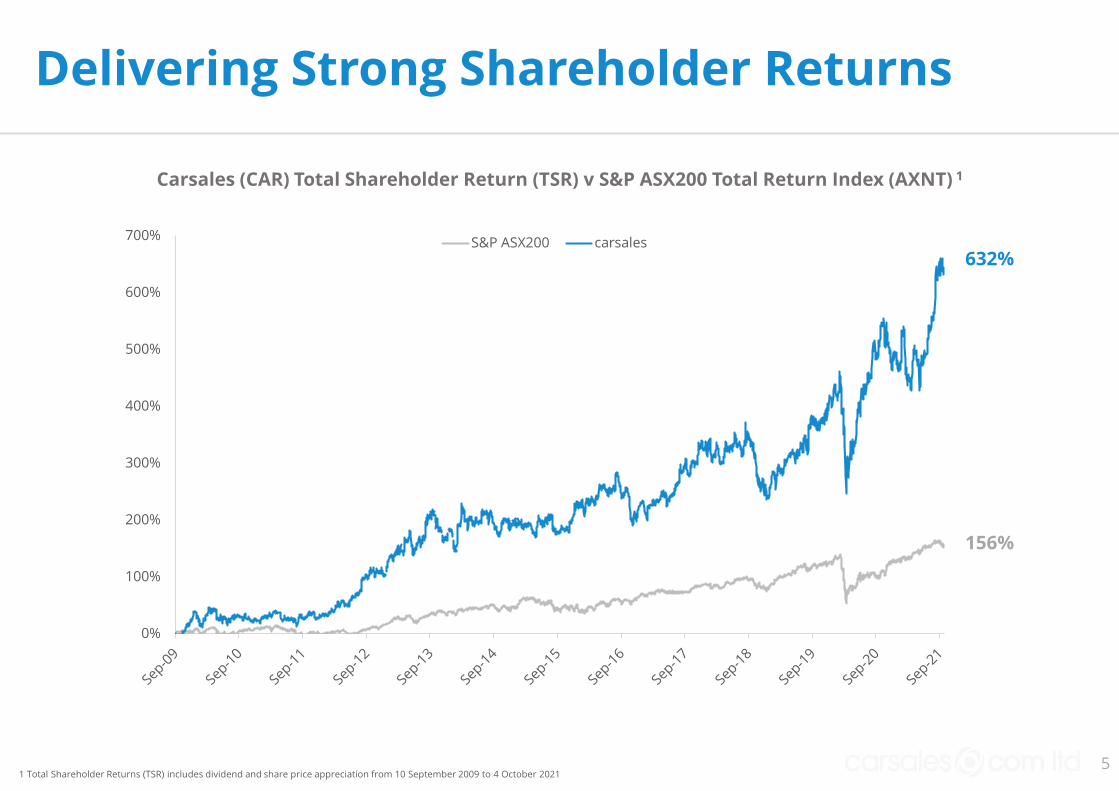
Delivering Strong Shareholder Returns
5
Carsales (CAR) Total Shareholder Return (TSR) v S&P ASX200 Total Return Index (AXNT) 1
1 Total Shareholder Returns (TSR) includes dividend and share price appreciation from 10 September 2009 to 4 October 2021
632%
156%

FY21 Highlights
1. Adjusted Revenue excludes COVID-19 support rebate provided to dealers, Adjusted EBITDA and Adjusted NPAT stated above is post non-controlling interests and excludes certain non-recurring or non-cash items. See slide 42 regarding the disclosure of non-IFRS information and slides 43-44 for a reconciliation of Reported to Adjusted financials. 2. Refers to local currency growth. 3. For look-through definition refer to slide 10.
REVENUE EBITDA NPAT
$438mAdjusted1
$254mAdjusted1
$153mAdjusted1
$427mReported
$241mReported
$131mReported
10%
20%
11%
9%
4%
8%
• Good earnings growth across our Domestic and International businesses despite the impact of COVID-19 lockdowns
• Expanded Group Adjusted EBITDA1 margin to 58%, whilst continuing to invest for the future
• Strong international result with South Korean revenue up 21%2 and International now representing 24% of look-through3 revenue
• Acquired 49% of Trader Interactive, a market leader in the RV, powersports, commercial truck and equipment categories in the US
• Excellent free cash flow generation and a strong balance sheet which supports a final dividend of 22.5 cents per share, representing an 80%
payout ratio
6

Operating Metrics
CARS ONLINE1
TOTAL TIME ON SITE8
SESSIONS3
672kOnline @ 30 Jun
1.1bnWorldwide 17%12%
LEADS4TIME TO SELL2
MEMBER CARS5 GUARANTEED6 MOST TRUSTED7
28%Improvement
614kIn Garage 27%
280kCars inspected
88%More than no.238%
42mWorldwide 35%
10xMore than no.2
Metrics reflect the value we create for our customers and our leading position in key markets
1. Stock published for websites in Australia, South Korea, Brazil, Mexico, Argentina and Chile on 30 Jun 21 v 30 Jun 20. 2. Median time to sell Jun 21 v Jun 20 for Australian private and dealer inventory. 3. Google Analytics, sessions for websites in Australia, South Korea, Brazil, Mexico, Argentina and Chile 1 Jul 20 - 30 Jun 21 v 1 Jul 19 – 30 Jun 20. 4. Leads from websites in Australia, South Korea, Brazil, Mexico, Argentina and Chile 1 Jul 20 - 30 Jun 21 v 1 Jul 19 – 30 Jun 20. 5. carsales internal data, cars in Garage at 30 Jun 21 v 30 Jun 20. 6. carsales internal data, cars inspected 1 Jul 20 - 30 Jun 21 v 1 Jul 19 – 30 Jun 20. 7. Study conducted by independent research agency Nature Pty Ltd Market brand health tracker (Jun 21). Reputation - Is Trustworthy (Rated 7-10). 8. Nielsen DCR, average time on site x visits 1 Sep 20 - 30 Jun 21 v nearest competitor.
27%
7

Group Financial Review

Well positioned to continue delivering long-term shareholder value through world-class capability, exposure to international growth markets and investment in new products and services
116127 130
138
153
FY17 FY18 FY19 FY20 FY21
319
377418 422 438
FY17 FY18 FY19 FY20 FY21
170
202218
232254
FY17 FY18 FY19 FY20 FY21
Strong Track Record of Growth
ADJUSTED REVENUE1 ADJUSTED EBITDA1 ADJUSTED NPAT1
CAGR 8% CAGR 11% CAGR 7%
1. Adjusted Revenue excludes COVID-19 support rebate provided to dealers, Adjusted EBITDA and Adjusted NPAT is post non-controlling interests and excludes certain non-recurring or non-cash items. See slide 42 regarding the disclosure of non-IFRS Information and slides 43-44 for a reconciliation of Reported to Adjusted financials. 2. FY20 Asia segment revenue and expense has been restated to treat certain expenses as a reduction in revenue, resulting in a A$1.4m reduction in revenue and expense.
2
9

92%86% 85% 82% 81%
8%
14% 15%18%
19%
179
212 220237
261
FY17 FY18 FY19 FY20 FY21
carsales Domestic carsales International
CAGR 10%
89%85% 80% 78% 76%
11%
15%20% 22%
24%326
385413 424
450
FY17 FY18 FY19 FY20 FY21
carsales Domestic carsales International
1. carsales “look-through” methodology: For equity accounted associates and consolidated subsidiaries, add the total revenue or EBITDA for the period of ownership within the reporting period multiplied by the % ownership over the period. Some “look-through” numbers involve the disclosure of non IFRS information - Refer to carsales’ Disclosure of Non IFRS information on slide 42 for further details. 2. Adjusted Revenue and Adjusted EBITDA stated above excludes currency fluctuation, certain non-recurring or non-cash items relating to restructuring and M&A transaction cost. See slide 42 regarding the disclosure of non-IFRS information and slides 43-44 for a reconciliation of Reported to Adjusted financials.
Look-through Results
LOOK-THROUGH1 ADJUSTED REVENUE2 LOOK-THROUGH1 ADJUSTED EBITDA2
International look-through1 revenue and EBITDA grew 18% and 20% respectively
CAGR 8%
10
1

• Delivered 4% growth in Adjusted Revenue2
• Solid results from Dealer segment reflecting continued market
leadership
• Growth in Core Private3 revenue of 26% driven by strong private
ad and instant offer volumes
• Strong H2 media performance reflected improving market
conditions and a lower prior period comparative result
• Data, Research and Services grew 2% excluding intentional exit
of low margin warranty product
• Excellent Asia result driven by strong growth in South Korea
• Latin America returned to revenue growth in H2 despite a
challenging COVID backdrop
Summary Revenue & EBITDA
EBITDA
Revenue
• Adjusted EBITDA1 growth of 10% reflecting strong margin
performance
• Growth in Online Advertising & DR&S reflects resilient revenue
performance augmented by strong cost discipline and operating
leverage
• Strong Asia result reflects excellent growth in South Korea whilst
investing in future growth
• Reduction in losses in Latin America reflects strong operating
cost discipline in a challenging environment
1. FY20 Asia segment revenue and expense has been restated to treat certain expenses as a reduction in revenue, resulting in a A$1.4m reduction in revenue and expense. 2. Adjusted Revenue excludes COVID-19 support rebate provided to dealers and Adjusted EBITDA stated above excludes certain non-recurring items. See slide 42 regarding the disclosure of non-IFRS Information and slides 43-44 for a reconciliation of Reported to Adjusted financials. 3. Core Private reflects Private segment excluding tyresales and Redbook Inspect.
11
FY201 FY21 $'s %
Adjusted Revenue2
Online Advertising 296.7 304.0 7.3 2% 2%
Dealer 168.7 178.1 9.4 6% 6%
Private 77.8 78.5 0.7 1% 1%
Media 50.2 47.5 (2.7) (5%) (5%)
Data, Research and Services 43.3 42.8 (0.5) (1%) (1%)
Asia 74.0 84.3 10.3 14% 20%
Latin America 7.6 6.7 (0.9) (12%) 3%
Adjusted Revenue2 421.6 437.8 16.2 4% 5%
Adjusted EBITDA2
Online Advertising 168.2 183.3 15.1 9% 9%
Data, Research and Services 27.5 28.6 1.1 4% 4%
Asia 40.7 43.1 2.4 6% 11%
Latin America (4.7) (0.8) 3.9 83% 67%
Adjusted EBITDA2 231.8 254.2 22.3 10% 10%
EBITDA Margin 55.0% 58.1% - 3.1% -
Growth$A Millions Constant
Currency
Year Ending
30 June 2021

Domestic
• Domestic core margin expansion by good growth in high incremental margin products and strong operating cost discipline
• Improved margins in Other Domestic Investments primarily reflects significantly improved profitability in tyresales due to better purchasing from OEM suppliers and less aggressive discounting
International
• Asia decline reflects additional marketing investment in South Korea to increase market share of the high growth Dealer Direct product. Excluding this investment margin in Asia expanded to 56% in FY21 from 55% in FY20
• Reduced the losses in Latin America through good cost management in a challenging COVID environment
1. Adjusted EBITDA stated above is on a continuing basis, excludes certain non-recurring or non-cash items relating to restructuring and M&A transaction cost. See slide 42 regarding the disclosure of non-IFRS information and slides 43-44 for a reconciliation of Reported to Adjusted financials.
Good domestic & international margin performance
Strong margin performance across Domestic and LATAM segments, Asia impacted by one-off marketing investment
55.0%
58.1%
0.8%
2.1% 1.0%
FY21 Adjusted EBITDA1
Margin
Domestic Core
Other Domestic
Investments
FY20 Adjusted EBITDA1
Margin
(0.8%)
Asia Latin America
12

1. FY20 Asia segment revenue and expense has been restated to treat certain expenses as a reduction in revenue, resulting in a A$1.4m reduction in revenue and expense. 2. Adjusted Revenue, Adjusted EBITDA and Adjusted NPAT stated above is post non-controlling interests and excludes certain non-recurring or non-cash items. See slide 42 regarding the disclosure of non-IFRS information and slides 43-44 for a reconciliation of Reported to Adjusted Financials.
• D&A increased by $3.7m due to increased depreciation of
building fit outs and software assets. The software
investment continues to support ongoing growth and
development of our global technology platform
• Net finance cost decrease reflects lower interest rates and
Net Debt balance
• Profits from associates largely reflects contribution from
webmotors and is lower than pcp due to unfavourable
exchange rate. webmotors EBITDA grew by 25% in local
currency
• Negative impact of non-controlling interest reflects
distributing profits to non-controlling shareholders
• Final dividend of 22.5 cents per share declared, down 10%
on pcp, reflecting the increase in the number of shares from
the recent entitlement offer in relation to the Trader
Interactive acquisition
• Reported results impacted by $11m COVID-19 dealer
support package. Reported growth on pcp positively
impacted due to providing higher rebates last year. Refer to
slides 43-44 for a reconciliation between reported and
adjusted results
Adjusted Net Profit After Tax Summary
13
FY201 FY21 $'s %
Adjusted Revenue2 421.6 437.8 16.2 4%
Operating expense 189.8 183.6 6.2 3%
Adjusted EBITDA2 231.8 254.2 22.4 10%
EBITDA Margin % 55.0% 58.1% - -
Depreciation & amortisation 28.2 31.9 (3.7) (13%)
Net finance cost 14.3 13.9 0.4 3%
Income tax expense 56.4 59.4 (3.0) (5%)
Profits from associates 4.7 4.3 (0.3) (7%)
Non-controlling interests (NCI) 0.7 (0.5) (1.2) (171%)
Adjusted NPAT2 138.2 152.8 14.6 11%
Adjusted Earnings per share (cents) 56.4 61.5 5.1 9%
Final Dividend per share (cents) 25.0 22.5 (2.5) (10%)
Summary of Reported Results
Reported Revenue 394.1 427.2 33.1 8%
Reported EBITDA 202.0 241.5 39.5 20%
Reported NPAT 119.9 130.7 10.8 9%
Reported Earnings per share (cents) 48.9 52.6 3.7 8%
Year Ending
30 June 2021
Growth$A Millions

171185
210 216
255
101%
92%99%
107% 105%
FY17 FY18 FY19 FY20 FY21
CASHFLOW CONVERSIONCashflow1 EBITDA to cash conversion
• Excellent conversion of EBITDA to cash flow reflects the attractive working capital profile of the business and good cash collections
• Capex up 11% reflecting continued investment in technology platforms and new products to drive future growth
• Leverage ratio decreased to 1.4x at year end due to continued strong free cash flow generation
• Anticipate carsales’ pro forma net debt / adjusted EBITDA leverage to be ~2.1x post settlement of the transaction in September. Trader Interactive successfully refinanced in July. The business has executed a new 7-year debt arrangement in the Term Loan market in the US. Loan size of $410m with an interest rate of 4.6%
1. Operating cash flow less tax. 2. Net debt includes total borrowings and cross currency interest swaps less total cash as at 30 June 2021 as per published balance sheet, excluding lease liabilities. Ratios above are based on reported financial outcomes and may vary with bank covenant definitions. Excludes the impact of the Trader Interactive capital raise and debt pay down. 3. Adjusted EBITDA stated above excludes certain non-recurring items. See slide 42 regarding the disclosure of non-IFRS Information and slides 43-44 for a reconciliation of Reported to Adjusted Financials. 4. June-21 figure excludes the cash receipt from capital raise to acquire Trader Interactive and debt paydown.
Strong Cash Flow and Robust Balance Sheet (Excludes Trader Interactive Acquisition Impact and Capital Raise)
CAPEX ($m)
LEVERAGE RATIO
29.733.0
FY20 FY21
1.6
1.4
FY20 FY21
NET DEBT2
11%
13%
$A Millions Jun-20 Jun-214 %
Borrowings 544.2 453.2 17%
Swaps 14.2 - 100%
Cash (179.9) (102.2) (43%)
Net Debt 378.5 351.0 7%
Net debt2 / Adjusted EBITDA3
14

carsalesAustralia

50.247.5
FY20 FY21
168.7178.1
FY20 FY21
170.3(reported) 47.0
(reported)
• Solid dealer performance supported by a buoyant automotive market,
with strong demand for new and used cars. New car sales were up
28% in H22. Lead growth weighted to H1 given a very strong
comparative period in H2 FY20, where dealer revenue was up 13% on
pcp
• carsales extended its market leadership position, reflected in record
traffic and enquiry volumes being generated for our dealer customers
• Depth revenue was in line with pcp which was a resilient result given
the heightened level of demand and reduced time to sell
• Reduction in revenue reflects a challenging OEM advertising
environment due to the significant reduction in new car sales in H1
and OEM supply constraints
• Revenue growth of 13% in the second half of FY21 driven by improved
market conditions, which positions the business well heading in to
FY22
• Our strategy of diversifying into non-automotive segments is paying
dividends with an increased contribution from our finance, insurance
and non-automotive vehicle markets (bikes, boats, motorcycles and
trucks)
1. Adjusted Revenue stated above excludes COVID-19 support rebate provided to dealers. See slide 42 regarding the disclosure of non-IFRS information and slides 43-44 for a reconciliation of reported to Adjusted Financials. 2. VFACTS reported new car sales volume Jan-Jun 2021, Federal Chamber of Automotive Industries
Domestic Revenue - Dealer & Media
DEALER ADJUSTED REVENUE1 UP 6% TO $178.1m MEDIA ADJUSTED REVENUE1 DOWN 5% TO $47.5m
6% 5%
16

77.8 78.5
FY20 FY21
43.3 42.8
FY20 FY21
40.4(reported)
• Core Private2 revenue growth of 26%, driven by strong growth in
private advertisement and Instant Offer volumes. This reflects the
strength of carsales’ value proposition as the most effective sales
channel for consumers
• Private ad yield also improved through pricing optimisations and
increased premium ad uptake
• Reduction in tyresales volumes reflects increased focus on
profitable channels and less aggressive discounting
• Revenue growth impacted by intentional exit of our lower margin
warranty product. Underlying revenue growth of 2% excluding this
impact, reflecting resilience of the segment
• Data, Research & Services segment continues to deliver revenue
growth despite difficult macroeconomic conditions, demonstrating
strong value proposition as a market leading source of vehicle
specification, valuation and pricing data
1. Adjusted Revenue stated above excludes COVID-19 support rebate provided to dealers. See slide 42 regarding the disclosure of non-IFRS information and slides 43-44 for a reconciliation of reported to Adjusted Financials. 2. Core Private reflects Private segment excluding tyresales and Redbook Inspect. 3. DR&S refers to Data, Research and Services segment.
DR&S3 ADJUSTED REVENUE1 DOWN 1% TO $42.8m
Domestic Revenue - Private & DR&S
PRIVATE REVENUE UP 1% TO $78.5m
1% 1%
3
17
0
50
100
150
200
Jul-
20
Au
g-2
0
Se
p-2
0
Oct
-20
No
v-2
0
De
c-2
0
Jan
-21
Fe
b-2
1
Ma
r-2
1
Ap
r-2
1
Ma
y-2
1
Jun
-21
+16%
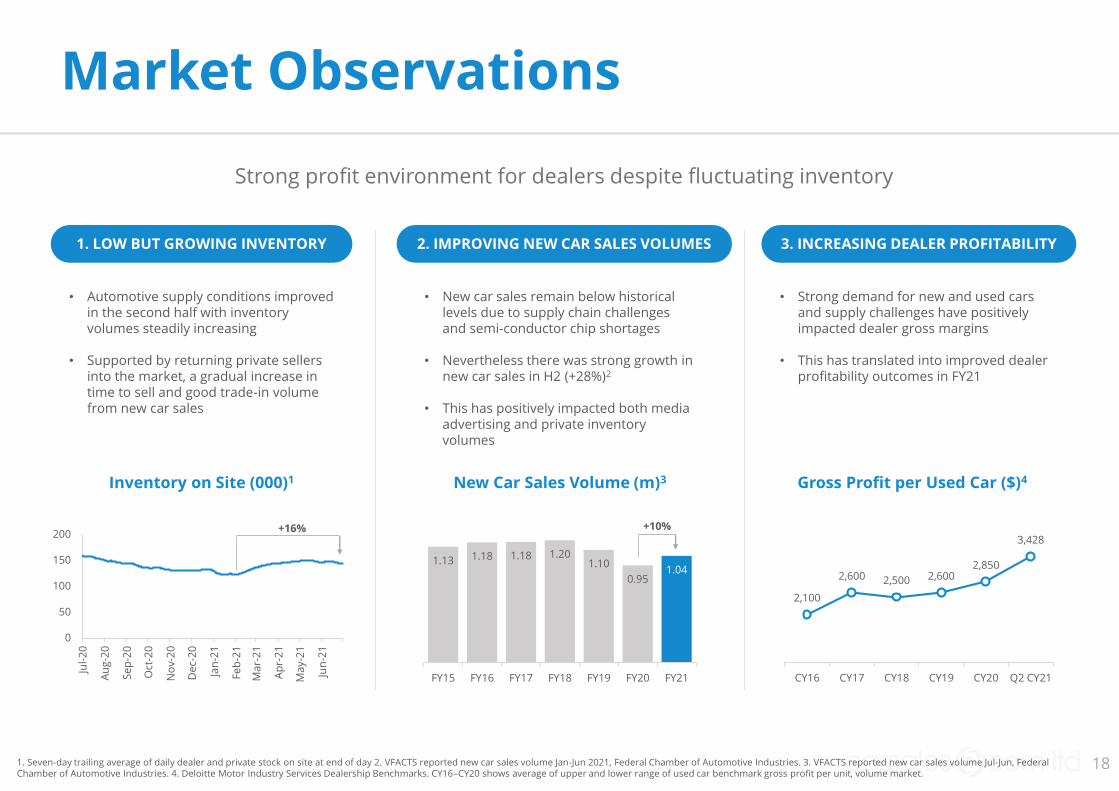
1. LOW BUT GROWING INVENTORY 2. IMPROVING NEW CAR SALES VOLUMES
• Automotive supply conditions improved in the second half with inventory volumes steadily increasing
• Supported by returning private sellers into the market, a gradual increase in time to sell and good trade-in volume from new car sales
3. INCREASING DEALER PROFITABILITY
• New car sales remain below historical levels due to supply chain challenges and semi-conductor chip shortages
• Nevertheless there was strong growth in new car sales in H2 (+28%)2
• This has positively impacted both media advertising and private inventory volumes
• Strong demand for new and used cars and supply challenges have positively impacted dealer gross margins
• This has translated into improved dealer profitability outcomes in FY21
1.13 1.18 1.18 1.201.10
0.951.04
FY15 FY16 FY17 FY18 FY19 FY20 FY21
+10%
New Car Sales Volume (m)3 Gross Profit per Used Car ($)4Inventory on Site (000)1
1. Seven-day trailing average of daily dealer and private stock on site at end of day 2. VFACTS reported new car sales volume Jan-Jun 2021, Federal Chamber of Automotive Industries. 3. VFACTS reported new car sales volume Jul-Jun, Federal Chamber of Automotive Industries. 4. Deloitte Motor Industry Services Dealership Benchmarks. CY16–CY20 shows average of upper and lower range of used car benchmark gross profit per unit, volume market.
Market Observations
Strong profit environment for dealers despite fluctuating inventory
2,100
2,600 2,500 2,6002,850
3,428
CY16 CY17 CY18 CY19 CY20 Q2 CY21
18

carsalesABC
carsalesABC
Se
ssio
ns
375mTotal sessions in FY21
up 21% on pcp1
4.4mAverage monthly unique audience
up 15% on pcp5
5bnTotal page views in FY21
up 16% on pcp3
32mTotal Editorial sessions in FY21
up 36% on pcp6
6.0x
7.0x7.5x
8.1x
Q1 Q2 Q3 Q4
Quarterly Lead Over Competitor B1 Full Year Lead Over Competition2
16.2x
21.1x
25.4x27.3x
Q1 Q2 Q3 Q4
Quarterly Lead Over Competitor B3 Full Year Lead Over Competition4
carsales had a record traffic year recording the following metrics
1. Nielsen Digital Content Ratings, Total Sessions, P2+, Digital C/M, Text, carsales.com.au (1 Jul 20 - 30 Jun 21) Competitor B (Q1: Sep-20, Q2-Q4 1 Oct 20 - 30 Jun 21) 2. Nielsen Digital Content Ratings, Monthly - Tagged, P2+, Digital C/M, Text, Average Monthly Sessions, carsales.com.au, Competitor A (1 Jul 20 - 30 Jun 21), Competitor B (1 Sep 20 - 30 Jun 21), Competitor C (1 Jul 20 - 31 Mar 21). 3. Nielsen Digital Content Ratings, Monthly - Tagged, P2+, Digital C/M, Text, Average Monthly Views, carsales.com.au, Competitor B (1 Sep 20 - 30 Jun 21). 4. Nielsen Digital Content Ratings, Monthly - Tagged, P2+, Digital C/M, Text, Average Monthly Views, carsales.com.au, Competitor A (1 Jul 20 - 30 Jun 21), Competitor B (1 Sep 20 - 30 Jun 21), Competitor C (1 Jul 20 - 31 Mar 21). 5. Nielsen Digital Content Ratings, Daily, P2+, Digital C/M, Text, Carsales.com.au (1 Jul 20 - 30 Jun 21). 6. Nielsen Digital Content Ratings, Total Sessions, P2+, Digital C/M, Text, carsales.com.au Editorial and motoring.com.au (1 Jul 20 - 30 Jun 21)
Extending Our Market LeadershipP
ag
e V
iew
s
6.8x
24x
19

Dealer
• Grow ROI for dealers on core transaction products
• Increase penetration and usage of listing depth
products
• Monetise dealer finance
• Facilitate an increasingly digital car buying process
Launch dealer ratings on details pages to improve lead conversion
Expand usage of recurring, no-touch promote products
Commence monetisation of dealer finance
Help our dealers deliver an online car selling experience
Private
• Grow penetration of trust and safety products
• Yield optimisation on core private revenue
• Drive growth in inspection volumes through new
service offerings
Launch enhanced buyer insights products
Increase yield through dynamic pricing models
Commence inspection and certifications of non-auto brands
Media
• Diversify customer base
• Increase programmatic capability
Grow share of non-automotive media spend through broader industry
targeting and a tailored product set
Upgrade ad server tech functionality to increase programmatic
capability and monetisation of unsold inventory
Data, Research &
Services
• Expand dealer product portfolio to address gaps in
the market
• Build and enhance engagement with members
Release new value-added products for dealers
Increase feature experience for logged-in members
Execute Owner Accelerate membership program to drive better
engagement with our Virtual Garage
FY21 Focus AreasKey Strategic Objectives
Australia FY21 Key Focus Areas
Continuing to deliver on our strategic objectives
20

carsalesInternational

USA - Trader InteractiveAcquisition completed on 1 September 2021
LAST QUARTER ANNUALISED1 (UNAUDITED, USDm)
Revenue EBITDA
• Strong financial performance in the first half of the calendar year, with revenue and EBITDA growth of 12% and 25% and an EBITDA margin increase of 6 percentage points
• A price rise for all markets was successfully executed in the last quarter which resulted in minimal churn, indicating that the platform continues to deliver excellent value for dealers
• Outstanding website performance and dealer acquisition metrics
H1 CY21 FINANCIAL SUMMARY (UNAUDITED)
TI is a leading platform of non-automotive marketplaces, providing digital marketing solutions and services across RV, powersports, truck and equipment industries in the United States
FY21 PERFORMANCE COMMENTARY
61
80
CY20 LQA
123139
CY20 LQA
+14%+33%
1. 1 Apr 21 – 30 Jun 21 multiplied by 4. 2. Similarweb visits and leads delivered 1 Jul 20 - 30 Jun 21 v 1 Jul 19 - 30 Jun 20 for rvtrader.com, rvt.com, cycletrader.com, commercialtrucktrader.com, nexttruckonline.com, equipmenttrader.com, rockanddirt.com, tradequip.com. 3. Total dealers subscribed to Trader Interactive 30 Jun 21 v 30 Jun 20.
227
291
FY20 FY21
4.8
7.4
FY20 FY21
8.9 9.1
FY20 FY21
Visits (m)2 Leads (m)2 Dealers (000)3
+28%
+55% +3%
1 1
22
H1 CY20 H1 CY21 $'s %
Adjusted Revenue 59.1 66.1 7.0 12%
Adjusted EBITDA 29.0 36.3 7.3 25%
Adjusted EBITDA margin 49% 55% 6%
USD Millions Growth

Revenue (KRWbn)
3844
49
56
68
FY17 FY18 FY19 FY20 FY21
2021
26
31
35
FY17 FY18 FY19 FY20 FY21
EBITDA (KRWbn)
• Strong financial performance with revenue growth of 21%2 and EBITDA growth of 12%2
• Encar invested 3.2b KRW in H2 FY21 to increase penetration and drive future growth of the Dealer Direct product. Excluding this investment EBITDA up 22%2 vs pcp
• Strong operational metrics despite continued challenges with COVID-19
• Performance has been driven by strong execution on key growth products:
• Dealer Direct: product enhancements, sales process improvements and Increased marketing activity underpinned growth of >100% in sales volumes
• Guaranteed inspections: Strong growth in volumes driven by increased utilisation of branches including 5 new branches opened in FY21. We now have 36 branches and Guaranteed penetration also increased to 32% in Jun-21 from 23% in Jun-20
• Home Delivery: Expanded the number of cars being offered for home delivery to >10,000 which has resulted in material uplift in volumes. Important part of the future e-commerce strategy for Encar
FY201 FY21 $'s %
Revenue 69.7 80.1 10.4 15% 21%
EBITDA 38.5 40.7 2.2 6% 12%
Constant
Currency
Growth$A Millions
1. FY20 revenue and expense has been restated to treat certain expenses as a reduction in revenue, resulting in a A$1.4m reduction in revenue and expense. 2. Represents constant currency growth.
South Korea - Encar
FINANCIAL SUMMARY
Another excellent year for Encar, supported by expansion of new products and services
FY21 PERFORMANCE COMMENTARY
CAGR 16% CAGR 15%
23

FY20 FY21 $'s %
Revenue 74.6 62.8 (11.8) (16%) 16%
EBITDA 30.6 27.7 (2.8) (9%) 25%
Pro-forma
100%
$A Millions Constant
Currency
Growth
108
139
187
219
254
FY17 FY18 FY19 FY20 FY21
29
53
8189
112
FY17 FY18 FY19 FY20 FY21
Revenue (BRLm) EBITDA (BRLm)
• Excellent financial performance in local currency with unfavourable exchange rates impacting AUD growth
• Strong cost discipline helping to deliver EBITDA margin expansion from 41% to 44%
• Excellent key operating metrics through challenging market conditions: • Site visits up 15%1
• Leads delivered up 45%2
• Subscribed dealer volume up 13%3
• Excellent outcomes from FY21 Focus areas:
• CRM +smart FY21 revenue nearly doubled, with more than 1,500 new dealers subscribed
• The contribution of finance revenue increased, with 21% growth on pcp
• Display revenue from OEMs grew 70% on pcp
• Regional Expansion plan whilst reduced still added ~2k dealers in south, south east and north east regions
• Use of our Home Delivery Product also accelerated, as demand for safe inspections increased
1. Total webmotors sessions 1 Jul 20 - 30 Jun 21 v 1 Jul 19 - 30 Jun 20. 2. Total webmotors leads delivered 1 Jul 20 - 30 Jun 21 v 1 Jul 19 - 30 Jun 20. 3. Total dealer subscriptions 30 Jun 21 v 30 Jun 20.
Brazil - webmotors
FINANCIAL SUMMARY
webmotors continues clear no. 1 position by accelerating core volume and expanding services
FY21 PERFORMANCE COMMENTARY
CAGR 24% CAGR 40%
24
FY20 FY21 FY20 FY21
FY20 FY21
CH
ILE
ME
XIC
O1
AR
GE
NT
INA
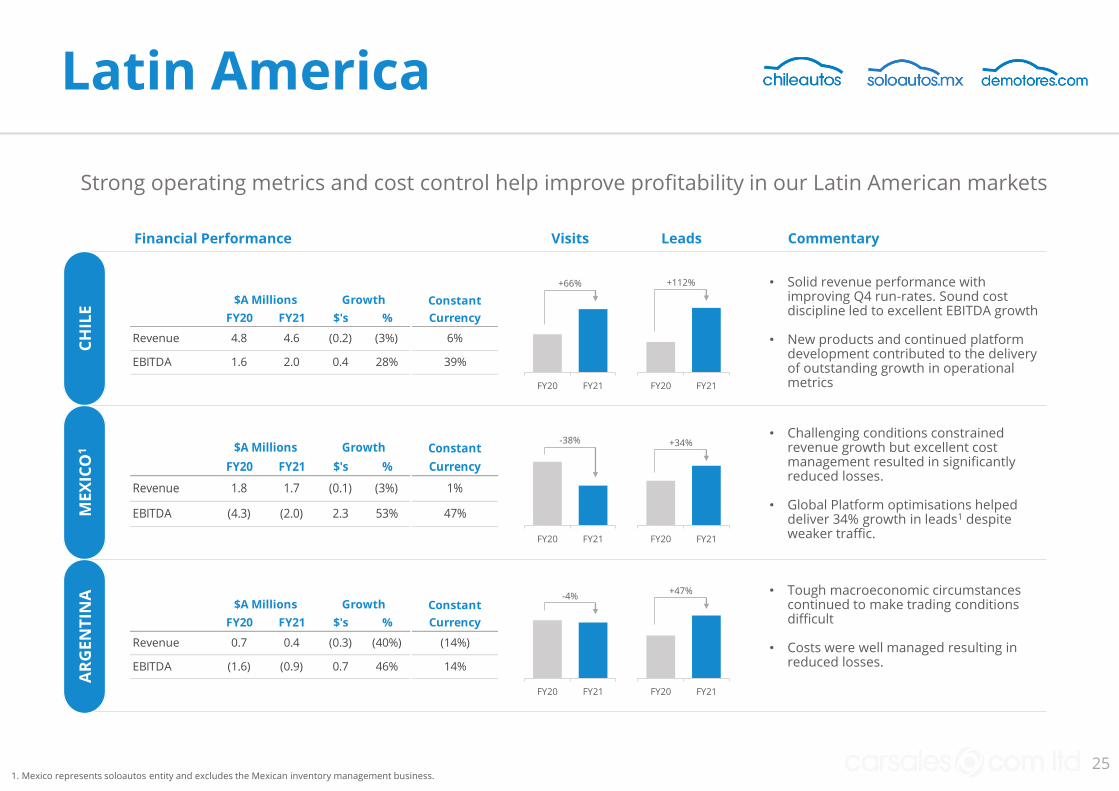
FY20 FY21 $'s %
Revenue 4.8 4.6 (0.2) (3%) 6%
EBITDA 1.6 2.0 0.4 28% 39%
$A Millions Growth Constant
Currency
FY20 FY21 $'s %
Revenue 1.8 1.7 (0.1) (3%) 1%
EBITDA (4.3) (2.0) 2.3 53% 47%
$A Millions Growth Constant
Currency
FY20 FY21 $'s %
Revenue 0.7 0.4 (0.3) (40%) (14%)
EBITDA (1.6) (0.9) 0.7 46% 14%
$A Millions Growth Constant
Currency
• Challenging conditions constrained revenue growth but excellent cost management resulted in significantly reduced losses.
• Global Platform optimisations helped deliver 34% growth in leads1 despite weaker traffic.
• Tough macroeconomic circumstances continued to make trading conditions difficult
• Costs were well managed resulting in reduced losses.
• Solid revenue performance with improving Q4 run-rates. Sound cost discipline led to excellent EBITDA growth
• New products and continued platform development contributed to the delivery of outstanding growth in operational metrics
+66%
FY20 FY21
FY20 FY21 FY20 FY21
Visits Leads
+112%
-38% +34%
-4%+47%
Financial Performance Commentary
Latin America
Strong operating metrics and cost control help improve profitability in our Latin American markets
1. Mexico represents soloautos entity and excludes the Mexican inventory management business.25

1.911.82 1.81 1.80 1.86 1.89
FY16 FY17 FY18 FY19 FY20 FY21
2.232.09
2.39
2.71
2.29 2.32
FY16 FY17 FY18 FY19 FY20 FY21
SOUTH KOREA (ENCAR) US (TRADER INTERACTIVE)
• Strong pandemic response has resulted in minimal disruption to the trading environment, with new car sales improving upon pre-COVID levels
• Encar’s operating metrics were positive, with visits up 11%1 and inventory has been stable throughout COVID
BRAZIL (WEBMOTORS)
• With the number of new COVID cases easing, trading conditions improved for TI in H2
Recreational• US outbound international air travel
reduced by 74%3 in 2020 which increased domestic tourism spending. This positively impacted demand in the RV and Powersports verticals
• Whilst there have been supply chain issues impacting inventory levels, dealers have been generating strong gross margins due to heightened demand. Pricing and margins likely to remain favourable for the rest of CY21
Commercial• Truck and equipment markets have also
experienced significant inventory challenges but are expected to improve over the next 6-9 months. Similar to recreation this has created strong pricing conditions in the market
• Despite difficult COVID conditions throughout the year, the automotive sales environment recovered strongly with vehicle sales being up 32% in H2 FY21 on pcp4
• webmotors delivered strong operating metrics with traffic up 15% on pcp5 and finance contracts up 22%
New Car Sales Volume (m)6
+2%
New Car Sales Volume (m)2
1. Total Encar sessions 1 Jul 20 - 30 Jun 21 v 1 Jul 19 - 30 Jun 20. 2. South Korea Ministry of Land, Infrastructure and Transport. 3. United States Department of Transportation, Bureau of Transportation Statistics. Air passenger travel from the United States 2020 v 2019. 4. Brazil Ministry of Infrastructure 1 Jan 21 - 30 Jun 21 v 1 Jan 20 - 30 Jun 20. 5. Total webmotors sessions 1 Jul 20 - 30 Jun 21 v 1 Jul 19 - 30 Jun 20. 6. Reported new car sales, Brazil Ministry of Infrastructure
Market Observations
International markets have been resilient through challenging conditions
+5%
+2%
26

B A Encar
SOUTH KOREA (ENCAR) US (TRADER INTERACTIVE) BRAZIL (WEBMOTORS)
Strong International Market Leadership
Key industry metrics are positive during challenging trading conditions
107
125 127 131
H120 H220 H121 H221
Total Visits (m)1
Full year market share v competition2
1.43x
1.64x1.69x
1.73x
Q1 Q2 Q3 Q4
webmotorsABC
Quarterly market share v competitor A4
Full year market share v competition4
• webmotors extended its lead over the no.2 vertical auto player
• More than 24% of the Korean population visited Encar in an average month in FY21 showing excellent brand strength and awareness
• TI is the clear market leader in recreational categories with a contestable position in trucks where TI holds more inventory than the market leader
1. Total Encar sessions 1 Jul 19 - 30 Jun 21. 2. Encar visits v nearest auto classifieds competitors. Similarweb Jun 2021 visits. 3. Similarweb visits 1 Jul 20 - 30 Jun 21 v nearest competitors. RV: rvtrader.com + rvt.com. Power Sports: cycletrader.com. Trucks commercialtrucktrader.com + nexttruckonline.com. Equipment: equipmenttrader.com + rockanddirt.com + tradequip.com. 4. Adobe Analytics. webmotors visits 1 Jul 20 - 30 Jun 21 v nearest competitors
Recreational market share3
7.6x5.1x
1.4x2.7x
RVno.2 PSno.2
Trucks no.2 Equipment no.2
8x 1.6x
no.2 Powersports
Commercial market share3
27

South Korea
• Increase penetration and usage of Guarantee product
• Expand our Dealer Direct product offering
• Expand our Home Service product offering
Open new Guarantee sites in strategic locations and continue
increasing utilisation by enhancing efficiency at sites to allow
inspection of more vehicles
Strengthening consumer awareness and improving user
experience for Dealer Direct
Expanding the supply of participating Home Service dealers and
strengthening operational processes including payment
Brazil
• Increase monetisation of Cockpit products
• Increase contribution of finance revenue
• Increase traffic and lead volumes to dealers
• Expand Webmotors regional brand presence (conditions
permitting)
Commence monetisation of CRM +smart subscription
Expand volume of eligible home delivery cars
Broaden customer base of OEMs using display products
Restart regional brand marketing and expansion campaign if
conditions allow
Other LATAM
• Continue to invest in global platform and product
optimisations to drive key operating metrics and
consolidate market leading positions
• Optimise finance opportunity
• Deploy new inventory and lead management platform
Deploy new inventory and lead management platform, which will
complement improved dealer monetisation
Drive enhanced data and analytics capabilities across the region
Chile and Argentina – execute finance partnerships with local
banks
International FY21 Key Focus Areas
FY21 Focus AreasKey Strategic Objectives
Investing in new products and leveraging global technology platform has driven growth
28

Strategy Update

Drivers
To grow our leadership in digital
classified advertising markets
To build a compelling ecosystem of
services that support our customers
through the buying, selling and
ownership of vehicles
Leveraging consumer insights and
industry trends to explore new
opportunities
Digital Marketplaces Value-added Services Future Horizons
To be a data-driven company, with unrivalled data and analytics to help customers understand their audience and commercial clients to grow their businesses
To be an employer of choice and destination for talent by continuously evolving our culture of inclusion, learning, leadership, performance and passion
To build global platform-based software services that exceed the expectations of our customers and drive continued growth in the carsales business
Data
People
Technology
carsales’ Strategy
Our purpose: Making buying and selling a great experience
30

Dealer
• Grow ROI for dealers on core transaction products
• Increase penetration and usage of listing depth
products
• Increase dealer finance penetration
• Facilitate an increasingly digital car buying process
• Depth product enhancements, and expand usage of recurring, no-
touch promote products
• Increase number of dealer listings with finance available
• Launch digital buying experience
Private
• Increase Instant Offer usage
• Yield optimisation on core private revenue
• Enhance scale and profitability of tyresales
• Increase Instant Offer brand awareness through above the line
marketing campaigns and optimise conversion funnel
• Introduce more sophisticated dynamic pricing tools
• Expand depth and quality of OEM supplier relationships
Media
• Diversify customer base
• Increase programmatic capability
• Grow value proposition through unified customer
profiles and self-serve capability
• Grow share of non-automotive media spend through broader industry
targeting and a tailored product set
• Increase sell-through rates utilising real-time-bidding service
• Implement Customer Data Platform and self-serve capability
Data, Research &
Services
• Expand dealer product portfolio to address gaps in
the market
• Build and enhance engagement with members
• Enhance vehicle valuation accuracy and coverage
• Release new value-added products for dealers
• Enrich feature experience for logged-in members
• Refine pricing systems, processes & algorithms
Australia FY22 Key Focus Areas
FY22 Focus AreasKey Strategic Objectives
Investing in improved customer experience and value-based outcomes to underpin future growth
31

FY16 FY17 FY18 FY19 FY20 FY21
DYNAMIC PRICING PHASE 1 DYNAMIC PRICING PHASE 2
• carsales has delivered strong yield growth from tiered pricing of its private listings over the last 5 years
• Prior to 2016 we charged the same ad price for all items irrespective of the value of the vehicle
• Since then we have transitioned to a tiered pricing model that adjusts to the value of the item being advertised
• This has enabled us to charge a higher price in higher value inventory tiers where the value we deliver is very strong
• Change the ad creation process to ask for the consumer’s location and car type prior to providing a price
• This will enable us to more dynamically adjust prices based on:• Location• Value of the car (enables micro bracketing)• Type of car • Demand for the car • Time of year
Average Yield Per Car
Price of car
2016 2021
$0-$5k
$68
$39
$5k-15k $69
$15-$20k $79
$20-$30k $109
$30-$70k $139
>$70k $239
+61%
Location pricing has gone live
• We have been testing location-based dynamic pricing and trialed in selected states
• Initial impact on yield and volume has been positive
Private – Dynamic Pricing
Our dynamic pricing strategy aims to better align the price charged with value delivered
Price Bracket History
32

Digital Car Retailing
Buy onlineCompany
Operating Market(s)
Annualised Sales2
431k
73k
34k
43k
Demand for a full digital retail experience is growing
We have conducted research to understand the drivers
We are creating carsales Select, a new digital used car offering
• of consumers are willing to purchase a used car online, however only of used car sales take place completely online1
• Demand for an entirely digital experience has been accelerated by COVID-19
• Internationally, new ‘digital dealer’ models are gaining market share where they have migrated offline elements of the sale to online
• Our consumer research has determined the key factors that will drive increased adoption of online purchasing:
1. Two-thirds of consumers say they are most concerned about the car having hidden issues;
2. Accessing a competitive, guaranteed price without the requirement for negotiation;
3. Being able to test drive the vehicle before making payment;
4. Having the car home delivered
Used Car Digital Dealers
Critical Factors in Buying Online
1%37%
63%
50%42%
34%
Quality
concerns
Competitive
price
Conducting a
test drive
Car home
delivery
% of respondents
COVID-19 has accelerated the willingness of consumers to buy and sell used cars online
1. Nature Buy Online Research Survey, n = 1,013. 2. Reported sales 1 Apr 21 - 30 Jun 21 multiplied by 4
33

carsales holds refundable reservation deposit in escrow
Pre-negotiated price
Car accompanied by Inspection & Facts+ Report
and high quality photos with imperfections highlighted
Certified inspection report
Instantly reserve online
7-day money-back guarantee
3-month limited warranty
Instils confidence by replicating test drive
experience
Using carsales pricing algorithm to ensure pricing
is competitive
Showcase dealer statutory warranties
Phase 2
Trade-in Finance Home Delivery
Money back guarantee
Digital Car Retailing
In FY22, carsales will launch a differentiated digital product experience called carsales Select. We are focused on helping dealers to bring more of the car buying process online
34

Sep-19 Dec-19 Mar-20 Jun-20 Sep-20 Dec-20 Mar-21 Jun-21
• Encar’s home delivery service brings together the offline elements of used car buying onto a digital platform and is a significant growth opportunity
• Every car is delivered with Encar inspection and certification and is provided with a 7-day money back guarantee. This means consumers can buy with confidence in the quality of the vehicle and know they can access a full refund within 7 days of delivery
• The value of these benefits allow the dealer to maintain strong gross margins, often higher than if sold using the marketplace section of the website, which incentivises further listing volume
• This has resulted in total listings available for delivery exceeding 10,000 cars during the year and FY21 transaction volume growth of over 2.5x times compared with pcp
Quarterly Home Delivery Volume
Find cars eligible for
home delivery
Car undergoes 105 point inspection
The vehicle is delivered to consumer
Consumer has 7 days to decide to
purchase
Launched in 2019, the quarterly run-rate has increased 8x
indicating strong consumer appetite for a fully digital car buying
experience
Encar Home Delivery Service
Deposit is made to Encar
who hold in Escrow
Digital Car Retailing
Encar’s home delivery service builds on inspection services, moving more of the buying process online
35

South Korea
• Reposition Encar as a vehicle trading platform
• Increase penetration and usage of Guarantee
product
• Strengthen our Dealer Direct and Home Service
product offering
• Increase the number of Guarantee sites and optimise the
portfolio, formats and in-store operations
• Deepen consumer awareness and refine customer experience
for Dealer Direct and Home Service
Brazil
• Increase monetisation of Cockpit products
• Increase contribution of finance revenue
• Increase revenue from OEMs
• Expand Webmotors regional brand presence
(conditions permitting)
• Continue to grow penetration of CRM +smart subscription
• Focus on increasing penetration of B2B and C2C finance loan
contribution
• Increase media product sophistication
• Accelerate regional brand marketing and expansion campaign
United States
• Drive and convert highest quality traffic
• Enable the transformation of the purchase
experience online for all of our verticals
• Best in class search experience
• Scale our communication tools to enhance buyer-seller
interaction
• Enhance content across sites to drive increased consumer
engagement
• Deploy valuation guidance
• Integrate finance, insurance and other services into buyer/
seller flow
International FY22 Key Focus Areas
Investing in products and leveraging global technology platform to underpin the growth
FY22 Focus AreasKey Strategic Objectives
36
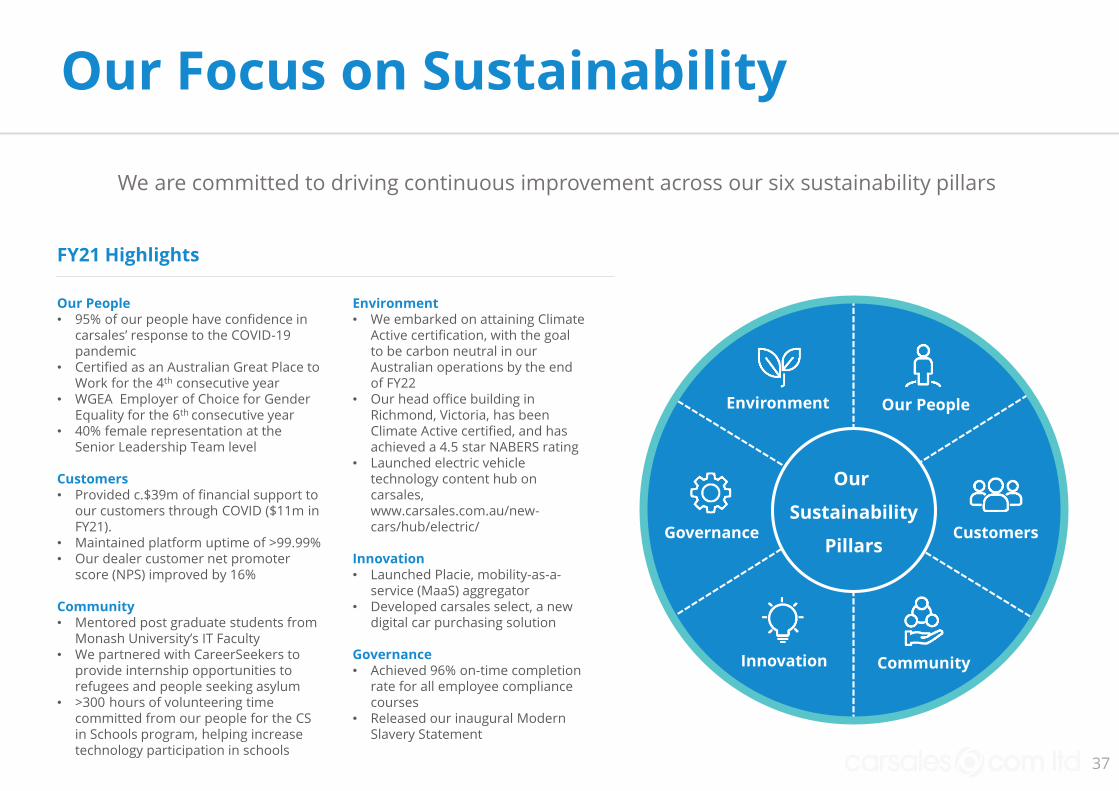
Environment• We embarked on attaining Climate
Active certification, with the goal to be carbon neutral in our Australian operations by the end of FY22
• Our head office building in Richmond, Victoria, has been Climate Active certified, and has achieved a 4.5 star NABERS rating
• Launched electric vehicle technology content hub on carsales, www.carsales.com.au/new-cars/hub/electric/
Innovation• Launched Placie, mobility-as-a-
service (MaaS) aggregator• Developed carsales select, a new
digital car purchasing solution
Governance• Achieved 96% on-time completion
rate for all employee compliance courses
• Released our inaugural Modern Slavery Statement
Our People• 95% of our people have confidence in
carsales’ response to the COVID-19 pandemic
• Certified as an Australian Great Place to Work for the 4th consecutive year
• WGEA Employer of Choice for Gender Equality for the 6th consecutive year
• 40% female representation at the Senior Leadership Team level
Customers• Provided c.$39m of financial support to
our customers through COVID ($11m in FY21).
• Maintained platform uptime of >99.99% • Our dealer customer net promoter
score (NPS) improved by 16%
Community• Mentored post graduate students from
Monash University’s IT Faculty• We partnered with CareerSeekers to
provide internship opportunities to refugees and people seeking asylum
• >300 hours of volunteering time committed from our people for the CSin Schools program, helping increase technology participation in schools
Our Focus on Sustainability
37
Environment
Our
Sustainability
Pillars
Our People
Customers
CommunityInnovation
Governance
We are committed to driving continuous improvement across our six sustainability pillars
FY21 Highlights

Transaction summaryLarge and under-penetrated
addressable marketInvestment thesis
• In Q1 FY22, we acquired 100% of online B2B tyre portal, tyreconnect, for consideration of $19 million
• Founded in 2015, tyreconnect is a technology enabled tyre wholesaler servicing 300+ automotive dealerships
• tyreconnect enables dealers to digitally source a comprehensive and competitively priced selection of tyres without having to trade separately with each tyre manufacturer
• tyreconnect is a capital light business, holding minimal inventory utilising an efficient drop ship model
• The transaction creates a compelling wholesale and retail tyre business with group sales volumes of c.350k tyres, which is more than double existing volumes
• Deal will be marginally EPS accretive in FY22 with further upside expected in FY23
In Q1 FY22 carsales acquired tyreconnect, a market-leading B2B tyre wholesaler in Australia
38
$9bnIndustry sales
$5bnRetail market1
$4bnWholesale
market2
Tyre Market Size in Australia
Online Sales Penetration by Country / Region2
1. Large and highly attractive addressable markets• Tyre market is large and digitally
immature. The digital share of sales is expected to grow over time with tyresales and tyreconnect to be key beneficiaries
• Tyres will become an increasingly important profit centre for dealers
2. Market leading positions in tyre retail & wholesale come together to drive supply synergies• Volume rebates and purchasing
efficiencies are critical in the tyre industry
3. Leverage carsales’ powerful audience, customer and membership base• Retail sales will be increasingly driven
by carsales’ vast audience and membership base
• The wholesale channel will benefit from leveraging carsales’ dealer and OEM relationships
tyreconnect Acquisition
0%
2%
4%
6%
8%
10%
12%
EU US AU
2,000+tyre retailers1
23miltyres imported
annually3
1 IBISWorld Tyre Retailing in Australia Market Research Report. 2. carsales management estimates. 3. TyreStewardship Australia

FY22 Outlook

FY22 OutlookOutlook statementIn Q1 of FY22, retail closures had an impact on leads and private ad volumes. If our experience is consistent with prior lockdowns, the business is well placed to recover all or most of the declines as lockdown restrictions are lifted. Since retail reopened in NSW a few weeks ago, daily lead volumes have significantly recovered compared to the lockdown period.
Excluding recent acquisitions1
We expect to deliver solid growth in Group Adjusted revenue, Adjusted EBITDA and Adjusted NPAT2 in FY22. Due to the extended lockdowns in the first half, financial performance will be more heavily weighted to the second half than usual.
Including recent acquisitions1
We expect to deliver strong growth in Group Adjusted revenue, solid growth in Group Adjusted EBITDA and strong growth in Group Adjusted NPAT. Due to the extended lockdowns in the first half, financial performance will be more heavily weighted to the second half than usual.
carsales Domestic Observations
• Dealer:• Outside the states impacted by lockdowns, underlying market
conditions remain solid• Private
• Private listing volumes are growing strongly on pcp• tyresales has operated at lower volume levels in Q1 FY21 due
to the lockdowns in NSW and Victoria. As outlined earlier with the acquisition of tyreconnect, we anticipate more than doubling the volume of tyres we now sell each year. Whilst the acquisition will grow revenue, it will provide minimal upside to group EBITDA in FY22
• Media and new car market:• The new car market continues to demonstrate signs of
improvement as evidenced by the solid performance in new car sales volumes over the last six months. This has resulted in an improvement in media revenue run-rate, providing confidence that we can deliver growth in this segment in FY22
• Domestic Core expenses:• Anticipating core expenses to be higher in FY22 compared to
FY21 largely reflecting the absence of wage subsidies
carsales International Observations3
• Korea:• In FY22 we expect strong growth in revenue3 and strong
growth in EBITDA3 excluding the potential for continued marketing investment in Dealer Direct
• Brazil:• We expect strong growth in revenue3 and EBITDA3 in FY22
• United States:• We expect strong growth in revenue3 and Adjusted EBITDA3 in
FY22
1. Acquisitions refers to the acquisition of Trader Interactive and tyreconnect (refer to slide 38 for more detail). 2. Adjusted NPAT growth assumes a balance sheet profile that excludes the impact of the Trader Interactive acquisition and associated funding. 3. All financial references in the International Observations section are in local currency. 40
Appendix

What is IFRS and non-IFRS financial information?
• IFRS financial information is financial information that is presented in accordance with all relevant accounting standards.
• Non-IFRS financial information is financial information that is presented other than in accordance with all relevant accounting standards. For example:
o Revenue or profit information calculated on a basis other than under accounting standard definitions or calculated with accounting standards and then adjusted e.g. “adjusted”, “underlying” or “look-through”.
What non-IFRS financial information does carsales disclose in its half year and year end results presentations?
• carsales presents reported financial information for its business segments, associates and investments where applicable IFRS financial information exists. The financial
information presented is sourced directly from financial information prepared in accordance with all relevant accounting standards and has been subject to either review or audit by carsales’ external auditors (PwC).
• In carsales’ investor presentations the company aims to provide equal or greater prominence to IFRS financial information. However, we also present or refer to non-IFRS financial information. Please note, all information labelled “Reported” in this presentation complies with IFRS.
• Non-IFRS financial information is calculated based on statutory IFRS financial information and adjusted to show either a position excluding significant items which have been removed OR presented based on carsales’ effective equity ownership interest of an entity’s underlying revenue, EBITDA or NPAT.
• Any non-IFRS financial information is clearly labelled as “underlying”, “Adjusted” or “look-through” to differentiate it from reported/IFRS financial information.
• carsales provides reconciliations on the face of slides, appendices and in footnotes of
presentations in order to allow the reader to clearly reconcile between the IFRS and non-IFRS financial information.
Why does carsales disclose non-IFRS financial information in its half year and full year results presentations?
• carsales has invested in businesses in Malaysia, Thailand, Indonesia, South Korea, Mexico, Chile, Brazil and Argentina and has become a global portfolio of online automotive assets. Accordingly carsales management believes that the presentation of additional non-IFRS information in its half year and full year results presentations provides readers of these documents with a greater understanding into the way in which management analyses the business as well as meaningful insights into the financial conditions of carsales overall performance.
• The Australian Securities and Investment Commission (“ASIC”) acknowledges the relevance of non-IFRS financial information in providing “meaningful insight” as long as it does not mislead the reader.
Overview Of Carsales Non-IFRS Financial Information
42

Reconciliation Of Reported To Adjusted
1. FY20 Asia segment revenue and expense has been restated to treat certain expenses as a reduction in revenue, resulting in a A$1.4m reduction in revenue and expense.
$A Millions Reported Adjustments Adjusted Reported Adjustments Adjusted
Revenue 394.1 27.5 421.6 427.2 10.7 437.8
Operating expense 192.1 (2.3) 189.8 185.7 (2.0) 183.6
EBITDA 202.0 29.8 231.8 241.5 12.7 254.2
EBITDA margin 51.3% 55.0% 56.5% 58.1%
Depreciation & amortisation 36.4 (8.1) 28.2 39.8 (7.9) 31.9
Net financing cost 7.1 7.2 14.3 18.7 (4.8) 13.9
Income tax expense 50.3 6.2 56.4 55.3 4.1 59.4
Profits from associates 4.2 0.5 4.7 3.9 0.4 4.3
Fair value revaluation 9.8 (9.8) - (0.4) 0.4 -
Gain / (Loss) on business disposal (0.5) 0.5 - - - -
Non-controlling interest (NCI) (1.9) 2.6 0.7 (0.5) - (0.5)
Net profit after tax 119.9 18.3 138.2 130.7 22.1 152.8
FY21FY201
43

Reconciliation Of Reported To Adjusted NPAT
$A Millions Revenue EBITDA NPAT Revenue EBITDA NPAT
Reported Financials 394.1 202.0 119.9 427.2 241.5 130.7
Dealer Support Package 27.5 27.5 19.3 10.7 10.7 7.5
Restructuring and M&A transaction costs - 2.3 2.0 - 2.0 1.5
Hedge Close out - - - - - 4.8
Option Movement in Fair Value - - (7.2) - - -
Loss / (Gain) on disposal of business - - 0.5 - - -
One-off tax adjustment - - 3.7 - - 1.3
Fair value revaluation post NCI - - (7.1) - - 0.4
Total acquired intangible amortisation - - 7.1 - - 6.7
Adjusted Financials 421.6 231.8 138.2 437.8 254.2 152.8
FY21FY201
441. FY20 Asia segment revenue and expense has been restated to treat certain expenses as a reduction in revenue, resulting in a A$1.4m reduction in revenue and expense.

“Look-through4” P&L (AUD)
$A Millions Consolidated Look-through Consolidated Look-through Consolidated Look-through
Domestic Core 299.9 299.9 313.3 313.3 4% 4%
Domestic Investments3 40.2 31.3 33.6 27.0 (17%) (14%)
Total Domestic 340.1 331.2 346.9 340.3 2% 3%
Brazil n/a 22.4 n/a 18.8 n/a (16%)
South Korea 69.7 69.7 80.1 80.1 15% 15%
Chile 4.8 4.8 4.6 4.6 (3%) (3%)
Mexico 2.1 2.1 1.7 1.7 (19%) (19%)
Argentina 0.7 0.7 0.4 0.4 (40%) (40%)
Other Asia and NZ 4.3 4.3 4.2 4.2 (3%) (3%)
Total International 81.5 103.9 91.0 109.8 12% 6%
Adjusted Revenue2 421.7 435.1 437.8 450.1 4% 3%
Domestic Core 195.5 195.5 206.5 206.5 6% 6%
Domestic Investments3 0.3 (0.4) 5.5 3.9 1733% 1002%
Total Domestic 195.8 195.1 212.0 210.4 8% 8%
Brazil n/a 9.1 - 8.3 n/a (9%)
South Korea 38.5 38.5 40.7 40.7 6% 6%
Chile 1.6 1.6 2.0 2.0 28% 28%
Mexico (4.7) (4.7) (2.0) (2.0) 57% 57%
Argentina (1.6) (1.6) (0.9) (0.9) 46% 46%
Other Asia and NZ 2.2 2.2 2.3 2.3 6% 6%
Total International 36.0 45.1 42.2 50.5 17% 12%
Adjusted EBITDA2 231.8 240.2 254.2 260.9 10% 9%
FY201 FY21 Growth %
Reported Revenue 394.2 407.6 427.2 439.5 8% 8%
Reported EBITDA 202.0 210.4 241.5 248.2 20% 18%
45
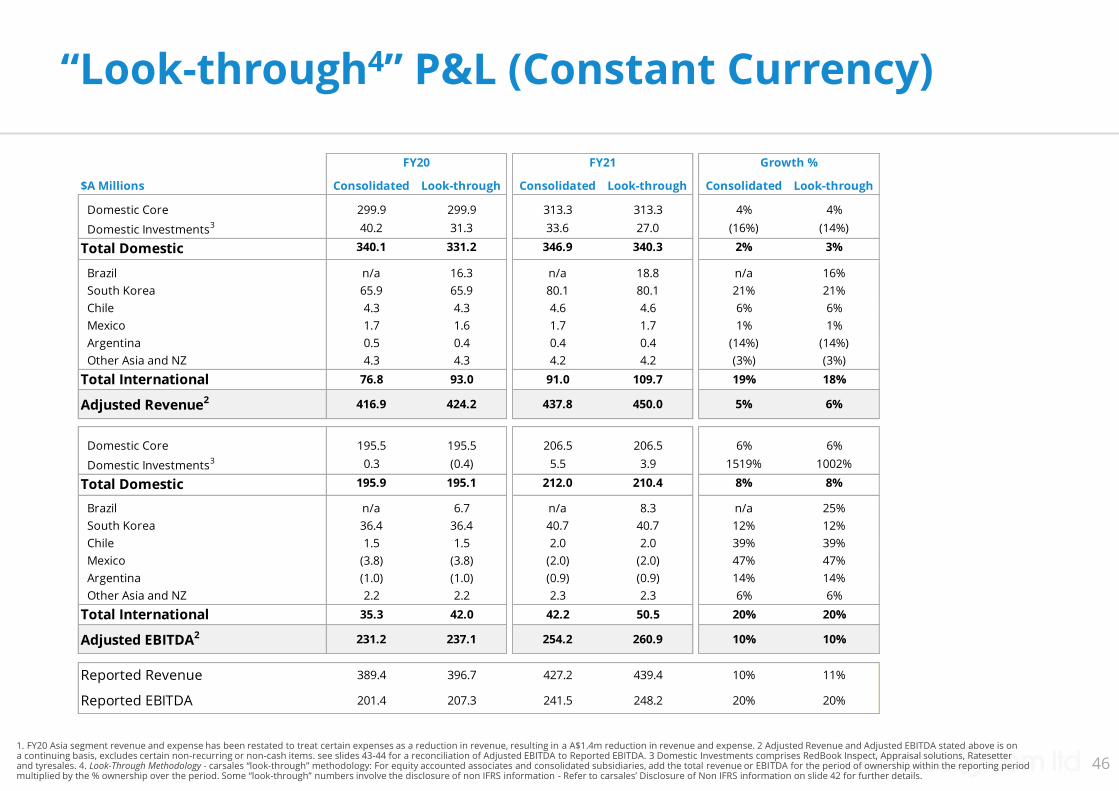
1. FY20 Asia segment revenue and expense has been restated to treat certain expenses as a reduction in revenue, resulting in a A$1.4m reduction in revenue and expense. 2 Adjusted Revenue and Adjusted EBITDA stated above is on a continuing basis, excludes certain non-recurring or non-cash items. see slides 43-44 for a reconciliation of Adjusted EBITDA to Reported EBITDA. 3 Domestic Investments comprises RedBook Inspect, Appraisal solutions, Ratesetter and tyresales. 4. Look-Through Methodology - carsales “look-through” methodology: For equity accounted associates and consolidated subsidiaries, add the total revenue or EBITDA for the period of ownership within the reporting periodmultiplied by the % ownership over the period. Some “look-through” numbers involve the disclosure of non IFRS information - Refer to carsales’ Disclosure of Non IFRS information on slide 42 for further details.
1. FY20 Asia segment revenue and expense has been restated to treat certain expenses as a reduction in revenue, resulting in a A$1.4m reduction in revenue and expense. 2 Adjusted Revenue and Adjusted EBITDA stated above is on a continuing basis, excludes certain non-recurring or non-cash items. see slides 43-44 for a reconciliation of Adjusted EBITDA to Reported EBITDA. 3 Domestic Investments comprises RedBook Inspect, Appraisal solutions, Ratesetter and tyresales. 4. Look-Through Methodology - carsales “look-through” methodology: For equity accounted associates and consolidated subsidiaries, add the total revenue or EBITDA for the period of ownership within the reporting periodmultiplied by the % ownership over the period. Some “look-through” numbers involve the disclosure of non IFRS information - Refer to carsales’ Disclosure of Non IFRS information on slide 42 for further details.
“Look-through4” P&L (Constant Currency)
$A Millions Consolidated Look-through Consolidated Look-through Consolidated Look-through
Domestic Core 299.9 299.9 313.3 313.3 4% 4%
Domestic Investments3 40.2 31.3 33.6 27.0 (16%) (14%)
Total Domestic 340.1 331.2 346.9 340.3 2% 3%
Brazil n/a 16.3 n/a 18.8 n/a 16%
South Korea 65.9 65.9 80.1 80.1 21% 21%
Chile 4.3 4.3 4.6 4.6 6% 6%
Mexico 1.7 1.6 1.7 1.7 1% 1%
Argentina 0.5 0.4 0.4 0.4 (14%) (14%)
Other Asia and NZ 4.3 4.3 4.2 4.2 (3%) (3%)
Total International 76.8 93.0 91.0 109.7 19% 18%
Adjusted Revenue2 416.9 424.2 437.8 450.0 5% 6%
Domestic Core 195.5 195.5 206.5 206.5 6% 6%
Domestic Investments3 0.3 (0.4) 5.5 3.9 1519% 1002%
Total Domestic 195.9 195.1 212.0 210.4 8% 8%
Brazil n/a 6.7 n/a 8.3 n/a 25%
South Korea 36.4 36.4 40.7 40.7 12% 12%
Chile 1.5 1.5 2.0 2.0 39% 39%
Mexico (3.8) (3.8) (2.0) (2.0) 47% 47%
Argentina (1.0) (1.0) (0.9) (0.9) 14% 14%
Other Asia and NZ 2.2 2.2 2.3 2.3 6% 6%
Total International 35.3 42.0 42.2 50.5 20% 20%
Adjusted EBITDA2 231.2 237.1 254.2 260.9 10% 10%
FY20 Growth %FY21
Reported Revenue 389.4 396.7 427.2 439.4 10% 11%
Reported EBITDA 201.4 207.3 241.5 248.2 20% 20%
46