Embed Size (px)
Citation preview
2021-2022Budget Workshop
February 22, 2021

Agenda
● Historical Financial Data
● 2021-2022 Budget Parameters
● Preliminary Five-Year Financial Plan
● Fund Balance Discussion

Impact of HB3 on GCISD Total Funding
2019-2020(old law)
2019-2020(new law) Difference
1 M&O Tax Collections $162,717,907 $151,765,740 ($10,951,357)
2 Recapture (64,377,182) (49,711,052) 14,666,130
3 M&O Tax Collections remaining in GCISD $98,340,725 $102,054,688 $3,714,773
4 Total State Aid $9,551,701 $9,289,229 ($262,472)
5 Total GCISD Funding $107,892,426 $111,343,917 $3,452,301

Historical Financial Data
Year Cost of Living Increase
StartingTeacher
Pay Other
2020-2021 1% of Midpoint+Equity Adjustments $54,000 One-time payment—Greater of 1% or $500
2019-2020 Teachers with 1-5 Years – 3% of MidpointTeachers with 5+ Years – 3% of Midpoint +$500All other employees – 2% of Midpoint
$53,500 TASB Compensation Study and HB3 Requirements
2018-2019 2.5% of Midpoint + Equity Adjustments $51,500 TASB Compensation Study
2017-2018 2% of Midpoint $50,000 One-time payment – Greater of 1% or $500Auxiliary adjustment: raised minimum to $10.50/ hour plus 2%
2016-2017 2% $50,000

Historical Financial Data
q General Operating Fund Balance-
q As of 6/30/20 - $58,145,036
q 31.2% of Annual Operating Expenditures
q Fund Balance Policy = 20% of Annual Operating Expenditures
$0.00$10.00$20.00$30.00$40.00$50.00$60.00$70.00
2010
-11
2011
-12
2012
-13
2013
-14
2014
-15
2015
-16
2016
-17
2017
-18
2018
-19
2019
-20
Milli
ons
Fund Balance History
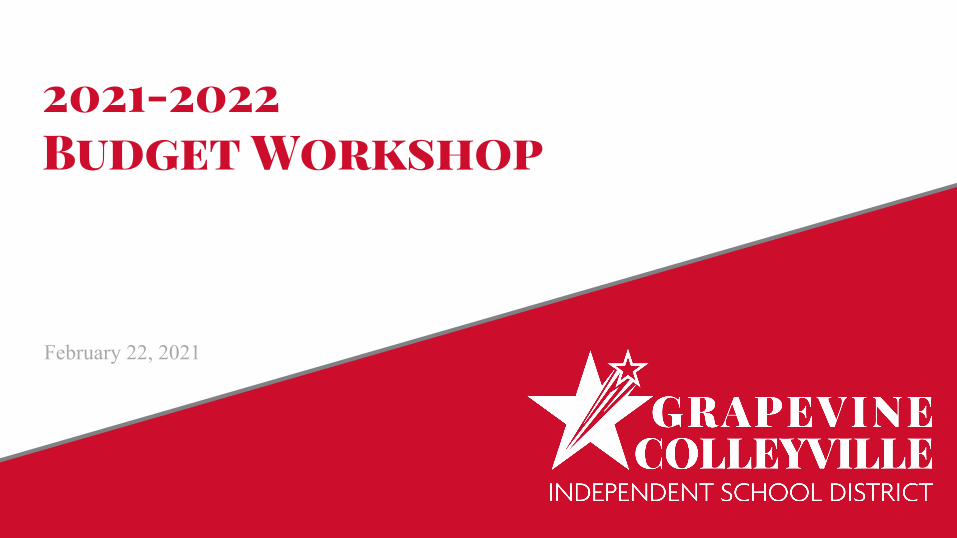
Historical Payroll vs. Non-Payroll Expenditures
$90.8 $87.3 $87.4 $89.1$94.9 $97.4 $100.4 $105.6 $109.3 $114.2
$13.4 $12.9 $13.4 $13.8 $13.3 $13.8 $14.4 $14.7 $15.4 $15.2$5.0
$15.0$25.0$35.0$45.0$55.0$65.0$75.0$85.0$95.0
$105.0$115.0
Payroll Non-Payroll

Historical Financial Data
Fiscal Year Amended Budget
Actual Operating Results
2019-2020 ($5,251,244) $1,025,313
2018-2019 ($6,070,718) $185,275
2017-2018 ($4,399,427) $993,030
2016-2017 ($83,043) $2,734,144
2015-2016 ($9,256,224) ($2,803,542)
2014-2015 ($4,583,688) $276,832
2013-2014 ($8,389,244) $2,885,998
2012-2013 ($5,986,602) ($521,487)
2011-2012 $5,373,624 $9,493,117
2010-2011 $1,146,977 $7,890,871

GCISD Robin Hood Payment History
$0
$10
$20
$30
$40
$50
$60
2012
2013
2014
2015
2016
2017
2018
2019
2020
2021
Milli
ons
Year Amount
2012 $28,968,997
2013 $27,857,927
2014 $24,248,621
2015 $24,412,421
2016 $25,140,386
2017 $30,665,351
2018 $44,223,887
2019 $53,798,333
2020 $49,715,634
2021* $53,830,394
Since Robin Hood was implemented in 1994, GCISD has paid over $784.1 Million to the State.
*Projected

2020-2021 Enrollment Data
Grade ProjectionsPEIMS
Snapshot
Differencefrom
Projections As of 2/22/21
Difference from
ProjectionsPre-K/EE 241 229 (12) 247 6
K 872 740 (132) 742 (130)
1 932 871 (61) 876 (56)
2-5 3,788 3,621 (96) 3,603 (185)
6-8 3,022 2,912 (110) 2,906 (116)
9-12 4,276 4,238 (39) 4,222 (54)
Total 13,131 12,611 (450) 12,596 (535)
iUprep 1,175 1,208 33 1,152 (23)
Grand Total 14,306 13,819 (417) 13,748 (558)
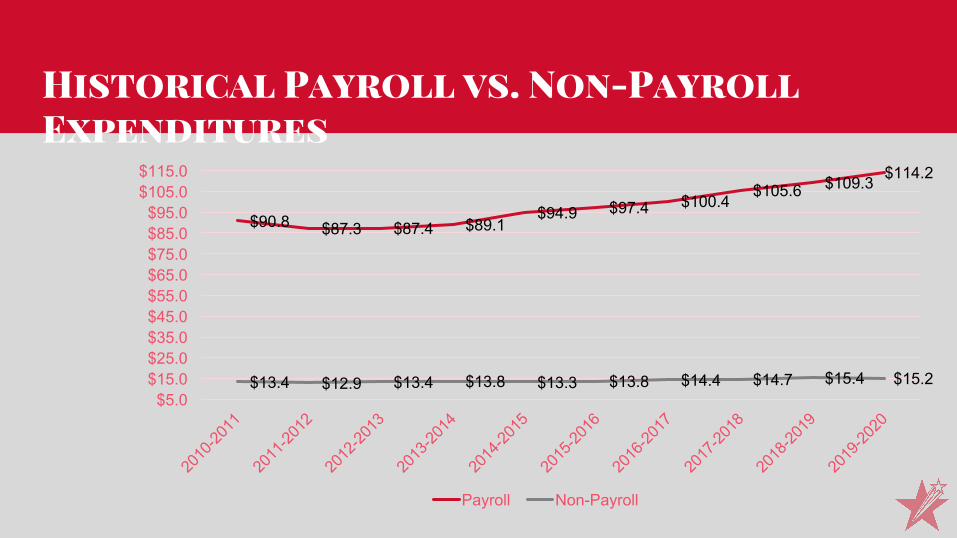
2021-2022 Budget Parameters
● Student enrollment (excluding iUniversity Prep) – 12,480
● Student enrollment for iUniversity Prep – 1,400
● Local appraisal district taxable values - $17.8 Billion ○ 0% increase from 2020 values as of January 2021○ Assuming an increase in residential property values will offset a decrease in commercial property values○ 50% of GCISD tax base is residential and 50% is commercial
● State Comptroller Values - $16.7 Billion○ 0.46% decrease from January 2021 values
● State funding per capita amount - $200○ Decrease from FY 2021 amount of $411.574○ Final amount approved by the State in September 2021
● Cost-of-living adjustments based on various models recommended by TASB compensation study
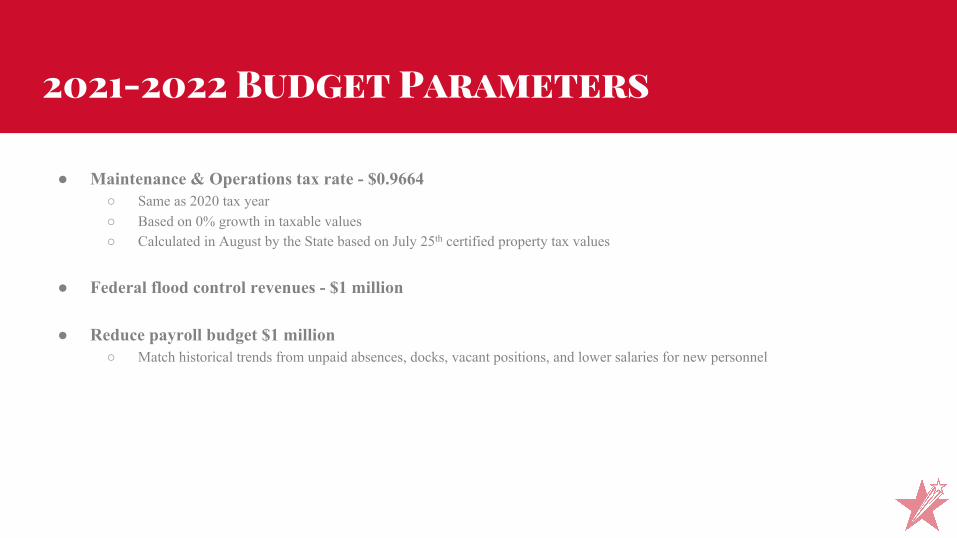
2021-2022 Budget Parameters
● Maintenance & Operations tax rate - $0.9664○ Same as 2020 tax year○ Based on 0% growth in taxable values○ Calculated in August by the State based on July 25th certified property tax values
● Federal flood control revenues - $1 million
● Reduce payroll budget $1 million○ Match historical trends from unpaid absences, docks, vacant positions, and lower salaries for new personnel

Five-Year Projection Assumptions: Student Data
2020-2021 2021-2022 2022-2023 2023-2024 2024-2025
1 Enrollment (Excluding iUprep) 12,611 12,480 12,351 12,337 12,329
2 iUniversity Prep Enrollment 1,208 1,400 1,500 1,600 1,700
3 TOTAL ENROLLMENT 13,819 13,880 13,851 13,937 14,029
4 Change from Prior Year 61 (29) 86 92
5 Average Daily Attendance (ADA) 13,357.89 13,196.23 13,161.16 13,244.82 13,334.68
6 Change from Prior Year (161.66) (35.07) 83.66 89.86
Note: All student population counts for allotments remain the same in all years.

Five-Year Projection Assumptions: Other Data Elements
2020-2021 2021-2022 2022-2023 2023-2024 2024-2025
1 Taxable Value Growth -- 0% 1% 2% 2%
2 CPTD Values $16.8 B $16.7 B $16.9 B $17.2 B $17.6 B
3 M&O Tax Rate $0.9664 $0.9664 $0.9538 $0.9414 $0.9292
4 Per Capita Rate $411.574 $200 $400 $200 $400
5 Cost of Living Adjustments -- 1% 1% 1% 1%
6 Inflation for Non-Payroll Costs -- 2% 2% 2% 2%
7 Teacher FTE Reductions -- 6 6 -- --
Note: Projections are based on current law.
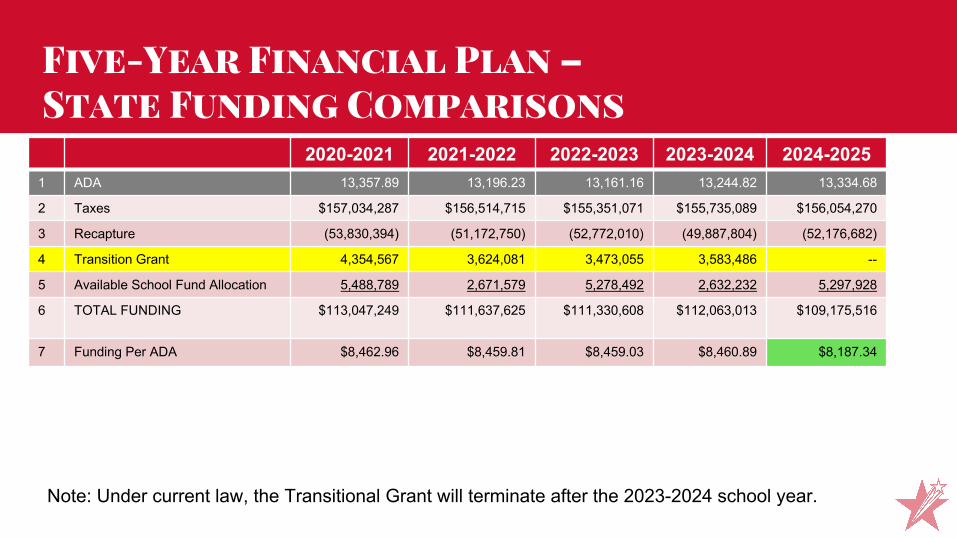
Five-Year Financial Plan –State Funding Comparisons
2020-2021 2021-2022 2022-2023 2023-2024 2024-20251 ADA 13,357.89 13,196.23 13,161.16 13,244.82 13,334.68
2 Taxes $157,034,287 $156,514,715 $155,351,071 $155,735,089 $156,054,270
3 Recapture (53,830,394) (51,172,750) (52,772,010) (49,887,804) (52,176,682)
4 Transition Grant 4,354,567 3,624,081 3,473,055 3,583,486 --
5 Available School Fund Allocation 5,488,789 2,671,579 5,278,492 2,632,232 5,297,928
6 TOTAL FUNDING $113,047,249 $111,637,625 $111,330,608 $112,063,013 $109,175,516
7 Funding Per ADA $8,462.96 $8,459.81 $8,459.03 $8,460.89 $8,187.34
Note: Under current law, the Transitional Grant will terminate after the 2023-2024 school year.
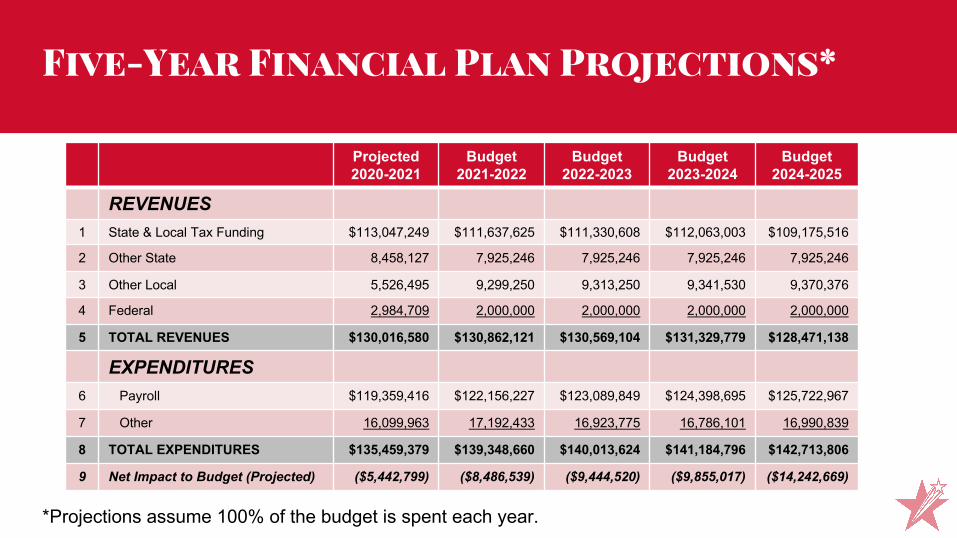
Five-Year Financial Plan Projections*
Projected2020-2021
Budget2021-2022
Budget2022-2023
Budget2023-2024
Budget2024-2025
REVENUES1 State & Local Tax Funding $113,047,249 $111,637,625 $111,330,608 $112,063,003 $109,175,516
2 Other State 8,458,127 7,925,246 7,925,246 7,925,246 7,925,246
3 Other Local 5,526,495 9,299,250 9,313,250 9,341,530 9,370,376
4 Federal 2,984,709 2,000,000 2,000,000 2,000,000 2,000,000
5 TOTAL REVENUES $130,016,580 $130,862,121 $130,569,104 $131,329,779 $128,471,138
EXPENDITURES6 Payroll $119,359,416 $122,156,227 $123,089,849 $124,398,695 $125,722,967
7 Other 16,099,963 17,192,433 16,923,775 16,786,101 16,990,839
8 TOTAL EXPENDITURES $135,459,379 $139,348,660 $140,013,624 $141,184,796 $142,713,806
9 Net Impact to Budget (Projected) ($5,442,799) ($8,486,539) ($9,444,520) ($9,855,017) ($14,242,669)
*Projections assume 100% of the budget is spent each year.

Five-Year Financial Plan-Fund Balance Analysis
2020-2021 2021-2022 2022-2023 2023-2024 2024-2025
1 Beginning Fund Balance $58,145,036 $52,702,237 $44,215,699 $34,771,180 $24,916,162
2 Net Change (Projected)* (5,442,799) (8,486,538) (9,444,519) (9,855,018) (14,242,669)
3 Ending Fund Balance $52,702,237 $44,215,699 $34,771,180 $24,916,162 $10,673,493
4 Targeted Fund Balance(20% of Operating Costs) $37,857,955 $38,104,282 $38,557,127 $38,214,520 $38,978,098
5 Target Overage/(Shortage) $14,844,282 $6,111,417 ($3,785,947) ($13,298,358) ($28,304,605)
*Projections assume 100% of the budget is spent.
General Operating Fund Balance Policy: CE(LOCAL)
● Financial Goal: to have sufficient fund balance to be able to maintain fiscal independence in case of a financial need or crisis.
● At a minimum, the District shall maintain assigned and unassigned fund balances equal to or exceeding 20% of total annual operating expenditures.
● The Board may commit a portion of the fund balance for a specific purpose by resolution during a Board meeting.
○ The Commitments can be amended at any time by Board approval.

2019-2020 Ending Fund Balance Classifications
Non-Spendable Fund BalanceInventories $311,505
Prepaid Items 228,918
Total Non-Spendable Fund Balance $540,423
Committed Fund Balance*Major Maintenance Expenditures $4,000,000
Potential Claims & Judgements 500,000
Self Insurance Workers Comp Plan Claims 500,000
LEAD 2.0 Strategic Plan 2,524,734
Future Compensation Adjustments 5,000,000
Total Committed Fund Balance $12,524,734
Assigned & Unassigned Fund Balance
Assigned Fund Balance $6,280,823
Unassigned Fund Balance $38,799,056
Total Fund Balance $58,145,036
*Committed by resolution with Board approval.

Why is maintaining a General Operating Fund Balance Important?
v Measures the District’s financial stability
v CASH FLOW - Provides flexibility when District’s revenues are not received and expenditures are not incurred in equal monthly amounts.
v Tax revenues collected during the months of November through January
v Financial Goal of GCISD – to have sufficient fund balance to be able to maintain fiscal independence in case of a financial need or crisis.
v Lower revenues (tax collections reduced/delayed, State funding reduced/delayed) or
v Higher expenditures (unfunded State mandates, gas and utility price fluctuations, contract increases)
v Unanticipated emergency, natural disaster, pandemic, etc.

Why is maintaining a General Operating Fund Balance Important?
v Fund balance should be used for “non-recurring” or “one time” expenditures and never used for “recurring expenditures” such as salaries.
v Pursuant to the Government Finance Officers Association “It is essential that governments maintain adequate levels of fund balance to mitigate current and future risks (e.g. revenue shortfalls and unanticipated expenditures).”
v Adequate fund balance is “Best Practice” of the following:
v Government Finance Officers Association
v Texas Education Agency
v Bond Rating Agencies

What is an Adequate Fund Balance?
Government Finance Officers Association recommends at a minimum at least 2 months of General Fund revenues or expenditures
Texas Education Agency Financial Integrity Rating System of Texas (FIRST) ratings require an aggregate assigned & unassigned fund balance of more than 75 days (approximately 20%) of operational expenditures in order to receive “Superior Achievement” status.
GCISD Board Policy CED(LOCAL) requires at a minimum, the District shall maintain assigned and unassigned fund balances equal to or exceeding 20% of total annual operating expenditures.

What is an Adequate Fund Balance?
Bond Rating Agencies use fund balance as a measure of school districts’ financial solvency
Texas School District Medians for Moody’s Ratings-Fund Balance as a Percentage of Operating Revenues*
Description “Aaa” “Aa1” “Aa2” “Aa3”
Number of Texas Public School Districts Rated 8 25 43 67
General Fund Balance as a % of General Fund Revenues 35.7% 35.2% 35.3% 35.6%
GCISD 2019-2020 Fund Balance 32.29% of Total Revenues (less TIF)
*Source: BOK Financial Securities

What is an Adequate Fund Balance?
$0
$50
$100
$150
$200
$250
Milli
ons
Cash In Cash Out
2019-2020 Cash In* Cash Out* Difference
July $41.9 $39.5 $2.4
August 38.9 42.6 (3.7)
September 16.7 24.3 (7.6)
October 23.1 30.2 (7.1)
November 57.1 57.1 --
December 114.7 126.8 (12.1)
January 236.4 235.6 0.8
February 89.6 88.6 1.0
March 89.5 73.2 16.3
April 53.8 49.9 3.9
May 21.8 22.2 (0.4)
June 53.6 46.4 7.2
*Amounts in Millions.
2019-2020 Cash Flow

Questions??