Embed Size (px)
Citation preview

HT RBTR/ Government of India 7 T/Ministry of Railways
k T/Railway Board)
No. 2020/W-1/Genl./Survey Report (E-off:3334538) New Delhi, Dt. 06.01.2021
The General Managers, All Indian Railways.
Director General Indian Rly. Institute of Civil Engg. (IRICEN), Rail Path, Pune, Pin-411001 (Maharashtra).
Sub: Use of Modern Survey Technologies for Survey of New Line, Gauge
Conversion & Doubling Projects.
Ref: () Railway Board letter No. 98/W-VGenl./O/30-Pt, dated 26.06.2020, i) Letter No. CAOC-TUMisc/2020 dated 16.10.2020.
A committee of thre officers was nominated by Board (the then ME) vide Railway
Board letter under reference (i) to study and evaluate various Modern Survey Technologies being used worldwide and in India.
The Committee has submitted its Report vide letter under reference (ii). The
Committee has discussed in detail the existing practices and use of modern technology for
surveys. Committee has also provided comparison of different technologies for different type
of Surveys in the report. The Committee, besides other recommendations, has recommended
that the report be circulated to field officers as a guiding factor while taking decision in the
ficld regarding adoption of technology for surveys. The Report has been accepted by Board
(Member/Infra). Report has been uploaded on Railway Board web site under Circulars in
(https://www.indianrailways.gov.in/railwayboard/view_section. Works Directorate. isp?id=0,1.304,366.556)
Board (Member/Infra) has also approved that Modern Survey Techniques may be
introduced as a regular Course in IRICEN as well as may be included as one or two lectures
in Phase-I training programme of IRSE Probationers. Any survey estimate (of a sanctioned/to
be sanctioned survey) having elements of these techniques should be acceptable along with
proper justification.
All Zonal Railways should envisage use of modern survey technologies for preparing
Survey Reports/Detailed Project Reports for rail projects of New Line, Gauge Conversion and Doubling as per the Report.
(B. K. Gupta) Executive Director/Proj.M.
Railway Board

GOVERMRNT OF INDIA
MINISTRY OF RAILWAYS
Report of Committee on
Various Modern Survey Technologies
October- 2020
786991/2020/O/o Director (Works)-II7

1
Table of Contents
Para Description Page No.
Preface 1
A Introduction 2
B Conventional Survey Technique 3
C Important terminology of Modern Surveying Technologies 7
D Modern Surveying Technologies 15
E Photogrammetry 17
E.1- Hi- Resolution Satellite Imagery 17
E.2- Drone Photogrammetry 22
F LiDAR 24
G Accuracy / Quality of output 30
H Data Acquisition & Processing time 33
I Cost 35
J Comparison of various Survey Technologies 37
K Design of Alignment, Preparation of Estimate, Maps and
Drawing using Modern Surveying Techniques.
38
L International Best Practices 42
M Conclusion 42
N Recommendation 44
References 45
Annexure-I 46
Annexure-II 47
Annexure-III 49
786991/2020/O/o Director (Works)-II8

2
PREFACE
Various types of surveys are conducted as per Indian Railway Code for
Engineering Department which includes Preliminary surveys (PETS) and Final
Location Survey (FLS). Large number of Rail projects of New Line, Gauge
Conversion and Doubling are being planned and executed by Indian Railway
where engineering studies are to be performed in very short time period and in
a most accurate manner. Presently, in the absence of defied framework,
modern survey technologies are being used on IR in a selective manner based
on the project requirement.
In this connection, Board (ME) has nominated a Committee of 3 officers, vide
Railway Board Letter No. 98/W-I/Genl./O/30-Pt Dated 26.06.2020, to study and
evaluate the various Modern Survey Technologies being used worldwide and in
India. The Committee members are:
1. Shri S. K. Jha, CAO/CII/NR
2. Shri H.S. Yadav, CAO/C-I/NFR
3. Shri Sanjay Khare, Sr. Prof./Works/IRICEN, Pune
The Terms of Reference of the Committee are as under: -
To study the various Modern Survey Technologies such as LiDAR
Photogrammetry based survey and to formalize the scope & specification
of these technologies for conducting PETS & FLS.
To evaluate and compare the different technologies in terms of cost time
requirement and quality of output generated for conducting PETS & FLS.
To give recommendations about technologies to be preferred in PETS &
FLS in various terrains for different type of projects.
The committee examined various prevailing practices adopted in Indian
Railway. Most of the surveys are conducted using conventional survey
technologies except in selective projects involving challenges like hilly terrain,
complicated yard layouts etc. where modern survey technologies based on
Remote sensing (Photogrammetry/ LiDAR based survey) are used.
This Report is based on literature survey, experience of construction units of NR
& NFR, provisions given in IR Engineering Code and Presentations shared by
survey organisation /consultant in IRICEN. The views expressed are subject to
modification from time to time in the light of future developments on the
subject.
786991/2020/O/o Director (Works)-II9

3
REPORT
[A] INTRODUCTION
Planning of a new railway alignment can be expensive and time-consuming
process by conventional surveying methods. There are many issues that need
to be addressed to arrive at the most optimum rail connectivity between
obligatory points considering the terms of reference. The challenge is to find
out most feasible, economical and stable alignment and to identify that how the
alignment will be influenced by the location properties like geographical,
topographical, soil and slope variations and other geological conditions. So it is
very important to conduct survey of an area very precisely for careful planning
and designing of various infrastructure projects such as road, railways,
transmission lines, pipelines etc.
The factors like cost & ease of construction, serviceability, environmental and
social Impact should also be considered during the finalization of an alignment.
‘Indian Railway Code for The Engineering Department’ categorizes Engineering
survey into three categories:
Reconnaissance Survey
Preliminary Survey
Final Location Survey
Reconnaissance Survey
• The main objective of reconnaissance survey is to examine the general
characteristics of the area for the purpose of determining the most
feasible route, or routes, for further more detailed investigations.
• It is a rough, quick investigation of an area with a view to determine the
technical feasibility and approximate cost of one or more routes for a
proposed Railway line with the help of field reconnaissance, SoI
topographical maps and other available resources.
• Particular attention is paid to ascertain the waterway requirement, and
the best sites for stations, crossings of streams, bridges and roads.
• It consist of Trafic and Engineering Survey.
786991/2020/O/o Director (Works)-II10

4
Preliminary Survey
• Preliminary survey consists of a detailed instrumental examination of the
route / or routes selected as a result of "Reconnaissance" in order to
obtain a close estimate of the probable cost of the projected line for
making fair investment decision.
• Selected routes are put on paper and details such as gradient, curves,
contours etc. are worked out.
• The long sections and formation levels are prepared and details of
structures worked out.
• Most economical and efficient route is decided along traffic survey.
Final Location Survey
• A Final Location Survey will generally be a post investment decision
investigation to prepare working details and to make accurate costing
with detailed survey of the selected most economic route.
• Hydrological, geotechnical and geological investigations are carried out
along the finalized route.
• The center line of the railway line is located on paper and stacked on
ground. Details such as gradient, curves, contours, etc. are worked out.
• All the working drawings are prepared.
There are broadly two types of survey techniques which are currently practiced,
namely Conventional and Modern survey methods. In conventional method,
survey is carried out manually using available resources [Survey of India (SOI)
maps & toposheets] and by measuring topographical features of area using
survey equipments. The main disadvantages of using conventional methods of
surveying are the following.
They are tedious and time-consuming.
Quality & accuracy of results are dependent on human skills.
Difficulty in obtaining data at inaccessible locations especially in dense
forests and mountainous terrain.
Huge volume of data is processed manually and form of data is mostly
incompatible with software.
786991/2020/O/o Director (Works)-II11

5
Most of the conventional survey techniques only provide topographical
data.
Results are not very presentable and difficult to comprehend.
Revolutionary changes have taken place in last few years in the field of
surveying. With rapid advancement in the technologies like GNSS (Global
Navigation Satellite System), LiDAR (Light Detection and Ranging), Aerial
Photogrammetry from aircraft/ UAV (Unmanned Aerial Vehicle), Satellite
imagery etc., there has been drastic improvement in the manner of determining
dimensions and contour of the Earth’s surface. Generation of different thematic
maps of area on geographic information system (GIS) software by making using
of behavior of different landforms on exposure to active/passive
electromagnetics radiations through satellite/drone imagery has vastly
improved the interpretation of geology, drainage patterns and geological
structures. All these technologies work on the principle of Remote sensing. Also,
the use of seismic & electromagnetic waves (geophysical survey) to interpret
the lithology of the area has also increased the pace & reduced the cost of
survey & design works by reducing the need of geotechnical investigation.
The details of these two different techniques i.e. the Conventional and Modern
surveying techniques, have been elaborated in the subsequent paragraph
below.
[B] Conventional Survey Technique –
In the conventional method of surveying technique, initial planning is carried
out on the basis of available Survey of India (SOI) Topographical maps in
various scales mainly 1:50,000 and 1:25,000 with contour interval of 20m to
40m. These SOI maps are referred to get the general information regarding
terrain, various structural features and spot elevation range. Since, these
toposheets are usually old and of larger scale, it has low accuracy level and
therefore can only be referred for initial project planning. Thereafter, it is
assisted by physical survey in field. Earlier, for this purpose, old equipments
like prismatic compass, clinometer, Abney level/ Altimeter, Pedometer, Aneroid
barometer, Clinometer, Ghat tracer etc. were being used. But now it is mostly
done using modern survey instruments like Total station, DGPS, Digital Level
etc. The result of this is to reproduce the topographical maps in smaller scale
(in general 1:5000 or smaller) and having finer accuracy which is fit for
engineering purpose.
786991/2020/O/o Director (Works)-II12

6
A brief of these modern equipments are given below:
B.1 Total Station
A total station combines the functions of a theodolite and a level and more. It
uses a laser or infrared beam. It is microprocessor based and can store data
measured. The Microprocessor unit enables computation of data collected to
calculate the horizontal distance, coordinates and reduced level of a point.
These devices save the surveyor from collecting multiple measurements for
each point location whose position needs to be known, as triangles can be
constructed trigonometrically once an internal angle (between baseline and
unknown point) and two edge lengths (the baseline and measured distance to
unknown point) are known. Total stations have LCD displays where one can set
up the kind of survey task one wants to carry out. Once set up, it will prompt
for set up data (co-ordinates of the benchmark, height of the instrument over
the benchmark etc.).
Survey with total station start with establishing Ground control point (GCPs).
This generally requires close traverse for error distribution and producing error
free co-ordinates (X, Y & Z) of GCP. This is followed by topographical survey
and alignment survey.
B.2 Digital Auto Level
Digital automatic level is a precise instrument used for precise leveling.
Operation of digital levels is based on the digital processing of indications of a
coded staff. At the beginning of measurement, a visual pointing of the
786991/2020/O/o Director (Works)-II13

7
instrument into the surface of leveling meter is performed. After that the
instrument automatically points the focus of its optical system on the surface
of the meter and then a rough correlation calculation is performed followed by
the precise correlation. According to the data received in the processor of the
instrument an exact distance from the axes of the instrument to the surface of
the level meter is calculated. According to the information received by decoding
the data as reflected from digital staff the height of the level placing is calculated
in the processor. All the data measured during the day is saved in the
instrument memory and can be brought out into readable formats in computers
for further calculations.
For small stretch, the conventional survey will be very useful as it can produce
desired result at low cost. However, Physical survey with these equipments
involves large manpower and is time consuming which makes the physical
survey very difficult and expensive for difficult hilly terrain as well as for large
stretches. Hence the need for Modern Surveying Techniques.
But before we describe Modern Surveying techniques, first we must get familiar with some important
tools/terminologies used in it.
[C] Important tools/terminologies of Modern Surveying Techniques:
C.1 SPATIAL DATA
Spatial data, also known as geospatial data, is information about a physical
object that can be represented by numerical values in a geographic coordinate
system. Spatial data represents the location, size and shape of an object on
planet Earth such as a building, lake, mountain or township.
Geographic Information Systems (GIS) or other specialized software
applications can be used to access, visualize, manipulate and analyze geospatial
data.
Spatial data are of two types according to the storing technique, namely, raster
data and vector data. The whole geographic area is divided into groups of
individual cells, which represent an image. Raster formats are grids of cells or
pixels. Raster formats are useful for storing GIS data that vary, such as
elevation or satellite imagery. Vector formats are polygons that use points
(called nodes) and lines. Vector formats are useful for storing GIS data with
firm borders, such as school districts or streets.
786991/2020/O/o Director (Works)-II14

8
C.2 DIGITAL ELEVATION MODEL
Digital elevation model is a 3D representation of the earth’s surface created
from a terrain's horizontal (X, Y) & elevation (Z) data. There are three types of
elevation models.
• DSM (Digital Surface Model): 3D Surface elevation model which contains
all the natural and man-made features (i.e. vegetation, buildings etc.)
• DEM (Digital Elevation Model): 3D elevation model without natural and
man-made features and furnished in raster format.
• DTM (Digital Terrain Model): It is the DEM in which terrain data is further
enhanced with break lines (Ridge & valley line, cutting etc.), creating
greater accuracy as it contains additional information of defined terrain
features like roads, rivers, bridges etc.
DEM is often used as a generic term for DSMs and DTMs, only representing
height information without any further definition about the surface.
786991/2020/O/o Director (Works)-II15

9
Digital elevation models (DEM) can also be prepared from digitalized
topographical sheets, topographical data measured with the help of total station
or any other point cloud data.
C.3 Terms defining Image Quality:
C.3.1 Radiometric resolution/Bit: Amount of detail in each pixel
expressed in units of bits. 1-bit raster contains two values (0&1) and has two
shades black and white. 8-bit raster ranges from 0-255 (28=256 values in total)
means 256 colors of shades of each band will be available. Typical Black & White
images from a source are 8 bits, meaning the information is represented with
a value of 0-255 or 256 in total.
In contrast, a colour image is represented using 3 channels, Red, Green, Blue
and each channel is 8 bits, equaling 24 bits of information. Humans visualise
colours as a combination of the three primary colours red, green and blue. Every
colour and corresponding shade is represented using a combination of these 3
primary colours and the intensity of each colour. A value of 0 in the blue channel
means that pixel is black. If the value of a pixel in blue channel is 255, it means
that the pixel is bright blue. So if a blue channel pixel has a radiometric
resolution of 8 bits, there will be 256 shades of blue.
C.3.2 Off Nadir angle (ONA): Angle at which an image is captured by
Satellite. Straight vertical view (0 degree) is the most preferred and the more
is the ONA the more is the distortion of an image.
In Ortho rectified products, ONA is to be restricted to 30 degrees in the worst
case. Less than 10 degrees is preferable.
786991/2020/O/o Director (Works)-II16

10
C.3.3 Image Resolution: Defines the pixel size, detail and the accuracy
of the image.
Spatial Resolution: Specifies the pixel size of a satellite image. The higher
the spatial resolution, the finer details it will contain. 30cm spatial resolution
satellite image means the pixel size is 30cmx30cm.
Spectral Resolution: Ability of the sensor to define fine wavelength
interval. It is number of bands in the spectrum in which the instrument can
take measurements. For instance
• Panchromatic: A single band image which is black and white
• Colour: It is a 3 band image consisting of Red, green and Blue.
• Multispectral: Multispectral products include the Multispectral bands
(Color and Near-Infrared). For example, the band order in a 4-band
multispectral product is Blue, Green, Red and Near Infrared.
• Hyperspectral: A Hyperspectral image consists of hundred or more
contiguous spectral bands. These images have potential applications in
agricultural and coastal management.
786991/2020/O/o Director (Works)-II17

11
C.4 GROUND CONTROL POINTS (GCP)
GCP are the points which are required to be measured at site to get fairly
accurate ground coordinates at any location identifiable on satellite/drone
image or LiDAR point cloud. There is also a need to create a local geoid model
for converting the ellipsoid heights into orthometric /MSL heights very precisely.
The Horizontal coordinates can be measured with the help of Total station,
DGPS (Differential Global Positioning System) etc. and vertical coordinates can
be obtained by levelling survey, total station, using EGM (Earth Gravitation
Model) /Geoid models etc. The DGPS and geoid models are explained further in
brief.
The GCP locations are selected based on following criteria:
One GCP to be selected for every 50 Sqkm for satellite imagery and at
every 250 to 500 m for drone imagery and made uniformly distributed
according to the area of the image.
The requirement of GCPs for drone LiDAR is approximately every 1 KM
and for the aerial helicopter LiDAR the requirement of known (X,Y) point
is at every 50 KM approximately and known (Z) every 5-10 KM to achieve
the target accuracy of 1 M because of better equipment.
Selected location should be easy to identify like the corner of a building,
bridge, corner of a field etc.
Common or repetitive features like parking lots or lines on a highway
should be avoided.
Collect GCPs in the area of overlap between two or more images wherever
possible. GCPs collected in multiple images helps to increase the
accuracy.
The GCP locations which are first identified qualitatively on raw satellite/drone
images, are measured at site with the help of DGPS/Total Station/Levelling/
RTX as explained below.
DGPS: is used to measure latitude, longitude & ellipsoid height with
reference to some known point (X,Y&Z) established by Survey of India
(SOI). The ellipsoid height has to be converted to orthometric height
(MSL) with the help of the latest earth gravitational model (EGM-08).
Total station: The (X, Y & Z) coordinates of a point can also be measured
with traversing from a known SOI point to the point of interest (GCP).
Levelling: The Z coordinate of a GCP can be established by doing levelling
survey from a known GTS benchmark of SOI to the identified GCP.
786991/2020/O/o Director (Works)-II18

12
RTX: RTX (real time measurement) is a GNSS based technology which
does not need a reference known point as required for DGPS to measure
the latitude, longitude & ellipsoid height of a GCP under 15 cm horizontal
accuracy at 95% confidence levels. RTX method of measurement uses
Advanced PPP (Post Precise Positioning) technique which unlike the usual
DGPS does not require any office process after the measurement.
Coordinates taken from the site are usable as final coordinates. Trimble
R10 GNSS receiver is one such type used to perform this measurement.
C.5 Earth Gravitation Model (EGM)/Geoid Model
All the GNSS (Global Navigation Satellite System) based measurements provide
the ellipsoidal height at any location which needs to be transformed to
orthometric height (MSL) with the help of earth gravitation model (EGM)/ Geoid
model. The geoid is the shape that the ocean surface would take under the
influence of the gravity and rotation of Earth alone, if other influences such as
winds and tides were absent. Transformation from ellipsoidal height (h)
determined by GPS surveys to orthometric height (H) is directly achieved with
precise Geoid (N) model. Geoid is an equipotential surface which is a very close
approximation of mean sea level and N is the Geoid undulation from imaginary
ellipsoid (Datum for any reference system). Relationship between ellipsoidal
height, orthometric height and Geoid height/undulation is depicted in the figure
below. Basic equation relating Orthometric and Ellipsoidal heights: H=h-N
EGM_08 is the latest geoid model and provide the MSL height with fairly good
accuracy of approximately 50 cm. But this accuracy is not at all suitable for
referencing highly accurate LiDAR/Drone data and therefore local geoid
corrections are made using SOI available GTS benchmarks to make it as per
desired accuracy.
786991/2020/O/o Director (Works)-II19

13
C.6 GNSS and DGPS (Differential Global Positioning System) Survey
GNSS/GPS: GNSS stands for Global Navigation Satellite System and is the
standard term for all the satellite navigation systems in the world that provide
geo-spatial positioning (X, Y & Z) with global coverage. Common GNSS Systems
are GPS (United States), GLONASS (Russia), Galileo (European Union), Beidou
(China) and other regional systems. NavIC is the Indian Regional Navigation
Satellite System (IRNSS) with 7 satellites. A GNSS/GPS receiver must acquire
signals from at least four satellites to reliably calculate a three-dimensional
position. Ideally, these satellites should be distributed across the sky. The
receiver performs mathematical calculations to establish the distance from a
satellite, which in turn is used to determine its position. The GNSS receiver
knows where each satellite is at the instant, its distance is measured. Common
GNSS receivers from Trimble, Leica, Topcon, Geomax, Stonex etc. are able to
receive signals from most of the GNSS satellite systems and more are the
satellites the more is the accuracy, redundancy and availability at all times. GPS
is the most widely used GNSS in the world and therefore GNSS is sometimes
commonly called as GPS.
Error in GNSS/GPS measurement: GPS signals coming from satellites down to
the ground have to travel through layers of the earth’s atmosphere, so they are
subjected to delays. Radio signals coming down from satellites have to travel
through the ionosphere where signal delays are caused and it depends upon
receiver location, satellite location, time of day, solar flare activity, etc. Then
further delay is caused when these signals travel through troposphere having
clouds, rain and lightning. These delays are random delays which fluctuate and
as such, there is no way to precisely measure it at any given time. This affects
the time taken for the signal to travel from any given satellite to a GPS receiver,
which introduces slight error into the GPS engine, causing an error in the
measured position. This can cause an approximate error up to 5 m in every GPS
measurement. Therefore DGPS is used to achieve higher accuracy in
measurement.
Principle behind DGPS: Any two receivers that are relatively close together will
experience similar atmospheric errors. Requirement of DGPS is that one GPS
receiver be set up on a precisely known location and it is called as the base or
reference station. The base station receiver calculates its position based on
satellite signals and compares it to the known location. This difference is applied
to the GPS data recorded by the second GPS receiver, which is known as the
roving receiver. The corrected information can be applied to data from the
roving receiver in real time in the field called as (RTK) Real Time Kinematic or
786991/2020/O/o Director (Works)-II20

14
through post-processing after data capture using special processing software
(Static DGPS). Static DGPS is more accurate than the RTK mode but RTK mode
is much faster (2-3 minutes) than the Static mode. Measurement of coordinates
of permanent control points is done by static DGPS.
The known base points with highly precise coordinates are provided by Survey
of India (SOI) which they have already established across India. The base
station can also be setup by recording the GPS data for as long as possible (48
hours normally). Over the time that the base station is capturing data, the
ionosphere and troposphere change, causing the delays in the signals to
change, randomly. Because the delays are subject to random changes, they can
be averaged out to find out very precise location.
Procedure to Carry out Static DGPS Survey: SOI-GCP points which are used as
a base station have been measured many years ago and therefore a
compatibility survey is first performed in order to find out whether the points
are fixed at their original location or not. A DGPS session (8 hours preferably)
is first carried out on all the known SOI GCP points. One of the SOI GCP is
considered as the known base point and rest of the SOI GCPs as unknown and
then compared with their known values. This process is repeated one by one
for all the points and most compatible base point is found out (having least
error). The coordinates of all the SOI GCPs are modified with respect to the
most compatible SOI GCP.
As the SOI GCPs are located very far from each other and therefore the second
step is to create a sub network of points comprising of few known SOI GCPs
and some of our unknown project GCPs. A DGPS session (8 hours preferably)
is carried out for this sub network and coordinates of unknown project GCPs/
permanent control pillars are found. By now we have known coordinates at a
fairly close distance (approximately 20 KM). Now we can run a small session
of about (1 to 2 hours) by including a few known points from sub-network and
some of the remaining unknown points of project GCP to find out the
coordinates of unknown GCPs. Some of the points in one small session are
overlapped with other small session to ensure compatibility between all the GCP
points in our area of interest (AoI). In this way we find out very precise (X & Y)
coordinates for all of our permanent control pillars/ project GCPs.
C.7 Orthorectification and Orthophoto
Orthorectification is the process of removing the effects of image perspective
(tilt) and relief (terrain) effects for the purpose of creating a planimetrically
correct image. The resultant orthorectified image has a constant scale wherein
786991/2020/O/o Director (Works)-II21

15
features are represented in their 'true' positions. It is the process of converting
images into a form suitable for maps by removing sensor, satellite/aircraft
motion and terrain-related geometric distortions from raw imagery.
An orthophoto (orthophotograph or orthoimage) is an aerial photograph or
satellite imagery geometrically corrected ("orthorectified") such that the scale
is uniform: the photo or image follows a given map projection.
[D] Modern Surveying Techniques:
Unlike conventional surveying method, modern surveying techniques consist of
limited field intervention. It can be carried out on aerial, ground and satellite
based platforms using mounted cameras and sensors in lesser time without
physically going to site. This concept of taking measurements from a distance
is called Remote Sensing.
There are two types of Remote Sensing.
• Active Sensing - Active sensors have its own source of light or
illumination. In particular, it actively sends a pulse and measures the
backscatter reflected back to the sensor. Examples of active sensing are
LiDAR, Sonar etc.
• Passive Sensing - Passive sensors measure reflected sunlight emitted
from the sun. When the sun shines, passive sensors measure this energy.
Examples of passive sensing are Drone/Satellite Images.
In remote sensing, the sensors collect the important details of ground in the
form of images very precisely. These images have various combinations of
bands of colours. All these geospatial and remotely sensed data can be used to
visualize and analyze the ground features in 2D/3D mode with the help of
786991/2020/O/o Director (Works)-II22

16
modern software’s. This is specially useful in hilly reaches where the locations
are not approachable and disturbed.
In the recent decade, the technology of LiDAR (Light detection and ranging)
and photogrammetry is being used widely to extract bare earth surface
elevations at required grid/point intervals by using various processing
techniques which is primary input in the design of various construction and
mining projects likes rail, road, power, mines etc. with a good accuracy and
limited field activity involvement.
The end product of both the technologies, active or passive remote sensing, is
Digital Elevation Model (DEM). DEM is a 3D representation of earth’s topography
and is the most important input for designing an alignment. The high spectral
& radiometric resolution captured by satellite/drone images are very helpful in
interpreting geology and various landforms in the area of interest. Slope &
aspect maps can also be created from DEM in hilly terrain to further analyze
the designed alignment for slope stability considerations. The probable
thrust/fault and landside zones can also be predicted to avoid hazardous
locations along the alignment. The cumbersome task of doing hydrological
calculation can be done quickly and very precisely by making use of the DEMs.
The temporal resolution of captured images is very useful to understand the
change in geology, river flow pattern (meandering) and vegetation in an area
over the years. Alignment drawings, L-section, cross-section, yard layouts and
other alignment features can also be extracted very easily & quickly with help
of the modern softwares using DEM.
786991/2020/O/o Director (Works)-II23

17
D.1 This is aided by the use of geophysical surveys which are non-destructive,
indirect, cheap and quick technique using seismic/electric/electromagnetic rays.
These are carried out to measure physical properties of medium for subsurface
characterization, ground water condition and geological structures and this has
vastly reduced the need of geotechnical investigations during survey stage.
D.2 Both the LiDAR and Photogrammetric technologies, as compared to
conventional land surveying methods, offer results much faster and with a
much higher data density (both techniques measure all visible objects with no
interpolation). However, the selection of the best technology for a project
depends on type of use, environmental conditions, delivery terms, and budget
among other factors. A detailed overview of the strengths and limitations of
photogrammetry (satellite & drone) and LiDAR (aerial & terrestrial) is described
in this report which will be helpful in choosing the right solution for a project,
especially in terms of Railway RET/PET/FLS survey.
[E] Photogrammetry - PRINCIPLE, PROCESS AND OUTPUTS
GENERATED:
With Photogrammetry, information about physical objects and the environment
is obtained through the process of recording, measuring and interpreting
photographic images and then converting them to maps through Ortho-
rectification. It uses the same principle that human eyes or 3D videos do, to
establish a depth perception, allowing the user to view and measure objects in
three dimensions.
E.1 HI-RESOLUTION SATELLITE IMAGERY
Satellite images are captured by remote sensing satellites like Worldviews
series, GeoEye, Pleiades, Quick Bird, Cartosat etc. These Satellite Imageries
have application in diversified fields depending upon its resolution & band type.
Stereo satellite imageries, which come in pairs, are used for creation of DEM
(Digital elevation model). Stereo Images are the two pictures of an area taken
from two slightly different angles which are then overlapped to produce the
illusion of depth.
786991/2020/O/o Director (Works)-II24

18
E.1.1 Processing of satellite imagery:
Step-1: Input Quality Checking & Inventory Report Preparation
Quality checking of the satellite images i.e. Nadir angle, snow & cloud cover,
overlapping of images, gap area etc. is done in various GIS software such as
ERDAS Imagine, Global Mapper, ARCGIS etc. Along with this, ground control
point (GCP) locations are also verified. Any discrepancy with the satellite image
is reported and the image is replaced.
Step-2: Selection for the location of GCP’s & Preparation of Monographs
for GCP establishment
GCP (Ground control Points) are the locations identifiable in satellite imagery
as well as on ground. The measurement of (X, Y & Z) coordinates of these
locations is done on ground to Geo reference the satellite imagery as per
ground, Datum etc. The measurement can be done with the help of total
station/DGPS/levelling etc. These GCP locations are identified with the help of
google earth/satellite imagery. The georeferencing process is required to be
done in all the photogrammetric/ LiDAR techniques.
Step-3: Aerial Triangulation (AT) - represents the mathematical process of
establishing precise and accurate relationships between the individual image &
Ground. When we talk in layman language it means Geo referencing of satellite
imagery to the ground using GCP point established onto the ground.
AT is carried out for georeferencing of the satellite imagery. Georeferencing is
the process of assigning geographic coordinates to a raster (grid of x and y)
image to define its location in the world based on a map coordinate system
(Everest/ WGS-84/ NAD-83 etc.). Satellite images, which are captured, don't
786991/2020/O/o Director (Works)-II25

19
perfectly match with the Earth's surface and neither the images coincide with
any projected coordinate system map (e.g. UTM).
Fig- Stereo Photogrammetry Workstation
So these satellite images (stereo pair) are georeferenced or transformed
according to the constraints of map projections for the purpose of topographical
survey/creation of DEM. This is done by identifying some prominent points,
called ground control points (GCPs) or photo control points (PCPs,) on satellite
images which are identifiable on ground for (X, Y & Z) coordinate measurement.
In the Aerial Triangulation process, firstly tie points which are generated at a
certain interval, are used to connect two stereo images and remove tiling of
images. It is done to provide relative accuracy between images. For absolute
accuracy measured value of GCP is assigned in the image and the process of
bundle block adjustment is carried out. A quality report is finally prepared to
compare the adjusted GCPs coordinates on image with the measured GCPs
coordinates and the difference should be within the permissible limits.
Step-4: DTM & 3D Topographical Map Generation - True Digital
Representation of 3D Terrain Surface for engineering Analysis, (DTM) is made
up of elevation points and abrupt change marked by 3D break lines representing
elevations of Surface. Fewer points can describe very flat or evenly sloping
ground; more points can be captured to describe very complicated terrain.
DSM is first generated using the georeferenced satellite image which includes
all the natural and manmade features like trees, buildings etc. After the DSM is
generated, mass points at certain interval on ground and break lines at ridges
& valleys are generated to remove these natural & manmade features, thus
generating DEMs. These mass points & break lines help in creation of smooth
786991/2020/O/o Director (Works)-II26
20
contours of natural ground/ terrain. A check is done on contours and wherever
abrupt changes are seen (Depicting sudden rise due to tree or building), mass
points are deleted to get the smooth contours. Digitization of all the
topographical features such as Roads, water body, bridges, building etc with
break lines are done using the 3D glasses. Finally, DTM is generated using the
software which is the 3-D model of terrain. DTM is used for different purposes.
Fig-Digital Elevation Model
Step-5: Orthophoto Generation - Once an aerial photo has been ortho
rectified, it is commonly referred to as an Orthophoto. Orthophoto is a high
resolution georeferenced colored 2D image generated in software using DTM &
georeferenced image on which further pan sharpening is performed. Pan
sharpening is the process in which colour of multi spectral low-resolution image
is fused over Pan (black & white) image of high resolution.
Fig- Orthophoto
786991/2020/O/o Director (Works)-II27

21
E.1.2 Other outputs generated by satellite images on GIS
platforms:
Different kind of thematic maps which can be derived from remote sensing
studies of satellite images are briefly explained in below.
Geological lineament map: Lineaments are the fractures, faults, thrusts,
valley lines, submit lines etc. in the area of interest. These are extracted with
the help of GIS software and verified later in the field by geologist to further
carry out geological mapping studies. Lineament density maps is also drawn
and area of high lineament density are avoided while deciding the railway route.
ROSE diagram of lineaments can also be made to find out the direction of
lineament sets and alignment is designed in such a way it crosses this area in
perpendicular direction if needed.
Quaternary Deposits Map: Quaternary Deposits are the lithological
formations which are younger than 2.58 million years and are the most
unconsolidated & unstable. The area of quaternary deposits is segregated with
the help of remote sensing for further studies.
Alluvial / Fluvial Map: The alluvial/ fluvial areas are identified along the river
basins for these deposits and suitable measures can be taken while designing
the alignment through this area.
Water drainage network maps: The water drainage maps are extracted with
the help DEM in GIS software. Location of bridges/viaducts can be planed
accordingly while design of alignment.
Topographical Analysis Maps (SLOPE, ASPECT): The slope and aspect
maps are prepared with the help of DEM to carry out the slope stability, land
slide or other geohazard analysis along the alignment. Aspect map is generated
with the aim to reveal the direction of landslides (0° to 360° of North) and slope
map is prepared in terms of percentage and degree in order to determine the
inclination of the landslide.
NDVI: Normalized Difference Vegetation Index study is carried out in order to
determine the open areas and vegetation-covered zones in the study area. This
analysis helps in avoiding the green zones while design of alignment.
Anaglyph Maps: The Anaglyph Creation map provides a simple means of
producing a color anaglyph simulation of the terrain in 3D using a DEM and an
image. Sometimes detecting an image in 3D makes it much easier to interpret
786991/2020/O/o Director (Works)-II28

22
the data and to pick out the details, such as the comparative height of
neighboring peaks and valley floors.
Fig-Aspect map
Archive data captured by different satellites around the world can also be
bought through NRSC (National Remote Sensing Centre).
E.2 DRONE PHOTOGRAMMETRY
Drone photogrammetry is a passive technology, based on images that are
transformed from 2D into 3D models.
Drone photogrammetry technique is very much similar to satellite imagery. The
images are taken from airborne platform from two different angles and are
generally overlapped (60-90%) to generate the 3D stereo pairs which are
utilized for analyzing the various features in 3D. The overlap in case of satellite
images need not be so much due to the large size of image and sufficient
number of GCPs available for one image.
786991/2020/O/o Director (Works)-II29

23
High-resolution cameras are mounted on Drone to take overlapping
photographs and they are processed in similar way as explained in E.1.1. above
to create digital elevation model (DEM) & Orthophotos.
Drone photogrammetry, in best cases, provides 1-3 cm of accuracy which is
very good in comparison to Satellite imagery. But Drone survey is difficult to
operate in hilly reaches whereas, satellite imageries have an advantage as it
can capture details of inaccessible places. Satellite image processing is most
suitable for large area of interest & for works which do not require very high
accuracy and Drone photogrammetry is most suitable for small area of interest
& for works requiring very high accuracy. Moreover, the data acquisition time
for satellite imagery is quite less for larger area of interest.
The data from Drone photogrammetry can also be used for other remote
sensing studies as discussed in section E.1.2 above.
786991/2020/O/o Director (Works)-II30

24
[F] LiDAR
LiDAR stands for Light Detection and Ranging. It is a technology that is based
on laser beams. It shoots outs laser to an object and measures the time it takes
for the light to return. It is so called active sensor, as it emits its energy source
rather than detects energy emitted from objects on the ground. The laser
beams can penetrate dense forests and provide details of bare earth very
conveniently in comparison to photogrammetry and this improves the accuracy
of generated DEM considerably.
After careful review, the acquired Lidar data is processed by a team of Lidar
professionals to generate a "Lidar point cloud." From this data, Digital Elevation
Models (DEMs) and other valuable Lidar products can be created for a variety
of uses.
LiDAR is also particularly useful for modeling narrow objects such as OHE masts
& wires, sleepers & rails, power lines or telecom towers as photogrammetry
might not recognize narrow and poorly visible objects. Besides, LiDAR can work
in poor lighting conditions and even at night.
The main product of LiDAR survey is a 3D point cloud. The density of the point
cloud depends on the sensor characteristics (scan frequency and repetition
rate), as well the flight parameters. Assuming that the scanner is pulsating and
oscillating at a fixed rate, the point cloud density depends on the flight altitude
and speed of the aircraft.
Various use cases might require different point cloud parameters, e.g., for
power line modeling one might want dense point cloud with over 100 points per
786991/2020/O/o Director (Works)-II31

25
square meter, while for creating Digital Terrain Model of a rural area 10 points
per square meter cloud may be good enough.
It is also important to understand that LiDAR sensor is only sampling positions
without RGB, creating a monochrome dataset which can be challenging to
interpret. To make it more meaningful, the data is often visualized using false-
color based on reflectivity or elevation.
Fig: Example of point cloud before and after adding a color attribute.
It is possible to overlay color on the LiDAR data in post-processing based on
images or other data sources, though this adds some complexity to the process.
The color can also be added based on classification (classifying each point to a
particular type/group of objects, e.g., trees, buildings, cars, ground, electric
wires).
There are two types of LiDAR systems
Airborne/Aerial LiDAR: Airborne LiDAR system is installed on a
helicopter/aircraft or drone for collecting data. Aerial Lidar is an aerial mapping
technology which uses reflected laser returns—from the earth’s surface to an
aircraft with on-board sensors in order to determine the precise elevation and
geospatial location of terrestrial objects and features. Airborne LiDAR is further
divided into two types i.e. Topographic LiDAR and Bathymetric LiDAR.
Topographic LiDAR typically uses a near-infrared laser to map the land, while
786991/2020/O/o Director (Works)-II32

26
bathymetric LiDAR uses water-penetrating green light to also measure seafloor
and riverbed elevations.
Terrestrial LiDAR: Terrestrial LiDAR systems are installed on moving vehicles
like trains or tripods on the earth surface for collecting accurate data points.
These are quite common for observing highways, Railways, analyzing
infrastructure or even collecting point clouds from the inside and outside of
buildings. Terrestrial LiDAR systems have two types i.e. Mobile LiDAR and Static
LiDAR. Mobile LiDAR technology by installing LiDAR equipment on
locomotive/last vehicle can be very beneficial for doubling projects. In the case
of static acquisition, the LiDAR system is typically mounted on a tripod or
stationary device.
Fig- Static & Mobile Terrestrial LiDAR
F.1 All LiDAR systems have mainly these major components:
• Laser source and laser detector emits the light and then receive it back
after reflection from the surface.
• The timing electronics records the exact time the laser pulse leaves and
returns to the scanner. Each pulse sent out can have up to multiple
returns as it reflects off of objects on the surface.
• The Global Positioning System (GPS) records the precise X, Y & Z location
of the scanner.
786991/2020/O/o Director (Works)-II33

27
• The Inertia Measurement Unit (IMU) along with Global Positioning System
(GPS) records the precise X, Y & Z location of the scanner. The IMU
contains an accelerometer, a gyroscope, and magnetometer sensors that
measure the velocity, orientation, and gravitational forces. It also
constantly records the pitch, roll, and yaw of the aircraft.
• Computer needed to store the raw data
F.2 LiDAR Data Processing
The processing involves combining the raw data from each sensor and produce
coordinates and images in their respective formats. By combining the laser
range vector, scan angle of scanner, IMU roll, pitch, and yaw, it is possible to
determine the coordinate corresponding to each laser pulse returned including
multiple returns. The steps involved in processing of data can be summarized
as below:
F.2.1 Importing IMU and On-Board GNSS Data
The data are downloaded from the Aero Control Data Unit using the Aero Office
software and the same are separated for further processes.
F.2.2 Airborne GNSS Kinematic Data Processing
On-board GNSS kinematic data will be processed on-site at processing center
using GrafNav or similar software to ensure an accurate Post Processing
Kinematic Trajectory Solution and to process the kinematic corrections for the
786991/2020/O/o Director (Works)-II34

28
aircraft. Aero Office or similar Software can be used to develop a trajectory file
that includes corrected aircraft position and attitude information.
F.2.3 Generation and Calibration of Laser Point clouds (Raw Data)
The bore-sighting angles and lever-arm offsets, which are known as the
mounting parameters. The mounting parameters together with other system
parameters are derived through the calibration process carried out during LiDAR
data acquisition. Laser data points are generated using Mathematical
Morphology (MM) Process. This software combines the raw laser range and
angle data file with the finalized GNSS/IMU solutions.
F.2.4 GNSS Trajectory Solution
The Ground DGNSS point data from the Ground Reference Station will be
collected from the field team and the GNSS from the on-board GNSS systems
are combined using GrafNav or similar Software.
F.2.5 INS Trajectory Solution
The trajectory and IMU data obtained from different software will be merged
and processed. Various graphs like INS position RMS, Gyro-Bias etc. are
generated and analysed.
F.2.6 Geo referencing laser points
The corrected INS (Inertial Navigation System) trajectories will be used to Geo-
reference the laser points and thereby, converting the raw laser points into a
generic format (.las). The geo referenced laser point contains the following
details like Easting, Northing, Elevation, Intensity, Scan Angle, GNSS Time,
Flight Line Number etc. There is requirement of GCPs for this purpose and at
the same time integration of data with locally corrected Geoid model.
F.2.7 Importing Laser Points
The laser points in the generic format (.las format) will be imported into the
software and separate blocks are created depending on the size of the point
cloud data. If the size of the data is more than 50 million points, they are
separated by creation of blocks.
F.2.8 Flight Line Adjustment
The flight line adjustment is done with the help of Tie Line. Tie Line iteration
and Tie Line Accuracy is evaluated. Flight lines are adjusted based on it.
786991/2020/O/o Director (Works)-II35

29
F.2.9 Preliminary Vertical Accuracy Assessment
In Aero Office Software, preliminary accuracy assessment will be done by
analysing the INS trajectory solution, satellites observed, PDOP (Position
dilution of precision) for the respective flight missions. Also target points
marked along the center line of the corridor have to be checked for the vertical
accuracy assessment.
F.2.10 Classification of LiDAR data for generation of High-Resolution DEM
TerraScan inbuilt macros with different parameters will be used to classify low
points, ground points, and non-ground points. The existing features captured
as 3D point cloud data during aerial survey will be classified as Point, Line and
Polygon layers and depicted as Topographical map.
F.2.11 Bare earth classification
The LiDAR points will be processed according to the priorities of classifications.
Firstly, high and low points will be filtered out followed by classification of bare
earth. Ground points will be subjected to manual edits for accurate
representation.
F.2.12 Water Classification and delineation of Hydro Break Lines
The hydro features such as rivers, streams, lakes, and ponds etc., will be
classified by capturing break lines manually by outlining a water body to classify
those points into water class. The LiDAR data intensity display will be used for
water body delineation.
F.2.13 Digital Surface Model generation
After the editing phase, all the tiles will be mosaicked and edge-matched to a
single dataset. DSM generation will employ Point to TIN and TIN to Raster
process with Natural Nearest Neighbor interpolation.
F.2.14 DTM: Break line Production & Qualitative Assessment
A point cloud comprises discrete points with voids in between the points. To
visualize the point cloud as a surface, we need to “fill in” the space between the
points. One of the most common ways of doing this in a Geospatial Information
System (GIS) is to connect each point in a triangle mesh.
The TIN is one of the most flexible representations of a point surface because,
like a three-legged stool, the faces will always perfectly fit the elevation points
of the original point cloud. The disadvantage of a TIN is that it has sharp edges
786991/2020/O/o Director (Works)-II36

30
and hence is very course in appearance when zoomed in (a TIN is a first order
approximation to a surface).
Break lines are three dimensional features (generally polylines or polygons)
introduced into the TIN to constrain the generation of surface models. These
introduced Break lines may be developed such that they do not modify the
original surface geometry. Break lines can be stored as ancillary feature data
that are dynamically added to the model when needed (during surface
generation or derived product creation).
F.2.15 Orthophotos Generation
Ortho photos are generated if images are also captured along with LiDAR data.
[G] ACCURACY/ QUALITY OF OUTPUT
In surveying, accuracy always has two dimensions: relative and absolute.
Relative accuracy is the measurement of how objects are positioned relative to
each other. Absolute accuracy refers to the difference between the location of
the objects and their true position on the Earth. This is why any survey can
have a high relative but low absolute accuracy. The accuracy we measure at
site for final product (DEM) is the absolute accuracy where random points are
measured with respect to some known points (SOI/ Project GCP). If the relative
accuracy is to be measured then the distance between two points can be
measured at site or height difference may be checked between two points and
compared with what we are getting from DEM. In general practice we are
measuring the absolute accuracy here.
Satellite Imagery
The accuracy of product (DEM) varies from few meters to hundreds of meters
and depend upon the quality of input data and its final use. The accuracy of
DEM required for hydrological studies or study of large water bodies may be of
the range of 30 m. This kind of data is readily available free of cost on internet.
Preliminary study of geology may also be done with the help of Aster DEM or
LISS data which is free of cost. But the accuracy of DEM required for engineering
purposes is a lot more. The freely available CartoDEM of 15 M accuracy may be
sufficient for corridor selection or reconnaissance survey but it will not give the
fairly accurate quantities of cut/fill. Reconnaissance survey studies can also be
done by procuring readymade CartoDEM or DEM prepared from 2.5 M spatial
786991/2020/O/o Director (Works)-II37

31
resolution satellite images available at very reasonable rates. These freely
available DEMs will give the more accurate results than the 20/40 M contours
available in SoI topographical sheets used for conventional surveying. But as
we go towards the preliminary studies where we require fairly accurate cost
estimate, we may have to make DEM from 1 M spatial resolution satellite
images.
The studies like FLS where highly accurate results are required for advanced
studies will require the highly accurate DEM. The best spatial resolution images
commercially available in the world are of 30 cm. India has launched its own
satellite which will provide 25 cm resolution images in future. The accuracy of
DEM which can be made out of 30 cm spatial resolution is under 1 M in
horizontal and 1.5 M in vertical. This kind of results have been practically
achieved in Bilaspur-Manali-Leh FLS project. This level of accuracy is fairly
sufficient for FLS stages but if found necessary this can be supplemented with
drone photogrammetry / LiDAR or helicopter LiDAR in narrow patches to get
better estimate of quantities and highly accurate data for design of structures.
Satellite images are sometimes not able to receive the data of bare earth in
dense forests or deep gorges. In these cases the missing data is interpolated
and thus decreasing the accuracy of final product.
The basic thumb rule for the final product is that DEM accuracy will be 2-3 times
in horizontal and 3-5 times in vertical of actual pixel size of raw image. The
accuracy is largely dependent on spatial resolution of image but at the same
time we should be careful while purchasing the satellite images. The images
with off nadir angle greater than 15 degrees and images with more cloud cover
will also degrade the quality of final product. At the same time the accuracy of
the final product depends upon the accuracy of ground control points. As per
American Society for Photogrammetry and Remote Sensing (ASPRS) standards
the GCP accuracy should be half of horizontal and one fourth of vertical targeted
accuracy. Therefore, we have to be careful while selecting the mode of
measurement of GCP on field. Although all the analysis is done on the
software’s but it also depends upon the skillset of engineer working on
preparation of DEM.
Drone Photogrammetry
As the accuracy of DEM is dependent on resolution of satellite image, similar
philosophy applied to drone photogrammetry. The good thing about the drone
photogrammetry is that unlike satellites which are hundreds of KM away from
earth, the drone can be flown at few meters of height above ground. This result
786991/2020/O/o Director (Works)-II38

32
in fairly small pixel size of captured image and this increases the accuracy of
final DEM. In best cases it also allows achieving 1-5 cm level accuracies.
However, it requires significant experience to select appropriate hardware,
flight parameters and software to process the data appropriately. Achieving
high absolute accuracies requires using RTK/PPK technology (Post-processed
kinematic and real-time kinematic) and additional GCPs or can be based purely
on a large number of GCPs. The rest of the accuracy parameters remains the
same is it is for satellite image processing. The bad thing is that it can capture
very limited area in one go. If we try to increase the width of capture (Swath)
by increasing the flying height of drone than it will also increase the pixel size
of captured image and thereby decreasing the final product accuracy. We have
to carefully balance and choose between the area of capture and accuracy of
capture to suite our project requirement. For example, we may need greater
width of corridor in preliminary survey as compare to final location survey but
accuracy requirement will be less for preliminary survey in comparison to final
location survey. In this way things can be balanced out.
Drone photogrammetry is sometimes not able receive the data of bare earth in
dense. In this case the missing data is interpolated and thus decreasing the
accuracy of final product.
LiDAR
LiDAR is one of the most accurate surveying technologies used across the world.
This is particularly the case for terrestrial lasers where the sensor is positioned
on the ground, and its exact location is measured using geodetic methods. Such
a setup allows achieving sub-centimeter level accuracies.
Achieving a high level of accuracy with aerial LiDAR is however more difficult as
the sensor is on the move. This is why the airborne LiDAR sensor is always
coupled with IMU (inertial motion unit) and GNSS receiver, which provide
information about the position, rotation, and motion of the scanning platform.
All the data obtained are combined allowing achieving high relative accuracy (1
to 5 cm). Achieving high absolute accuracies requires adding few Ground
Control Points (GCPs) and several checkpoints for verification purposes. In
some cases when additional GNSS positioning accuracy is needed, one can use
advanced RTK/PPK UAV positioning systems. The advantage of LiDAR over
Photogrammetry is that it can penetrate dense forests and provide highly
accurate data even in dense forest and it can also work during night.
786991/2020/O/o Director (Works)-II39

33
The accuracy of LiDAR final product is also dependent on density of point cloud
and it depends upon the height of sensor & velocity of vehicle. We can choose
the point cloud density based on the kind of work targeted. The survey of
existing OHE may need greater point cloud density but less swath. Plain terrain
where elevations are not varying much may need a less point cloud density in
comparison to mountainous terrain with sharp change in elevation.
The horizontal accuracies are comparatively achieved easily in comparison to
vertical accuracies. This is because the Datum used for vertical data is MSL and
all the GNSS systems provide ellipsoid heights. These ellipsoid heights are
converted to Orthometric/MSL heights with the help of geoid model. The geoid
model in its natural form give accuracy of 50 cm as observed in Bilaspur-Manali-
Leh project. This geoid model has to be corrected by locally adjusting the geoid
heights with respect to difference observed between computed orthometric
heights and actual MSL at number of locations. The accuracy of locally corrected
geoid model will severely impact the quality of our final product.
[H] DATA ACQUISITION & PROCESSING TIME
Satellite Imagery
The input data for creating DEM and orthophotos from satellite imagery will be
raw satellite images and coordinates of ground control points. The satellite
images procured through NRSC are either from Indian satellites and foreign
satellites. The images of resolution up to 1 m can be procured from Indian
satellites and very high-resolution satellite images (30/40 cm) have to be
obtained from foreign satellites through NRSC. The low-resolution free satellite
images can be immediately downloaded from Bhuvan/NRSC website. Satellite
images to be procured from Indian satellites can be obtained within 1-2 weeks
if data is available in archive capture. But if fresh data have to be obtained than
it will take much more time to capture the fresh data as per the orbit / return
time of satellite. The low-resolution DEM can be downloaded immediately from
NRSC and SOI website.
The data which is to be procured from foreign satellites is procured through
NRSC only. User place the indent as per requirement and NRSC calls the
quotations to foreign vendors accordingly. The most optimum vendor is given
the order and data is supplied to user after scrutiny by NRSC. The archive data
in this case can be obtained typically in 1-2 months. But if fresh data have to
be obtained than it will take much more time to capture the fresh data as per
the orbit / return time of satellite and total area of interest.
786991/2020/O/o Director (Works)-II40

34
The measurement of GCP is also dependent on accuracy of coordinates required
for the final product. Advanced technologies like RTX can measure the
coordinates of any point in half an hour with the accuracy of 15-30 cm. But if
more accurate data is required than we will have to go for DGPS. DGPS requires
the data of some known GCPs of SOI and speed of measurement is dependent
on availability of SOI GCPs in the region. More detailed analysis has to be done
to convert ellipsoid heights obtained in RTX/DGPS measurement into MSL at all
the GCPs. The time required for overall process is dependent on area of interest,
availability of SOI GCPs/GTS benchmarks and accuracy desired GCPs.
Procurement of data of SOI GCPs/GTS bench marks also take 2-3 weeks
generally. Normally RTX technology will be sufficient for processing of 30 cm
satellite imagery and may take 10-15 day for measurement of GCPs in area of
interest of 5000 SQKM with two instruments. Measurement though conventional
technologies like total station/ levelling will take much longer time in large area
of interest but are very suitable for small area of interest.
Processing of satellite images is also dependent on number of manpower
deployed for the work. Typically for small area of interest of about 200-300
SQKM may take 1-month time for processing. But for large area of interest of
about 5000 SQKM with deployment of maximum manpower the work can be
completed in 2-3 months. In nutshell the time required for overall process in
best case scenario will be 2 months and it can take up to 6 months as well for
large area of interest.
Drone Photogrammetry
The time required for capture of data is dependent on total area of interest and
kind of terrain. Typically, in a day 8-12 KM of data can be captured though a
drone in a day for one swath or 1-2 SQKM. In photogrammetry, one of the
critical parameters required to process the data accurately is the image overlap
that should be at the level of 60-90% (front and side) depending on the terrain
structure and hardware applied.
Additionally, for high absolute accuracy, photogrammetry requires more
Ground Control Points to achieve accuracy in comparison to satellite and LiDAR.
As the area of interest is normally less in this case, measuring of GCPs can be
done by conventional land surveying methods on the ground using Total
Stations & Dumpy levels which mean further dependence on conventional
survey techniques leading to time and cost. GCPs can also be measured through
DGPS RTK mode if sufficient SOI GCPs are available in vicinity for expediting
the work. Procurement of data of SOI GCPs/ GTS benchmarks also take 2-3
786991/2020/O/o Director (Works)-II41

35
weeks generally. RTX data cannot be used in India yet to achieve cm level
accuracy in the product. Data capture also depends upon location, accessibility,
weather and lighting conditions. They are also less safe over urban areas and
are prone to damage.
The processing time in case of drone photogrammetry will normally take a 3-4
weeks for medium size area of interest (100-150 SQKM).
LiDAR
The time required for capture of data is dependent on total area of interest and
kind of terrain. Typically, in a day 8-12 KM of data can be captured though a
drone in a day for one swath or 1-2 SQKM. For large area of interest, the data
can be captured through helicopter with much faster face. The data capturing
in case terrestrial LiDAR is very fast and hundreds of KMs can be captured in a
day by placing the LiDAR sensor on locomotive or last vehicle. This type of data
capturing is very beneficial for doubling projects but missing data at high banks
& deep cuttings have to be filled in with the help of drone survey.
The requirement of number of GCPs will be little less in case of LiDAR survey
but the method of measurement of GCPs will remain the same as for drone
photogrammetry. LiDAR data processing is very fast. Raw data require
substantially less time (typically1-2 weeks) to generate the final product in
comparison to photogrammetry.
In photogrammetry, data processing is the most time-consuming part of the
overall process which may leads to months together depending upon data
volume and manpower availability. In addition, it requires powerful computers
that can handle operations on gigabytes of images. The good thing is that in
contrast to LiDAR data, the photogrammetry data can be shared for processing
and processing time can be reduced with additional manpower and hardware.
[I] COST
The cost of a suitable surveying technique depends on many factors, some of
which are given below for better understanding:
I.1 Cost of satellite images: The cost of satellite DEM is dependent upon the
desirable accuracy. Low resolution satellite images and its readymade DEM are
available free of cost at NRSC website. But as the requirement of desirable
786991/2020/O/o Director (Works)-II42

36
accuracy increases, the rates are also increased. Some of the rates of
commercially available satellite imagery/ DEM are given below in the table.
Satellite
Name
Spatial
Resolution
DEM
Accuracy
Contour
interval
Map
Scale Cost
Cartosat 1 2.5 M 5 M 10 M 1:10,000 Rs. 6450/ (27.5
km * 27.5 km)
Cartosat 2 1 M 2-3 M 2-3 M 1:5000 Rs. 2890/ (9.6
km * 9.6 km)
CartoDEM 2.5 M 15 M 15 M 1:15000 Rs. 6290/ (14
km * 14 km)
World View 0.5 M 1-2 M 1-2 M 1:2,000
35 $/SQKM
Archive
55 $/SQKM
Fresh
World View 0.3 M 1 M 2 M 1:1,000
45 $/SQKM
Archive
65 $/SQKM
Fresh
Worldview
DEM 0.5 M 3 M 3 M 1:2000 35 $/SQKM
Worldview
Orthophoto 0.5 M 3 M - - 20 $/SQKM
I.2 Processing cost of satellite images: The cost of processing (DEM &
Orthophoto creation) is approximately Rs. 5000-7000/- per SQKM including
measurement of GCPs and may decrease as the area of interest increases.
I.3 Cost of producing DEM : The overall cost for production of DEM through
drone photogrammetry in a single swath (100-200 m) including the cost of
measurement of GCPs will be Rs. 25000/- per KM. Similar cost for drone LiDAR
DEM for a single swath (100-200 m) including the cost of measurement of GCPs
will be Rs. 40000/- per KM. The cost of terrestrial LiDAR through
locomotives/last vehicles will be Rs. 25000/- per KM for single run. The cost of
aerial LIDAR in which data is captured through helicopters for large aera of
interest in highly rugged terrains is in the range of Rs. 50000-60000/- per
SQKM.
I.4 Hardware cost: When we look at the overall cost of LiDAR and
photogrammetry surveys, there are multiple cost items which need to be
786991/2020/O/o Director (Works)-II43

37
considered. First of all the hardware, UAV LiDAR sensor sets (scanner, IMU, and
GNSS) cost between Rs.36 lakhs to 2.16 Cr. For most use cases the high-end
devices are preferable. To prevent from damage, most users spend additional
Rs.18 lakhs to Rs.36 lakhs for the appropriate UAV platform. It all adds up to
minimum Rs.50-60 lakhs for a single surveying set which is equivalent to 5x
Tesla Model.
For photogrammetry, all needed is a satellite based high resolution image or
high-resolution camera-equipped drone, and these tend to be much cheaper.
In the Rs.2.00 to 5.00 lakhs range, a wide selection of professional multirotor
devices such as DJI Inspire can be purchased. For the price level of Rs. 7.00
lakhs to Rs. 18.00 lakhs, one can buy RTK/PPK enabled sets such us DJI Matrice
600 or fixed-wing devices SensflyeBee and PrecisionHawk Lancaster.
I.5 Software cost: Another cost item is processing software. In case of LiDAR,
it is typically added for free by a sensor manufacturer. However, post-
processing, e.g. point cloud classification, one might require using 3rd party
software, such as TerraScan that cost Rs 15 lakhs to 24 lakhs for a single
license. On the other hand, photogrammetry software prices are closer to the
level of Rs.2000/- to Rs.4000/- a month per license.
I.6 Labour and time cost: Besides this, another important factor that
influences the cost of the service is labor and time. Here, LiDAR has a significant
advantage over photogrammetry, as it not only requires significantly less time
to process the data but also to set up and mark GCPs.
Overall, depending on the use case, photogrammetry services are typically
cheaper than LiDAR simply because the investment in the hardware is very less.
[J] COMPARISON OF VARIOUS SURVEY TECHNOLOGIES
All the survey methods described above has their own positive and negatives
in terms of their uses. Therefore, the choice of technology for conducting survey
depends upon requirements, time and cost. The various survey techniques,
both conventional and modern techniques, have been evaluated and compared
in terms of cost, time requirement and output. The table mentioned below
shows comparative description of all three techniques as discussed in earlier
sections.
786991/2020/O/o Director (Works)-II44
38
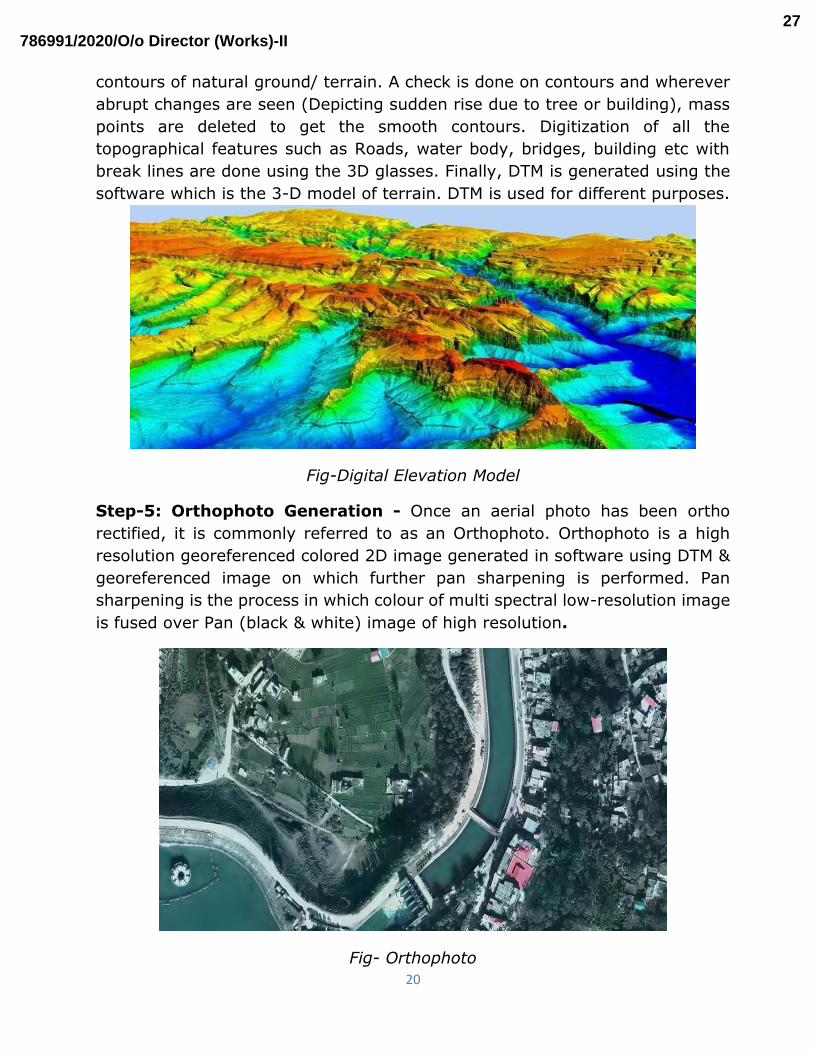
Detail Matrix of Comparison
S
N Parameter
Conventional
Surveying
Satellite
Imagery
Drone
Photogrammetry LiDAR
1
Equipment/
Software
Requirement
DGPS, Total
Station, Auto
level, AutoCAD 2D
Software
DGPS, Total
Station, Auto
level,
Photogrammetry
Software, 3D
Computers
DGPS, Total Station,
Auto level, drone
camera,
Photogrammetry
Software, 3D
Computers
DGPS, Total
Station, Auto
level,
Drone/terrestrial/a
erial LiDAR
equipment, LiDAR
Cloud data
Processing
Software
2 Input
Requirement
Topographical
sheets, Survey
Corridor or
Alignment, SOI
Bench Marks
Satellite Images,
SOI Bench Marks,
DGPS Control
Points
Area of Interest and
Drone Images, SOI
Bench Marks, DGPS
Control Points
Area of Interest,
DGPS Control
Points and Cloud
data of LiDAR
3 Time taken High Moderate/high Moderate Fast
4 Accuracy Human error Moderate High Higher
5 Estimated
Cost
Cost Range from
Rs.8000 to 15000
per sq. km and
depends upon the
density of points
and type of
equipment being
used. The main
cost is (additional)
for the manpower
working on the
data for longer
duration.
Cost Range is Rs
5000-7000/sq. km
for moderate
quality DEM &
orthophotos and
Rs. 10000-12000/
sq. km for high
quality DEM &
orthophotos. This
includes
measurement of
GCPs and
procurement of
satellite imagery.
Cost Range from
Rs.30000 to 40000
per Sq. km and Rs.
25000/ KM for single
swath including
drone image and
GCP.
Cost Range from
Rs. 50000-60000
per Sq. km for
large areas and
Rs. 35000-45000/
KM for single
swath. This
includes Data
acquisition by
Areal fly, GCP
(min. 50 to 100
sq. km. for
viability) and Local
geoid correction.
* Depending upon necessary clearances and flying schedule done on time else
it takes more time.
[K] DESIGN OF ALIGNMENT, PREPARATION OF ESTIMATE, MAPS AND
DRAWINGS USING MODERN SURVEYING TECHNIQUES
Design of alignment is most important output of all survey procedures. All the
efforts made for preparation of good quality DEM will be finally used in
alignment software for design of alignment. A suitable alignment can be defined
as “A most preferable route between two obligatory points considering all the
terms of reference”.
786991/2020/O/o Director (Works)-II45

39
The shortest path between two points is the direct straight connection; but due
to topographical, strategic, commercial and geological constraints, alignment
deviation is done with the help of introduction of curves.
K.1 Some Factors in choosing a suitable alignment:
The first step while designing the alignment is the marking of all the
obligatory points (locations which are mandatory to connect) on the
Google earth or Orthophotos. The minimum distance requirement
between two obligatory points (stations) is calculated based on their
elevation difference & ruling gradient on the section. If the Crow fly
distance between two stations is more than the calculated distance based
on gradient requirement, then crow fly distance will be the designed
section length.
On the basis of varying terrain, it can be divided into number of sections
if needed.
The obstructions in the form of natural & manmade features are avoided
by introduction of permissible curves.
Station location is one of the important parameters in the alignment
design. Location should link maximum nearby villages.
Sharp curve at the entry/exit or within the station should be avoided.
Station site should be on the flat ground as far as possible.
Minimum three alignments should be studied at reconnaissance/
preliminary stage before the finalization of route based on the technical
parameters such as Gradient, Degree of Curve, block section length etc.
provided by the Railway Administration with terms of reference.
Other aspects to keep in mind while design of alignments are the
following:
Minimum Cut and Fill
Tunnel Length (in case of Hilly Terrain)
Open Area
Bridge Length and Height
Safety and Comfort
Environmental Impact
Geological Constraints
Accessibility for ease of construction
K.2 Selection of Best suited alignment: A detailed techno-commercial (multi-
criteria analysis) analysis is done to select the most technically feasible and
economically viable alignment from among the alternatives. A weightage is
786991/2020/O/o Director (Works)-II46

40
decided for all the factors which are taken into consideration and rating is given
to each factor for every alignment. A combined score is calculated for all the
alternatives and the best alternative is finalized. The main factors which are
taken into consideration are the following:
Cost Consideration
Ease of Construction Consideration
Serviceability Consideration
Geological Consideration
Environmental and Social Impact Consideration
Design of alignment using software
K.3 PROCESS OF ALIGNMENT DESIGN:
K.3.1 Various designing softwares such as Autocad Civil 3D, Bentely rail
track, Quantum etc. are used these days for alignment design. Foremost
requirement for designing an alignment is Digital Elevation Model. More precise
is the DEM, highly accurate will be the alignment design & so the cost estimate.
K.3.2 At very first tentative alignments are marked based on the technical
parameters & obligatory points in software with the superimposed orthophoto
in background or the Google earth (in case if orthophoto is not available) for
the better understanding/visualization of the topography. Horizontal geometry
is decided by proving inputs like degree of curve, transition lengths, curve type
with inbuilt tools. Topographical data as well as administrative boundaries are
also essential for alignment design as well as to generate various output maps.
In conventional survey, topographical sheets were traced manually to obtain
contours and topographical features such as road, river, bridges, dams etc
which used to be time consuming and cumbersome task. Subsequently some
softwares, such as Autocad, came up with its digitizer tool which helped to trace
the feature faster; but work still required substantial time and manpower.
In the modern digital world all these data are available in vector form and can
be easily purchased from Survey of India. Open series maps are available on
SOI portal which help to understand Topo sheet number with regard to the Area
of interest of project. Each topo sheet covers an area of 700 Sqkm. in scale of
1:50000. Typical Pricing per sheet is shown below:
786991/2020/O/o Director (Works)-II47

41
Type of sheet Cost per sheet in Rs
Topographical map
Single layer 6300
2 layers 10350
3 to 5 layers 14500
Whole sheet 20700
Administrative Boundary (Per state)
only District Boundaries 4550
District boundaries upto Taluk level 9250
Village boundaries 22500
K.3.3 Availability of the digital data eliminated the laborious task of
tracing or digitizing features manually. These features are used in the various
maps designed in the alignment study such as General map, Index plan,
Detailed plan, ESP. All the available digital features such as Road network,
drainage network containing Rivers, nallahs, canal, bridges, culverts,
administrative boundaries, and forest boundaries can be used easily in the
background of any alignment for any map preparation.
Thematic digital maps produced through remote sensing studies such as
lineament maps, drainages network maps, Geohazard maps, Quaternary
deposit and also georeferenced GSI maps can be opened in background easily
and necessary refinement can be made for the safe structure planning. Using
all the maps most viable and safe alignment can be designed
K.3.4 After generating the longitudinal section, vertical geometry of the
alignment is designed such as Gradient, vertical curves etc. Wherever necessary
the alignment can be improved to minimize or to balance cut fill only just by
shifting or by curve introduction in the alignment and respective changes can
be seen immediately in the section. Tunnel and bridge lengths can be altered
easily. This way most economical alignment is produced. Chainage, Formation
as well as ground levels, cut fill, horizontal & vertical geometry can be shown
in the bottom of profile view with the help of tools at any interval required.
Cross sections may also be generated quickly at any interval.
K.3.5 Yard plan can also be prepared using different turnout options
available within the software. Placing of rails, sleepers, platform can also be
shown in software.
K.3.6 Output maps such as General maps, Index map Index plan and
section and detailed plan& section of the required scale can be generated in the
786991/2020/O/o Director (Works)-II48

42
software very easily. Any modification in the drawing in later stage will reflect
itself in the maps hence repetitive work of manually modifying the maps in the
old times is saved.
K.3.7 Various list such as Curve, gradient, structures can be extracted
from the software and also earthwork can be calculated quickly after deciding
the permanent way profile. As most of the data can be directly extracted from
software using DEM, the time for the preparation of cost estimate and report
gets minimized.
K.3.8 3D visualization of the alignment can be generated within the
software for better understanding of route.
K.3.9 With using modern technologies, all the data becomes digitally
available and we can reach very precise location even by using our smartphone
or GPS device. This saves time as well money to put pegs along the alignment
for locating it as being done in conventional survey.
[L] INTERNATIONAL BEST PRACTICES:
Drone photogrammetry, LiDAR and satellite imagery are the latest techniques
being used around the world for surveying. The use of technology is totally
dependent upon the criticality and extent of survey. Readymade DEM available
with many satellite imagery providers are also used these days for the accuracy
requirement of up to 3 m. LiDAR and Drone Photogrammetry used based on
the characteristics of terrain. RTX method (Advance PPP technology) instead of
conventional DGPS is also used for measuring (X, Y & Z coordinates) of ground
control points with very fine accuracy (<5cm) in America and Europe, which is
yet not possible with such fine accuracy in Asian Countries.
[M] CONCLUSIONS
M.1 Comparing Conventional & Modern Surveying techniques :When
comparing Conventional method of surveying with equipments (like total
station) and modern aerial technologies (like LiDAR and photogrammetry), it
must be understood that all these technologies have their applications as well
as limitations, and in the majority of use cases, these are complementary. None
of these technologies is better than the other and none of them will cover all
the use cases. The comparison between all these technologies is already
discussed in above table in [J] above.
786991/2020/O/o Director (Works)-II49

43
As can be seen that in conventional method, the best advantage is to pick the
topographical and other project related features physically, seen by the human
eye while its main disadvantage is that it takes longer time in collection of data
and then it’s processing.
On the other hand, the modern technologies involve very less physical presence
and therefore very fast in data acquisition and processing with very high
accuracy. Hence it is quite useful for long stretch survey. However, even
modern surveying techniques are also dependent on methods likes DGPS, Total
Station, Levelling, EGM etc., as ground control points will have to be set up
manually. And accuracy of aerial technologies will also depend upon the
accuracy of GCPs.
M.2 Comparing within Modern Surveying Techniques - Satellite imagery,
Drone photogrammetry and LiDAR:
The main advantages of Satellite imagery is acquisition of data for large area
of interest in one go at very reasonable rates and provides 3D elevation models
& orthophotos.
Drone Photogrammetry has benefits in its accuracy and cost effectiveness,
gives 3D and 2D coloured model while its main disadvantage is that it takes
comparatively longer time for data acquisition and processing than LiDAR. It is
also difficult to obtain bare earth model in dense forest areas through
photogrammetric techniques.
On the other hand LiDAR gives point cloud data which is excellent for accuracy
but does not provide colored 3D model for visualization and comparison. It is
also a costlier survey due to high cost of equipment.
M.3 Other Conclusions:
RET surveys can be done by using free CartoDEM available on NRSC
website along with georeferenced SOI topsheets. However, for
preliminary survey like PET survey of railway line where some details of
ground are required, digitalized SOI topsheets and moderate resolution
Cartosat-2 satellite image DEM and referred to at low cost as it will save
both time and money.
For FLS of Railway alignment, high accuracy level is required. For this,
use of high resolution (0.5/0.3m resolution) multiband satellite images,
which can give highly accurate DEM, are needed along with accurate
ground survey work like precise measurement of GCPs and DGPS, double
tertiary levelling etc.
786991/2020/O/o Director (Works)-II50

44
All the three modern technologies i.e. Satellite imagery, drone
photogrammetry and LiDAR can be adopted for FLS of railway line
depending upon the size & area of interest, terrain type, NL/DL/GC
projects etc. Work may be done by using satellite imagery in large and
tough terrain in hilly regions, supplemented by drone
photogrammetry/LiDAR if felt necessary for new lines. Some problems
faced in conducting flights for LiDAR or drone photogrammetry in hilly
terrain are inaccessibility, weather as well as various clearances required
for drone flights. Hence, to obviate these problems, many a times it is
considered preferable to purchase and process high-resolution satellite
images instead.
If the terrain is plain/rolling then for FLS, work can be done based on
drone photogrammetry with very high accuracy with no need for satellite
imagery. LiDAR survey being an expensive technology, can also be
dispensed with in such a terrain.
But if the terrain is difficult, hilly and with dense vegetation, LiDAR survey
is much faster and can replace both satellite & drone photogrammetry.
The use of terrestrial LiDAR on locomotives/last vehicle is the best option
for FLS studies on doubling projects.
[N] RECOMMENDATIONS:
The purpose of survey is to accumulate the required basic data from the field
and its processing. Modern survey techniques have an edge over conventional
methods in terms of accuracy and time. The objective of all the surveys is to
create DEM for better project planning and all these survey methods have their
own merits and demerits. Hence the choice of survey technologies can be made
based on techno-economic suitability for the specific project.
Some brief idea based on study and experience are summarized in Annexure I,
II & III for Reconnaissance Survey, Preliminary Survey & Final Location Survey
respectively. However, these are meant for general guidance only.
Sanjay Khare
Sr. Prof (works)
IRICEN,Pune
S.K.Jha
CAO/C-II/NR
H.S.Yadav
CAO/C-I/NFR
786991/2020/O/o Director (Works)-II51

45
REFRENCES:
Indian Railway Code of The Engineering department (Chapter II, IV &V).
Presentation Shared by SOI, Pune
ISRO Geo- Platform- www. Bhuvan.nrsc.gov.in
Presentation shared by Consultants with IRICEN, Pune
www.Google.com- Various websites related to Modern Survey Techniques
Various GIS software
786991/2020/O/o Director (Works)-II52

46
ANNEXURE-I
Reconnaissance Survey
Type of
Survey
Terrain Satellite Imagery Drone Photogrammetry LiDAR
Specification Cost ₹ Time
New Line Plain/ rolling CartoDEM 6290/ 14 km X 14
km grid
Instantly
These are not recommended at this stage
due to its high cost and redundant
accuracy which is not required at this
stage.
Hilly/
Mountainous
CartoDEM 6290/ 14 km X 14
km grid
Instantly
Gauge
conversi
on
Plain/ rolling CartoDEM 6290/ 14 km X 14
km grid
Instantly
Hilly/
Mountainous
CartoDEM 6290/ 14 km X 14
km grid
Instantly
Doubling Plain/ rolling CartoDEM 6290/ 14 km X 14
km grid
Instantly
Hilly/
Mountainous
CartoDEM 6290/ 14 km X 14
km grid
Instantly
The additional costs to be incurred while adopting modern technology in reconnaissance survey will be for
design of alignment and drawing/map preparation on alignment software, preparation of report, limited site
reconnaissance and making cost estimate after extracting BOQ from software. Digital drawings available for
reserved forests, state/district/village boundaries, road map, water bodies etc. will be used in the
background of designed alignment to furnish desired maps in no time. Using software will considerably
reduce the time and manpower required for preparation of final report. Engineer may decide to adopt
modern surveying for RET survey based on availability of software and expertise.
786991/2020/O/o Director (Works)-II53

47
ANNEXURE-II
Preliminary Survey
Type of
Survey
Terrain Satellite Imagery Drone Photogrammetry LiDAR
Specification Cost ₹ Time Specification Cost ₹ Time
New
Line
Plain/
rolling
1 M cartosat
imagery DEM
5000 –
7000/
SQKM
1-3 months
depending
upon total
area.
Drone photogrammetry is not
recommended at this stage in plain
terrain due to its high cost and
redundant accuracy which is not
required at this stage.
LiDAR survey is not
recommended at this stage in
due to its high cost and
redundant accuracy which is
not required at this stage.
Hilly/
Mountain
ous
1 M cartosat
imagery DEM
5000 –
7000/
SQKM
1-3 months
depending
upon total
area.
Drone photogrammetry (5-10 cm) can
be done at important locations like
bridge, tunnel portals and stations
where high accuracy will be beneficial.
The cost will be approx. ₹ 30000-
40000 / SQKM.
Gauge
conver
sion
Plain/
rolling
1 M cartosat
imagery DEM 5000 –
7000/
SQKM
1-3 months
depending
upon total
area.
Drone photogrammetry (5-10 cm) can
be done at junctions and important
locations like bridge, tunnel portals
and stations where high accuracy will
be beneficial. The cost will be approx.
₹ 30000-40000 / SQKM.
Hilly/
Mountain
ous
1 M cartosat
imagery DEM
Doubl-
ing
Plain/
rolling
1 M cartosat
imagery DEM
5000 –
7000/
SQKM
1-3 months
depending
upon total
area.
Drone
photogrammetry
(1-5 cm) can be
done in doubling
projects in single
swath (100 m
width). The cost
will be ₹ 25000/
Km which is little
on a higher side
for preliminary
survey.
₹
25000
/ Km
1–2
months
Terrestrial LiDAR (1-5 cm
DEM) is one of the best
techniques for doubling
projects. The cost and time
will be similar/less to drone
photogrammetry
Hilly/
Mountain
ous
1 M cartosat
imagery DEM
5000 –
7000/
SQKM
1-3 months
depending
upon total
area.
786991/2020/O/o Director (Works)-II54

48
The additional costs to be incurred while adopting modern technology in preliminary survey will be for design
of alignment and drawing/map preparation on alignment software, preparation of report, site visit and
making cost estimate after extracting BOQ from software. Traversing with total station along alignment &
rivers, taking levels, plain table surveying, installing pegs etc. can be totally avoided using modern
technologies. With the digital drawings of alignment and GPS, we can reach the exact location on ground
whenever we want. Digital drawings available for geology (GSI maps), reserved forests, state/district/village
boundaries, road map, water bodies etc. will be used in the background of designed alignment to furnish
desired maps in no time. These days’ digital and scanned toposheets are also available from SOI and they
can also be put in the background of designed alignment for better visualization of data. All these
technologies, if adopted will save huge time and manpower (if not cost) required for preparation of final
report.
786991/2020/O/o Director (Works)-II55

49
ANNEXURE-III
Final Location Survey
Type of
Survey Terrain
Satellite Imagery Drone Photogrammetry LiDAR
Specificat
ion
Cost
₹
Tim
e Specification Cost ₹ Time Specification Cost ₹ Time
New Line
Plain/ rolling
30/40 cm
high
resolution
4/8 band
imagery
DEM,
orthophoto
& thematic
maps
10000
to
12000
per
SQKM
for
DEM &
Ortho
photo
2-6
mon
ths
Drone
photogrammetry
(1-5 cm) can be
adopted for new
lines if width of
corridor to be
studied is low
and area has less
vegetation.
30000
to
40000
per
SQKM
or
25000
/swath
/km
1-2
SQKM/
day and
preparat
ion of
DEM
may
take 1
month
Aerial LiDAR (1-5
cm) can be
adopted for new
lines if width of
corridor to be
studied is low
and area has
dense
vegetation.
50000
to
60000
per
SQKM
or
35000
/swath
/km
1-2 SQKM/
day with
drone &
50-100
SQKM/day
with
helicopter
and
preparation
of DEM may
take 2-3
weeks.
Hilly/
Mountainous
Gauge
conversio
n
Plain/ rolling
Hilly/
Mountainous
Doubling
Plain/ rolling
Doubling projects do not
require to study large area
of interest and therefore it
is not worth to spend so
much time in procurement
& preparation of DEM from
high resolution satellite
images.
Drone
photogrammetry
(1-5 cm) can be
adopted in area
with less
vegetation in a
single swath
along old line.
25000
/swath
/km
1-2
SQKM/
day and
preparat
ion of
DEM
may
take 1
month
Terrestrial LiDAR
(1-5 cm DEM) is
one of the best
techniques for
doubling
projects. The
cost and time
will be
similar/less to
drone
photogrammetry
and all track
details/ sign
boards/ OHE
details will also
be captured.
25000
/swath
/km
Capture can
be done in
single / few
days for
large
stretches.
Preparation
of DEM may
take 2-3
weeks.
Hilly/
Mountainous
786991/2020/O/o Director (Works)-II56

50
The additional costs to be incurred while adopting modern technology in final location survey will be for
design of alignment, drawing/map preparation, extracting plan & L-sections on alignment software,
hydrological studies with the help of prepared DEM, thematic map preparation from satellite/drone images,
preparation of report, site visit and making cost estimate after extracting BOQ from software,
geotechnical/geophysical studies. Traversing with total station along alignment & rivers, taking levels, plain
table surveying, installing pegs etc. can be totally avoided using modern technologies. Requirement of
permanent benchmarks can be reduced significantly. Yard plan/sections can be easily prepared in modern
software’s. With the digital drawings of alignment and GPS we can reach the exact location on ground
whenever we want. Digital drawings available for geology (GSI maps), reserved forests, state/district/village
boundaries, road map, water bodies etc. will be used in the background of designed alignment to furnish
desired maps in no time. These days’ digital and scanned toposheets are also available from SOI and they
can also be put in the background of designed alignment for better visualization of data. All these modern
technologies if adopted will save huge time and manpower (if not cost) required for preparation of final
report and quality is output will be much better than using conventional technologies.
Sanjay Khare
Sr. Prof (works)
IRICEN,Pune
S.K.Jha
CAO/C-II/NR
H.S.Yadav
CAO/C-I/NFR
786991/2020/O/o Director (Works)-II57