Embed Size (px)
Citation preview
2 0 2 0 V o l u m e 4 4h t t p s ://d o i .o r g /1 0 .3 3 3 2 1 /c d i .2 0 2 1 .4 5 .5
Decreased incidence of enterovirus and norovirus infect ions during the COVID-19 pandemic, Victoria, Australia, 2020L e e s a D B r u g g in k , A r n a u G a r c ia -C la p e s , T h o m a s T r a n , J u lia n D D r u c e , B r u c e R T h o r le y
C o m m u n i c a b l e D i s e a s e s I n t e l l i g e n c e IS S N : 2 2 0 9 -6 0 51 O n lin e
T h is jo u r n a l is in d e x e d b y In d e x M e d ic u s a n d M e d lin e .
C r e a t iv e C o m m o n s L ic e n c e - A t t r ib u t io n -N o n C o m m e r c ia l-N o D e r iv a t iv e s C C B Y -N C -N D
© 2 0 2 0 C o m m o n w e a lt h o f A u s t r a lia a s r e p r e s e n t e d b y t h e D e p a r tm e n t o f H e a lt h
T h is p u b lic a t io n is l ic e n s e d u n d e r a C r e a t iv e C o m m o n s A t t r ib u t io n - N o n -C o m m e r c ia l N o D e r iv a t iv e s 4 .0 In t e r n a t io n a l L ic e n c e f r o m h t t p s ://c r e a t iv e c o m m o n s .o r g /lic e n s e s /b y -n c -n d /4 .0 /le g a lc o d e (L ic e n c e ). Yo u m u s t r e a d a n d u n d e r s t a n d t h e L ic e n c e b e f o r e u s in g a n y m a t e r ia l f r o m t h is p u b lic a t io n .
R e s t r i c t i o n s T h e L ic e n c e d o e s n o t c o v e r, a n d t h e r e is n o p e rm is s io n g iv e n f o r, u s e o f a n y o f t h e f o llo w in g m a t e r ia l f o u n d in t h is p u b lic a t io n (i f a n y ):
• t h e C o m m o n w e a lt h C o a t o f A rm s (b y w a y o f in f o rm a t io n , t h e t e rm s u n d e r w h ic h t h e C o a t o f A rm s m a y b e u s e d c a n b e f o u n d a t w w w .it s a n h o n o u r.g o v .a u );
• a n y lo g o s (in c lu d in g t h e D e p a r tm e n t o f H e a lt h ’s lo g o ) a n d t r a d e m a r k s ;
• a n y p h o t o g r a p h s a n d im a g e s ;
• a n y s ig n a t u r e s ; a n d
• a n y m a t e r ia l b e lo n g in g t o t h ir d p a r t ie s .
D i s c l a im e r O p in io n s e x p r e s s e d in C o m m u n ic a b le D is e a s e s In t e ll ig e n c e a r e t h o s e o f t h e a u t h o r s a n d n o t n e c e s s a r i ly t h o s e o f t h e A u s t r a lia n G o v e r n m e n t D e p a r tm e n t o f H e a lt h o r t h e C o m m u n ic a b le D is e a s e s N e t w o r k A u s t r a lia . D a t a m a y b e s u b je c t t o r e v is io n .
E n q u i r i e s E n q u ir ie s r e g a r d in g a n y o t h e r u s e o f t h is p u b lic a t io n s h o u ld b e a d d r e s s e d t o t h e C o m m u n ic a t io n B r a n c h , D e p a r tm e n t o f H e a lt h , G P O B o x 9 8 4 8 , C a n b e r r a A C T 2 6 01 , o r v ia e -m a il t o : c o p y r ig h t@ h e a lt h .g o v .a u
C o m m u n i c a b l e D i s e a s e s N e t w o r k A u s t r a l i a C o m m u n ic a b le D is e a s e s In t e ll ig e n c e c o n t r ib u t e s t o t h e w o r k o f t h e C o m m u n ic a b le D is e a s e s N e t w o r k A u s t r a lia . h t t p ://w w w .h e a lt h .g o v .a u /c d n a
Communicable Diseases Intelligence (CDI) is a peer-reviewed scientific journal published by the Office of Health Protection, Department of Health. The journal aims to disseminate information on the epidemiology, surveillance, prevention and control of communicable diseases of relevance to Australia.
E d i t o r Ta n ja F a rm e r
D e p u t y E d i t o r S im o n P e t r ie
D e s i g n a n d P r o d u c t i o n K a s r a Yo u s e fi
E d i t o r i a l A d v i s o r y B o a r d D a v id D u r r h e im , M a r k F e r s o n , J o h n K a ld o r, M a r t y n K ir k a n d L in d a S e lv e y
W e b s i t e h t t p ://w w w .h e a lt h .g o v .a u /c d i
C o n t a c t s C o m m u n ic a b le D is e a s e s In t e ll ig e n c e is p r o d u c e d b y : H e a lt h P r o t e c t io n P o lic y B r a n c h O ffi c e o f H e a lt h P r o t e c t io n A u s t r a lia n G o v e r n m e n t D e p a r tm e n t o f H e a lt h G P O B o x 9 8 4 8 , (M D P 6 ) C A N B E R R A A C T 2 6 01
E m a i l : c d i .e d it o r@ h e a lt h .g o v .a u
S u b m i t a n A r t i c l e Yo u a r e in v i t e d t o s u b m it y o u r n e x t c o m m u n ic a b le d is e a s e r e la t e d a r t ic le t o t h e C o m m u n ic a b le D is e a s e s In t e ll ig e n c e (C D I) f o r c o n s id e r a t io n . M o r e in f o rm a t io n r e g a r d in g C D I c a n b e f o u n d a t : h t t p ://h e a lt h .g o v .a u /c d i .
F u r t h e r e n q u ir ie s s h o u ld b e d ir e c t e d t o : c d i .e d it o r@ h e a lt h .g o v .a u .
1 of 8 health.gov.au/cdi Commun Dis I n te l l (2018) 2020;44 (https://doi.org/10.33321/cdi.2021.45.5) Epub 29/2/2021
S h o r t r e p o r t
D e c re a s e d in c id e n c e o f e n te ro v iru s a n d n o ro v iru s in fe c t io n s d u r in g th e C O V ID -19 p a n d em ic , V ic to r ia , A u s tra lia , 2 020L e e s a D B r u g g in k , A r n a u G a r c ia -C la p e s , T h o m a s T r a n , J u lia n D D r u c e , B r u c e R T h o r le y
Abstract
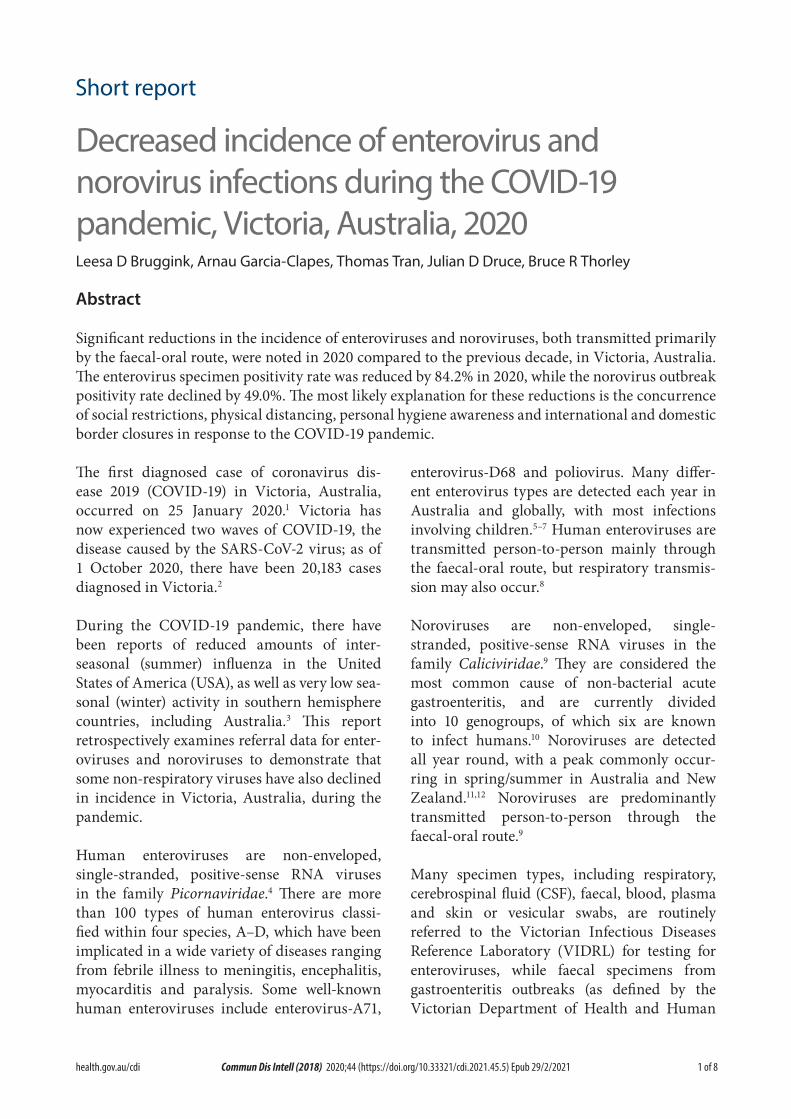
Significant reductions in the incidence of enteroviruses and noroviruses, both transmitted primarily by the faecal-oral route, were noted in 2020 compared to the previous decade, in Victoria, Australia. The enterovirus specimen positivity rate was reduced by 84.2% in 2020, while the norovirus outbreak positivity rate declined by 49.0%. The most likely explanation for these reductions is the concurrence of social restrictions, physical distancing, personal hygiene awareness and international and domestic border closures in response to the COVID-19 pandemic.
The first diagnosed case of coronavirus dis-ease 2019 (COVID-19) in Victoria, Australia, occurred on 25 January 2020.1 Victoria has now experienced two waves of COVID-19, the disease caused by the SARS-CoV-2 virus; as of 1 October 2020, there have been 20,183 cases diagnosed in Victoria.2
During the COVID-19 pandemic, there have been reports of reduced amounts of inter-seasonal (summer) influenza in the United States of America (USA), as well as very low sea-sonal (winter) activity in southern hemisphere countries, including Australia.3 This report retrospectively examines referral data for enter-oviruses and noroviruses to demonstrate that some non-respiratory viruses have also declined in incidence in Victoria, Australia, during the pandemic.
Human enteroviruses are non-enveloped, single-stranded, positive-sense RNA viruses in the family Picornaviridae.4 There are more than 100 types of human enterovirus classi-fied within four species, A–D, which have been implicated in a wide variety of diseases ranging from febrile illness to meningitis, encephalitis, myocarditis and paralysis. Some well-known human enteroviruses include enterovirus-A71,
enterovirus-D68 and poliovirus. Many differ-ent enterovirus types are detected each year in Australia and globally, with most infections involving children.5–7 Human enteroviruses are transmitted person-to-person mainly through the faecal-oral route, but respiratory transmis-sion may also occur.8
Noroviruses are non-enveloped, single-stranded, positive-sense RNA viruses in the family Caliciviridae.9 They are considered the most common cause of non-bacterial acute gastroenteritis, and are currently divided into 10 genogroups, of which six are known to infect humans.10 Noroviruses are detected all year round, with a peak commonly occur-ring in spring/summer in Australia and New Zealand.11,12 Noroviruses are predominantly transmitted person-to-person through the faecal-oral route.9
Many specimen types, including respiratory, cerebrospinal fluid (CSF), faecal, blood, plasma and skin or vesicular swabs, are routinely referred to the Victorian Infectious Diseases Reference Laboratory (VIDRL) for testing for enteroviruses, while faecal specimens from gastroenteritis outbreaks (as defined by the Victorian Department of Health and Human
2 of 8 health.gov.au/cdiCommun Dis I n te l l (2018) 2020;44 (https://doi.org/10.33321/cdi.2021.45.5) Epub 29/2/2021
Services) are referred for testing for the pres-ence of noroviruses. Screening of specimens for enterovirus and norovirus RNA is per-formed using real-time reverse-transcription polymerase chain reaction (RT-PCR) methods. The real-time RT-PCR for enterovirus RNA detection is a previously-described in-house assay.5 The norovirus real-time RT-PCR is a commercial assay (RIDAGENE Norovirus I & II, R-Biopharm, PG1415) previously evaluated in the laboratory.13 All specimens included in this study were referred from Victoria, Australia. Data are collected as part of routine clinical microbiology testing and for public health sur-veillance purposes, and are not identifiable to individual patients.
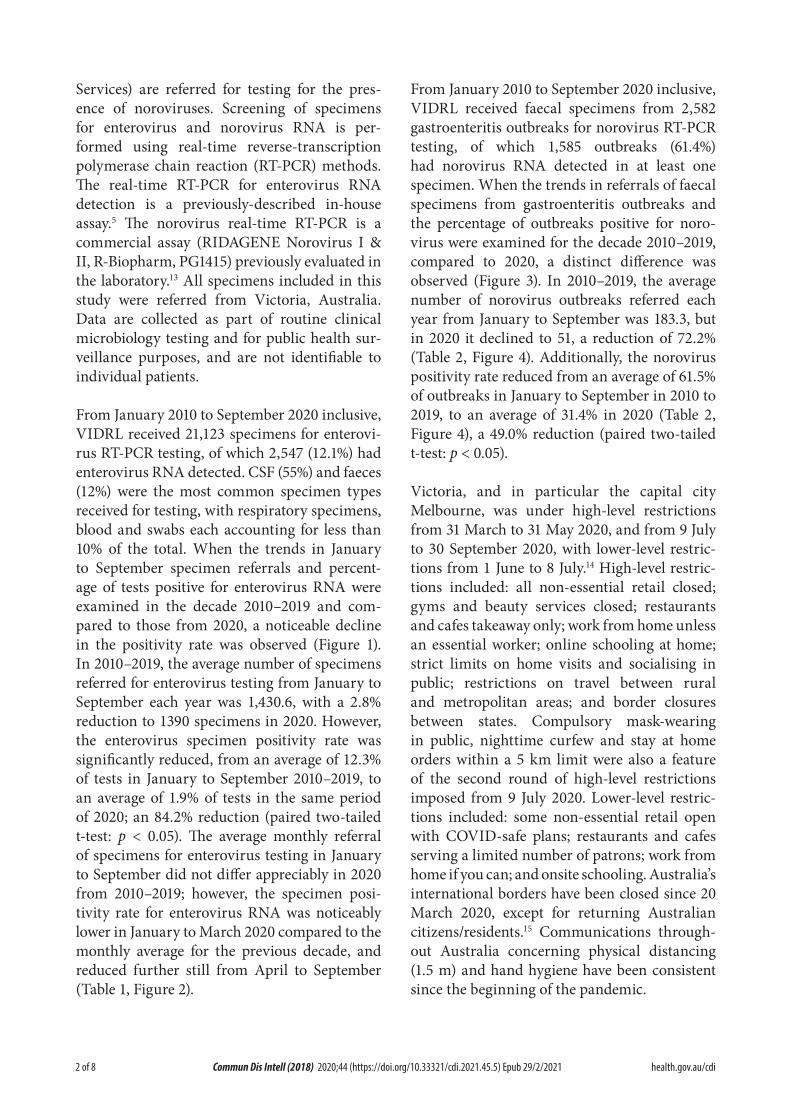
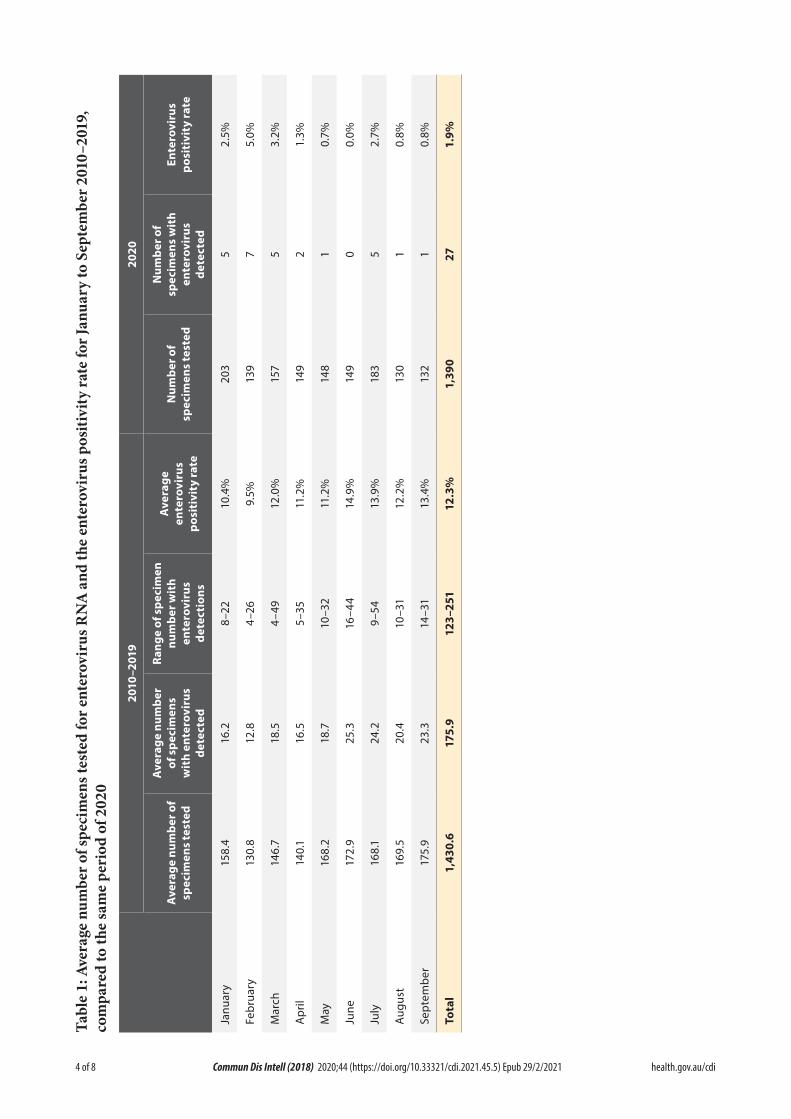
From January 2010 to September 2020 inclusive, VIDRL received 21,123 specimens for enterovi-rus RT-PCR testing, of which 2,547 (12.1%) had enterovirus RNA detected. CSF (55%) and faeces (12%) were the most common specimen types received for testing, with respiratory specimens, blood and swabs each accounting for less than 10% of the total. When the trends in January to September specimen referrals and percent-age of tests positive for enterovirus RNA were examined in the decade 2010–2019 and com-pared to those from 2020, a noticeable decline in the positivity rate was observed (Figure 1). In 2010–2019, the average number of specimens referred for enterovirus testing from January to September each year was 1,430.6, with a 2.8% reduction to 1390 specimens in 2020. However, the enterovirus specimen positivity rate was significantly reduced, from an average of 12.3% of tests in January to September 2010–2019, to an average of 1.9% of tests in the same period of 2020; an 84.2% reduction (paired two-tailed t-test: p < 0.05). The average monthly referral of specimens for enterovirus testing in January to September did not differ appreciably in 2020 from 2010–2019; however, the specimen posi-tivity rate for enterovirus RNA was noticeably lower in January to March 2020 compared to the monthly average for the previous decade, and reduced further still from April to September (Table 1, Figure 2).
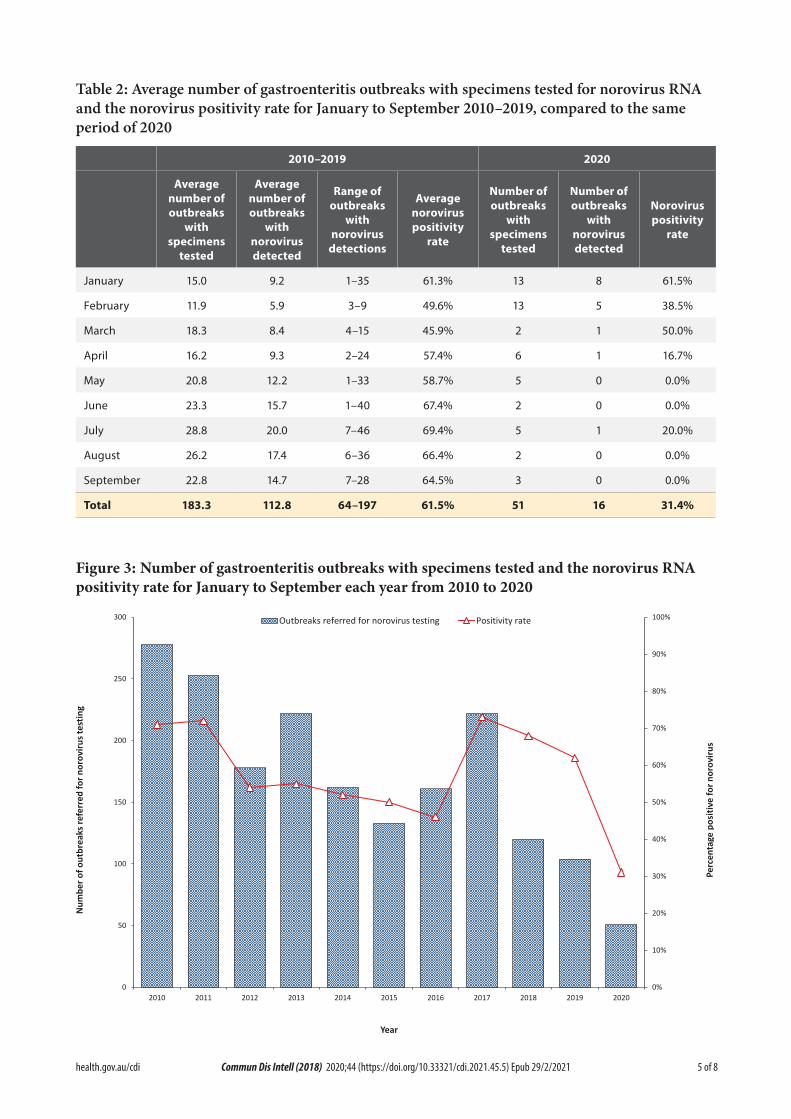
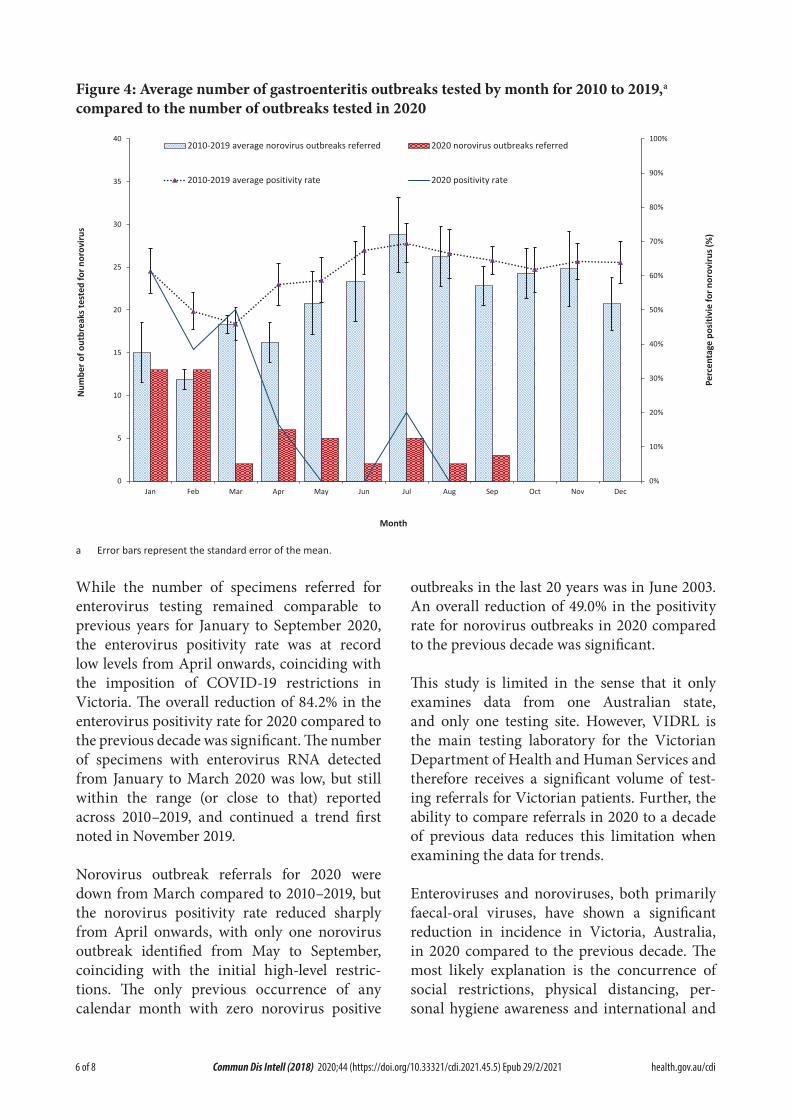
From January 2010 to September 2020 inclusive, VIDRL received faecal specimens from 2,582 gastroenteritis outbreaks for norovirus RT-PCR testing, of which 1,585 outbreaks (61.4%) had norovirus RNA detected in at least one specimen. When the trends in referrals of faecal specimens from gastroenteritis outbreaks and the percentage of outbreaks positive for noro-virus were examined for the decade 2010–2019, compared to 2020, a distinct difference was observed (Figure 3). In 2010–2019, the average number of norovirus outbreaks referred each year from January to September was 183.3, but in 2020 it declined to 51, a reduction of 72.2% (Table 2, Figure 4). Additionally, the norovirus positivity rate reduced from an average of 61.5% of outbreaks in January to September in 2010 to 2019, to an average of 31.4% in 2020 (Table 2, Figure 4), a 49.0% reduction (paired two-tailed t-test: p < 0.05).
Victoria, and in particular the capital city Melbourne, was under high-level restrictions from 31 March to 31 May 2020, and from 9 July to 30 September 2020, with lower-level restric-tions from 1 June to 8 July.14 High-level restric-tions included: all non-essential retail closed; gyms and beauty services closed; restaurants and cafes takeaway only; work from home unless an essential worker; online schooling at home; strict limits on home visits and socialising in public; restrictions on travel between rural and metropolitan areas; and border closures between states. Compulsory mask-wearing in public, nighttime curfew and stay at home orders within a 5 km limit were also a feature of the second round of high-level restrictions imposed from 9 July 2020. Lower-level restric-tions included: some non-essential retail open with COVID-safe plans; restaurants and cafes serving a limited number of patrons; work from home if you can; and onsite schooling. Australia’s international borders have been closed since 20 March 2020, except for returning Australian citizens/residents.15 Communications through-out Australia concerning physical distancing (1.5 m) and hand hygiene have been consistent since the beginning of the pandemic.
3 of 8 health.gov.au/cdi Commun Dis I n te l l (2018) 2020;44 (https://doi.org/10.33321/cdi.2021.45.5) Epub 29/2/2021
Figure 1: Number of enterovirus RNA tests and the positivity rate for total tests for January to September each year from 2010 to 2020
0%
2%
4%
6%
8%
10%
12%
14%
16%
18%
20%
0
200
400
600
800
1,000
1,200
1,400
1,600
1,800
2010 2011 2012 2013 2014 2015 2016 2017 2018 2019 2020
Perc
enta
ge p
ositi
ve fo
r ent
erov
irus
Spec
imen
s tes
ted
for e
nter
oviru
s
Year
Total specimens for enterovirus testing Positivity rate
Figure 2: Average number of enterovirus RNA tests by month and the positivity rate for 2010 to 2019,a compared to tests performed in 2020
0%
5%
10%
15%
20%
25%
30%
35%
40%
0
50
100
150
200
250
Jan Feb Mar Apr May Jun Jul Aug Sep Oct Nov Dec
Perc
enta
ge p
ositi
vie
for e
nter
oviru
s (%
)
Num
ber o
f spe
cim
ens t
este
d fo
r ent
erov
irus
Month
2010-2019 average enterovirus tests 2020 enterovirus tests
2010-2019 average positivity rate 2020 positivity rate
a E r r o r b a r s r e p r e s e n t t h e s t a n d a r d e r r o r o f t h e m e a n .
4 of 8 health.gov.au/cdiCommun Dis I n te l l (2018) 2020;44 (https://doi.org/10.33321/cdi.2021.45.5) Epub 29/2/2021
Table 1: Average num
ber o
f specimen
s tested for e
nterov
irus RNA an
d the enterovirus p
ositivity ra
te fo
r Jan
uary to
September 2
010–
2019,
compa
red to th
e same period
of 2
020
2010
–201
920
20
Ave
rage number of
spec
imen
s tested
Ave
rage number
of spec
imen
s with enterovirus
detec
ted
Ran
ge of spec
imen
number with
enterovirus
detec
tions
Ave
rage
enterovirus
pos
itivity rate
Number of
spec
imen
s tested
Number of
spec
imen
s with
enterovirus
detec
ted
Enterovirus
pos
itivity rate
Janu
ary
158.4
16.2
8–22
10.4%
203
52.5%
Februa
ry130.8
12.8
4–26
9.5%
139
75.0%
March
146.7
18.5
4–49
12.0%
157
53.2%
April
140.1
16.5
5–35
11.2%
149
21.3%
May
168.2
18.7
10–32
11.2%
148
10.7%
June
172.9
25.3
16–4
414.9%
149
00.0%
July
168.1
24.2
9–54
13.9%
183
52.7%
Aug
ust
169.5
20.4
10–31
12.2%
130
10.8%
Septem
ber
175.9
23.3
14–31
13.4%
132
10.8%
Total
1,43
0.6
175.9
123–
251
12.3%
1,39
027
1.9%
5 of 8 health.gov.au/cdi Commun Dis I n te l l (2018) 2020;44 (https://doi.org/10.33321/cdi.2021.45.5) Epub 29/2/2021
Table 2: Average number of gastroenteritis outbreaks with specimens tested for norovirus RNA and the norovirus positivity rate for January to September 2010–2019, compared to the same period of 2020
2 0 1 0 –2 0 1 9 2 0 2 0
A v e r a g e n u m b e r o f o u t b r e a k s
w i t h s p e c i m e n s t e s t e d
A v e r a g e n u m b e r o f o u t b r e a k s
w i t h n o r o v i r u s d e t e c t e d
R a n g e o f o u t b r e a k s
w i t h n o r o v i r u s d e t e c t i o n s
A v e r a g e n o r o v i r u s p o s i t i v i t y
r a t e
N u m b e r o f o u t b r e a k s
w i t h s p e c i m e n s t e s t e d
N u m b e r o f o u t b r e a k s
w i t h n o r o v i r u s d e t e c t e d
N o r o v i r u s p o s i t i v i t y
r a t e
J a n u a r y 1 5 .0 9 .2 1 –3 5 6 1 .3 % 13 8 6 1 .5 %
F e b r u a r y 11 .9 5 .9 3 –9 4 9 .6 % 13 5 3 8 .5 %
M a r c h 1 8 .3 8 .4 4 –15 4 5 .9 % 2 1 5 0 .0 %
A p r i l 1 6 .2 9 .3 2 –2 4 5 7.4% 6 1 1 6 .7 %
M a y 2 0 .8 12 .2 1 –3 3 5 8 .7 % 5 0 0 .0 %
J u n e 2 3 .3 1 5 .7 1 –4 0 6 7.4% 2 0 0 .0 %
J u ly 2 8 .8 2 0 .0 7–4 6 6 9 .4% 5 1 2 0 .0 %
A u g u s t 2 6 .2 17.4 6 –3 6 6 6 .4% 2 0 0 .0 %
S e p t e m b e r 2 2 .8 14 .7 7–2 8 6 4 .5 % 3 0 0 .0 %
T o t a l 1 8 3 . 3 1 1 2 . 8 6 4 –1 9 7 6 1 . 5 % 5 1 1 6 3 1 . 4 %
Figure 3: Number of gastroenteritis outbreaks with specimens tested and the norovirus RNA positivity rate for January to September each year from 2010 to 2020
0%
10%
20%
30%
40%
50%
60%
70%
80%
90%
100%
0
50
100
150
200
250
300
2010 2011 2012 2013 2014 2015 2016 2017 2018 2019 2020
Perc
enta
ge p
ositi
ve fo
r nor
oviru
s
Num
ber o
f out
brea
ks re
ferr
ed fo
r nor
oviru
s tes
ting
Year
Outbreaks referred for norovirus testing Positivity rate
6 of 8 health.gov.au/cdiCommun Dis I n te l l (2018) 2020;44 (https://doi.org/10.33321/cdi.2021.45.5) Epub 29/2/2021
Figure 4: Average number of gastroenteritis outbreaks tested by month for 2010 to 2019,a compared to the number of outbreaks tested in 2020
0%
10%
20%
30%
40%
50%
60%
70%
80%
90%
100%
0
5
10
15
20
25
30
35
40
Jan Feb Mar Apr May Jun Jul Aug Sep Oct Nov Dec
Perc
enta
ge p
ositi
vie
for n
orov
irus (
%)
Num
ber o
f out
brea
ks te
sted
for n
orov
irus
Month
2010-2019 average norovirus outbreaks referred 2020 norovirus outbreaks referred
2010-2019 average positivity rate 2020 positivity rate
a Error bars represent the standard error of the mean.
While the number of specimens referred for enterovirus testing remained comparable to previous years for January to September 2020, the enterovirus positivity rate was at record low levels from April onwards, coinciding with the imposition of COVID-19 restrictions in Victoria. The overall reduction of 84.2% in the enterovirus positivity rate for 2020 compared to the previous decade was significant. The number of specimens with enterovirus RNA detected from January to March 2020 was low, but still within the range (or close to that) reported across 2010–2019, and continued a trend first noted in November 2019.
Norovirus outbreak referrals for 2020 were down from March compared to 2010–2019, but the norovirus positivity rate reduced sharply from April onwards, with only one norovirus outbreak identified from May to September, coinciding with the initial high-level restric-tions. The only previous occurrence of any calendar month with zero norovirus positive
outbreaks in the last 20 years was in June 2003. An overall reduction of 49.0% in the positivity rate for norovirus outbreaks in 2020 compared to the previous decade was significant.
This study is limited in the sense that it only examines data from one Australian state, and only one testing site. However, VIDRL is the main testing laboratory for the Victorian Department of Health and Human Services and therefore receives a significant volume of test-ing referrals for Victorian patients. Further, the ability to compare referrals in 2020 to a decade of previous data reduces this limitation when examining the data for trends.
Enteroviruses and noroviruses, both primarily faecal-oral viruses, have shown a significant reduction in incidence in Victoria, Australia, in 2020 compared to the previous decade. The most likely explanation is the concurrence of social restrictions, physical distancing, per-sonal hygiene awareness and international and
7 of 8 health.gov.au/cdi Commun Dis I n te l l (2018) 2020;44 (https://doi.org/10.33321/cdi.2021.45.5) Epub 29/2/2021
domestic border closures resulting from the COVID-19 pandemic in 2020. It remains to be seen whether infectious diseases, other than COVID-19, increase in incidence when restric-tions are eased.
Author details
Dr Leesa D Bruggink, Senior Medical Scientist1
Mr Arnau Garcia-Clapes, Administrative Officer1
Mr Thomas Tran, Senior Medical Scientist2
Dr Julian D Druce, Laboratory Head2
Dr Bruce R Thorley, Laboratory Head1
1. Enteric Virus Laboratory, Victorian Infec-tious Diseases Reference Laboratory (VID-RL), Royal Melbourne Hospital, at the Peter Doherty Institute for Infection and Immunity
2. Viral Identification Laboratory, Victorian Infectious Diseases Reference Laboratory (VIDRL), Royal Melbourne Hospital, at the Peter Doherty Institute for Infection and Im-munity
Corresponding author
Dr Leesa D Bruggink
Victorian Infectious Diseases Reference Laboratory, Royal Melbourne Hospital, at the Peter Doherty Institute for Infection and Immunity, 792 Elizabeth St, Melbourne, Victoria, Australia
Email: [email protected]
Phone: +61 03 93429607
References
1. Department of Health and Human Services (DHHS). Media releases. [Internet.] Mel-bourne: Victoria State Government, DHHS; 2020. [Accessed on 29 October 2020.] Avail-able from: https://www2.health.vic.gov.au/about/media-centre/mediareleases.
2. DHHS. Coronavirus update for Victoria – 01 October 2020. [Internet.] Melbourne: Vic-toria State Government, DHHS; 1 October 2020. [Accessed on 29 October 2020.] Avail-able from: https://www.dhhs.vic.gov.au/coro-navirus-update-victoria-01-october-2020.
3. Olsen SJ, Azziz-Baumgartnet E, Budd AP, Brammer L, Sullivan S, Pineda RF et al. De-creased influenza activity during the COV-ID-19 pandemic – United States, Australia, Chile, and South Africa, 2020. MMWR Morb Mortal Wkly Rep. 2020;69(37):1305–9.
4. Pallansch MA, Oberste MS, Whitton JL. Enteroviruses: polioviruses, coxsackieviruses, echoviruses, and newer enteroviruses. In Knipe DM, Howley PM, eds. Fields Virol-ogy. Volume 1. (Sixth edition.) Philadelphia: Wolters Kluwer Health/Lippincott Williams & Wilkins; 2013, 490–530.
5. Papadakis G, Chibo D, Druce J, Catton M, Birch C. Detection and genotyping of entero-viruses in cerebrospinal fluid in patients in Victoria, Australia, 2007–2013. J Med Virol. 2014;86(9):1609–13.
6. Roberts JA, Hobday LK, Ibrahim A, Thorley B. Australian National Enterovirus Reference Laboratory annual report, 2018. Commun Dis Intell (2018). 2020;44. doi: https://doi.org/10.33321/cdi.2020.44.26.
7. Suresh S, Rawlinson WD, Andrews PI, Stelz-er-Braid S. Global epidemiology of nonpolio enteroviruses causing severe neurological complications: A systematic review and me-ta-analysis. Rev Med Virol. 2020;30(1):e2082. doi: https://doi.org/10.1002/rmv.2082.
8 of 8 health.gov.au/cdiCommun Dis I n te l l (2018) 2020;44 (https://doi.org/10.33321/cdi.2021.45.5) Epub 29/2/2021
8. Oberste MS, Pallansch MA. Establishing evidence for enterovirus infection in chronic disease. Ann N Y Acad Sci. 2003;1005:23–31.
9. Green KY. Caliciviridae: the noroviruses. In Knipe DM, Howley PM, eds. Fields Virol-ogy. Volume 1. (Sixth edition.) Philadelphia: Wolters Kluwer Health/Lippincott Williams & Wilkins; 2013, 582–608.
10. Chhabra P, de Graaf M, Parra GI, Chan MCW, Green K, Martella V et al. Updated classification of norovirus genogroups and genotypes. J Gen Virol. 2019;100(10):1393–406.
11. Bruggink L, Witlox K, Huang B, Warrilow D, Marshall J. GII.4 norovirus recombi-nant causes gastroenteritis epidemic in eastern Australia, winter 2017. J Med Virol. 2018;90(6):1168–71.
12. Lun JH, Hewitt J, Yan GJH, Tuipulotu DE, Rawlinson WD, White PA. Recombinant GII.P16/GII.4 Sydney 2012 was the dominant norovirus identified in Australia and New Zealand in 2017. Viruses. 2018;10(10):548. doi: https://dx.doi.10.3390/v10100548.
13. Dunbar NL, Bruggink LD, Marshall JA. Evaluation of the RIDAGENE real-time PCR assay for the detection of GI and GII norovi-rus. Diagn Microbiol Infect Dis. 2014;79:317–21.
14. DHHS. Media hub – coronavirus (COV-ID-19). [Internet.] Melbourne: Victoria State Government, DHHS; 2020. [Accessed on 29 October 2020.] Available from: https://www.dhhs.vic.gov.au/media-hub-coronavirus-disease-covid-19.
15. Prime Minister of Australia. Border restric-tions. Media release 19 Mar 2020. [Internet.] Canberra: Australian Government Depart-ment of Prime Minister and Cabinet; 19 March 2020. [Accessed on 13 November 2020.] Available from: https://www.pm.gov.au/media/border-restrictions.