Embed Size (px)
Citation preview
1
2020 Investor DayMaury Gallagher – Chairman and CEO

1
2020 Investor DayScott Sheldon- EVP & COO
2
Predictive Maintenance to Reduce IROPs and Maintenance Costs
Self Service Initiatives to Reduce Call Center Volume
Improved IROPS cost & Customer Experience
Improved Operational Performance and Reliability
Operations overview
3
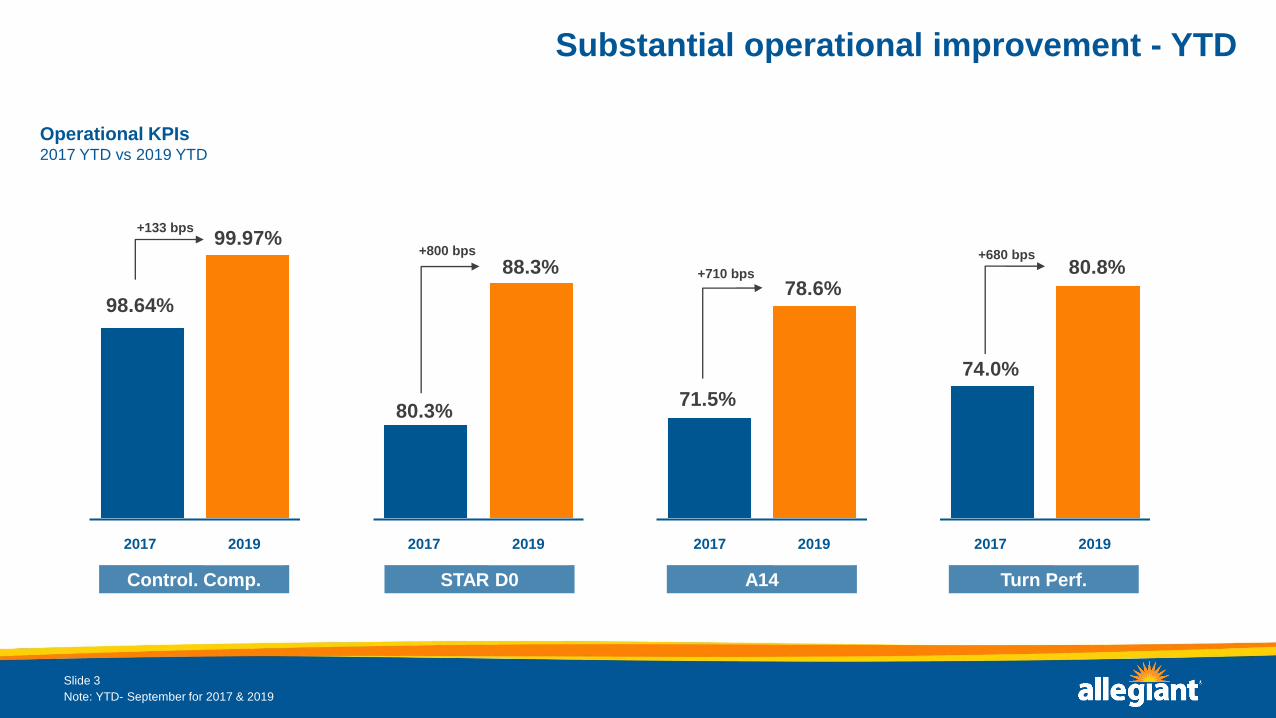
Substantial operational improvement - YTD
Operational KPIs2017 YTD vs 2019 YTD
2019E 2019E
Slide 3
2020E 2020E 2019E 2019E2021E 2021E
98.64%
Control. Comp. STAR D0 A14 Turn Perf.
2017 2019 2017 20192017 20192017 2019
99.97%
80.3%
88.3%78.6%
71.5%
80.8%
74.0%
+133 bps
+800 bps
+710 bps
+680 bps
Note: YTD- September for 2017 & 2019
4
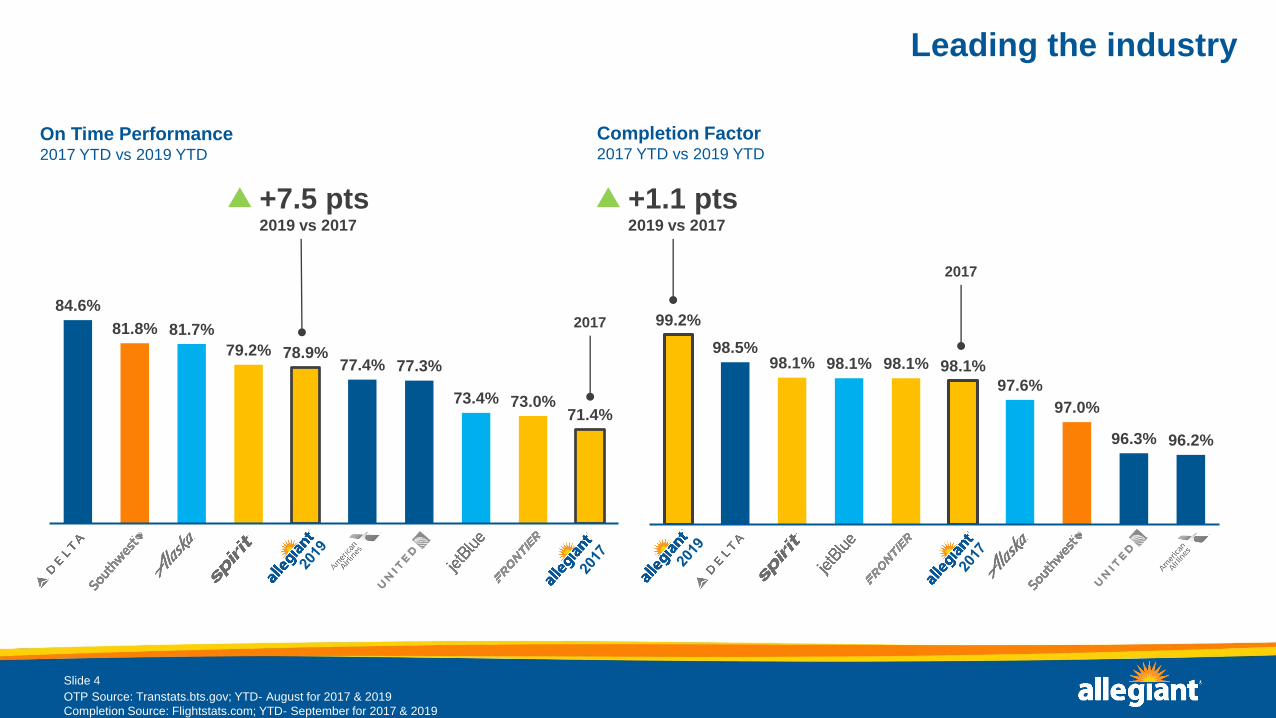
99.2%
98.5%98.1% 98.1% 98.1% 98.1%
97.6%
97.0%
96.3% 96.2%
Allegiant Spirit Frontier Alaska United
84.6%
81.8% 81.7%
79.2% 78.9%77.4% 77.3%
73.4% 73.0%71.4%
DL WN AS NK G4 AA UA B6 F9 G4 2017
Leading the industry
On Time Performance2017 YTD vs 2019 YTD
Slide 4
+7.5 pts2019 vs 2017
2017
+1.1 pts2019 vs 2017
2017
OTP Source: Transtats.bts.gov; YTD- August for 2017 & 2019
Completion Source: Flightstats.com; YTD- September for 2017 & 2019
Completion Factor2017 YTD vs 2019 YTD

5
Best in industry – 18 of the last 21 months
Completion Factor2017 – September 2019
Slide 5
90%
92%
94%
96%
98%
100%
Industry average ex Allegiant Other airlines
Source: Flightstats.com Other airlines include: Alaska Airlines, American Airlines, Delta Air Lines, Frontier Airlines, JetBlue, Southwest Airlines, Spirit Airlines, United Airlines.*includes flights delayed to next day

6
0.0
1.0
2.0
3.0
4.0
5.0
6.0
7.0
8.0
9.0
10.0
10%
15%
20%
25%
30%
2013 2014 2015 2016 2017 2018 1Q19 2Q19 3Q19
Blo
ck H
ou
r U
tiliz
atio
n
% o
f F
ligh
ts w
ith
Con
tro
llab
le D
ela
ys
11.6%3Q19
Operational improvement in a higher utilization environment
A14 Trend 2013 – 3Q19
Slide 6
60%
65%
70%
75%
80%
85%
2013 2014 2015 2016 2017 2018 1Q19 2Q19 3Q19
79.9%3Q19
% of Flights With Controllable Delays vs Blk Hr Utilization2013 – 3Q19
Note: Average for 3Q19
3Q19 vs 2013+34.5%
7
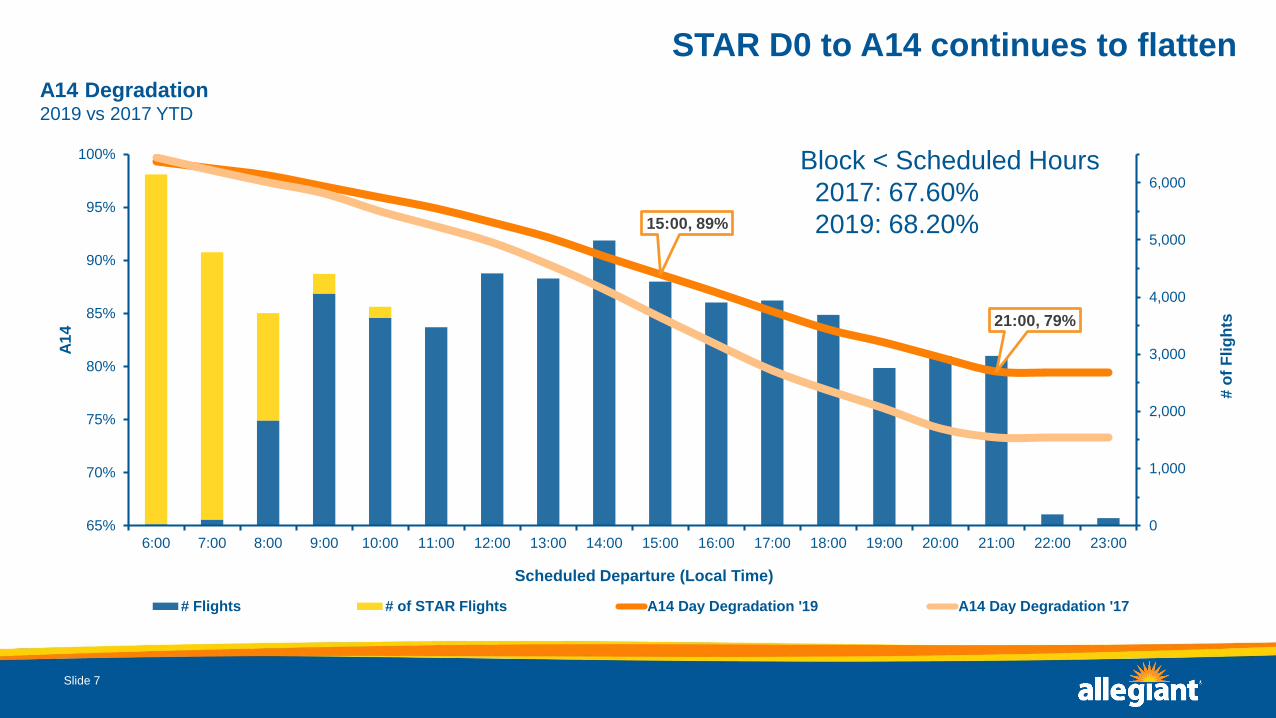
STAR D0 to A14 continues to flatten
Slide 7
15:00, 89%
21:00, 79%
0
1,000
2,000
3,000
4,000
5,000
6,000
65%
70%
75%
80%
85%
90%
95%
100%
6:00 7:00 8:00 9:00 10:00 11:00 12:00 13:00 14:00 15:00 16:00 17:00 18:00 19:00 20:00 21:00 22:00 23:00
Scheduled Departure (Local Time)
# o
f F
lig
hts
A1
4
# Flights # of STAR Flights A14 Day Degradation '19 A14 Day Degradation '17
A14 Degradation2019 vs 2017 YTD
Block < Scheduled Hours
2017: 67.60%
2019: 68.20%
8
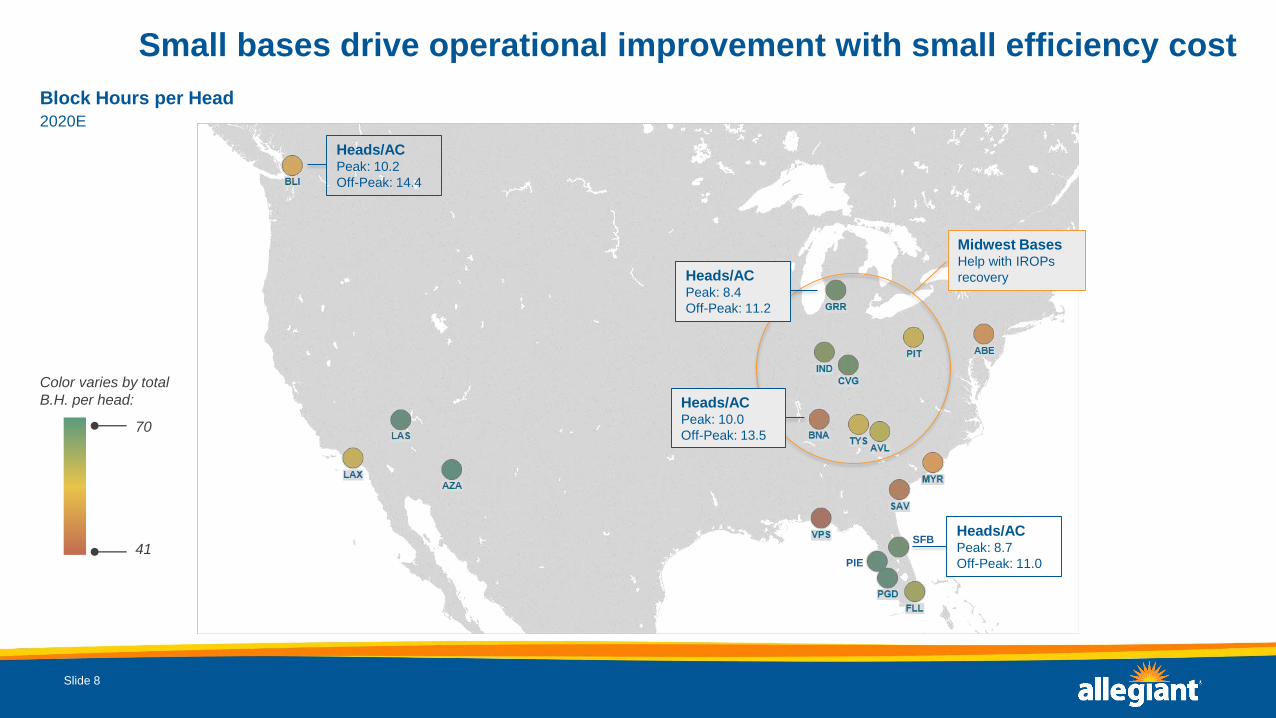
Small bases drive operational improvement with small efficiency cost
Slide 8
Block Hours per Head
2020E
Color varies by total
B.H. per head:
70
41PIE
SFBHeads/ACPeak: 8.7
Off-Peak: 11.0
Heads/ACPeak: 10.2
Off-Peak: 14.4
Heads/ACPeak: 8.4
Off-Peak: 11.2
Heads/ACPeak: 10.0
Off-Peak: 13.5
Midwest BasesHelp with IROPs
recovery
9
$36.2
$25.8
$11.8
909
287
28
824
233
230
100
200
300
400
500
600
700
800
900
1000
-
5
10
15
20
25
30
35
40
2017 2018 2019
Cost of IROPs Cancellations MX Cancellations
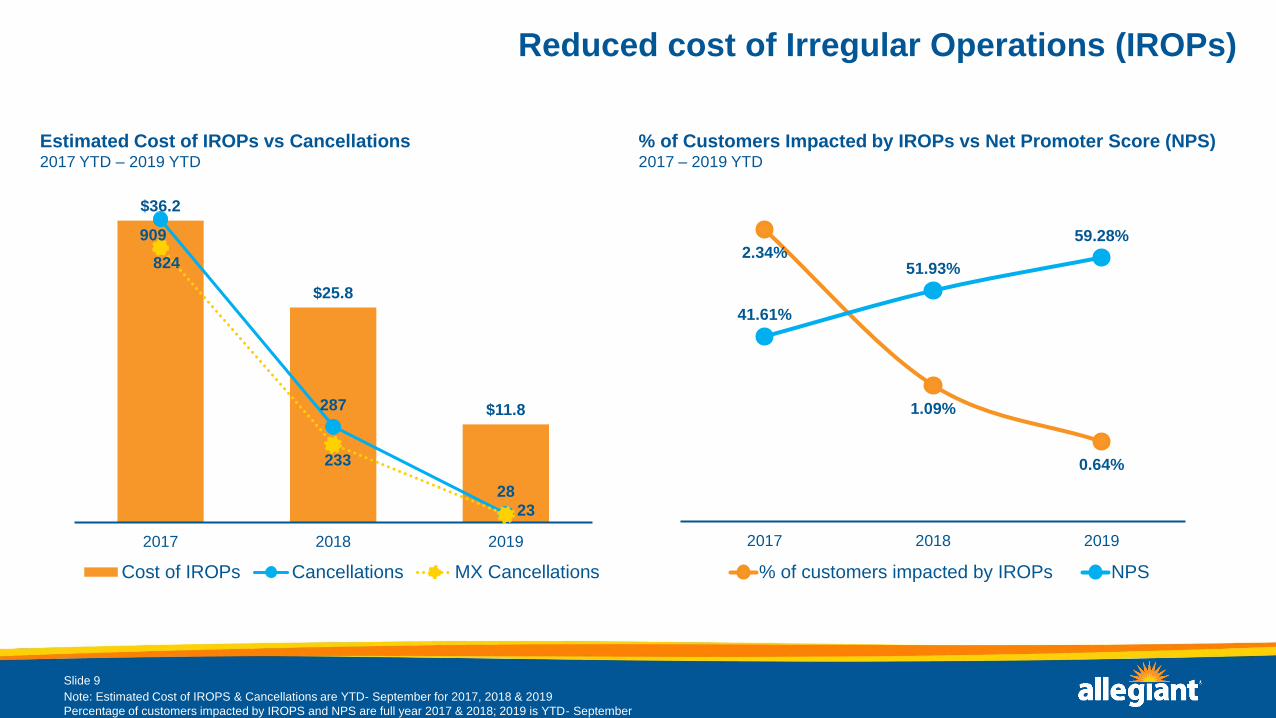
Reduced cost of Irregular Operations (IROPs)
Estimated Cost of IROPs vs Cancellations 2017 YTD – 2019 YTD
Slide 9
2.34%
1.09%
0.64%
41.61%
51.93%
59.28%
0.0%
10.0%
20.0%
30.0%
40.0%
50.0%
60.0%
70.0%
-
0
0
0
0
0
2017 2018 2019
% of customers impacted by IROPs NPS
% of Customers Impacted by IROPs vs Net Promoter Score (NPS)2017 – 2019 YTD
Note: Estimated Cost of IROPS & Cancellations are YTD- September for 2017, 2018 & 2019
Percentage of customers impacted by IROPS and NPS are full year 2017 & 2018; 2019 is YTD- September
10
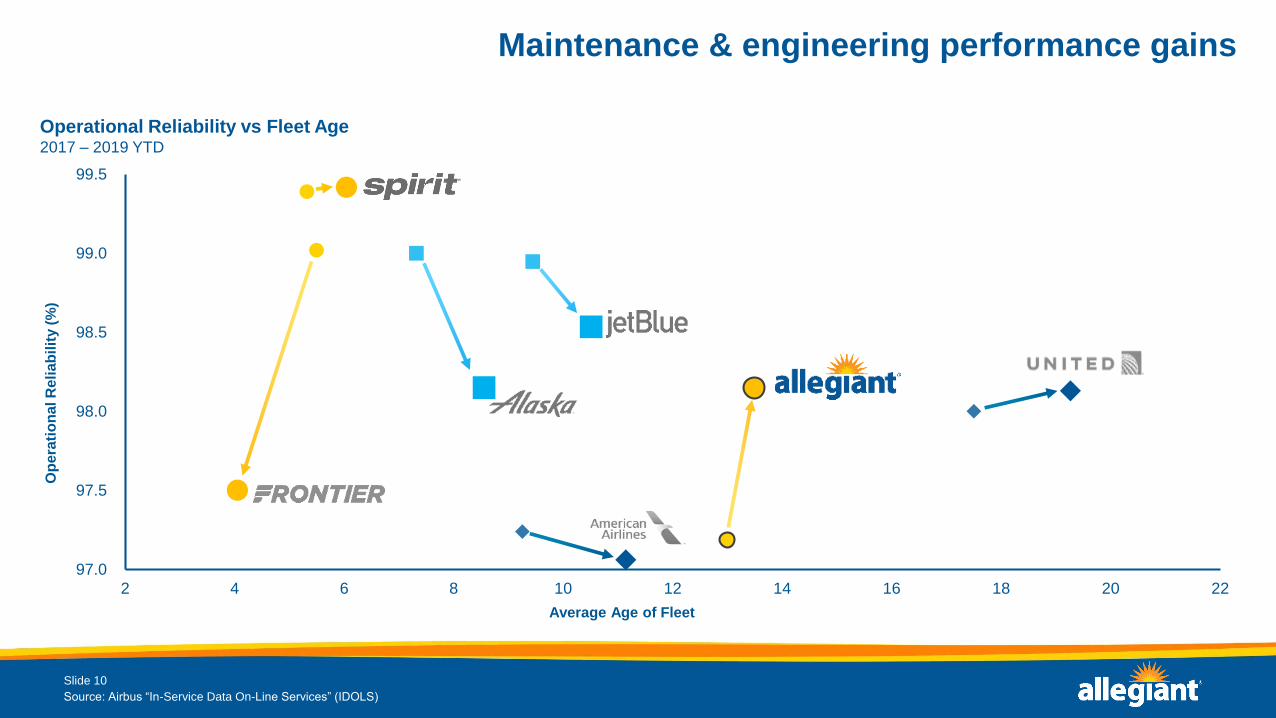
Maintenance & engineering performance gains
Operational Reliability vs Fleet Age2017 – 2019 YTD
Slide 10
97.0
97.5
98.0
98.5
99.0
99.5
2 4 6 8 10 12 14 16 18 20 22
Op
era
tio
na
l R
eli
ab
ilit
y (
%)
Average Age of Fleet
Source: Airbus “In-Service Data On-Line Services” (IDOLS)

11
Improved dispatch reliability vs. North American operators
95.5%
96.0%
96.5%
97.0%
97.5%
98.0%
98.5%
99.0%
Ja
n-1
7
Fe
b-1
7
Ma
r-17
Apr-
17
Ma
y-1
7
Ju
n-1
7
Ju
l-1
7
Aug
-17
Sep
-17
Oct-
17
No
v-1
7
Dec-1
7
Ja
n-1
8
Fe
b-1
8
Ma
r-18
Apr-
18
Ma
y-1
8
Ju
n-1
8
Ju
l-1
8
Aug
-18
Sep
-18
Oct-
18
Nov-1
8
Dec-1
8
Ja
n-1
9
Fe
b-1
9
Ma
r-19
Apr-
19
Ma
y-1
9
Ju
n-1
9
Ju
l-1
9
Aug
-19
Sep
-19
Allegiant North America
Allegiant vs North America Dispatch ReliabilityJanuary 2017 – September 2019

12
Skywise integration and long-term planTurn historically unscheduled maintenance events into scheduled maintenance events
• Leverage aircraft connectivity, technical engineering expertise, and data modeling to build predictive models that can accurately forecast
future component/system failure
• AC modifications to enhance amount of data coming off AC (“FOMAX”) ongoing
Year to date, over 150 maintenance actions initiated from predictive maintenance alerts
• Dropping aircraft out of service frequency by estimated 10 percent during operational hours
• Estimated 600 maintenance hours reallocated from normal irregular operations recovery towards strategic reliability initiatives
Avg: 9.3 Hrs.
Avg: 11.4 Hrs.
13
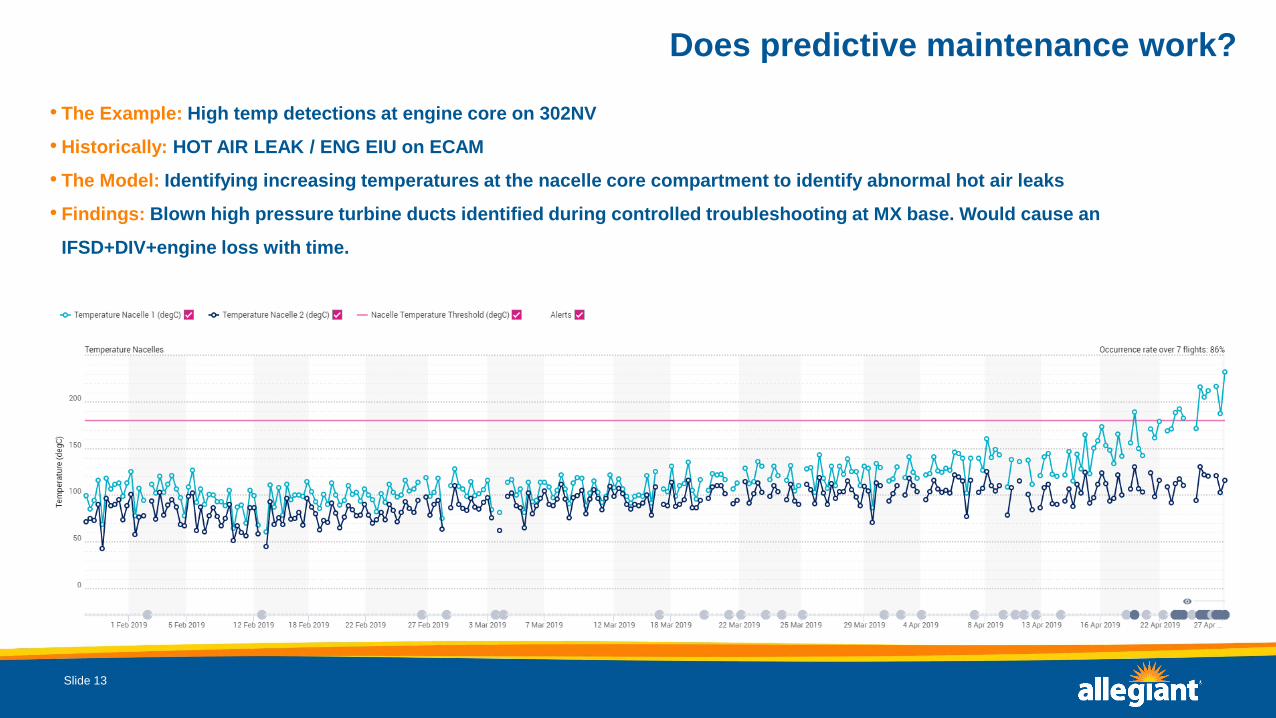
Does predictive maintenance work?
Slide 13
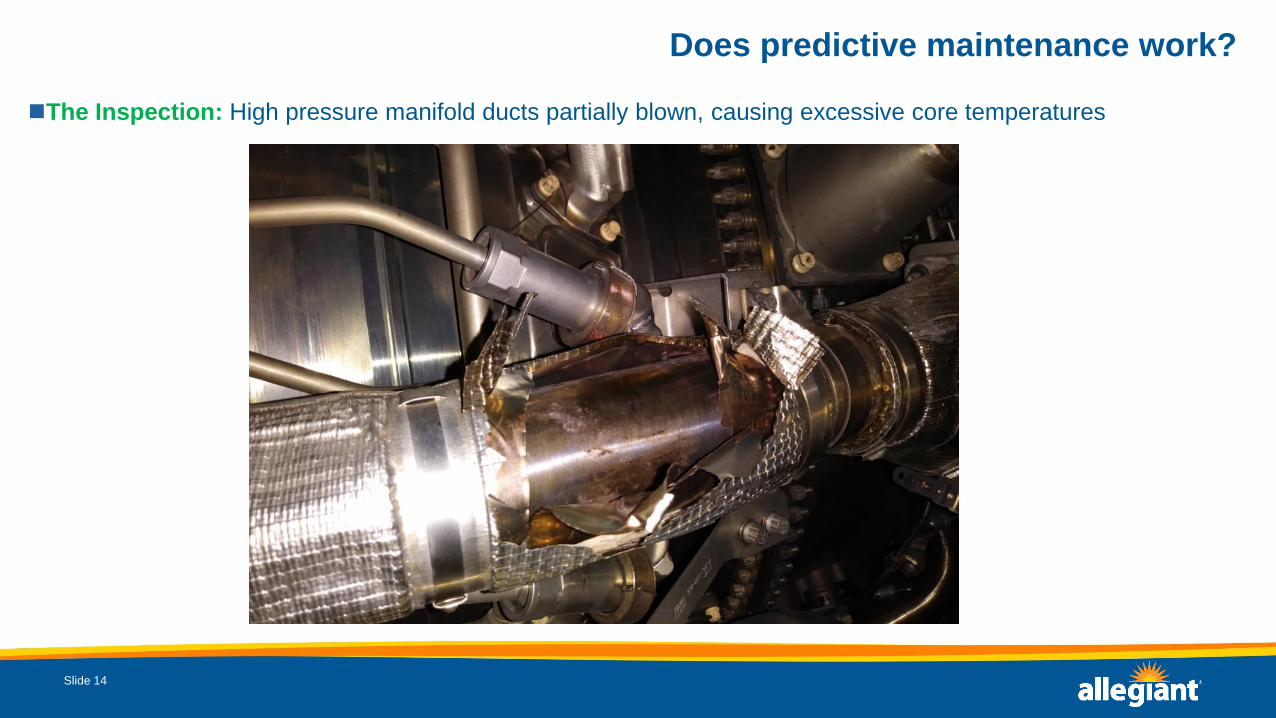
• The Example: High temp detections at engine core on 302NV
• Historically: HOT AIR LEAK / ENG EIU on ECAM
• The Model: Identifying increasing temperatures at the nacelle core compartment to identify abnormal hot air leaks
• Findings: Blown high pressure turbine ducts identified during controlled troubleshooting at MX base. Would cause an
IFSD+DIV+engine loss with time.
14
Does predictive maintenance work?
Slide 14
The Inspection: High pressure manifold ducts partially blown, causing excessive core temperatures
15
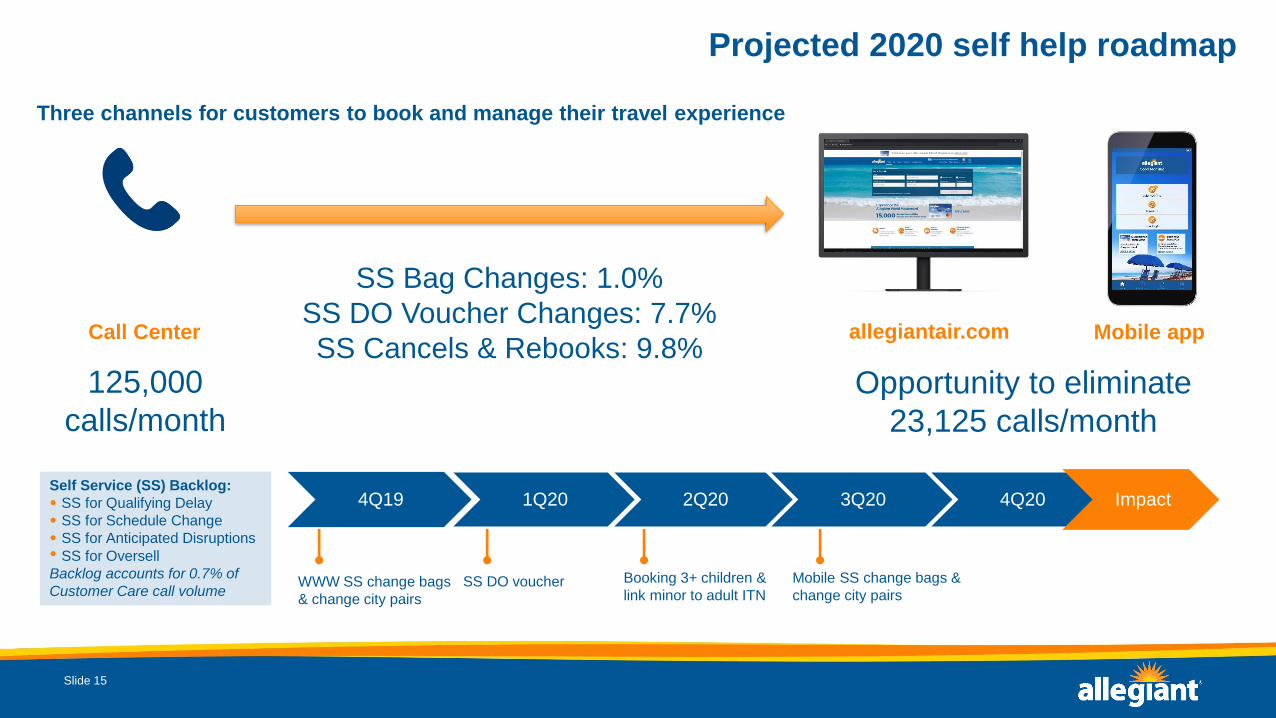
Projected 2020 self help roadmap
Slide 15
WWW SS change bags
& change city pairs
4Q19 1Q20 2Q20 3Q20 4Q20 ImpactSelf Service (SS) Backlog:
• SS for Qualifying Delay
• SS for Schedule Change
• SS for Anticipated Disruptions
• SS for Oversell
Backlog accounts for 0.7% of
Customer Care call volumeMobile SS change bags &
change city pairsSS DO voucher Booking 3+ children &
link minor to adult ITN
Mobile appallegiantair.comCall Center
Three channels for customers to book and manage their travel experience
SS Bag Changes: 1.0%
SS DO Voucher Changes: 7.7%
SS Cancels & Rebooks: 9.8%
125,000
calls/month
Opportunity to eliminate
23,125 calls/month
11
Commercial
Approach to
Allegiant 2.0
Scott DeAngelo
Chief Marketing Officer
22
Marketing Approach
Allegiant 2.0
Loyalty Programs
Strategic Partnerships

33

44
Marketing Approach

55
Overview of Allegiant’s commercial approach
Source: based on trailing 12 months as of Sep ’19

66
$211.71
$158.16
$258.41 97.1%
25.5%*
$94.31*
$250.92
Average Net Revenue “Total Basket”; 2-PAX ITN
EBITDA %
+70%
+266%
Average EBITDA“Total Basket”; 2 PAX ITN
Selling “beyond the plane” with third party products (hotel, auto and cobrand credit card)
drives game-changing impact on customer revenue and profitability levels
Allegiant “total basket” ITN-level economics
*Data represents base fare and air ancillary combined
Note: illustrative 2-passenger itinerary based on average transaction amounts over the trailing 12 months as of Sep ’19
Third Party
Air Ancillary
Air
77
$0.00
$5.00
$10.00
$15.00
$20.00
$25.00
DL UA HA AA AS B6 WN F9 G4 NK
Estimated Credit Card Fees Other Fulfillment Advertising
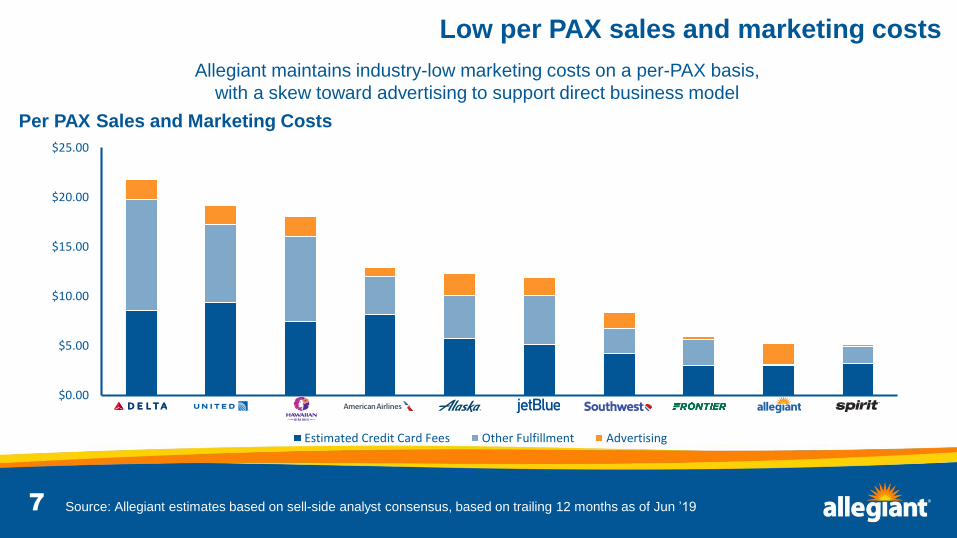
Low per PAX sales and marketing costs
Allegiant maintains industry-low marketing costs on a per-PAX basis,
with a skew toward advertising to support direct business model
Source: Allegiant estimates based on sell-side analyst consensus, based on trailing 12 months as of Jun ’19
Per PAX Sales and Marketing Costs
88
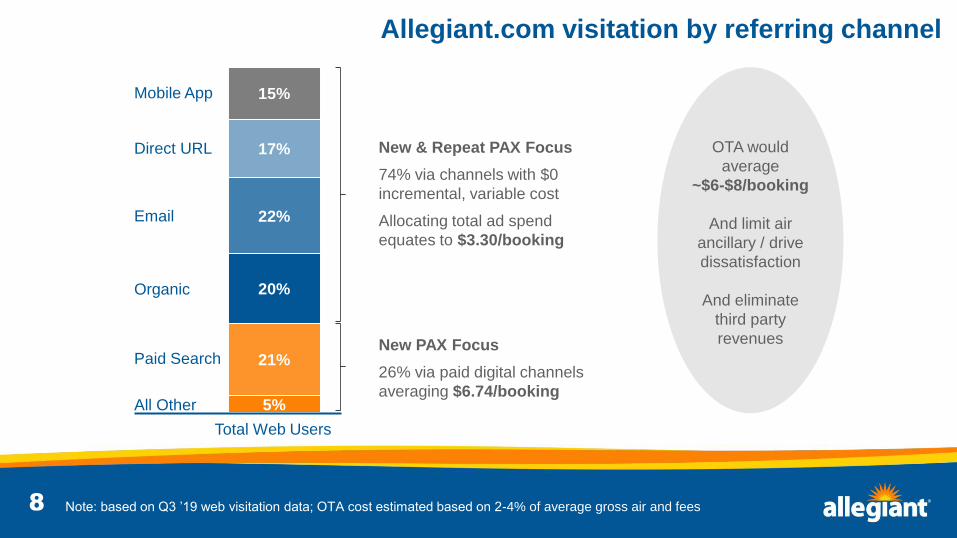
5%
21%
20%
22%
17%
15%Mobile App
Direct URL
Organic
Paid Search
All Other
New & Repeat PAX Focus
74% via channels with $0
incremental, variable cost
Allocating total ad spend
equates to $3.30/booking
New PAX Focus
26% via paid digital channels
averaging $6.74/booking
OTA would
average
~$6-$8/booking
And limit air
ancillary / drive
dissatisfaction
And eliminate
third party
revenues
Total Web Users
Allegiant.com visitation by referring channel
Note: based on Q3 ’19 web visitation data; OTA cost estimated based on 2-4% of average gross air and fees

99
• Seamless coordination across
Planning, Revenue and Marketing
• Advertising planning model and
investment decisions based on:
‒ Historic demand
‒ Capacity changes
‒ Prior year performance
‒ Responsiveness
• Bottoms-up build of plan to align
with budget and revenue targets
Data-driven, surgical approach to advertising
Note: select sanitized examples for illustrative purposes

1010 Source: Heart+Mind Strategies custom research and segmentation analysis, Aug ’18
10%4%
14%
14%
41%
34%
35%
48%
% of AllegiantCustomers
% of AllegiantRevenue
Avid
Traveler
Budget
Traveler
Traditionalist
Traveler
Road
Tripper
2.0
1.4
1.5
1.0
8.2
4.2
4.6
2.1
Total Leisure Trips per Year(Fly + Drive); Allegiant vs. Non
• Millennials, aspire to travel more on a budget
• Travel to connect with others
• Saving money on airfare is #1…
• …to connect more often
• Affluent, most engaged in travel category
• Travel to seek adventure and fun
• Saving money on airfare is #1…
• …to spend on other parts of their trip
Budget Traveler
Avid Traveler
“It makes travel more accessible…it means
more money for hotels, food, and things to
actually do when you get there.”
“It's important to me to keep my relationship
with my family and friends up to date and
current… you don't have to dwell on it.
You're like, ‘Ah, I can afford it, I'll just go.’”
Allegiant customer segments and insights
Allegiant understands who our customers are and how to engage them

1111

1212
7.7 M
12.3 M
555.5 K
692.9 K
589.2 K
637.8 K
737.5 K
776.6 K
628.7 K
End of4Q17
1Q18 2Q18 3Q18 4Q18 1Q19 2Q19 3Q19 End of3Q19
Customer email universe has grown by 4.6M (+60%) in past 2 years; personalized email
program with content/offers engineered to drive booking performance and engagement
Expanded e-mail marketing program

1313
66%
34%
May 2019 Bookings
Allegiant
First-time
Allegiant
Repeat
29%
36%
23%
22%
17%
15%
15%
11%
4%
3%
5%
5%
7%
8%Airline
Last
Flown
Airline
Usually
Flown
84% of new customers last flew or usually fly
Southwest, Delta, American or United
63%
53%
12%
12%
9%
11%
6%
9%
3%
5%
2%
3%
2%
4%
3%
3%
Allegiant Southwest Delta American United Spirit Frontier Other
Airline
Last
Flown
Airline
Usually
Flown
Airline last flown/usually flown among Allegiant customers
Most Allegiant customers are non-ULCC flyers, having last flown
or usually flown Southwest, Delta, American and United
Allegiant Customer Database Survey, Jun ’19
1414
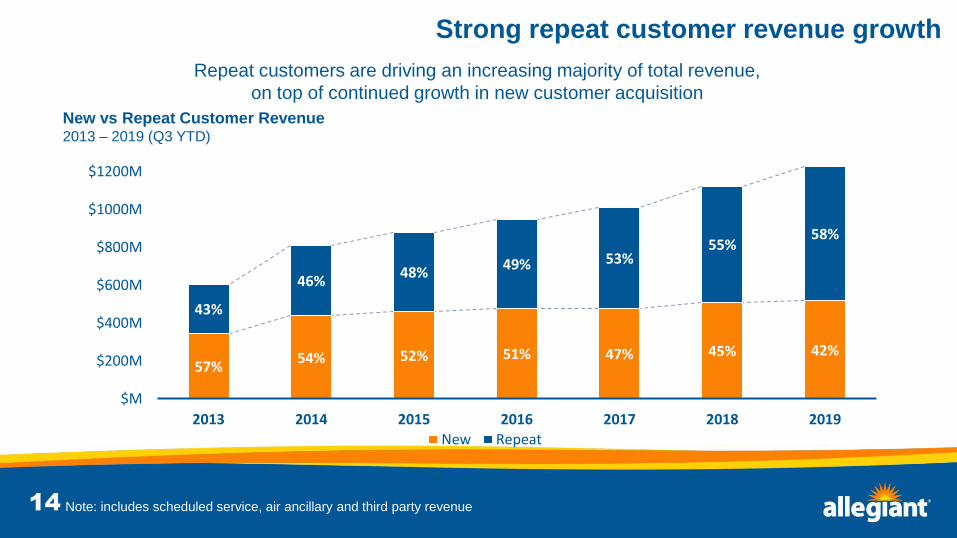
57%54% 52% 51% 47% 45% 42%
43%
46%48%
49% 53%55%
58%
$M
$200M
$400M
$600M
$800M
$1000M
$1200M
2013 2014 2015 2016 2017 2018 2019
New Repeat
Strong repeat customer revenue growth
Repeat customers are driving an increasing majority of total revenue,
on top of continued growth in new customer acquisition
Note: includes scheduled service, air ancillary and third party revenue
New vs Repeat Customer Revenue2013 – 2019 (Q3 YTD)

1515
Allegiant NPS Performance
2016 – 2019
2019 Change 2018 Brand 2019 2018
1 - 1 JetBlue 71.6 72.9
2 3 Alaska Air 70.5 70.6
3 2 Southwest 69.5* 72.4
4 - 4 Hawaiian 64.7 66.7
5 6 Delta 64.4 62.3
6 5 Allegiant 62.1 62.6
Average 61.9 63.1
7 - 7 Air Canada 61.4 62.1
8 - 8 American 58.7 60.8
9 - 9 United 55.3 55.6
10 - 10 Frontier 52.4 53.7
11 - 11 Spirit 50.2 52.6
Improved customer sentiment toward Allegiant
2016 2017 2018 2019
+32
points
1616
.0M
2.0M
4.0M
6.0M
8.0M
10.0M
12.0M
14.0M
16.0M
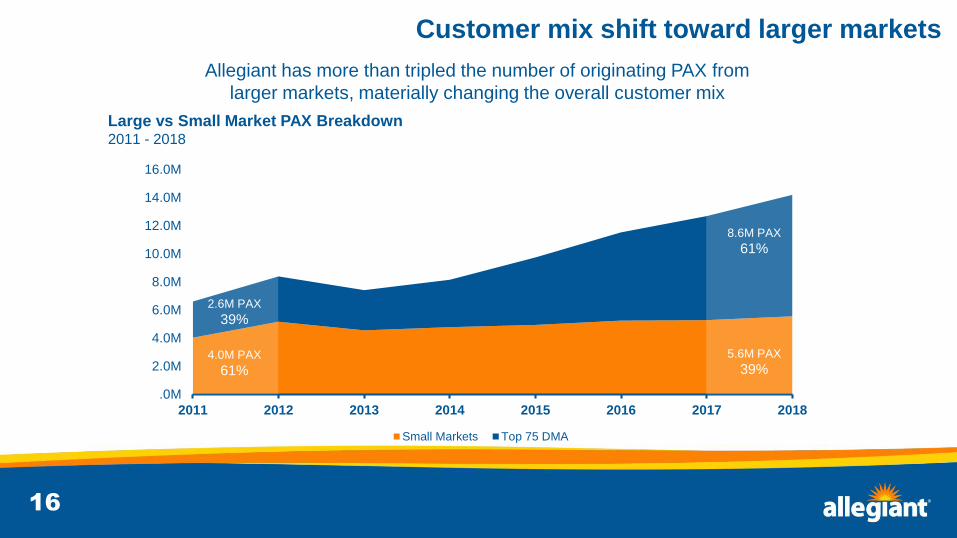
2011 2012 2013 2014 2015 2016 2017 2018
Small Markets Top 75 DMA
2.6M PAX
39%
4.0M PAX
61%
8.6M PAX
61%
5.6M PAX
39%
Customer mix shift toward larger markets
Allegiant has more than tripled the number of originating PAX from
larger markets, materially changing the overall customer mix
Large vs Small Market PAX Breakdown2011 - 2018
1717
Allegiant 2.0

1818
Customer Platform Dynamic Digital UX
Customer Engagement (Programmatic & Technical)
Commerce Engine
Package addressable customer audiences
for internal and external monetization
Presentation layer capable of consuming and
displaying personalized rules/content
Collection of capabilities driving the
presentation of products and pricing
Stored payment, profile, preferences
– along with pay monthly – promote
low-friction, “quick book” solution
Cobrand credit card and/or non-card loyalty
provide incentive for buying broad and deep
at allegiant.com and across all brands
Allegiant 2.0 digital experience and supporting capabilities
1919
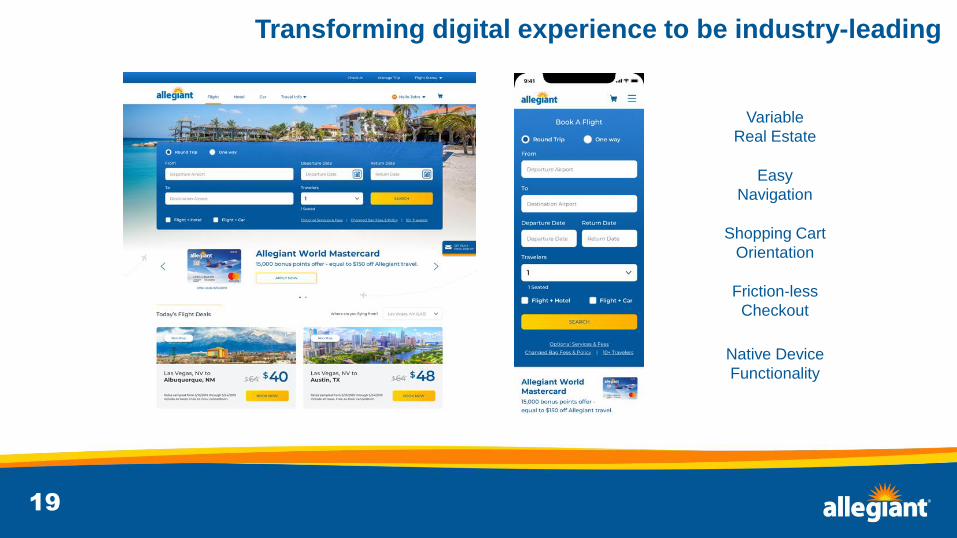
Variable
Real Estate
Easy
Navigation
Shopping Cart
Orientation
Friction-less
Checkout
Native Device
Functionality
Transforming digital experience to be industry-leading

2020
~40% mobile
device users
~60% desk-/
lap-top users
~6% of bookings “multi-channel”
New web and mobile UX goes live in 2020

2121
Loyalty Programs

2222
Additional benefits include: no point expiration, no minimum points redemption,
no blackout dates, no foreign transaction fees, dedicated member services line
Allegiant World Mastercard overview

2323
0
20,000
40,000
60,000
80,000
100,000
120,000
140,000
160,000
180,000
200,000
Existing Active Accounts New Accounts
Allegiant World Mastercard performance
180K+ total active cardholders; 27% YOY new account growth in 2019 YTD
60%+ of total compensation TTM is variable/cardholder spend-based
$.M
$.5M
$1.M
$1.5M
$2.M
$2.5M
$3.M
$3.5M
$4.M
$4.5M
Fixed Variable
63%
37%
Variable/Cardholder Spend-based Flat/Cardholder acquisition-based
Total Active CardholdersSeptember 2016 – August 2019
Cobrand CompensationSeptember 2016 – August 2019
2424
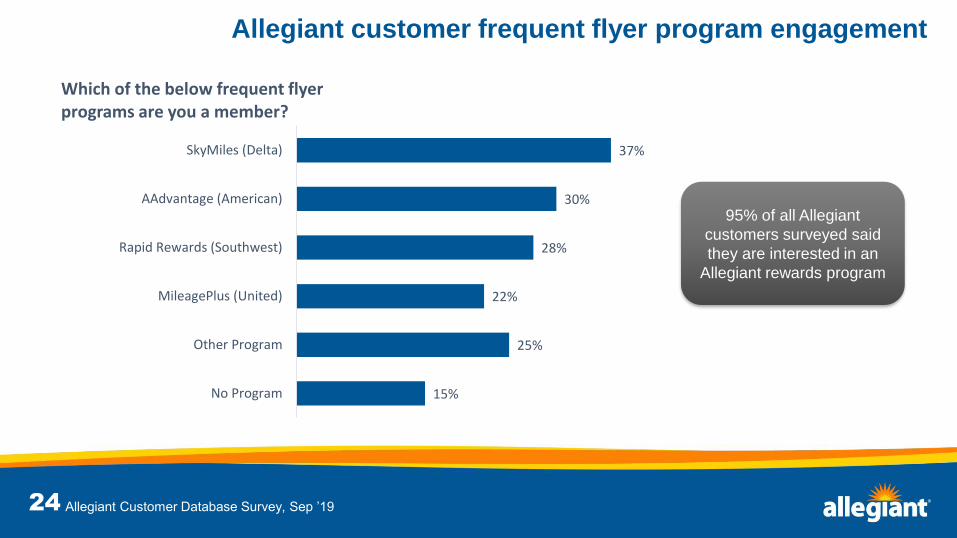
37%
30%
28%
22%
25%
15%
SkyMiles (Delta)
AAdvantage (American)
Rapid Rewards (Southwest)
MileagePlus (United)
Other Program
No Program
Which of the below frequent flyer programs are you a member?
95% of all Allegiant
customers surveyed said
they are interested in an
Allegiant rewards program
Allegiant customer frequent flyer program engagement
Allegiant Customer Database Survey, Sep ’19

2525
5%
17%
43%
1
2
3+
Less
77%
65%
38%
1
2
3+
Attrited
-$106M YOY -$119M YOY
-$160M YOY -$43M YOY
-$560M YOY -$36M YOY
71%
51%
17%
20%
12%
29%
Customers Revenue
18%
18%
19%
1
2
3+
More
Allegiant customer loyalty opportunity
Significant opportunity to boost customer retention, even among those who fly with Allegiant YOY
3+ ITNs
2 ITNs
1 ITN
Note: PY=Oct ’17-Sep ’18; CY=Oct ’18-Sep ’19
PY Customers and Revenue by Number of ITNs CY Change in Behavior/Value

2626
Easy to Redeem
in any amount
Fast, Transparent Earning
on every purchase
Special Offers
all the time
Proven Success
with customers
Allegiant’s rewards program converges retail, tech and travel
Quick
Earn/Burn
Tech
Forward
Personal
Impact

2727

2828

2929

3030
$
2 points per $1 spent
on spend >$500
1 point per $1 spent
at allegiant.com
Points redeemed at
$0.01 per point
%5% off airfare
always
1x
2x
• Points available 24 hours
after a transaction is made
• No blackout dates or point
usage fees
• Use points whenever, for
whatever at allegiant.com
• No minimum point
redemption
• No point expiration when
you buy every 24 months
• Combine points, gift cards
and vouchers seamlessly
• Buyer gets points (and has
ability to share points)
Stimulate
Repeat
Purchase
Maximize
Transaction
Size
Engage
Across
Businesses
Allways Rewards Program overview
3131
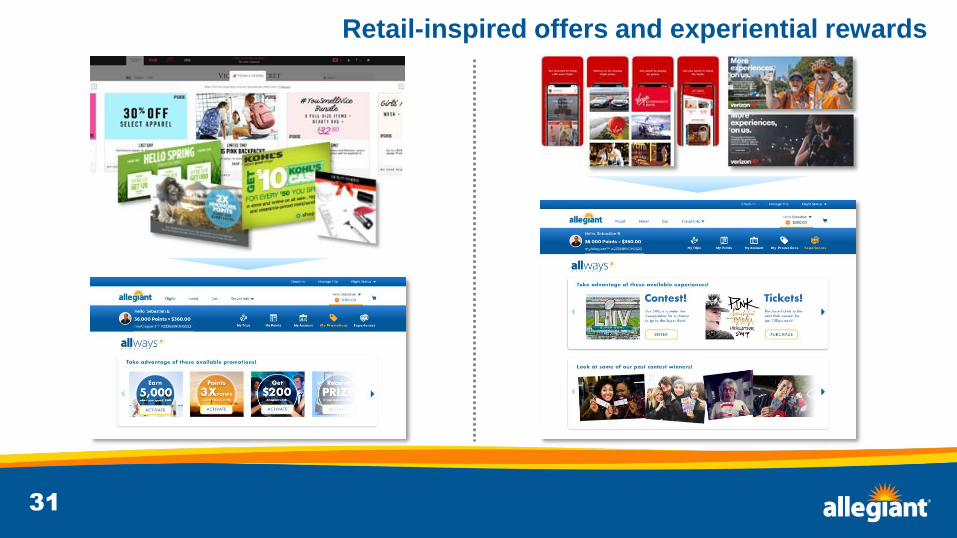
Retail-inspired offers and experiential rewards

3232
Strategic Partnerships

3333
Strategic partnerships, including national film/TV opportunities as well
as Allegiant Nonstop locations and city-specific sports sponsorships
Strategic marketing partnerships

3434
-
5,000
10,000
15,000
20,000
25,000
30,000
35,000
40,000
45,000
Ju
l-18
Ju
l-18
Aug
-18
Aug
-18
Sep
-18
Sep
-18
Oct-
18
Oct-
18
No
v-1
8
No
v-1
8
No
v-1
8
De
c-1
8
De
c-1
8
Ja
n-1
9
Ja
n-1
9
Feb
-19
Feb
-19
Mar-
19
Mar-
19
Apr-
19
Apr-
19
May-1
9
May-1
9
May-1
9
Ju
n-1
9
Ju
n-1
9
Ju
l-19
Ju
l-19
Aug
-19
Aug
-19
Sep
-19
Sep
-19
Oct-
19
New nonstop Only Emails Existing G4 Emails Added to nonstop Database
77% of Nonstop emails are
new Allegiant relationships
Email Database Growth
Allegiant Nonstop Family Entertainment Centers
Current and Potential Markets
$4-5M building purchase + $6-8M buildout → $6-8M annual revenue, >30% EBITDA margin
Allegiant Nonstop presents a relevant, growth opportunity to achieve higher awareness,
greater share of leisure wallet and more new customer relationships in key markets

3535
3636
3737
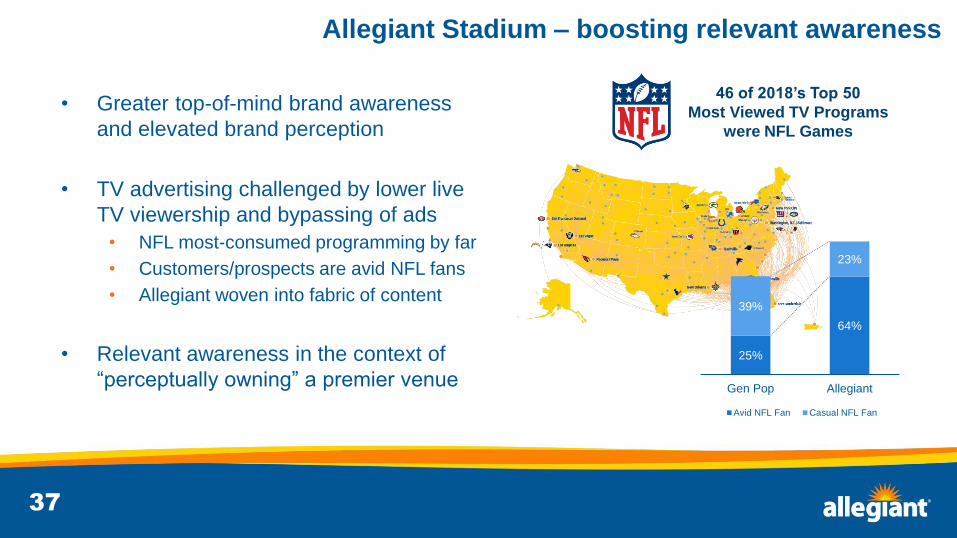
• Greater top-of-mind brand awareness
and elevated brand perception
• TV advertising challenged by lower live
TV viewership and bypassing of ads
• NFL most-consumed programming by far
• Customers/prospects are avid NFL fans
• Allegiant woven into fabric of content
• Relevant awareness in the context of
“perceptually owning” a premier venue
Allegiant Stadium – boosting relevant awareness
46 of 2018’s Top 50
Most Viewed TV Programs
were NFL Games
25%
64%
39%
23%
Gen Pop Allegiant
Avid NFL Fan Casual NFL Fan

3838
• Expected 4B+ impressions annually,
equivalent ~$90M advertising spend
• 2020 Marketing expense, inclusive
of stadium naming rights, flat YOY
• Surgical elimination / reallocation
• Boosted efficacy across all efforts
• Mid-case return hurdle is 2.7M web
visitors (2.5% incremental lift)…
• …which requires average of 0.09%
lift across marketing efforts
Allegiant Stadium – investment thesis

3939
• No team/venue in sports has
ever relied more on fan travel
• Raiders season ticketholders
from Oakland and LA areas
• 75M NFL fans say Las Vegas
#1 city they would travel to
• Additional commercial impact
through sponsorship assets
• Fan Travel Packages
• Season-long Promotions
• “Money Can’t Buy” Experiences
Allegiant Stadium – commercialization
4040

1
Network and RevenueDrew Wells
2
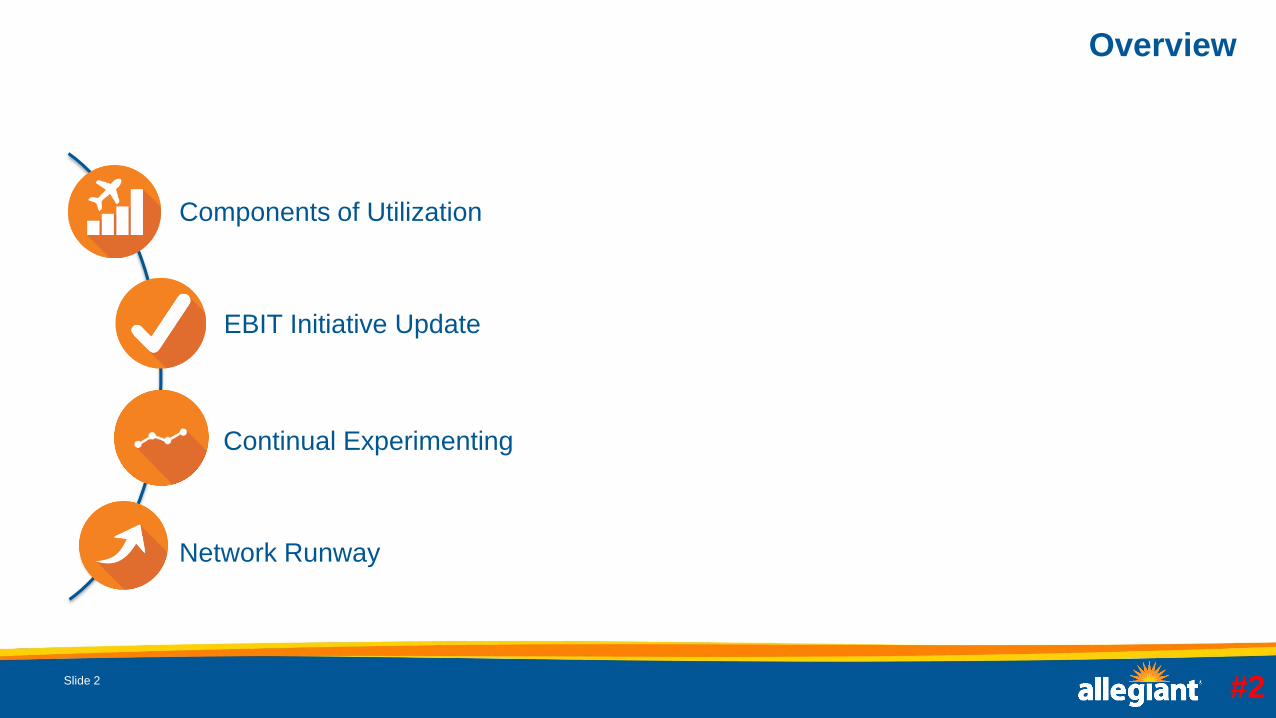
Overview
Slide 2 #2
Components of Utilization
EBIT Initiative Update
Continual Experimenting
Network Runway

3
Components of utilization
Slide 3 #2
• Planning capacity / Scheduling the airline
• Every market, every week
• Comparing uses of aircraft
• Fuel buffer
• Components of Utilization
• Profitability Forecasts
• Saturdays & Geography
• Seasonality
• Spare Count
• Revenue Initiatives
• Network

4
Components of utilization
1Includes zero weekly frequencies
Slide 4
• Components of Utilization
• Profitability Forecasts
• Saturdays & Geography
• Seasonality
• Spare Count
• Revenue Initiatives
• Network
1.3%
30.9%
26.9%
21.4%
10.4%
5.3%
1.9%0.6% 1.1%
0.2%
1 2 3 4 5 6 7 8 9 10
# of Different Market Frequencies
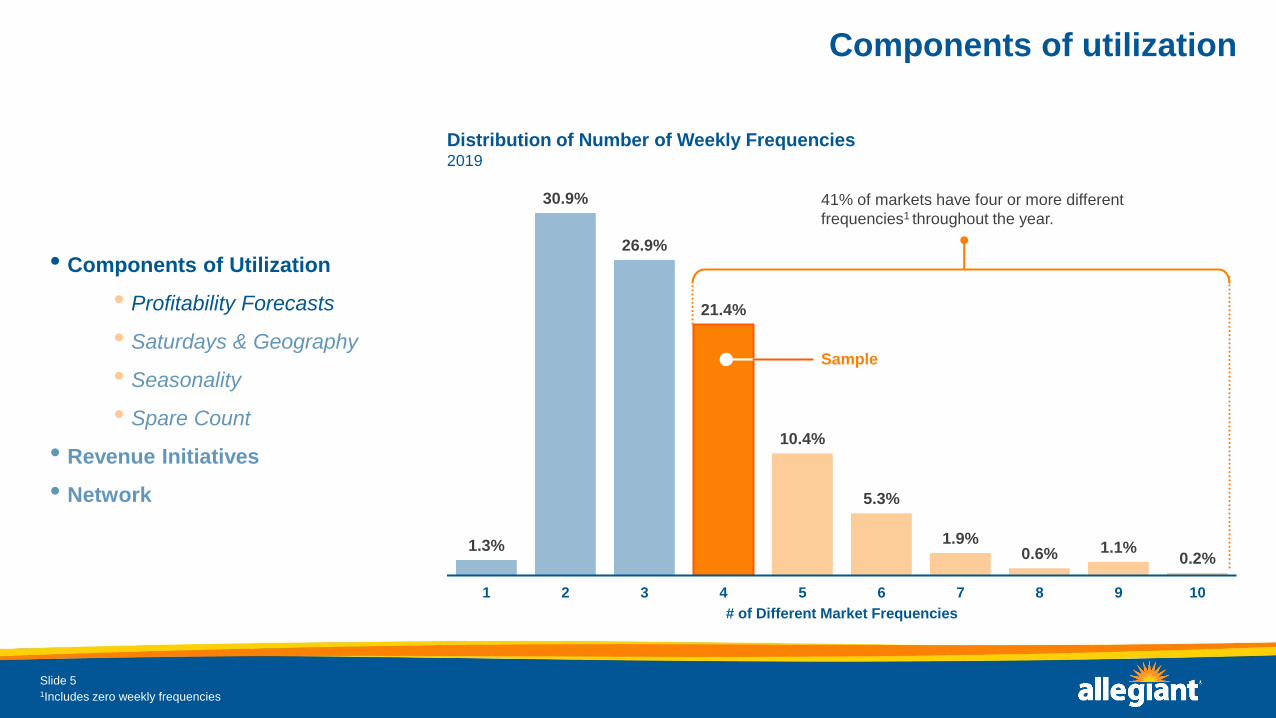
Distribution of Number of Weekly Frequencies2019
41% of markets have four or more different
frequencies1 throughout the year.
5
Components of utilization
1Includes zero weekly frequencies
Slide 5
• Components of Utilization
• Profitability Forecasts
• Saturdays & Geography
• Seasonality
• Spare Count
• Revenue Initiatives
• Network
1.3%
30.9%
26.9%
21.4%
10.4%
5.3%
1.9%0.6% 1.1%
0.2%
1 2 3 4 5 6 7 8 9 10
# of Different Market Frequencies
Distribution of Number of Weekly Frequencies2019
41% of markets have four or more different
frequencies1 throughout the year.
Sample

6
Components of utilization
Slide 6
• Components of Utilization
• Profitability Forecasts
• Saturdays & Geography
• Seasonality
• Spare Count
• Revenue Initiatives
• Network
Sample Market2019
Full Year Est. GP Difference from Baseline
Baseline $2,000,000
2x only $1,800,000 ($200,000)
5x only $1,650,000 ($350,000)
•Dynamic capacity drives incremental gross profitability by best matching
supply with demand
•Difference is in the hundreds of thousands of dollars annually on a
market level and 98.7% of markets had multiple frequencies in 2019
7
Components of utilization
Slide 7
• Components of Utilization
• Profitability Forecasts
• Saturdays & Geography
• Seasonality
• Spare Count
• Revenue Initiatives
• Network
•Comparing Uses of Aircraft
•Scheduled Service vs. Fixed Fee vs. Spare
•Valuing each line of flying
•LAS-IWA Ferry Results
•$1.05 million in GP from mid-February
through end of March (mostly March)
•LAS-LAX Ferry Results
•Positive gross margin but not as accretive
as LAS-IWA
8
Components of utilization
Slide 8
• Planning capacity / Scheduling the airline
• Every market, every week
• Comparing uses of aircraft
• Fuel buffer
• Immense economic benefit of Airbus vs. MD80
• Components of Utilization
• Profitability Forecasts
• Saturdays & Geography
• Seasonality
• Spare Count
• Revenue Initiatives
• Network

9
Components of utilization
Slide 9
• Components of Utilization
• Profitability Forecasts
• Saturdays & Geography
• Seasonality
• Spare Count
• Revenue Initiatives
• Network
$0.00
$0.50
$1.00
$1.50
$2.00
$2.50
$3.00
$0.00 $1.00 $2.00 $3.00 $4.00 $5.00
MD
80 C
PG
A319 & A320 Fuel CPG
Airbus margin
profile better at
all fuel CPG
A319
A320
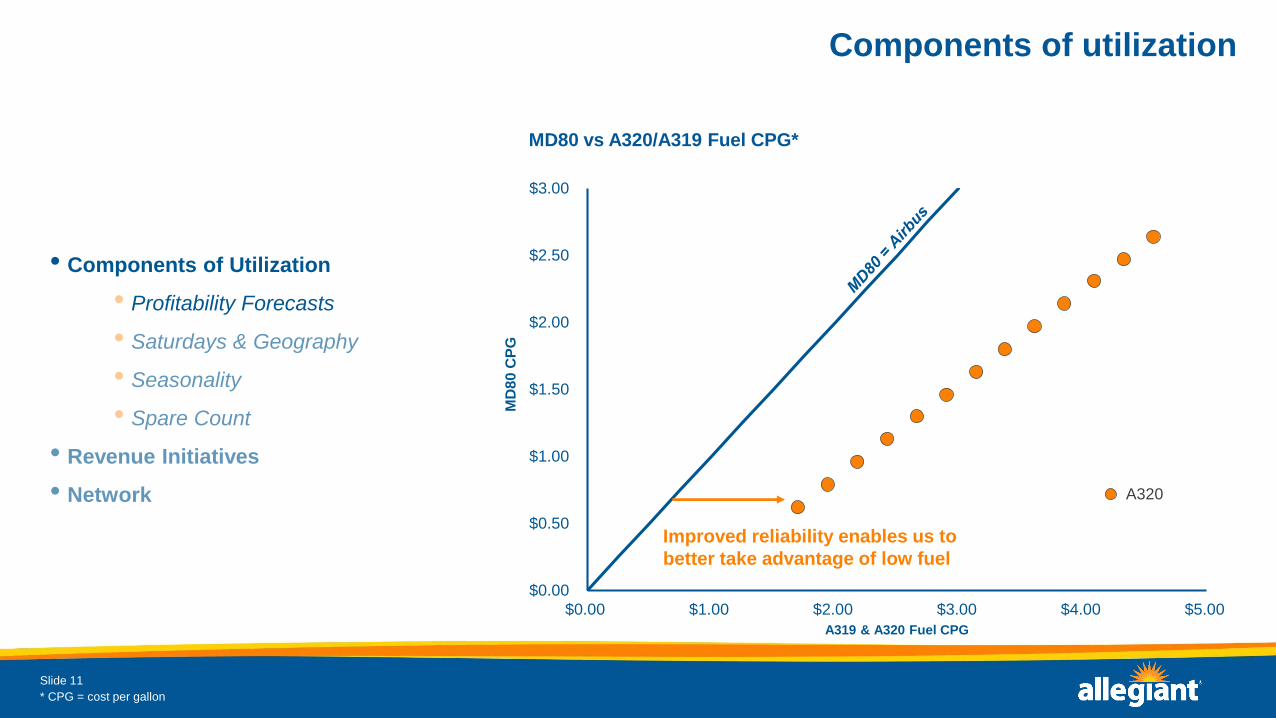
MD80 vs A320/A319 Fuel CPG*
* CPG = cost per gallon

10
Components of utilization
Slide 10
• Components of Utilization
• Profitability Forecasts
• Saturdays & Geography
• Seasonality
• Spare Count
• Revenue Initiatives
• Network
$0.00
$0.50
$1.00
$1.50
$2.00
$2.50
$3.00
$0.00 $1.00 $2.00 $3.00 $4.00 $5.00
MD
80 C
PG
A319 & A320 Fuel CPG
Better positioned to
respond to high fuel
A320
MD80 vs A320/A319 Fuel CPG*
* CPG = cost per gallon
11
Components of utilization
Slide 11
• Components of Utilization
• Profitability Forecasts
• Saturdays & Geography
• Seasonality
• Spare Count
• Revenue Initiatives
• Network
$0.00
$0.50
$1.00
$1.50
$2.00
$2.50
$3.00
$0.00 $1.00 $2.00 $3.00 $4.00 $5.00
MD
80 C
PG
A319 & A320 Fuel CPG
Improved reliability enables us to
better take advantage of low fuel
A320
MD80 vs A320/A319 Fuel CPG*
* CPG = cost per gallon
12
Components of utilization
Slide 12
• Components of Utilization
• Profitability Forecasts
• Saturdays & Geography
• Seasonality
• Spare Count
• Revenue Initiatives
• Network
•All days of week are not created equal
•Sundays = Good
•Tuesdays = Bad
•Saturdays = Good and Bad
•Fluid within network

13
Components of utilization
Slide 13
• Components of Utilization
• Profitability Forecasts
• Saturdays & Geography
• Seasonality
• Spare Count
• Revenue Initiatives
• Network
Saturday Relevance2012-2019
0%
20%
40%
60%
80%
100%
120%
0%
2%
4%
6%
8%
10%
12%
14%
16%
Ve
ga
s a
s %
of
sys
tem
AS
Ms
Sa
turd
ay a
s %
of
Sc
he
d S
erv
ice A
SM
s
Vegas Everything But Vegas
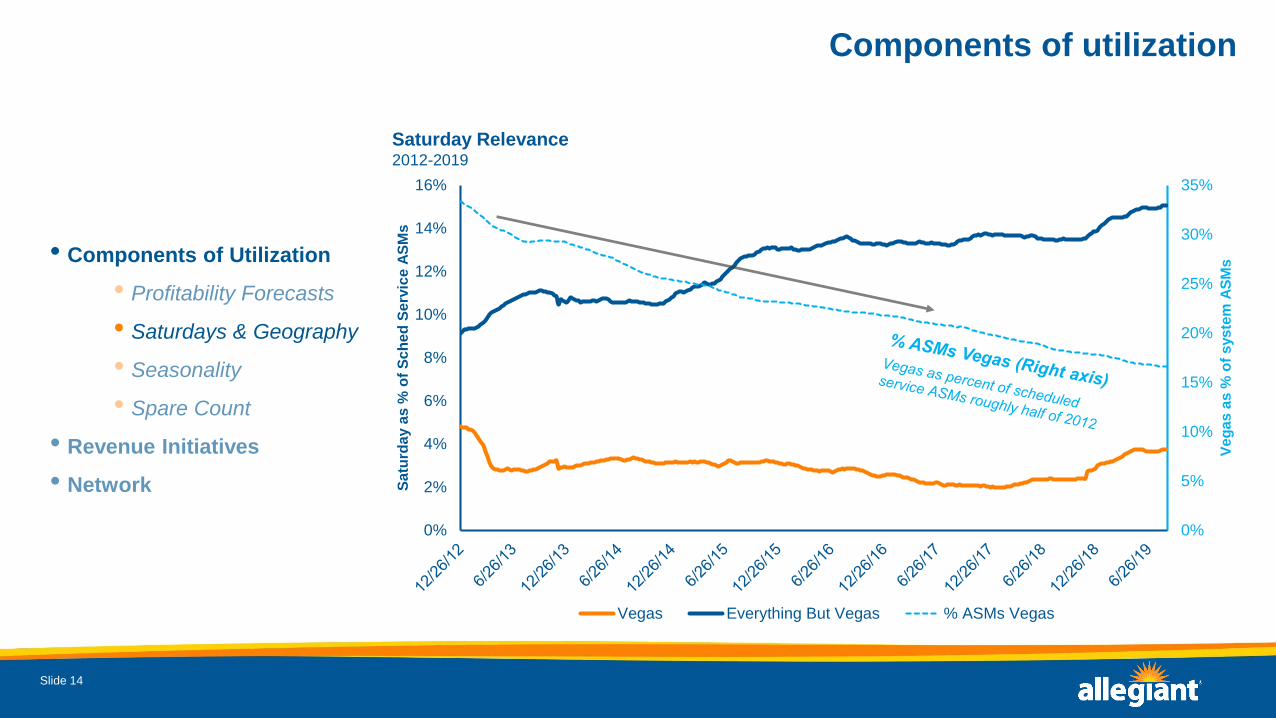
Non-Vegas steadily growing to >15%
Vegas largely capped even with Airbus
14
Components of utilization
Slide 14
• Components of Utilization
• Profitability Forecasts
• Saturdays & Geography
• Seasonality
• Spare Count
• Revenue Initiatives
• Network
Saturday Relevance2012-2019
0%
5%
10%
15%
20%
25%
30%
35%
0%
2%
4%
6%
8%
10%
12%
14%
16%
Ve
ga
s a
s %
of
sys
tem
AS
Ms
Sa
turd
ay a
s %
of
Sc
he
d S
erv
ice A
SM
s
Vegas Everything But Vegas % ASMs Vegas
15
Components of utilization
Slide 15
• Components of Utilization
• Profitability Forecasts
• Saturdays & Geography
• Seasonality
• Spare Count
• Revenue Initiatives
• Network
•All seasons are not created equal
•The ability to flex utilization up and down is core to the
business model
16
Components of utilization
Slide 16
• Components of Utilization
• Profitability Forecasts
• Saturdays & Geography
• Seasonality
• Spare Count
• Revenue Initiatives
• Network
4.5
5.5
6.5
7.5
8.5
9.5
10.5
Jan Feb Mar Apr May Jun Jul Aug Sep Oct Nov Dec
Sys
tem
blo
ck h
ou
rs/A
C/d
ay
2016 2017 2018 2019E
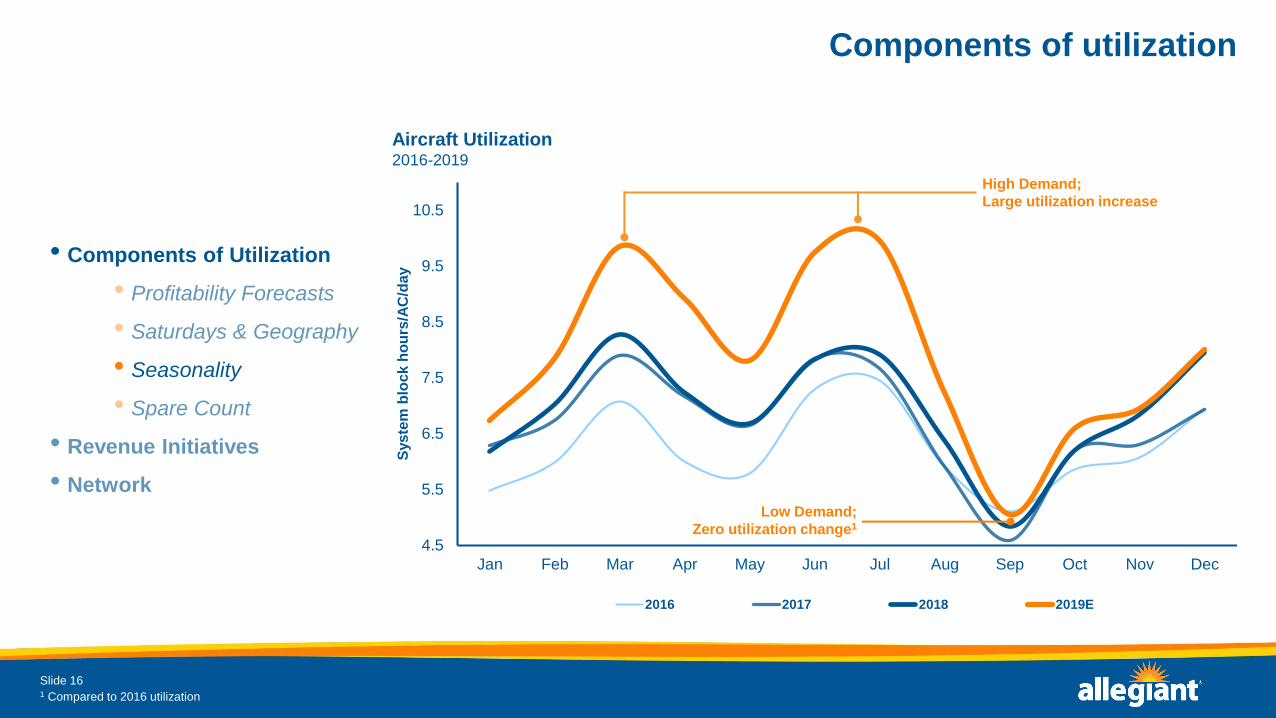
High Demand;
Large utilization increase
Low Demand;
Zero utilization change1
Aircraft Utilization 2016-2019
1 Compared to 2016 utilization
17
Components of utilization
Slide 17
• Components of Utilization
• Profitability Forecasts
• Saturdays & Geography
• Seasonality
• Spare Count
• Revenue Initiatives
• Network
4.5
5.5
6.5
7.5
8.5
9.5
10.5
Jan Feb Mar Apr May Jun Jul Aug Sep Oct Nov Dec
Sys
tem
blo
ck h
ou
rs/A
C/d
ay
2018 2019E 2020E
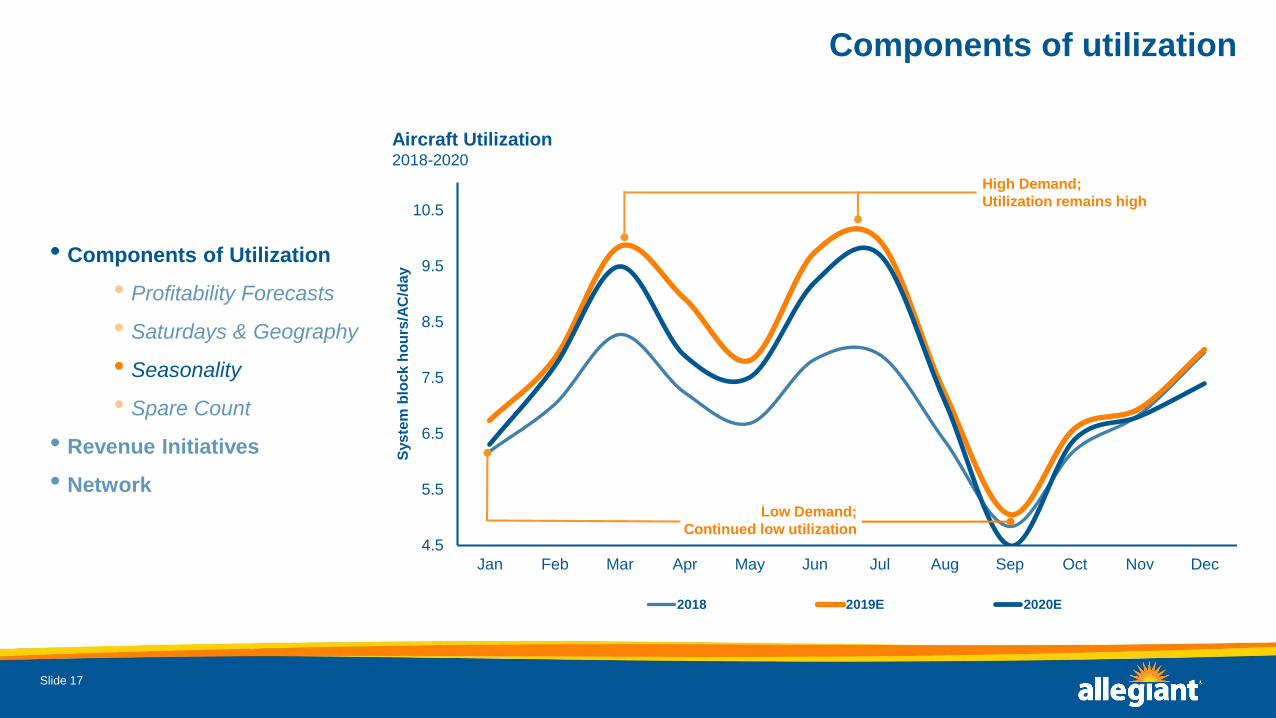
High Demand;
Utilization remains high
Low Demand;
Continued low utilization
Aircraft Utilization 2018-2020

18
4.5
5.5
6.5
7.5
8.5
9.5
10.5
Jan Feb Mar Apr May Jun Jul Aug Sep Oct Nov Dec
Sys
tem
blo
ck h
ou
rs/A
C/d
ay
2018 2019 w 2018 sparing 2019E
Over 50% of utilization increases
Mar – Jul 2019 are driven by
reduced spare counts
Components of utilization
Slide 18
• Components of Utilization
• Profitability Forecasts
• Saturdays & Geography
• Seasonality
• Spare Count
• Revenue Initiatives
• Network
Aircraft Utilization2018-2019
1 Demonstrates the aircraft utilization if 2019 spare count was at 2018 levels
1
19
Fleet productivity
Slide 19
• Components of Utilization
• Profitability Forecasts
• Saturdays & Geography
• Seasonality
• Spare Count
• Revenue Initiatives
• Network
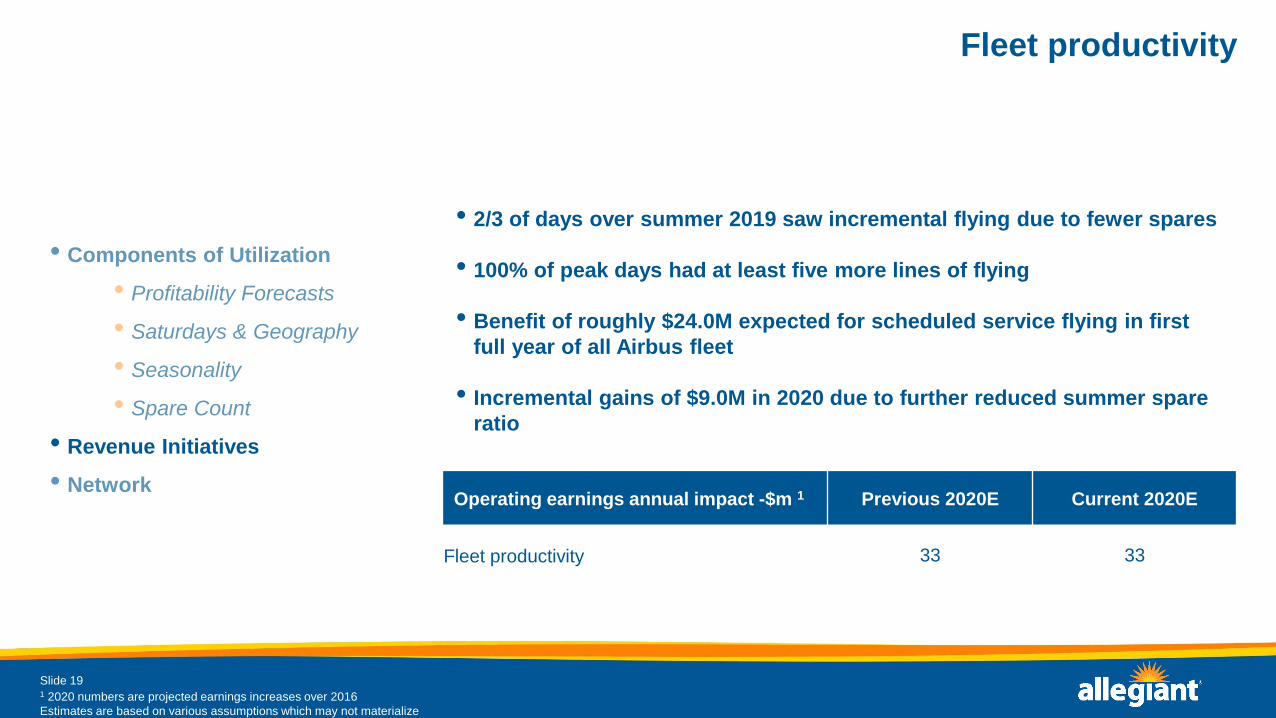
• 2/3 of days over summer 2019 saw incremental flying due to fewer spares
• 100% of peak days had at least five more lines of flying
• Benefit of roughly $24.0M expected for scheduled service flying in first
full year of all Airbus fleet
• Incremental gains of $9.0M in 2020 due to further reduced summer spare
ratio
Operating earnings annual impact -$m 1 Previous 2020E Current 2020E
Fleet productivity 33 33
1 2020 numbers are projected earnings increases over 2016
Estimates are based on various assumptions which may not materialize
20
Fixed fee revenue
Slide 20
• Components of Utilization
• Profitability Forecasts
• Saturdays & Geography
• Seasonality
• Spare Count
• Revenue Initiatives
• Network
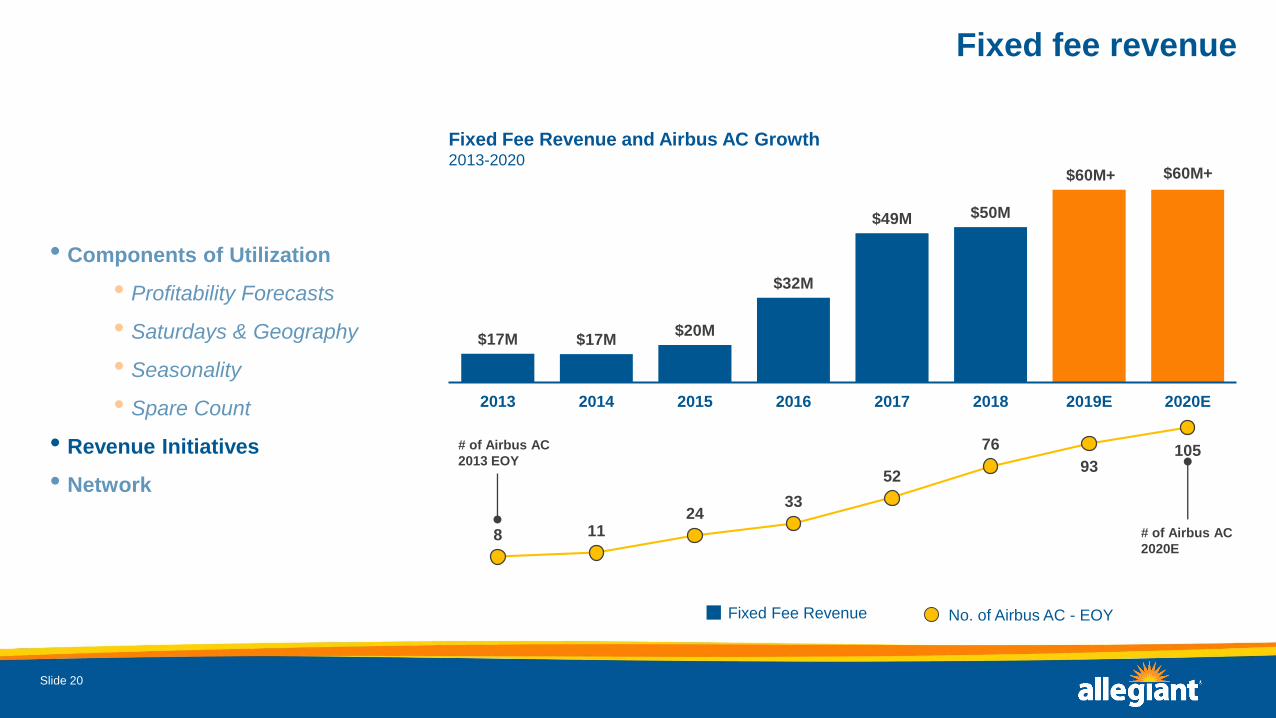
$17M $17M$20M
$32M
$49M $50M
2013 2014 2015 2016 2017 2018 2019E 2020E
$60M+ $60M+
Fixed Fee Revenue and Airbus AC Growth2013-2020
8 1124
33
52
76
93105# of Airbus AC
2013 EOY
# of Airbus AC
2020E
No. of Airbus AC - EOYFixed Fee Revenue
21
Pricing engine
Slide 21
• Components of Utilization
• Profitability Forecasts
• Saturdays & Geography
• Seasonality
• Spare Count
• Revenue Initiatives
• Network
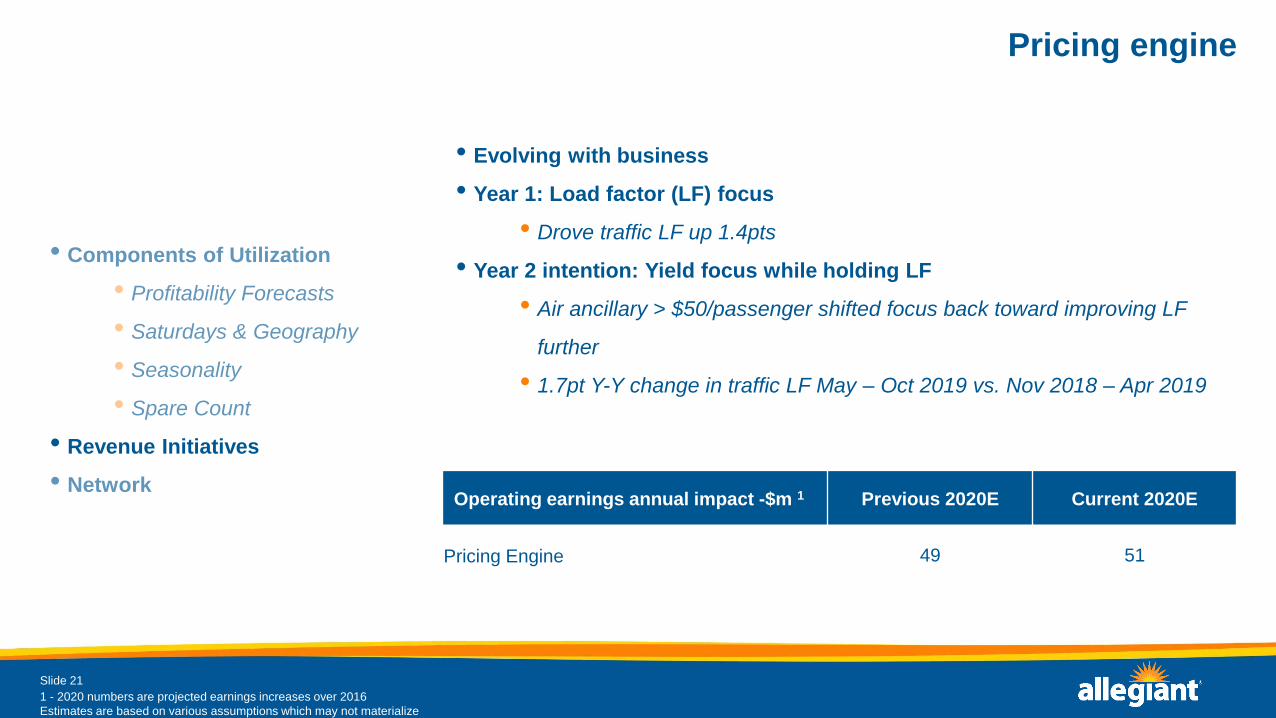
• Evolving with business
• Year 1: Load factor (LF) focus
• Drove traffic LF up 1.4pts
• Year 2 intention: Yield focus while holding LF
• Air ancillary > $50/passenger shifted focus back toward improving LF
further
• 1.7pt Y-Y change in traffic LF May – Oct 2019 vs. Nov 2018 – Apr 2019
Operating earnings annual impact -$m 1 Previous 2020E Current 2020E
Pricing Engine 49 51
1 - 2020 numbers are projected earnings increases over 2016
Estimates are based on various assumptions which may not materialize

22
Pricing engine
Slide 22
• Components of Utilization
• Profitability Forecasts
• Saturdays & Geography
• Seasonality
• Spare Count
• Revenue Initiatives
• Network
• Revenue gains negatively correlated to strength of flights
• Largest gains coming from lowest demand weeks
• Fairly even cadence of gains in years one and two
0 pt
2 pt
4 pt
6 pt
8 pt
10 pt
12 pt
14 pt
First Second Third Fourth
Year 2 vs. Year 0
Same Store TRASM by Quartile1
1 - Quartiles defined by week level flight strength. First = strongest 13 weeks; fourth = weakest 13 weeks. Results indexed to first quartile results. All non-Hawaii
markets started in or before 2015 Year 0 = 11/2/16 – 10/31/17; Year 1 = 11/1/17 – 10/30/18; Year 2 = 10/31/18 – 10/29/19

23
Round trip discount
Slide 23
• Components of Utilization
• Profitability Forecasts
• Saturdays & Geography
• Seasonality
• Spare Count
• Revenue Initiatives
• Network
• One way travel is disruptive to
twice a week markets
• For example, a high
Sunday one way flight
results in four fewer
passengers being booked
on the Thursday flight
Rolling 12M One Way %2013-2019
0 pt
1 pt
2 pt
3 pt
4 pt
5 pt
6 pt
7 pt
8 pt
Ch
an
ge
vs
. F
Y 2
01
3
1 - 2020 numbers are projected earnings increases over 2016
Estimates are based on various assumptions which may not materialize

24
Bundled ancillaries
Slide 24
• Components of Utilization
• Profitability Forecasts
• Saturdays & Geography
• Seasonality
• Spare Count
• Revenue Initiatives
• Network
• Rolled out system wide Oct 14,
2019
• Allegiant bonus testing
various combinations
• Very basic initial state with
many criteria to be included
over time
• Forecasting impact at $1.00 -
$1.25/PAX
1 - 2020 numbers are projected earnings increases over 2016
Estimates and forecasts are based on various assumptions which may not materialize
25
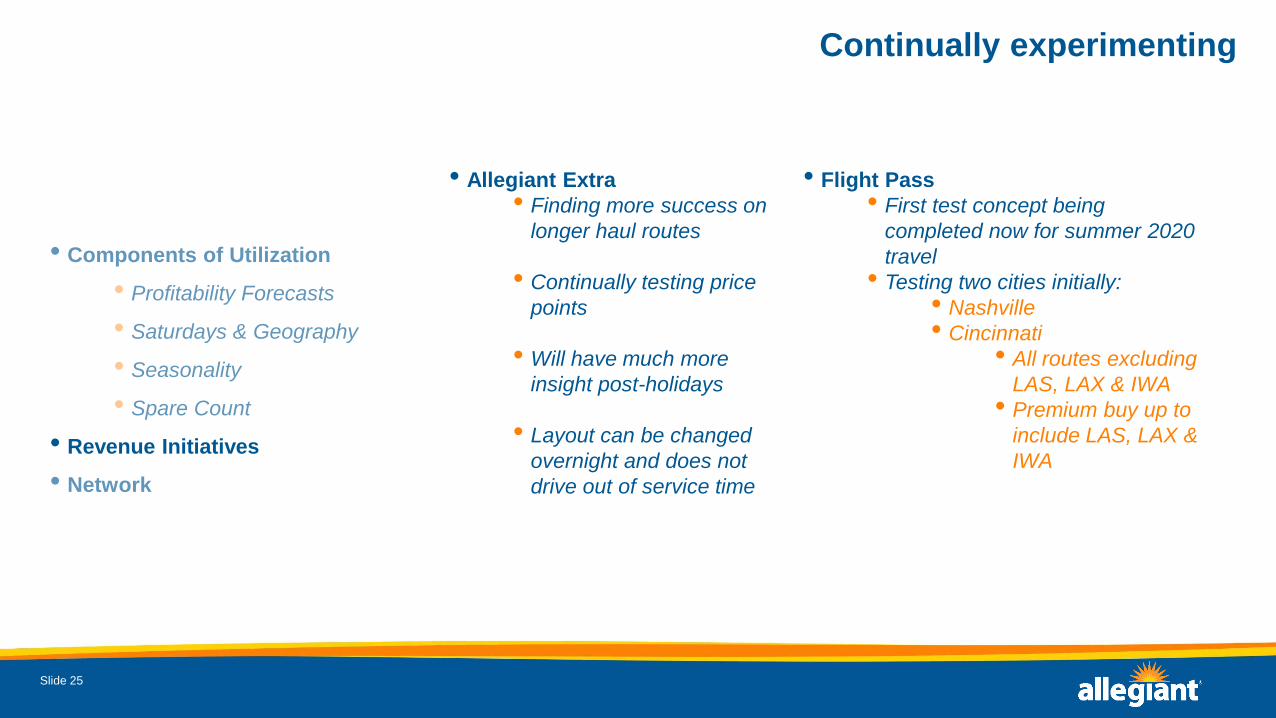
Continually experimenting
Slide 25
• Components of Utilization
• Profitability Forecasts
• Saturdays & Geography
• Seasonality
• Spare Count
• Revenue Initiatives
• Network
• Allegiant Extra
• Finding more success on
longer haul routes
• Continually testing price
points
• Will have much more
insight post-holidays
• Layout can be changed
overnight and does not
drive out of service time
• Flight Pass
• First test concept being
completed now for summer 2020
travel
• Testing two cities initially:
• Nashville
• Cincinnati
• All routes excluding
LAS, LAX & IWA
• Premium buy up to
include LAS, LAX &
IWA
26
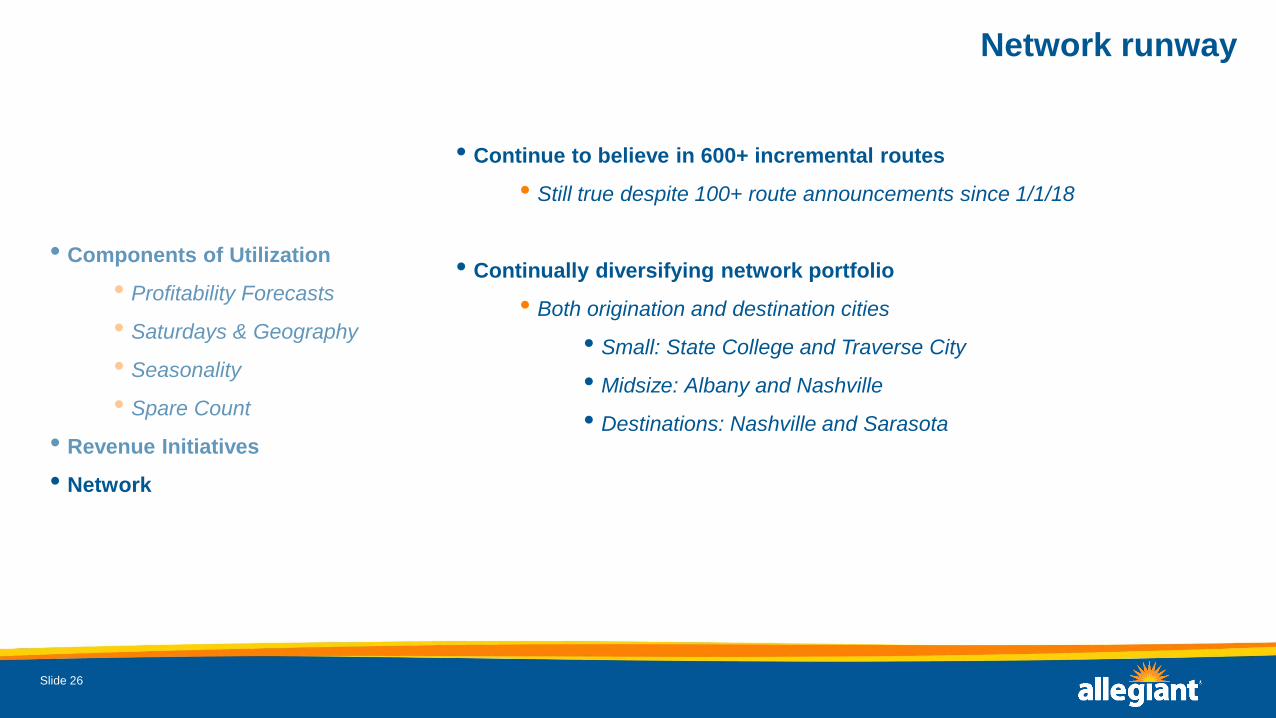
• Continue to believe in 600+ incremental routes
• Still true despite 100+ route announcements since 1/1/18
• Continually diversifying network portfolio
• Both origination and destination cities
• Small: State College and Traverse City
• Midsize: Albany and Nashville
• Destinations: Nashville and Sarasota
Network runway
Slide 26
• Components of Utilization
• Profitability Forecasts
• Saturdays & Geography
• Seasonality
• Spare Count
• Revenue Initiatives
• Network
27
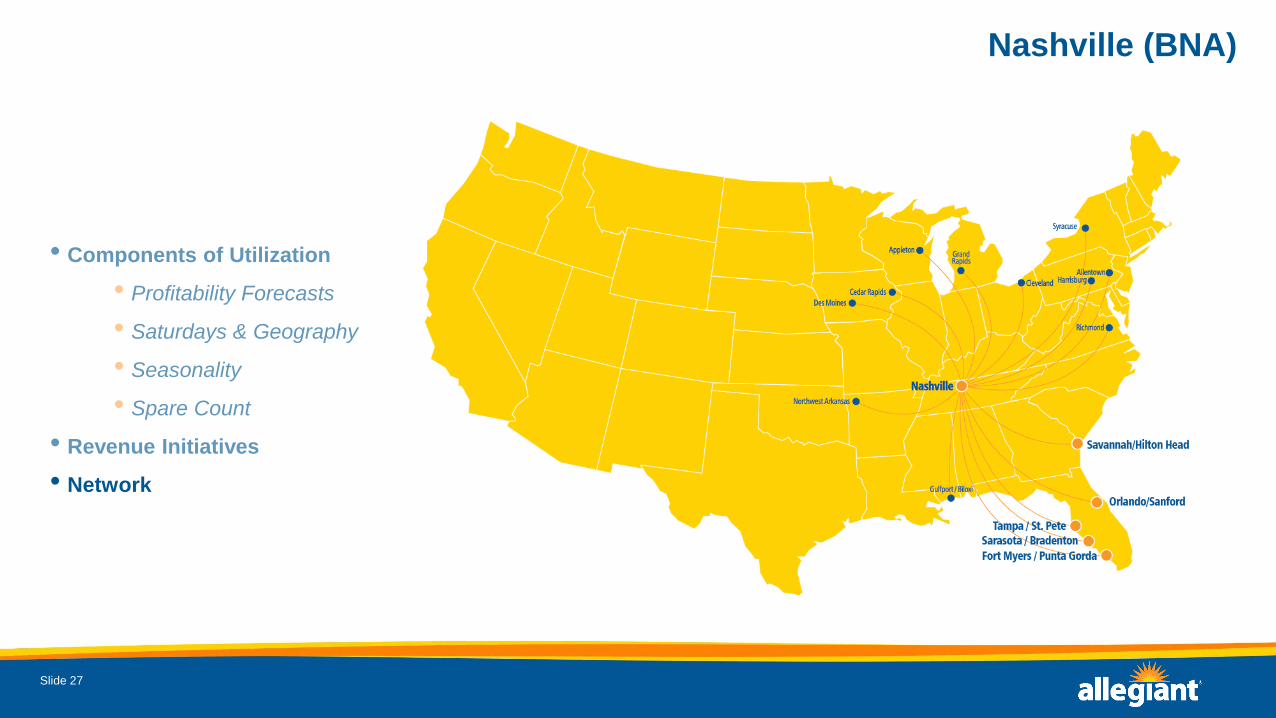
Nashville (BNA)
Slide 27
• Components of Utilization
• Profitability Forecasts
• Saturdays & Geography
• Seasonality
• Spare Count
• Revenue Initiatives
• Network

28
• De-peaking largest destination bases
• Better utilization of existing infrastructure
• Increased fixed fee potential
• Unique network opportunities
• Including thinner demand destinations
Mid-continent base strategy
Slide 28
• Components of Utilization
• Profitability Forecasts
• Saturdays & Geography
• Seasonality
• Spare Count
• Revenue Initiatives
• Network
0%
5%
10%
15%
20%
25%
Dec-13 Dec-14 Dec-15 Dec-16 Dec-17 Dec-18 Dec-19
Mid-Con Bases as % of Sched Service Departures2013-2020

29
• 2013 – 2015: > 90% of routes touched one of Allegiant’s core traditional
destinations*
• Beginning 2016 the growth to non-traditional Allegiant destinations like
Destin (VPS), Savannah (SAV) & Nashville (BNA) ramped up significantly
Diversifying destination portfolio
Slide 29
• Components of Utilization
• Profitability Forecasts
• Saturdays & Geography
• Seasonality
• Spare Count
• Revenue Initiatives
• Network
*Core traditional Allegiant destinations: FLL, IWA, LAS, LAX, MYR, OAK, PGD, PIE and SFB
0%
5%
10%
15%
20%
25%
30%
Jan-13 Jan-14 Jan-15 Jan-16 Jan-17 Jan-18 Jan-19
Non-Traditional Markets as % of Total2013-2019
30
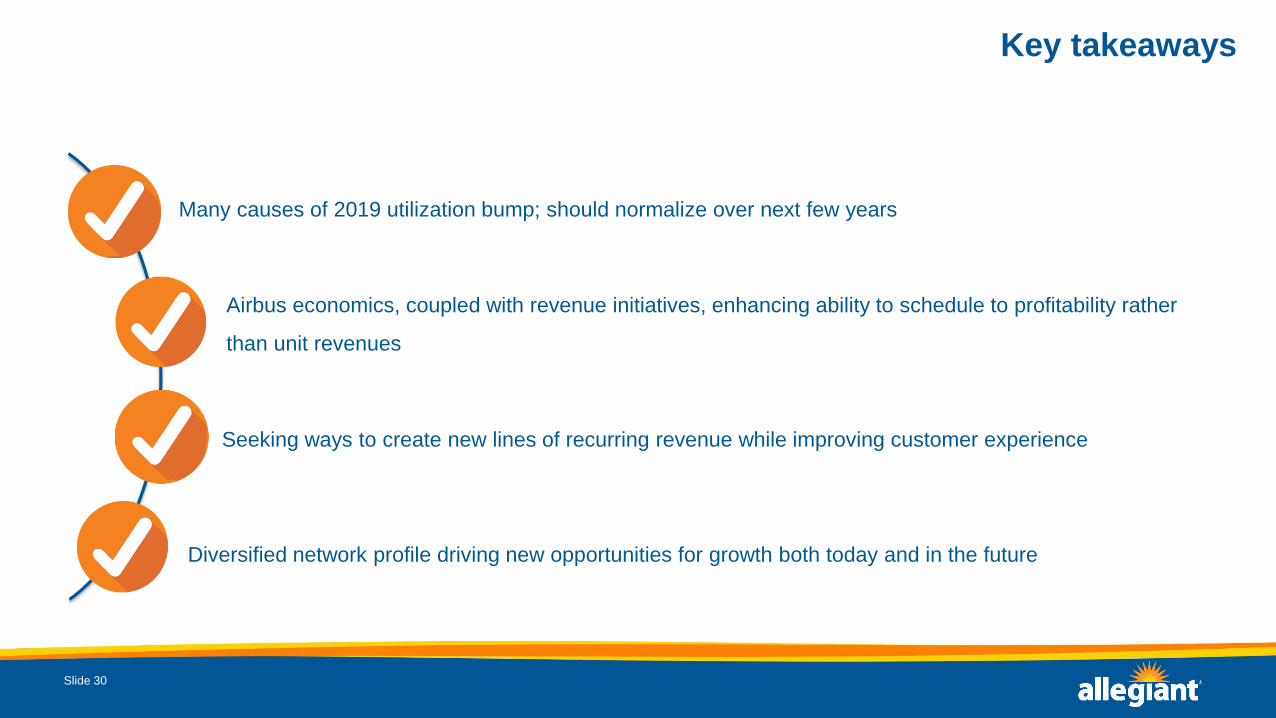
Key takeaways
Slide 30
Many causes of 2019 utilization bump; should normalize over next few years
Airbus economics, coupled with revenue initiatives, enhancing ability to schedule to profitability rather
than unit revenues
Seeking ways to create new lines of recurring revenue while improving customer experience
Diversified network profile driving new opportunities for growth both today and in the future
1
2020 Investor DayJohn Redmond– President

2
Opening and Operating
-Re Revenue Discussion
Selling the Resort
Construction Overview
Sunseeker overview
$
3
$48
$335
$460 $470
2018 2019E 2020E 2021E
$48
$120
$295 $295
$155$175
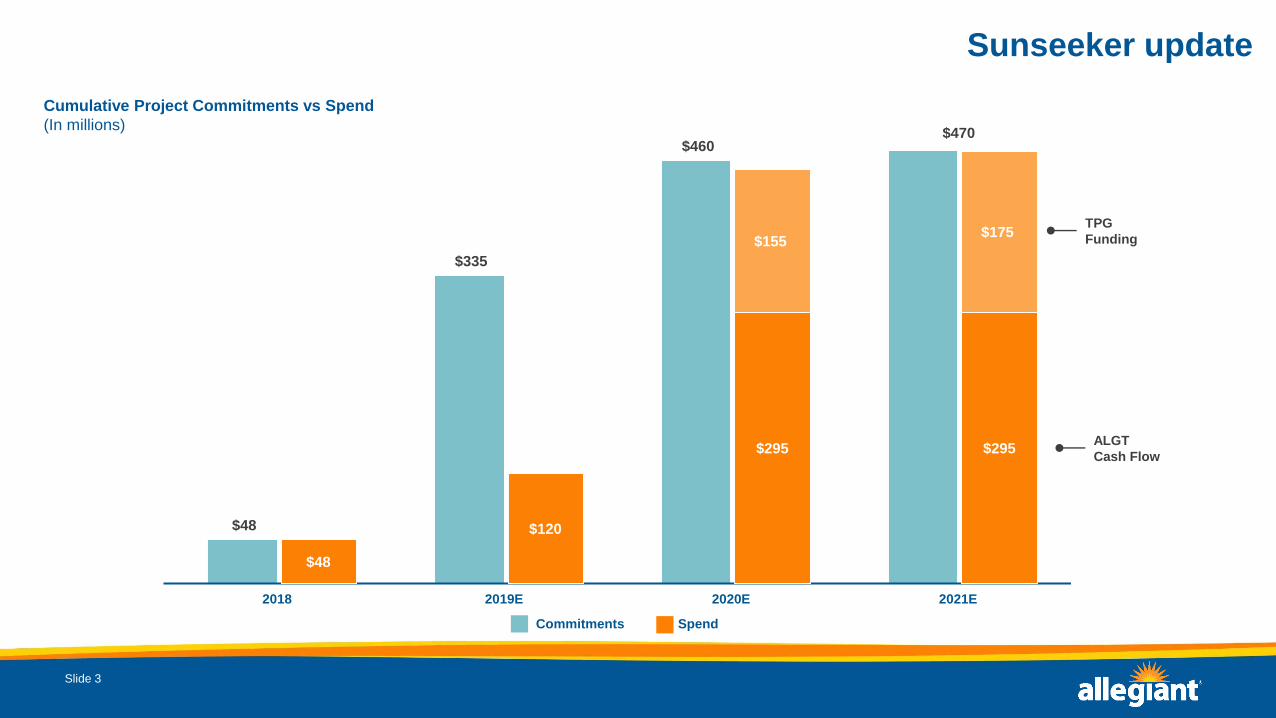
Sunseeker update
Slide 3
Cumulative Project Commitments vs Spend
(In millions)
Commitments Spend
TPG
Funding
ALGT
Cash Flow

5
Selling the Resort
6
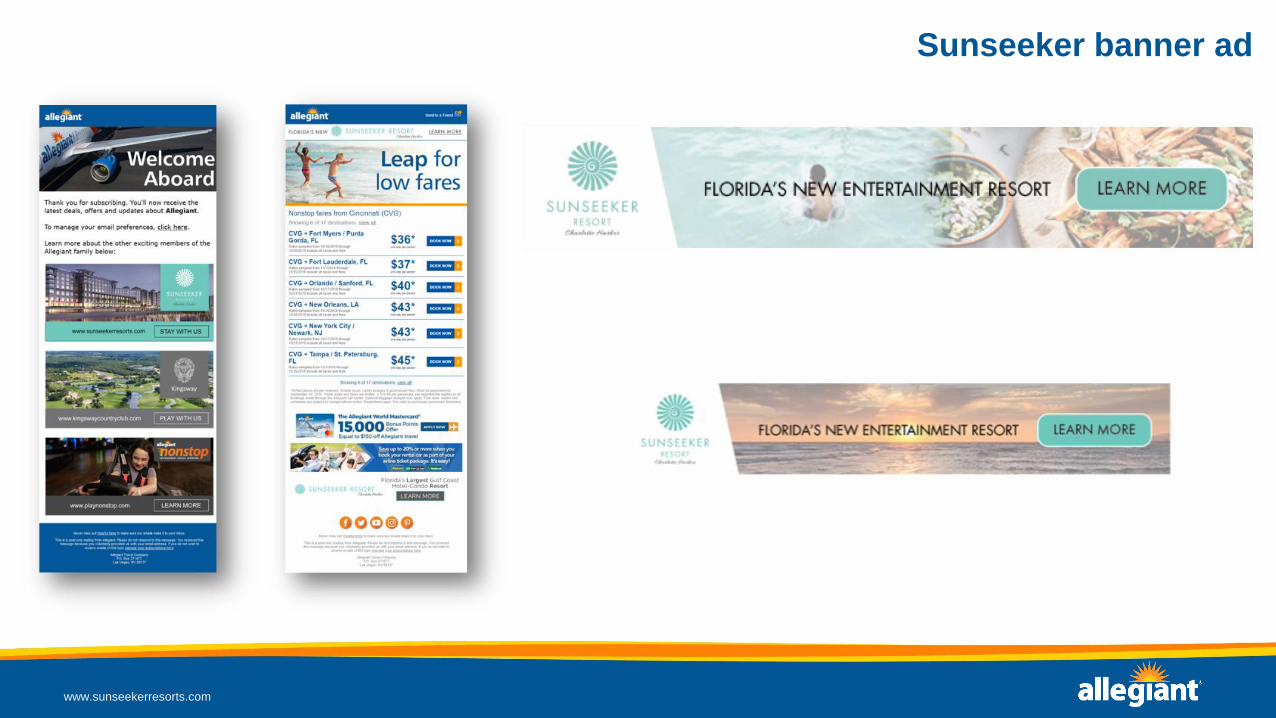
Sunseeker banner ad
www.sunseekerresorts.com

7
Guests’ interest inquiries questionnaire
www.sunseekerresorts.com
8
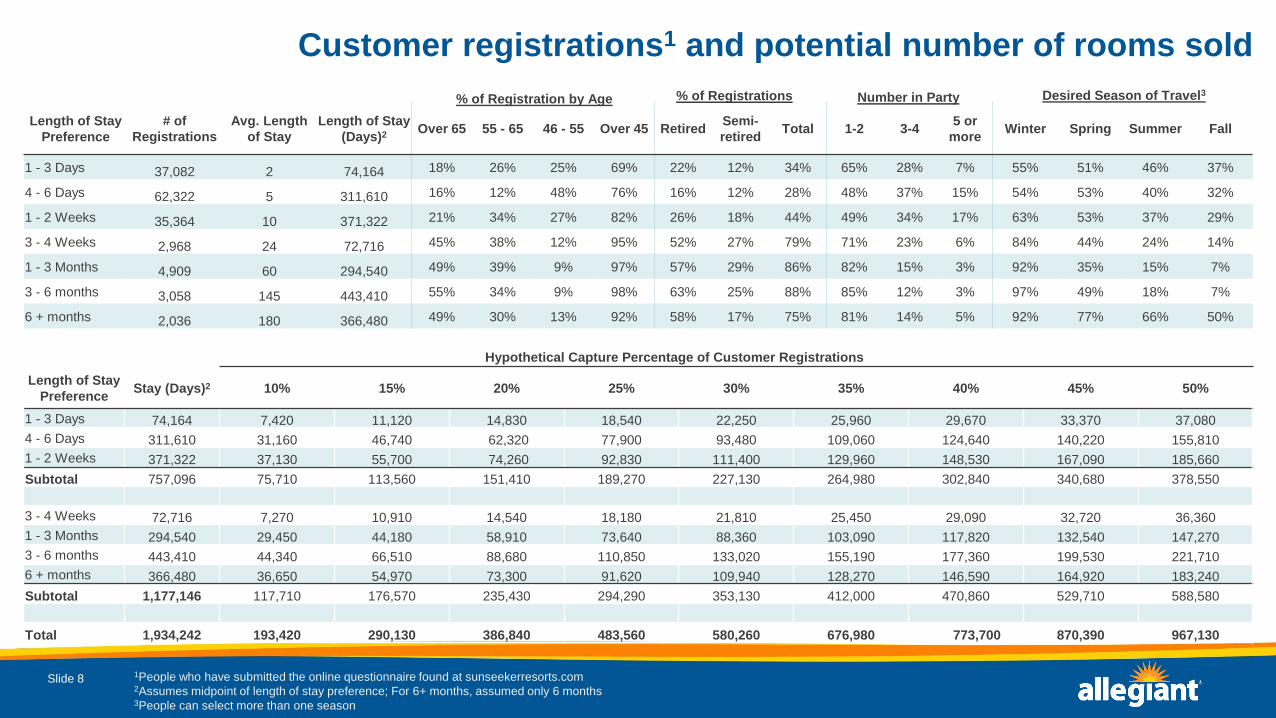
Customer registrations1 and potential number of rooms sold
1People who have submitted the online questionnaire found at sunseekerresorts.com 2Assumes midpoint of length of stay preference; For 6+ months, assumed only 6 months 3People can select more than one season
Slide 8
Length of Stay
Preference
# of
Registrations
Avg. Length
of Stay
Length of Stay
(Days)2Over 65 55 - 65 46 - 55 Over 45 Retired
Semi-
retiredTotal 1-2 3-4
5 or
moreWinter Spring Summer Fall
1 - 3 Days 37,082 2 74,164 18% 26% 25% 69% 22% 12% 34% 65% 28% 7% 55% 51% 46% 37%
4 - 6 Days 62,322 5 311,610 16% 12% 48% 76% 16% 12% 28% 48% 37% 15% 54% 53% 40% 32%
1 - 2 Weeks 35,364 10 371,322 21% 34% 27% 82% 26% 18% 44% 49% 34% 17% 63% 53% 37% 29%
3 - 4 Weeks 2,968 24 72,716 45% 38% 12% 95% 52% 27% 79% 71% 23% 6% 84% 44% 24% 14%
1 - 3 Months 4,909 60 294,540 49% 39% 9% 97% 57% 29% 86% 82% 15% 3% 92% 35% 15% 7%
3 - 6 months 3,058 145 443,410 55% 34% 9% 98% 63% 25% 88% 85% 12% 3% 97% 49% 18% 7%
6 + months 2,036 180 366,480 49% 30% 13% 92% 58% 17% 75% 81% 14% 5% 92% 77% 66% 50%
% of Registration by Age % of Registrations Number in Party Desired Season of Travel3
Length of Stay
PreferenceStay (Days)2 10% 15% 20% 25% 30% 35% 40% 45% 50%
1 - 3 Days 74,164 7,420 11,120 14,830 18,540 22,250 25,960 29,670 33,370 37,080
4 - 6 Days 311,610 31,160 46,740 62,320 77,900 93,480 109,060 124,640 140,220 155,810
1 - 2 Weeks 371,322 37,130 55,700 74,260 92,830 111,400 129,960 148,530 167,090 185,660
Subtotal 757,096 75,710 113,560 151,410 189,270 227,130 264,980 302,840 340,680 378,550
3 - 4 Weeks 72,716 7,270 10,910 14,540 18,180 21,810 25,450 29,090 32,720 36,360
1 - 3 Months 294,540 29,450 44,180 58,910 73,640 88,360 103,090 117,820 132,540 147,270
3 - 6 months 443,410 44,340 66,510 88,680 110,850 133,020 155,190 177,360 199,530 221,710
6 + months 366,480 36,650 54,970 73,300 91,620 109,940 128,270 146,590 164,920 183,240
Subtotal 1,177,146 117,710 176,570 235,430 294,290 353,130 412,000 470,860 529,710 588,580
Total 1,934,242 193,420 290,130 386,840 483,560 580,260 676,980 773,700 870,390 967,130
Hypothetical Capture Percentage of Customer Registrations

9Slide 9
IN
13%
OH
17%
IL
11%
MI
7%IA
6%
MO
2%
WI
2%
KY
8%
TN
3%NC
4%
PA
8%
NY
5%
FL
Repeat Allegiant’s customers to PGD3
1 Excluding FL, AK, HI, and PR. 2 Peak Season: March and April 3Since 2013
48%
20%
10%
22%
2 3 4 5+
0%
25%
50%
75%
100%
Jan Feb Mar Apr May Jun Jul Aug Sep Oct Nov Dec
Repeat Customers by Trips
(% of Total)
# of itineraries
Seasonal Distribution of Repeat Customer Trips
(% of Peak Season2)
90% of repeat customers
originate from the
highlighted states1
States not highlighted have <1% repeat customers
10
Revenue Discussion
11
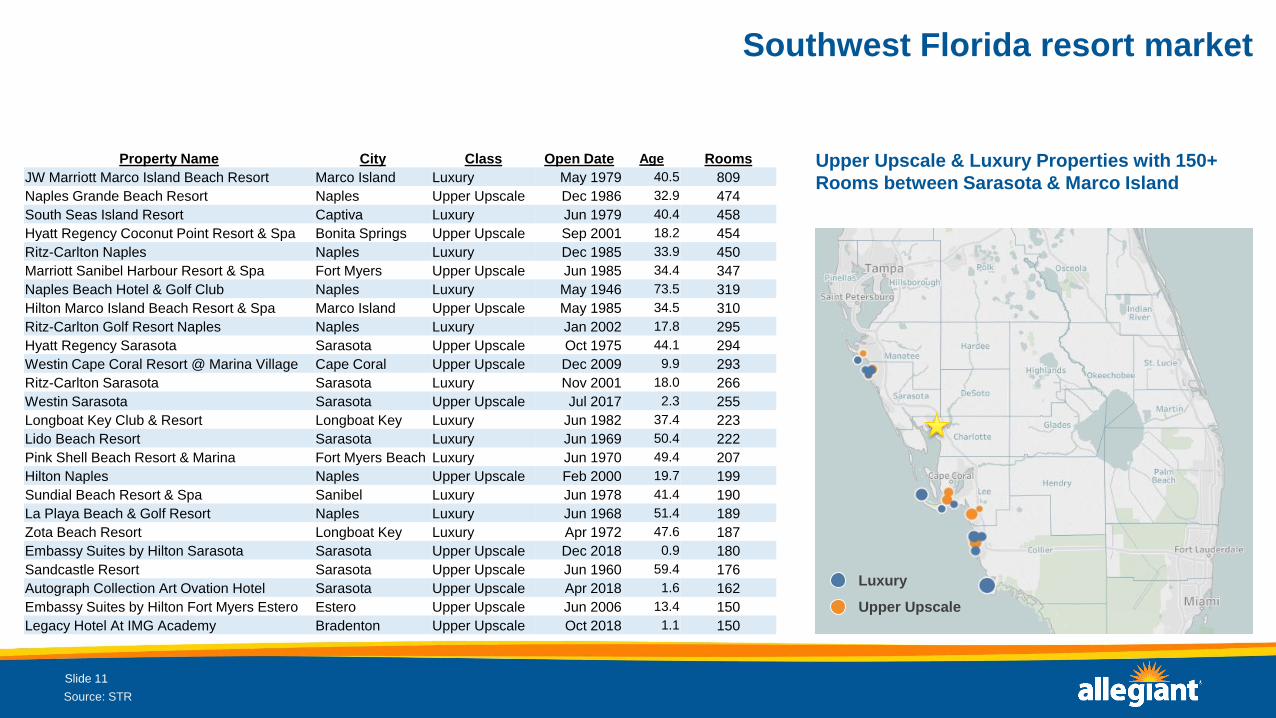
Southwest Florida resort market
Slide 11
Upper Upscale & Luxury Properties with 150+
Rooms between Sarasota & Marco Island
Property Name City Class Open Date Age Rooms
JW Marriott Marco Island Beach Resort Marco Island Luxury May 1979 40.5 809
Naples Grande Beach Resort Naples Upper Upscale Dec 1986 32.9 474
South Seas Island Resort Captiva Luxury Jun 1979 40.4 458
Hyatt Regency Coconut Point Resort & Spa Bonita Springs Upper Upscale Sep 2001 18.2 454
Ritz-Carlton Naples Naples Luxury Dec 1985 33.9 450
Marriott Sanibel Harbour Resort & Spa Fort Myers Upper Upscale Jun 1985 34.4 347
Naples Beach Hotel & Golf Club Naples Luxury May 1946 73.5 319
Hilton Marco Island Beach Resort & Spa Marco Island Upper Upscale May 1985 34.5 310
Ritz-Carlton Golf Resort Naples Naples Luxury Jan 2002 17.8 295
Hyatt Regency Sarasota Sarasota Upper Upscale Oct 1975 44.1 294
Westin Cape Coral Resort @ Marina Village Cape Coral Upper Upscale Dec 2009 9.9 293
Ritz-Carlton Sarasota Sarasota Luxury Nov 2001 18.0 266
Westin Sarasota Sarasota Upper Upscale Jul 2017 2.3 255
Longboat Key Club & Resort Longboat Key Luxury Jun 1982 37.4 223
Lido Beach Resort Sarasota Luxury Jun 1969 50.4 222
Pink Shell Beach Resort & Marina Fort Myers Beach Luxury Jun 1970 49.4 207
Hilton Naples Naples Upper Upscale Feb 2000 19.7 199
Sundial Beach Resort & Spa Sanibel Luxury Jun 1978 41.4 190
La Playa Beach & Golf Resort Naples Luxury Jun 1968 51.4 189
Zota Beach Resort Longboat Key Luxury Apr 1972 47.6 187
Embassy Suites by Hilton Sarasota Sarasota Upper Upscale Dec 2018 0.9 180
Sandcastle Resort Sarasota Upper Upscale Jun 1960 59.4 176
Autograph Collection Art Ovation Hotel Sarasota Upper Upscale Apr 2018 1.6 162
Embassy Suites by Hilton Fort Myers Estero Estero Upper Upscale Jun 2006 13.4 150
Legacy Hotel At IMG Academy Bradenton Upper Upscale Oct 2018 1.1 150
Source: STR
Luxury
Upper Upscale

12
Favorable ADR environment in the market
Slide 12
Source: STR Trend Report for the 25 properties on the “Southwest Florida Resort Market” slide: Upper Upscale & Luxury Properties with 150+ rooms between Sarasota & Marco Island
Market Total ADR
2016 2017 2018 2019
Jan $307 $303 $320 $316
Feb $371 $367 $391 $381
Mar $438 $417 $457 $426
Apr $315 $360 $344 $362
May $244 $250 $255 $258
Jun $216 $224 $231
Jul $233 $236 $225
Aug $208 $210 $198
Sep $193 $197 $186
Oct $221 $214 $213
Nov $241 $251 $249
Dec $309 $322 $338
Weighted
Average$285 $290 $297 $353

13
Market experiences heavy occupancy seasonality
Slide 13
Source: STR Trend Report for the 25 properties on the “Southwest Florida Resort Market” slide: Upper Upscale & Luxury Properties with 150+ rooms between Sarasota & Marco Island
35%
45%
55%
65%
75%
85%
95%
Jan Feb Mar Apr May Jun Jul Aug Sep Oct Nov Dec
2016
2017
2018
2019
Historical Occupancy (%) – Market Set
2016-20192016 2017 2018 2019
Jan 72% 70% 68% 66%
Feb 84% 84% 84% 82%
Mar 88% 88% 88% 86%
Apr 79% 82% 79% 75%
May 66% 69% 64% 68%
Jun 66% 67% 68%
Jul 73% 72% 72%
Aug 56% 56% 48%
Sep 54% 36% 41%
Oct 62% 57% 52%
Nov 66% 65% 61%
Dec 62% 61% 56%
14
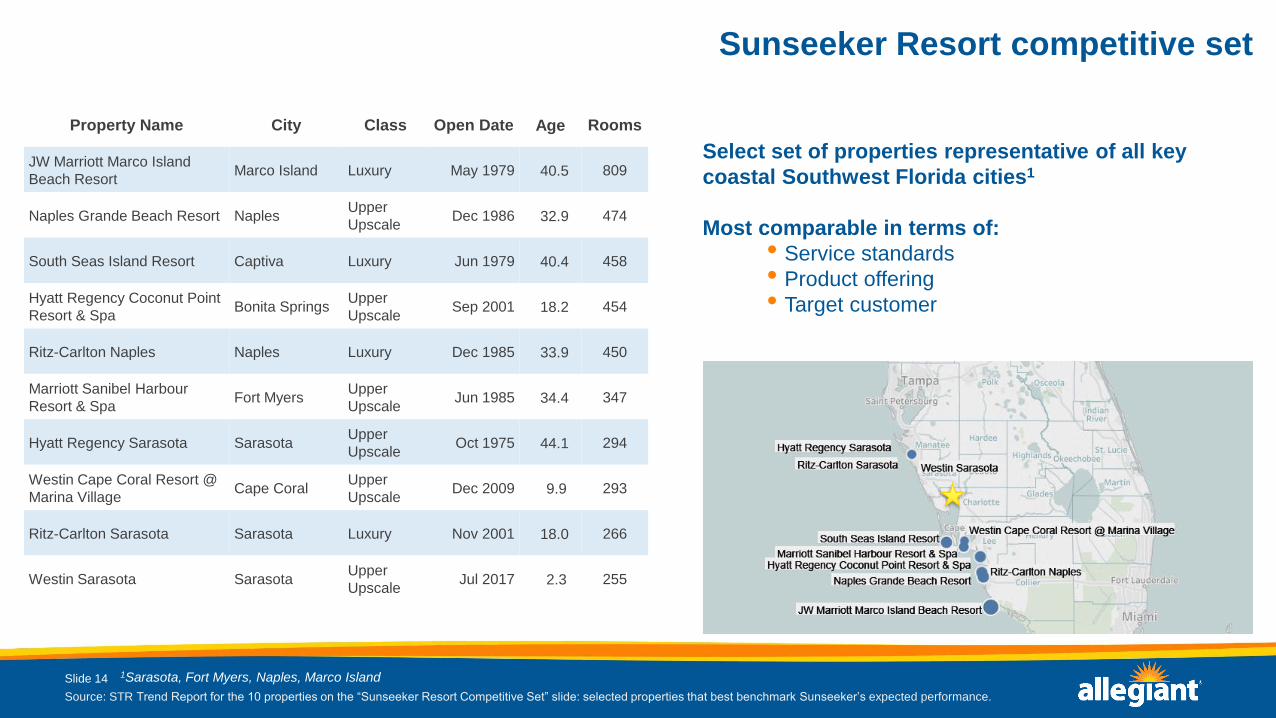
Sunseeker Resort competitive set
Slide 14
Property Name City Class Open Date Age Rooms
JW Marriott Marco Island
Beach Resort Marco Island Luxury May 1979 40.5 809
Naples Grande Beach Resort Naples Upper
Upscale Dec 1986 32.9 474
South Seas Island Resort Captiva Luxury Jun 1979 40.4 458
Hyatt Regency Coconut Point
Resort & SpaBonita Springs
Upper
Upscale Sep 2001 18.2 454
Ritz-Carlton Naples Naples Luxury Dec 1985 33.9 450
Marriott Sanibel Harbour
Resort & Spa Fort Myers
Upper
Upscale Jun 1985 34.4 347
Hyatt Regency Sarasota Sarasota Upper
Upscale Oct 1975 44.1 294
Westin Cape Coral Resort @
Marina VillageCape Coral
Upper
Upscale Dec 2009 9.9 293
Ritz-Carlton Sarasota Sarasota Luxury Nov 2001 18.0 266
Westin Sarasota Sarasota Upper
Upscale Jul 2017 2.3 255
Select set of properties representative of all key
coastal Southwest Florida cities1
Most comparable in terms of:
• Service standards
• Product offering
• Target customer
1Sarasota, Fort Myers, Naples, Marco Island
Source: STR Trend Report for the 10 properties on the “Sunseeker Resort Competitive Set” slide: selected properties that best benchmark Sunseeker’s expected performance.
15
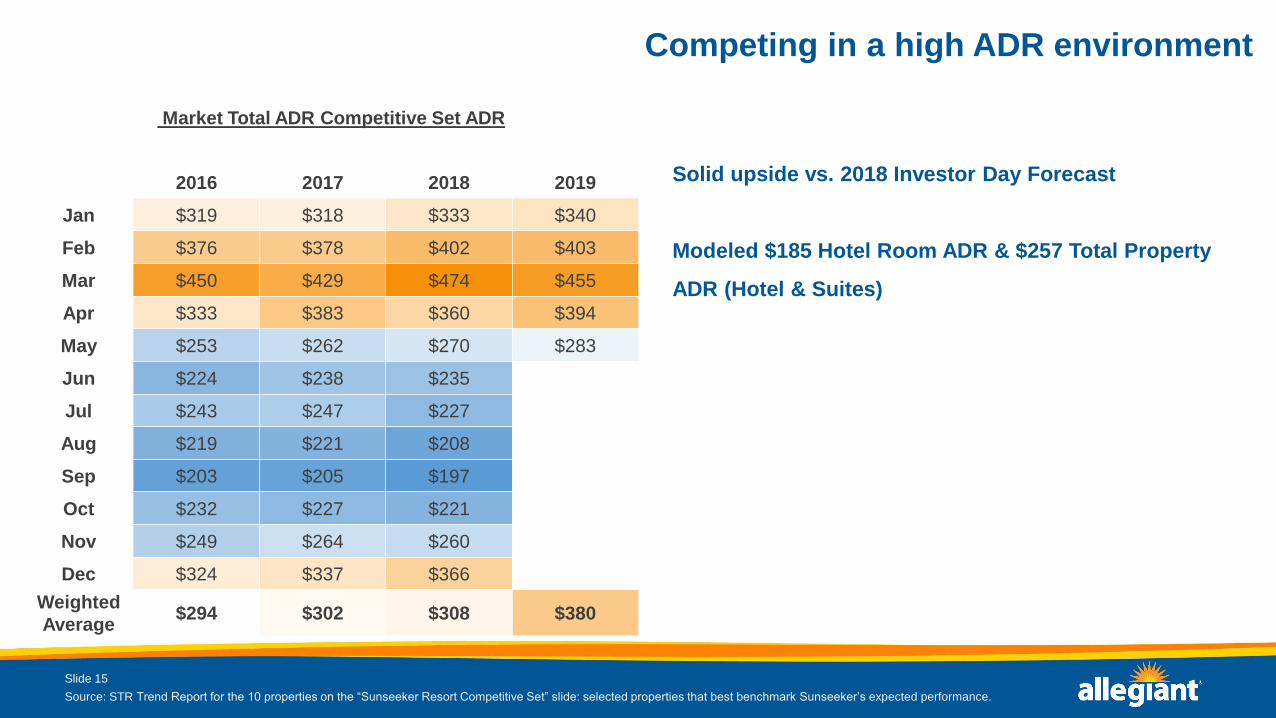
Competing in a high ADR environment
Slide 15
Solid upside vs. 2018 Investor Day Forecast
Modeled $185 Hotel Room ADR & $257 Total Property
ADR (Hotel & Suites)
Market Total ADR Competitive Set ADR
2016 2017 2018 2019
Jan $319 $318 $333 $340
Feb $376 $378 $402 $403
Mar $450 $429 $474 $455
Apr $333 $383 $360 $394
May $253 $262 $270 $283
Jun $224 $238 $235
Jul $243 $247 $227
Aug $219 $221 $208
Sep $203 $205 $197
Oct $232 $227 $221
Nov $249 $264 $260
Dec $324 $337 $366
Weighted
Average$294 $302 $308 $380
Source: STR Trend Report for the 10 properties on the “Sunseeker Resort Competitive Set” slide: selected properties that best benchmark Sunseeker’s expected performance.
16
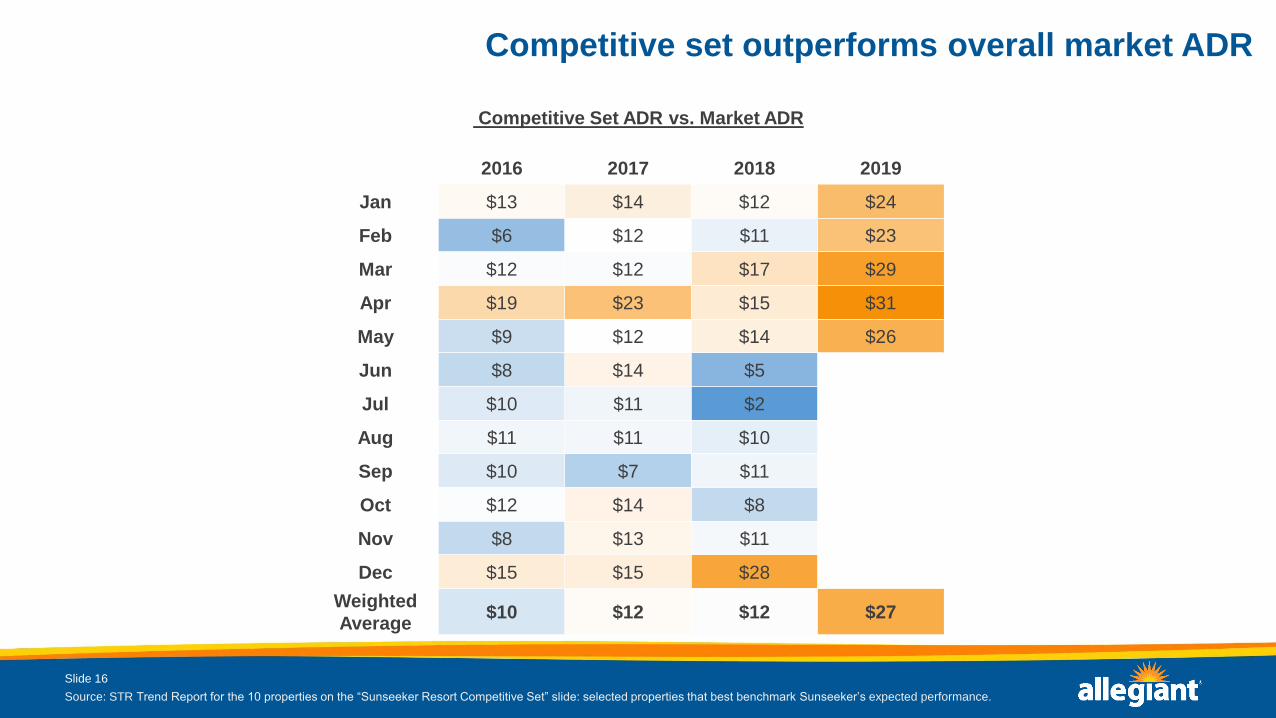
Competitive set outperforms overall market ADR
Slide 16
Competitive Set ADR vs. Market ADR
2016 2017 2018 2019
Jan $13 $14 $12 $24
Feb $6 $12 $11 $23
Mar $12 $12 $17 $29
Apr $19 $23 $15 $31
May $9 $12 $14 $26
Jun $8 $14 $5
Jul $10 $11 $2
Aug $11 $11 $10
Sep $10 $7 $11
Oct $12 $14 $8
Nov $8 $13 $11
Dec $15 $15 $28
Weighted
Average$10 $12 $12 $27
Source: STR Trend Report for the 10 properties on the “Sunseeker Resort Competitive Set” slide: selected properties that best benchmark Sunseeker’s expected performance.

17
Competitive set occupancy
Slide 17
Source: STR Trend Report for the 10 properties on the “Sunseeker Resort Competitive Set” slide: selected properties that best benchmark Sunseeker’s expected performance; 2nd half of
2017 – 2018 significantly impacted by Red Tide & major hurricanes (Sep. 2017: Irma – Category 4; Oct. 2018: Michael – Category 5)
Opportunities to combat seasonality and sub-optimal occupancy at Sunseeker
through a superior product, competitive pricing & airline distribution
30%
40%
50%
60%
70%
80%
90%
100%
Jan Feb Mar Apr May Jun Jul Aug Sep Oct Nov Dec
2016 2017 2018 2019
Historical Occupancy – Market Set
2016 - 2019 Competitive Set Occupancy
2016 2017 2018 2019
Jan 70% 70% 67% 70%
Feb 83% 84% 83% 83%
Mar 88% 88% 87% 87%
Apr 78% 83% 79% 77%
May 65% 68% 65% 68%
Jun 64% 71% 70%
Jul 72% 72% 72%
Aug 55% 57% 50%
Sep 56% 35% 44%
Oct 64% 60% 58%
Nov 68% 68% 66%
Dec 65% 61% 59%

18
Ability to capture market share in off-peak months with favorable pricing
Slide 18
Source: Occupancy - STR Trend Report for the 10 properties on the “Sunseeker Resort Competitive Set” slide: selected properties that best benchmark Sunseeker’s expected
performance; Competitive Set Rates is OTA Insight; Base Rate which is defined as the lowest published rate before any discounts
Competitive Set:
2016 - 2018
Sunseeker Occupancy Potential: Room Nights
Required
Sunseeker Occupancy: % of Competitive Set
Room NightsRate Differential
Month Avg. OccupancyAvg. Occ. Room
Nights
80%
Occupancy
85%
Occupancy
90%
Occupancy
80%
Occupancy
85%
Occupancy
90%
Occupancy
Median
Competitive Set
Hotel Room Base
Rate
Avg. Sunseeker
Hotel Room Base
Rate
Sunseeker Rate vs.
Competitive Set
Rate
Jan 68.7% 81,553 12,698 13,491 14,285 16% 17% 18% $377 $359 ($18)
May 65.8% 78,048 12,698 13,491 14,285 16% 17% 18% $277 $260 ($17)
Jun 68.2% 78,250 12,288 13,056 13,824 16% 17% 18% $275 $240 ($35)
Aug 54.4% 63,864 12,698 13,491 14,285 20% 21% 22% $263 $214 ($49)
Sep 44.9% 53,080 12,288 13,056 13,824 23% 25% 26% $329 $222 ($107)
Oct 60.3% 70,685 12,698 13,491 14,285 18% 19% 20% $300 $227 ($73)
Nov 67.1% 76,363 12,288 13,056 13,824 16% 17% 18% $271 $239 ($32)
Dec 61.3% 75,044 12,698 13,491 14,285 17% 18% 19% $328 $289 ($38)
Includes only months with historical (2016 – 2018) occupancy rates under 70%; does not include
Suites

19
Run high off-peak occupancy through capturing existing market & leveraging
Allegiant distribution
Slide 19Source: Occupied Room Nights - STR Trend Report for the 10 properties on the “Sunseeker Resort Competitive Set” slide: selected properties that best bechmark Sunseeker’s expected
performance; Take Rate Calculations assume 5 day length of stay; Itinerary Counts are from TTM through September 2019 to PGD (forward traffic only)
Fair Share represents receiving the same % of average 2016 – 2018 Occupied Room Nights as Sunseeker will represent as a %
of supply. Once built – the Competitive Set has 4,100 Rooms and Sunseeker will add 512 (excludes suites) - “Fair Share”
assumes Sunseeker captures 11% [Sunseeker Rooms / (Sunseeker Rooms + Competitive Set Rooms)] of Occupied Room
Nights
Sunseeker Occupancy Potential: Allegiant Take Rate Required with Fair
Share
Month
Competitive Set
Occupied Room
Nights
Sunseeker Fair
Share
Allegiant Inbound
Itineraries80% 85% 90%
Jan 81,553 9,054 34,409 2.1% 2.6% 3.0%
May 78,048 8,664 29,521 2.7% 3.3% 3.8%
Jun 78,250 8,687 28,958 2.5% 3.0% 3.6%
Aug 63,864 7,090 20,654 5.4% 6.2% 7.0%
Sep 53,080 5,893 12,976 9.9% 11.0% 12.2%
Oct 70,685 7,847 32,367 3.0% 3.5% 4.0%
Nov 76,363 8,477 31,456 2.4% 2.9% 3.4%
Dec 75,044 8,331 32,946 2.7% 3.1% 3.6%

20
Lift off-peak occupancy with Allegiant distribution
Slide 20
Source: Occupancy - STR Trend Report for the 10 properties on the “Sunseeker Resort Competitive Set” slide: selected properties that best benchmark Sunseeker’s expected
performance; Load Factor is RPM/ASM to PGD; Itinerary Counts are from TTM through September 2019 to PGD (forward traffic only)
Includes only months with historical (2016 – 2018) Competitive Set occupancy rates under 70%; does not include
Suites; assumes 5 day length of stay & only Allegiant guests
Sunseeker Occupancy Potential: Allegiant Take Rate Required
for Occupancy Scenarios
Allegiant Inbound Itineraries
to PGDAllegiant Load Factor 80% Occupancy 85% Occupancy 90% Occupancy
Jan 34,409 86% 7.4% 7.8% 8.3%
May 29,521 81% 8.6% 9.1% 9.7%
Jun 28,958 88% 8.5% 9.0% 9.6%
Aug 20,654 85% 12.3% 13.1% 13.8%
Sep 12,976 86% 18.9% 20.1% 21.3%
Oct 32,367 86% 7.9% 8.3% 8.8%
Nov 31,456 81% 7.8% 8.3% 8.8%
Dec 32,946 83% 7.7% 8.2% 8.7%
21
47%60%
72%
58%49% 53%
66% 66%
44% 42%48%
67%
52%39%
26%
41%50% 46%
32% 32%
54% 56%50%
31%
Jan Feb Mar Apr May Jun Jul Aug Sep Oct Nov Dec
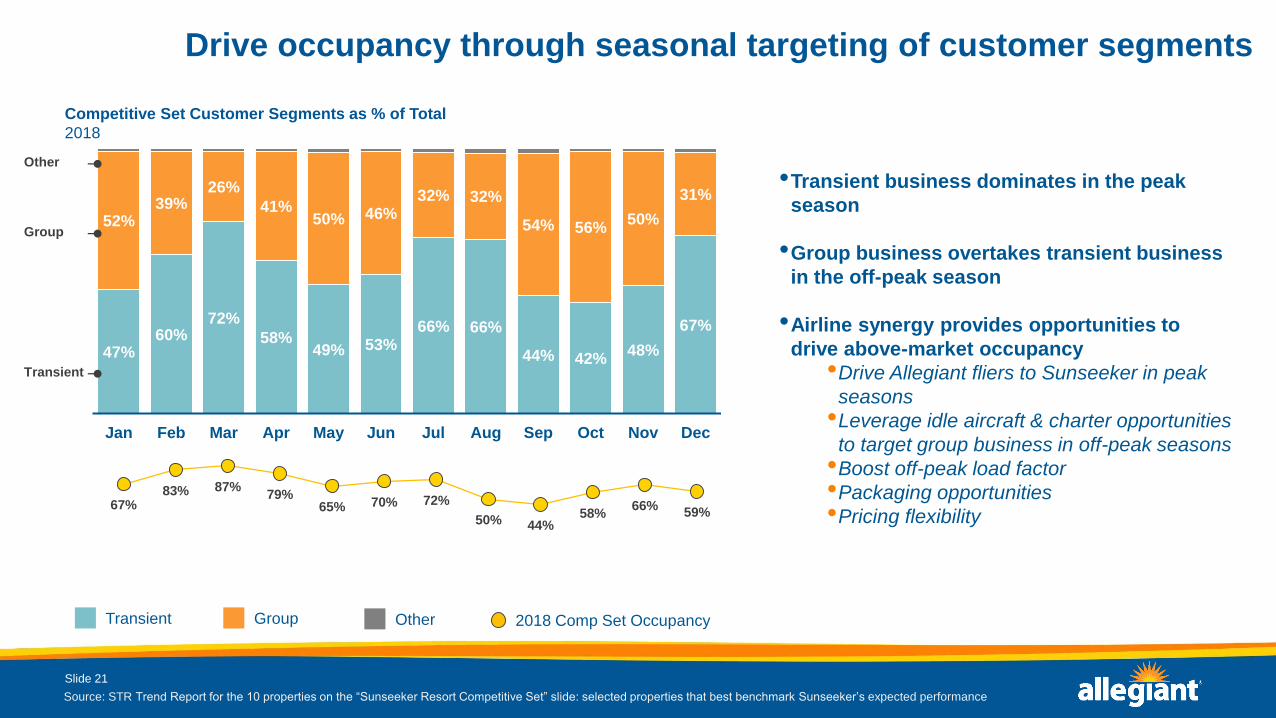
Drive occupancy through seasonal targeting of customer segments
Slide 21
Source: STR Trend Report for the 10 properties on the “Sunseeker Resort Competitive Set” slide: selected properties that best benchmark Sunseeker’s expected performance
•Transient business dominates in the peak
season
•Group business overtakes transient business
in the off-peak season
•Airline synergy provides opportunities to
drive above-market occupancy
•Drive Allegiant fliers to Sunseeker in peak
seasons
•Leverage idle aircraft & charter opportunities
to target group business in off-peak seasons
•Boost off-peak load factor
•Packaging opportunities
•Pricing flexibility
Competitive Set Customer Segments as % of Total
2018
67%83% 87%
79%65% 70% 72%
50% 44%58%
66%59%
Transient
Group
Other
Group Other 2018 Comp Set OccupancyTransient
22
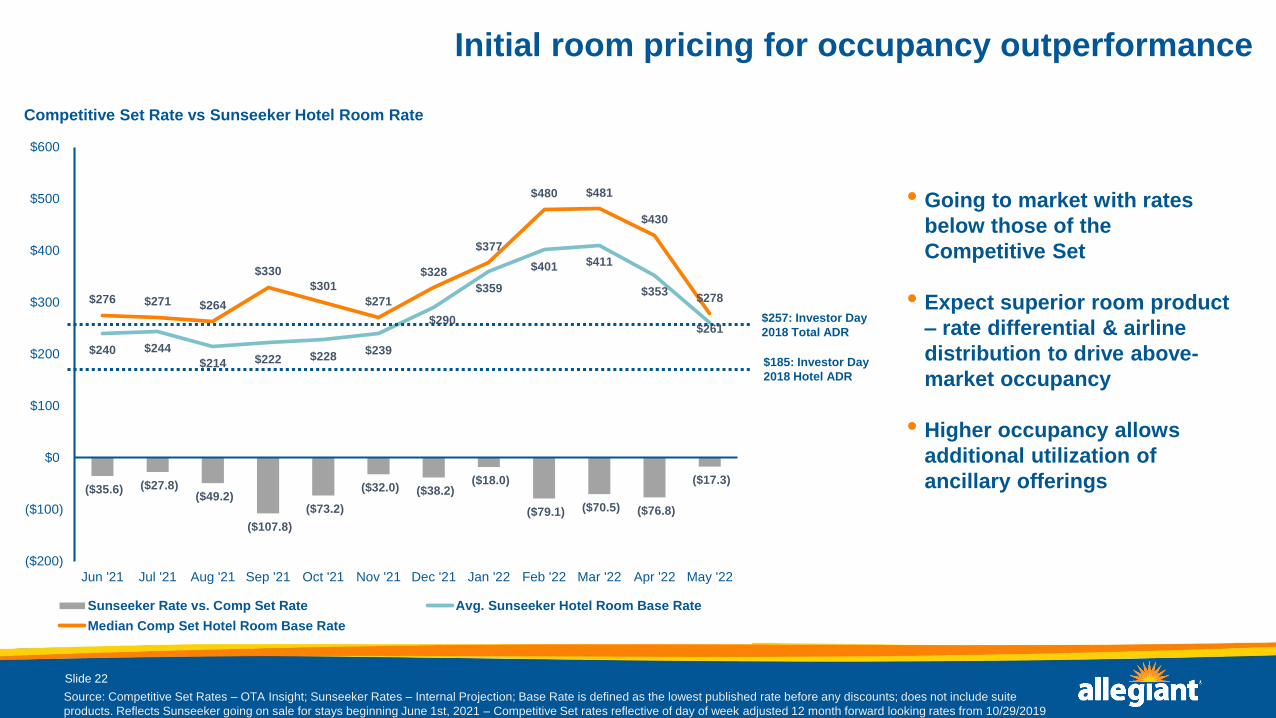
Initial room pricing for occupancy outperformance
Slide 22
Source: Competitive Set Rates – OTA Insight; Sunseeker Rates – Internal Projection; Base Rate is defined as the lowest published rate before any discounts; does not include suite
products. Reflects Sunseeker going on sale for stays beginning June 1st, 2021 – Competitive Set rates reflective of day of week adjusted 12 month forward looking rates from 10/29/2019
• Going to market with rates
below those of the
Competitive Set
• Expect superior room product
– rate differential & airline
distribution to drive above-
market occupancy
• Higher occupancy allows
additional utilization of
ancillary offerings($35.6) ($27.8)($49.2)
($107.8)
($73.2)
($32.0) ($38.2)($18.0)
($79.1) ($70.5) ($76.8)
($17.3)
$240 $244
$214 $222 $228$239
$290
$359
$401 $411
$353
$261
$276 $271 $264
$330
$301
$271
$328
$377
$480 $481
$430
$278
($200)
($100)
$0
$100
$200
$300
$400
$500
$600
Jun '21 Jul '21 Aug '21 Sep '21 Oct '21 Nov '21 Dec '21 Jan '22 Feb '22 Mar '22 Apr '22 May '22
Sunseeker Rate vs. Comp Set Rate Avg. Sunseeker Hotel Room Base Rate
Median Comp Set Hotel Room Base Rate
$257: Investor Day
2018 Total ADR
$185: Investor Day
2018 Hotel ADR
Competitive Set Rate vs Sunseeker Hotel Room Rate

23
Income statement from September 2018 investor day
Slide 23
(000’s) Year 1 Year 2 Year 3 Year 4 Year 5
Revenue
Hotel $ 32,854 $ 35,264 $ 37,473 $ 39,007 $ 40,600
Suites 24,825 27,241 29,280 30,598 31,728
Food & Beverage 25,900 29,254 32,134 33,828 35,420
Golf & Marina 4,513 4,907 5,104 5,333 5,495
Total Revenue $ 88,092 $ 96,666 $ 103,991 $ 108,766 $ 113,243
Expenses
Hotel & Suite Department $ 5,324 $ 6,815 $ 7,187 $ 7,479 $ 7,762
Food & Beverage Department 22,626 24,315 25,893 27,270 28,469
Golf & Marina 3,080 3,210 3,313 3,422 3,526
Selling & Admin 23,476 24,486 25,466 26,333 27,204
Total Expenses $ 54,506 $ 58,826 $ 61,859 $ 64,504 $ 66,961
EBITDA $ 33,586 $ 37,840 $ 42,132 $ 44,262 $ 46,282
38.1% 39.1% 40.5% 40.7% 40.9%
Hotel Occupancy 90% 92% 94% 95% 96%
Hotel ADR $ 185.00 $ 194.25 $ 202.02 $ 208.08 $ 214.32
Hotel Avg Daily Resort Fee $ 12.00 $ 12.60 $ 13.10 $ 13.50 $ 13.90
Suite Occupancy 87% 91% 94% 95% 96%
Suite ADR $ 390.13 $ 409.60 $ 425.94 $ 437.60 $ 450.32
Suite Avg Daily Resort Fee $ 20.00 $ 21.00 $ 21.84 $ 22.50 $ 23.17
Avg F&B Spend/Room Night $ 115.60 $ 126.97 $ 136.07 $ 141.50 $ 146.73
Blended Suite/Hotel ADR $ 257.44 $ 271.29 $ 282.67 $ 291.17 $ 299.62
Blended S/H Avg. Resort Fee $ 14.05 $ 14.79 $ 15.40 $ 15.87 $ 16.34
$33,586
$37,840
$42,132
$44,262
$46,282
Year 1 Year 2 Year 3 Year 4 Year 5
EBITDA
(000’s)
24
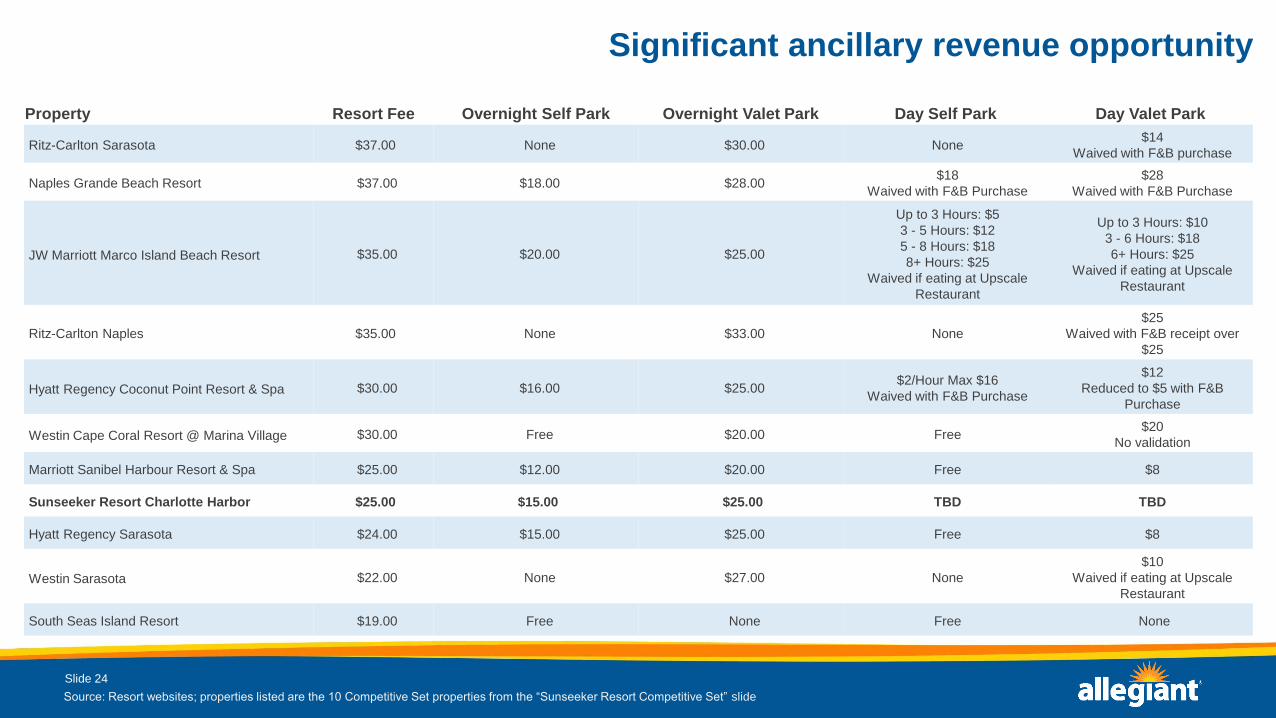
Significant ancillary revenue opportunity
Slide 24
Source: Resort websites; properties listed are the 10 Competitive Set properties from the “Sunseeker Resort Competitive Set” slide
Property Resort Fee Overnight Self Park Overnight Valet Park Day Self Park Day Valet Park
Ritz-Carlton Sarasota $37.00 None $30.00 None$14
Waived with F&B purchase
Naples Grande Beach Resort $37.00 $18.00 $28.00 $18
Waived with F&B Purchase
$28
Waived with F&B Purchase
JW Marriott Marco Island Beach Resort $35.00 $20.00 $25.00
Up to 3 Hours: $5
3 - 5 Hours: $12
5 - 8 Hours: $18
8+ Hours: $25
Waived if eating at Upscale
Restaurant
Up to 3 Hours: $10
3 - 6 Hours: $18
6+ Hours: $25
Waived if eating at Upscale
Restaurant
Ritz-Carlton Naples $35.00 None $33.00 None
$25
Waived with F&B receipt over
$25
Hyatt Regency Coconut Point Resort & Spa $30.00 $16.00 $25.00 $2/Hour Max $16
Waived with F&B Purchase
$12
Reduced to $5 with F&B
Purchase
Westin Cape Coral Resort @ Marina Village $30.00 Free $20.00 Free$20
No validation
Marriott Sanibel Harbour Resort & Spa $25.00 $12.00 $20.00 Free $8
Sunseeker Resort Charlotte Harbor $25.00 $15.00 $25.00 TBD TBD
Hyatt Regency Sarasota $24.00 $15.00 $25.00 Free $8
Westin Sarasota $22.00 None $27.00 None
$10
Waived if eating at Upscale
Restaurant
South Seas Island Resort $19.00 Free None Free None

25
Competitive set data highlights potential of extensive F&B offering
Slide 25
Source: STR Host Report 2018 Data for aforementioned competitive set; Westin Sarasota & Marriott Sanibel Harbour excluded as they did not report P&L data in 2018; Food & Beverage
spend per occupied room includes all venues, room service, banquets/catering, and room/AV rental
Food & Beverage Spend per Occupied Room Night
$150 $175 $200 $225 $242 $275
An
nu
al
Oc
cu
pa
nc
y
65% 27.9 32.6 37.2 41.9 45.2 51.2
70% 30.1 35.1 40.1 45.1 48.7 55.2
75% 32.2 37.6 43.0 48.4 52.1 59.1
80% 34.4 40.1 45.8 51.6 55.6 63.0
85% 36.5 42.6 48.7 54.8 59.1 67.0
90% 38.7 45.1 51.6 58.0 62.6 70.9
95% 40.8 47.6 54.4 61.2 66.0 74.9
Potential Sunseeker Food & Beverage Revenue Under Various Annual Occupancy & Spend Per
Occupied Room Scenarios (in millions except for Food & Beverage Spend per Occupied Room Night)
Competitive Set
Performance
Heavy Food & Beverage spend per Occupied
Room Night at Competitive Set Properties
Category Amount POR1
Food $146.98
Beverage 59.54
Other 36.08
Total $242.60
1Per Occupied Room Night
Competitive Set Performance
Food & Beverage Revenue - $25,900,000 Year 1
Avg. F&B POR - $115.60 Year 1
Previously projected for Sunseeker in 2018 Investor Day

26
Limited dining options in PGD
Source: Yelp 1Restaurants may have multiple categories.
Slide 26
Restaurant Count1
Based on Yelp Categories
36
35
34
33
28
26
24
22
21
16
14
11
10
10
8
8
8
8
Sandwiches
Pizza
Fast Food
American
Italian
Burgers
Breakfast
Coffee & Tea
Grocery
Frozen Yogurt
Chicken Wings
Seafood
Bakeries
Chinese
American (New)
Convenience Stores
Diners
Juice Bars
Others
Punta Gorda Restaurant LocationsOctober, 2019
161
Others not to scale
132
111
8 3
$ $$ $$$ $$$$
Count by Price
Based on a 25 mile radius from Sunseeker
27
Opening and Operating

28
Seasoned operations team with extensive opening experience
Slide 28
• The Sunseeker Resorts Operations Team has held leadership
roles in the opening, or post- renovation repositioning of
some of the premier resorts of the world, including:
• MGM Grand & Signature (6,800 Rooms)
• ARIA and ARIA SkySuites (4,000 Rooms)
• Monte Carlo (3,000 Rooms)
• The Mirage (3,000 Rooms)
• Bellagio (3,000 Rooms)
• Treasure Island (2,900 Rooms)
• Palmer House Hilton (1,600 Rooms)
• Vdara (1,500 Rooms)
• Bellagio Spa Tower (900 Rooms)
• Park Central New York (700 Rooms)
• Intercontinental Time Square (600 Rooms)
• MGM National Harbor (300 Rooms)
• MGM Springfield (250 Rooms)
• WestHouse New York (200 Rooms)Intercontinental Time Square, New York City Center (Aria; Vdara), Las Vegas
Bellagio, Las Vegas

29
Robust Southwest Florida labor market
Slide 29
Source: Bureau of Labor Statistics Quarterly Census of Employment & Wages 2018 Annual Data
•Sunseeker Resort will compete in the market
comprised of Manatee, Sarasota, Charlotte, Lee, and
Collier Counties
•Properties in the Market Set & Competitive Set are
all located in these five counties
•Similar service standards
•Well-trained potential employees
•Market supports a robust labor market (122K
hospitality jobs and 2.1M population)
•Additional opportunities to recruit
•Non-coastal counties
•Outside leisure & hospitality
Leisure & Hospitality Jobs by County
2018

1
2020 Investor DayGreg Anderson - CFO

2
Overview
Slide 2 #2
Well positioned for the future
CASM-ex goal hit a year early, expect further reduction going forward
De-leveraging business post fleet transition
Sustainable, cash generation per aircraft
3
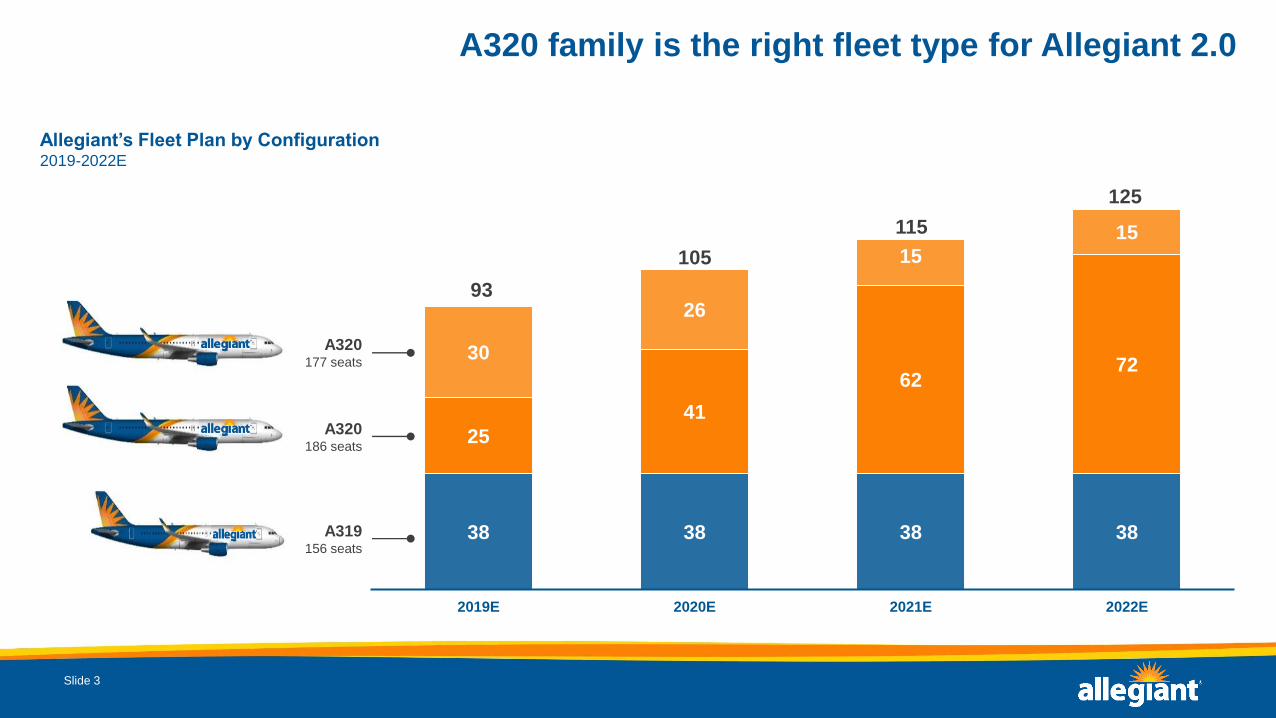
A320 family is the right fleet type for Allegiant 2.0
Allegiant’s Fleet Plan by Configuration2019-2022E
38 38 38 38
25
41
6272
30
26
15
15
2019E 2020E 2021E 2022E
Slide 3
93
105
115
125
A320186 seats
A320177 seats
A319156 seats
4
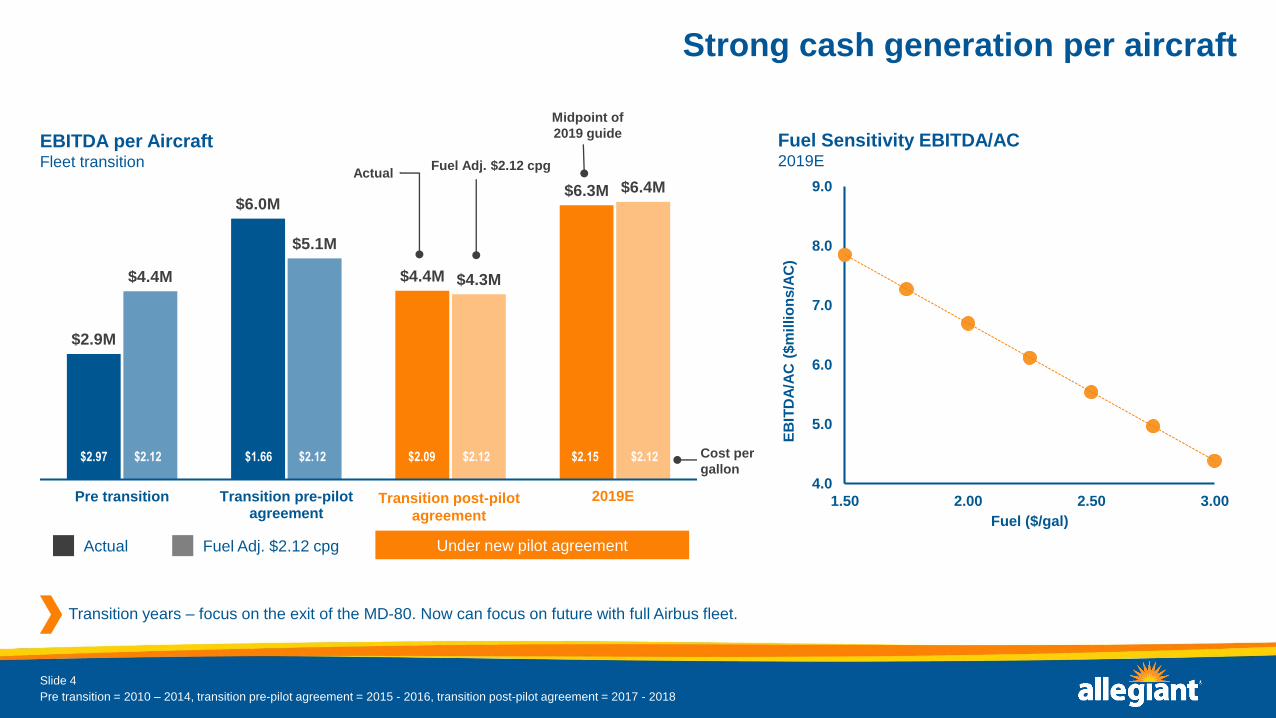
Strong cash generation per aircraft
Pre transition = 2010 – 2014, transition pre-pilot agreement = 2015 - 2016, transition post-pilot agreement = 2017 - 2018
EBITDA per AircraftFleet transition
Transition years – focus on the exit of the MD-80. Now can focus on future with full Airbus fleet.
$2.9M
$6.0M
$4.4M
$6.3M
$4.4M
$5.1M
$4.3M
$6.4M
Pre transition Transition pre-pilotagreement
Transition post-pilotagreement
2019E
Slide 4
Under new pilot agreement
Transition post-pilot
agreement
2019E4.0
5.0
6.0
7.0
8.0
9.0
1.50 2.00 2.50 3.00
EB
ITD
A/A
C (
$m
illio
ns
/AC
)
Fuel ($/gal)
Fuel Sensitivity EBITDA/AC2019E
ActualFuel Adj. $2.12 cpg
Actual Fuel Adj. $2.12 cpg
$2.97 $2.12 $1.66 $2.12 $2.09 $2.12 $2.15 $2.12 Cost per
gallon
Midpoint of
2019 guide
5
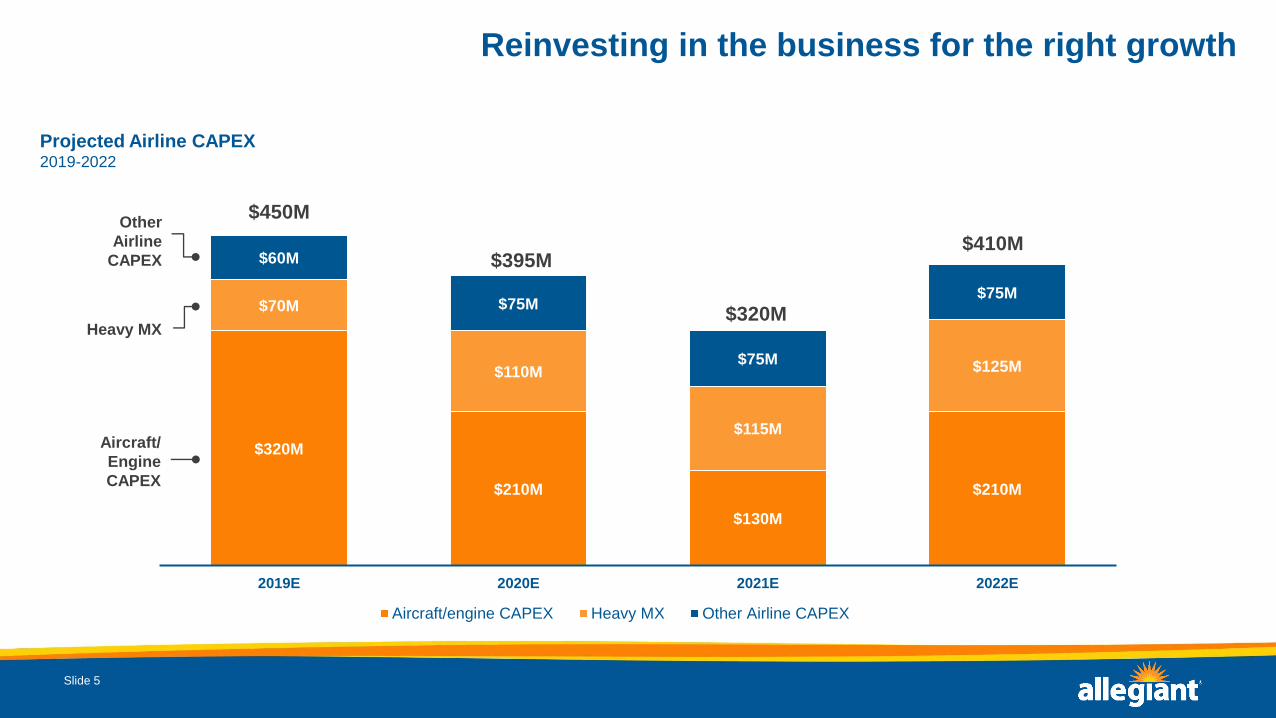
Reinvesting in the business for the right growth
Projected Airline CAPEX2019-2022
$320M
$210M
$130M
$210M
$70M
$110M
$115M
$125M
$60M
$75M
$75M
$75M
2019E 2020E 2021E 2022E
Aircraft/engine CAPEX Heavy MX Other Airline CAPEX
Slide 5
Aircraft/
Engine
CAPEX
Other
Airline
CAPEX
$450M
$395M
$320M
$410M
Heavy MX

6
Low asset price + higher % of variable cost = strong free cash generation1
Airline Free Cash Generation2019-2022
2019E 2019E
Slide 6
2020E 2020E 2019E 2019E2021E 2021E
Projected Annual EBITDA Airline CAPEX Airbus Heavy Maintenance
$535
$625M$690M
$760M
$450M$395M
$320M$410M
$85M
$230M
$370M$350M
2019E 2020E 2021E 2022E
EBITDACAPEX &
Heavy MXEBITDA
CAPEX &
Heavy MXEBITDA
CAPEX &
Heavy MXEBITDA
CAPEX &
Heavy MX
EBITDA levels assumes our 2019 estimate of $6.3M per aircraft times average aircraft in particular year
1Free Cash Flow = (EBITDA – CAPEX)

7
$450M $450M $450M $450M $445M $440M $435M
$363M
$721M$829M $890M
$755M $845M$670M
$258M
2016 2017 2018 2019E 2020E 2021E 2022E
$450M $450M $450M
2016 2017 2018 2019E 2020E 2021E 2022E
Expect to continue de-leveraging post fleet transition
Airline Debt and Leverage Ratios 2016-2022E (Airline Only)
Slide 7
1.7
3.3 3.4
2.5 2.31.9
1.5
2016 2017 2018 2019E 2020E 2021E 2022E
HY/TLB AC Secured Debt Debt/EBITDA
$813M
$1,171M$1,279M
$1,340M$1,450M
$1,285M
$1,105M
Airline Debt/EBITDA¹
30% 30% 35% 45%Unencumbered as a %
of total fleet
Future debt²
Future Debt
1EBITDA for 2019 – 2022 assumes $6.3M / AC times average AC at a fuel cpg of $2.12; 2Includes non-recourse portion of TPG financing for Sunseeker
8
$48M$72M
$175M
$155M
$20M$48M
$120M
$295M $295M
$155M$175M
2018 2019E 2020E 2021E
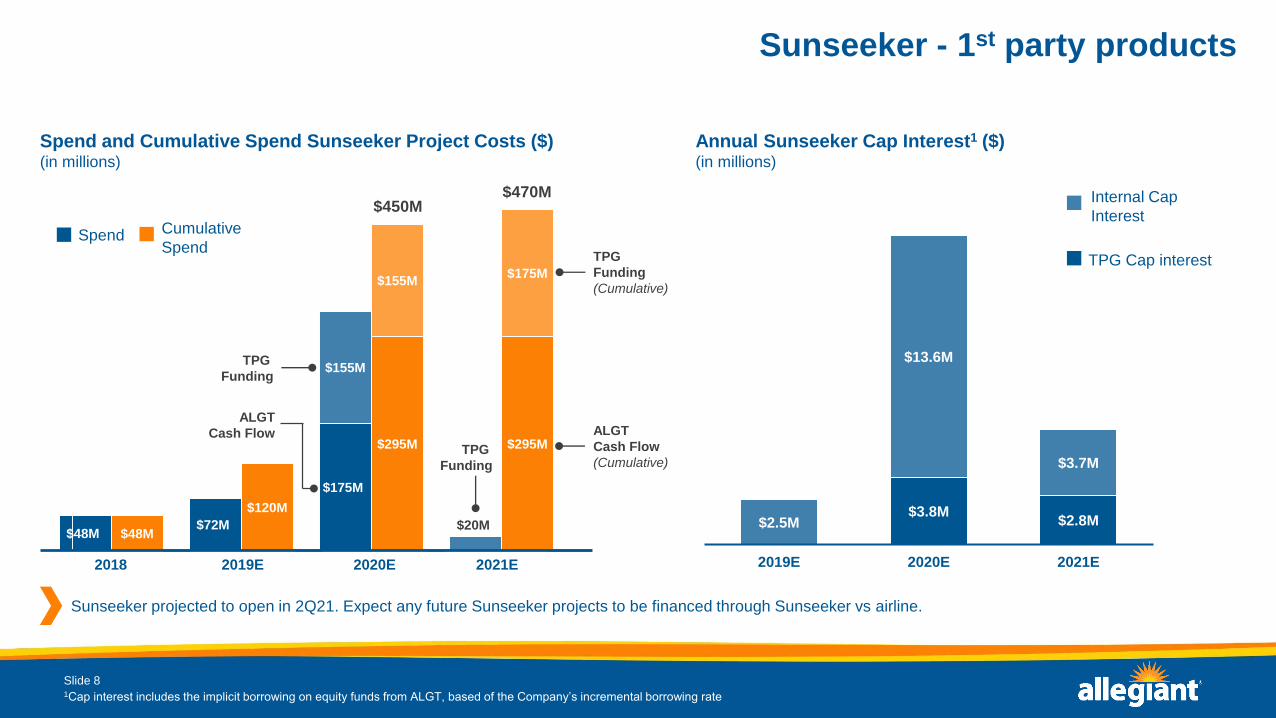
Sunseeker - 1st party products
Spend and Cumulative Spend Sunseeker Project Costs ($) (in millions)
Slide 8
$3.8M$2.8M$2.5M
$13.6M
$3.7M
2019E 2020E 2021E
Annual Sunseeker Cap Interest1 ($)(in millions)
Sunseeker projected to open in 2Q21. Expect any future Sunseeker projects to be financed through Sunseeker vs airline.
1Cap interest includes the implicit borrowing on equity funds from ALGT, based of the Company’s incremental borrowing rate
ALGT
Cash Flow
(Cumulative)
$450M$470M
2018 2019E 2020E 2021E
TPG
Funding
Spend Cumulative
Spend
ALGT
Cash Flow
Internal Cap
Interest
TPG Cap interestTPG
Funding
(Cumulative)
TPG
Funding
9
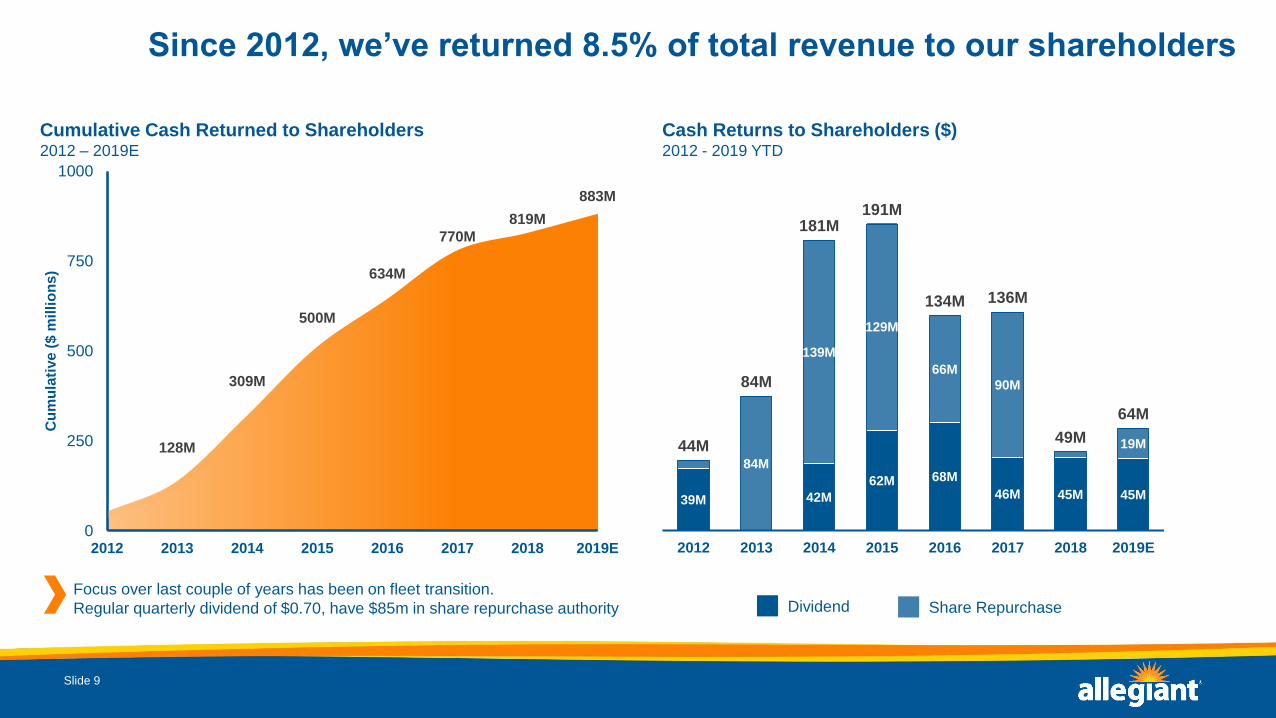
39M 42M
62M 68M
46M 45M 45M
84M
139M
129M
66M
90M
19M44M
84M
181M191M
134M 136M
49M
64M
2012 2013 2014 2015 2016 2017 2018 2019E
Since 2012, we’ve returned 8.5% of total revenue to our shareholders
Cumulative Cash Returned to Shareholders2012 – 2019E
Slide 9
128M
309M
500M
634M
770M
819M
883M
0
250
500
750
1000
2012 2013 2014 2015 2016 2017 2018 2019E
Cu
mu
lati
ve
($
mil
lio
ns
)
Cash Returns to Shareholders ($)2012 - 2019 YTD
Focus over last couple of years has been on fleet transition.
Regular quarterly dividend of $0.70, have $85m in share repurchase authority Dividend Share Repurchase

10
Limited cash tax payers through 2022 and beyond
Expected Cash Taxes to be Paid by Year2018 – 2022E
Slide 10
($42M)
$2M$4M
$8M
$15M
2018 2019E 2020E 2021E 2022E
Income Tax Cash Outflow/(Inflow)
#17
11
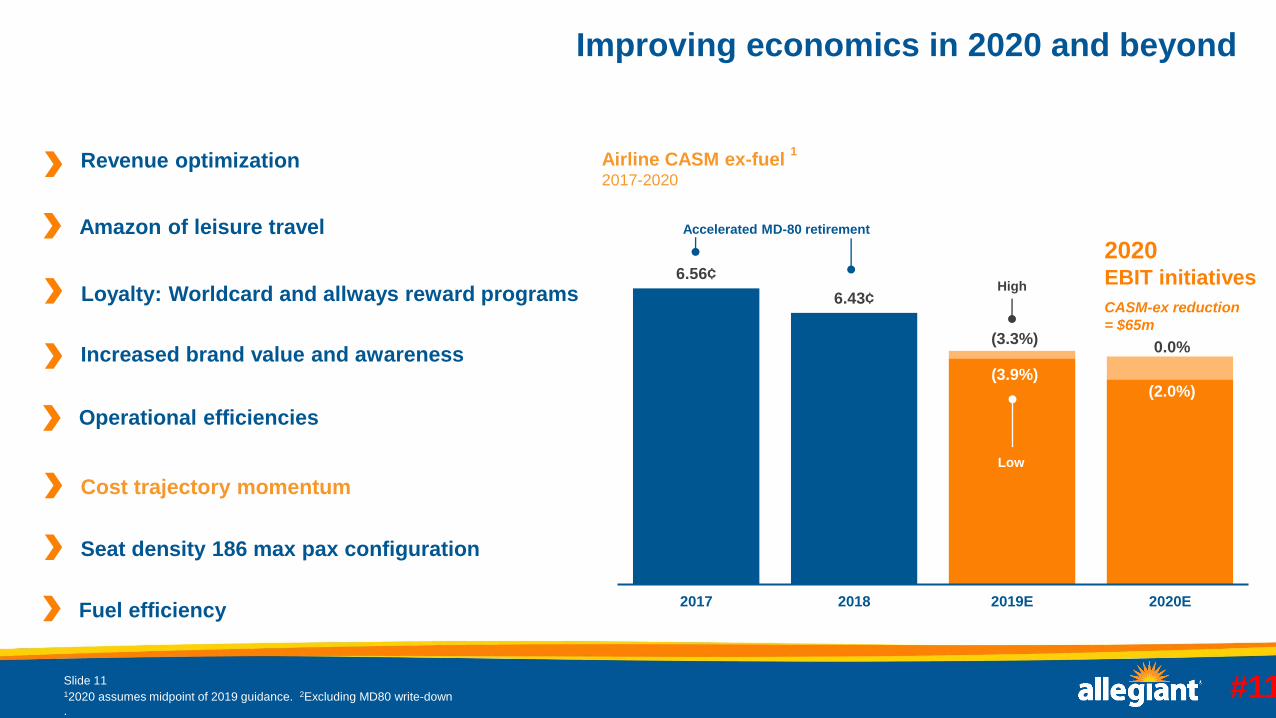
6.56¢
6.43¢
2017 2018 2019E 2020E
Improving economics in 2020 and beyond
Airline CASM ex-fuel2017-2020
Slide 11
(3.9%)
(3.3%)
(2.0%)
0.0%
12020 assumes midpoint of 2019 guidance. 2Excluding MD80 write-down
.
High
Low
Accelerated MD-80 retirement
#11
2
1
CASM-ex reduction
= $65m
2020EBIT initiatives
Revenue optimization
Amazon of leisure travel
Loyalty: Worldcard and allways reward programs
Increased brand value and awareness
Operational efficiencies
Cost trajectory momentum
Seat density 186 max pax configuration
Fuel efficiency

12
Increasing gauge with max pax configuration
A320s at 186 Passenger ConfigurationExpectation for used 186 seat A320s in 2020 (excluding 13 new AC)
3528
49
59
2017 revised 2020E 2021E 2022E
Slide 12
From ‘17 Investor Day
Expected in 2020
28 ac X $500k = $14M
Used A320 @ 186 seats
2020EBIT initiatives

13
17M
30M
33M
125
150
175
200
225
250
275
2016 2017 2018 2019E 2020E
Ga
llo
ns
(m
illi
on
s)
- Difference
12.4B13.6B
14.9B16.2B
17.8B
71.8 72.9 77.8 82.7 83.0
Significantly improved fuel efficiency
Allegiant Fleet Fuel Efficiency2016 - 2020
Slide 13
System ASMs (billions)Gallons at 2016 efficiency Actual/Projected gallons
ASMs/gal
ASMs
33M gal X $2.12 = $70M
2020EBIT initiatives
14
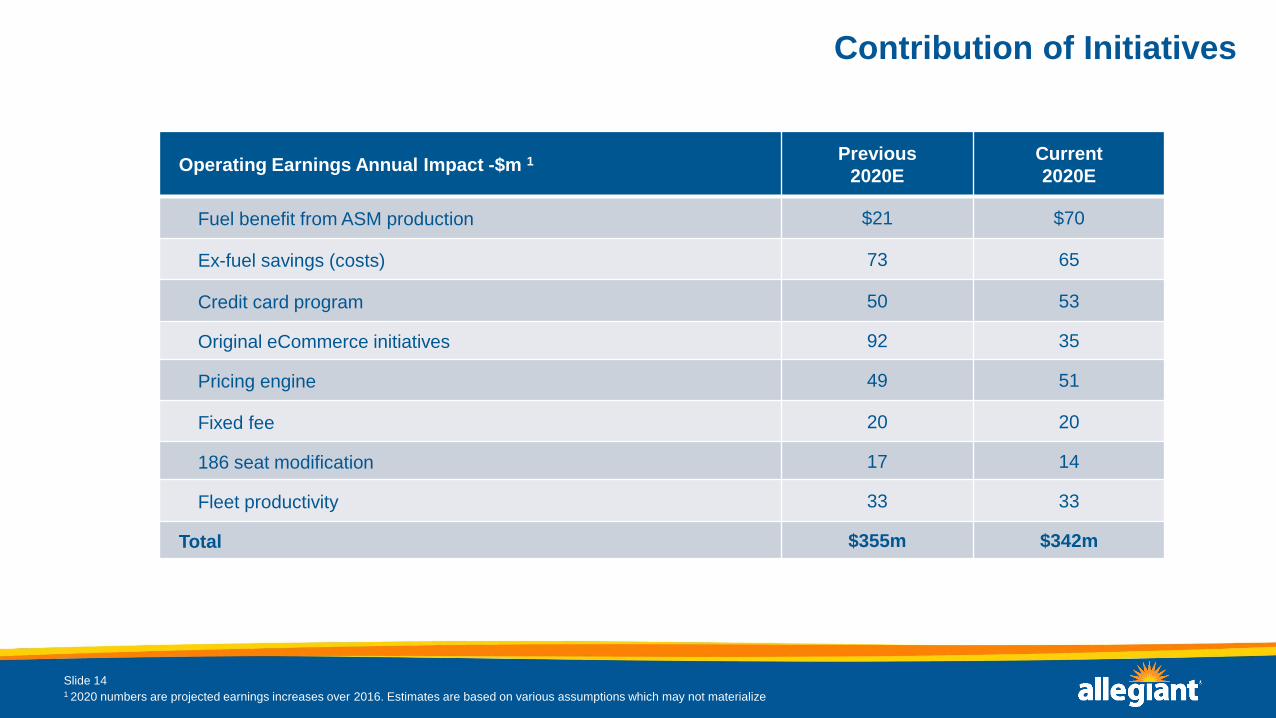
Contribution of Initiatives
Slide 141 2020 numbers are projected earnings increases over 2016. Estimates are based on various assumptions which may not materialize
Operating Earnings Annual Impact -$m 1Previous
2020E
Current
2020E
Fuel benefit from ASM production $21 $70
Ex-fuel savings (costs) 73 65
Credit card program 50 53
Original eCommerce initiatives 92 35
Pricing engine 49 51
Fixed fee 20 20
186 seat modification 17 14
Fleet productivity 33 33
Total $355m $342m

15
2020 guide
Slide 15
Full year guidance 2019 2020
Fuel cost per gallon $2.15 $2.12
Available seat miles (ASMs) / gallon 82.5 to 83.0 82.5 to 83.5
Interest expense (millions)¹ $70 to $75 $75 to $80
Capitalized interest (millions) NA $16 to $19
Tax rate 23 to 24% 23 to 24%
Share count (millions) 16.0 16.0
System ASMs – year over year 8.5 to 8.9% 10 to 12%
Scheduled ASMs – year over year 8.5 to 8.9% 10 to 12%
Ownership (D/A + AC Rent) (millions) $155 to $60 $180 to $190
Airline operating expense ex fuel (CASM ex) – YOY (3.9) to (3.3)% (2) to 0%
EPS $14.25 to $14.75 $16.50 to $19.00
1 Interest expense excludes impact of capitalized interest; 2 Includes approximately $150m of spend expected to be financed by TPG
16
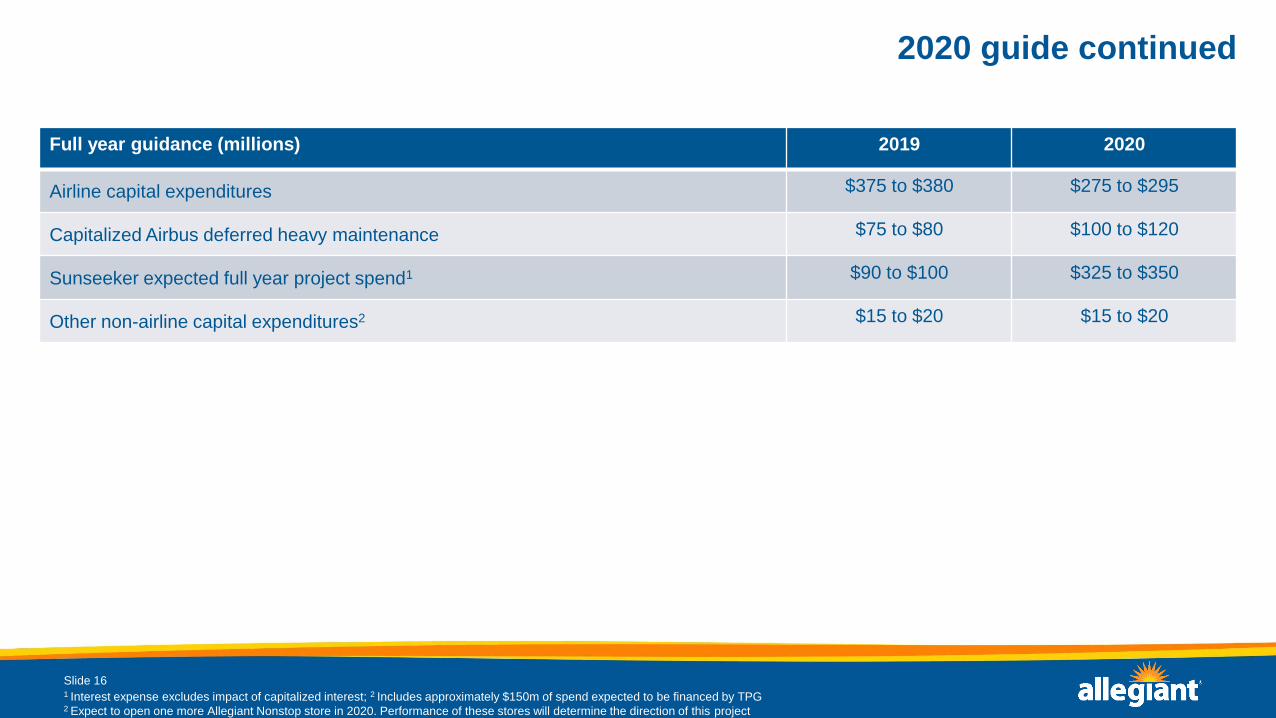
2020 guide continued
Slide 16
Full year guidance (millions) 2019 2020
Airline capital expenditures $375 to $380 $275 to $295
Capitalized Airbus deferred heavy maintenance $75 to $80 $100 to $120
Sunseeker expected full year project spend1 $90 to $100 $325 to $350
Other non-airline capital expenditures2 $15 to $20 $15 to $20
1 Interest expense excludes impact of capitalized interest; 2 Includes approximately $150m of spend expected to be financed by TPG2 Expect to open one more Allegiant Nonstop store in 2020. Performance of these stores will determine the direction of this project
17
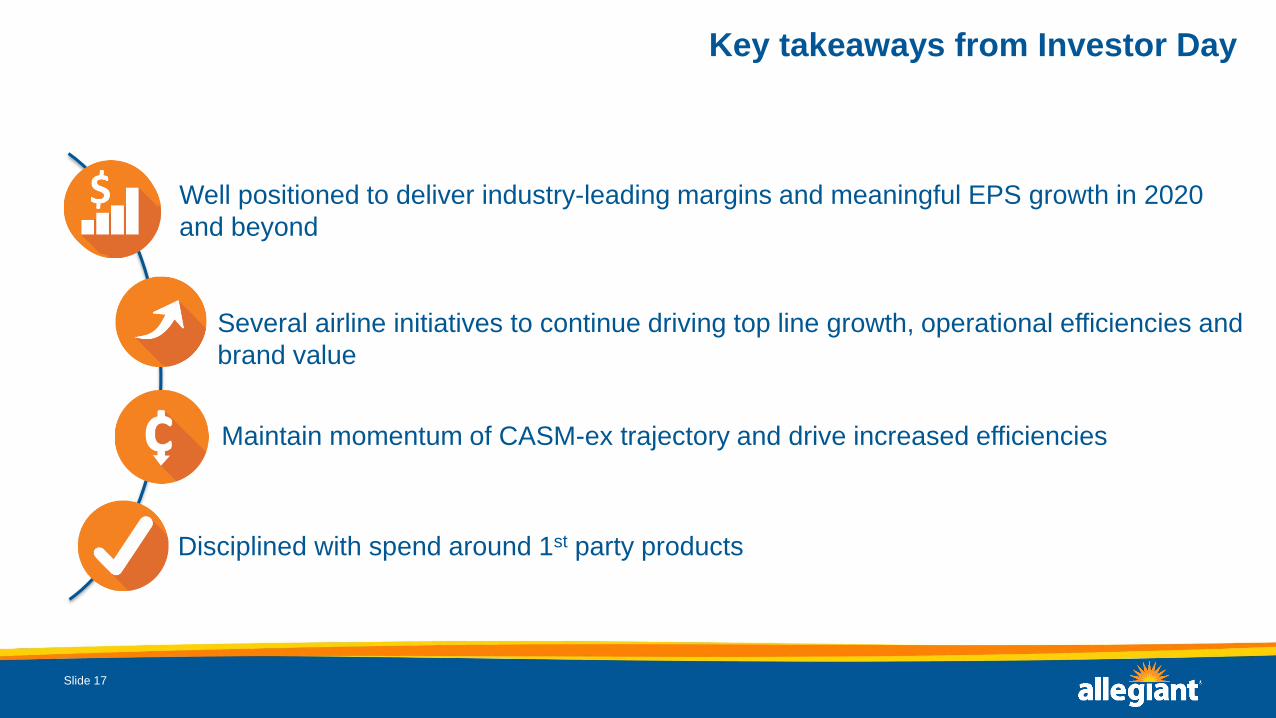
Key takeaways from Investor Day
Slide 17
Disciplined with spend around 1st party products
C Maintain momentum of CASM-ex trajectory and drive increased efficiencies
Several airline initiatives to continue driving top line growth, operational efficiencies and
brand value
Well positioned to deliver industry-leading margins and meaningful EPS growth in 2020
and beyond
18
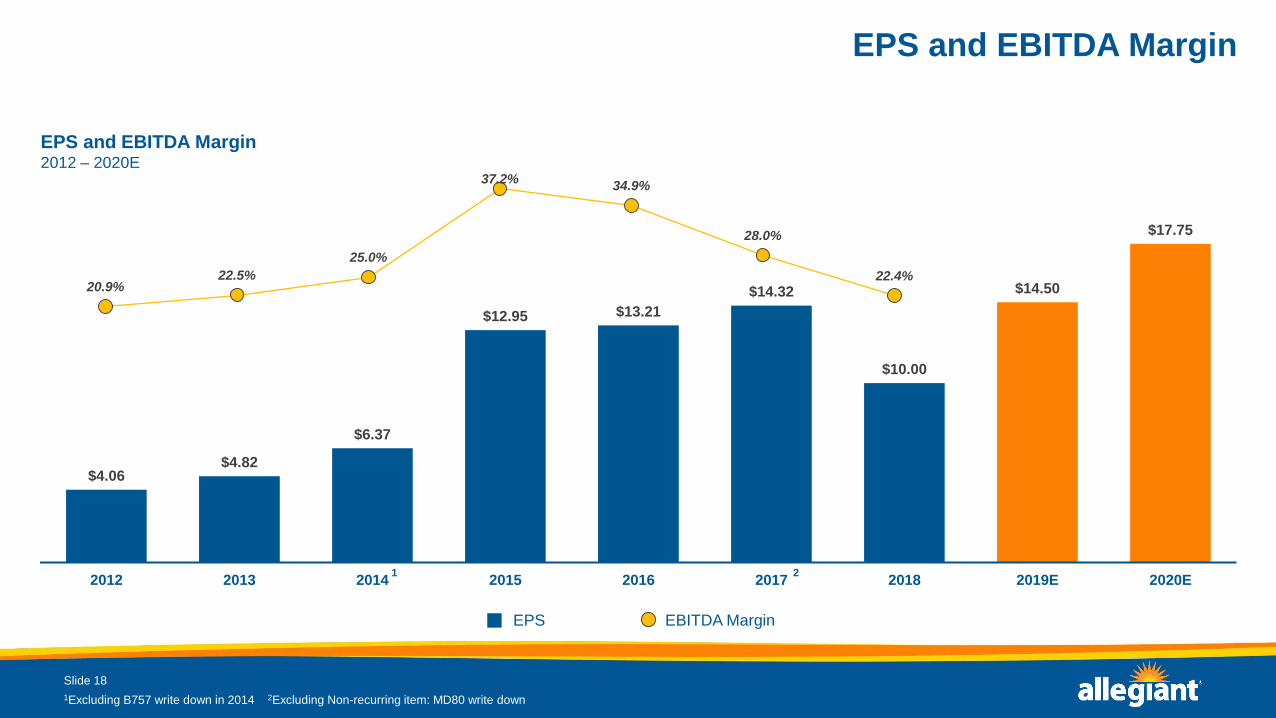
$4.06$4.82
$6.37
$12.95 $13.21
$14.32
$10.00
$14.50
$17.75
2012 2013 2014 2015 2016 2017 2018 2019E 2020E
20.9%22.5%
25.0%
37.2%34.9%
28.0%
22.4%
EPS and EBITDA Margin
EPS and EBITDA Margin2012 – 2020E
Slide 18
1
1Excluding B757 write down in 2014 2Excluding Non-recurring item: MD80 write down
2
EBITDA MarginEPS