Embed Size (px)
Citation preview

2020
GLOBAL TRENDS IN GIVING REPORT
S P O N S O R E D BY
F U N R A I S E . O R G
P R O D U C E D BY
N P T E C H FO R G O O D . CO M

Table of Contents
3 About the Report
G I V I N G T R E N D S B Y R E G I O N
4 Africa
8 Asia
12 Australia & New Zealand
16 Canada & the United States
20 Europe
24 Latin America & the Caribbean
31 Partners
G L O B A L T R E N D S I N G I V I N G
28 Benchmarks
30 Non-Donors
2

About the ReportThe Global Trends in Giving Report is a biennial research project
that seeks to gain a better understanding of how donors prefer to
give and engage with their favorite causes and charitable organizations.
Sponsored by Funraise and produced by Nonprofit Tech for Good, the
report examines the impact of technology upon individual giving.
Now in its third edition, this year’s report provides giving benchmarks for Africa,
Asia, Australia and New Zealand, Canada and the United States, Europe, and Latin
America and the Caribbean. A global average of the benchmark data is also provided.
The Global Trends in Giving Report is a sister report to the Global NGO Technology Report. The findings from both reports are meant to help NPOs,
NGOs, and charities determine if they are effectively using technology
to inspire philanthropy and achieve their mission and programs.
MethodologyThe 2020 Global Trends in Giving Report
is based upon the survey results of 13,468
donors worldwide. The survey was conducted
and promoted entirely online from March 1
to May 31, 2020. To reach a diverse global
audience, the survey was published in
Arabic, English, French, Italian, Portuguese,
Spanish, and Taiwanese Mandarin.
Due to the methodology used, it’s important to
note that the results only represent the views
of respondents that (1) read Arabic, English,
French, Italian, Portuguese, Spanish, and
Taiwanese Mandarin; (2) have access to the
Internet; and (3) use email and/or social media.
F U N R A I S E . O R G
Funraise provides innovative and friendly
fundraising technology built on a foundation
of nonprofit experience. Our platform
was built for fundraisers by fundraisers,
helping you raise the funds and the fun.
N P T E C H FO R G O O D . CO M
With 50,000+ monthly visitors and more
than one million followers on social networks,
Nonprofit Tech for Good is a leading
online fundraising and social media blog
for nonprofit professionals worldwide.
133Countries
13,468 Donors
3

6%Tunsia
31%South Africa
3%Kenya
6%Ghana
30%Nigeria
Gender
Female 50%
Male 50%
Generation
Gen Z (1998 or after) 6%
Millennial Generation (1981-1997) 50%
Gen X (1965-1980) 26%
Baby Boomers (1946-1964) 17%
Matures (Before 1946) 1%
Giving Level
$100 USD or less 61%
$101-$999 USD 29%
$1,000-$4,999 USD 5%
$5,000-$9,999 USD 2%
$10,000 USD or more 3%
G I V I N G T R E N D S I N
AFRICAAbout the Survey Respondents
Top 10 Causes
Children & youth 22%
Community development 11%
Hunger & homelessness 11%
Education 9%
Animals & wildlife 8%
Health & wellness 8%
Arts & culture 6%
Faith & spirituality 5%
Human & social services 4%
Women & girls 4%
Top 5 Countries
Top 5 Key Findings
130% of donors in Africa prefer to give online with a credit or debit card, up from 25% in 2018. 24% prefer to give cash and 9% prefer to give via mobile money—both rates are higher than any other region.
2#GivingTuesday is growing in Africa. 12% of donors gave on #GivingTuesday 2019, up from 9% in 2017. Crowdfunding in Africa remains popular at 51%.
380% of donors in Africa volunteer with NGOs—the highest rate in the world. Of those, 82% also donate to the NGOs that they volunteer for.
4Social media has a significant impact on giving. 37% say social media is the communication tool most likely to inspire giving and 36% say it is also the tool most likely to inspire repeat donations.
5WhatsApp has the most impact upon giving at 35%, higher than any other region. YouTube has the least impact at 2%, lower than any other region.
234Donors
31Countries

30%of donors in Africa prefer to give online with a credit or debit card.
OTHER PREFERRED METHODS OF GIVING
Bank/wire transfer 24%
Cash 24%
Mobile Money 9%
Direct/Post mail 5%
PayPal 3%
Text-to-give 3%
Digital Wallet 2%
51% donate to crowdfunding
campaigns that benefit NGOs.
63%have donated to an
NGO in response to the COVID-19 pandemic.
33% create online peer-to-peer
fundraising campaigns to benefit NGOs.
24% donate to NGOs located outside
of their country of residence.
62%are enrolled in a recurring giving program.
12% are enrolled in a workplace
giving program.
12% donated on
#GivingTuesday 2019.
57% Monthly
25% Annually
10% Quarterly
8% Weekly
GIVING TRENDS IN AFRICA
5

80%of donors in Africa
volunteer with NGOs.
55%attend fundraising events,
such as galas or luncheons.
82%donate to the NGOs
they volunteer for.
22%participate in endurance
fundraising events, such as marathons and bike-a-thons.
Donors in Africa also donate to NGOs through:
An online store that benefits an NGO 56%
Online auctions 22%
Online raffles or sweepstakes
14%
Giving through gaming 10%
Smart speaker giving 6%
Fundraising concept most likely to use in the future:
A mobile app that allows two-tap giving that earns badges and redeemable points 53%
Facial recognition giving through a smartphone 23%
Point-and-tap giving through an internet-connected TV 10%
Swipe-giving through a digital billboard on public transport 8%
Voice-command giving through a smart speaker or car radio 6%
77% vote regularly in local and national elections.
79% sign online petitions.
21% participate in marches and protests.
10% donate to political campaigns.
99% of donors say NGOs are essential for creating social change.
91% say NGOs are ethical and can be trusted.
88% donate food and goods to NGOs.
GIVING TRENDS IN AFRICA
6

37%of donors say that social media is the communication tool that most inspires them to give.
Email 20%
Website 11%
Phone call 8%
TV ad 7%
Text message 5%
Messaging app 4%
Print 4%
Radio ad 3%
Billboard 1%
Of those inspired to give by social media:
42% say Facebook has the most impact.
OTHER IMPACTFUL SOCIAL MEDIA SITES
WhatsApp 25%
Instagram 15%
Twitter 11%
LinkedIn 5%
YouTube 2%
Communication method most likely to inspire repeat donations:
Regular social media communication 36%
Regular email communication 33%
Regular print communication 13%
A personal phone call 12%
A handwritten note 6%
17% donate through
Facebook Fundraising Tools.
Of those,
100% say they are likely to
give through Facebook Fundraising Tools again.
86% say that NGOs effectively
express gratitude for their donations.
93% of donors say that NGOs must
invest financial resources in digital communications
in order to stay relevant.
89% say that NGOs effectively
keep them updated on their programs.
DOWNLOAD & COMPARE
GIVING TRENDS IN AFRICA
Africa NGO Technology Data Africa Giving Trends Data
FOLLOW
Please share commentary and resources about the data for Africa using #GivingTrends20.
7
Of those inspired to give by email:
32% say NGOs should email updates monthly.
Weekly 20%
Quarterly 18%
Daily 17%
Twice monthly 9%
Twice weekly 4%

26%Singapore
11%Taiwan
16%Malaysia
8%Pakistan
35%Israel
Gender
Female 61%
Male 38%
Non-binary 1%
Generation
Gen Z (1998 or after) 5%
Millennial Generation (1981-1997) 41%
Gen X (1965-1980) 30%
Baby Boomers (1946-1964) 21%
Matures (Before 1946) 3%
Giving Level
$100 USD or less 37%
$101-$999 USD 39%
$1,000-$4,999 USD 16%
$5,000-$9,999 USD 5%
$10,000 USD or more 3%
G I V I N G T R E N D S I N
ASIAAbout the Survey Respondents
Top 10 Causes
Children & youth 14%
Animals & wildlife 11%
Hunger & homelessness 11%
Health & wellness 10%
Human & social services 10%
Disability rights 6%
Education 6%
Environment & conservation 6%
Faith & spirituality 6%
Human & civil rights 3%
Top 5 Countries
Top 5 Key Findings
152% of donors in Asia prefer to give online with a credit or debit card, up from 51% in 2018. 13% prefer bank/wire transfer, up from 9% in 2018. 8% prefer PayPal, down from 13% in 2018.
249% are enrolled in a recurring giving program, up from 41% in 2018. 81% prefer to give monthly, 13% annually, 4% quarterly, and 2% weekly.
361% donate to crowdfunding campaigns that benefit NGOs—the highest rate in the world. 10% create peer-to-peer fundraising campaigns to benefit NGOs—3% below the global average.
416% of donors in Asia are enrolled in a workplace giving program—the highest rate in the world. 26% gave on #GivingTuesday 2019, up from 10% in 2017—the largest increase in the world.
5At 20%, donors in Asia are the least likely to attend fundraising events, such as a gala or luncheon. Only 13% participate in endurance fundraising events, the second-lowest rate in the world.
1,998Donors
28Countries

52%of donors in Asia prefer to give online with a credit or debit card.
OTHER PREFERRED METHODS OF GIVING
Bank/wire transfer 13%
Cash 13%
PayPal 8%
Direct/Post mail 6%
Digital wallet 5%
Mobile money 2%
Text-to-give 1%
61% donate to crowdfunding
campaigns that benefit NGOs.
47%have donated to an
NGO in response to the COVID-19 pandemic.
10% create online peer-to-peer
fundraising campaigns to benefit NGOs.
32% donate to NGOs located outside
of their country of residence.
49%are enrolled in a recurring giving program.
16% are enrolled in a workplace
giving program.
26% donated on
#GivingTuesday 2019.
81% Monthly
13% Annually
4% Quarterly
2% Weekly
GIVING TRENDS IN ASIA
9

56%of donors in Asia
volunteer with NGOs.
20%attend fundraising events,
such as galas or luncheons.
65%donate to the NGOs
they volunteer for.
13%participate in endurance
fundraising events, such as marathons and bike-a-thons.
Donors in Asia also donate to NGOs through:
An online store that benefits an NGO 62%
Online auctions 28%
Online raffles or sweepstakes
15%
Giving through gaming 5%
Smart speaker giving 1%
Fundraising concept most likely to use in the future:
A mobile app that allows two-tap giving that earns badges and redeemable points 50%
Facial recognition giving through a smartphone 20%
Swipe-giving through a digital billboard on public transport 15%
Point-and-tap giving through an internet-connected TV 9%
Voice-command giving through a smart speaker or car radio 6%
83% vote regularly in local and national elections.
66% sign online petitions.
20% participate in marches and protests.
12% donate to political campaigns.
97% of donors in Asia say NGOs are essential for creating social change.
88% say NGOs are ethical and can be trusted.
7% donate stock or mutual funds
to NGOs and 4% donate to Donor-Advised Funds (DAFs).
68% donate food and goods to NGOs.
GIVING TRENDS IN ASIA
10

32%of donors in Asia say that social media is the communication tool that most inspires them to give.
Email 22%
Website 20%
Print 7%
Phone call 6%
TV ad 5%
Messaging app 3%
Text message 3%
Radio ad 1%
Billboard 1%
Of those inspired to give by social media:
47% say Facebook has the most impact.
OTHER IMPACTFUL SOCIAL MEDIA SITES
Instagram 18%
WhatsApp 15%
YouTube 8%
Twitter 7%
LinkedIn 3%
Line 2%
Of those inspired to give by email:
36% say NGOs should email updates quarterly.
Monthly 33%
Twice monthly 12%
Weekly 11%
Daily 4%
Twice weekly 4%
Communication method most likely to inspire repeat donations:
Regular email communication 41%
Regular social media communication 31%
Regular print communication 11%
A personal phone call 9%
A handwritten note 8%
11% donate through
Facebook Fundraising Tools. Of those,
86% say they are likely to give through Facebook Fundraising Tools again.
9% donate through
Instagram Fundraising Tools. Of those,
83% say they are likely to give through Instagram Fundraising Tools again.
85% say that NGOs effectively
express gratitude for their donations.
93% of donors in Asia say that NGOs must invest financial resources
in digital communications in order to stay relevant.
82% say that NGOs effectively
keep them updated on their programs.
GIVING TRENDS IN ASIA
DOWNLOAD & COMPARE
Asia Giving Trends Data
FOLLOW
Please share commentary and resources about the data for Africa using #GivingTrends20.
Asia NGO Technology Data
11

6%New Zealand
94%Australia
Gender
Female 74%
Male 25%
Non-binary 1%
Generation
Gen Z (1998 or after) 1%
Millennial Generation (1981-1997) 25%
Gen X (1965-1980) 38%
Baby Boomers (1946-1964) 34%
Matures (Before 1946) 2%
Giving Level
$100 USD or less 15%
$101-$999 USD 44%
$1,000-$4,999 USD 27%
$5,000-$9,999 USD 5%
$10,000 USD or more 9%
G I V I N G T R E N D S I N
AUSTRALIA & NEW ZEALANDAbout the Survey Respondents Top 10 Causes
Children & youth 16%
Animals & wildlife 12%
Health & wellness 12%
Environment & conservation 8%
Human & social services 7%
International development & relief 7%
Hunger & homelessness 6%
Women & girls 6%
Arts & culture 5%
Education 5%
Top 5 Key Findings
164% of donors in Australia & New Zealand prefer to give online with a credit or debit card—the highest rate in the world and up from 51% in 2018.
233% of donors say that email is the communication tool that most inspires them to give, up from 30% in 2018. 48% say email is also the most likely to inspire repeat donations. Both rates are higher than any other region.
3Donors have embraced Facebook Fundraising Tools. In 2018, only 7% donated directly to an NPO using Facebook Fundraising Tools. In 2019, the number grew to 48%.
4Only 7% gave on #GivingTuesday 2019—10% less than the global average and likely a result of NPOs in Australia & New Zealand also having the lowest adoption rate of #Giving Tuesday as a fundraising strategy.
5Donors in Australia & New Zealand are the most likely to adopt new fundraising technology. 20% say they would use facial recognition to give, 18% an internet-connected TV, and 18% swipe-giving through digital billboards.
262Donors

64%of donors prefer to give online with a credit or debit card.
OTHER PREFERRED METHODS OF GIVING
PayPal 15%
Bank/wire transfer 10%
Direct/Post mail 5%
Cash 4%
Digital wallet 2%
52% donate to crowdfunding
campaigns that benefit NPOs.
44%have donated to an
NPO in response to the COVID-19 pandemic.
21% create online peer-to-peer
fundraising campaigns to benefit NPOs.
31% donate to NPOs located outside
of their country of residence.
51%are enrolled in a recurring giving program.
11% are enrolled in a workplace
giving program.
7% donated on
#GivingTuesday 2019.
80% Monthly
11% Annually
2% Quarterly
7% Weekly
GIVING TRENDS IN AUSTRALIA & NEW ZEALAND
13

GIVING TRENDS IN AUSTRALIA & NEW ZEALAND
14
75%of donors in Australia and New Zealand volunteer with NPOs.
69%attend fundraising events,
such as galas or luncheons.
73%donate to the NPOs
they volunteer for.
23%participate in endurance
fundraising events, such as marathons and bike-a-thons.
Donors also donate to NPOs through:
An online store that benefits an NPO 58%
Online raffles or sweepstakes
45%
Online auctions 26%
Giving through gaming 5%
Fundraising concept most likely to use in the future:
A mobile app that allows two-tap giving that earns badges and redeemable points 44%
Facial recognition giving through a smartphone 20%
Point-and-tap giving through an internet-connected TV 18%
Swipe-giving through a digital billboard on public transport 14%
Voice-command giving through a smart speaker or car radio 4%
98% vote regularly in local and national elections.
77% sign online petitions.
23% participate in marches and protests.
11% donate to political campaigns.
98% of donors say NPOs are essential for creating social change.
92% say NPOs are ethical and can be trusted.
3% donate stock or mutual funds
to NPOs and 5% donate to Donor-Advised Funds (DAFs).
66% donate food and goods to NPOs.

33%of donors say that email is the communication tool that most inspires them to give.
Social media 30%
Website 15%
Print 9%
TV ad 5%
Phone call 4%
Radio ad 2%
Billboard 1%
Text message 1%
Of those inspired to give by social media:
48% say Facebook has the most impact.
OTHER IMPACTFUL SOCIAL MEDIA SITES
Instagram 28%
LinkedIn 17%
Twitter 3%
YouTube 3%
WhatsApp 1%
Of those inspired to give by email:
37% say NPOs should email updates monthly.
Quarterly 33%
Weekly 14%
Twice monthly 9%
Daily 4%
Twice weekly 3%
Communication method most likely to inspire repeat donations:
Regular email communication 48%
Regular social media communication 28%
Regular print communication 9%
A handwritten note 9%
A personal phone call 6%
48% donate through
Facebook Fundraising Tools. Of those,
85% say they are likely to give through Facebook Fundraising Tools again.
10% donate through
Instagram Fundraising Tools. Of those,
100% say they are likely to give through Instagram Fundraising Tools again.
88% say that NPOs effectively
express gratitude for their donations.
97% of donors say that NPOs must
invest financial resources in digital communications
in order to stay relevant.
87% say that NPOs effectively
keep them updated on their programs.
GIVING TRENDS IN AUSTRALIA & NEW ZEALAND
DOWNLOAD & COMPARE
FOLLOW
Please share commentary and resources about the data for Africa using #GivingTrends20.
Australia & New Zealand NGO Technology Data
Australia & New Zealand Giving Trends Data
15

11%United States
89%Canada
Gender
Female 67%
Male 32%
Non-binary 1%
Generation
Gen Z (1998 or after) 1%
Millennial Generation (1981-1997) 12%
Gen X (1965-1980) 19%
Baby Boomers (1946-1964) 51%
Matures (Before 1946) 17%
Giving Level
$100 USD or less 9%
$101-$999 USD 38%
$1,000-$4,999 USD 35%
$5,000-$9,999 USD 11%
$10,000 USD or more 7%
G I V I N G T R E N D S I N
CANADA & THE UNITED STATESAbout the Survey Respondents
7,004Donors
Top 10 Causes
Hunger & homelessness 15%
Health & wellness 13%
Faith & spirituality 12%
Animals & wildlife 10%
Children & youth 9%
Environment & conservation 7%
Human & social services 7%
International development 7%
Arts & culture 6%
Women & girls 4%
Top 5 Key Findings
157% of donors in Canada & the United States are enrolled in a recurring giving program, up from 46% in 2018. 94% prefer to give monthly, 3% weekly, 2% annually, and 1% quarterly.
2Email continues to grow in its power to impact donors in Canada & the United States. 33% say that email is the communication tool that most inspires them to give, up from 31% in 2018.
3Only 18% say that social media is the most inspiring, down from 25% in 2018. However, Facebook and Instagram Fundraising Tools are increasingly powerful. 40% have donated through Facebook, 12% through Instagram.
434% of donors in Canada & the United States give through crowdfunding and 10% create peer-to-peer-fundraising campaigns, down from 36% and 16%, respectively.
533% donate to NPOs located outside of their country of residence. The top 5 countries are Australia (8%), India (7%), Israel (6%), United Kingdom (6%), and Kenya (5%).

63%of donors prefer to give online with a credit or debit card.
OTHER PREFERRED METHODS OF GIVING
Direct/Post mail 16%
PayPal 10%
Bank/wire transfer 5%
Cash 4%
Digital wallet 1%
Text-to-give 1%
34% donate to crowdfunding
campaigns that benefit NPOs.
62%have donated to an
NPO in response to the COVID-19 pandemic.
10% create online peer-to-peer
fundraising campaigns to benefit NPOs.
33% donate to NPOs located outside
of their country of residence.
57%are enrolled in a recurring giving program.
9% are enrolled in a workplace
giving program.
26% donated on
#GivingTuesday 2019.
94% Monthly
3% Annually
2% Quarterly
1% Weekly
GIVING TRENDS IN CANADA & THE UNITED STATES
17

GIVING TRENDS IN CANADA & THE UNITED STATES
18
68%of donors in Canada
and the United States volunteer with NPOs.
44%attend fundraising events,
such as galas or luncheons.
76%donate to the NPOs
they volunteer for.
15%participate in endurance
fundraising events, such as marathons and bike-a-thons.
Donors also donate to NPOs through:
Online raffles or sweepstakes
47%
An online store that benefits an NPO
45%
Online auctions 24%
Giving through gaming 8%
Fundraising concept most likely to use in the future:
A mobile app that allows two-tap giving that earns badges and redeemable points 50%
Facial recognition giving through a smartphone 18%
Point-and-tap giving through an internet-connected TV 18%
Swipe-giving through a digital billboard on public transport 7%
Voice-command giving through a smart speaker or car radio 7%
97% vote regularly in local and national elections.
65% sign online petitions.
36% participate in marches and protests.
16% donate to political campaigns.
96% of donors say NPOs are essential for creating social change.
91% say NPOs are ethical and can be trusted.
5% donate stock or mutual funds
to NPOs and 4% donate to Donor-Advised Funds (DAFs).
81% donate food and goods to NPOs.

33%of donors say that email is the communication tool that most inspires them to give.
Print 19%
Social media 18%
Website 16%
TV ad 7%
Radio ad 4%
Phone call 2%
Text message 1%
Of those inspired to give by social media:
56% say Facebook has the most impact.
OTHER IMPACTFUL SOCIAL MEDIA SITES
Instagram 21%
Twitter 13%
YouTube 5%
LinkedIn 4%
WhatsApp 1%
Of those inspired to give by email:
45% say NPOs should email updates quarterly.
Monthly 29%
Weekly 10%
Twice monthly 9%
Daily 4%
Twice weekly 3%
Communication method most likely to inspire repeat donations:
Regular email communication 48%
Regular social media communication 18%
Regular print communication 16%
A handwritten note 12%
A personal phone call 6%
40% donate through
Facebook Fundraising Tools. Of those,
88% say they are likely to give through Facebook Fundraising Tools again.
12% donate through
Instagram Fundraising Tools. Of those,
93% say they are likely to give through Instagram Fundraising Tools again.
94% say that NPOs effectively
express gratitude for their donations.
92% of donors say that NPOs must
invest financial resources in digital communications
in order to stay relevant.
93% say that NPOs effectively
keep them updated on their programs.
GIVING TRENDS IN CANADA & THE UNITED STATES
DOWNLOAD & COMPARE
FOLLOW
Please share commentary and resources about the data for Africa using #GivingTrends20.
Canada & the United States NGO Technology Data
Canada & the United States Giving Trends Data
19

47%Italy
6%Ireland
9%North Macedonia
7%France
15%Romania
Gender
Female 66%
Male 33%
Non-binary 1%
Generation
Gen Z (1998 or after) 2%
Millennial Generation (1981-1997) 39%
Gen X (1965-1980) 35%
Baby Boomers (1946-1964) 22%
Matures (Before 1946) 2%
Giving Level
$100 USD or less 41%
$101-$999 USD 49%
$1,000-$4,999 USD 8%
$5,000-$9,999 USD 1%
$10,000 USD or more 1%
G I V I N G T R E N D S I N
EUROPEAbout the Survey Respondents
Top 10 Causes
Children & youth 15%
Health & wellness 13%
Hunger & homelessness 8%
International development & relief 8%
Human & civil rights 7%
Human & social services 7%
Animals & wildlife 6%
Environment & conservation 6%
Education 5%
Arts & culture 4%
Top 5 Countries
Top 5 Key Findings
134% of donors in Europe say that social media is the most inspiring communication tool. 44% have donated through Facebook Fundraising Tools, up from 16% in 2018. 12% have donated through Instagram Fundraising Tools.
2Giving by bank/wire transfer (20%), PayPal (11%), and cash (10%) remained the same from 2018 to 2019. Text-to-give grew from 4% to 9%, credit/debit card giving dropped from 46% to 43%, and direct mail/post dropped from 5% to 3%.
368% give by shopping at online stores that benefit NPOs—the highest rate in the world and 12% above the global average of 56%.
4Donors in Europe are less likely to give through online auctions (19%), online raffles or sweepstakes (17%), and gaming (6%)—compared to the global averages of 32%, 22%, and 8%, respectively.
5Donors in Europe are the least likely to participate in #GivingTuesday. Only 6% gave in 2019, 39% chose not to, and 55% have never heard of #GivingTuesday.
2,445Donors
35Countries

43%of donors prefer to give online with a credit or debit card.
OTHER PREFERRED METHODS OF GIVING
Bank/wire transfer 20%
PayPal 11%
Cash 10%
Text-to-give 9%
Direct/Post mail 3%
Mobile money 3%
Digital wallet 1%
57% donate to crowdfunding
campaigns that benefit NPOs.
60%have donated to an
NPO in response to the COVID-19 pandemic.
17% create online peer-to-peer
fundraising campaigns to benefit NPOs.
30% donate to NPOs located outside
of their country of residence.
43%are enrolled in a recurring giving program.
7% are enrolled in a workplace
giving program.
6% donated on
#GivingTuesday 2019.
72% Monthly
22% Annually
5% Quarterly
1% Weekly
GIVING TRENDS IN EUROPE
21

GIVING TRENDS IN EUROPE
22
64%of donors in Europe
volunteer with NPOs.
43%attend fundraising events,
such as galas or luncheons.
74%donate to the NPOs
they volunteer for.
20%participate in endurance
fundraising events, such as marathons and bike-a-thons.
Donors in Europe also donate to NPOs through:
An online store that benefits an NPO 68%
Online auctions 19%
Online raffles or sweepstakes
17%
Giving through gaming 6%
Smart speaker giving 1%
Fundraising concept most likely to use in the future:
A mobile app that allows two-tap giving that earns badges and redeemable points 48%
Swipe-giving through a digital billboard on public transport 17%
Facial recognition giving through a smartphone 16%
Point-and-tap giving through an internet-connected TV 11%
Voice-command giving through a smart speaker or car radio 8%
94% vote regularly in local and national elections.
80% sign online petitions.
41% participate in marches and protests.
10% donate to political campaigns.
98% of donors say NPOs are essential for creating social change.
91% say NPOs are ethical and can be trusted.
10% donate stock or mutual funds
to NPOs and 3% donate to Donor-Advised Funds (DAFs).
78% donate food and goods to NPOs.

34%of donors say that social media is the communication tool that most inspires them to give.
Website 20%
Email 19%
TV ad 9%
Print 7%
Radio ad 4%
Text message 3%
Phone call 2%
Billboard 1%
Messaging app 1%
Of those inspired to give by social media:
55% say Facebook has the most impact.
OTHER IMPACTFUL SOCIAL MEDIA SITES
Instagram 19%
Twitter 8%
LinkedIn 7%
WhatsApp 6%
YouTube 5%
Of those inspired to give by email:
42% say NPOs should email updates monthly.
Quarterly 24%
Twice monthly 16%
Weekly 12%
Daily 3%
Twice weekly 3%
Communication method most likely to inspire repeat donations:
Regular email communication 44%
Regular social media communication 32%
Regular print communication 10%
A handwritten note 8%
A personal phone call 6%
44% donate through
Facebook Fundraising Tools. Of those,
89% say they are likely to give through Facebook Fundraising Tools again.
12% donate through
Instagram Fundraising Tools. Of those,
87% say they are likely to give through Instagram Fundraising Tools again.
86% say that NPOs effectively
express gratitude for their donations.
94% of donors say that NPOs must
invest financial resources in digital communications
in order to stay relevant.
87% say that NPOs effectively
keep them updated on their programs.
GIVING TRENDS IN EUROPE
DOWNLOAD & COMPARE
Europe Giving Trends Data
FOLLOW
Please share commentary and resources about the data for Africa using #GivingTrends20.
Europe NGO Technology Data
23

1%Ecuador
2%Dominican
Republic
75%Brazil
2%Barbados
15%Mexico
Gender
Female 78%
Male 21%
Non-binary 1%
Generation
Gen Z (1998 or after) 6%
Millennial Generation (1981-1997) 52%
Gen X (1965-1980) 24%
Baby Boomers (1946-1964) 17%
Matures (Before 1946) 1%
Giving Level
$100 USD or less 69%
$101-$999 USD 26%
$1,000-$4,999 USD 4%
$5,000-$9,999 USD 1%
G I V I N G T R E N D S I N
LATIN AMERICA & THE CARIBBEANAbout the Survey Respondents Top 10 Causes
Children & youth 20%
Hunger & homelessness 16%
Animals & wildlife 12%
Human & social services 10%
Community development 6%
Education 6%
Health & wellness 6%
Environment & conservation 5%
Arts & culture 4%
Disability rights 4%
Top 5 Countries
Top 5 Key Findings
131% of donors in Latin America & the Caribbean prefer to give by bank/wire transfer—19% above the global average and the highest rate in the world. 55% donate to crowdfunding campaigns, up from 45% in 2018.
241% say that social media is the communication tool that most inspires them to give—the highest rate in the world. 40% say social media is the tool most likely to inspire repeat donations.
3Latin America & the Caribbean is the only region where donors say Instagram is the social media that has the most impact on their giving. The top three are Instagram (43%), Facebook (26%), and WhatsApp (14%).
472% have donated to an NPO in response to the COVID-19 pandemic—the highest rate in the world. 90% donate foods and goods—also the highest rate in the world.
5Donors in Latin America & the Caribbean embrace online advocacy. 84% sign online petitions—the highest rate in the world. 99% say that NPOs are essential for creating social change.
1,485Donors
25Countries

44%of donors prefer to give online with a credit or debit card.
OTHER PREFERRED METHODS OF GIVING
Bank/wire transfer 31%
Cash 13%
PayPal 6%
Digital wallet 3%
Direct/Post mail 2%
Mobile money 1%
55% donate to crowdfunding
campaigns that benefit NPOs.
72%have donated to an
NPO in response to the COVID-19 pandemic.
17% create online peer-to-peer
fundraising campaigns to benefit NPOs.
15% donate to NPOs located outside
of their country of residence.
42%are enrolled in a recurring giving program.
8% are enrolled in a workplace
giving program.
9% donated on
#GivingTuesday 2019.
87% Monthly
7% Annually
4% Quarterly
2% Weekly
GIVING TRENDS IN LATIN AMERICA & THE CARIBBEAN
25

GIVING TRENDS IN LATIN AMERICA & THE CARIBBEAN
26
70%of donors in Latin America & the Caribbean volunteer with NPOs.
32%attend fundraising events,
such as galas or luncheons.
65%donate to the NPOs
they volunteer for.
11%participate in endurance
fundraising events, such as marathons and bike-a-thons.
Donors also donate to NPOs through:
An online store that benefits an NPO 66%
Online raffles or sweepstakes
29%
Giving through gaming 10%
Online auctions 7%
Smart speaker giving 1%
Fundraising concept most likely to use in the future:
A mobile app that allows two-tap giving that earns badges and redeemable points 49%
Point-and-tap giving through an internet-connected TV 19%
Facial recognition giving through a smartphone 15%
Swipe-giving through a digital billboard on public transport 13%
Voice-command giving through a smart speaker or car radio 4%
94% vote regularly in local and national elections.
84% sign online petitions.
33% participate in marches and protests.
5% donate to political campaigns.
99% of donors say NPOs are essential for creating social change.
89% say NPOs are ethical and can be trusted.
90% donate food and goods to NPOs.
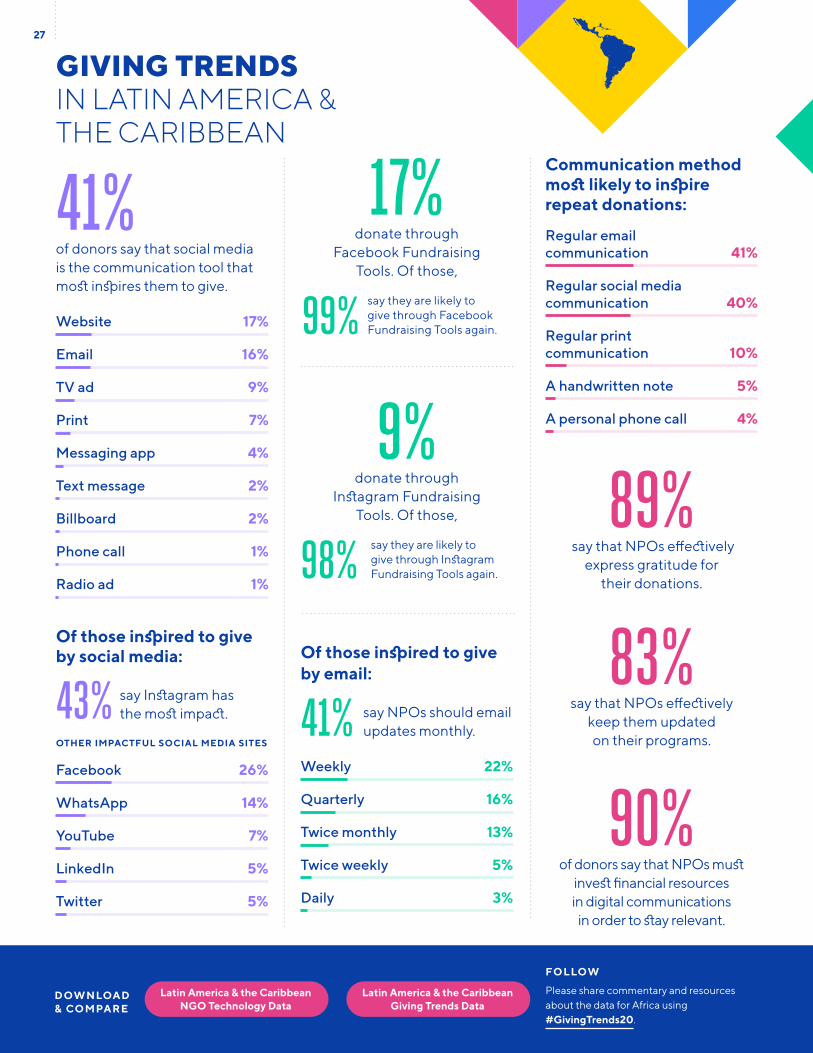
41%of donors say that social media is the communication tool that most inspires them to give.
Website 17%
Email 16%
TV ad 9%
Print 7%
Messaging app 4%
Text message 2%
Billboard 2%
Phone call 1%
Radio ad 1%
Of those inspired to give by social media:
43% say Instagram has the most impact.
OTHER IMPACTFUL SOCIAL MEDIA SITES
Facebook 26%
WhatsApp 14%
YouTube 7%
LinkedIn 5%
Twitter 5%
Of those inspired to give by email:
41% say NPOs should email updates monthly.
Weekly 22%
Quarterly 16%
Twice monthly 13%
Twice weekly 5%
Daily 3%
Communication method most likely to inspire repeat donations:
Regular email communication 41%
Regular social media communication 40%
Regular print communication 10%
A handwritten note 5%
A personal phone call 4%
17% donate through
Facebook Fundraising Tools. Of those,
99% say they are likely to give through Facebook Fundraising Tools again.
9% donate through
Instagram Fundraising Tools. Of those,
98% say they are likely to give through Instagram Fundraising Tools again.
89% say that NPOs effectively
express gratitude for their donations.
90% of donors say that NPOs must
invest financial resources in digital communications
in order to stay relevant.
83% say that NPOs effectively
keep them updated on their programs.
GIVING TRENDS IN LATIN AMERICA & THE CARIBBEAN
DOWNLOAD & COMPARE
FOLLOW
Please share commentary and resources about the data for Africa using #GivingTrends20.
Latin America & the Caribbean NGO Technology Data
Latin America & the Caribbean Giving Trends Data
27

Global Trends in Giving BenchmarksAbout the Survey RespondentsTop 5 Countries
13,468 Donors
6%United States
5%Isreal
9%Italy
8%Brazil
46%Canada
The top 10 causes supported by donors worldwide: hunger and homelessness (13%), children and youth (12%), health and wellness (12%), animals and wildlife (10%), faith and spirituality (8%), human and social services (8%), environment and conservation (6%), arts and culture (5%), international development and relief (5%), and education (4%).
55% of donors worldwide prefer to give online with a credit or debit card. 12% prefer to give by bank/wire
transfer, 10% by direct/post mail, 10% via PayPal, 8% in cash, 2% via digital wallet, 2% by text-to-give, and 1% by mobile money.
51% are enrolled in a recurring giving program. Of those, 87% give monthly, 8% annually, 3% weekly, and 2% quarterly.
45% donate to crowdfunding campaigns that benefit NPOs.
13% create online peer-to-peer fundraising campaigns to benefit NPOs.
9% are enrolled in a workplace giving program.
60% have donated to an NPO in response to the COVID-19 pandemic.
133Countries
Giving Level
$100 USD or less 27%
$101-$999 USD 39%
$1,000-$4,999 USD 23%
$5,000-$9,999 USD 7%
$10,000 USD or more 4%
Gender
Female 67%
Male 32%
Non-binary 1%
Generation
Gen Z (1998 or after) 2%
Millennial Generation (1981-1997) 26%
Gen X (1965-1980) 25%
Baby Boomers (1946-1964) 37%
Matures (Before 1946) 10%
28

30% donate to NPOs located outside of their country of residence. The top five
countries donated to are the United States (24%), Canada (9%), Australia (5%), the United Kingdom (4%), and India (3%).
17% donated on #GivingTuesday 2019.
66% of donors worldwide volunteer with NPOs. Of those, 73% donate to the NPOs
they volunteer for.
40% attend fundraising events, such as galas or luncheons.
16% participate in endurance fundraising events, such as marathons and bike-a-thons.
Donors worldwide also donate to NPOs through the following methods: an online store that benefits an NPO (56%), online raffle or sweepstakes (32%), online auction (22%), giving through gaming (8%), and smart speaker giving (1%).
Fundraising concept most likely to use in the future: a mobile app that allows two-tap giving that earns badges and redeemable points (49%), facial recognition giving through a smartphone (18%), point-and-tap giving through an internet-connected TV (15%), swipe-giving through a digital billboard on public transport (12%), and voice-command giving through a smart speaker or car radio (6%).
8% donate stock or mutual funds to NPOs and 4% donate to Donor-Advised Funds (DAFs).
79% donate food and goods to NPOs.
94% vote regularly in local and national elections. 71% sign online petitions, 23%
donate to political campaigns, and 23% participate in marches and protests.
96% of donors worldwide say that NPOs are essential for creating social change and
90% say NPOs are ethical and can be trusted.
26% of donors worldwide say that email is the communication tool that most inspires
them to give. 25% say social media, 17% website, 13% print, 8% TV ad, 4% phone call, 3% radio ad, 2% text message, 1% billboard, and 1% messaging app
Of those inspired to give by email, 39% say NPOs should email updates quarterly. 32% say monthly, 11% twice monthly, 11% weekly, 4% daily, and 3% twice weekly.
Of those inspired to give by social media, 48% say Facebook has the most impact. 24% say Instagram, 9% Twitter, 8% WhatsApp, 6% YouTube, and 5% LinkedIn.
32% have donated through Facebook Fundraising Tools. Of those, 89% said they
are likely to give through Facebook Fundraising Tools again.
10% have donated through Instagram Fundraising Tools. Of those, 93% said they
are likely to give through Instagram Fundraising Tools again.
Communication method most likely to inspire repeat donations: regular email communication (45%), regular social media communication (25%), regular print communication (13%), a handwritten note (10%), and a personal phone call (7%).
90% say that NPOs effectively express gratitude for their donations.
89% say that NPOs effectively keep them updated on their programs.
92% of donors worldwide say that NPOs must invest financial resources in digital
communications in order to stay relevant.
29

42%of non-donors worldwide
say the primary reason they do not give money to NPOs is because they do not have
the financial resources.
OTHER REASONS FOR NOT GIVING MONEY
Volunteer my time in lieu of making a donation 22%
Donate food or goods in lieu of making a donation 18%
Don’t trust organizations to spend their money well 9%
Prefer to spend their money on their family and friends 7%
Don’t believe that NPOs make a positive difference 2%
52% of non-donors say it is unlikely
they will give money to an NPO within the next 12 months.
70%donate food and goods to NPOs.
22%attend fundraising events,
such as galas or luncheons.
13% participate in endurance
fundraising events, such as marathons and bike-a-thons.
Global Trends in Giving Non-donors
89Countries
1,817 Non-
Donors
30
85% vote regularly in local and national elections.
70% sign online petitions.
29% participate in marches and protests.
4% donate to political campaigns.

31
Our Partnership ModelOur partnership model is simple and innovative: in exchange for promoting the Global Trends
in Giving Survey to donors in their country, our partners receive the anonymized survey data
for their country. By crowdsourcing our research, we’re able to increase the participation
of donors throughout the globe thus providing a more accurate understanding of how
they prefer to give and engage with their favorite causes and charitable organizations.
MEXICO DOMINICAN REPUBLIC ROMANIA TAIWAN
FRANCE MEXICO UNITED KINGDOM IRELAND
CANADA TUNISIA
SOUTH AFRICA CANADA BARBADOSBRAZIL

32
BRAZIL NIGERIA AUSTRALIA THE NETHERLANDS
NORTH MACEDONIA ISRAEL ITALY MALAYSIA
UNITED STATES PAKISTAN
UNITED STATES
AUSTRALIA
AUSTRALIA
MALAYSIA
GHANA
UNITED STATES BELGIUMSINGAPORE GREECE

Events & Ticketing
Fundraising Websites
Peer-to-Peer Fundraising
Automated Emails
Text Engagement
Supporters
Donations
Donation Tasks
Subscriptions
Wealth Screenings
Reporting
Donation Forms
In-Person Donations
Build your movement.
Smart fundraising tech for forward-thinking nonprofits.
POWER UP AT FUNRAISE .ORG
DONATIONS FUNDRAISING NONPROFIT CRM
33

Thank you to the 13,468 donors and 1,817 non-donors worldwide that participated in the 2020 Global Trends in Giving Survey. Your contribution is greatly appreciated.
D E S I G N BY
B U R E AU FO R G O O D . CO M
S P O N S O R E D BY
F U N R A I S E . O R G
P R O D U C E D BY
N P T E C H FO R G O O D . CO M