Embed Size (px)
Citation preview

2021
Electricity Supply
Plan
P O W E R P L A N N I N G T E C H N I C A L C O M M I T T E E
a power supply outlook with medium term projections for Ghana

2021 ELECTRICITY SUPPLY PLAN FOR GHANA
An Outlook of the Power Supply Situation for 2021 and
Highlights of Medium Term Power Requirements
REPUBLIC OF GHANA

i 2021 Electricity Supply Plan
POWER PLANNING TECHNICAL COMMITTEE
The Power Planning Technical Committee (PPTC) which was inaugurated in 2020 by the Hon.
Minister of Energy to among others develop planning reports for the Ghana Power System worked
to develop the 2021 Electricity Supply Plan (ESP) as per the requirement in Section-7 of the National
Electricity Grid Code and Section 2 (2)(c) of the Energy Commission Act 1997 (ACT 541).
The Committee is made up of technical experts as follows:
Chairpersons:
Ing. Frank Otchere (Chairman) – Ghana Grid Company Limited
Salifu Addo (Co-Chairman) – Energy Commission
Other Members:
Frederick Okang – Ghana Grid Company Limited
Kassim Abubakar – Ghana Grid Company Limited
Sheila Bortey-Kharis (Mrs.) – Ghana Grid Company Limited
Monica Debrah (Mrs.) – Ghana Grid Company Limited
Simpson Attieku – Energy Commission
Eric Kyem – Energy Commission
Joseph Banuro – Energy Commission
Adolf Nii Ashong – Energy Commission
Frederick Oblitey – Public Utilities Regulatory Commission
Hanson Monney – Ministry of Energy
Abdul N. Wahab – Volta River Authority
Justice Barnor Kyere – Bui Power Authority
Ebenezer Baiden – Electricity Company of Ghana
Mohammed T. Tampuri – Northern Electricity Company Limited
Hamis Ussif – Ghana National Petroleum Corporation
Benjamin Buabeng-Acheampong – Ghana National Gas Company

ii 2021 Electricity Supply Plan
ACKNOWLEDGEMENT
We hereby wish to acknowledge all Wholesale Suppliers, Bulk Customers and other key stakeholders
who provided relevant information to conduct demand forecasts, determine sources of supply, firm
up maintenance programmes, potential new projects and other information required for developing
the 2021 ESP.
We also acknowledge Mrs. Laura Zordeh (Energy Commission) who provided administrative support
to the PPTC during the development of the report.

iii 2021 Electricity Supply Plan
EXECUTIVE SUMMARY
The highlights of the 2021 ESP are as follows:
1.1 2020 Performance Review
Peak Load
The Corona Virus Disease (COVID-19) pandemic has brought about disruptions in regular routine
operations in economies all over the world as a result of restrictions imposed to contain it. Despite
its devastating effects on global economies, the COVID-19 pandemic did not have any significant effect
on electricity supply and demand in 2020. To that effect, the System Peak demand which occurred at
20.15 h on December 4, 2020 is as follows:
Load Type 2020 SYSTEM PEAK (MW)
Projected Actual
Domestic Peak 2,631 2,682
Export
CEB 150 100
SONABEL 180 128
CIE 0 95
Total Export 330 323
VALCO 100 85
System Peak (coincident) 3,061 3,090
The coincident 2020 System Peak load (3090 MW) represents a 10.2% growth on the 2019 peak load
(2,803.7 MW).
Energy Consumption
Consumer Projection (GWh) Actual (GWh)
ECG 12,562.62 12,653.33
NEDCo 1,537.02 1,573.19
Mines 1,533.99 1,499.20
VALCO 702.32 721.56
EPC 258.13 242.15
Export 1,787.06 1,855.09
Direct Cust. 300.16 274.65
Losses 897.03 887.75
Network Usage 9.63 9.67
Total Energy Transmitted 19,608.21 19,716.59
The total energy consumed, including losses, was 19,716.59 GWh representing a 10.23% increase
over the 2019 consumption of 17,887 GWh.

iv 2021 Electricity Supply Plan
Energy Generated
The total energy generated over the period was 19,716.59 GWh; this was made up of 7,293.23 GWh
(36.99%) from hydro generation, 12,365.09 GWh (62.71%) from thermal generation and 58.24 GWh
(0.3%) imports.
1.2 2021 Demand Outlook
The projected base case coincident Ghana peak demand for 2021 is 3,303.72 MW. This represents a
growth of 6.9% (an increase of 213.72 MW) over the 2020 peak demand of 3,090 MW.
The projected 2021 base case energy consumption is 21,265.52 GWh, which includes transmission
network losses and station service usage of 1,090.53 GWh. The estimated transmission losses and
usage represents a 5.13% of total projected energy supply. The projected 2021 energy consumption
represents an increase of 1,548.93 GWh (growth of 7.86 %) over the 2020 consumption of 19,716.59
GWh.
1.3 2021 Generation Outlook
Hydro Generation Projected total annual hydro generation for 2021 is 7,001.2 GWh. This is made up of 5,650 GWh
from Akosombo GS, 850 GWh from Kpong GS. The projected total annual hydro generation from
Akosombo and Kpong is 6,500 GWh.
The headwater level at Bui GS is critically low. Projected energy to be generated from Bui GS is 501.2
GWh.
Thermal Generation
The total projected thermal energy generation in 2021 is 14,111.97 GWh. A total of US$ 758.8M is
required for thermal fuel purchase in 2021. This comprises US$ 753.33M for Gas and US$ 5.48M for
HFO.
RE Generation
A total of 152.34 GWh of electrical energy is expected from Renewable Energy sources in 2021. The
renewable energy sources will include the grid connected solar RE farm at Bui, the embedded BXC
and Meinergy solar plants and VRA’s facilities at Navrongo and Lawra/Kaleo.
1.4 Imports
No power import is anticipated till the end of the year. However, inadvertent energy exchanges on
tie-lines could result from transient flows. Emergency imports may be necessitated as a result of
short-term capacity shortages caused by faults or fuel supply contingencies.

v 2021 Electricity Supply Plan
1.5 2021 Transmission System Outlook
Due to low water level in the Bui dam, generating units at Bui Hydro Plant shall not be dispatched
during off-peak periods. A system condition with no Bui units in service would lead to voltage stability
issues especially across the northern parts of the grid.
Transmission projects which are expected to be completed to improve system performance in 2021
are as follows:
• 330/34.5 kV Pokuase Substation;
• 161 kV Volta – Achimota – Mallam line corridor upgrade
• 330 kV Anwomaso – Kintampo line and
• 161/34.5 kV Kasoa Substation
1.6 2021 Distribution System Outlook
As a measure towards improving distribution network performance, the Distribution companies have
embarked on a number of activities including the reconstruction of BSPs at Tafo, Kpong, Juapong,
Daboase, Inchaban, Awaso; the expansion of Weija, Tokuse, Koforidua and Winneba, etc.
EPC has commenced with the development of a 2km double circuit sub-transmission line and a
switching station for the evacuation of 60MVA of power to the business park area in the Tema
Freezones Enclave.
1.7 Medium Term Outlook
Demand Outlook
The Ghana system peak demand is projected to increase from 3,539 MW in 2022 to 4,460 MW in
2026.
Total electricity requirement for Ghana including power exports to Togo, Benin, Burkina and Mali is
projected to increase from 22,799 GWh in 2022 to 28,550 GWh by 2026 at a Compound Annual
Growth Rate (CAGR) of approximately 5.8%.
2022 2023 2024 2025 2026
Peak Demand (MW) 3,539 3,739 3,964 4,171 4,460
Energy Demand (GWh) 22,799 24,177 25,572 27,069 28,550
vi 2021 Electricity Supply Plan
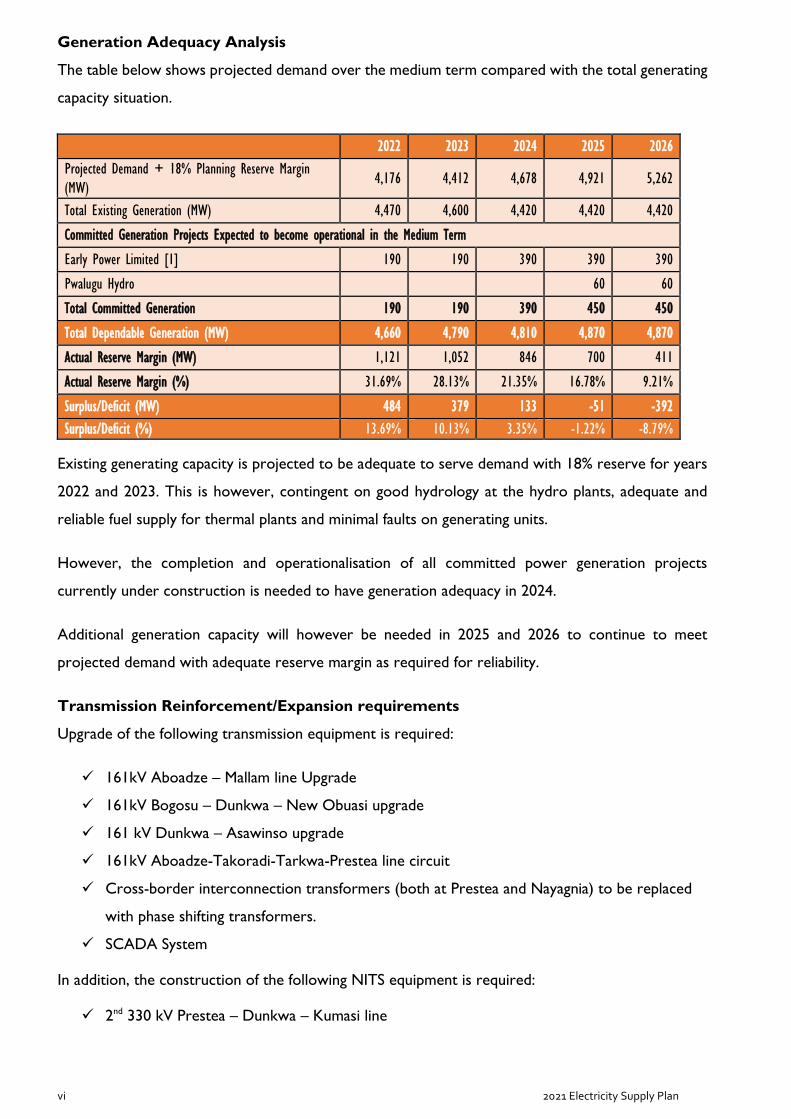
Generation Adequacy Analysis
The table below shows projected demand over the medium term compared with the total generating
capacity situation.
2022 2023 2024 2025 2026
Projected Demand + 18% Planning Reserve Margin
(MW) 4,176 4,412 4,678 4,921 5,262
Total Existing Generation (MW) 4,470 4,600 4,420 4,420 4,420
Committed Generation Projects Expected to become operational in the Medium Term
Early Power Limited [1] 190 190 390 390 390
Pwalugu Hydro 60 60
Total Committed Generation 190 190 390 450 450
Total Dependable Generation (MW) 4,660 4,790 4,810 4,870 4,870
Actual Reserve Margin (MW) 1,121 1,052 846 700 411
Actual Reserve Margin (%) 31.69% 28.13% 21.35% 16.78% 9.21%
Surplus/Deficit (MW) 484 379 133 -51 -392
Surplus/Deficit (%) 13.69% 10.13% 3.35% -1.22% -8.79%
Existing generating capacity is projected to be adequate to serve demand with 18% reserve for years
2022 and 2023. This is however, contingent on good hydrology at the hydro plants, adequate and
reliable fuel supply for thermal plants and minimal faults on generating units.
However, the completion and operationalisation of all committed power generation projects
currently under construction is needed to have generation adequacy in 2024.
Additional generation capacity will however be needed in 2025 and 2026 to continue to meet
projected demand with adequate reserve margin as required for reliability.
Transmission Reinforcement/Expansion requirements
Upgrade of the following transmission equipment is required:
161kV Aboadze – Mallam line Upgrade
161kV Bogosu – Dunkwa – New Obuasi upgrade
161 kV Dunkwa – Asawinso upgrade
161kV Aboadze-Takoradi-Tarkwa-Prestea line circuit
Cross-border interconnection transformers (both at Prestea and Nayagnia) to be replaced
with phase shifting transformers.
SCADA System
In addition, the construction of the following NITS equipment is required:
2nd 330 kV Prestea – Dunkwa – Kumasi line

vii 2021 Electricity Supply Plan
330/161 kV Dunkwa substation for break-in of the 330 kV Takoradi Thermal – Anwomaso
line
161kV Pokuase – Mallam line
2nd Takoradi Thermal – Pokuase 330 kV line
Accra (Pokuase) – Kumasi (Anwomaso) 330 kV line
Eastern Transmission Corridor Projects:
o 161 kV Akosombo/Kpong GS -Asiekpe Transmission Line
o 161 kV Asiekpe -Kpando Transmission Line
o 161kV Kpando – Juale Transmission Line
o 161kV Juale – Yendi Transmission Line
o A 161kV, 2x33 MVA Substation at Nkwanta (to supply Nkwanta, Salaga and Bimbila)
A third Bulk Supply Point in Kumasi
A ±50 MVar STATCOM to be installed in Kumasi
Creation of new Generation Enclaves
Analysis conducted confirms the recommendation made in the Electricity Supply Plans of previous
years for the establishment of two new generation enclaves at:
i. Kumasi and
ii. between Kasoa and Winneba.
1.8 Conclusion
The following conclusions are drawn from the 2021 Electricity Supply Plan and the medium-term
outlook:
1. Despite the crippling effect the COVID-19 pandemic had on economies globally in the
year 2020, there was no significant net impact on Electricity demand in Ghana.
2. There is the need to dispatch Bui Hydro Plant conservatively throughout 2021 to ensure
that the reservoir is not drawn down below its minimum operating levels to guarantee
sustainable operations in the coming years.
3. There is no projected requirement for LCO in 2021due to anticipated high volumes of gas
from Sankofa, Jubilee, TEN and Nigeria as well as the envisaged completion of the LNG
project. Strategic stocks will, however, be required to be kept in reserve for use as backup
fuel in the event of any gas supply upsets.
4. An amount of US$ 63.23 Million is required every month (US$758.8 Million for the year)
to procure Natural gas and HFO for the operation of thermal power plants in 2021.
5. The completion of projects to upgrade the transmission systems by mid-2021 is expected
to improve system performance with reduced transmission losses.
6. A number of upgrade projects have been commissioned into service to help augment
ECG’s ability to increase distribution capacity and reliability of supply to customers.

viii 2021 Electricity Supply Plan
7. Some interventions such as the conversion of shield wire systems to conventional 34.5kV
feeder circuits and procurement of smart meters have been initiated by NEDCo to
improve supply reliability and combat electricity theft within their operational area.
8. The deployment of the committed generation capacities would be adequate to meet
projected demand, including a reserve capacity of 18% up to 2024.
9. Additional generation capacity will be needed from 2025. Specifically, 51 MW and 392 MW
additional generation capacity will be needed in 2025 and 2026, respectively.
1.9 Recommendation
Based on the above conclusions, the following recommendations are made:
1. Adopt a conservative dispatch of the Bui GS to manage the use of its limited head water
until the next inflow season.
2. Installation of a third 161/34.5kV transformer at Anwomaso Substation and the transfer of
some load from the ECG substation at Ridge, Kumasi to Anwomaso in order to limit
congestion on the 161 kV Anwomaso – Kumasi line, especially when Bui is not running
during off-peak periods.
3. Ongoing transmission expansion projects should be expedited and completed in the first
half of 2021 to ensure that the NITS continues to have adequate capacity to supply all
projected customer loads with minimal losses.
4. Power Supply Outage management for the ongoing projects should be well coordinated
to reduce the impact on customers.
5. Implementation of the break-in on the 330 kV Takoradi Thermal – Anwomaso line at
Dunkwa with the construction of the 330/161kV Dunkwa II Substation by GRIDCo to
address the low voltage situation in the Western parts of the NITS. This will help improve
power system stability.
6. Create a generation enclave in Kumasi for network stability, and to address voltage limit
violations in the mid-sections of the Ghana power system in situations such as where Bui
units are not in service and to reduce line loadings between Kumasi and the South East.
7. Considering the time required for planning, procurement, design, construction and
commissioning of power plants, there is the need to commence procure processes for
additional generation capacity (51 MW in 2025 and 392 MW in 2026 - through a
competitive least cost procurement process) in order to continue to meet the Ghana
power system electricity demand with the required reserve margin by 2025.

ix 2021 Electricity Supply Plan
TABLE OF CONTENTS
ACKNOWLEDGEMENT ..................................................................................................................................................... I
EXECUTIVE SUMMARY .................................................................................................................................................. III
TABLE OF CONTENTS .................................................................................................................................................... III
1 INTRODUCTION .................................................................................................................................................... 1
2 REVIEW: 2019 POWER SYSTEM PERFORMANCE ................................................................................................... 2
2.1 OBJECTIVE .................................................................................................................................................................. 2 2.2 THE IMPACT OF SOME MAJOR EVENTS ON ELECTRICITY SUPPLY ............................................................................................ 2
2.2.1 The Impact of the WAGP Intelligent Pigging Operation ................................................................................ 2 2.2.2 The Impact of the COVID-19 Pandemic ......................................................................................................... 3
2.3 PEAK LOAD ................................................................................................................................................................. 5 2.3.1 Supply at Peak (MW) ..................................................................................................................................... 6
2.4 ENERGY CONSUMPTION ................................................................................................................................................ 7 2.4.1 Domestic Consumption ................................................................................................................................. 7 2.4.2 Exports ........................................................................................................................................................... 8 2.4.3 Losses ............................................................................................................................................................ 8
2.5 ENERGY GENERATION ................................................................................................................................................. 10 2.6 GENERATION FACILITIES ................................................................................................................................................ 1
2.6.1 Hydro Facilities .............................................................................................................................................. 1 2.7 THERMAL FACILITIES ..................................................................................................................................................... 3 2.8 FUEL SUPPLY ............................................................................................................................................................... 4
2.8.1 Fuel Usage ..................................................................................................................................................... 4 2.8.2 Natural Gas Supply Security .......................................................................................................................... 5
2.9 RENEWABLES .............................................................................................................................................................. 6 2.10 SYSTEM DISTURBANCES ............................................................................................................................................ 7 2.11 SYSTEM RELIABILITY................................................................................................................................................. 7
2.11.1 Quality of Supply....................................................................................................................................... 7 2.11.2 System Frequency ..................................................................................................................................... 7 2.11.3 System Voltages ....................................................................................................................................... 8
2.12 TRANSMISSION NETWORK PERFORMANCE ................................................................................................................... 8 2.12.1 Power Supply (Feeder) Availability ........................................................................................................... 8 2.12.2 Transmission Line Availability ................................................................................................................... 9 2.12.3 Transformer Capacity ............................................................................................................................... 9
2.13 DISTRIBUTION NETWORK PERFORMANCE .................................................................................................................... 9 2.13.1 Operational Performance ......................................................................................................................... 9
3 2020 DEMAND OUTLOOK ................................................................................................................................... 21
3.1 INTRODUCTION ......................................................................................................................................................... 21 3.1.1 Distribution network Demand Forecast Methodology ................................................................................ 21
3.2 2021 PEAK DEMAND ................................................................................................................................................. 22 3.2.1 Details of 2021 Peak Demand Projections................................................................................................... 22
3.3 2021 ENERGY CONSUMPTION PROJECTIONS .................................................................................................................. 24 3.4 PROJECTED MONTHLY PEAK AND ENERGY DEMAND FOR 2020 .......................................................................................... 26
4 SUPPLY OUTLOOK ............................................................................................................................................... 29
4.1 GENERATION SOURCES ............................................................................................................................................... 29 4.2 SUMMARY OF GENERATION SOURCES ............................................................................................................................ 29 4.3 HYDRO POWER GENERATION FOR 2020 ........................................................................................................................ 30
4.3.1 Akosombo & Kpong Hydro .......................................................................................................................... 30 4.3.2 Bui Hydro ..................................................................................................................................................... 31
4.4 THERMAL POWER GENERATION FOR 2021 ..................................................................................................................... 32 4.5 RENEWABLE ENERGY GENERATION SOURCES .................................................................................................................. 32 4.6 KEY ASSUMPTIONS UNDERPINNING THE SUPPLY PLAN ...................................................................................................... 33
4.6.1 Planned Maintenance ................................................................................................................................. 33 4.6.2 Natural Gas Quantities and Availabilities ................................................................................................... 33 4.6.3 Fuel Allocation ............................................................................................................................................. 35

x 2021 Electricity Supply Plan
4.6.4 Fuel Price ..................................................................................................................................................... 35 4.7 DEMAND - SUPPLY ANALYSIS ....................................................................................................................................... 35 4.8 PROJECTED CAPACITY SITUATION .................................................................................................................................. 40 4.9 FUEL REQUIREMENT ................................................................................................................................................... 43
4.9.1 Monthly Fuel Requirement .......................................................................................................................... 44 4.10 ESTIMATES OF FUEL COST ....................................................................................................................................... 45
5 NATIONAL INTERCONNECTED TRANSMISSION SYSTEM ...................................................................................... 47
5.1 STATE OF THE GHANA NATIONAL INTERCONNECTED TRANSMISSION SYSTEM ......................................................................... 47 5.2 TRANSMISSION LINE, FEEDER AND SUBSTATION AVAILABILITY ............................................................................................ 48 5.3 SCOPE OF NETWORK ANALYSIS ..................................................................................................................................... 48
5.3.1 Technical Adequacy Criteria ........................................................................................................................ 48 5.4 2021 BUSINESS AS USUAL SCENARIO (PEAK AND OFF-PEAK ANALYSES) ............................................................................... 50 5.5 DYNAMIC SIMULATIONS ....................................................................................................................................... 60
6 DISTRIBUTION OUTLOOK FOR 2021 .................................................................................................................... 68
6.1 INTRODUCTION ......................................................................................................................................................... 68 6.2 INTERVENTIONS FOR NETWORK IMPROVEMENT ............................................................................................................... 68
6.2.1 Projects Executed in Southern Ghana.......................................................................................................... 68 6.2.2 Projects Executed in Northern Ghana ......................................................................................................... 69
6.3 EXPECTED IMPACT OF ONGOING & EXECUTED PROJECTS ................................................................................................... 69 6.4 NEW DEVELOPMENTS ................................................................................................................................................. 70
6.4.1 Implementation of the Cash Waterfall Mechanism .................................................................................... 70 6.4.2 Additional Renewable Generation in Northern Ghana................................................................................ 70 6.4.3 Utilities MoU with Energy Commission of Ghana ....................................................................................... 70 6.4.4 Network Expansion Initiatives by EPC ......................................................................................................... 70 6.4.5 Influx of Small-Scale Renewable Energy (RE) Technologies in Ghana ......................................................... 71 6.4.6 Support for Electric Vehicles in Ghana ........................................................................................................ 71
7 OVERVIEW OF MEDIUM-TERM SUPPLY: 2022 - 2026 .......................................................................................... 77
7.1 DEMAND OUTLOOK ................................................................................................................................................... 77 7.2 PROJECTED SUPPLY OUTLOOK ...................................................................................................................................... 79
7.2.1 Existing Generation ..................................................................................................................................... 79 7.2.2 Committed Generation Projects .................................................................................................................. 81 7.2.3 Demand and Supply Balance ....................................................................................................................... 82 7.2.4 Additional Generation Requirement ........................................................................................................... 82 7.2.5 High Demand Sensitivity on Supply ............................................................................................................. 83
7.3 MEDIUM TERM TRANSMISSION NETWORK EXPANSION/UPGRADE REQUIREMENTS ................................................................ 84 7.4 CREATION OF NEW GENERATION ENCLAVES .................................................................................................................... 85
7.4.1 360 MW Plant sited at Kumasi .................................................................................................................... 85 7.4.2 360 MW Plant sited between Winneba and Kasoa ..................................................................................... 86
8 CONCLUSIONS .................................................................................................................................................... 85
8.1 DEMAND AND SUPPLY OUTLOOK .................................................................................................................................. 85 8.2 REQUIREMENTS FOR NITS REINFORCEMENT ................................................................................................................... 86 8.3 DISTRIBUTION SYSTEMS .............................................................................................................................................. 87 8.4 MEDIUM TERM SUPPLY .............................................................................................................................................. 88
9 RECOMMENDATIONS ......................................................................................................................................... 88
10 APPENDICES ....................................................................................................................................................... 90
xi 2021 Electricity Supply Plan
Table of Tables
Table 2.1: Comparison of growth in electricity consumption between March and June for 2018, 2019 & 2020 ...........................................3
Table 2.2: Quarterly Cumulative Average Growth Rate for 2018-2020 ..............................................................................................................4
Table 2.3 System Peak Demand for 2020 and Projection ..................................................................................................................................5
Table 2.4: System Projected and Actual Peak Demand for 2020 .......................................................................................................................5
Table 2.5: Plants dispatched to meet Peak Demand for 2020 ...........................................................................................................................6
Table 2.6: Energy projection for 2020 and actual consumption for 2020 & 2019 ..........................................................................................7
Table 2.7: Domestic Consumption .........................................................................................................................................................................8
Table 2.8: Energy Export in 2019and 2020 ........................................................................................................................................................8
Table 2.9: Monthly Transmission Losses for 2020 ................................................................................................................................................9
Table 2.10: ECG’s Distribution System Losses 2020 ...........................................................................................................................................10
Table 2.11: NEDCo Distribution system losses 2020 ........................................................................................................................................10
Table 2.12: Projected versus Actual Energy generation for 2020 .....................................................................................................................10
Table 2.13: Comparison of projected and actual monthly energy generation (GWh) ........................................................................................1
Table 2.14: 2020 Projected and Actual Hydro Generation ..................................................................................................................................1
Table 2.15: 2020 Thermal Capacities and Energy generated ..............................................................................................................................4
Table 2.16: Domestic Gas Consumption by Plants for 2020 ...............................................................................................................................5
Table 2.17: System Voltages ..................................................................................................................................................................................8
Table 2.18: Feeder Availability for 2020 ..............................................................................................................................................................9
Table 2.19: Transmission line availability for 2020. ............................................................................................................................................9
Table 2.20: Distribution Reliability Indices as at Q2, 2020 ..............................................................................................................................10
Table 3.1: Summary of 2021 Projected Peak Demand ......................................................................................................................................22
Table 3.2: Summary of 2021 consumption by customer class ..........................................................................................................................24
Table 3.3: Summary of Projected 2021 Monthly Energy (GWh) Consumption –Base Case Scenario ..............................................................26
Table 3.4: Summary of Projected 2021 Monthly Peak (MW) demand – Base Case Scenario .........................................................................27
Table 3.5: Summary of Projected 2021 Monthly Peak (MW) demand – Base Case Scenario .........................................................................27
Table 4.1: Existing Generation Sources for 2021 ...............................................................................................................................................29
Table 4.2: Summary of Thermal Generation .......................................................................................................................................................32
Table 4.3: Summary of Renewable Energy Generation.......................................................................................................................................33
Table 4.4: Projected Monthly Generation in GWh (January – June 2021) ......................................................................................................37
Table 4.5: Projected Monthly Generation in GWh (July – December 2021)....................................................................................................38
Table 4.6: 2021 Projected energy Generation and Consumption Balance in GWh ..........................................................................................39
Table 4.7: Projected Monthly Capacity Situation for 2021 (January – June 2021) ........................................................................................41
Table 4.8: Projected Monthly Capacity Situation for 2021 (July – December 2021) ......................................................................................42
Table 4.9: Monthly fuel requirements and associated costs (January – December 2021) ..............................................................................44
Table 5.1: Criteria, normal condition ..................................................................................................................................................................48
Table 5.2: Criteria, contingency condition ..........................................................................................................................................................49
Table 5.3: Generation dispatch from Generation Enclaves (Off-peak conditions) .............................................................................................50
Table 5.4: Generation dispatch from Generation Enclaves (Peak conditions) ...................................................................................................51
Table 5.5: Balanced Generation Dispatch from Generation Enclaves (Peak conditions for 1st half year of 2021) .......................................52
Table 5.6: Maximum East Generation Dispatch (Peak conditions for 1st half year of 2021) .........................................................................53
Table 5.7: Maximum West Generation Dispatch (Peak conditions for 1st half year of 2021) .......................................................................54
Table 5.8: Balanced Generation Dispatch (Peak conditions for 2nd half year of 2021) .................................................................................55
Table 5.9: Maximum East Generation Dispatch (Peak conditions for 2nd half year of 2021) .......................................................................56
Table 5.10: Maximum West Generation Dispatch (Peak conditions for 2nd half year of 2021) ....................................................................57
Table 7.1: Projected Energy Demand (GWh) (2022- 2026) ..............................................................................................................................79
Table 7.2: Projected Peak Demand (MW) (2022- 2026) ...................................................................................................................................79
Table 7.3: Projected Demand and Supply balance (2022- 2026) .....................................................................................................................79
Table 7.4: Comparison of system losses (MW) - Siting Generation at Kumasi .................................................................................................85
Table 7.5: Comparison of line loadings (% line thermal capacity) - Siting Generation at Kumasi ................................................................85
Table 7.6: Comparison of bus Voltages (kV) - Siting Generation at Kumasi ....................................................................................................85

POWER PLANNING
TECHNICAL COMMITTEE
2021 ELECTRICITY
SUPPLY PLAN
Chapter 1
INTRODUCTION

1 ……………………………………………………………………………………………………………………………………2021 Electricity Supply Plan
1 INTRODUCTION
The 2021 Electricity Supply Plan (ESP) outlines projections for electricity demand and supply for the
year, based on energy sector data collected and assumptions for load forecasting and the year's
expected generation. The ESP highlights various strategies for delivering electricity generation,
transmission, and distribution services on the Ghana power system in 2021.
The report commences with a review of the actual Ghana Power System performance of the
preceding year (2020) with reference to projections and other benchmarks. It continues to forecast
the year's electricity supply and demand, which is largely driven by economic variables, for the three
main end-user categories; domestic, VALCO and exports. Additionally, it highlights the key
assumptions underpinning the 2021 projections, including maintenance schedules and natural gas
availability.
In 2021, it is envisaged that power supply capacity will continue to outstrip forecasted demand and
would require an optimised dispatch regime to adequately and efficiently meet the forecasted demand.
The report assesses all available generation resources for dispatch based on considerations such as
merit order dispatch (including lower overall system losses) and system stability requirements in the
analysis for the demand-supply balance for the year. Also, the optimisation of thermal power plants'
dispatch due to their increasing proportion in the overall energy mix was considered in the report.
The Hydro generation plants continue to play the crucial role of system stability and the required
energy mix for the PURC tariff for regulated customers. The energy allocations from the hydropower
plants took cognisance of the average inflows into the Akosombo and Bui hydro reservoirs during
the inflow season in 2020 and prudent management of the reservoir to prevent the need for a spill
or to operate below the minimum reservoir levels.
In line with government policy which leans towards natural gas utilisation as the primary fuel source
for thermal power generation, priority is given to plants with a stable supply of natural gas. The
adequacy of the two main sources of gas (Indigenous gas and N-Gas) have been analysed in the report
to ensure fuel supply security for the thermal power allocations needed to compliment the Hydro
and renewable sources. The plants' alternative liquid fuel requirements have also been discussed albeit
insignificant due to anticipated high volumes of gas from Sankofa, Jubilee and TEN fields and the
envisaged Tema LNG project.
Furthermore, the report takes a critical look at the major challenges anticipated, which can adversely
impact the reliability of power supply in 2021. It also proffers immediate to medium-term
recommendations to address the identified challenges such as grid reinforcements and budgetary
allocations for fuel procurement and supply.

2……………………………………………………………………………………………………………………………………2021 Electricity Supply Plan
For the first time since its inception, the ESP has been prepared by the Power Planning Technical
Committee (PPTC) which is jointly chaired by the Ghana Grid Company Limited and the Energy
Commission. This is in line with the IPSMP recommendation to ensure planning was more
collaborative among the key players in the power sector; which hitherto was carried out in "silos"
and with different sets of assumptions, data sets, planning horizons, and technical analyses.

1…………………………………………………………………………………2021 Electricity Supply Plan
POWER PLANNING
TECHNICAL COMMITTEE
2021 ELECTRICITY
SUPPLY PLAN
Chapter 2
2020 POWER SYSTEM PERFORMANCE REVIEW

2…………………………………………………………………………………2021 System Performance
2 2020 POWER SYSTEM PERFORMANCE REVIEW
2.1 Objective
The review of the Ghana Power System performance includes an analyses of the peak demand for
the year, the total energy consumption and an assessment of the generation capacities in service at
the time of occurrence of the peak demand compared to what was projected in the 2020 ESP. It also
takes a look at the overall performance at hydro power plants including their hydrological turn out;
the performance of thermal sources, and finally, it assesses the NITS performance through analysis of
some indicators.
2.2 The Impact of some Major Events on Electricity Supply
In this section, we highlight major events which occurred during the year and its impact on the
power system. Further analysis is carried out on system voltages and transmission system losses.
2.2.1 The Impact of the WAGP Intelligent Pigging Operation
A mandatory intelligent pigging operation of the offshore segment of the West African Gas Pipeline
(WAGP) required for the assessment of the integrity pipeline was carried out from January 20, 2020
to March 5, 2020 by the West African Gas Pipeline Company (WAPCO). It involved the launch of
five (5) pigs from Itoki to Takoradi.
Natural gas supply for thermal generation in Tema was curtailed over the period, rendering the Sunon
Asogli Power Plant, CENIT, VRA’s TT1PP and TT2PP plants inoperable (810MW capacity unavailable
in Tema). Cenpower plant and VRA’s KTPP which also became inoperable on gas, however switched
to liquid fuel - Cenpower switched, running one gas turbine in combined cycle on LCO whiles KTPP
switched to run on Diesel Fuel.
Notwithstanding the huge capacity that became unavailable, it was projected that the remaining
generation capacity would be adequate to serve all Ghana demand. Unfortunately however, the TICO
gas turbine unit no. 1 and its corresponding steam unit as well as Bui unit no. 1 became faulted few
days after the start of the pigging exercise and remained unavailable through the period. This resulted
in periodic situations of generation inadequacy, compounded by periodic liquid fuel challenges at
Cenpower Plant and AKSA. Load management was therefore carried out at certain times to address
periods of generation inadequacy.
Please note that WAPCO took advantage of the gas supply outage in Tema to upgrade its metering
skid in Tema as part of works under the Takoradi – Tema Interconnection Project, increasing its

3…………………………………………………………………………………2021 System Performance
capacity from the then 140 mmscf to 235 mmscf. This has made it possible for Thermal plants in Tema
to use more domestic natural gas produced in the West and improve gas supply reliability.
2.2.2 The Impact of the COVID-19 Pandemic
The outbreak of Corona Virus Disease (COVID-19) in the last quarter of 2019 brought disruptions
in economies worldwide when measures put in place to curb the spread involved the slowing down
and grounding of activities in the transport, industrial and services sectors etc.
Ghana, upon recording its first case in March 2020, closed down educational institutions and advised
people to as much as possible stay at home including relaxed working conditions allowing as many as
could to work from home. The President of Ghana instituted partial lockdowns in the Greater Accra
Metropolitan Area, Greater Kumasi Metropolitan Area and Kasoa in the Central Region with
restrictions on movement of people (with the exception of essential services such as hospitals,
electricity workers and the food chain sector operatives). The lockdown lasted from March 30 to
April 20 2020
2.2.2.1 Impact of Covid-19 on the Distribution System
For northern Ghana, average electricity consumption increased by 9% between March and June 2020
when the partial lockdown was imposed. Residential consumption increased by 13% from March to
June 2020 though it was forecasted to have grown by only 5.3% during the same period. In the case
of industry, there was no significant change in consumption.
Generally, electricity consumption between March and June 2020, increased by 5.3% in southern
Ghana whilst consumption reduced by 0.95% over the same period and location in 2019. Residential
consumption increased by 10% between March and June 2020 but decreased by 1.3% within the same
period in 2019.
In the case of industry, Special Load Tariff Low Voltage (SLT-LV) and SLT-HV customers’ consumption
reduced significantly by 1.9% and 17.2% respectively over the period March to June 2020. Although
there was decrease in consumption for these two customer groups over the same period in 2019,
the decrease was more during the lockdown period when all non-food related industries had to shut
down operations and workers stayed at home until the lockdown was over.
In the case of medium voltage (SLT-MV) customers, which includes the canneries and food processing
companies, consumption during the lockdown period of 2020 on average increased by about 5.9%
whilst in 2019 consumption grew by only 0.75% within the same period.
Table 2.1: Comparison of growth in electricity consumption between March and June for 2018, 2019 & 2020

4…………………………………………………………………………………2021 System Performance
In the case of EPC, actual consumption for April 2020 dropped by 42.5% compared to the forecast
and this is attributed to the lockdown.
Table 2.2: Quarterly Cumulative Average Growth Rate for 2018-2020
The above table compares the growth in consumption on a quarterly basis from 2018 to 2020. In all
cases, the cumulative average growth in total consumption in southern Ghana is higher in 2020
compared to the previous years. As at Q2, 2020, Residential consumption, SLT – MV and HV
consumption experienced some significant growth. However, as at Q3 2020, the SLT-HV
Consumption showed more sustained growth.
2.2.2.2 Overall impact of COVID-19 on Ghana demand
Analysis conducted to determine the impact of COVID-19 on electricity demand in Ghana in 2020
showed that, there was a dip in demand during the three week partial lockdown attributed to reduced
activities in the industrial and service sectors. However following the easing of restrictions and the
announcement of electricity relief by the government on April 11, 2020, system demand returned to
normal such that peak demand in 2020 grew by 10.2% over that of 2019.
Similar analysis carried out with energy data shows that though actual energy consumption tipped
below the projected over the lockdown period, total actual energy consumption for 2020 also grew
by 10.2% over that of 2019.
2020 2019 2018
CAGR CAGR CAGR
Residential 6.03% -2.03% 8.66%
Non-Residential 1.19% -1.20% -7.55%
SLT-LV -3.30% -3.00% 1.79%
SLT-MV 4.58% 1.76% 8.68%
SLT-HV -6.92% -2.60% -13.48%
Total 3.64% -1.41% 4.44%
Customer Class
March to June
CAGR: Cumulative Average Growth Rate
March to June 2020 is the full lockdown period
2020 2019 2018 2020 2019 2018 2020 2019 2018
CAGR CAGR CAGR CAGR CAGR CAGR CAGR CAGR CAGR
Residential 0.34% -1.82% -9.74% 6.03% -2.03% 0.89% -1.07% -2.12% -0.96%
Non-Residential -0.46% -0.12% -5.31% 1.19% -1.20% -6.66% -2.00% -4.02% -5.82%
SLT-LV -5.38% -5.60% -3.27% -3.30% -3.00% -0.27% -2.98% -3.06% -2.34%
SLT-MV 2.70% 2.52% -5.22% 4.58% 1.76% 2.89% -0.70% 0.79% -3.77%
SLT-HV 10.83% -2.17% 4.85% -6.92% -2.60% -6.57% 2.49% -2.00% 8.56%
Total 1.21% -1.16% -6.74% 3.64% -1.41% -0.18% -0.92% -1.97% -1.19%
As At End of Q3
CAGR: Cumulative Average Growth Rate
Customer Class
As At End of Q1 As At End of Q2

5…………………………………………………………………………………2021 System Performance
It can therefore be concluded that overall, the COVID-19 pandemic did not have any significant impact
on electricity demand in Ghana. There was however an increase in residential energy consumption
possibly due to the social adjustments driven by containment measures adopted where most
Ghanaians stayed at home in accordance with the Presidential directive and the increased use of home
appliances as some pupils/students took to virtual learning programmes using computers, television
sets, laptop or mobile phones as a result of the prolonged closure of schools.
2.3 Peak Load
The coincident peak load for the year 2020 was 3,089.5 MW which occurred at 20.15 h on December
4, 2020. This represents only a marginal deviation of 29.27 MW (0.96%) from the projected 2020
peak load of 3060.7 MW. The peak load recorded also represents a 10.2% (286.3 MW) growth over
the 2019 peak load of 2,803.7 MW. The summary of projected and actual peak load as recorded over
the period is shown in Table 2.3:
Table 2.3 System Peak Demand for 2020 and Projection
Load Type System Peak(MW) System Peak (MW) Difference (MW)
Projection 2020 Actual 2020 (Projection - Actual)
Domestic Peak 2,630.70 2,681.8 -51.3
Export
CEB 150 99.4 51
SONABEL 180 128 52
CIE 0 95 -95
VALCO 100 85.3 15
System Peak (coincident) 3060.7 3,089.50 -28.8
Table 2.4 on the other hand compares monthly actual peak loads with projections for 2020.
Table 2.4: System Projected and Actual Peak Demand for 20201
Month Projected Demand(MW) Actual Demand (MW) Difference
System System Domestic ( Projected -Actual)
Jan-20 2,918.9 2,900.0 2,606.0 18.9
Feb-20 2,986.6 2,893.0 2,640.0 93.6
Mar-20 3,064.2 2,957.0 2,609.0 107.2
Apr-20 3,093.2 2,825.0 2,551.0 268.2
May-20 3,054.2 2,781.0 2,439.0 273.2
Jun-20 3,019.5 2,870.0 2,584.0 149.5
Jul-20 2,839.7 2,653.0 2,364.0 186.7
Aug-20 2,857.91 2,637.0 2,443.0 220.9
Sep-20 2,818.28 2,677.0 2,410.0 141.3
Oct-20 3,001.50 2,848.0 2,660.0 153.5
Nov-20 3,020.01 2999.50 2691.0 20.51
Dec-20 3,060.73 3089.50 2857.0 (28.77)
1 Projected demand from July to December is taken from the 2020 Electricity Supply Plan Mid-Year Review Report
6…………………………………………………………………………………2021 System Performance
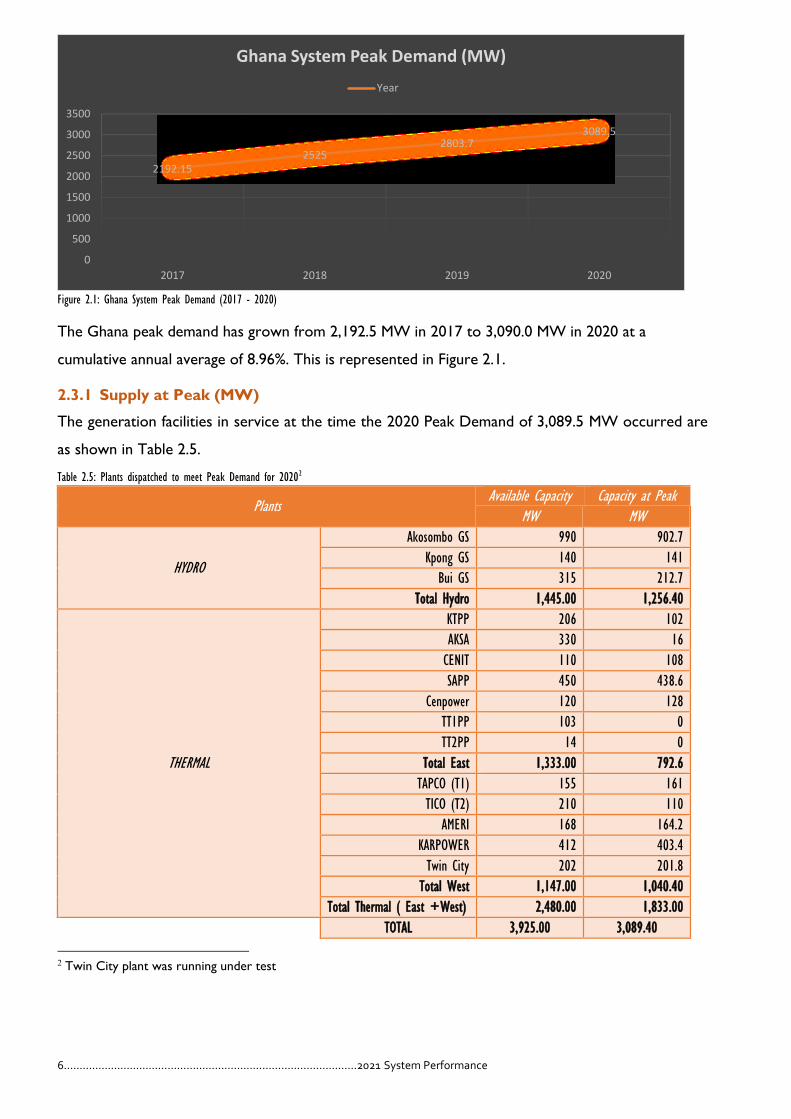
Figure 2.1: Ghana System Peak Demand (2017 - 2020)
The Ghana peak demand has grown from 2,192.5 MW in 2017 to 3,090.0 MW in 2020 at a
cumulative annual average of 8.96%. This is represented in Figure 2.1.
2.3.1 Supply at Peak (MW)
The generation facilities in service at the time the 2020 Peak Demand of 3,089.5 MW occurred are
as shown in Table 2.5.
Table 2.5: Plants dispatched to meet Peak Demand for 20202
Plants Available Capacity Capacity at Peak
MW MW
HYDRO
Akosombo GS 990 902.7
Kpong GS 140 141
Bui GS 315 212.7
Total Hydro 1,445.00 1,256.40
THERMAL
KTPP 206 102
AKSA 330 16
CENIT 110 108
SAPP 450 438.6
Cenpower 120 128
TT1PP 103 0
TT2PP 14 0
Total East 1,333.00 792.6
TAPCO (T1) 155 161
TICO (T2) 210 110
AMERI 168 164.2
KARPOWER 412 403.4
Twin City 202 201.8
Total West 1,147.00 1,040.40
Total Thermal ( East +West) 2,480.00 1,833.00
TOTAL 3,925.00 3,089.40
2 Twin City plant was running under test
2192.152525
2803.73089.5
0
500
1000
1500
2000
2500
3000
3500
2017 2018 2019 2020
Ghana System Peak Demand (MW)
Year

7…………………………………………………………………………………2021 System Performance
This was made up of 1,256.40 MW (40.7%) hydro generation and 1,833.0 MW (59.3%) thermal
generation; between the Western and the Eastern thermal enclaves, the generation contributions
were: 1,040.4 MW (38%) from the Western enclave and 792.6 MW (20%) from the Eastern enclave.
There was no import at the time.
2.4 Energy Consumption
The total energy consumed in 2020, including losses, was 19,716.59 GWh. Comparing with the
projected total energy consumption of 19,608.21 GWh per the 2020 ESP, it is noteworthy that the
actual energy consumed was only marginally higher than what was projected by 108.38 GWh (0.55%).
A total of 17,887.0 GWh was consumed during the same period in 2019: the 2020 energy
consumption thus represents a 1,829.59 GWh (10.23%) increase over that of 2019.
A breakdown of the energy consumed over the period is as shown in Table 2.6.
Table 2.6: Energy projection for 2020 and actual consumption for 2020 & 2019
Customer
Projection
(GWh) Actual (GWh) Actual (GWh) % Growth
2020 2020 2019 (2020-2019)
ECG 12,562.62 12,653.33 11,487.24 10.15%
NEDCo 1,537.02 1,573.19 1,410.51 11.53%
Mines 1,533.99 1,499.20 1,318.94 13.67%
VALCO 702.32 721.56 892.55 -19.16%
EPC 258.13 242.15 235.51 2.82%
Export 1,787.06 1,855.09 1,430.39 29.69%
Direct Cust. 300.16 274.65 259.41 5.87%
Losses 897.03 887.75 842.85 5.33%
Network Usage 9.63 9.67 9.45 2.31%
Total Energy
Transmitted 19,608.21 19,716.59 17,886.85 10.23%
The data shows tremendous growth in exports which is primarily due to increased supply to Burkina
Faso. Additionally there was also export to CIE in the last quarter of 2020 when some of their thermal
plants at Azito were under maintenance. Mining load has also grown appreciably. Transmission losses
on the other hand increased due to the increase in energy transmitted while VALCO consumption
reduced significantly due to their inability to operate their two pot lines as planned.
2.4.1 Domestic Consumption
ECG recorded a growth rate of 10.15% and accounted for 64% of the total domestic consumption.
NEDCo recorded a growth of 11.53% and accounted for 8.0% of the total domestic consumption.

8…………………………………………………………………………………2021 System Performance
VALCO consumption dropped by 19.16% due to their inability to fully run two potlines but increased
by 2.7% compared to the projected. Other Direct/Bulk Customers and the Mines recorded growth
rates of 5.87% and 13.67% respectively. A breakdown of the energy consumption by customer class
is shown in Table 2.7.
Table 2.7: Domestic Consumption
Customer
Projection
(GWh) Actual (GWh)
2020 2020
ECG 12,562.62 12,653.33
NEDCo 1,537.02 1,573.19
Mines 1,533.99 1,499.20
VALCO 702.32 721.56
EPC 258.13 242.15
Export 1,787.06 1,855.09
Direct Cust. 300.16 274.65
Losses 897.03 887.75
Network Usage 9.63 9.67
Total Energy
Transmitted 19,608.21 19,716.59
2.4.2 Exports
A total of 715.23 GWh and 990.47 GWh were exported to Togo/Benin and Burkina respectively
during the period. A net of 207.53 GWh was also exchanged between Ghana and Cote d’Ivoire. This
was made up of 58.18 GWh imports and 149.37 GWh exports.
Table 2.8: Energy Export in 2019and 2020
Customer/Year 2019 2020
Export to CEB (GWh) 777.45 715.23
Export to CIE (GWh) 76.40 149.37
Export to SONABEL (GWh) 576.54 990.47
Total power export increased by 29.69% from 1,430.39 GWh in 2019 to 1,855.09 GWh in 2020. The
growth was largely due to increased exports to SONABEL.
2.4.3 Losses
This section analyses transmission and distribution losses.
- Transmission losses
A monthly breakdown of transmission losses recorded during the period is shown in Table 2.9.
ECG64%
NEDCo8%
Mines8%
VALCO4%
EPC1%
Export9%
Direct Cust.1%
Losses5%
Network Usage
0%
% SHARE OF DOMESTIC CONSUMPTION

9…………………………………………………………………………………2021 System Performance
Table 2.9: Monthly Transmission Losses for 2020
Month Total Generation (GWh) Losses (GWh) % Loss
Jan 1,636.43 69.92 4.27%
Feb 1,624.65 72.92 4.49%
Mar 1,738.88 80.28 4.62%
Apr 1,602.40 74.71 4.66%
May 1,722.14 84.26 4.89%
Jun 1,594.63 73.51 4.61%
July 1,574.15 69.96 4.44%
Aug 1,531.62 64.40 4.20%
Sept 1,481.63 57.81 3.90%
Oct 1,654.54 65.59 3.96%
Nov 1,702.01 76.18 4.48%
Dec 1,853.52 98.18 5.30%
The total transmission losses recorded over the period was 887.75 GWh which is 4.50% of the total
energy transmitted in 2020 (19,716.59 GWh). This is only 1.02% below the projected loss in
transmission of 897.03 GWh.
Figure 2.2 compares the 2020 and 2019 transmission losses recorded.
Figure 2.2: Comparison of 2020 and 2019 transmission losses
Comparing the losses for 2019 and 2020, it can be seen in figure 2.4 that there was reduction in losses
in 2020 which is attributable to the energization of the 330 kV Aboadze – Anwomaso and, the 330
kV Kintampo – Adubiyili – Nayagnia line circuits in the last quarter of 2019. Further to the energization
of the line, the Bui plant was dispatched one unit offpeak and two units during peak continuously due
to the high reservoir elevation. This dispatch scenario curtailed the poor voltages normally
experienced in the northern part of the grid which resulted in reduction in losses.
However, losses increased in the last quarter of 2020 which can be attributed to increased energy
transmitted to SONABEL and poor reactive compensation across the NITS.
0.00%
1.00%
2.00%
3.00%
4.00%
5.00%
6.00%
7.00%
Jan Feb Mar Apr May Jun July Aug Sept Oct Nov Dec
2020 versus 2019 Transmission System Losses
2020 2019

10…………………………………………………………………………………2021 System Performance
2.4.3.1 ECG Distribution losses
ECG distribution losses as at the end of the second quarter, 2020 is presented in Table 2.10
Table 2.10: ECG’s Distribution System Losses 2020
Purchases (Gwh) Sales (GWh) %Losses
1st Quarter 3,207.39 2,304.23 28.16%
2nd Quarter 3,173.20 2,219.45 30.06%
2.4.3.2 NEDCo Distribution losses
The NEDCo distribution network losses as at September, 2020 is presented in the Table 2.11
Table 2.11: NEDCo Distribution system losses 2020
Month Energy Loss (KWh) %Losses
Jan-20 28,894,297.59 25.3%
Feb-20 31,320,398.86 26.0%
Mar-20 43,121,159.99 27.6%
Apr-20 41,495,449.73 28.3%
May-20 38,710,057.12 28.0%
Jun-20 24,034,012.43 26.5%
Jul-20 27,393,615.21 25.9%
Aug-20 38,017,395.93 26.5%
Sep-20 35,159,194.24 26.7%
2.5 Energy Generation
The projected 2020 monthly energy generation based on the estimated availability factors of the
generating plants are compared in Table 2.12 with the actuals recorded over the period.
Table 2.12: Projected versus Actual Energy generation for 2020
Months
Projected (GWh) Actual (GWh)
Total
Hydro
(GWh)
Total
Thermal
(GWh)
Total Solar
(GWh)
Import
(GWh)
Total
(GWh)
Hydro
(GWh)
Thermal
(GWh)
Import
(GWh)
Total
(GWh)
January 639.3 974.2 4.8 0.00 1,618.35 639.28 993.65 3.50 1,636.43
February 622.4 939.3 4.4 0.00 1,566.07 760.48 858.51 5.66 1,624.65
March 583.50 1,136.73 4.8 0.00 1,725.07 732.73 1,002.63 3.51 1,738.88
April 508.00 1,162.69 4.7 0.00 1,675.37 562.80 1,035.02 4.58 1,602.40
May 484.80 1,196.30 4.8 0.00 1,685.94 616.26 1,098.97 6.91 1,722.14
June 466.53 1,102.13 4.7 0.00 1,573.34 482.75 1,106.39 5.50 1,594.63
July 564.2 973.0 4.9 0.00 1,542.10 476.74 1,091.31 6.08 1,574.14
August 588.2 949.9 4.9 0.00 1,543.00 544.19 978.87 8.56 1,531.62
September 621.9 896.3 4.6 0.00 1,522.80 600.04 873.95 7.62 1,481.61
October 636.2 1,034.10 5.3 0.00 1,675.60 595.75 1,053.39 5.39 1,654.54
November 583.9 1,119.70 5.0 0.00 1,708.60 661.37 1,039.99 0.65 1,702.01
December 598.2 1,166.30 5.3 0.00 1,769.80 620.84 1,232.40 0.28 1,853.52

11…………………………………………………………………………………2021 System Performance
The hydro/thermal proportions is presented graphically in Figure 2.3.
Figure 2.3: Projected versus Actual Energy Generation for 2020
Table 2.13 gives a monthly breakdown of the individual plant generation.
6897.11
12650.67
0.00
7293.23
12365.09
58.24
GW
H
Projected Vs Actual Generation GWh
Projected Actual

1…………………………………………………………………………………2021 Electricity Supply Plan
Table 2.13: Comparison of projected and actual monthly energy generation (GWh)
Plant
Availability
(%)
Akosombo 96.88
Kpong 82.75
Bui 93.45
TAPCO 66.29
TICO 78.61
TT1PP 97.62
KTPP 99.94
TT2PP 82.02
SAPP 97.89
CENIT 95.79
AMERI Power
Plant 94.26
Karpower Barge 99.87
AKSA 99.99
CENPOWER 82.12
TWIN CITY -
Early Power -
0 1,000,000,000 2,000,000,000 3,000,000,000 4,000,000,000 5,000,000,000 6,000,000,000
Akosombo…
Kpong GS
Bui GS
TAPCo
TICo
TP47
T2PP
Twin City
SAPP
CENIT
KTPP
Karpower
Ameri
Aksa
Cenpower
Early Power
Import
ENERGY GENERATION (GWH)
PROJECTED vrs. ACTUAL GENERATION FOR YEAR 2020
Actual Projected

1…………………………………………………………………………………2021 Electricity Supply Plan
The total energy generated over the period was 19,716.59 GWh; this was made up of 7,293.23 GWh
(36.99%) from hydro generation, 12,365.09 GWh (62.71%) from thermal generation and 58.24 GWh
(0.3%) import.
Figure 2.4 shows a graphical illustration of the actual generation mix for 2020.
Figure 2.4: Generation Mix for 2020
2.6 Generation Facilities
2.6.1 Hydro Facilities
The dependable capacities and the projected energies for the individual hydro plants are shown in
Table 2.14.
Table 2.14: 2020 Projected and Actual Hydro Generation
Plants Dependable Capacity
Projected
Energy Actual Energy
Variations % Variations
(MW) (GWh) (GWh)
Akosombo GS 900 4,827.1 5,161.45 334.35 6.93%
Kpong GS 105 851.5 862.25 (10.75) (1.26) %
Bui GS 360 1,218.6 1,269.52 (50.92) (4.17)%
From Table 2.14 it can be seen that the total hydro generated for 2020 was 7,293.23 GWh as against
the projected of 6,897.2 GWh. This was made up of 5,164.45 GWh, 862.25 GWh and 1,269.52 GWh
from Akosombo, Kpong and Bui Generating Stations respectively.
2.6.1.1 Akosombo & Kpong
The elevation of the Volta Lake at the start of the year 2020 was 80.70 m (264.76 feet). Based on this
reservoir elevation, and the intent to store water in the reservoir, it was recommended to operate
up to four (4) units during the off-peak period and up to five (5) units during the peak period in the
36.99%
62.71%
0.30%
2020 Actual Generation Mix
Hydro Thermal Import

2……………………………………………………………………………………………………………………………………2021 Electricity Supply Plan
year 2020. As a result to the adherence to the above recommendation, the reservoir elevation
dropped to a minimum of 78.46 m (257.41 feet) during the dry season in May 2020 and started rising
on July 02, 2020.
The Kpong Generation Station (Kpong GS), was also planned to operate three (3) out of the four
(4) generating units at the plant. The fourth unit which was unavailable for major retrofit was
restored to service on September 19, 2020.
Inflows in 2020
The reservoir elevation at the end of 2020 was 81.60 m (267.73 ft). This figure represents an increase
of 3.80 ft above the projected elevation of 260.96 ft. The recorded maximum lake elevation at the
end of year 2020 inflow season was 269.97 feet, a rise of 29.97 feet above the minimum operating
level of 240 feet. The total net inflow recorded in 2020 was 31.86 MAF, which implies that net inflow
obtained was above the long term average of 25.21 MAF. Figure 2.5 shows the Akosombo reservoir
trajectory for 2020 plotted against the trajectory for 2019 and the projected trajectory for 2020.
Figure 2.5: Akosombo Reservoir Elevation
2.6.1.2 Bui
The Bui Reservoir level at the beginning of 2020 was 180.37 masl, dropping to a minimum of 169.98
masl at the end of the dry season. The minimum level reached was thus 0.02 m lower than the
projected minimum of 170.00 masl for the year. At the end of the inflow season, the reservoir level
235
240
245
250
255
260
265
270
275
280
Jan Feb Mar Apr May Jun Jul Aug Sep Oct Nov Dec
AKOSOMBO RESERVOIR ELEVATION
2020 2019 MAX MIN
2019
2020
Maximum Operating Level
Minimum Operating Level

3 ……………………………………………………………………………………………………………………………………2021 Electricity Supply Plan
rose to a maximum of 174.56 masl, the lowest ever recorded since the dam was constructed. The
year-end elevation is 172.22 masl.
The total energy supplied to the NITS in 2020 was 1,260 GWh compared to the projected 764 GWh
(this was revised to 1,213 GWh during the Mid-year review of the 2020 Electricity Supply Plan). The
recorded reservoir trajectory in 2020 is as shown in Figure 2.6.
Figure 2.6: Bui Reservoir Elevation
2.7 Thermal Facilities
The Projected Dependable Thermal Capacities for 2020 was 3,314 MW which was made up of 1,492
MW and 1,678 MW from Eastern and Western Enclaves respectively. The total thermal energy
generation projected for the same year was 13,307.96 GWh, made up of generation outputs from
VRA and IPP Plants. Table 2.15 details the capacities of the individual thermal plants and their energies
delivered.
167
168
169
170
171
172
173
174
175
176
177
178
179
180
181
182
183
Jan Feb Mar Apr May Jun Jul Aug Sep Oct Nov Dec
BUI RESERVOIR ELEVATION
2020 2019 Max MIN
2020
Maximum Operating
Level
Minimum Operating Level
2019

4……………………………………………………………………………………………………………………………………2021 Electricity Supply Plan
Table 2.15: 2020 Thermal Capacities and Energy generated
Plants Dependable Capacity (MW) Generated Energy (GWh) Western E
nclave
TAPCO (T1) 300 1087.48
TICO (T2) 320 1,193.31
Ameri 230 1,283.07
TwinCity 192 195.99
KAR Power 450 3,128.12
Sub-Total 1492 6887.97
Eastern
Encla
ve
TT1PP 100 427.26
TT2PP 58 90.06
KTPP 200 368.43
Sunon Asogli 530 2,905.22
CENIT 100 710.86
AKSA 330 397.76
CEN Power 360 567.71
Sub-Total 1678 5467.31
Committed
Early Power 144 9.81
TOTAL SUPPLY 3314 12,365.09
Figure 2.7: Eastern Vs Western Thermal Generation for 2020
2.8 Fuel Supply
Thermal plants on the Ghana Power System make up 68% of the total installed capacity with plants
running on fuel sources such Natural gas, Light Crude Oil and Heavy Fuel Oil. The various fuel sources
consumed by the thermal plants for the year 2020 is highlighted below:
2.8.1 Fuel Usage
2.8.1.1 Natural Gas Usage
Up to 89% of installed thermal plants depend on natural gas as the primary fuel source. The sources
of supply include the associated gas fields (Jubilee and TEN) and the non-associated gas field (Sankofa)
in the western offshore of Ghana, as well as imports from Nigeria through the West African Gas
44.30%
55.7%
Eastern Vrs Western Thermal Generat ion (GWh) for 2020
Western Eastern
5 ……………………………………………………………………………………………………………………………………2021 Electricity Supply Plan
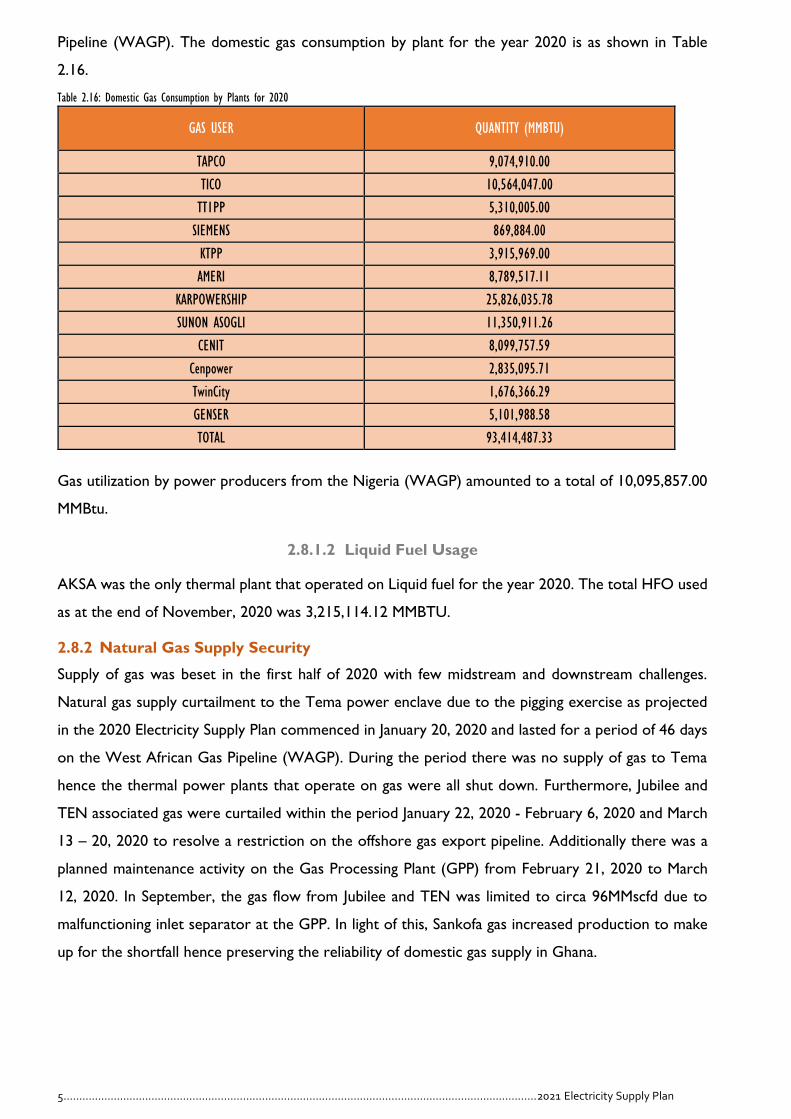
Pipeline (WAGP). The domestic gas consumption by plant for the year 2020 is as shown in Table
2.16.
Table 2.16: Domestic Gas Consumption by Plants for 2020
GAS USER QUANTITY (MMBTU)
TAPCO 9,074,910.00
TICO 10,564,047.00
TT1PP 5,310,005.00
SIEMENS 869,884.00
KTPP 3,915,969.00
AMERI 8,789,517.11
KARPOWERSHIP 25,826,035.78
SUNON ASOGLI 11,350,911.26
CENIT 8,099,757.59
Cenpower 2,835,095.71
TwinCity 1,676,366.29
GENSER 5,101,988.58
TOTAL 93,414,487.33
Gas utilization by power producers from the Nigeria (WAGP) amounted to a total of 10,095,857.00
MMBtu.
2.8.1.2 Liquid Fuel Usage
AKSA was the only thermal plant that operated on Liquid fuel for the year 2020. The total HFO used
as at the end of November, 2020 was 3,215,114.12 MMBTU.
2.8.2 Natural Gas Supply Security
Supply of gas was beset in the first half of 2020 with few midstream and downstream challenges.
Natural gas supply curtailment to the Tema power enclave due to the pigging exercise as projected
in the 2020 Electricity Supply Plan commenced in January 20, 2020 and lasted for a period of 46 days
on the West African Gas Pipeline (WAGP). During the period there was no supply of gas to Tema
hence the thermal power plants that operate on gas were all shut down. Furthermore, Jubilee and
TEN associated gas were curtailed within the period January 22, 2020 - February 6, 2020 and March
13 – 20, 2020 to resolve a restriction on the offshore gas export pipeline. Additionally there was a
planned maintenance activity on the Gas Processing Plant (GPP) from February 21, 2020 to March
12, 2020. In September, the gas flow from Jubilee and TEN was limited to circa 96MMscfd due to
malfunctioning inlet separator at the GPP. In light of this, Sankofa gas increased production to make
up for the shortfall hence preserving the reliability of domestic gas supply in Ghana.

6……………………………………………………………………………………………………………………………………2021 Electricity Supply Plan
2.9 Renewables
VRA commenced construction of 17 MWp solar power plant in September 2019 at Kaleo and
Lawra. A total of 6 MWp has been commissioned in October 2020. The remaining 11 MWp will be
commissioned during the first quarter of 2021.
Bui Power Authority (BPA) commenced the construction of a 50 MWp solar plant at Bui. The
Authority has commissioned 10 MWp of the 50 MWp solar plant and a 1 MW floating solar PV
installation on the Black Volta, at Bui. The remaining 40 MWp is expected to be commissioned by the
end of March 2021. The BPA has also completed and commissioned Ghana’s first micro-hydropower
plant at Tsatsadu in the Volta Region. Is a run-of-river hydro plant and has an installed capacity of
45kW with the possibility adding another 45 MW capacity turbine in the future.
Six (6) Operational Wholesale Electricity Supply Licenses have also been granted to the following
Independent Power Producers:
1. BXC (Ghana) Company Limited (20 MWp solar PV plant located at Gomoa Onyadze in the
Central Region.)
2. Safi Sana Ghana Limited (100kW waste-to-energy plant) located at Ashaiman, near Tema.
3. Meinergy Technology Company Limited (20 MWp solar PV plant located at Gomoa Onyaadze
in the Central Region).
4. Crossboundary Energy Ghana Limited (400 kWp rooftop solar PV plant at Kasapreko
Company Limited located at Spintex Road, Accra).
5. CrossBoundary Energy Ghana Limited (970kWp rooftop solar PV plant at Unilever Ghana
Limited) located at Tema.
6. SolarPlast Project Company Limited (782kWp rooftop solar PV plant at Miniplast) located on
the Spintex Road in Greater Accra.
The Ministry of Energy issued a policy directive on 11th August 2020, granting the Electricity Company
of Ghana (ECG) the permission to conduct a competitive tendering process for the procurement of
100MW of power from solar PV, as part of the Cycle 1 targets under the Renewable Energy Master
Plan (REMP). The tender is for the licensees whose PPAs have been reviewed and approved.
The Renewable Energy Act, 2011 (Act 832) was amended by Parliament on 6th November, 2020,
with the Feed-in Tariff Scheme being replaced with a Competitive Procurement Scheme.
Due to the excess grid generation capacity and the over-subscription of Power Purchase
Agreements (PPAs), especially for solar and wind projects, the Ministry of Energy issued a policy
directive that effective 1st July 2019, all power (conventional and renewable) to be procured by any

7 ……………………………………………………………………………………………………………………………………2021 Electricity Supply Plan
Government agency should be done through a competitive tendering process. The Energy
Commission has therefore placed a temporary suspension on the issuance of Provisional Licenses,
Siting & Construction Permits, and Operational Licences for projects with distribution utilities as
potential off-takers.
2.10 System Disturbances
The Ghana Power System experienced several major system disturbances in the year. The
disturbances were mainly due to challenges in the transmission network. Typical of them are the
disturbances which occurred in the month of September caused by fault on the 330 kV transmission
circuit resulting in cascaded trips on other 161 kV transmission lines and outages to customers. The
fault was as a result of flashovers on the post insulators supporting the Aboadze 330 kV P Bus due to
the aggregation of salt and heavy dew on the insulators. In the course of rectifying the problem, a
major fault occurred on the Tafo – Akwatia 161 kV transmission line when a truck run into the line
towers, damaging the towers and snapping the line conductors. The outage to this line further
weakened the grid hence the series of disturbances.
2.11 System Reliability
2.11.1 Quality of Supply
The quality of supply to consumers on the NITS is assessed based on the frequency of the system for
the period and the voltage at which power was delivered. Substations with substantive amount of
demand are considered.
2.11.2 System Frequency
Fig 2.8 shows system frequency performance for the year. It is seen from the graph that system
frequency was within the normal range of 49.8Hz - 50.2Hz, 78.51% of the time which is largely higher
than the 70.68% recorded in the same period in 2019. System frequency over the years have deviated
most often above the 50.2 Hz limit, indicating inadequate primary frequency regulation on the NITS.
It is therefore necessary that other units are included in primary frequency regulation to support the
Akosombo generating units which have over the years solely played that role.
The others are:
49.5Hz - 49.8Hz – 0.79% of the time.
50.2 Hz - 50.5 Hz - 20.66% of the time.
It was in emergency state for 0.05% of the time in the entire year as follows:
49.0 – 49.5Hz - 0.30% of the time.
50.5 – 51.0Hz - 0.02% of the time.

8……………………………………………………………………………………………………………………………………2021 Electricity Supply Plan
Figure 2.8: System Frequency for 2020
2.11.3 System Voltages
An analysis of voltages at selected Bulk Supply Points (BSP) at peak time indicated that voltages across
the NITS were generally within normal (acceptable) limits except New Tema which recorded high
voltages for 29% of the period. There was however, a significant period where voltages below the
normal limits were recorded in Mallam and Kumasi as shown in Table 2.15. That notwithstanding,
voltages in Kumasi have seen significant improvements. Additional improvements will be realised upon
completion of the Anwomaso – Kintampo 330 kV transmission line. The cause of the low voltages in
Mallam and Achimota is attributable to congestion on the Volta – Achimota line circuits and supply
of customers from the western corridor and the pigging period when generation in the Tema Enclave
was less than the 650 MW requirement.
Table 2.17: System Voltages
Station Normal Below Normal Above Normal
Achimota 315 86% 51 14% 0 0%
Mallam 249 68% 115 31% 2 1%
New Tema 219 60% 42 11% 105 29%
Kumasi 280 77% 81 22% 5 1%
Takoradi 353 96% 13 4% 0 0%
Tamale 327 89% 36 10% 3 1%
2.12 Transmission Network Performance
2.12.1 Power Supply (Feeder) Availability
The GRIDCo network registered an average feeder availability of 99.85% as against the approved
PURC 95% benchmark. ECG, NEDCO and other bulk customers recorded average feeder availability
of 99.81%, 99.84% and 99.84% respectively.
0.00% 0.03% 0.79%
78.51%
20.66%
0.02% 0.00%0%
10%
20%
30%
40%
50%
60%
70%
80%
90%
100%
<49.0 49.0 - 49.5 49.5 - 49.8 49.8 - 50.2 50.2 - 50.5 50.5 - 51.0 >51.0
PER
CEN
TAG
E O
F TI
ME
FREQUENCY RANGE (HZ)
APPENDIX 2 - SYSTEM FREQUENCY DISTRIBUTION FOR THE YEAR 2020

9……………………………………………………………………………………………………………………………………2021 Electricity Supply Plan
Table 2.19 shows the availability of feeders for year 2020.
Table 2.18: Feeder Availability for 2020
Customer Availability %
ECG 99.81
NEDCO 99.84
Other Bulk Customers 99.84
2.12.2 Transmission Line Availability
The transmission lines recorded an average availability of 99.15 % for the period, as shown in Table
2.20. The Table also shows average availability for the transmission lines of the various voltage classes.
Table 2.19: Transmission line availability for 2020.
Voltage Class Availability %
69kV 99.58%
161kV 99.21%
225kV 96.78%
330kV 98.92%
System Average Availability 99.15%
2.12.3 Transformer Capacity
The total transformer capacity as at the end of 2020 was 8,901.8 MVA. The total capacity of
conventional step down transformers within the NITS is 5,301.8 MVA. The Transformer Utilisation
Factor (TUF) of the transmission system is 51.28%, computed based on the peak load of 2,719.2 MVA
and system average load factor of 0.88 for the period. This is indicative of a high transformer
redundancy within the NITS for adequate and reliable power supply.
2.13 Distribution Network Performance
Electricity distribution in Ghana is done by the Electricity Company of Ghana Limited (ECG), Northern
Electricity Distribution Company (NEDCo) and Enclave Power Limited (EPC) namely the Discos.
Whereas ECG and EPC are located in the southern part of Ghana, where the population is dense and
electricity consumption is about 89% of total consumption in Ghana, NEDCo is responsible for the
northern part of Ghana with its geographical area starting from the Bono Region. NEDCo has a wide
operational area covering 64% of the landmass of Ghana but few customers.
2.13.1 Operational Performance
The distribution network was stable and available for most of the periods. Voltages were generally
stable, and customers experienced minimal interruptions in power supply. ECG experienced some
intermittent outages from its suppliers due to the intelligent pigging exercise which was carried out

10……………………………………………………………………………………………………………………………………2021 Electricity Supply Plan
during the first quarter. As a result of the pigging, natural gas (NG) supply to the eastern corridor of
Ghana was curtailed and some of ECG’s power producers could not access natural gas to generate
power to the NITS. Accordingly, ECG also carried out critical maintenance works on some of its
networks.
During the second quarter, the Western Region experienced, the washing of salt deposits on the
insulators along the NITS and this created some outages to the distribution network.
Table 19 is the reliability indices as at the end of Q2, 2020 for the Discos:
Table 2.20: Distribution Reliability Indices as at Q2, 2020
Reliability
Index
ECG NEDCo EPC
Regulatory Benchmarks
Metro Urban EPC Metro Urban Rural Metro Urban Rural
System
Average
Interruption
Frequency
Index
(SAIFI)
9.22 times 15.41
times
19.46
times 23.2 times
14.2
times
18.3
times
6 times 6
times
6
times 1.68
times
System
Average
Interruption
Duration
Index
(SAIDI)
15.44hrs 25.43hrs 30.28hrs 25.4hrs 19.7hrs 33.4hrs
72hrs 144hrs
4.1hrs 48hrs
Customer
Average
Interruption
Duration
Index
(CAIDI)
1.67hrs 1.64hrs 1.54hrs 1.0hrs 1.1hrs 1.8hrs 8hrs 12hrs 24hrs

20…………………………………………………………………………………2021 Electricity Supply Plan
POWER PLANNING
TECHNICAL COMMITTEE
2021 ELECTRICITY
SUPPLY PLAN
Chapter 3
2021 DEMAND FORECAST

21……………………………………………………………………………………………………………………………………2021 Electricity Supply Plan
3 2021 DEMAND FORECAST
3.1 Introduction
This chapter presents energy and peak demand projections for the Ghana Power System for 2021.
The demand forecast is necessary for conducting operations planning activities including generation
capacity planning, transmission and distribution network investment decision making, fuel (thermal
generation) procurement planning, maintenance scheduling as well as financial projection of utilities,
etc.
Electricity demand largely depends on economic variables (socio-economic activities) as well as
weather. Being a developing country, electricity demand in Ghana is expected to continue to grow,
on the levels of demand realised in the previous years.
Electricity demand in Ghana can be classified into:
Domestic demand which refers to electricity demand within the control area of Ghana
(excluding VALCO), including demand that is typically served through Distributing Companies
such as the Electricity Company of Ghana, Northern Electricity Distributing Company and
Enclave Power Company as well as the Mines, other bulk consumers who take supply directly
from the NITS such as Diamond Cement, etc;
VALCO; and
Cross-border Exchanges (such as CEB, SONABEL and CIE).
3.1.1 Distribution network Demand Forecast Methodology
Distribution network demand typically accounts for approximately 80% of total Ghana demand. The
demand forecast for the Distribution network (ie. ECG and NEDCo) was based on the 2021
projection for GDP growth in Ghana3, as determined by the Ministry of Finance in the Budget
Statement for the year.
Customers of the Distributing Companies have been classified into categories. ECG customers are
categorized into Special Load Tariff (SLT) customers and Non – Special Load Tariff (NSLT) customers.
The SLT customers include industrial customers who consume a demand of 100 kVA and above whilst
the Non SLT customers include both residential and commercial customers who consume a demand
less than 100 kVA.
For NEDCo, there are three categories of customers. These are Residential, Non-Residential and
SLT customers. NEDCo's operational area covers approximately 64% of the geographical area of
Ghana (including the northern parts of Volta, Ashanti and Western regions), however the customer
density and consumption levels of the operational area are low.

22……………………………………………………………………………………………………………………………………2021 Electricity Supply Plan
Depending on the growth patterns for the different categories of customers, different forecast
models were employed for forecasting demand for each customer category for the year 2021 taking
into account projections for losses.
Regression analyses was used to determine relationship between historical energy consumption and
macro-economic indicators such as GDP, Population growth (Customer Population). The relationship
derived was used to forecast the electricity demand using projected macroeconomic indicators. This
procedure was used to project residential, commercial, and small industrial loads. For large industrial
consumers, their demand was treated as spot loads.
3.2 2021 Peak Demand
The projected base case coincident peak demand for 2021 (for the Ghana Power System) is 3,303.72
MW. This represents a growth of 6.9% (an increase of 213.72 MW) over the 2020 peak demand of
3,090 MW which occurred on December 10, 2020.
The 2020 demand survey exercise carried out identified the following activities which are expected
to contribute to achieve the 2021 peak demand:
Demand increases attributable to ongoing distribution network expansion works intended to
extend coverage and improve service quality to ECG and NEDCo customers;
Expected completion and commissioning of various ongoing rural electrification projects
within the ECG and NEDCo distribution zones in 2021;
VALCO’s peak demand to grow from 90 MW to 130 MW; Increase in export to SONABEL
(Burkina Faso)- from an average of 120 MW in 2020 to a maximum 160 MW in 2021;
Exports to CEB (Togo/Benin) expected to increase from an average of 120 MW in 2020 to a
planned maximum of 150 MW in 2021;
Re-operationalisation of the AngloGold Ashanti mine at Obuasi.
The month-on-month peak demand will vary depending on the impact of demand drivers such as
social and economic activities, seasonal changes in weather, etc.
3.2.1 Details of 2021 Peak Demand Projections
Table 3.1 shows a detailed breakdown of 2021 Projected Peak Demand showing the individual Load
Entity/Distributing Company.
Table 3.1: Summary of 2021 Projected Peak Demand
Demand Customer 2021 – Projected Coincident
Peak (MW)
Domestic Peak Demand
ECG 2,106.75
NEDCo 263.83
Enclave Power 56.99
Mines
New Obuasi
245.01 Obuasi
New Tarkwa

23……………………………………………………………………………………………………………………………………2021 Electricity Supply Plan
Prestea
Ahafo/Kenyase (Newmont)
New Abirim (Newmont)
Akyempem (Wexford)
Perseus (Ayanfuri)
Bogosu
Akwatia
Konongo
Adamus Gold Resources
Asanko Gold
Drill Works
Earl Int
Other Bulk Customers
Akosombo Textiles
50.14
Aluworks
Ghana Water Company Ltd
Diamond Cement
Generation Plants Station
Service
Volta Hotel
Savana Cement (Buipe)
VRATownships
Losses +Network Usage 151
Total Domestic Peak Demand 2,873.72
Exports
CEB 150
CIE 0
SONABEL 150
Total Exports 300
VALCO 130
Coincident Peak Demand MW 3,303.72
The Pie-Chart below illustrates the composition of the projected 2021 Peak Demand, showing the
percentage share of each customer class. As shown in the Chart, ECG has the highest demand,
constituting 64% of the total system peak followed by Exports constituting 9%, followed by NEDCo
and the Mines at 8% and 7% respectively. VALCO at two pot-lines constitutes 4%. Other Bulk
Consumers constitute 2% of total peak demand.

24……………………………………………………………………………………………………………………………………2021 Electricity Supply Plan
Figure 3.1: 2021 projected peak demand
3.3 2021 Energy Consumption Projections
In 2021, the projected base case energy consumption is 21,265.52 GWh, which includes transmission
network losses and station service usage of 1,090.53 GWh. The estimated transmission losses and
usage, represents a 5.13% of total projected energy supply. The projected 2021 energy consumption
represents an increase of 1,548.93 GWh (growth of 7.86 %) over the 2020 consumption of
19,716.59GWh.
The summary of 2021 consumption by customer class is presented in Table 3.2.
Table 3.2: Summary of 2021 consumption by customer class
Energy Customer 2021 – Projected Consumption (GWh)
Domestic Consumption
ECG 13,583.00
NEDCo 1,611.76
Enclave Power Company 306.03
Mines 1,845.73
Other Bulk Customers 246.08
Losses + Network Usage 1,090.53
Total Domestic 18,683.13
Exports
CEB 512.14
CIE 15.12
SONABEL 1,000.00
VALCO 1,055.13
Total Energy (GWh) 21,265.52
Figure 3.2 below shows a pie-chart representation of the projected energy consumption of the various
customer classes in 2021 and their percentages. As shown, ECG’s consumption of 13,583.0 GWh
represents 64% of the total projected energy consumption for 2021. It is followed by Mines and
NEDCo with projected consumption of 1,845.73 and 1,611.76 GWh respectively representing 9%
ECG 64%
NEDCo 8%
Enclave 2%
Mines 7%
Other Bulk Customers 2%
VALCO 4%
Export 9%
Losses 4%

25……………………………………………………………………………………………………………………………………2021 Electricity Supply Plan
and 8% of total consumption. Losses are expected to constitute 5% of the total projected energy
consumption.
Figure 3.2: 2021 Projected Energy consumption by Customer
ECG64%
NEDCo8%
Enclave1%
Mines9%
Other Bulk Customers1%
VALCO5%
Export7%
Losses5%

26……………………………………………………………………………………………………………………………………2021 Electricity Supply Plan
3.4 Projected Monthly Peak and Energy Demand for 2021
A summary of monthly energy consumption and the corresponding peak demand for the various customer classes is shown in Tables 3.3 and 3.4.
Table 3.3: Summary of Projected 2021 Monthly Energy (GWh) Consumption –Base Case Scenario
Energy Forecast
(GWh) Jan Feb Mar Apr May Jun Jul Aug Sep Oct Nov Dec Total GWh
ECG 1,166.76 1,090.35 1,193.05 1,168.85 1,166.05 1,062.91 1,054.93 1,065.37 1,057.13 1,145.06 1,178.92 1,233.62 13,583.00
NEDCo 123.64 129.56 129.98 150.12 131.79 130.53 124.96 126.22 127.44 142.7 147.41 147.41 1,611.76
Enclave Power
Company 21.58 22.55 23.07 23.36 24.9 24.8 27.91 28.73 28 27.96 27.51 25.65 306.02
MINES 151.44 141.05 152.54 149.96 155.01 150.26 155.18 159.65 155.27 159.78 156.26 159.33 1,845.73
Other Bulk Customers 21.76 21.43 20.6 20.05 20.8 19.74 20.13 20.38 20.06 20.53 19.89 20.7 246.07
VALCO 68.45 66.53 78.86 82.8 90.77 93.6 96.72 96.72 93.6 96.72 93.6 96.76 1,055.13
CEB(Togo/Benin) 63.89 57.99 49.27 36.65 34.37 29.89 37.86 27.84 26.95 38.93 44.21 64.3 512.15
SONABEL(Burkina) 80 76 86 88 89 84 82 82 83 86 84 80 1,000.00
CIE(Ivory Coast) 15.12 0 0 0 0 0 0 0 0 0 0 0 15.12
EDM(Mali) 0 0 0 0 0 0 0 0 0 0 0 0 0
Network Usage 0.9 0.84 0.91 0.9 0.9 0.84 0.84 0.84 0.83 0.9 0.92 0.96 10.56
LOSSES 98.94 92.74 100.13 99.35 98.94 92.18 92.41 92.83 91.93 71.5 72.92 76.08 1,079.96
Total 1,812.47 1,699.04 1,834.41 1,820.04 1,812.52 1,688.75 1,692.94 1,700.58 1,684.21 1,790.08 1,825.64 1,904.81 21,265.52

27……………………………………………………………………………………………………………………………………2021 Electricity Supply Plan
Table 3.4: Summary of Projected 2021 Monthly Peak (MW) demand – Base Case Scenario
Coincident Peak Demand
(MW) Jan Feb Mar Apr May Jun Jul Aug Sep Oct Nov Dec
ECG 2,006.09 2,020.60 2,057.53 2,051.41 2,038.43 1,886.74 1,813.91 1,720.46 1,887.62 2,031.61 2,079.12 2,106.75
NEDCo 235.12 246.37 247.18 268.69 250.61 248.23 237.63 240.03 242.35 255.41 263.83 263.83
Enclave Power Company 54.05 52.64 53.67 55.62 56.32 60.25 63.52 60.07 59.47 57.22 55.53 56.99
MINES 235.16 237.05 238.34 238.35 238.69 239.45 239.01 244.5 245.4 245.62 245.1 245.01
Other Bulk Customers 50.26 48.41 52.8 51.91 51.56 50.29 50.08 48.89 47.74 51.18 50.6 50.14
VALCO 92 99 106 115 122 130 130 130 130 130 130 130
CEB(Togo/Benin) 150 150 150 150 150 150 150 150 150 150 150 150
SONABEL(Burkina) 150 150 160 160 160 160 140 140 140 155 150 150
CIE(Ivory Coast) 100 0 0 0 0 0 0 0 0 0 0 0
EDM(Mali) 0 0 0 0 0 0 0 0 0 0 0 0
Network Usage 1.82 1.78 1.81 1.83 1.81 1.7 1.64 1.59 1.69 1.79 1.85 1.86
LOSSES 189.5 185.27 189.06 190.63 189.19 177.31 171.09 165.53 175.92 142.91 148.26 149.14
System Peak (Coincident) 3,264.00 3,191.12 3,256.40 3,283.43 3,258.61 3,103.97 2,996.87 2,901.07 3,080.19 3,220.74 3,274.29 3,303.72
Table 3.5: Summary of Projected 2021 Monthly Peak (MW) demand – Base Case Scenario

28…………………………………………………………………………………………………………………………………2021 Electricity Supply Plan
POWER PLANNING
TECHNICAL COMMITTEE
2021 ELECTRICITY
SUPPLY PLAN
Chapter 4
2021 GENERATION OUTLOOK
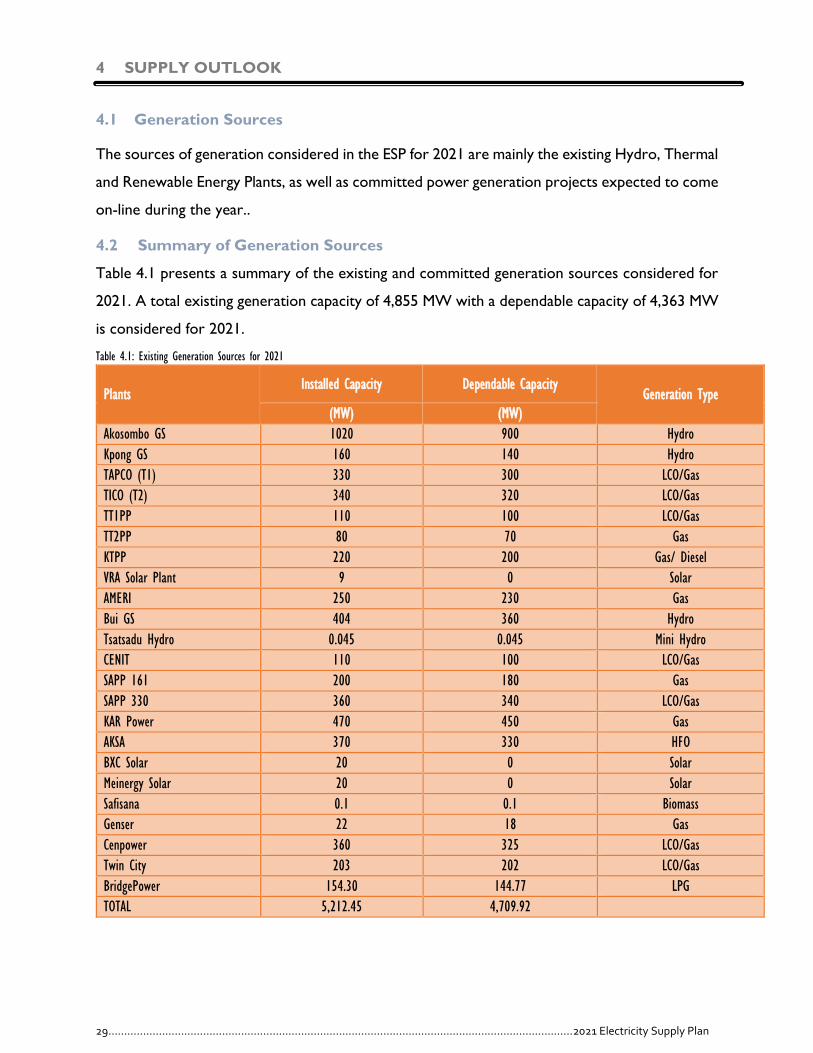
29…………………………………………………………………………………………………………………………………2021 Electricity Supply Plan
4 SUPPLY OUTLOOK
4.1 Generation Sources
The sources of generation considered in the ESP for 2021 are mainly the existing Hydro, Thermal
and Renewable Energy Plants, as well as committed power generation projects expected to come
on-line during the year..
4.2 Summary of Generation Sources
Table 4.1 presents a summary of the existing and committed generation sources considered for
2021. A total existing generation capacity of 4,855 MW with a dependable capacity of 4,363 MW
is considered for 2021.
Table 4.1: Existing Generation Sources for 2021
Plants Installed Capacity Dependable Capacity
Generation Type
(MW) (MW)
Akosombo GS 1020 900 Hydro
Kpong GS 160 140 Hydro
TAPCO (T1) 330 300 LCO/Gas
TICO (T2) 340 320 LCO/Gas
TT1PP 110 100 LCO/Gas
TT2PP 80 70 Gas
KTPP 220 200 Gas/ Diesel
VRA Solar Plant 9 0 Solar
AMERI 250 230 Gas
Bui GS 404 360 Hydro
Tsatsadu Hydro 0.045 0.045 Mini Hydro
CENIT 110 100 LCO/Gas
SAPP 161 200 180 Gas
SAPP 330 360 340 LCO/Gas
KAR Power 470 450 Gas
AKSA 370 330 HFO
BXC Solar 20 0 Solar
Meinergy Solar 20 0 Solar
Safisana 0.1 0.1 Biomass
Genser 22 18 Gas
Cenpower 360 325 LCO/Gas
Twin City 203 202 LCO/Gas
BridgePower 154.30 144.77 LPG
TOTAL 5,212.45 4,709.92

30…………………………………………………………………………………………………………………………………2021 Electricity Supply Plan
4.3 Hydro Power Generation for 2021
Projected total annual hydro generation for 2021 is 7,001.2 GWh. This is made up of 5,650 GWh
from Akosombo GS, 850 GWh from Kpong GS and 501.2 GWh from Bui GS.
4.3.1 Akosombo & Kpong Hydro
The planned maintenance schedule for Akosombo GS is such that the plant will have one (1) unit
out of service for SCADA works throughout the year. This will make only 5 out the 6 units
available throughout the year. At an average capacity of 150 MW per unit, the Akosombo GS is
expected to have up to 750 MW available when the SCADA work commences. The Akosombo
GS is planned to generate a total of 5,650 GWh in 2021.
Figure 4.1: 2021 Projected Akosombo Reservoir Trajectory prior to inflow season
At an Akosombo GS year start elevation of 267.70 feet (81.595 m) this mode of operation is
expected to result in a total drop in elevation of approximately 10.19 feet (3.106 m) resulting in
a projected minimum elevation of 257.51 feet (78.489 m). The depletion curve of Akosombo
Generation Station is shown in Figure 4.1 below.
Having completed the retrofit of all four (4) units at the Kpong GS, the plant will have all four (4)
units available. The total average capacity that is expected to be available at Kpong GS is 140
MW. The Kpong GS is expected to generate 850 GWh in 2021. On the basis of the above mode

31…………………………………………………………………………………………………………………………………2021 Electricity Supply Plan
of operation, the projected total annual hydro generation from Kpong and Akosombo generating
stations is 6,500 GWh.
4.3.2 Bui Hydro
Due to very low inflows into the Bui reservoir during the just ended inflow season in 2020, the
reservoir elevation is very low, with a year-start elevation of 172.16 masl.
Consequently, in 2021, Bui Hydro Plant is projected to generate an annual total of 501 GWh
throughout the year. This implies it will generate an average of 1.37 GWh/day which corresponds
to an average generation capacity of 220 MW to serve demand. With a year start elevation of
172.16 masl, the expected generation from Bui is projected to result in a year-end elevation of
178 masl.
The assumptions for the projected 2021 generation from the Bui Generating Station are as
follows:
● 75% (Long Term Average Inflow (6,167 Mm3), i.e. 4,625 Mm3.
● The 2021 Year start elevation of Bui Reservoir – 172.16 masl
● Annual energy generation of 501 GWh.
Figure 4.2: 2021 Projected Bui Reservoir Trajectory

32…………………………………………………………………………………………………………………………………2021 Electricity Supply Plan
4.4 Thermal Power Generation for 2021
The Projected Dependable Thermal Capacity from the existing generation resources is 3,222.1
MW. Additionally, a total of 347 MW of generation capacity is expected from on-going power
plant projects that are expected to begin commercial operations in 2021. These are as follows:
● 203 MW Twin City Power Plant: The plant is currently undergoing performance testing
and is expected to be completed by January 2021. The plant, located within the Western
enclave of the power system, is operable on both LCO and natural gas.
● 144 MW BridgePower Plant: Construction of the power plant is completed and
commissioning is expected to be completed by the end of the first quarter of 2021. The plant
is operable on both LPG and natural gas. The plant is located within the Eastern enclave of
the power system.
The projected cumulative thermal energy generation from VRA’s portfolio of Thermal power
plants and IPPs for 2021 is 14,111.97 GWh, as shown in Table 4.2 below.
Table 4.2: Summary of Thermal Generation
Generation Sources 2021 Projected Thermal Supply (GWh)
TAPCO 1,972.70
TICO 2,085.10
TT1PP 353.3
KTPP 369.2
TT2PP 111.7
AMERI Power Plant 795
Imports from Cote d'Ivoire -
SAPP 2,166.60
CENIT 525.8
Karpower Barge 3,107.60
AKSA 121.2
CEN Power 1,259.60
Twin City 1,119.00
BridgePower 125.2
Total Thermal Supply (GWh) 14,111.97
4.5 Renewable Energy Generation Sources
In addition to the 2.5 MW Solar power plant at Navrongo, the VRA is expected to increase the
installed capacity of the Kaleo/Lawra solar power plant from 6.5 MWp to 17 MWp from April
2021. The Bui Power Authority (BPA) is projected to dispatch 50MWp from the Bui Solar PV

33…………………………………………………………………………………………………………………………………2021 Electricity Supply Plan
farm by the end of April 2021. Total generation from Bui Solar PV Farm is projected to be 68
GWh by end of year 2021.
Additional generation is expected from the 20 MW BXC solar power plant as well as Meinergy
solar power plant and 0.1 MW Safisana Biomass plant.
A total generation of 152.34 GWh is expected from Renewable Energy sources in 2021. The
summary of generation from the RE power plant facilities is as shown in Table 4.3.
Table 4.3: Summary of Renewable Energy Generation
Generation Sources 2021 Projected Renewable Energy Supply (GWh)
VRA Solar (Navrongo) 3
VRA Solar (Kaleo/Lawra) 26.6
Bui Solar Farm 68
BxC Solar 27
Safisana 0.7
Meinergy 27
Total Renewable Supply (GWh) 152.34
4.6 Key Assumptions Underpinning the Supply Plan
In developing the 2021 Supply Outlook, the following key assumptions were made:
4.6.1 Planned Maintenance
The schedule of key maintenance activities expected to be undertaken in 2021 on generating
units at the various power plants is shown in Appendix B.
4.6.2 Natural Gas Quantities and Availabilities
Natural gas supply in 2021 is expected to be significantly bolstered by additional 125MMscfd from
the Tema LNG Project which is expected to be operational from April 2021. Sankofa is expected
to maintain its capacity to supply up to 210MMscfd, whilst Jubilee and TEN together are expected
to supply 125MMscfd. Expected import from Nigeria is 50MMscfd. The maximum quantity of gas
expected in 2021 is therefore projected at 480 MMscfd.
Some maintenance activities have been scheduled for 2021 by the various facilities. However,
these have been coordinated to minimize their impact on the reliability of gas supply. The Sankofa
gas production facility is expected to shut down for maintenance for five (5) days in July 2021.

34…………………………………………………………………………………………………………………………………2021 Electricity Supply Plan
During this period, a combination of increased supply from Jubilee, TEN, and the Tema LNG will
make up for the Sankofa volumes.
The Jubilee production facility is scheduled for maintenance from 7th to 28th September 2021
(21 days). During this period, the TEN and Sankofa fields are expected to make up for the Jubilee
flows. The TEN and Tema LNG facilities are not scheduled for any planned maintenance in 2021.
A planned shutdown of the Takoradi Distribution Station (TDS) and pipeline for maintenance
works in mid-April 2021 is the most critical outage scheduled in 2021, because it will take out all
domestic gas supply. During this period, increased imports from Nigeria and LNG are expected
to make-up. Maintenance of the West African Gas Pipeline (WAGP) has been scheduled to
coincide with the TDS maintenance schedule to limit the impact of gas supply disruptions in 2021.
2021 Maintenance activities on gas importing facilities in Nigeria are expected to be undertaken
in the third (3rd) quarter and involve a two (2) day shutdown at Itoki Station and a five (5) day
pigging operation on the Itoki to Lagos Beach stretch of the pipeline. This will lead to reduced
flow of gas from Nigeria over the period of work.
Natural gas supply in 2021 from the various sources is shown in the table below:
Figure 4.3: Forecasted Supply Gas Volumes (MMscfd) - 2021
Assuming each 100 MW generation capacity (simple cycle) will use a total of 30 MMscfd of natural
gas, then the 480 MMscfd can be used for approximately 1,600 MW of simple cycle generation.
-
50
100
150
200
250
300
350
400
450
500
Jan Feb Mar Apr May Jun Jul Aug Sep Oct Nov Dec
125 125 125 125 125 125 125 125 125 125 125 125
180 180 180 180 180 180 180 180 180 180 180 180
125 125 125 125 125 125 125 125 125
50 50 50
50 50 50 50 50 50 50 50 50
Jubilee/TEN OCTP/Sankofa LNG N-Gas

35…………………………………………………………………………………………………………………………………2021 Electricity Supply Plan
If all units using the gas are combined cycle units then approximately 2,400 MW of combined
cycle generation could be realized from the 480 MMscfd of natural gas.
4.6.2.1 West to East Reverse Flow
Following the completion of the West to East Reverse Flow project which has enabled the
transportation of gas from domestic producing fields in the West (Takoradi) for use by thermal
power plants in the East (Tema) using the WAPCo Gas Pipeline, a total of approximately 120
MMscfd of gas can be supplied from the West for use by thermal plants such as CENIT,
Cenpower, TT1PP, KTPP, Sunon Asogli, etc. using the WAPCo pipeline.
The gas infrastructure at Tema has a total capacity of 235 MMscfd. Hence the quantity of natural
gas that can be transported from the West to the East depends on how much gas is being supplied
from Nigeria.
4.6.3 Fuel Nominations
Given the quantities of natural gas supply in 2021 as projected above, fuel usage by power plants
at the Tema and Takoradi Power Enclaves is coordinated through a natural gas nomination
process.
4.6.4 Fuel Price
The following assumptions on price of fuel delivered made:
● Natural Gas – US$ 6.08/MMbtu
● Delivered LCO – US$ 60/barrel
● Delivered HFO – US$ 321/MT.
4.7 Demand - Supply Analysis
This sub-section analyzes the demand – supply balance for the year 2021. The assumptions
underpinning the demand - supply projections for the year are as described in Section 4.6. The
analysis begins with the projected monthly energy generation from all the Generating Plants. The
analysis of the monthly energy balance shows supply surplus in 2021. Therefore, the following
considerations are used to determine which Plants are dispatched on monthly basis:
● Power Plant Availability
● System Stability Requirements
● Merit order dispatch

36…………………………………………………………………………………………………………………………………2021 Electricity Supply Plan
Hydro Dispatch. For system stability and also based on Electricity Market Oversight Panel
(EMOP) hydro allocation and PURC tariff for 2021, is 6,500 GWh.
Furthermore, the Bui hydro power plant shall be dispatched conservatively taking into
consideration the low level of inflows during the just ended inflow season. On the basis of this
the Bui hydro plant is projected to generate 501.2 GWh in 2021.
Consequently a total of 7,001.2 GWh of energy generation is projected from the hydro power
plants in the year.
Renewable Energy Dispatch. The solar power plants are must run plants and hence are
largely dispatched based on expected energy from the plants. A total of about 152.34 GWh is
expected from all the solar and other renewable sources. Especially, the Bui Solar Farm which is
expected to be commissioned in the first quarter of 2021 is expected to complement generation
from the hydro plant to enable the management of the headwater in its reservoir until the next
inflow season.
Thermal Power Plant Dispatch. To meet projected demand, the thermal plants are
dispatched after determining how much hydro and renewable generation is to be dispatched. The
dispatch of the thermal power plants takes into consideration the fact that to achieve system
stability there is the requirement to have at least 300 MW of generation capacity from the
Western Corridor, 650 MW of generation capacity from the Eastern Corridor. Additionally, fuel
supply adequacy at the thermal power plants is also taken into consideration.
Power Imports. No power import is anticipated till the end of the year. However, inadvertent
energy exchanges on tie-lines could result from transient flows or emergency imports
necessitated by short-term capacity shortages caused by faults or fuel supply contingencies.
On the basis of the above considerations the 2021 demand/supply balance is illustrated in Tables
4.4 and 4.5. The tables show annual energy and supply projections for 2021.

37 …………………………………………………………………………………………………………………………………2021 Electricity Supply Plan
Table 4.4: Projected Monthly Generation in GWh (January – June 2021)
Customer Category Jan Feb Mar Apr May Jun
Domestic 1,585.0 1,498.5 1,620.3 1,612.6 1,598.4 1,481.3
VALCO 68.4 66.5 78.9 82.8 90.8 93.6
Export (CEB+SONABEL+CIE) 159.0 134.0 135.3 124.6 123.4 113.9
Projected Energy Consumption 1,812.5 1,699.0 1,834.4 1,820.0 1,812.5 1,688.8
Generation Sources
Akosombo GS 479.9 433.4 479.9 464.4 479.9 464.4
Kpong GS 72.2 65.2 72.2 69.9 72.2 69.9
TAPCO 172.4 155.7 172.4 166.9 172.4 166.9
TICO 195.2 176.3 195.2 188.9 195.2 188.9
TT1PP 59.5 - 59.5 - 59.5 -
KTPP - 57.1 - 61.2 - 61.2
TT2PP 9.5 8.6 9.5 9.2 9.5 9.2
AMERI Power Plant 91.4 80.9 57.1 69.3 58.1 25.1
VRA Solar (Navrongo) 0.3 0.2 0.3 0.2 0.3 0.2
VRA Solar (Kaleo/Lawra) 0.9 0.8 0.9 2.6 2.7 2.6
Imports From Cote d'Ivoire - - - - - -
Bui GS 31.0 28.0 31.0 30.0 31.0 30.0
Bui Solar Farm 5.8 5.2 5.8 5.6 5.8 5.6
SAPP 187.5 169.3 187.5 181.4 187.5 162.5
CENIT 47.7 47.7 47.7 47.7 47.7 47.7
Karpower Barge 267.8 241.9 267.8 259.2 267.8 239.2
AKSA 9.5 8.6 9.5 9.2 9.5 9.2
CEN Power 107.5 97.1 107.5 104.0 107.5 104.0
Twin City Energy 69.7 118.6 126.0 130.1 86.0 83.2
Bridge Power - - - 15.7 15.2 14.4
BxC Solar 2.3 2.1 2.3 2.2 2.3 2.2
Meinergy 2.3 2.1 2.3 2.2 2.3 2.2
Safisana 0.1 0.1 0.1 0.1 0.1 0.1
Total Supply (GWh) 1,812.5 1,699.0 1,834.4 1,820.0 1,812.5 1,688.8

38…………………………………………………………………………………………………………………………………2021 Electricity Supply Plan
Table 4.5: Projected Monthly Generation in GWh (July – December 2021)
Customer Category Jul Aug Sep Oct Nov Dec Annual Total
(GWh)
Domestic 1,476.4 1,494.0 1,480.7 1,568.4 1,603.8 1,663.8 18,683.1
VALCO 96.7 96.7 93.6 96.7 93.6 96.8 1,055.1
Export (CEB+SONABEL+CIE) 119.9 109.8 110.0 124.9 128.2 144.3 1,527.3
Projected Energy Consumption 1,692.9 1,700.6 1,684.2 1,790.1 1,825.6 1,904.8 21,265.52
Generation Sources
Total
Supply
(GWh)
Akosombo GS 479.9 479.9 464.4 479.9 464.4 479.9 5,650.0
Kpong GS 72.2 72.2 69.9 72.2 69.9 72.2 850.0
TAPCO 172.4 172.4 166.9 172.4 166.9 114.9 1,972.7
TICO 195.2 100.7 97.4 167.8 188.9 195.2 2,085.1
TT1PP 59.5 - 57.6 - 57.6 - 353.3
KTPP - 63.2 - 63.2 - 63.2 369.2
TT2PP 9.5 9.5 9.2 9.5 9.2 9.5 111.7
AMERI Power Plant 20.0 80.9 56.0 78.1 76.2 101.8 795.0
VRA Solar (Navrongo) 0.3 0.3 0.2 0.3 0.2 0.3 3.0
VRA Solar (Kaleo/Lawra) 2.7 2.7 2.6 2.7 2.6 2.7 26.6
Imports From Cote d'Ivoire - - - - - - -
Bui GS 31.0 31.0 30.0 77.0 74.0 77.0 501.2
Bui Solar Farm 5.8 5.8 5.6 5.8 5.6 5.8 68.0
SAPP 155.5 187.5 181.4 187.5 181.4 197.5 2,166.6
CENIT 29.2 27.7 47.7 22.7 47.7 64.3 525.8
Karpower Barge 237.8 267.8 259.2 267.8 259.2 271.8 3,107.6
AKSA 9.5 9.5 9.2 9.5 9.2 19.0 121.2
CEN Power 107.5 107.5 104.0 101.3 104.0 107.5 1,259.6
Twin City Energy 86.0 63.0 104.0 55.8 93.0 103.5 1,119.0
Bridge Power 14.3 14.4 14.3 12.0 11.0 14.0 125.2
BxC Solar 2.3 2.3 2.2 2.3 2.2 2.3 27.0
Meinergy 2.3 2.3 2.2 2.3 2.2 2.3 27.0
Safisana 0.1 0.1 0.1 0.1 0.1 0.1 0.7
Total Supply (GWh) 1,692.9 1,700.6 1,684.2 1,790.1 1,825.6 1,904.8 21,265.52

39…………………………………………………………………………………………………………………………………2021 Electricity Supply Plan
Table 4.6: 2021 Projected energy Generation and Consumption Balance in GWh
Consumer Category 2021 Projected Consumption (GWh)
Domestic 18,683.10
VALCO 1,055.10
Export (CEB+SONABEL+CIE) 1,527.30
Projected System Energy Requirement 21,265.52
Generation Sources 2021 Projected Generation (GWh)
Akosombo 5,650.00
Kpong GS 850
TAPCO 1,972.70
TICO 2,085.10
TT1PP 353.3
KTPP 369.2
TT2PP 111.7
VRA Solar (Navrongo) 3
VRA Solar (Kaleo/Lawra) 26.6
AMERI Power Plant 795
Imports From Cote d'Ivoire -
Bui GS 501.2
Bui Solar Farm 68
SAPP 2,166.60
CENIT 525.8
Karpower Barge 3,107.60
AKSA 121.2
CEN Power 1,259.60
Twin City 1,119.00
Bridge Power 125.2
BxC Solar 27
Meinergy 27
Safisana 0.7
Total Supply (GWh) 21,265.52
Figure 4.4 is a graphical presentation of the above energy Generation/Consumption balance
showing the percentage share of each generation type. The Chart shows that thermal generation
constitutes 66.4% of projected total generation whilst generation from hydro and Solar PV
constitute 32.9% and 0.7% respectively.

40…………………………………………………………………………………………………………………………………2021 Electricity Supply Plan
Figure 4.4: Contribution of Supply by Generation Types
The high penetration and increasing proportion of thermal generation in the overall generation
mix could pose serious challenges for the following reasons;
Since tariffs are cedi-denominated and the utilities purchase fuel and other consumables
mostly in United States Dollars (USD), any major depreciation of the Ghana Cedi against
the major foreign currencies, particularly the USD, could cause financial challenges,
The thermal plants are predominantly gas-fired, consequently any disruption in gas supply
could have dire consequences on the security of power supply.
4.8 Projected Capacity Situation
The projected monthly Supply Capacity levels, taking planned unit maintenance and Fuel Supply
into consideration is shown in Table 4.7
33%
66%
1%
Generation Mix for 2021
Hydro Thermal RE

41…………………………………………………………………………………………………………………………………2021 Electricity Supply Plan
Table 4.7: Projected Monthly Capacity Situation for 2021 (January – June 2021)
Customer Category 2021 Projected
System Peak (MW) Jan Feb Mar Apr May Jun
Domestic 2798.38 2,772 2,792 2,840 2,858 2,827 2,664
VALCO 130.00 92 99 106 115 122 130
Export (CEB+SONABEL) 290.00 400 300 310 310 310 260
Projected System Demand 3303.72 3,264 3,191 3,256 3,283 3,259 3,054
Generation Sources Dependable Gen.
Capacity
Akosombo 900 750 750 750 750 750 750
Kpong GS 140 140 140 140 140 140 140
TAPCO 300 300 300 300 300 300 300
TICO 320 320 320 320 320 320 320
TT1PP 100 100 0 100 0 100 0
KTPP 200 - 100 0 100 0 100
TT2PP 80 45 45 45 45 45 45
AMERI Power Plant 230 200 200 200 200 200 200
VRA Solar 9
Imports From Cote d'Ivoire 0 - - - - - -
Bui GS 345 220 220 220 220 220 220
Bui Min Unit 4 4 4 4 4 4 4
SAPP 161 180 180 180 180 180 180 180
SAPP 330 350 350 350 350 350 350 350
CENIT 100 100 100 100 100 100 100
Karpower Barge 450 400 400 400 400 400 400
AKSA 330 330 330 330 330 330 330
CEN Power 325 325 325 325 325 325 325
Amandi 192 100 190 190 190 190 190
Bridge Power 144 0 0 0 120 120 120
Trojan 0 0 0 0 0 0 0
Genser 60 60 60 60 60 60 60
Safisana 0.1 0.1 0.1 0.1 0.1 0.1 0.1
Meinergy 20
Solar (Central Region) 20
Total Available Generation (MW) 4,799 3,924 4,014 4,014 4,134 4,134 4,134
Surplus/deficit (MW) 1,495 660 823 758 851 875 1,080
Required Reserve (18%) 595 588 574 586 591 587 550
Actual Reserve Margin 45% 20% 26% 23% 26% 27% 35%

42…………………………………………………………………………………………………………………………………2021 Electricity Supply Plan
Table 4.8: Projected Monthly Capacity Situation for 2021 (July – December 2021)
Customer Category
2021 Projected
System Peak
(MW)
Jul Aug Sep Oct Nov Dec
Domestic 2798.38 2,577 2,481 2,660 2,786 2,844 2,874
VALCO 130.00 130 130 130 130 130 130
Export (CEB+SONABEL) 290.00 240 240 240 255 310 300
Projected System Demand 3303.72 2,947 2,851 3,030 3,171 3,284 3,304
Generation Sources Dependable Gen.
Capacity
Akosombo 900 750 750 750 750 750 750
Kpong GS 140 140 140 140 140 140 140
TAPCO 300 300 300 300 300 300 220
TICO 320 320 165 165 320 320 320
TT1PP 100 100 0 100 0 100 0
KTPP 200 0 100 0 100 0 100
TT2PP 80 45 45 45 45 45 45
AMERI Power Plant 230 200 200 200 200 200 200
VRA Solar 9
Imports From Cote d'Ivoire 0
-
-
-
-
-
-
Bui GS 345 220 220 220 220 220 220
Bui Min Unit 4 4 4 4 4 4 4
SAPP 161 180 150 180 180 180 180 180
SAPP 330 350 350 350 350 350 350 350
CENIT 100 100 100 100 100 100 100
Karpower Barge 450 400 400 400 400 400 400
AKSA 330 330 330 330 330 330 330
CEN Power 325 325 325 325 325 325 325
Amandi 192 190 190 190 190 190 190
Bridge Power 144 120 120 120 120 120 120
Trojan 0 0 0 0 0 0 0
Genser 60 60 60 60 60 60 60
Safisana 0.1 0.1 0.1 0.1 0.1 0.1 0.1
Meinergy 20
Solar (Central Region) 20
Total Available Generation (MW) 4,799 4,104 3,979 3,979 4,134 4,134 4,054
Surplus/deficit (MW) 1,495 1,157 1,128 949 963 850 750
Required Reserve (18%) 595 530 513 545 571 591 595
Actual Reserve Margin 45% 39% 40% 31% 30% 26% 23%
The analysis of the above monthly demand and supply situation for 2021 shows monthly positive
generation reserve margins of up to 40% in 2021. With such a considerably high reserve capacity,

43…………………………………………………………………………………………………………………………………2021 Electricity Supply Plan
it is inevitable that some power plants would be used as non-spinning reserves to be used to
provide strategic reserve capacity on the Ghana power system.
4.9 Fuel Requirement
Currently, the main fuels for power generation are Natural Gas, Heavy Fuel Oil (HFO), Light
Crude Oil (LCO) and Diesel Fuel Oil (DFO). The Bridge Power Plant when fully commissioned
will also use Liquified Petroleum Gas (LPG). The estimates of monthly quantity and cost of fuel
requirement in 2021 is indicated in Table 4.9.
The summary of major fuel requirements for 2021 is as presented below:
Natural Gas: Based on the assumed gas supply from Nigeria and Ghana, the total natural
gas consumption for 2021 is projected to be about 123.903 Tbtu.
LCO: There would be no significant requirement for LCO for the year 2021. This is due
to anticipated high volumes of gas from Sankofa, Jubilee and TEN fields as well as from
Nigeria and the envisaged LNG project. LCO stock as at January 1, 2021 at VRA power
station at Tema and Takoradi was 43,605.49 barrels and 307,228 barrels.
HFO: The AKSA Plant is scheduled to operate on HFO in 2021 from January to June.
Therefore, an estimated 121,849 barrels would be required by AKSA.
Diesel. Diesel is not projected to be used in 2021. The diesel stock as at January 1, 2021
was 13,704.57 cubic meter.

44…………………………………………………………………………………………………………………………………2021 Electricity Supply Plan
4.9.1 Monthly Fuel Requirement
A summary of Monthly fuel requirements and associated costs are as shown in Table 4.9 below.
Table 4.9: Monthly fuel requirements and associated costs (January – December 2021)
Unit s Jan Feb Mar Apr May Jun
Est imated Thermal Fuel Requ irement Un it s
TAPCO - GAS mmbtu 1,541,970 1,392,747 1,541,970 1,492,229 1,541,970 1,492,229
TICO - GAS mmbtu 1,542,868 1,393,558 1,542,868 1,493,098 1,542,868 1,493,098
TT1PP - GAS mmbtu 696,384 - 696,384 - 696,384 -
KTPP - GAS mmbtu - 672,874 - 720,936 - 720,936
TT2PP - GAS mmbtu 111,935 101,102 111,935 108,324 111,935 108,324
AMERI Power Plant - GAS mmbtu 1,031,430 912,751 644,047 781,969 655,248 283,632
Karpower Barge - GAS mmbtu 2,163,470 1,954,102 2,163,470 2,093,680 2,163,470 1,932,131
SAPP - GAS mmbtu 1,553,137 1,402,834 1,553,137 1,503,036 1,553,137 1,345,873
CENIT - GAS mmbtu 563,407 563,407 563,407 563,407 563,407 563,407
AMANDI - GAS mmbtu 574,163 977,021 1,037,646 1,071,177 708,366 685,515
CENPOWER - GAS mmbtu 884,145 798,582 884,145 855,624 884,145 855,624
Early Power - GAS mmbtu - - - 178,653 173,785 163,724
AKSA - GAS mmbtu
AKSA - HFO barrels 20,869 18,850 20,869 20,196 20,869 20,196
To tal Natural Gas Vo lume (MMBtu) 10,662,908 10,168,978 10,739,009 10,862,134 10,594,714 9,644,493
ESTIMATED FUEL COST
Total Natural Gas Cost @ US$ 6.08/mmbtu MMUS$ 64.83 61.83 65.29 66.04 64.42 58.64
Total HFO Cost @ US$ 45/bbl MMUS$ 0.94 0.85 0.94 0.91 0.94 0.91
To tal Fuel Co st (US$ Mi l l ion ) MMUS$ 65.77 62.68 66.23 66.95 65.35 59.55

45…………………………………………………………………………………………………………………………………2021 Electricity Supply Plan
4.10 Estimates of Fuel Cost
The breakdown of the estimated cost of fuel for running all the Thermal Plants in 2021 is US$
755.9 Million. This translates into an approximate monthly average of US$ 62.99 Million. The cost
is made up of US$ 737.19 Million for Natural gas at an average cost of US$ 6.08/MMbtu and US$
18.66 Million for HFO at US$ 70/barrel.
Unit s Ju l Aug Sep Oc t Nov Dec Annual To tal
Est imated Thermal Fuel Requ irement Un it s
TAPCO - GAS mmbtu 1,541,970 1,541,970 1,492,229 1,541,970 1,492,229 1,027,980 17,641,463
TICO - GAS mmbtu 1,542,868 795,541 769,879 1,325,902 1,493,098 1,542,868 16,478,514
TT1PP - GAS mmbtu 696,384 - 673,920 - 673,920 - 4,133,376
KTPP - GAS mmbtu - 744,967 - 744,967 - 744,967 4,349,647
TT2PP - GAS mmbtu 111,935 111,935 108,324 111,935 108,324 111,935 1,317,942
AMERI Power Plant - GAS mmbtu 225,596 912,420 632,006 880,557 859,708 1,148,153 8,967,518
Karpower Barge - GAS mmbtu 1,921,145 2,163,470 2,093,680 2,163,470 2,093,680 2,195,779 25,101,546
SAPP - GAS mmbtu 1,288,460 1,553,137 1,503,036 1,553,137 1,503,036 1,635,977 17,947,940
CENIT - GAS mmbtu 344,139 327,356 563,407 268,343 563,407 759,226 6,206,320
AMANDI - GAS mmbtu 708,366 518,817 856,894 459,517 766,296 852,513 9,216,291
CENPOWER - GAS mmbtu 884,145 884,145 855,624 832,971 855,624 884,145 10,358,917
Early Power - GAS mmbtu 162,754 163,652 162,644 136,800 125,400 159,600 1,427,013
AKSA - GAS mmbtu 109,089 109,089 105,570 109,089 105,570 218,352 756,759
AKSA - HFO barrels 121,849
To tal Natural Gas Vo lume (MMBtu) 9,536,851 9,826,498 9,817,214 10,128,658 10,640,292 11,281,493 61,231,008
ESTIMATED FUEL COST
Total Natural Gas Cost @ US$ 6.08/mmbtu MMUS$ 57.98 59.75 59.69 61.58 64.69 68.59 372.28
Total HFO Cost @ US$ 45/bbl MMUS$ - - - - - - -
To tal Fuel Co st (US$ Mi l l ion ) MMUS$ 57.98 59.75 59.69 61.58 64.69 68.59 372.3

46…………………………………………………………………………………………………………………………………2021 Electricity Supply Plan
POWER PLANNING
TECHNICAL COMMITTEE
2021 ELECTRICITY
SUPPLY PLAN
Chapter 5
2021 TRANSMISSION SYSTEM OUTLOOK

47…………………………………………………………………………………………………………………………………2021 Electricity Supply Plan
5 2021 TRANSMISSION SYSTEM OUTLOOK
5.1 State of the Ghana National Interconnected Transmission System
The National Interconnected Transmission System (NITS) transmits electricity from the various
generating stations to the various load centers across country. The NITS, predominantly a 161
kV (73.2% of total circuit length of all NITS lines) grid, also comprises transmission lines and
circuits at 69 kV (3% of total circuit length of all NITS lines), 225 kV (1.3% of total circuit length
of all NITS lines) and 330 kV (22.5% of total circuit length of all NITS lines) voltage levels. The
Ghana power system, one of the best in sub-Saharan Africa, is interconnected with the power
systems of Côte d’Ivoire and Burkina at 225 kV and with Togo at both 161 kV and 330 kV. The
330 kV interconnection with Togo was constructed as part of activities towards the
implementation of the West African Power Pool (WAPP).
The state of the NITS as at end of year 2020 is as follows:
The total circuit length is 7,200.5 km;
The total number of Bulk Supply Points (BSPs) is 65;
Total number of load transformers at BSPs is 138;
Total transformation capacity is 8,901.8 MVA;
Total capacity fixed capacitive compensation devices is 309.8 MVAr;
Total capacity of reactors is 230 MVAr;
One 40 MVAr Static Synchronous Compensator (STATCOM4) installed at the Tamale
substation.
The fixed capacitors, reactors and the STATCOM complement the generating units in providing
the reactive power requirements on the NITS in order to maintain voltages within normal levels
and minimize transmission losses.
The System Control Centre (SCC) in Tema is responsible for the real time dispatch (monitoring,
coordination and control of operations) of the Ghana Power System including cross-border
power exchanges with neighbouring countries. The SCC is equipped with a Network Manager
System (NMS), which is the main tool used to monitor and conduct dispatch operations on the
Ghana Power System.
4 STATCOM is a regulating device used on alternating current electricity transmission networks. It is based on a
power elecrtronics voltage source converter and can act as either a source or sink of reactive AC power to an
electricity network.

48…………………………………………………………………………………………………………………………………2021 Electricity Supply Plan
5.2 Transmission Line, Feeder and Substation Availability
The criteria used for ensuring high transmission Line, Feeder and Substation availability are as
presented below:
All existing transmission lines are expected to be in service in 2021 to ensure transmission
of electricity from the generation stations to the Bulk Supply Points across the nation and
to enable the execution of power exchanges with neighbouring countries.
Maintenance work on transmission lines and substations is to be organized in order not
to significantly affect power supply to customers except for single transformer substations
and consumers served on radial lines.
5.3 Scope of Network Analysis
Network analyses are carried out in order to determine transmission line loadings, substation
bus voltages and network loss levels across the transmission network. In particular, the analyses
seek to determine:
Transmission line constraints to the evacuation of power from the generating stations to
the Bulk Supply Points;
The ability of the entire power system to withstand an N-1 contingency (i.e. forced outage
of a single network element) e.g. transmission line, generator, transformer, etc.;
Adequacy of reactive power compensation in the transmission network in achieving
acceptable system voltages;
Overall stability of the Ghana Power System;
Overall transmission system losses during peak and off-peak periods;
The impact of locational imbalance in generation resources.
5.3.1 Technical Adequacy Criteria
The following criteria were used to assess the performance of the system under both normal and
contingency conditions.
a. Normal Condition
Table 5.1: Criteria, normal condition
Parameter Range
Bus Voltages 0.95 pu to 1.05 pu
Transmission Line Power flows not exceeding 85% of Line Capacity
Transformers Not exceeding 100% (nameplate rating) Generators Not exceeding their Capability Curves
b. Contingency Conditions

49…………………………………………………………………………………………………………………………………2021 Electricity Supply Plan
Table 5.2: Criteria, contingency condition
Parameter Range
Bus Voltages 0.90 pu to 1.10 pu
Transmission Line Power flows not exceeding 100% of Line Capacity
Transformers Not exceeding 120% of Nameplate Rating
Generators Not exceeding their Capability Curve
c. Technical Analysis
Load Flow analyses were carried out to determine the transfer capability and assess the level of
reliability of the transmission network to evacuate power from the generation centres to the
various Bulk Supply Points.
Loadings on transmission lines and other power equipment are monitored to determine whether
there are any limit violations. Also overall transmission system losses are compared to determine
the impact of generation and transmission investments on grid performance.
d. Assumptions and Development of a Base Case
The study was carried out on the 2021 model of the Ghana power system which was developed
using the 2021 energy and capacity Demand forecast data. The study was conducted on the
expected state of the power system within two periods of the year - being, the first half year
(January - June) and the second half year (July – December).
e. Generation Additions
The first phase of Bridge Power Plant consisting of 147 MW located in Tema. This Plant has
already been commissioned on LPG with commissioning on Natural Gas left as outstanding
works.
f. Transmission Additions
The following transmission lines and substation under construction are modelled in the second
half of 2021 to assess their impact on the grid:
g. Transmission Lines and substations
330 kV, Anwomaso – Kintampo Transmission line Project.
161 kV, Volta – Accra East – Achimota line reconstruction
161kV Achimota – Mallam line reconstruction
330/161/34.5 kV Pokuase Substation project.
h. Summary of Results for the Steady State Network Analysis

50…………………………………………………………………………………………………………………………………2021 Electricity Supply Plan
The following scenarios were studied:
2021 Base Case (current system scenario-Peak and off-peak scenarios)
2021 Case Balanced Dispatch Scenario – (Voltage Analyses for first-half system off-peak
and peak scenarios)
2021 Case Maximum East Dispatch Scenario – (Voltage Analyses for first-half system peak
scenarios)
2021 Case Maximum West Dispatch Scenario – (Voltage Analyses for first-half system
peak scenarios)
2021 Case Balanced Dispatch Scenario – (Voltage Analyses for second-half system peak
scenarios)
o 2021 second-half case with the completion of the 330/161/34.5 kV Pokuase
(A4BSP) substation only.
o 2021 second-half case with the upgrade of the 161 kV Volta-Achimota-Mallam line
corridor.
o 2021 second-half case with the completion of the 330kV Anwomaso – Kintampo
line.
System Contingency Analyses
5.4 2021 Business as Usual Scenario (Peak and Off-Peak Analyses)
a. Off-Peak Condition – Bui water level constraints
This case simulates the current 2021 system conditions and serves as the base case for the off-
peak period. In this case, a system demand of 2,670.3 MW is simulated.
The Table below shows the generation dispatch from all generation enclaves in the grid.
Table 5.3: Generation dispatch from Generation Enclaves (Off-peak conditions)
GENERATION ENCLAVE OUTPUT (MW)
EASTERN (TEMA THERMALS) 480
WESTERN (TAKORADI THERMALS) 1,240.3
EASTERN HYDROS 949

51…………………………………………………………………………………………………………………………………2021 Electricity Supply Plan
NORTHERN HYDROS 0
TOTAL 2,670.3
During the first half year of 2021, the Bui water level is low. This situation is expected to
significantly impact active power generation from the Hydro Dam. In view of this, there is the
likelihood that generating units at Bui Hydro Plant will not be dispatched during off-peak periods.
From system simulations, a system condition with no Bui units in service showed voltage stability
issues across the northern parts of the grid. Much of the power supply to consumers in the
northern parts of the grid comes from the Western generation enclave and flows along the
western corridor transmission lines over long distances. Most of these transmission lines are of
170MVA small sized capacity which will tend to get overloaded leading to voltage instability and
a non-convergence of the power flow analysis. To support the voltage, the Bui generator was
dispatched in synchronous condenser mode to deliver 50MVAr to support low voltages in the
northern portions of the grid. Substations across the middle belt of the grid mainly serving mining
customers recorded poor voltages (average voltage of 0.85 P.U). These include Dunkwa,
Asawinso, Ayanfuri and Obotan substations.
The analyses show that transmission losses during this period is approximately 199.52 MW
represent 7.47 % of 2,670.3 MW generation.
b. Peak Condition
The peak demand for 2020 is 3,090 MW . The Table below shows the generation dispatch from
the various generation enclaves in Ghana at the time the peak occurred.
Table 5.4: Generation dispatch from Generation Enclaves (Peak conditions)
GENERATION ENCLAVE OUTPUT (MW)
EASTERN (TEMA THERMALS) 889
WESTERN (TAKORADI THERMALS) 1,158.3
EASTERN HYDROS 812.7
NORTHERN HYDROS 230

52…………………………………………………………………………………………………………………………………2021 Electricity Supply Plan
TOTAL 3,090
As earlier indicated, the hydrology at Bui will allow for only two units (230 MW) of Bui GS to be
dispatched during the peak periods in 2021.
From the analyses, system conditions improve compared to the off-peak scenario with an average
voltage improvement of 5 kV across substations in the mining area. The 161 kV Volta - Accra
East and Kumasi – Anwomaso line loadings are 100 % and 95 % respectively.
Simulations show that transmission losses during this period reduce to 195.47 MW representing
6.33 % of peak generation (3,090 MW).
2021 PEAK CASE WITH BALANCED GENERATION (1st Half).
From the 2021 capacity and energy demand forecast, the projected peak for the first half of 2021
is 3,283.4 MW. In this scenario, power plants are dispatched optimally to realise the least
acceptable transmission losses. It is worth noting that a number of the ongoing transmission
projects are expected to be completed by the end of June 2021. These include the upgrade of
the 161kV Volta – Achimota – Mallam corridor, the 330kV Anwomaso -Kintampo line and
330/34.5 kV Pokuase substation. Therefore, these investments are not modelled in this case.
Again, analyses show that the overload on the 161kV Anwomaso - Kumasi line will be reduced
when a third 161/34.5 kV 66 MVA transformer is installed at Anwomaso and ECG transfers load
from its Ridge BSP/Kumasi to Anwomaso. This results in a significant easing of the line overload
from 111% to 88% of its line capacity.
The Table below shows the generation dispatch from all generation enclaves in the grid.
Table 5.5: Balanced Generation Dispatch from Generation Enclaves (Peak conditions for 1st half year of 2021)
GENERATION ENCLAVE OUTPUT (MW)
EASTERN (TEMA THERMALS) 959
WESTERN (TAKORADI THERMALS) 1,289.3
EASTERN HYDROS 805.1
NORTHERN HYDROS 230

53…………………………………………………………………………………………………………………………………2021 Electricity Supply Plan
TOTAL 3, 283.4
The results also show that there will be low voltages and transmission line overloads on key
transmission corridors in the west. Comparing to the base case, system conditions for this
scenario worsen due to the significant increase in system demand. The 161 kV Volta - Accra East,
Tarkwa – New Tarkwa and New Tarkwa – Prestea lines record overloads of 110.3%, 94.3 %,
92.9 % and 99.6 % of their line capacities respectively. Also the 161kV Anwomaso-Kumasi
transmission line is overloaded at 111% of its capacity. This means that without any interventions,
the lines loaded above 100% will trip leading to system disturbance. The transmission losses
recorded for this scenario is approximately 215.96 MW representing 6.58 % of 3,283.4 MW
generation.
Again, substations across the middle parts of the grid mainly serving mining customers record
poor voltages (average voltage of 0.85 P. U). This includes the 161kV Dunkwa, Asawinso, Prestea,
Ayanfuri and Obotan substations.
2021 PEAK CASE WITH MAXIMISED GENERATION IN THE EAST (1st Half).
This simulation depicts a 2021 first-half year scenario where all the Hydro units at Akosombo
are engaged and complemented with Thermals in and around Tema. Such a dispatch scenario is
possible during periods of gas unavailability within the western generation enclave.
The Table below shows the generation dispatch from all generation enclaves in the grid.
Table 5.6: Maximum East Generation Dispatch (Peak conditions for 1st half year of 2021)
GENERATION ENCLAVE OUTPUT (MW)
EASTERN (TEMA THERMALS) 1,349
WESTERN (TAKORADI THERMALS) 740
EASTERN HYDROS 965.7
NORTHERN HYDROS 230
TOTAL 3,284.7

54…………………………………………………………………………………………………………………………………2021 Electricity Supply Plan
The analyses shows that transmission losses will be 221.61 MW (6.75% of 3,284.7 MW
generation). Transmission losses increase by 6 MW compared with the base case. Additionally,
the 161kV Volta – Accra East, Volta-Achimota lines are overloaded at 118.9% and 93.8%
respectively. The short 161 kV line from KTPP- Volta is loaded at 93.2% with two units (220MW)
engaged at KTPP. An upgrade of the corridor will reduce the overloads and also reduce
transmission losses.
Also, some severe system voltage violations are observed on the following substations serving
the western mining communities. These include the 161kV Prestea, Dunkwa, Asawinso Ayanfuri,
and Obotan substations recording an average voltage of 138.2kV. An average voltage of 148.3kV
is also observed across the 161kV Kumasi, Nkawkaw and Anwomaso substations.
From the simulations, it is observed that the minimum allowable generation dispatch from the
Western generation enclave considering the current grid constraints should be 700 MW. Any
generation dispatch less than this total may result in voltage stability issues along the Western
and Northern parts of the NITS.
2021 PEAK CASE WITH MAXIMUM GENERATION IN THE WEST (1st Half).
This case analyses the impact when majority of the Power Plants at Aboadze are put in service.
It is worth noting that such a dispatch scenario is possible during periods of gas unavailability in
the eastern generation enclave, such as when the WAPCO R&M Station at Tema is shut down.
The Table below shows the generation dispatch from all generation enclaves used in this analysis.
Table 5.7: Maximum West Generation Dispatch (Peak conditions for 1st half year of 2021)
GENERATION ENCLAVE OUTPUT (MW)
EASTERN (TEMA THERMALS) 809
WESTERN (TAKORADI THERMALS) 1,462.9
EASTERN HYDROS 777.7
NORTHERN HYDROS 230
TOTAL 3,279.6

55…………………………………………………………………………………………………………………………………2021 Electricity Supply Plan
Transmission losses of 217.4 MW (6.63%) were recorded from a simulated peak load of
3,279.6 MW. This shows a marginal 1.41 MW increase in transmission losses compared with
the base case of 215.96 MW. It is observed that the 161 kV Volta - Accra East, Tarkwa – New
Tarkwa, New Tarkwa – Prestea and Takoradi – Tarkwa lines are loaded at 106.9%, 97.4%, 95.9%
and 86% respectively. Also, some severe system voltage violations are observed within Accra and
the mining areas in the West. Specifically, an average voltage of 152kV. is observed across the
161kV Achimota, Winneba, Mallam and Accra East. For the mining areas including the 161kV
Prestea, Dunkwa, Kumasi, Asawinso Ayanfuri and Obotan substations, an average voltage of
139kV is recorded.
2021 PEAK CASE WITH BALANCED GENERATION (2nd Half).
The projected peak for 2021 is 3303.72 MW expected to be realised by the fourth quarter of
the year. By this time it is expected the following projects would have been commissioned:
161kV Volta – Achimota – Mallam corridor upgrade project,
330kV Anwomaso -Kintampo line
330/34.5 kV Pokuase substation
If so, it is expected that the network additions will significantly improve system voltage profile
and consequently reduce transmission losses (the losses will still be above the set PURC
threshold, though).
The Table below shows the generation dispatch from all generation enclaves in Ghana.
Table 5.8: Balanced Generation Dispatch (Peak conditions for 2nd half year of 2021)
GENERATION ENCLAVE OUTPUT (MW)
EASTERN (TEMA THERMALS) 959
WESTERN (TAKORADI THERMALS) 1,320.4
EASTERN HYDROS 793
NORTHERN HYDROS 230
TOTAL 3,303.72
It is noteworthy that aside the effect of optimised power dispatch, the network additions from
completed projects within this period contribute to the improvement observed.

56…………………………………………………………………………………………………………………………………2021 Electricity Supply Plan
The results of the load flow simulations indicate transmission losses of 149.12 MW (4.51%)
which is a 66.84 MW reduction from the first half year figure of 215.96 MW (6.58%). However,
there are observed voltage violation at the 161kV Asawinso (143.3kV),161 kV Dunkwa (149.7kV),
161 kV Ayanfuri (146.5kV) and 161kV Obotan (139.2 kV) substations. There were no line loading
violations observed system wide.
2021 CASE WITH MAXIMUM GENERATION IN THE EAST (2nd Half).
In this scenario, analyses are carried out assuming maximum generation dispatch from the
western enclave (Aboadze) for the second half of 2021. The Table below shows the generation
dispatch from all generation enclaves in the grid.
Table 5.9: Maximum East Generation Dispatch (Peak conditions for 2nd half year of 2021)
GENERATION ENCLAVE OUTPUT (MW)
EASTERN (TEMA THERMALS) 1597.6
WESTERN (TAKORADI THERMALS) 490
EASTERN HYDROS 1010.9
NORTHERN HYDROS 230
TOTAL 3,328.5
The results of the load flow simulations show transmission losses of 175.65 MW (5.28 %) out of
a total of 3,328.5 MW generation. Transmission loss reduction observed here is due to the
assumed completion of the upgrade of the Volta – Achimota – Mallam 161kV corridor, the
completion of the 330kV Anwomaso - Kintampo line and the 330/161/34.5 kV Pokuase
substation.
The completion of these system upgrades and development during this period will relieve the
NITS of most of its line overloads seen in the first half year analysis. However, the KTPP - Volta
161 kV line is highly loaded at 91.6% when two units (220MW) are dispatched at KTPP. Voltage
violations observed show an average voltage of 143.4kV recorded within the mining areas
including the 161kV Prestea, Dunkwa, Asawinso Ayanfuri, and Obotan substations.
As observed in the first half of 2021, the analysis shows that due to improved system conditions
in the second half of 2021, the minimum acceptable generation dispatch from the Western
generation enclave reduces to 450 MW. This dispatch flexibility is because of the removal of

57…………………………………………………………………………………………………………………………………2021 Electricity Supply Plan
overloads on transmission line corridors and associated improvements in the voltage profile in
the western, middle to northern parts of the NITS, that is from the Takoradi Thermal substation
through the mining areas and through Kumasi to the northern parts of the grid. A generation
dispatch less than the 450MW total output from the western enclave may result in voltage
stability issues along the western grid and towards the north.
2021 CASE WITH MAXIMUM GENERATION IN THE WEST (2nd Half).
A maximum western generation dispatch for the second half of 2021 is simulated. The Table
below shows the generation dispatch from all generation enclaves in the grid.
Table 5.10: Maximum West Generation Dispatch (Peak conditions for 2nd half year of 2021)
GENERATION ENCLAVE OUTPUT (MW)
EASTERN (TEMA THERMALS) 690
WESTERN (TAKORADI THERMALS) 1,562.8
EASTERN HYDROS 837.9
NORTHERN HYDROS 230
TOTAL 3,320.7
The results of the simulations indicate transmission losses of 168.50 MW (5.07%) out of
3,320.81 MW generation. Again, the transmission loss figure is seen to have reduced compared
with the 2021 first-half -year case due primarily to the assumed completion of all the on-going
transmission system reinforcement projects .
The 161kV Tarkwa -New Tarkwa and New Tarkwa – Prestea lines are observed to be heavily
loaded at 89% and 88% of their thermal capacities respectively. Similarly, system voltage violations
as observed in the earlier case improve to 145.3kV P.U in this case.
EXPECTED IMPACT OF COMPLETION OF TRANSMISSION SYSTEM PROJECTS
ON GRID PERFORMANCE IN THE 2ND HALF OF 2021
a. 330/34.5 KV POKUASE(A4BSP) SUBSTATION.
The completion and coming into service of the 330/161/34.5 kV Pokuase (A4BSP) substation is
expected by the second half of 2021. Simulations show improvement in system performance.
58…………………………………………………………………………………………………………………………………2021 Electricity Supply Plan
Transmission losses reduce comparing with the previous case (1st half year 2021 Balanced
Generation case) from 215.96 MW to 211.74 MW representing 6.43% of 3,291.62 MW
system generation. However, line overloads are recorded on the 161 kV Volta - Accra East (102
%), 161kV Tarkwa – New Tarkwa (86.9 %), 161 kV New Tarkwa – Prestea (85.4%) lines. This is
a significant improvement on results from the previous case.
Again, substation voltages at the flagged substations i.e. 161kV Dunkwa, Asawinso Ayanfuri, and
Obotan substations record an improved average of 140.1kV P.U.
b. 161kV VOLTA-ACHIMOTA-MALLAM LINE CORRIDOR UPGRADE
Similarly, the upgrade of the 161kV Volta – Achimota – Mallam line corridor also will result in
improvements in system performance. Line overloads reduce further with only the 161kV Tarkwa
– New Tarkwa, 161 kV New Tarkwa – Prestea recording 92.3% and 91.1 % of their line capacities
respectively compared with the 2021 1st half Balanced Generation case. Also, substation voltages
improve recording an average voltage of 0.86 P.U. Transmission losses also reduce from 215.96
MWto 203.07 MW (6.19% of 3,282.61 MW system generation).
c. 330kV ANWOMASO – KINTAMPO LINE
Comparing results of this scenario with that of the first half year balanced generation scenario
above, transmission losses reduce by 62MW from 215.96 MW to 153.30 MW (4.74 % of
3,231.26 MW generation). This system intervention records the most benefits compared with
the other two interventions above. Thus, this project yields greatest improvements in system
performance.
With this line in service, simulations show that export capability to SONABEL increases from the
projected 150 MW to 200 MW on the average. However, the 161kV Volta – Accra East and
Volta –Achimota lines remain overloaded at 113.4% and 88.7% of their rated line capacities
respectively. Voltage violations as seen in the 2021 1st half year Balanced Generation case are still
observed, but significant improvement are observed across substations serving the western
mining communities. An average voltage of 148.4kV is recorded.
N-1 CONTINGENCY ANALYSES
N-1 contingency analyses are studies conducted on sections of a power system to determine the
capability of the section to continue to provide electricity service delivery in the event of an
outage to a single element/equipment, eg. transmission line, transformer, etc.

59…………………………………………………………………………………………………………………………………2021 Electricity Supply Plan
Single line contingency (N-1) analyses are conducted on the 2021 power flow model. The
contingencies are ranked in order of severity and are as follows: The analyses considered the
following criteria:
Contingencies causing severe line overloads
Contingencies causing voltage collapse issues.
Contingencies causing line overloads
a) 330kV Takoradi Thermal – Anwomaso line
Since this high-capacity line carries an average of 450MW at peak, a loss of the line results in re-
routing of almost this amount of power on the 161kV circuit between Aboadze Enclave and
Kumasi. This leads to overloads along the 161kV line circuit in the Western corridor. This will
lead to system disturbances triggered by tripping of 161kV lines between Takoradi Thermal and
Prestea on overload. The solution is to break into the 330kV Takoradi Thermal – Anwomaso
line at Dunkwa with a connection to the 161kV network at the existing Dunkwa substation.
b) 330kV Kintampo – Anwomaso line
A 1000MVA single circuit 330kV strategic line connecting the 330kV high capacity line from
Anwomaso to Kintampo and forming part of the Ghana’s power evacuation highway to the
Northern parts of the NITS and to Burkina Faso (SONABEL). The line carries an average of 240
MW at peak. When the line is out of service, the power-flow is re-routed on the 161kV circuit
between Anwomaso and Kumasi, severely overloading the line as well as the 330/161kV
Autotransformers at Anwomaso. Breaking into the 330kV Takoradi Thermal - Anwomaso line at
Dunkwa minimizes the impact of the line outage.
c) 161kV Tarkwa – Prestea line
This higher capacity 364MVA line in parallel with the low capacity 170MVA Tarkwa- New Tarkwa
– Prestea line carries an average of 160 MW at peak. A loss of this line severely overloads this
parallel line. Operationally, this will also trigger overload relays to trip the lines from Tarkwa
through New Tarkwa to Prestea. This once again is mitigated by a break into the 330kV Takoradi
Thermal – Anwomaso line at Dunkwa. The 161kV Aboadze-Takoradi-Tarkwa -New Tarkwa -
Prestea lines will however require upgrade in the medium term.

60…………………………………………………………………………………………………………………………………2021 Electricity Supply Plan
d) 161kV Aboadze – Tarkwa line
A contingency on this line overloads the smaller capacity 161kV Takoradi Thermal - Takoradi
and Takoradi - Tarkwa lines. These lines are observed to be overloaded at 109% and 155%
respectively. This will eventually cause these lines to trip on overload.
Contingencies causing voltage support issues
a) 330kV Adubiyili – Nayagnia line
This is the terminal section of the 330kV high-capacity power evacuation highway on the Ghana
power ststem which espcially carries power supply to Burkina Faso. A loss of this line will cause
exports to Burkina to be rerouted on the 161kV line from Tamale to Nayagnia and towards
Burkina. These lines are however small in capacity and due to their higher impedance encounter
significant losses resulting in voltage dips.
a) 330kV Takoradi Thermal – A4BSP line
This high capacity 1000 MVA 330kV line carries major portion of the power flowing from the
Takoradi Thermal generation enclave towards Accra and Tema. At peak an average of 190 MW
flows on this line. A loss of this line will cause power to be redirected on the smaller capacity
161kV Takoradi Thermal T3 – Cape Coast- Winneba- Mallam line into Accra. The additional flow
overloads these lines and worsens substation voltages along this corridor. Hence, the Pokuase
substation is back fed from the 330kV Volta substation in Tema.
a) 161kV Dunkwa – Ayanfuri line
This line forms part of the long stretch of lines that serve the western mining communities from
Dunkwa through Ayanfuri to Asawinso and finally to Obotan. With an average of 110 MW of
power flowing on this line at peak, a loss of this line causes a severe voltage dips across the
corridor. Solution is the 330/161kV Dunkwa break-in project.
5.5 DYNAMIC SIMULATIONS
The purpose of the dynamic simulations is to analyse the transient behaviour of the Ghana power
system in disturbed situations (loss of generation or loss of a critical transmission line, etc).
Dynamic simulations were carried out for the power system using a 2021 demand/supply model
of the Ghana power system.
The dynamic study seeks to evaluate the Ghana power system’s transient response to large
system disturbances such as the loss of the biggest production unit.

61…………………………………………………………………………………………………………………………………2021 Electricity Supply Plan
The scope of these simulations involves investigation of the impact of the loss of the biggest
Power Plant (i.e., Twin City -190 MW) on the grid.
Loss of 190 MW Twin City Power Plant
Loss of the 190MW Twin City Power Plant which is the biggest capacity combined cycle
generator on the power system was analysed.
The loss of the Twin City Power Plant results in frequency decay to 49.53 Hz. It is observed from
the plot (Figure 5.1) that only primary frequency control is engaged to arrest the frequency to
avoid further decay which could lead to load shedding via AFLS relay operation.
Figure 5.1: Loss of 190MW C/C Twin City Power Plant-System Frequency plot
In Figure 5.2 we observe that the primary frequency response of all connected power plants
ramped up their active power outputs sufficiently to make-up for the loss and avoid AFLS relay
operation to trip loads.

62…………………………………………………………………………………………………………………………………2021 Electricity Supply Plan
Figure 5.2: Loss of 190MW C/C Twin City Power Plant-Active power output of other Power Plants

67…………………………………………………………………………………2021 Electricity Supply Plan
POWER PLANNING
TECHNICAL COMMITTEE
2021 ELECTRICITY
SUPPLY PLAN
Chapter 6
2021 DISTRIBUTION SYSTEM OUTLOOK

68…………………………………………………………………………………………………………………………………2021 Electricity Supply Plan
6 2021 DISTRIBUTION SYSTEM OUTLOOK
6.1 Introduction
Electricity distribution in Ghana is done by the Electricity Company of Ghana Limited (ECG),
Northern Electricity Distribution Company (NEDCo) and Enclave Power Limited (EPC) namely
the Discos. Whereas ECG and EPC are located in the southern part of Ghana, where the
population is dense and electricity consumption is about 89% of total consumption in Ghana,
NEDCo is responsible for the northern part of Ghana with its geographical area starting from
the Bono Region. NEDCo has a wide operational area covering 64% of the landmass of Ghana
but few customers.
6.2 Interventions for Network Improvement
6.2.1 Projects Executed in Southern Ghana
The following projects and works valued at USD40million were successfully commissioned within
the Southern Electricity Distribution Zone (SEDZ) to help augment ECG’s ability to deliver
quality electricity services to its customers:
Reconstruction of the Tafo and Kpong BSPs, Juapong, Daboase, Inchaban and Awaso
substations to permit the evacuation of power to the mentioned communities and its
environs.
Expansion of the Weija, Tokuse, Koforidua and Winneba substations to increase supply
capacity to the western part of Accra, Kasoa and Winneba.
The interconnecting 33kV and 11kV lines for the above BSPs and substations have all been
completed
In the second quarter of 2020, EPC carried out critical maintenance works on some sections of
the 11kV network in the Tema Free Zones Enclave. Porcelain insulators on some sections of the
11kV network were replaced with polymeric insulators. This was done to remedy the nuisance
tripping on the network due to compromised insulation levels of the insulators from the pollution
of nearby cement factories. Overhead conductors on some sections of the 11kV network were
upgraded to increase network capacity and reduces system distribution losses.
EPC has commenced with the development of a 2km double circuit sub-transmission line and a
switching station for the evacuation of 60MVA of power to the business park area in the Tema

69…………………………………………………………………………………………………………………………………2021 Electricity Supply Plan
Freezones Enclave. This is mainly to facilitate the operations of Ferro Fabric who have requested
for 20MVA power at the end of 2021 third quarter (Q3).
The company also developing a Mini-SCADA system for the Tema Freezones Enclave and the
Dawa Industrial Enclave. This will provide alarms and measurands for analog data monitoring only
from both BSP’s to a centralized location at the Enclave Power Company head office.
At the end of Q2 2020, EPC completed the construction of a laboratory in the Tema Free Zones
Enclave equipped with specialized test instruments to enable EPC conduct test such as meter
calibration and dissolved gas analysis on transformer oils.
6.2.2 Projects Executed in Northern Ghana
In the northern zone, NEDCo’s initiated and continued the implementation of the following
projects as part of efforts to improve the performance of its distribution infrastructure:
30kV shield wire conversion to 34.5kV network to Techiman Aboufour;
20kV shield wire conversion to 34.5kV network at Walewale;
Installation of auto reclosers and sectionalizer on NEDCo feeders; and
Procurement of 287,000 split-smart meters to help combat energy theft within the NEDCo
operational Area. The first batch of the meters has arrived, and installations works are in
progress.
Construction of eight (8no.) primary substations, a Distribution Network Management
System (DNMS/SCADA), and the installation of smart metering systems to revolutionize the
distribution infrastructure of NEDCo and achieve operational efficiency.
NEDCo has also commenced designs works for the construction of eight (8no.) primary
substations across its operational area over a period of 5 years. These substations are expected
to improve the quality of supply to customers as well as reduce technical losses.
6.3 Expected Impact of Ongoing & Executed Projects
The above projects in addition to other planned and ongoing works will help the Discos to
achieve the following regulatory benchmarks for its operations by end of 2021:
A system losses target of 23%;
Revenue collection rate of 98%;
The outage and reliability benchmarks provided in LI 1935; and

70…………………………………………………………………………………………………………………………………2021 Electricity Supply Plan
Generally bring electricity services closer to the doorsteps of customers
6.4 New Developments
6.4.1 Implementation of the Cash Waterfall Mechanism
The Energy Sector commenced the implementation of the Cash Waterfall Mechanism (CWM) in
April 2020. The CWM is a mechanism to ensure the equitable distribution of tariff revenues
accruing to agencies of the Energy Sector on a prorate basis using the amount of generation and
associated invoices from suppliers and the PURC approved allocation of tariffs. The CWM
commenced with ECG and its suppliers including fuel providers and is supported by a natural gas
clearing house.
It is planned that tariff revenues from all discos (including NEDCo and EPC) as well as VRA will
later be included in the CWM. Additionally, a framework to top up and provide for shortages in
payments will be developed and implemented under the CWM to ensure that all utilities and
suppliers receive full payment for invoices.
6.4.2 Additional Renewable Generation in Northern Ghana
In another development, NEDCo will offtake power from a newly commissioned 6.8MWp solar
PV plant commissioned by VRA at Larwa in the Upper West Region. The project which is the
first phase of 17MW and is connected to NEDCo’s 34.5kV distribution infrastructure at Lawra,
will improve the voltage profile on the 110km long 34.5kV feeder of NEDCo.
6.4.3 Utilities MoU with Energy Commission of Ghana
The Energy Commission of Ghana has signed a performance-based memorandum of
understanding with the Discos to help improve the operational performance of the Discos in
Ghana. Under the MoU, KPIs have been set and will be monitored by the EC from time to time.
6.4.4 Network Expansion Initiatives by EPC
The first phase of the distribution network development for the Dawa Industrial Enclave is
currently underway. This comprises the construction of approximately 11km of overhead lines
and a switching station to cater for the expected power demand of current and potential
customers in the Dawa Enclave.

71 …………………………………………………………………………………………………………………………………2021 Electricity Supply Plan
6.4.5 Influx of Small-Scale Renewable Energy (RE) Technologies in Ghana
It is observed that all classes of customers are gradually exploring the use of REs as a way of
introducing reliability to their premises. The Discos have noted and are working towards driving
such initiatives in a win-win manner. The aim is to ensure that customers have value for money
and the electricity distribution assets are not stranded. Additionally, the utilities await on the
regulators to redefine the modalities for electricity exchange under the net metering scheme and
approve the draft procedures and guidelines for enrolment of customers as well as the contract
framework. This will help to properly truck and manage the small scale RE installations to ease
out the threat to grid supply.
6.4.6 Support for Electric Vehicles in Ghana
The Energy Commission and ECG are actively working to promote the use of Electric Vehicles
(EVs) in Ghana. The Commission, is currently developing regulations for EV charging
infrastructure detailing technical guidelines and setting out the statutory requirements for
installations. This is to ensure conformity with international standards, establish the requisite legal
and regulatory framework, ensure compatibility and guard against factors that could affect the
health and safety of consumers,.
Meanwhile, ECG has partnered some firms to support the rollout of the electric vehicle
technology and to provide charging points at selected locations within ECG operational area. This
is to ensure that the company is ahead of innovation and embraces evolving technologies that
boost the consumption of electricity.

76…………………………………………………………………………………2021 Electricity Supply Plan
POWER PLANNING
TECHNICAL COMMITTEE
2021 ELECTRICITY
SUPPLY PLAN
Chapter 7
OVERVIEW OF MEDIUM TERM SUPPLY

77 …………………………………………………………………………………………………………………………………2021 Electricity Supply Plan
7 OVERVIEW OF MEDIUM-TERM SUPPLY: 2022 - 2026
A power system must have sufficient generating capacity at all times to reliably supply its electrical
energy demand. Typically, it takes averagely five years for a conventional power plant project to
evolve from conception through arrangements for funding, detailed design, construction and
commissioning to the commencement of commercial operation.
In a developing country such as Ghana, demand for electricity is expected to continue to grow.
It is therefore expedient for managers of power systems to continually carry out relevant planning
activities to assess the adequacy of generation resources and identify other challenges which
would require addressing in a way to ensure the reliability, security and quality of supply to
consumers.
Medium-term power system planning accordingly assesses electricity demand projections for the
ensuing five (5) year period, the generating resources available to supply demand over the period
and determines the need, if any, for additional generating capacity. It also assesses the need for
reinforcements or changes to the transmission and distribution networks, etc., where it is found
meritorious.
In line with this, we present in this chapter peak demand and consumption projections for the
Medium-Term (2022 - 2026) together with an analysis of the adequacy of generation capacity
over the period to serve as a guide for power system investment planning in order to ensure
security of supply in the Ghana Power System in the medium term.
7.1 Demand Outlook
The Projected electricity demand for the period 2022 – 2026 is based on data collated from a
load survey exercise conducted by the Technical Committee. It takes into consideration
projections for natural growth in domestic demand over the period. It also incorporates some
Spot Loads expected to add to demand in the medium term.
The spot loads expected in the medium term are as follows:
Development of an Integrated Aluminum Industry in Ghana:
Volta Aluminium Company Limited (VALCO) projects to operate 2 potlines (150 MW)
through 2021 to 2022. Per their projection, demand is expected to increase to 300 MW
in 2023 and is expected to further increase to 500 MW by 2024. Upon the completion of

78…………………………………………………………………………………………………………………………………2021 Electricity Supply Plan
the expansion works of VALCO by 2027, the maximum demand is projected to be about
1,000 MW.
However, the ability to purchase power depends on generation cost vis-à-vis the price of
aluminium. In recent times, the price of aluminium has been lower than the grid electricity
generation cost. In view of this and considering VALCO as a strategic industry, the
government by a policy decision, gave legacy hydro with a generation cost of about $3.5
cent to VALCO. This agreement is for a 150 MW and valid to 2023. Beyond 2023 remains
unknown at the time of writing this report.
In view of this the PPTC, for the purpose of this report which influences investment for
generation capacity and grid transmission plan, downgraded VALCO’s demand for the
base case to a maximum of 150 MW (translating to 2potlines) throughout the
planning period. The 500 MW for VALCO is therefore considered under the High case
scenario. These are subject to review in the development of 2022 Annual Supply Plan.
Mines:
Total demand for mines is expected to increase from 271 MW in 2022 to 331 MW
MW in 2026. Some of the specifics are as follows
Newmont Mines, Ahafo - demand is expected to increase from 46 MW in 2021
to 89 MW in 2026 at Ahafo-North;
Azuma Mines - 18 MW by 2025 at Yagha (50km North West of Wa);
Anglogold Ashanti – demand is expected to increase to 49 MW by 2026.
Potential Exports:
Total export is expected to increase from 322 MW in 2022 to 430 MW in 2026
No planned export to CIB but inadvertently export can occur owing to
interconnected system conditions;
150 MW export to CEB through to 2026
170 MW in 2022, 184 MW in 2023 and further increasing to 200 MW from 2024
onwards as export to SONABEL

79…………………………………………………………………………………………………………………………………2021 Electricity Supply Plan
80 MW export to Mali is expected to begin by 2026.
Total electricity requirement for Ghana including power exports to Togo, Benin, Burkina Faso
and Mali is projected to increase from 22,799 GWh in 2022 to 28,550 GWh by 2026 at a
Compound Annual Growth Rate (CAGR) of approximately 5.8%. The Ghana system peak
demand is projected to increase from 3,539 MW in 2022 to 4,460 MW in 2026.
The summary of 2022-2026 projected demand is illustrated in Tables 8.1 and 8.2.
Table 7.1: Projected Energy Demand (GWh) (2022- 2026)
2022 2023 2024 2025 2026
Domestic 19,590 20,859 22,199 23,639 25,031
VALCO 1,315 1,371 1,371 1,371 1,371
Exports 1,894 1,946 2,001 2,059 2,148
TOTAL 22,799 24,177 25,572 27,069 28,550
Table 7.2: Projected Peak Demand (MW) (2022- 2026)
2022 2023 2024 2025 2026
Domestic 3052 3240 3449 3656 3865
VALCO 165 165 165 165 165
Exports 322 334 350 350 430
TOTAL 3,539 3,739 3,964 4,171 4,460
7.2 Projected Supply Outlook
The power supply outlook was prepared considering the existing and committed capacity
additions. The assessment of generation adequacy is based on ensuring that sufficient generation
resources are available to meet the forecast demand including the required 18% capacity
operating reserve margin.
7.2.1 Existing Generation
The existing generating facilities in Ghana are made up of hydro, thermal and renewable energy
sources. The breakdown of projected demand versus expected supply from the existing
generation resources is as shown in Table 8.3.
Table 7.3: Projected Demand and Supply balance (2022- 2026)
Projected Capacity Demand (MW) 2022 2023 2024 2025 2026
Domestic 3052 3240 3449 3656 3865
VALCO 165 165 165 165 165
Exports 322 334 350 350 430
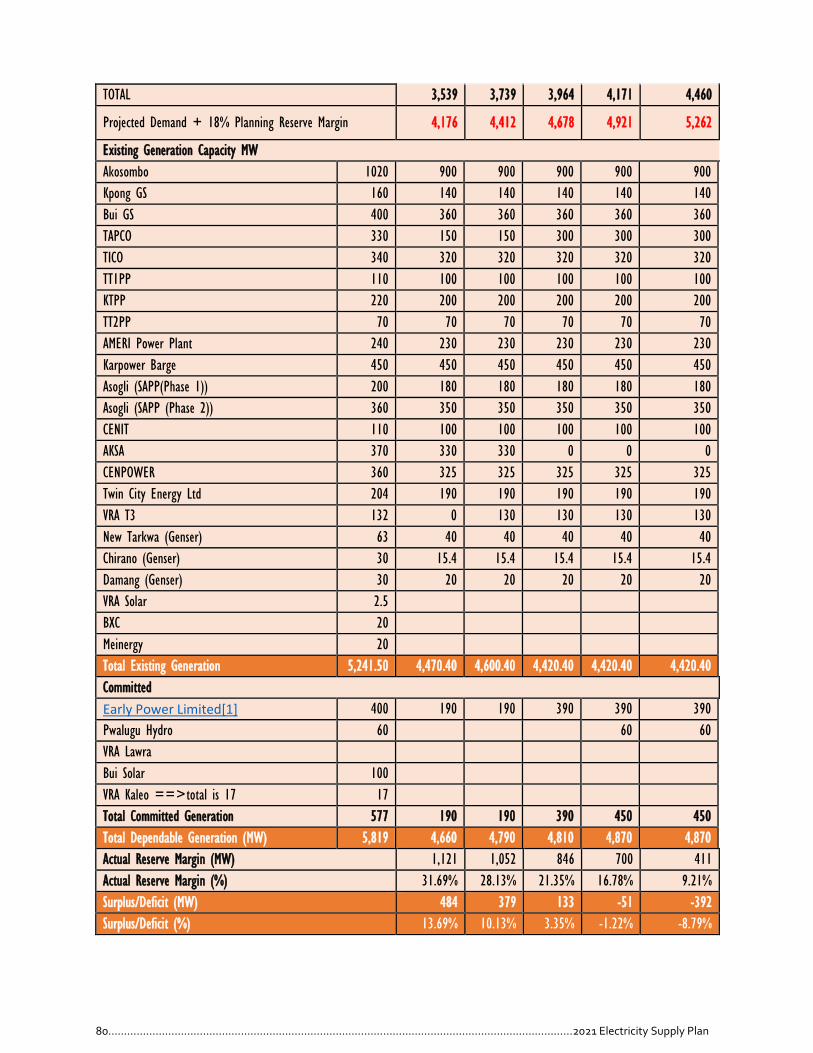
80…………………………………………………………………………………………………………………………………2021 Electricity Supply Plan
TOTAL 3,539 3,739 3,964 4,171 4,460
Projected Demand + 18% Planning Reserve Margin 4,176 4,412 4,678 4,921 5,262
Existing Generation Capacity MW
Akosombo 1020 900 900 900 900 900
Kpong GS 160 140 140 140 140 140
Bui GS 400 360 360 360 360 360
TAPCO 330 150 150 300 300 300
TICO 340 320 320 320 320 320
TT1PP 110 100 100 100 100 100
KTPP 220 200 200 200 200 200
TT2PP 70 70 70 70 70 70
AMERI Power Plant 240 230 230 230 230 230
Karpower Barge 450 450 450 450 450 450
Asogli (SAPP(Phase 1)) 200 180 180 180 180 180
Asogli (SAPP (Phase 2)) 360 350 350 350 350 350
CENIT 110 100 100 100 100 100
AKSA 370 330 330 0 0 0
CENPOWER 360 325 325 325 325 325
Twin City Energy Ltd 204 190 190 190 190 190
VRA T3 132 0 130 130 130 130
New Tarkwa (Genser) 63 40 40 40 40 40
Chirano (Genser) 30 15.4 15.4 15.4 15.4 15.4
Damang (Genser) 30 20 20 20 20 20
VRA Solar 2.5
BXC 20
Meinergy 20
Total Existing Generation 5,241.50 4,470.40 4,600.40 4,420.40 4,420.40 4,420.40
Committed
Early Power Limited[1] 400 190 190 390 390 390
Pwalugu Hydro 60 60 60
VRA Lawra
Bui Solar 100
VRA Kaleo ==>total is 17 17
Total Committed Generation 577 190 190 390 450 450
Total Dependable Generation (MW) 5,819 4,660 4,790 4,810 4,870 4,870
Actual Reserve Margin (MW) 1,121 1,052 846 700 411
Actual Reserve Margin (%) 31.69% 28.13% 21.35% 16.78% 9.21%
Surplus/Deficit (MW) 484 379 133 -51 -392
Surplus/Deficit (%) 13.69% 10.13% 3.35% -1.22% -8.79%

81…………………………………………………………………………………………………………………………………2021 Electricity Supply Plan
7.2.2 Committed Generation Projects
The following are the committed generation facility projects expected to come on line in the
medium-term:
Projects Under Construction
Early Power: This is a 400 MW power plant located at Tema and would be
constructed in two phases made up of 200 MW each. Phase 1A of the first phase (147
MW) is expected to be commissioned in the first quarter of 2021, while the second
part, phase 1B of 53 MW, would come online in 2022. The final phase making up the
400 MW is planned to be commissioned by 2024.
Pwalugu Hybrid Hydro and Solar Plant: This is a 60 MW hydro electric plant in
hybrid operation with a 50 MWp Solar PV plant which is expected to be completed and
commissioned by 2025. The plant is planned to be located in the Upper East Region.
Kaleo Solar PV Plant: This is a 17 MW PV plant being constructed by VRA at Kaleo
and Lawra in the Northern Region. It is planned to be commissioned in 2020.
Edikan Power Plant: This is a 42 MW thermal power plant. It’s an embedded
generation at Ayamfuri in the Central Region. It is expected to commence operation
third quarter of 2022.

82…………………………………………………………………………………………………………………………………2021 Electricity Supply Plan
Figure 7.1: Projected Base Demand Versus Supply balance (2022 - 2026)
7.2.3 Demand and Supply Balance
A comparative analyses of the projected medium term demand and the corresponding projected
supply generating capacity was carried out, as presented in Table 8.3 and Figure 8.1. The total
dependable capacity, including existing and committed/ongoing generation projects was
compared with projected reference case peak demand with 18% operating reserve margin.
The results of the analyses indicate that existing generating capacity will be adequate to serve
projected demand and 18% reserve margin for 2022 and 2023 with corresponding surplus being
484 MW (13.69%) and 133 MW (3.35%) respectively. However, the completion of the committed
projects are needed from 2024 onwards. The committed projects would suffice upto 2024,
additional generation capacity is needed in 2025 and 2026 to meet the reserve margin required
for reliability.
7.2.4 Additional Generation Requirement
Requirements for additional electricity generation resource acquisition are determined in
accordance with the policy to balance supply and demand taking into account the need for the
provision of adequate reserve capacity to cater for contingencies.
Deducing from the demand and supply balance analysis, total (existing and committed)
dependable capacity for the years up to 2026 would NOT be adequate to serve projected
2,000
2,500
3,000
3,500
4,000
4,500
5,000
5,500
2022 2023 2024 2025 2026
MW
Base Case Demand-Supply Outlook (2022-2026)
Existing Gen. (Dependable Capacity) Committed Generation
Additional Capacity Required Projected Base Case Demand
Projected Base Case + 18% Reserve

83…………………………………………………………………………………………………………………………………2021 Electricity Supply Plan
demand and the 18% operating reserve margin required for reliability. Specifically, 51 MW and
392 MW additional generation capacity (aside the committed power plants) is
needed in 2025 and 2026 respectively to meet the reserve margin required for
reliability.
7.2.5 High Demand Sensitivity on Supply
The aim is to analyse the sensitivity of power demand on supply. This is particulary important
due to government’s flagship programmes such as the integrated aluminium and steel programme.
The successful completion of this singular programme can increase the consumption of aluminium
smelting in the country by multiple folds.
Figure 7.2: Projected High Demand Versus Supply balance (2022 - 2026)
If VALCO’s demand should increase to 500 MW from 2024 onwards, and Domestic demand
should also increase by 100 MW on top of base case for each ensuing year, then as evident in
figure 8.2, in addition to the additional capacity needed under Base Case, a further 381 MW, 514
MW and 514 MW of generation would be required in 2024, 2025 and 2026 respectively.
2,000
2,500
3,000
3,500
4,000
4,500
5,000
5,500
6,000
2022 2023 2024 2025 2026
MW
High Case Demand-Supply Outlook (2022-2026)
Additional Capacity Required
Base Case Supply Requirement (Dependable generation + additional Capacity under Base case)
Projected High Case Demand
Projected High Case + 18% Reserve
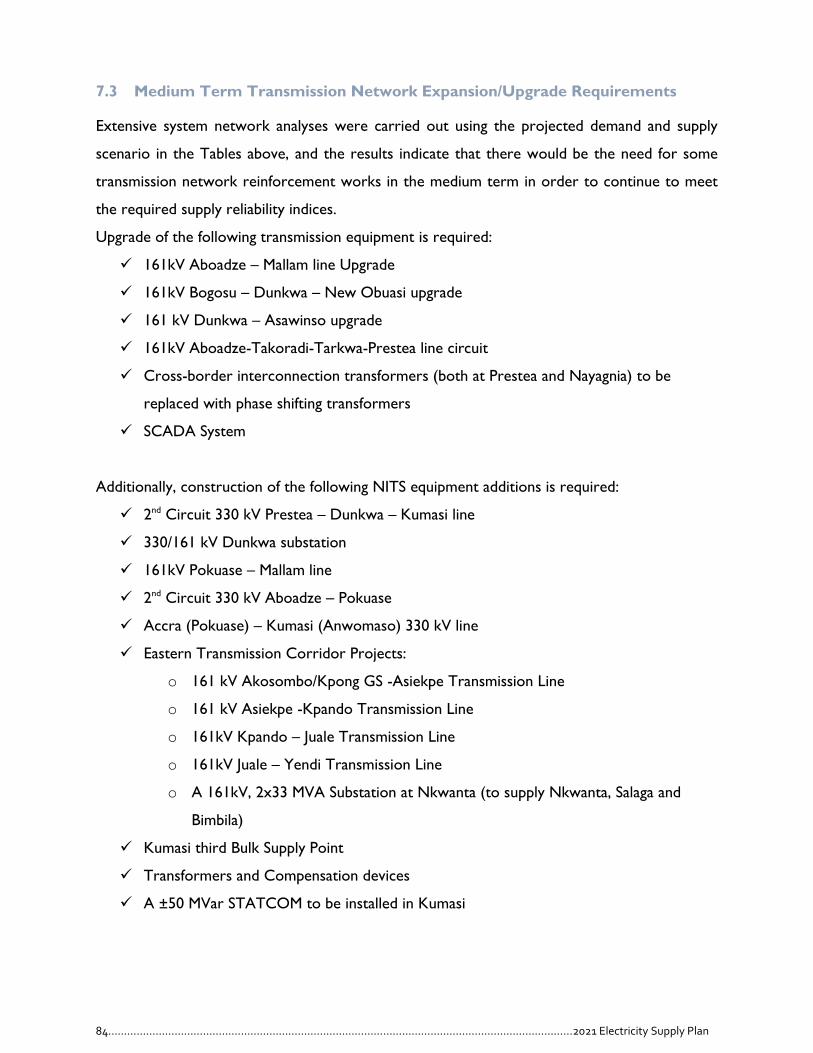
84…………………………………………………………………………………………………………………………………2021 Electricity Supply Plan
7.3 Medium Term Transmission Network Expansion/Upgrade Requirements
Extensive system network analyses were carried out using the projected demand and supply
scenario in the Tables above, and the results indicate that there would be the need for some
transmission network reinforcement works in the medium term in order to continue to meet
the required supply reliability indices.
Upgrade of the following transmission equipment is required:
161kV Aboadze – Mallam line Upgrade
161kV Bogosu – Dunkwa – New Obuasi upgrade
161 kV Dunkwa – Asawinso upgrade
161kV Aboadze-Takoradi-Tarkwa-Prestea line circuit
Cross-border interconnection transformers (both at Prestea and Nayagnia) to be
replaced with phase shifting transformers
SCADA System
Additionally, construction of the following NITS equipment additions is required:
2nd Circuit 330 kV Prestea – Dunkwa – Kumasi line
330/161 kV Dunkwa substation
161kV Pokuase – Mallam line
2nd Circuit 330 kV Aboadze – Pokuase
Accra (Pokuase) – Kumasi (Anwomaso) 330 kV line
Eastern Transmission Corridor Projects:
o 161 kV Akosombo/Kpong GS -Asiekpe Transmission Line
o 161 kV Asiekpe -Kpando Transmission Line
o 161kV Kpando – Juale Transmission Line
o 161kV Juale – Yendi Transmission Line
o A 161kV, 2x33 MVA Substation at Nkwanta (to supply Nkwanta, Salaga and
Bimbila)
Kumasi third Bulk Supply Point
Transformers and Compensation devices
A ±50 MVar STATCOM to be installed in Kumasi

85…………………………………………………………………………………………………………………………………2021 Electricity Supply Plan
7.4 Creation of new Generation Enclaves
Currently apart from Akosombo GS and Bui GS, there are two other generation enclaves in
Ghana, namely the Tema and the Takoradi thermal generation enclaves.
Power system network analyses carried out show that establishing new generation enclave near
Kumasi and Winneba result in considerable improvement in the stability of the NITS and
significantly reduces transmission system losses. It also improves the quality of supply to end
users through improved network voltage control via generators.
7.4.1 360 MW Plant sited at Kumasi
Results for an analysis carried out on a 2022 network model which assumes a total system
generation of 3,543.2 MW. For the base case scenario, total system losses were 132.5 MW
representing 3.74 % of total generation.
Power flow and analyses indicate that siting a 360 MW combine cycle thermal plant at Kumasi
results in a the significant reduction in transmission losses to 107.6 MW representing 3.1% of
total generation. A reduction in total system losses of 24.9 MW is thus achieved.
Table 8.4 shows the load flow results.
Table 7.4: Comparison of system losses (MW) - Siting Generation at Kumasi
No generation at Kumasi
360 MW generation at Kumasi
Losses (MW) 132.5 MW 107.6 MW
The results again show significant reduction in some transmission line loadings (congestion) within
the South West to Ashanti corridor as shown in Table 8.5:
Table 7.5: Comparison of line loadings (% line thermal capacity) - Siting Generation at Kumasi
It also shows bus voltage improvements as shown in Table 8.6.
Table 7.6: Comparison of bus Voltages (kV) - Siting Generation at Kumasi
Percentage Line Loading
No Generation 360 MW Generation at Kumasi
New Tarkwa – Tarkwa 76% 56%
Takoradi - Tarkwa 56% 41%
Dunkwa -Ayanfuri 93% 87%
Dunkwa - New Obuasi 86% 107%

86…………………………………………………………………………………………………………………………………2021 Electricity Supply Plan
Bus Voltage (kV) No generation at Kumasi 360 MW generation at Kumasi
Dunkwa 150.7 162.9
Ayanfuri 148.7 159.8
New Obuasi 153.7 160.9
Kumasi 156.4 159.1
7.4.2 360 MW Plant sited between Winneba and Kasoa
Power flow analyses indicate that siting a 360 MW generation facility in the immediate western part
of Accra (ie., between Winneba and Kasoa) also results in significant improvements in the
transmission network voltage profile. It also reduces congestion on the 161 kV Aboadze – Mallam
and Volta – Mallam transmission corridors. Additionally, total transmission system losses of 135.2
MW (3.8 %) is reduced to 115.1 MW (3.2%).
Tables 8.7 to 8.8 show the load flow results.
Table 7.7: Comparison of system losses (MW) - Siting Generation at Kumasi
No generation at Winneba
360 MW generation at Winneba
Losses (MW) 135.2 MW 115.1 MW
It also shows bus voltage improvements in Accra, Winneba and Kasoa as shown in Table 8.8.
Table 7.8: Comparison of bus Voltages (MW) - Siting generation at Winneba
Bus Voltage (kV) No generation at Winneba 360 MW generation at Winneba
Mallam 152.5 156.4
Achimota 155.3 157.9
Winneba 149.7 161.3
Accra Central 152.7 156.1
Kasoa 150.5 158
Furthermore, in the event of an outage to the 330kV Aboadze – Volta line, the remaining Coastal
lines get highly loaded (about 86% of line thermal capacity). With generation in Winneba the flow on
the line reduces to 29% of the line’s thermal capacity under same contingency (with the 330kV
Aboadze - Volta line still out of service).

84…………………………………………………………………………………2021 Electricity Supply Plan
POWER PLANNING
TECHNICAL COMMITTEE
2021 ELECTRICITY
SUPPLY PLAN
Chapter 8
CONCLUSIONS

85…………………………………………………………………………………………………………………………………2021 Electricity Supply Plan
8 CONCLUSIONS
The following conclusions are drawn in respect of the Electricity Supply Plan for 2021 and for the
medium term (2022 – 2026):
a) Despite the crippling effect the COVID-19 pandemic had on economies globally in the year
2020, there was no significant net impact on Electricity demand in Ghana. Actual demand
and supply statistics for the year were as follows:
2020 Demand Statistics 2020 Projection 2020 Actual % Deviation
System Peak Demand 3,060.7 MW 3,089.5 MW 0.9
Total System Energy
Consumption(less Losses)
18,711.2 GWh 18,828.8 GWh 0.6
Domestic Energy
Consumption
17,118.8 GWh 17,561.5 GWh 2.5
Total Exports 1,787.1 GWh 1,855.1 GWh 3.8
Total Energy Generated 19,608.2 GWh 19,716.6 GWh 0.5
Total Imports 0 GWh 58.2 GWh
b) It is noteworthy from the above table that the actuals attained were very close to the
projections made in 2020.
8.1 Demand and Supply Outlook
a) The 2021 total system demand is projected to be 3,303.72 MW (base case), representing a
6.9 % growth over the 2020 peak demand of 3,090 MW. The corresponding projected
energy consumption for 2021 is 21,265.52 GWh of which:
Hydro supply will be 7,001.2 GWh representing 32.92% of the total energy supply;
Thermal supply will be 14,111.8 GWh representing 66.36% of total energy supply;
and
Renewables supply will be 152.3 GWh representing 0.72% of total energy supply
b) Total projected energy exports are 1,527.26 GWh for 2021.

86…………………………………………………………………………………………………………………………………2021 Electricity Supply Plan
c) VALCO is expected to operate on two pot lines with projected total consumption of
1,055.13 GWh.
d) There is the need to dispatch Bui Hydro Plant conservatively throughout 2021 to ensure
that the reservoir is not drawn down below its minimum operating levels to guarantee
sustainable operations in the coming years.
Natural Gas 123,903,040 MMBtu
HFO - 121,849 barrels
e) There is no projected requirement for LCO in 2021due to anticipated high volumes of gas
from Sankofa, Jubilee, TEN fields as well as from Nigeria and the envisaged LNG project.
Strategic stocks will however be required to be kept in reserve for use as back-up fuel in
the event of any gas supply upsets.
f) In terms of fuel cost for gas and HFO, an annual total of approximately 758.8 Million USD
is required, averaging a monthly total of US$ 63.23 Million.
8.2 Requirements for NITS Reinforcement
a) By the end of the first half of 2021, the following projects are expected to be completed
and commissioned. The expected corresponding savings in losses are also indicated:
161kV Volta – Achimota – Mallam line corridor upgrade project, saving 12MW at
peak
330/34.5 kV Pokuase substation which saves 4MW at peak
Energization of the 330kV Anwomaso – Kintampo line offers the system conditions
with losses reduced by 62MW to 153.3 MW (4.86 %). Loading on the 161kV
Anwomaso-Kumasi line will reduce significantly thus improving voltages in Kumasi
b) A first half-year analysis of the network considering a maximum West, maximum East and
Balanced generation dispatch scenarios show that
A maximum East dispatch will result in the highest recorded transmission losses of
221. 61 MW representing 6.75 % of peak demand of 3,284.7 MW
Transmission losses recorded in the maximum west dispatch scenario follows with
an average of 217.4 MW representing 6.63 % of peak demand.
A balanced generation dispatch records the lowest transmission losses of 215.96
MW representing 6.58 % of 3,283.4 MW peak demand
c) In all the simulated dispatch scenarios for the first half of 2021, there are overloads on the
161kV Volta-Accra East- Achimota corridor, the 161kV Kumasi – Anwomaso and the

87…………………………………………………………………………………………………………………………………2021 Electricity Supply Plan
161kVTarkwa - New Tarkwa - Prestea lines. There will be low voltages recorded
predominantly across substations serving the mining communities in the West. These
overloads and low voltages will be the main drivers of high transmission losses for this
period.
d) With the expected low water level of the Bui Hydro Plant in the first half of 2021, a current
system simulation considering a Bui Hydro Plant maximum output of 200 MW (two units)
show that transmission losses increase to a high of 199.52 MW represent 7.47 % of
2,670.4 MW off-peak demand.
e) For the second half of 2021, the system peak demand is 3,303.72 MW. During this period,
it is expected that all the above-mentioned projects under construction will be
commissioned.
f) Simulations show that during the second half of 2021, the balanced generation dispatch
scenario significantly improves system performance with reduced transmission losses to
about 149.12 MW representing 4.51 % of peak demand, with few observed line loading
violations.
g) In contrast, a maximum east dispatch scenario proves to be the least preferred option with
transmission losses recording a high of 175.65 MW representing 5.28 % of peak demand.
h) During the second half of the year, the following transmission lines may record overloads
with maximum generation from their adjoining enclaves;
161kV KTPP –Volta
161kV Tarkwa – New Tarkwa – Prestea lines
i) Single line contingency (N-1) analyses for 2021 show that the 330 kV and 161kV
transmission line corridors from Aboadze Enclave to Kumasi are the most critical. A
contingency on any of the transmission lines leads to system disturbance since the evacuate
heavy amounts of power from Aboadze
j) There are low voltages recorded in the Dunkwa, Ayanfuri, Asawinso substations.
8.3 Distribution Systems
a) ECG has initiated the use of drones to monitor the distribution networks and collect data
for preventive maintenance on their distribution network.
b) A number of upgrade projects have been commissioned into service to help augment ECG’s
ability to increase distribution capacity and reliability of supply to customers. These are;
88…………………………………………………………………………………………………………………………………2021 Electricity Supply Plan
Reconstruction of Tafo, and Kpong BSPs, Juapong, Daboase, Inchaban and Awaso
substations to increase power evacuation to their communities and its environs.
Expansion of Weija, Tokuse, Koforidua and Winneba substations to increase supply
capacity to the western part of Accra, Kasoa and Winneba.
c) Power supply reliability in NEDCo Areas is generally good. However, reliability in some
areas of the network has been lower than expected due to over extension and over-ageing
distribution lines resulting in high technical losses. Some interventions, however, have been
made on some of these lines resulting in improved supply reliability on them. These include
Conversion of shield wire systems to conventional 34.5kV feeder circuits at Abofuor
and Walewale.
Procurement of smart meters to help combat theft within the NEDCo operational
area.
Construction of eight (8no.) primary substations and a Distribution Network
Management System (DNMS/SCADA)
8.4 Medium Term Supply
a) Total electricity requirement for Ghana including power exports to Togo, Benin, Burkina
Faso and Mali is projected to increase from 22,799 GWh in 2022 to 28,550 GWh by 2026
at a Compound Annual Growth Rate (CAGR) of approximately 5.7%. The Ghana system
peak demand is projected to increase from 3,539 MW in 2022 to 4,460 MW in 2026.
b) The deployment of the committed generation capacities, would be adequate to meet
projected demand including a reserve capacity of 18% only up to 2024. Highest surplus of
13.7% (484 MW) in 2022 decreasing to 3.3% (133 MW) in 2024.
c) Additional generation capacity is needed from 2025. Specifically, 51 MW and 392 MW
additional generation capacity is needed in 2025 and 2026 respectively.
d) Under High Demand Scenario, in addition to the additional capacity needed under Base
Case, a further 381 MW, 514 MW and 514 MW are needed in 2024, 2025 and 2026
respectively.

87…………………………………………………………………………………2021 Electricity Supply Plan
POWER PLANNING
TECHNICAL COMMITTEE
2021 ELECTRICITY
SUPPLY PLAN
Chapter 9
RECOMMENDATIONS

88…………………………………………………………………………………………………………………………………2021 Electricity Supply Plan
9 RECOMMENDATIONS
Based on the above conclusions, the following recommendations are made:
a) Adopt a conservative dispatch of the Bui GS to manage the use of its limited head water
until the next inflow season.
b) Installation of a third 161/34.5kV transformer at Anwomaso Substation and the transfer of
some load from the ECG substation at Ridge, Kumasi to Anwomaso in order to limit
congestion on the 161 kV Anwomaso – Kumasi line especially when Bui is not running
during off-peak periods.
c) Ongoing transmission expansion projects should be expedited and completed in the first
half of 2021 to ensure that the NITS continues to have adequate capacity to supply all
projected customer loads with minimal losses. These projects include:
161kV Volta – Achimota – Mallam Transmission Line Upgrade Project
330 kV Anwomaso – Kintampo transmission line Project
330/34.5kV Pokuase Substation
d) GRIDCo urgently needs the implementation of the break-in on the 330 kV Takoradi
Thermal – Anwomaso line at Dunkwa with the construction of the 330/161kV Dunkwa II
Substation to address the low voltage situation in the Western parts of the NITS. It will
also help improve power system stability.
e) In order to continue to adequately meet growing demand as well as transmission reliability
index requirements, the following critical transmissions additions and upgrades are required
in the medium term:
Upgrade of 161kV Takoradi Thermal – Takoradi – Tarkwa – Prestea circuit.
Construction of a second 330 kV Prestea - Dunkwa – Kumasi line,
161 kV Mallam – A4BSP transmission line link.
Construction of a second 330 kV Aboadze – Pokuase (A4 BSP) circuit.
Construction of a double circuit 330 kV line from Accra (A4BSP) to Kumasi (K2BSP).
Upgrade of 161kV Aboadze-Mallam transmission lines
f) Prepare the grid and System Control Centre for grid connected RE sources of generation.
g) Repair and restore all defective capacitor banks and reactive compensation devices on the
NITS especially in the southern parts of the NITS.

89…………………………………………………………………………………………………………………………………2021 Electricity Supply Plan
h) Power Supply Outage management for the ongoing projects should be well coordinated to
reduce the impact on customers.
i) There is a need to procure additional generation capacity (51 MW in 2025 and 392 MW in
2026) (through a competitive least cost procurement process) in order to continue to meet
the Ghana power system electricity demand with the required reserve margin by 2025.
j) Considering the lead time for planning, procurement, design, construction and
commissioning of power plants, the procurement process should commence on time.
k) However, if proposed plans to retrofit and scale-up operations at VALCO up to 500MW
by 2024 (IAI & VALCO) materialise and domestic demand is higher than base case by 100
MW, then the requirement for additional generation will come earlier, in 2024, and much
higher. In addition to the additional capacities under Base case, a further 381 MW in 2024,
514 MW in 2025 and another 514 MW in 2026 is needed. the procurement process for
additional generation would have to start much earlier.
l) Continue to engage stakeholders and grid participants on loss reduction strategies which
will ensure that system losses are minimised.
m) Install a dynamic voltage support device (50MVAr Statcom) in Kumasi to address voltage
excursions.
n) Create a generation hub/enclave in Kumasi for network stability, and to address voltage
limit violations in the mid-sections of the Ghana power system in situations such as where
Bui units are not in service and to reduce line loadings between Kumasi and the South East
as well as the South West generation enclaves. It will give Ghana a competitive advantage
for power export to Burkina, Mali and other potential customers north of Ghana.

90…………………………………………………………………………………………………………………………………2021 Electricity Supply Plan
10 APPENDICES
Appendix A –Forecast: Peak and Energy Demand
A1: Base Case - Peak Demand Forecast (MW): 2021 - 2030
A2: Base Case - Energy Demand Forecast (GWh) -2021 – 2030
Appendix B – Planned Generating Equipment Maintenance Schedule
Appendix C – Glossary
Appendix D– Grid Map
Appendix E – Summary of NITS Load Flow analyses (Contingency Cases)

91…………………………………………………………………………………………………………………………………2021 Electricity Supply Plan
APPENDIX A - FORECAST PEAK DEMAND AND ENERGY CONSUMPTION
A1: Base Case - Peak Demand Forecast (MW): 2021 – 2030
Load forecast: Peak demand (MW) 2021 2022 2023 2024 2025 2026 2027 2028 2029 2030
ECG 2,106.8 2,210.4 2,343.9 2,485.5 2,635.6 2,794.8 2,963.6 3,142.6 3,332.5 3,533.7
NEDCo 263.8 286.6 309.4 334.0 360.5 389.1 420.1 453.4 489.5 528.4
ENCLAVE POWER COMPANY 57.0 70.8 73.6 77.3 81.9 84.6 91.0 93.8 99.4 103.0
MINES 243.0 269.1 286.9 302.8 326.6 328.5 331.7 331.3 329.7 328.1
Other Bulk Customers 59.8 59.5 59.9 70.8 71.2 71.2 71.2 71.6 71.6 71.7
VALCO 130.0 164.8 164.8 164.8 164.8 164.8 292.9 292.9 371.0 371.0
CEB(Togo/Benin) 150.0 150.0 150.0 150.0 150.0 150.0 150.0 150.0 150.0 150.0
SONABEL(Burkina) 150.0 171.7 183.8 200.0 200.0 200.0 200.0 200.0 200.0 200.0
CIE(Ivory Coast) 0.0 0.0 0.0 0.0 0.0 0.0 0.0 0.0 0.0 0.0
EDM(Mali) 0.0 0.0 0.0 0.0 0.0 80.0 90.0 100.0 100.0 100.0
Network Usage 1.9 2.0 2.1 2.2 2.4 2.5 2.7 2.9 3.0 3.2
LOSSES 149.1 154.0 164.4 176.8 177.6 194.0 225.5 246.6 262.3 274.7
Total 3,311.4 3,539.0 3,738.8 3,964.1 4,170.6 4,459.7 4,838.8 5,085.2 5,409.0 5,663.9

92…………………………………………………………………………………………………………………………………2021 Electricity Supply Plan
A2: Base Case -Projected Energy Demand (GWh) -2021-2030
Load forecast: Energy (GWh) 2021 2022 2023 2024 2025 2026 2027 2028 2029 2030
ECG 13583.00 14403.41 15273.38 16195.89 17174.12 18211.44 19311.41 20477.82 21714.68 23026.25
NEDCo 1611.76 1761.20 1901.16 2052.23 2215.32 2391.36 2581.39 2786.52 3007.96 3246.99
ENCLAVE POWER COMPANY 306.03 352.44 366.17 384.48 407.36 421.09 448.56 466.86 494.33 512.64
MINES 1822.28 1928.25 2113.42 2223.72 2456.33 2503.75 2528.22 2542.11 2530.18 2520.43
DIRECT 260.37 260.43 260.50 326.42 326.49 326.57 326.64 326.71 326.79 326.86
VALCO 1055.13 1315.10 1371.47 1371.47 1371.47 1371.47 2624.85 2624.85 2546.42 2546.42
CEB(Togo/Benin) 512.14 843.59 843.59 843.59 843.59 843.59 843.59 843.59 843.59 843.59
SONABEL(Burkina) 1000.00 1050.00 1102.50 1157.63 1215.51 1215.51 1215.51 1215.51 1215.51 1215.51
CIE(Ivory Coast) 15.12 0.00 0.00 0.00 0.00 0.00 0.00 0.00 0.00 0.00
EDM(Mali) 0.00 0.00 0.00 0.00 0.00 88.76 328.50 469.54 469.54 657.00
Network Usage 10.56 11.34 12.03 12.69 13.45 14.16 15.65 16.45 17.19 18.10
LOSSES 1079.96 873.10 932.72 1003.40 1045.44 1162.42 1337.39 1432.35 1487.37 1536.59
Total
21,256.36
22,798.87
24,176.93
25,571.51
27,069.06
28,550.12
31,561.69
33,202.30
34,653.54
36,450.36

93 2021 Electricity Supply Plan
APPENDIX B: GENERATOR PLANNED MAINTENANCE SCHEDULE
i. 1st Quarter 2021 Schedule:
GENERATING PLANT UNIT FROM TO DESCRIPTION OF WORK
1G1 22-Feb 29-Apr SCADA UPGRADE/ANNUAL MAINTENANCE
1G2
1G3
1G4
1G5
1G6
19G1
19G2
19G3
19G4
54G1 11-Jan 15-Jan QUARTERLY MAINTENANCE
54G2 15-Mar 19-Mar QUARTERLY MAINTENANCE
54G3 1-Feb 26-Feb ANNUAL MAINTENANCE
54G4 22-Mar 23-Mar QUARTERLY MAINTENANCE
Tsatsadu 27-Jan 29-Jan MAINTENANCE
Bui Solar
32G1 9-Jan 10-Jan OFFLINE WATER WASH
32G2 30-Jan 31-Jan OFFLINE WATER WASH
32G3
32G4 2-Feb 4-Feb ENHANCED BOROSCOPE INSPECTION/OFFLINE WATER WASH
32G5 5-Feb 7-Feb ENHANCED BOROSCOPE INSPECTION/OFFLINE WATER WASH
32G6
TT1PP 47G1
67G1 15-Jan 22-Jan TYPE B INSPECTION
67G2
50G1
50G2
50G3
50G4
50G5
50G6
50G7
50G8
CENIT 47G2
51G1 24-Dec 6-Jan CLASS C MAINTENANCE
51G2
51G3
51G4
51G5
51G6
51G7
51G8
51G9
51G10
79G1 4-Jan 22-Jan WARTSILA ENGINE VIBRATION DAMPER MAINTENANCE
79G2 25-Jan 12-Feb WARTSILA ENGINE VIBRATION DAMPER MAINTENANCE
79G3 15-Feb 5-Mar WARTSILA ENGINE VIBRATION DAMPER MAINTENANCE
79G4
79G5
79G6
79G7
79G8
79G9
79G10
79G11
79G12
79G13
79G14
79G15
79G16
79G17
79G18
79G19 8-Mar 26-Mar WARTSILA ENGINE VIBRATION DAMPER MAINTENANCE
79G20
79G21
79G22
74G1
74G2
74G3
74G4
74G5
74G6
74G7
74G8
74G9
74G10
7-Jan 7-Jan 8000 hrs PLANNED MAINTENANCE
19-Feb 20-Feb 9000+18000 hrs PLANNED MAINTENANCE
8-Jan 8-Jan 8000 hrs PLANNED MAINTENANCE
1-Feb 2-Feb 9000+18000 hrs PLANNED MAINTENANCE
15-Mar 15-Mar 2000 hrs PLANNED MAINTENANCE
1-Jan 1-Jan 8000 hrs PLANNED MAINTENANCE
12-Feb 12-Feb 9000 hrs PLANNED MAINTENANCE
4-Jan 4-Jan 8000 hrs PLANNED MAINTENANCE
9-Feb 10-Feb 9000+18000 hrs PLANNED MAINTENANCE
23-Mar 23-Mar 2000 hrs PLANNED MAINTENANCE
26-Jan 27-Jan 18000 hrs PLANNED MAINTENANCE
10-Feb 10-Feb 9000 hrs PLANNED MAINTENANCE
25-Mar 25-Mar 2000 hrs PLANNED MAINTENANCE
5-Feb 5-Feb 9000 hrs PLANNED MAINTENANCE
19-Mar 19-Mar 2000 hrs PLANNED MAINTENANCE
3-Jan 3-Jan 8000 hrs PLANNED MAINTENANCE
13-Feb 14-Feb 9000+18000 hrs PLANNED MAINTENANCE
27-Mar 27-Mar 2000 hrs PLANNED MAINTENANCE
11-Feb 12-Feb 9000+18000 hrs PLANNED MAINTENANCE
26-Mar 26-Mar 2000 hrs PLANNED MAINTENANCE
12-Jan 12-Jan 9000 hrs PLANNED MAINTENANCE
23-Feb 23-Feb 2000 hrs PLANNED MAINTENANCE
16-Jan 16-Jan 9000 hrs PLANNED MAINTENANCE
27-Feb 27-Feb 2000 hrs PLANNED MAINTENANCE
18-Jan 18-Jan 9000 hrs PLANNED MAINTENANCE
1-Mar 1-Mar 2000 hrs PLANNED MAINTENANCE
2-Jan 3-Jan 18000 hrs PLANNED MAINTENANCE
25-Jan 25-Jan 9000 hrs PLANNED MAINTENANCE
9-Mar 9-Mar 2000 hrs PLANNED MAINTENANCE
11-Jan 11-Jan 9000 hrs PLANNED MAINTENANCE
22-Feb 22-Feb 2000 hrs PLANNED MAINTENANCE
27-Jan 28-Jan 9000+18000 hrs PLANNED MAINTENANCE
10-Mar 10-Mar 2000 hrs PLANNED MAINTENANCE
15-Jan 16-Jan 9000+18000 hrs PLANNED MAINTENANCE
26-Feb 26-Feb 2000 hrs PLANNED MAINTENANCE
21-Jan 21-Jan 9000 hrs PLANNED MAINTENANCE
4-Mar 4-Mar 2000 hrs PLANNED MAINTENANCE
13-Jan 14-Jan 18000 hrs PLANNED MAINTENANCE
4-Feb 4-Feb 9000 hrs PLANNED MAINTENANCE
18-Mar 18-Mar 2000 hrs PLANNED MAINTENANCE
14-Jan 15-Jan 9000+18000 hrs PLANNED MAINTENANCE
25-Feb 25-Feb 2000 hrs PLANNED MAINTENANCE
28-Jan 29-Jan 9000+18000 hrs PLANNED MAINTENANCE
11-Mar 11-Mar 2000 hrs PLANNED MAINTENANCE
17-Jan 17-Jan 9000 hrs PLANNED MAINTENANCE
28-Feb 28-Feb 2000 hrs PLANNED MAINTENANCE
20-Jan 20-Jan 9000 hrs PLANNED MAINTENANCE
3-Mar 3-Mar 2000 hrs PLANNED MAINTENANCE
10-Jan 10-Jan 9000 hrs PLANNED MAINTENANCE
21-Feb 21-Feb 2000 hrs PLANNED MAINTENANCE
77G23 20-Feb 21-Feb 9000+18000 hrs PLANNED MAINTENANCE
30-Jan 31-Jan 9000+18000 hrs PLANNED MAINTENANCE
13-Mar 13-Mar 2000 hrs PLANNED MAINTENANCE
19-Jan 20-Jan 1000 hrs PLANNED MAINTENANCE
2-Mar 3-Mar 1000 hrs PLANNED MAINTENANCE
6-Feb 7-Feb 1000 hrs PLANNED MAINTENANCE
20-Mar 21-Mar 1000 hrs PLANNED MAINTENANCE
76G1
76G2
76G3
AMERI
CENPOWER
SUNON ASOGLI
AKSA
KARPOWER
BUI
TAPCO
TICO
KTPP
TT2PP
Jan-21 Feb-21 Mar-21
AKOSOMBO
KPONG
77G1
77G9
77G15
77G10
77G11
77G2
77G6
77G3
77G13
77G26
77G4
77G5
77G8
77G7
77G25
77G21
77G16
77G12
77G14
77G19
77G24
77G17
77G22
77G18
77G20

94 2021 Electricity Supply Plan
ii. 2nd Quarter 2021 Schedule:
GENERATING
PLANTUNIT from to Description of Work
1G1 22-Feb 29-Apr SCADA UPGRADE/ANNUAL MAINTENANCE (FEB 22 - APR 29)
1G1 3-May 8-Jul SCADA UPGRADE/ ANNUAL MAINTENANCE (MAY 3 - JUL 8)
1G1
1G1
1G1
1G1
19G1
19G2
19G3
19G4
54G1 10-May 14-May Quarterly Maintenance
54G2 1-Apr 30-Jun Level-A Maintenance
54G3 14-Jun 18-Jun Quarterly Maintenance
54G4 7-Jun 8-Jun Quarterly Maintenance
TSATSADU 19-May 21-May Quarterly Maintenance
BUI SOLAR 12-Apr 16-Apr Solar Maintenance
32G1 3-Apr 4-Apr OFFLINE WATER WASH
32G2 24-Apr 25-Apr OFFLINE WATER WASH
32G3 22-Apr 6-May Gen. CB Midlife INSP./CEMS Ugrade
32G4 22-May 22-May OFFLINE WATER WASH
32G5 23-May 23-May OFFLINE WATER WASH
32G6
TT1PP 47G1
67G1
67G2
50G1
50G2
50G3
50G4 14-Jun 18-Jun TYPE A Maintenance
50G5 21-Jun 25-Jun TYPE A Maintenance
50G6
50G7 1-Apr 17-Apr TYPE A Maintenance
50G8
CENIT 47G2
51G1 18-Jun 7-Jul CLASS C MAINTENANCE
51G2 18-Jun 22-Jul CLASS B+ MAINTENANCE
51G3 25-Jun 8-Jul CLASS C MAINTENANCE
51G4
51G5
51G6
51G7 25-May 11-Jun CLASS C MAINTENANCE
51G8 25-May 12-Jun CLASS C MAINTENANCE
51G9
51G10
79G1
79G2
79G3
79G4
79G5
79G6
79G7
79G8 5-Apr 23-Apr WARTSILA ENGINE 36K MECHANICAL MAINTENANCE & GAS CONVERSION
79G9 26-Apr 14-May WARTSILA ENGINE 36K MECHANICAL MAINTENANCE & GAS CONVERSION
79G10 17-May 4-Jun WARTSILA ENGINE 36K MECHANICAL MAINTENANCE & GAS CONVERSION
79G11 7-Jun 25-Jun WARTSILA ENGINE 36K MECHANICAL MAINTENANCE & GAS CONVERSION
79G12 28-Jun 16-Jul WARTSILA ENGINE 36K MECHANICAL MAINTENANCE & GAS CONVERSION
79G13
79G14
79G15
79G16
79G17
79G18
79G19
79G20
79G21
79G22
74G1
74G2
74G3
74G4
74G5
74G6
74G7
74G8
74G9
74G10
2-Apr 2-Apr 2000 hrs PLANNED MAINTENANCE
14-May 14-May 4000 hrs PLANNED MAINTENANCE
77G2 6-Jun 6-Jun 4000 hrs PLANNED MAINTENANCE
6-May 6-May 2000 hrs PLANNED MAINTENANCE
30-Jun 30-Jun 6000 hrs PLANNED MAINTENANCE
77G4 14-Jun 14-Jun 4000 hrs PLANNED MAINTENANCE
77G5 15-Jun 15-Jun 4000 hrs PLANNED MAINTENANCE
77G6 9-Jun 9-Jun 4000 hrs PLANNED MAINTENANCE
77G7 18-Jun 18-Jun 4000 hrs PLANNED MAINTENANCE
77G8 16-Jun 16-Jun 4000 hrs PLANNED MAINTENANCE
17-May 17-May 4000 hrs PLANNED MAINTENANCE
28-Jun 28-Jun 6000 hrs PLANNED MAINTENANCE
20-May 21-May 4000 hrs PLANNED MAINTENANCE
24-Jun 24-Jun 6000 hrs PLANNED MAINTENANCE
77G11 22-May 23-May 4000 hrs PLANNED MAINTENANCE
77G12 30-May 30-May 4000 hrs PLANNED MAINTENANCE
77G13 16-May 16-May 4000 hrs PLANNED MAINTENANCE
77G14 1-Jun 2-Jun 4000 hrs PLANNED MAINTENANCE
19-May 19-May 4000 hrs PLANNED MAINTENANCE
29-Jun 29-Jun 6000 hrs PLANNED MAINTENANCE
77G16 25-May 26-May 4000 hrs PLANNED MAINTENANCE
77G17 8-Jun 8-Jun 4000 hrs PLANNED MAINTENANCE
77G18 18-May 18-May 4000 hrs PLANNED MAINTENANCE
77G19 2-Jun 2-Jun 4000 hrs PLANNED MAINTENANCE
21-May 21-May 4000 hrs PLANNED MAINTENANCE
27-Jun 27-Jun 6000 hrs PLANNED MAINTENANCE
25-Jun 25-Jun 6000 hrs PLANNED MAINTENANCE
24-May 24-May 4000 hrs PLANNED MAINTENANCE
77G22 15-May 16-May 4000 hrs PLANNED MAINTENANCE
4-Apr 4-Apr 2000 hrs PLANNED MAINTENANCE
26-Jun 26-Jun 4000 hrs PLANNED MAINTENANCE
77G24 4-Jun 4-Jun 4000 hrs PLANNED MAINTENANCE
13-Apr 15-Apr 3000 hrs PLANNED MAINTENANCE
23-May 24-May 1000 hrs PLANNED MAINTENANCE
1-May 3-May 3000 hrs PLANNED MAINTENANCE
12-Jun 12-Jun 1000 hrs PLANNED MAINTENANCE
76G1 1-Jun 8-Jun COMBUSTION INSPECTION
76G2
76G3
AKOSOMBO
KPONG
CENPOWER
BUI
AMERI
SUNON ASOGLI
AKSA
TAPCO
TICO
KTPP
TT2PP
Apr-21 May-21 JUN
77G1
77G15
77G25
KARPOWER
77G26
77G10
77G21
77G23
77G20
77G9
77G3

95 2021 Electricity Supply Plan
iii. 3rd Quarter 2021 Schedule:
GENERATING PLANT UNIT FROM TO DESCRIPTION OF WORKS
1G1
1G2 3-May 8-Jul SCADA UPGRADE / ANNUAL MAINTENANCE
1G3 12-Jul 10-Sep SCADA UPGRADE / ANNUAL MAINTENANCE
1G4 14-Sep 15-Nov SCADA UPGRADE / ANNUAL MAINTENANCE
1G5
1G6
19G1
19G2
19G3
19G4
54G1 1-Jul 29-Sep LEVEL A MAINTENANCE
54G2 20-Sep 24-Sep QUARTERLY MAINTENANCE
54G3 23-Aug 27-Aug QUARTERLY MAINTENANCE
54G4 13-Sep 14-Sep QUARTERLY MAINTENANCE
Tsatsadu
Bui Solar
32G1 3-Jul 4-Jul OFFLINE WATER WASH
32G2 24-Jul 25-Jul OFFLINE WATER WASH
32G3
32G4 28-Aug 28-Aug OFFLINE WATER WASH
32G5 1-Aug 9-Oct HOTGAS PATH INSPECTION/ FILTER REPLACEMENT & EXHAUST PLENUM REPLACEMENT
32G6
TT1PP 47G1
67G1
67G2
50G1 2-Aug 16-Aug ENGINE SWAP
50G2 9-Aug 13-Aug TYPE A MAINTENANCE
50G3 16-Aug 20-Aug TYPE A MAINTENANCE
50G4
50G5 5-Jul 9-Jul TYPE A MAINTENANCE
50G6 19-Jul 23-Jul TYPE A MAINTENANCE
50G7
50G8 23-Aug 27-Aug TYPE A MAINTENANCE
CENIT 47G2
51G1 18-Jun 7-Jul CLASS C MAINTENANCE
51G2 18-Jun 22-Jul CLASS B+ MAINTENANCE
51G3 25-Jun 8-Jul CLASS C MAINTENANCE
51G4 1-Jul 20-Jul CLASS C MAINTENANCE
51G5 21-Jul 9-Aug CLASS C MAINTENANCE
51G6
51G7
51G8
51G9
51G10
79G1
79G2
79G3
79G4
79G5
79G6
79G7
79G8
79G9
79G10
79G11
79G12 28-Jun 16-Jul WARTSILA ENGINE 36K MECHANICAL MAINTENANCE & GAS CONVERSION
79G13 19-Jul 6-Aug WARTSILA ENGINE 36K MECHANICAL MAINTENANCE & GAS CONVERSION
79G14 9-Aug 27-Aug WARTSILA ENGINE 36K MECHANICAL MAINTENANCE & GAS CONVERSION
79G15
79G16
79G17
79G18
79G19
79G20
79G21
79G22
74G1
74G2
74G3
74G4
74G5
74G6
74G7
74G8
74G9
74G10
11-Jul 11-Jul 6000HRS PLANNED MAINTENANCE
9-Aug 10-Aug 8000HRS PLANNED MAINTENANCE
27-Jul 27-Jul 6000HRS PLANNED MAINTENANCE
2-Sep 3-Sep 8000HRS PLANNED MAINTENANCE
8-Aug 8-Aug 4000HRS PLANNED MAINTENANCE
26-Aug 31-Aug 24000HRS PLANNED MAINTENANCE
77G4 31-Jul 31-Jul 6000HRS PLANNED MAINTENANCE
77G5 10-Jul 10-Jul 6000HRS PLANNED MAINTENANCE
13-Jul 18-Jul 24000HRS PLANNED MAINTENANCE
21-Jul 21-Jul 6000HRS PLANNED MAINTENANCE
18-Jul 18-Jul 6000HRS PLANNED MAINTENANCE
15-Sep 15-Sep 2000HRS PLANNED MAINTENANCE
19-Jul 19-Jul 6000HRS PLANNED MAINTENANCE
10-Sep 10-Sep 2000HRS PLANNED MAINTENANCE
77G9 16-Sep 16-Sep 8000HRS PLANNED MAINTENANCE
19-Aug 19-Aug 2000HRS PLANNED MAINTENANCE
26-Sep 1-Oct 24000HRS PLANNED MAINTENANCE
28-Jul 28-Jul 6000HRS PLANNED MAINTENANCE
10-Aug 15-Aug 24000HRS PLANNED MAINTENANCE
7-Aug 7-Aug 6000HRS PLANNED MAINTENANCE
1-Sep 1-Sep 2000HRS PLANNED MAINTENANCE
10-Sep 15-Sep 24000HRS PLANNED MAINTENANCE
1-Aug 1-Aug 6000HRS PLANNED MAINTENANCE
1-Aug 6-Aug 24000HRS PLANNED MAINTENANCE
16-Aug 16-Aug 6000HRS PLANNED MAINTENANCE
1-Sep 2-Sep 2000HRS PLANNED MAINTENANCE
77G15 18-Aug 19-Aug 2000HRS PLANNED MAINTENANCE
22-Jul 27-Jul 24000HRS PLANNED MAINTENANCE
9-Aug 9-Aug 6000HRS PLANNED MAINTENANCE
4-Jul 4-Jul 6000HRS PLANNED MAINTENANCE
3-Sep 3-Sep 2000HRS PLANNED MAINTENANCE
16-Sep 21-Sep 24000HRS PLANNED MAINTENANCE
3-Jul 3-Jul 6000HRS PLANNED MAINTENANCE
18-Aug 18-Aug 2000HRS PLANNED MAINTENANCE
21-Sep 26-Sep 24000HRS PLANNED MAINTENANCE
77G19 12-Jul 12-Jul 6000HRS PLANNED MAINTENANCE
19-Aug 20-Aug 2000HRS PLANNED MAINTENANCE
3-Sep 8-Sep 24000HRS PLANNED MAINTENANCE
77G21 5-Jul 10-Jul 24000HRS PLANNED MAINTENANCE
20-Jul 20-Jul 6000HRS PLANNED MAINTENANCE
21-Aug 26-Aug 24000HRS PLANNED MAINTENANCE
29-Jul 29-Jul 6000HRS PLANNED MAINTENANCE
15-Sep 16-Sep 2000HRS PLANNED MAINTENANCE
17-Aug 17-Aug 6000HRS PLANNED MAINTENANCE
2-Sep 2-Sep 2000HRS PLANNED MAINTENANCE
1-Jul 2-Jul 1000HRS PLANNED MAINTENANCE
20-Aug 22-Aug 24000HRS PLANNED MAINTENANCE
` 30-Jul 31-Jul 1000HRS PLANNED MAINTENANCE
8-Sep 10-Sep 3000HRS PLANNED MAINTENANCE
76G1
76G2
76G3
CENPOWER
KARPOWER
JUL AUG SEP
AKOSOMBO
KPONG
BUI
TAPCO
TICO
KTPP
77G14
77G1
77G2
77G3
77G6
77G7
TT2PP
SUNON ASOGLI
AKSA
AMERI
77G8
77G10
77G11
77G12
77G13
77G24
77G25
77G26
77G16
77G17
77G18
77G20
77G22
77G23

96 2021 Electricity Supply Plan
iv. 4th Quarter 2021 Schedule:
GENERATING PLANT UNIT FROM TO DESCRIPTION OF WORK
1G1
1G2
1G3
1G4 14-Sep 15-Nov SCADA UPGRADE / ANNUAL MAINTENANCE
1G5 17-Nov 18-Jan SCADA UPGRADE / ANNUAL MAINTENANCE
1G6
19G1
19G2
19G3
19G4
54G1 13-Dec 17-Dec QUARTERLY MAINTENANCE
54G2 22-Nov NOV 26 QUARTERLY MAINTENANCE
54G3 18-Oct 22-Oct QUARTERLY MAINTENANCE
54G4 1-Nov 30-Nov LEVEL A MAINTENANCE
Tsatsadu 8-Dec 10-Dec QUARTERLY MAINTENANCE
Bui Solar 4-Oct 8-Oct QUARTERLY MAINTENANCE
32G1 4-Dec 5-Dec OFFLINE WATER WASH
32G2 18-Dec 19-Dec OFFLINE WATER WASH
32G3 1-Dec 21-Jan STEAM TURBINE GENERATOR MAJOR INSPECTION
32G4
32G5 27-Nov 27-Nov OFFLINE WATER WASH
32G6
TT1PP 47G1
67G14-Oct
11-Oct
9-Oct
16-Oct
TYPE A MAINTENANCE
EGATROL EVOLUTION
67G2 18-Oct 23-Oct EGATROL EVOLUTION
50G1 5-Oct 11-Oct GEAR BOX OVERHAUL
50G2 12-Oct 17-Oct GEAR BOX OVERHAUL
50G32-OCT
2-NOV
8-OCT
8-NOV
GEAR BOX OVERHAUL
GEAR BOX OVERHAUL
50G4
50G5 9-Nov 15-Nov GEAR BOX OVERHAUL
50G6 23-Nov 29-Nov GEAR BOX OVERHAUL
50G7
50G8
CENIT 47G2
51G1
51G2
51G3
51G4
51G5
51G6
51G7
51G8
51G9 25-Oct 18-Nov CLASS B MAINTENANCE
51G10 2-Nov 18-Nov CLASS C MAINTENANCE
79G1
79G2
79G3
79G4
79G5
79G6
79G7
79G8
79G9
79G10
79G11
79G12
79G13
79G14
79G15
79G16
79G17
79G18
79G19
79G20
79G21
79G22
74G1
74G2
74G3
74G4
74G5
74G6
74G7
74G8
74G9
74G10
77G1 4-Dec 9-Dec 24000HRS PLANNED MAINTENANCE
29-Oct 4-Nov 24000HRS PLANNED MAINTENANCE
31-Dec 31-Dec 2000HRS PLANNED MAINTENANCE
77G3 16-Dec 16-Dec 8000HRS PLANNED MAINTENANCE
77G4 14-Nov 19-Nov 24000HRS PLANNED MAINTENANCE
3-Oct 4-Oct 8000HRS PLANNED MAINTENANCE
9-Oct 14-Oct 24000HRS PLANNED MAINTENANCE
28-Dec 28-Dec 24000HRS PLANNED MAINTENANCE
9-Oct 9-Oct 2000HRS PLANNED MAINTENANCE
27-Dec 27-Dec 4000HRS PLANNED MAINTENANCE
77G7 19-Nov 24-Nov 24000HRS PLANNED MAINTENANCE
24-Nov 29-Nov 24000HRS PLANNED MAINTENANCE
19-Dec 19-Dec 8000HRS PLANNED MAINTENANCE
77G9 9-Dec 14-Dec 24000HRS PLANNED MAINTENANCE
77G10 23-Dec 23-Dec 8000HRS PLANNED MAINTENANCE
77G11 29-Nov 29-Nov 2000HRS PLANNED MAINTENANCE
77G12 20-Dec 21-Dec 2000HRS PLANNED MAINTENANCE
77G13 13-Nov 14-Nov 2000HRS PLANNED MAINTENANCE
77G14 4-Nov 9-Nov 24000HRS PLANNED MAINTENANCE
14-Oct 19-Oct 24000HRS PLANNED MAINTENANCE
29-Dec 29-Dec 2000HRS PLANNED MAINTENANCE
77G16
77G17 21-Dec 21-Dec 2000HRS PLANNED MAINTENANCE
77G18 22-Dec 22-Dec 2000HRS PLANNED MAINTENANCE
4-Oct 9-Oct 24000HRS PLANNED MAINTENANCE
26-Dec 26-Dec 2000HRS PLANNED MAINTENANCE
77G20 17-Dec 17-Dec 2000HRS PLANNED MAINTENANCE
3-Oct 3-Oct 2000HRS PLANNED MAINTENANCE
25-Dec 25-Dec 4000HRS PLANNED MAINTENANCE
77G22 14-Dec 14-Dec 2000HRS PLANNED MAINTENANCE
77G23 29-Nov 4-Dec 24000HRS PLANNED MAINTENANCE
24-Oct 29-Oct 24000HRS PLANNED MAINTENANCE
30-Dec 30-Dec 2000HRS PLANNED MAINTENANCE
1-Oct 2-Oct 1000HRS PLANNED MAINTENANCE
15-Dec 16-Dec 1000HRS PLANNED MAINTENANCE
10-Nov 11-Nov 1000HRS PLANNED MAINTENANCE
18-Dec 19-Dec 1000HRS PLANNED MAINTENANCE
76G1
76G2 1-Dec 8-Dec COMBUSTION INSPECTION
76G3 1-Oct 30-Nov CIRCULATING WATER PIPE REPLACEMENT FOR STEAM TURBINE GENERATOR
CENPOWER
KARPOWER
KPONG
BUI
TAPCO
TICO
KTPP
OCT NOV DEC
AKOSOMBO
TT2PP
SUNON ASOGLI
AKSA
AMERI
77G15
77G19
77G21
77G24
77G25
77G26
77G2
77G5
77G6
77G8
97 2021 Electricity Supply Plan
APPENDIX C: GLOSSARY OF ELECTRICAL UTILITY TERMS
1000 Watt-hours = 1 Kilo Watt-hour (kWh)
1000 Kilo Watt-hour = 1 Mega Watt-hour (MWh)
1000 Mega Watt-hour = 1 Giga Watt-hour (GWh)
1000 Giga Watt-hour = 1 Tera Watt-hour (TWh)
Average Day Load
The average system demand is indicative of the system’s load during most part of the day that is
from 7: am – 5: pm apart from the peak load.
Capability
The maximum load a generator, piece of equipment, substation, or system can carry under
specified (standardized) conditions for a given time interval without exceeding approved limits.
Capacitor
1) In a power system, installed to supply reactive power.
2) A device to store an electrical charge (usually made of two or more conductors separated by
a non-conductor such as glass, paper, air, oil, or mica) that will not pass direct current and whose
impedance for alternating current frequencies is inversely proportional to frequency. 3) In a
power system, capacitors consist of metal-foil plates separated by paper or plastic insulation in
oil or other suitable insulating fluid and sealed in metal tanks.
Capacitor bank
A grouping of capacitors used to maintain or increase voltages in power lines and to improve
system efficiency by reducing inductive losses.
Capacity
The rated continuous load-carrying ability, expressed in megawatts (MW) or megavolt-amperes
(MVA) of generation, transmission, or other electrical equipment.
Installed Capacity
The total of the capacities shown by the name plate ratings of similar kinds of apparatus, such as
generators, transformers, or other equipment in a station or system.

98 2021 Electricity Supply Plan
Combined Cycle
An electric generating technology in which electricity is produced from otherwise lost waste heat
exiting from one or more gas (combustion) turbines. The exiting heat is routed to a conventional
boiler or to a heat recovery steam generator for utilization by a steam turbine in the production
of electricity. Such designs increase the efficiency of the electric generating unit.
Conductor
A substance or body that allows an electric current to pas continuously along it.
Contingency
In a power system, the possibility of a fault or equipment failure. First contingency disturbances
(outages) involve only one system element, such as a transmission line fault or a transformer
failure. A second contingency disturbance would have one system element out of service and
subject the system to a fault and loss of a second element.
Demand
The rate at which electric energy is delivered to or by the System or part of the System and is
the sum of both Active and Reactive Power, unless otherwise stated.
Demand, Peak:
The highest electric requirement occurring in a given period (e.g., an hour, a day, month, season,
or year). For an electric system, it is equal to the sum of the metered net outputs of all generators
within a system and the metered line flows into the system, less the metered line flows out of
the system.
Dispatch
The operating control of an integrated electric system to: (1) assign specific generating units and
other sources of supply to meet the relevant area Demand taken as load rises or falls; (2) control
operations and maintenance of high voltage lines, substations and equipment, including
administration of safety procedures; (3) operate interconnections; (4) manage energy
transactions with other interconnected Control Areas; and (5) curtail Demand.
Disturbance
An unplanned event that produces an abnormal system condition. Any occurrence that adversely
affects normal power flow in a system

99 2021 Electricity Supply Plan
Fault
An event occurring on an electric system such as a short circuit, a broken wire, or an intermittent
connection.
Generation (Electricity)
The process of producing electric energy from other forms of energy; also, the amount of electric
energy produced, expressed in watthours (Wh).
Giga (G)
A prefix indicating a billion (1,000,000,000); 109 in scientific notation. Hence Gigawatt (GW) and
Gigawatt-hour (GWh).
Grid
The transmission network (or “highway”) over which electricity moves from suppliers to
customers.
Grid Operator
An entity that oversees the delivery of electricity over the grid to the customer, ensuring
reliability and safety.
High voltage:
Descriptive of transmission lines and electrical equipment with voltage levels from 100 kV
through 287 kV.
Independent Power Producer (IPP):
A private entity that operates a generation facility and sells power to electric utilities for resale
to retail customers.
Insulator:
The porcelain support used to insulate electric service wires from the pole. All electric lines
require an insulator to attach the wires to the pole or to a residence.
Interconnected System
A system consisting of two or more individual electric systems that normally operate in
synchronism (matching frequency, voltage, phase angles, etc) and have connecting tie lines.
Kilowatt (kW)
One thousand watts of electricity (See Watt).

100 2021 Electricity Supply Plan
Kilo watthour (kWh):
One thousand watthours.
Load
The amount of power carried by a utility system or subsystem, or amount of power consumed
by an electric device at a specified time. May also be referred to as demand. A connection point
or defined set of connection points at which electrical power is delivered to a person or to
another network or the amount of electrical power delivered at a defined instant at a connection
point, or aggregated over a defined set of connection points.
Load Centers
A geographical area where large amounts of power are drawn by end-users.
Losses
Electric energy losses in the electric system which occur principally as energy transformation
from kilowatt-hours (kWh) to waste heat in electrical conductors and apparatus.
Maximum Demand:
The highest amount of electrical power delivered, or forecast to be delivered, over a defined
period (day, week, month, season or year) at a defined.
Megawatt (MW)
One million watts of electricity (See Watt).
masl
Metres above sea level
Overload
Operation of equipment in excess of its normal, full load rating or operation of a conductor in
excess of ampacity, and if continued for a sufficient length of time, would cause damage or
overheating.
System Planning
The process by which the performance of the electric system is evaluated and future changes and
additions to the bulk electric systems are determined.

101 2021 Electricity Supply Plan
Power System
The electricity power system of the national grid including associated generation and transmission
and distribution networks for the supply of electricity, operated as an integrated arrangement.
Reactive Power
Means the product of voltage and current and the sine of the phase angle between them
measured in units of volt-amperes reactive and standard multiples thereof. Reactive power is a
necessary component of alternating current electricity which is separate from active power and
is predominantly consumed in the creation of magnetic fields in motors and transformers and
produced by plant such as: (a) alternating current generators (b) capacitors, including the
capacitive effect of parallel transmission wires;(c) synchronous condensers.
Reliability
The degree of performance of the elements of the bulk electric system that results in electricity
being delivered to customers within accepted standards and in the amount desired. It is a measure
of the ability of a power system to provide uninterrupted service, even while that system is under
stress. Reliability may be measured by the frequency, duration, and magnitude of adverse effects
on the electric supply. Electric system reliability has two components -- adequacy and security.
Adequacy is the ability of the electric system to supply the aggregate electrical demand and
energy requirements of the customers at all times, taking into account scheduled and reasonably
expected unscheduled outages of system elements.
Security is the ability of the electric system to withstand sudden disturbances such as electric
short circuits or unanticipated loss of system facilities.
Single Contingency
The sudden, unexpected failure or outage of a system facility(s) or element(s) (generating unit,
transmission line, transformer, etc.). Elements removed from service as part of the operation of
a remedial action scheme are considered part of a single contingency.
Stability
The ability of an electric system to maintain a state of equilibrium during normal and abnormal
system conditions or disturbances.

102 2021 Electricity Supply Plan
Supervisory Control and Data Acquisition (SCADA)
A computer system that allows an electric system operator to remotely monitor and control
elements of an electric system.
Switching Station
An installation of equipment where several transmission lines are interconnected. Does not
include equipment for transforming voltage levels.
Power System
An interconnected combination of generation, transmission, and distribution components
comprising an electric utility, an electric utility and independent power producer(s) (IPP), or
group of utilities and IPP(s).
Right of Way (ROW)
A corridor of land on which electric lines may be located. The Transmission Owner may own
the land in fee, own an easement, or have certain franchise, prescription, or license rights to
construct and maintain lines.
Thermal Limit
The maximum amount of electrical current that a transmission line or electrical facility can
conduct over a specified time period before it sustains permanent damage by overheating or
before it violates public safety requirements.
Transfer Capability
The amount of power, usually the maximum amount, that can be transmitted between one
system and another; power flow and stability studies determine transfer capability under various
outage, system loading, and system operating conditions.
Transformer
A device for transferring electrical energy from one circuit to another by magnetic induction,
usually between circuits of different voltages. Consists of a magnetic core on which there are two
or more windings. In power systems, most frequently used for changing voltage levels.
Transmission System (Electric)
An interconnected group of electric transmission lines and associated equipment for moving or
transferring electric energy in bulk between points of supply and points at which it is transformed
for delivery over the distribution system lines to consumers, or is delivered to other electric
systems.

103 2021 Electricity Supply Plan
Utility
A public or private organization created for the purpose of selling or supplying for general public
use water, electric energy, telephone service, or other items or services.
Voltage
The electronic force or electric potential between two points that gives rise to the flow of
electricity.
Voltage Stability
The condition of an electric system in which the sustained voltage level is controllable and within
predetermined limits.
Wheeling
The use of the facilities of one transmission system to transmit power and energy from one
power system to another.

104 2021 Electricity Supply Plan
APPENDIX D – GRID MAP

105 2021 Electricity Supply Plan