Embed Size (px)
Citation preview

2020 Colorado Creative Economy Report with Initial Impacts of the COVID-19 Crisis
Margaret Hunt Director, Colorado Creative Industries
Prepared by:
Dr. Michael Seman Colorado State University LEAP Institute for the Arts
Regional Economic Development Institute

i
Table of Contents Executive Summary ......................................................................................................... ii Introduction .................................................................................................................... 1 Creative Industries Employment ..................................................................................... 1
Regional Trends and Growth ............................................................................... 2
Creative Occupations Employment ................................................................................. 7 Creative Industries Revenue............................................................................................ 8 Conclusion .................................................................................................................... 10 Initial Impacts of the COVID-19 Crisis ............................................................................ 11
Background ....................................................................................................... 11 Impacts ............................................................................................................. 11 Conclusion ......................................................................................................... 12
Acknowledgements....................................................................................................... 14 Appendix: Methodology ................................................................................................ 15 References .................................................................................................................... 21

ii
Executive Summary Colorado’s creative economy is robust and growing. This report examines the scale, scope, and
growth of the creative economy statewide offering details regarding employment trends and
sales revenue over a nine-year period from 2010 to 2019. Some key data points and observations
include the following:
Employment • Colorado’s creative industries support 191,248 jobs and there are 172,884 employed in
creative occupations across multiple industries throughout the state. Employment in
Colorado’s creative industries grew by 25% between 2010 and 2019 with an addition of
38,118 jobs. Employment in creative occupations grew by 25% in the same time period
with an addition of 34,485 jobs.
• All three major regions within the state, the Front Range, Western Slope, and Eastern
Plains, experienced employment growth in the creative industries between 2010 and
2019.
• Colorado’s top five clusters of creative industries by employment in 2019 include Music,
Theater, Dance, and Visual Arts (64,961 jobs), Culinary Arts (22,779), Design and
Advertising (22,352 jobs), Creative Technology (20,260 jobs), and Architecture and Living
Spaces (19,552 jobs).
• Colorado’s top five clusters of creative industries with the greatest growth in employment
from 2010 to 2019 include Culinary Arts (75%), Music, Theater, Dance, and Visual Arts
(35%), Creative Technology (35%), Culture and Heritage (35%), and Architecture and
Living Spaces (31%).
Revenue • Colorado’s creative industries produced $31.6 billion in sales of goods and services (sales
revenue) in 2019 which represents 4% of all goods and services sold within the state.
• Colorado’s top 3 clusters of creative industries by sales of goods and services (sales
revenue) in 2019 include Creative Technology ($8.1 billion), Culinary Arts ($6.7 billion),
and Film, Television, and Radio ($4.8 billion).
• All three major regions of the state benefitted financially from creative industries activity
with regional sales revenue surpassing the billion-dollar mark in two of the regions: Front
Range ($29.6 billion), Western Slope ($1.7 billion), Eastern Plains ($336 million).
Initial Impacts of the COVID-19 Crisis • Colorado’s creative industries will lose an estimated 59,588 jobs and $2.6 billion in sales
revenue between April and July 2020 due to the COVID-19 crisis. This four-month period

iii
of estimated losses will contract the region’s creative economy by 31% in terms of
employment and 8% in annual sales revenue.
• The Music, Theater, Dance, and Visual Arts industry cluster is responsible for the majority
of losses due to the COVID-19 crisis. The cluster is estimated to lose 31,781 jobs and $823
million in sales revenue between April and July. This represents just over half of all
estimated jobs lost and 31% of all estimated sales revenue lost in the state’s creative
industries during the time period.

1
Introduction Colorado and creativity go hand-in-hand. The arts are at the core of this relationship. Colorado
ranks in the top ten of all states regarding the number of people performing and creating art; it
leads all other states for the number of people attending performing arts events.1 But creativity
in Colorado extends beyond what is traditionally considered as the creation and consumption of
the arts. There are brewmasters exploring uncharted culinary territory while experimenting with
ingredients in craft beverages; artists welding ultralight materials into bike frames for riders
competing at the highest professional levels; architects digitally drafting cutting-edge designs for
environmentally sustainable housing.
Creativity in Colorado cuts across artistic disciplines and industries to form a broader, “creative
economy.” This economy stretches from the musicians, artists, dancers, filmmakers, and others
who create the paintings, films, and performances we enjoy to the designers, chefs, curators,
teachers, and more who work both in the arts and in other industries such as education, outdoor
recreation, technology, and aerospace. The creative economy in Colorado is vast and this report
is designed to offer a brief look into its scale and scope. What follows provides a baseline for the
state’s creative economy in terms of employment and revenue while highlighting trends which
offer insight into its comparative health statewide. The initial effects of the COVID-19 crisis are
also addressed with suggestions for how to mitigate them and move forward.
Creative Industries Employment Employment in Colorado’s creative industries includes everyone employed in the firms and
establishments within the industries whether they are in creative occupations or not, e.g., the
receptionist, the in-house graphic designer, and the promoter at a concert promotions company.
Additionally, the graphic designer who is self-employed with her own practice is also captured as
is the graphic designer who freelances part-time.
Colorado’s creative industries supported 191,248 jobs in 2019 – a figure representing 5% of the
state’s overall jobs that year. When grouped into nine industry clusters, underlying employment
dynamics of the state’s creative industries are highlighted (Figure 2). The Music, Theater, Dance,
and Visual Arts cluster is by far the largest in terms of employment representing 34% of overall
creative industries employment and almost 65,000 jobs dedicated to the creation, management,
and promotion of art, music, theater, dance, and other fine and performing arts.i The size of this
cluster is unsurprising given the robust health of the state’s music industry alone.2
The next four clusters, Culinary Arts, Design and Advertising, Creative Technology, and
Architecture and Living Spaces are relatively close in job totals, falling within a range of 19,000 to
23,000 jobs, representing 44% of total employment. These four clusters engage in a wide range
i Please see the appendix for a full description of how the creative economy is defined.
2
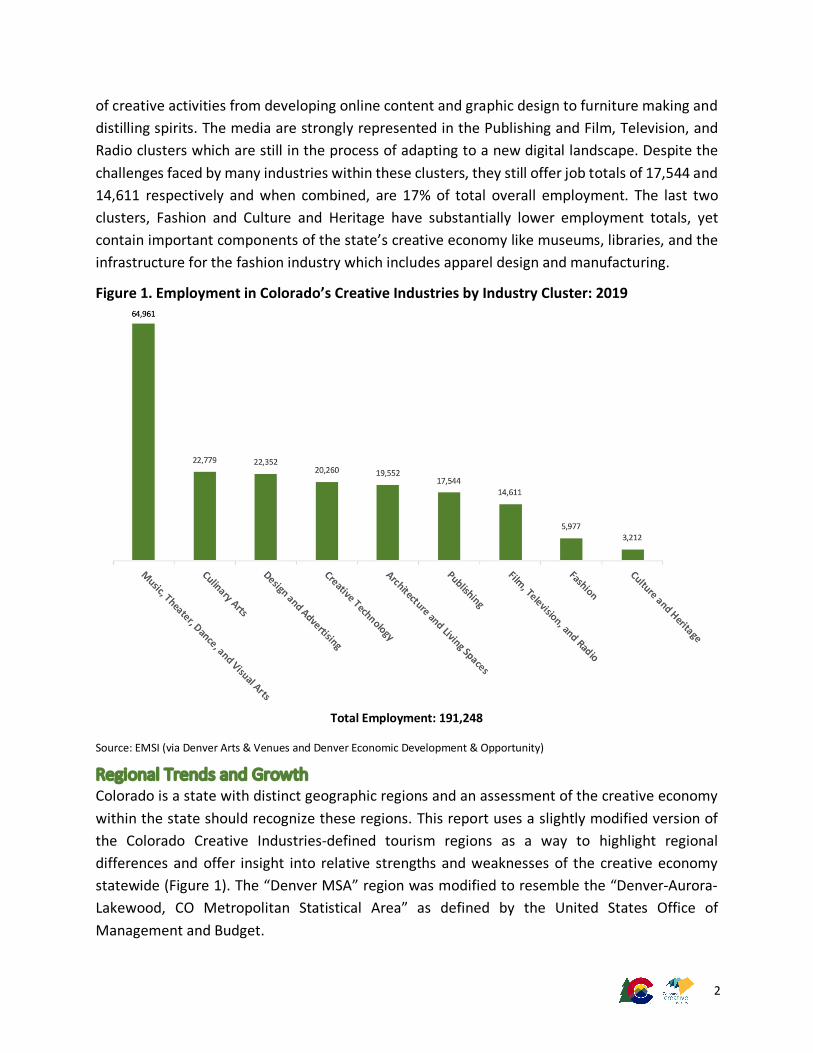
of creative activities from developing online content and graphic design to furniture making and
distilling spirits. The media are strongly represented in the Publishing and Film, Television, and
Radio clusters which are still in the process of adapting to a new digital landscape. Despite the
challenges faced by many industries within these clusters, they still offer job totals of 17,544 and
14,611 respectively and when combined, are 17% of total overall employment. The last two
clusters, Fashion and Culture and Heritage have substantially lower employment totals, yet
contain important components of the state’s creative economy like museums, libraries, and the
infrastructure for the fashion industry which includes apparel design and manufacturing.
Figure 1. Employment in Colorado’s Creative Industries by Industry Cluster: 2019
Total Employment: 191,248
Source: EMSI (via Denver Arts & Venues and Denver Economic Development & Opportunity)
Regional Trends and Growth Colorado is a state with distinct geographic regions and an assessment of the creative economy
within the state should recognize these regions. This report uses a slightly modified version of
the Colorado Creative Industries-defined tourism regions as a way to highlight regional
differences and offer insight into relative strengths and weaknesses of the creative economy
statewide (Figure 1). The “Denver MSA” region was modified to resemble the “Denver-Aurora-
Lakewood, CO Metropolitan Statistical Area” as defined by the United States Office of
Management and Budget.

3
Figure 2. The Seven Regions of Colorado Used for Analysis
Source: Colorado Creative Industries, U.S. Office of Management and Budget.
Colorado embraces both its urban and rural regions. The state’s creative industries are no different. From 2010 to 2019, all regions of the state – urban and rural – experienced employment growth in the creative industries adding 38,118 jobs for a growth of 25% statewide (Table 1). Only two regions, the Southeast and Northeast did not register growth in the double digits, however this growth given their comparatively sparse populations is still impressive.
Table 1. Employment Growth in Colorado’s Creative Industries by Region: 2010 - 2019
Region 2010 Jobs
2019 Jobs
2010 - 2019 Change
Percentage Change
Front Range
Denver MSA 81,646 107,324 25,678 31%
North Central 34,982 41,755 6,773 19%
South Central 17,414 19,919 2,505 14%
Western Slope
Northwest 10,414 12,523 2,109 20%
Southwest 4,970 5,932 962 19%
Eastern Plains
Southeast 2,953 3,038 85 3%
Northeast 751 757 6 1%
Statewide
Colorado 153,130 191,248 38,118 25% Source: EMSI (via Denver Arts & Venues and Denver Economic Development & Opportunity)

4
Examining the growth by industry cluster helps tell a richer story concerning trends statewide
(Table 2). The Culinary Arts cluster outstripped the growth of all others between 2010 and 2019.
This growth is largely due to Colorado being a leader nationwide in craft brewing with new
breweries coming online and established ones expanding during the time period examined. Craft
breweries are innovating and producing creative products, but it is important to note they also
employ other people within the creative economy to help design, brand, and market their
products, serve as sponsors for local and regional live music events, and often function as
community gathering spaces fostering further development of the creative economy.3 The
additional impacts a craft brewery can offer a creative economy in a rural region cannot be
overstated. Colorado’s Culinary Arts cluster is also benefitting from the emergence of distilleries,
wineries, a strong food truck culture, and continued development of the culinary scene writ large
in both urban and rural regions.
Table 2. Employment Growth in Colorado’s Creative Industries by Cluster: 2010 - 2019
Industry Cluster 2010 Jobs 2019 Jobs 2010 - 2019
Change Percentage
Change
Culinary Arts 13,008 22,779 9,771 75%
Music, Theater, Dance, and Visual Arts 48,080 64,961 16,881 35%
Creative Technology 15,059 20,260 5,201 35%
Culture and Heritage 2,388 3,212 824 35%
Architecture and Living Spaces 14,612 19,552 4,940 31%
Design and Advertising 18,447 22,352 3,905 21%
Film, Television, and Radio 12,504 14,611 2,107 17%
Fashion 5,299 5,977 678 13%
Publishing 23,733 17,544 -6,189 -26%
Totals 153,130 191,248 38,118 25% Source: EMSI (via Denver Arts & Venues and Denver Economic Development & Opportunity)
Colorado’s status as a nationwide leader in the production and consumption of the arts is evident
in the solid employment growth in the Music, Theater, Dance, and Visual Arts cluster. The state’s
robust music industry is driving this cluster with a strong focus on live music events attracting
residents and tourists alike.4 The Creative Technology cluster also performed well between 2010
and 2019 adding just over 5,200 jobs supporting the development of software and online
platforms related to gaming, social media, sports, news, and lifestyle content.
Double-digit employment growth in the clusters, Culture and Heritage, Architecture and Living
Spaces, and Design and Advertising speaks to their relative strengths throughout the state.
Conversely, the comparatively low employment growth rate of the Film, Television, and Radio
cluster may reflect challenges the filmmaking industry within Colorado has faced in the same
5
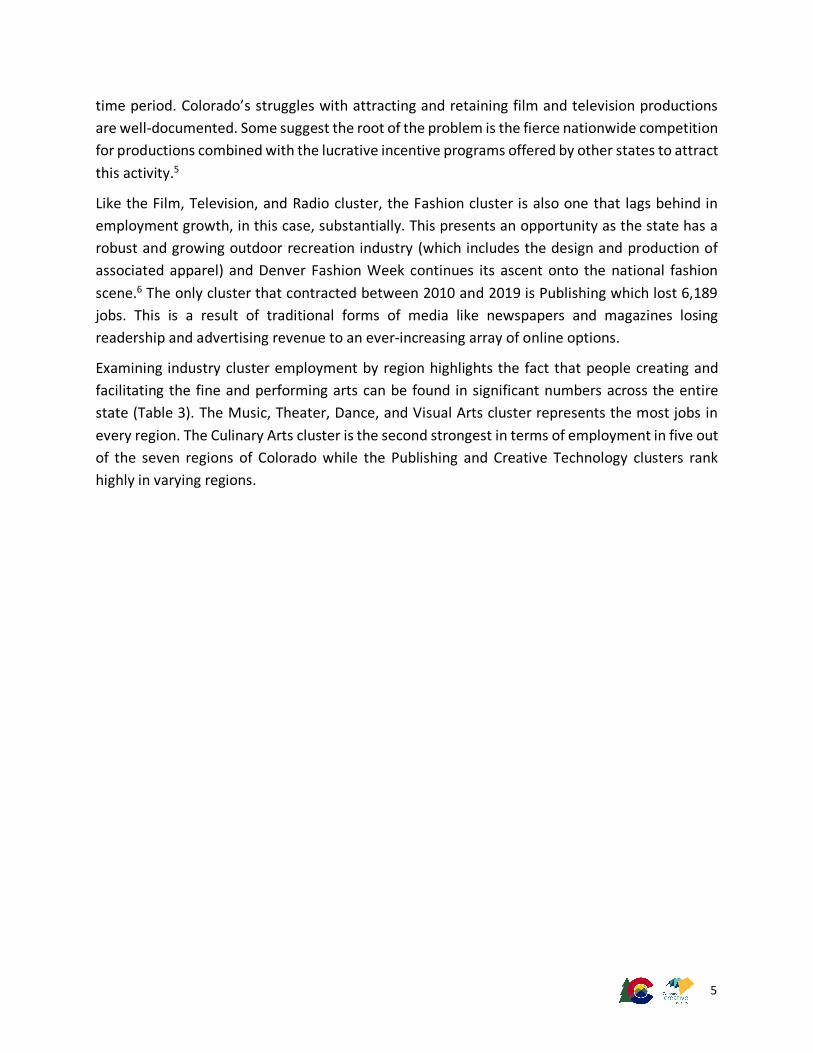
time period. Colorado’s struggles with attracting and retaining film and television productions
are well-documented. Some suggest the root of the problem is the fierce nationwide competition
for productions combined with the lucrative incentive programs offered by other states to attract
this activity.5
Like the Film, Television, and Radio cluster, the Fashion cluster is also one that lags behind in
employment growth, in this case, substantially. This presents an opportunity as the state has a
robust and growing outdoor recreation industry (which includes the design and production of
associated apparel) and Denver Fashion Week continues its ascent onto the national fashion
scene.6 The only cluster that contracted between 2010 and 2019 is Publishing which lost 6,189
jobs. This is a result of traditional forms of media like newspapers and magazines losing
readership and advertising revenue to an ever-increasing array of online options.
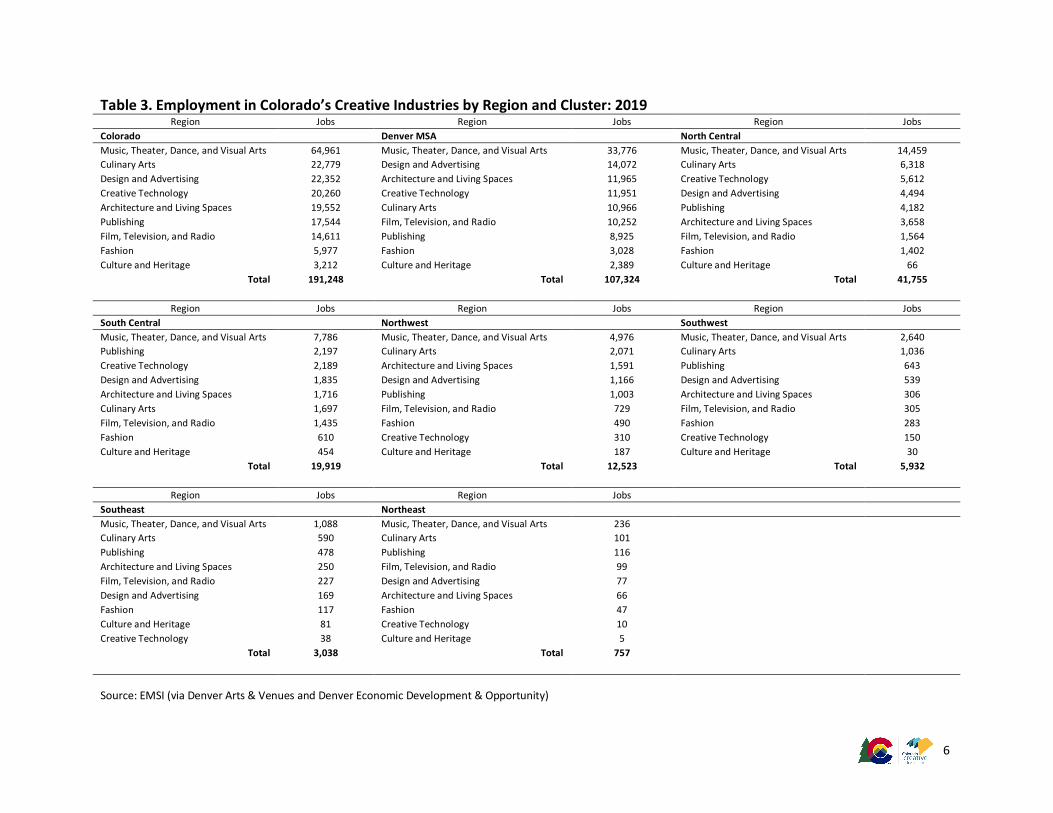
Examining industry cluster employment by region highlights the fact that people creating and
facilitating the fine and performing arts can be found in significant numbers across the entire
state (Table 3). The Music, Theater, Dance, and Visual Arts cluster represents the most jobs in
every region. The Culinary Arts cluster is the second strongest in terms of employment in five out
of the seven regions of Colorado while the Publishing and Creative Technology clusters rank
highly in varying regions.
6
Table 3. Employment in Colorado’s Creative Industries by Region and Cluster: 2019 Region Jobs Region Jobs Region Jobs
Colorado Denver MSA North Central Music, Theater, Dance, and Visual Arts 64,961 Music, Theater, Dance, and Visual Arts 33,776 Music, Theater, Dance, and Visual Arts 14,459 Culinary Arts 22,779 Design and Advertising 14,072 Culinary Arts 6,318 Design and Advertising 22,352 Architecture and Living Spaces 11,965 Creative Technology 5,612 Creative Technology 20,260 Creative Technology 11,951 Design and Advertising 4,494 Architecture and Living Spaces 19,552 Culinary Arts 10,966 Publishing 4,182 Publishing 17,544 Film, Television, and Radio 10,252 Architecture and Living Spaces 3,658 Film, Television, and Radio 14,611 Publishing 8,925 Film, Television, and Radio 1,564 Fashion 5,977 Fashion 3,028 Fashion 1,402 Culture and Heritage 3,212 Culture and Heritage 2,389 Culture and Heritage 66
Total 191,248 Total 107,324 Total 41,755
Region Jobs Region Jobs Region Jobs South Central Northwest Southwest Music, Theater, Dance, and Visual Arts 7,786 Music, Theater, Dance, and Visual Arts 4,976 Music, Theater, Dance, and Visual Arts 2,640 Publishing 2,197 Culinary Arts 2,071 Culinary Arts 1,036 Creative Technology 2,189 Architecture and Living Spaces 1,591 Publishing 643 Design and Advertising 1,835 Design and Advertising 1,166 Design and Advertising 539 Architecture and Living Spaces 1,716 Publishing 1,003 Architecture and Living Spaces 306 Culinary Arts 1,697 Film, Television, and Radio 729 Film, Television, and Radio 305 Film, Television, and Radio 1,435 Fashion 490 Fashion 283 Fashion 610 Creative Technology 310 Creative Technology 150 Culture and Heritage 454 Culture and Heritage 187 Culture and Heritage 30
Total 19,919 Total 12,523 Total 5,932
Region Jobs Region Jobs Southeast Northeast Music, Theater, Dance, and Visual Arts 1,088 Music, Theater, Dance, and Visual Arts 236 Culinary Arts 590 Culinary Arts 101 Publishing 478 Publishing 116 Architecture and Living Spaces 250 Film, Television, and Radio 99 Film, Television, and Radio 227 Design and Advertising 77 Design and Advertising 169 Architecture and Living Spaces 66 Fashion 117 Fashion 47 Culture and Heritage 81 Creative Technology 10 Creative Technology 38 Culture and Heritage 5
Total 3,038 Total 757
Source: EMSI (via Denver Arts & Venues and Denver Economic Development & Opportunity)

7
Creative Occupations Employment When focusing only on the core creative occupations that propel the state’s creative economy – e.g., a graphic designer – the employment numbers are slightly lower, yet still substantial with 172,884 jobs in creative occupations across multiple industries within Colorado. This number captures the graphic designer who works in a creative industry, the graphic designer who works in another industry like aerospace or insurance, the graphic designer who is self-employed, and the graphic designer freelancing part-time. The 25% growth in jobs for all creative occupations statewide between 2010 and 2019 mirrors that of the creative industries throughout Colorado in the same time period (Table 4).
Table 4. Employment Growth in Colorado’s Creative Economy by Occupation and Industry: 2010 - 2019
2010 Jobs
2019 Jobs
2010 – 2019 Change
Percentage Change
Employment: Creative Occupations 138,399 172,884 34,485 25%
Employment: Creative Industries 153,130 191,248 38,118 25% Source: EMSI (via Denver Arts & Venues and Denver Economic Development & Opportunity), U.S. Bureau of Labor Statistics
Examining the top ten creative occupations in Colorado offers more insight into the dynamics of its creative economy. The list is dominated by occupations that engage with the fine and performing arts including photographers, writers, sculptors, musicians, and others. Graphic designers, marketing managers, and those who work in public relations are also represented. Finally, the rapid growth in population and the built environment along the Front Range is reflected with the substantial number of architects and interior designers that are employed. (Table 5).
Table 5. Colorado’s Top Ten Creative Occupations by Employment: 2019
Rank Occupation Jobs
1 Photographers 23,616
2 Writers and Authors 12,058
3 Graphic Designers 10,955
4 Musicians and Singers 10,921
5 Public Relations Specialists 6,336
6 Architects, Except Landscape and Naval 6,077
7 Marketing Managers 5,548
8 Fine Artists, including Painters, Sculptors, and Illustrators 5,457
9 Interior Designers 4,882
10 Editors 4,770 Source: EMSI (via Denver Arts & Venues and Denver Economic Development & Opportunity), U.S. Bureau of Labor Statistics

8
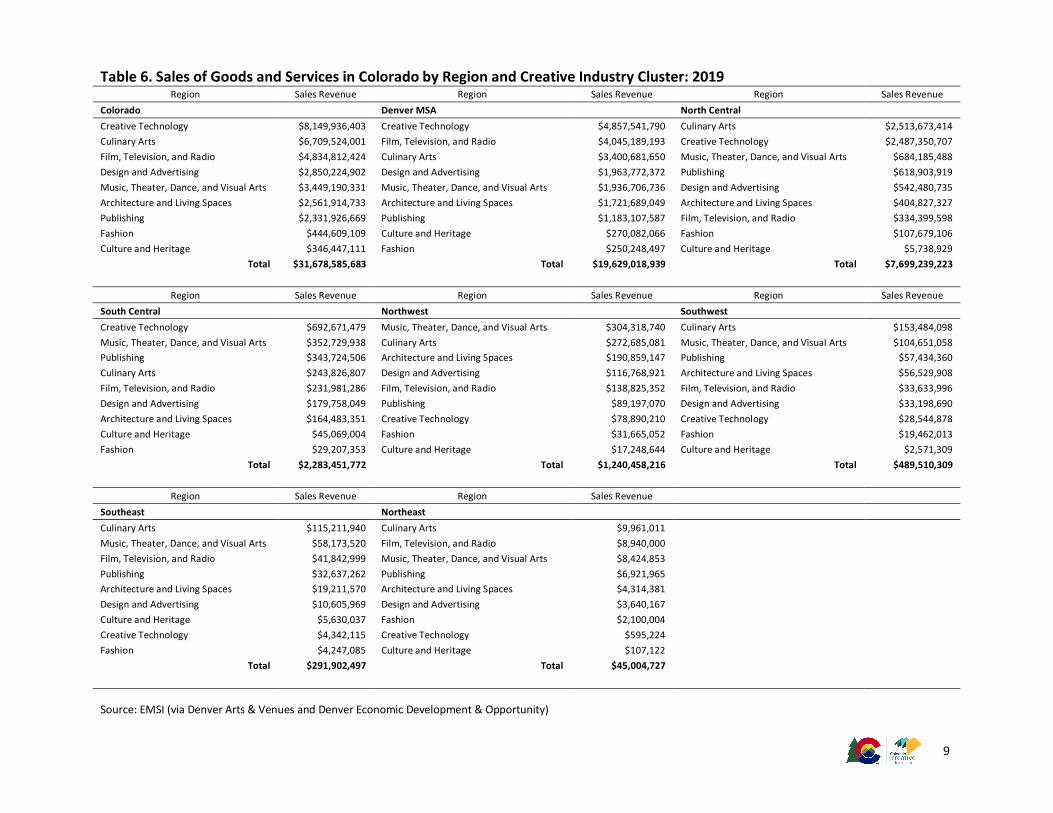
Creative Industries Revenue Employment growth for the combination of firms, establishments, and the self-employed comprising Colorado’s creative industries and in the creative occupations woven throughout the state’s entire economy is robust. Equally robust is the sales revenue attributed to the state’s creative industries. Colorado’s creative industries are responsible for $31.6 billion in sales of goods and services. This figure represents 4% of all goods and services sold within the state.
The Creative Technology industry cluster leads all others with just over $8 billion in revenue from software publishing and internet-related broadcasting and publishing, but close behind is the Culinary Arts cluster with its craft breweries, distilleries, specialty foods, and more helping to generate $6.7 billion in sales revenue in 2019. Coming in third place is the Film, Television, and Radio cluster with $4.8 billion in revenue, largely the result of the still-lucrative advertising landscape in the television and radio industries and to some extent, the state’s film industry (Table 6).
Examining the creative economy regionally throughout the state offers perspective into the relative strengths of the regions. Two of the three regions that loosely comprise the state’s Front Range region are led by the Creative Technology cluster – Denver MSA and South Central. This reflects the prominent role the technology industry plays in those regions. However, the third region in Colorado’s Front Range, North Central is dominated by the Culinary Arts cluster. This is not surprising as the North Central region is home to Fort Collins and several nationally recognized craft breweries that drive a vibrant brewing ecosystem stretching across the region.
Four of the seven regions forming the state have Culinary Arts as their number one creative economy industry cluster. This is due largely to the emergence of craft brewing and distilleries as viable creative businesses in rural regions of the state; regions that already leverage their considerable agricultural resources in both traditional and creative ways. The strong presence of the Music, Theater, Dance, and Visual Arts cluster in the more rural regions of the state should also be noted. In addition to the rural regions utilizing their agricultural resources as the basis of creative endeavors, artists of all disciplines embrace these regions of Colorado and play leading roles in driving their overall economies.
The metropolitan regions of Colorado’s Front Range are a little more varied with several different industry clusters performing well. In addition to Creative Technology and Culinary Arts, the industry clusters Film, Television, and Radio and Music, Theater, Dance, and Visual Arts also contribute billions of dollars in sales revenue. The Denver MSA region’s mix of creative industries is especially impressive. The region is often recognized for its concentration of fine and performing arts activity including strong theater, dance, and gallery scenes plus a live music ecosystem that supports a full schedule of concerts at Red Rocks Amphitheatre, several festivals throughout the year, and multiple shows at venues throughout the region every night of the week. Despite this activity, the Music, Theater, Dance, and Visual Arts cluster only ranks fifth amongst the region’s creative industry clusters with its $1.9 billion in sales revenue falling behind even more robust clusters like Design and Advertising and Film, Television, and Radio.
9
Table 6. Sales of Goods and Services in Colorado by Region and Creative Industry Cluster: 2019 Region Sales Revenue Region Sales Revenue Region Sales Revenue
Colorado Denver MSA North Central Creative Technology $8,149,936,403 Creative Technology $4,857,541,790 Culinary Arts $2,513,673,414 Culinary Arts $6,709,524,001 Film, Television, and Radio $4,045,189,193 Creative Technology $2,487,350,707 Film, Television, and Radio $4,834,812,424 Culinary Arts $3,400,681,650 Music, Theater, Dance, and Visual Arts $684,185,488 Design and Advertising $2,850,224,902 Design and Advertising $1,963,772,372 Publishing $618,903,919 Music, Theater, Dance, and Visual Arts $3,449,190,331 Music, Theater, Dance, and Visual Arts $1,936,706,736 Design and Advertising $542,480,735 Architecture and Living Spaces $2,561,914,733 Architecture and Living Spaces $1,721,689,049 Architecture and Living Spaces $404,827,327 Publishing $2,331,926,669 Publishing $1,183,107,587 Film, Television, and Radio $334,399,598 Fashion $444,609,109 Culture and Heritage $270,082,066 Fashion $107,679,106 Culture and Heritage $346,447,111 Fashion $250,248,497 Culture and Heritage $5,738,929
Total $31,678,585,683 Total $19,629,018,939 Total $7,699,239,223
Region Sales Revenue Region Sales Revenue Region Sales Revenue South Central Northwest Southwest Creative Technology $692,671,479 Music, Theater, Dance, and Visual Arts $304,318,740 Culinary Arts $153,484,098 Music, Theater, Dance, and Visual Arts $352,729,938 Culinary Arts $272,685,081 Music, Theater, Dance, and Visual Arts $104,651,058 Publishing $343,724,506 Architecture and Living Spaces $190,859,147 Publishing $57,434,360 Culinary Arts $243,826,807 Design and Advertising $116,768,921 Architecture and Living Spaces $56,529,908 Film, Television, and Radio $231,981,286 Film, Television, and Radio $138,825,352 Film, Television, and Radio $33,633,996 Design and Advertising $179,758,049 Publishing $89,197,070 Design and Advertising $33,198,690 Architecture and Living Spaces $164,483,351 Creative Technology $78,890,210 Creative Technology $28,544,878 Culture and Heritage $45,069,004 Fashion $31,665,052 Fashion $19,462,013 Fashion $29,207,353 Culture and Heritage $17,248,644 Culture and Heritage $2,571,309
Total $2,283,451,772 Total $1,240,458,216 Total $489,510,309
Region Sales Revenue Region Sales Revenue Southeast Northeast Culinary Arts $115,211,940 Culinary Arts $9,961,011 Music, Theater, Dance, and Visual Arts $58,173,520 Film, Television, and Radio $8,940,000 Film, Television, and Radio $41,842,999 Music, Theater, Dance, and Visual Arts $8,424,853 Publishing $32,637,262 Publishing $6,921,965 Architecture and Living Spaces $19,211,570 Architecture and Living Spaces $4,314,381 Design and Advertising $10,605,969 Design and Advertising $3,640,167 Culture and Heritage $5,630,037 Fashion $2,100,004 Creative Technology $4,342,115 Creative Technology $595,224 Fashion $4,247,085 Culture and Heritage $107,122
Total $291,902,497 Total $45,004,727
Source: EMSI (via Denver Arts & Venues and Denver Economic Development & Opportunity)

10
Conclusion This report is a brief glimpse into the scale and scope of Colorado’s creative economy and it highlights the fact that creativity is found across the state in both urban and rural regions. The state’s creative economy is strong and poised for more growth in the coming decade. The growth of the culinary arts across the state and increasing activity in the fine and performing arts defined the last decade. Looking towards the future, it is important that policymakers, private industry, philanthropic institutions, and the highly skilled workers who drive the creative economy think regionally and statewide while looking for ways to facilitate the intersection of Colorado’s creative economy with other industries across the state. Cross-pollenating Colorado’s abundance of artists, musicians, chefs, dancers, designers, architects, and more with others in the state pushing boundaries in industries like health care, technology, and outdoor recreation will propel Colorado’s creative economy to new heights while helping position the state as a hub of creativity for the entire country.

11
Initial Impacts of the COVID-19 Crisis Background Colorado’s creative economy was poised for further growth before the COVID-19 pandemic sparked the greatest economic crisis in the United States since the Great Depression. This report offers a portrait of Colorado’s creative economy as it appeared immediately before the COVID-19 crisis took hold in the state. It is impossible to detail the exact effects this crisis will have regarding the findings presented in this report as it is still unfolding at the time of writing, but it is important to address its influence. This section presents an estimate of the initial effects the COVID-19 crisis will have on creative industry employment and sales revenue in Colorado.
An economic model was constructed to develop the estimates in this section and employs a time frame beginning on April 1st, 2020 and ending on July 31st, 2020. This model incorporates several assumptions based on an informed perspective. The effects of local and statewide “stay-at-home” and “safer-at-home” orders and the closing of non-essential businesses are considered as well as all live events at full-capacity being prohibited until likely 2021 at the earliest. The model assumes access to federal stimulus funds for firms, establishments, and the self-employed. Additionally, this model incorporates a predicted 24% contraction of the United States’ overall economy taking hold in April and progressing through the second quarter of 2020 and unemployment averaging 14% in the same time period.7
Information concerning how the COVID-19 crisis may affect specific industries within the creative economy in the state was gained from informal interviews with those in the industries and perspectives published via media outlets, private firms, and government agencies. It is important to note that estimated job losses include those who are laid off and furloughed, plus those who piece together steady employment through a succession of freelance “gigs” and as such may regain employment in the creative economy beyond the time period examined.
Impacts Colorado’s creative industries will lose an estimated 59,587 jobs and over $2.6 billion in sales revenue between April and July 2020 (Table 6). To give some perspective on these losses, a sample month for Colorado’s creative industries supports an estimated 191,248 jobs and $2.6 billion in sales revenue. This four-month period of estimated losses will contract Colorado’s creative industries by 31% in terms of employment and 8% in annual sales revenue. Table 6. Estimated Cumulative Losses for the Creative Industries: April to July 2020
Month Jobs Sales Revenue April 41,873 $486,802,350 May 62,184 $1,228,240,480 June 64,430 $2,009,530,986 July 59,588 $2,674,413,462
Source: EMSI (via Denver Arts & Venues and Denver Economic Development & Opportunity), Author’s Estimates

12
For deeper insight into how these losses are structured, an examination of the nine industry clusters within Colorado’s creative industries is helpful. The Music, Theater, Dance, and Visual Arts industry cluster is responsible for the majority of losses due to the COVID-19 crisis. The cluster is estimated to lose 31,781 jobs and $823 million in sales revenue between April and July. This represents just over half of all estimated jobs lost and 31% of all estimated sales revenue lost in the state’s creative industries during the time period (Table 7). These significant losses are due largely to the state’s music industry coming to a complete stop in addition to other performing arts activities such as theater and dance having to cease all live performances.
Table 7. Estimated Cumulative Losses for the Creative Industries by Industry Cluster: April to July 2020
Cluster Jobs Sales Revenue Music, Theater, Dance, and Visual Arts 31,781 $823,063,643 Culinary Arts 5,513 $413,115,466 Design and Advertising 4,470 $225,642,805 Publishing 4,184 $222,690,502 Architecture and Living Spaces 4,106 $159,890,951 Creative Technology 4,052 $339,580,683 Film, Television, and Radio 3,561 $366,566,395 Fashion 1,439 $48,799,476 Culture and Heritage 482 $75,063,541
Totals 59,588 $2,674,413,462 Source: EMSI (via Denver Arts & Venues and Denver Economic Development & Opportunity), Author’s Estimates
The Culinary Arts cluster ranks second in terms of estimated losses in jobs and sales revenue. This is the result of the temporary closing of restaurants lessening demand for locally-sourced culinary products, the cancellation of events and festivals that incorporate mobile dining options, smaller craft breweries unable to move product, and the effects of a sudden loss of tourists and events like weddings at wineries and distilleries among many other factors. Although the Film, Television, and Radio industry cluster comes in seventh in terms of employment loss, the comparatively higher valuation of its output places it in third for estimated losses in sales revenue. The sizeable losses in that sector are due to film, television, and commercial production largely shutting down with post production work drying up as well. Advertising on television and radio will also suffer as other industries slowdown – a situation that will impact the Design and Advertising cluster in a broader capacity, helping it to shed an estimated 4,470 jobs and $225 million in sales revenue. Similarly, the Architecture and Living Spaces cluster will feel measurable effects from the COVID-19 crisis as commercial and residential building is disrupted, resulting in an estimated 4,106 jobs lost and $159 million in lost sales revenue.
Conclusion These are estimations and subject to influences still unfolding and factors unique to creative economies. How policymakers at all levels of government continue to react to the COVID-19 crisis is dynamic, as is the spread of COVID-19. Multiple variables may be introduced via policy or

13
through the spread of COVID-19 that could significantly change these estimations. In addition, these estimations are for the creative industries, and include people in creative occupations and other occupations within creative industry firms and establishments, the self-employed, and those working part-time in a freelance capacity. If one considers the entire creative economy and how its dynamics are interwoven with other industries, an even more challenging scenario emerges.
Those who are in creative occupations that drive both the creative industries and the broader creative economy are particularly vulnerable to the economic shock of the COVID-19 crisis as a disproportionate number of them are either self-employed or work freelance in addition to other jobs. For example, 36% of architects, 46% of graphic designers, 71% of fashion designers, and 79% of musicians in Colorado are either self-employed or work freelance with presumably a sizeable portion of these individuals working other jobs for economic security either within or outside of the creative industries. Add to that the number of those working full-time in creative occupations in industries like service, hospitality, travel, or retail – i.e., industries which are also currently experiencing their own challenging COVID-19 crisis scenarios – and the precarious position of Colorado’s entire creative economy emerges.
Although there are many variables still in play at this early stage of the COVID-19 crisis, there will undoubtedly be wide-ranging and long-lasting impacts on Colorado’s creative economy. Regional professional groups, philanthropic organizations, municipal governments, and arts agencies should coordinate efforts swiftly to address the state’s creative economy by taking two steps. The first step is to advocate for local, state, and federal funding for creative workers, firms, and establishments. This funding will help with immediate needs in the creative economy and prevent it from losing all the momentum it had up until this point.
The second step is to establish a program similar to the New Deal-era’s Federal Art Project in the 1930s and 1940s wherein unemployed workers in creative industries and occupations could be employed on projects in their communities and throughout the state. Teams of creatives could work together across disciplines to solve challenges like how to retrofit performing arts venues so they may safely reopen or reimagine and program open spaces when the COVID-19 crisis has passed. Incorporating representatives from industries like education, technology, and health care as advisors in this program would help create projects that could upgrade participants’ skills, further integrate the creative economy within the broader knowledge economy, and offer potential for innovation in an interdisciplinary setting.
Colorado’s creative economy was healthy and growing before the challenges posed by the COVID-19 crisis and it is positioned for continued growth and resilience. The next year or two are critical as a new environment can be established to facilitate the return of growth while also preparing creative workers, firms, and establishments to develop the creative economy of the future.

14
Acknowledgements About Colorado Creative Industries Colorado Creative Industries (CCI) strives to support and expand the impact of creative industries, artists and entrepreneurs, connecting communities to advance a thriving and vibrant Colorado. With the support of CCI, non-profit and for-profit creative businesses, artists and creative entrepreneurs will have increased access to financial support, skill development, leadership training and professional networking. Colorado is recognized as a premier creative hub – a home for world-class creative businesses, productions and experiences. Recognizing Colorado’s creative hub, CCI’s efforts support opportunities for arts learning. Creativity skills development will be available to Colorado youth to help them succeed in school and to be better prepared to enter the workforce, and to Colorado adults, in support of lifelong learning. It’s our goal to make sure all Coloradans will have access to creative environments and experiences while preserving and promoting Colorado’s unique cultural heritage.
For more information: https://www.coloradocreativeindustries.org
About the Author Dr. Michael Seman is an assistant professor of arts management in Colorado State University’s LEAP Institute for the Arts and a research associate in Colorado State University’s Regional Economic Development Institute. He received his doctorate in urban planning and public policy from the University of Texas at Arlington in 2014. Before joining Colorado State University, Michael was Director of Creative Industries Research and Policy at the University of Colorado Denver College of Arts and Media. His co-edited volume concerning the production and consumption of music in the digital age was published by Routledge in 2016 as part of their Contemporary Human Geography Series and Michael recently helped author music strategies for both the City of Denver and the State of Colorado. Michael’s work can also be found in many academic journals including Cities, Regional Science Policy and Practice, Applied Research in Economic Development, City, Culture and Society, Industrial Geographer, Artivate: A Journal of Entrepreneurship in the Arts, and most recently in Growth and Change. National Public Radio, Vice, Wired, The Washington Post, and many regional media outlets seek Michael’s insight and he is often invited to speak at professional and civic events across the country.
For more information: https://leap.colostate.edu
https://redi.colostate.edu

15
Appendix: Methodology Two approaches are taken in this report to examine Colorado’s creative economy – industrial and occupational. First, the creative economy is measured by the scale and scope of distinct creative industry clusters. This offers insight into the total number of jobs (whether in creative occupations or not) and the overall sales of goods and services that can be attributed to these industry clusters. For example, using this approach captures everyone employed in a music promotion firm, from the receptionist to the graphic designer on staff to the promoter booking the concerts. This approach also captures the graphic designer who is self-employed with her own practice, plus the graphic designer who freelances part-time. With an industrial approach, sales of goods and services from all firms, establishments, the self-employed, and freelancers are captured as well. An occupational approach is taken to consider just the employment of the creative individuals who drive this activity in firms and establishments, are employed by firms in a different industry, are self-employed, or are freelancing part-time. This approach isolates a region’s core creative workforce and allows for closer analysis of creative employment throughout the broader economy.
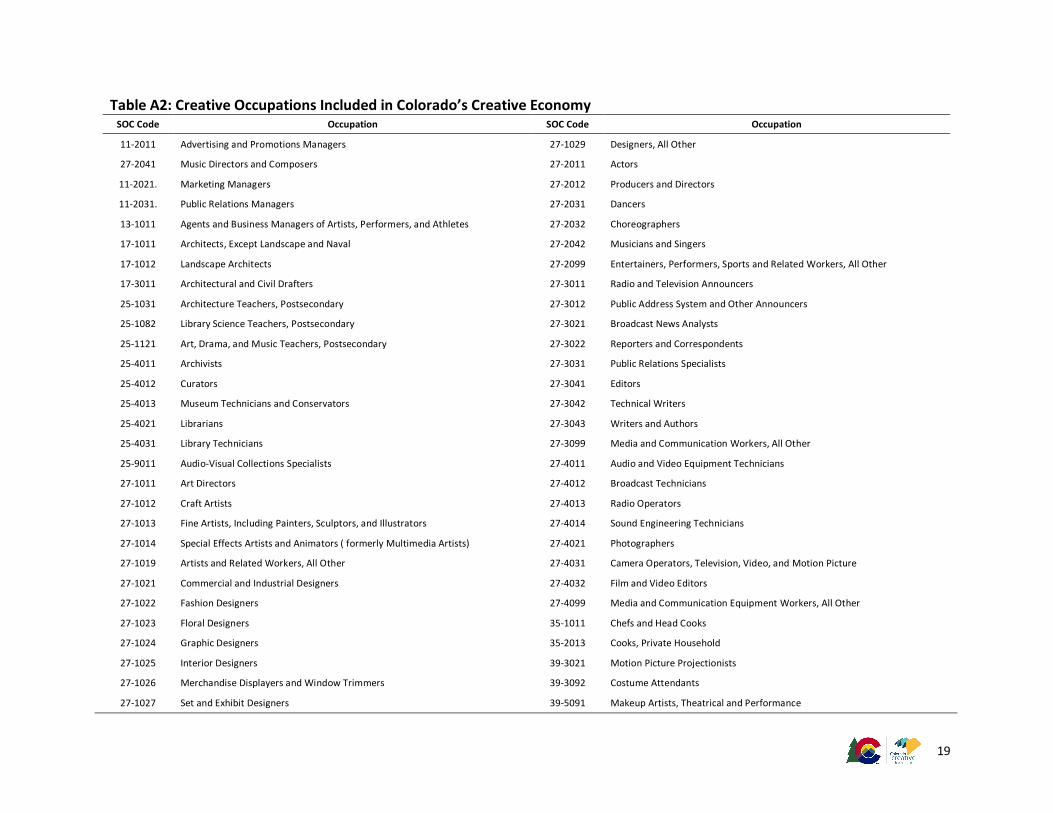
Whether taking an industrial or occupation approach to measuring a creative economy in a region, parameters are needed to describe it and then access to data in order to measure it. There is no general consensus as to which industries definitively comprise the creative economy.8 As such, the first step for this report was selecting which industries as defined by the Office of Management and Budget’s (OMB) North American Industrial Classification System (NAICS) might be considered as part of Colorado’s creative economy. After reviewing similar studies, academic research papers, and methodologies offered by national arts associations, a list of potential industries was created. A similar method was used to identify which occupations as defined by the OMB’s Standard Occupational Classification (SOC) system should be included in this report. These lists were then presented to representatives of both the City of Denver Arts & Venues and Colorado Creative Industries for their input on what industries and occupations would best represent the creative economy regionally and statewide. These lists were then refined according to the input provided and formally used to gather data for both creative industries (Table A1) and creative occupations (Table A2).
The City of Denver Arts & Venues and Denver Economic Development & Opportunity provided the data via Economic Modeling Specialists International (EMSI), an industry-standard economic analyst tool. EMSI gathers data provided by the Bureau of Labor Statistics, Bureau of Economic Analysis, U.S. Census, and other city, state and federal organizations. This report used data from EMSI’s “Q4 2019 Data Set.” In some cases, the data sets provided had to be augmented by data gathered from the Bureau of Labor Statistics. EMSI data sets are valuable for creative economy analysis as they capture employment at firms and establishments, those who are self-employed as solo practitioners, and those who earn second incomes from their work in the creative economy. This is important as a substantial amount of work in the creative economy is completed by those who are self-employed or work in a freelance capacity.

16
Table A1: Creative Industries Included in Colorado’s Creative Economy NAICS Code Industry NAICS Code Industry
311340 Non-chocolate confectionery manufacturing 322230 Stationery product manufacturing
311423 Dried and dehydrated food manufacturing 323111 Commercial printing (except screen and books)
311612 Meat processed from carcasses 323113 Commercial screen printing
311710 Seafood product preparation and packaging 323117 Books printing
311830 Tortilla manufacturing 323120 Support activities for printing
311920 Coffee and tea manufacturing 327110 Pottery, ceramics, and plumbing fixture manufacturing
311930 Flavoring syrup and concentrate manufacturing 327212 Other pressed and blown glass and glassware manufacturing
311941 Mayonnaise, dressing, and other prepared sauce manufacturing 332323 Ornamental and architectural metal work manufacturing
311942 Spice and extract manufacturing 337121 Upholstered Household Furniture Manufacturing
312120 Breweries 337122 Nonupholstered Wood Household Furniture Manufacturing
312130 Wineries 337125 Metal Household Furniture Manufacturing
312140 Distilleries 337125 Household Furniture (Except Wood and Metal) Manufacturing
313210 Broadwoven Fabric Mill 337212 Custom architectural woodwork and millwork manufacturing
313220 Narrow Fabric Mills 339910 Jewelry and silverware manufacturing
313310 Textile & Fabric Finishing Mills 339992 Musical instrument manufacturing
313320 Fabric Coating Mills 423410 Photographic equipment and supplies merchant wholesalers
314910 Textile bag and canvas mills 423940 Jewelry, watch, precious stone, and precious metal merchant wholesalers
314999 All other Misc. Textile Mills 424920 Book, periodical, and newspaper merchant wholesalers
315190 Other apparel knitting mills 445210 Meat markets
315210 Cut and Sew Apparel Contractors 445220 Fish and seafood markets
315220 Men's and boy’s cut and sew apparel manufacturing 445230 Fruit and vegetable markets
315240 Women's, girl's, and infant's cut an sew apparel manufacturing 315990 Apparel accessories and other apparel manufacturing
315280 Other cut and sew apparel manufacturing 448310 Jewelry stores
315990 Apparel accessories and other apparel manufacturing 451130 Sewing, needlework, and piece goods stores
316210 Footwear Manufacturing 451140 Musical instrument and supplies stores
316992 Women's handbag and purse manufacturing 451211 Book stores

17
Table A1: Creative Industries Included in Colorado’s Creative Economy (Continued) NAICS Code Industry NAICS Code Industry
451212 News dealers and newsstands 541320 Landscape architectural services
453110 Florists 541340 Drafting services
453920 Art dealers 541410 Interior design services
511110 Newspaper publishers 541420 Industrial design services
511120 Periodical publishers 541430 Graphic design services
511130 Book publishers 541490 Other specialized design services
511191 Greeting card publishers 541810 Advertising agencies
511199 All other publishers 541820 Public relations agencies
511210 Software publishers 541830 Media buying agencies
512110 Motion picture and video production 541840 Media representatives
512120 Motion picture and video distribution 541850 Outdoor Advertising
512131 Motion picture theaters (except drive-Ins) 541860 Direct mail advertising
512132 Drive-in motion picture theaters 541870 Advertising Material Distribution Services
512191 Teleproduction and other postproduction services 541890 Other services related to advertising
512199 Other motion picture and video industries 541921 Photography studios, portrait
512230 Music publishers 541922 Commercial photography
512240 Sound recording studios 611610 Fine arts schools (private)
512250 Record Production and Distribution 711110 Theater companies and dinner theaters
512290 Other sound recording industries 711120 Dance companies
515111 Radio networks 711130 Musical groups and artists
515112 Radio stations 711190 Other performing arts companies
515120 Television broadcasting 711310 Promoters of performing arts, sports, and similar events with facilities
515210 Cable and other subscription programming 711320 Promoters of performing arts, sports, and similar events without facilities
519110 News syndicates 711410 Agents and managers for artists, athletes, entertainers, and other public figures
519120 Libraries and archives 711510 Independent artists, writers, and performers
519130 Internet publishing and broadcasting and web search portals 712110 Museums
541310 Architectural services 712120 Historical sites

18
Table A1: Creative Industries Included in Colorado’s Creative Economy (Continued)
NAICS Code Industry
712130 Zoos and botanical gardens
722320 Caterers
722330 Mobile food services
811420 Reupholstery and furniture repair
812921 Photofinishing laboratories (except one-hour)
19
Table A2: Creative Occupations Included in Colorado’s Creative Economy SOC Code Occupation SOC Code Occupation
11-2011 Advertising and Promotions Managers 27-1029 Designers, All Other
27-2041 Music Directors and Composers 27-2011 Actors
11-2021. Marketing Managers 27-2012 Producers and Directors
11-2031. Public Relations Managers 27-2031 Dancers
13-1011 Agents and Business Managers of Artists, Performers, and Athletes 27-2032 Choreographers
17-1011 Architects, Except Landscape and Naval 27-2042 Musicians and Singers
17-1012 Landscape Architects 27-2099 Entertainers, Performers, Sports and Related Workers, All Other
17-3011 Architectural and Civil Drafters 27-3011 Radio and Television Announcers
25-1031 Architecture Teachers, Postsecondary 27-3012 Public Address System and Other Announcers
25-1082 Library Science Teachers, Postsecondary 27-3021 Broadcast News Analysts
25-1121 Art, Drama, and Music Teachers, Postsecondary 27-3022 Reporters and Correspondents
25-4011 Archivists 27-3031 Public Relations Specialists
25-4012 Curators 27-3041 Editors
25-4013 Museum Technicians and Conservators 27-3042 Technical Writers
25-4021 Librarians 27-3043 Writers and Authors
25-4031 Library Technicians 27-3099 Media and Communication Workers, All Other
25-9011 Audio-Visual Collections Specialists 27-4011 Audio and Video Equipment Technicians
27-1011 Art Directors 27-4012 Broadcast Technicians
27-1012 Craft Artists 27-4013 Radio Operators
27-1013 Fine Artists, Including Painters, Sculptors, and Illustrators 27-4014 Sound Engineering Technicians
27-1014 Special Effects Artists and Animators ( formerly Multimedia Artists) 27-4021 Photographers
27-1019 Artists and Related Workers, All Other 27-4031 Camera Operators, Television, Video, and Motion Picture
27-1021 Commercial and Industrial Designers 27-4032 Film and Video Editors
27-1022 Fashion Designers 27-4099 Media and Communication Equipment Workers, All Other
27-1023 Floral Designers 35-1011 Chefs and Head Cooks
27-1024 Graphic Designers 35-2013 Cooks, Private Household
27-1025 Interior Designers 39-3021 Motion Picture Projectionists
27-1026 Merchandise Displayers and Window Trimmers 39-3092 Costume Attendants
27-1027 Set and Exhibit Designers 39-5091 Makeup Artists, Theatrical and Performance

20
Table A2: Creative Occupations Included in Colorado’s Creative Economy (Continued)
SOC Code Occupation
41-3011 Advertising Sales Agents
41-9012 Models
43-4121 Library Assistants, Clerical
43-9031 Desktop Publishers
49-9061 Camera and Photographic Equipment Repairers
49-9063 Musical Instrument Repairers and Tuners
51-3011 Bakers
51-5113 Print Binding and Finishing Workers
51-6052 Tailors, Dressmakers, and Custom Sewers
51-6093 Upholsterers
51-7010 Cabinetmakers and Bench Carpenters
51-7021 Furniture Finishers
51-9012 Separating, Filtering, Clarifying, Precipitating, and Still Machine Setters, Operators, and Tenders
51-9071 Jewelers and Precious Stone and Metal Workers
51-9151 Photographic Process Workers and Processing Machine Operators
21
References 1 National Endowment for the Arts and United States Bureau of the Census (2020). Arts Basic Survey,
United States, 2018. Inter-university Consortium for Political and Social Research [distributor].
2 Seman, M. (2018). Colorado’s Music Industry: An Analysis and Look Forward. Prepared for Colorado
Creative Industries and the Bohemian Foundation. University of Colorado Denver College of Arts &
Media.
3 Reid, N. and Gatrell, J. D. (2017) “Creativity, community, & growth: A social geography of urban craft
beer.” REGION, 4(1): 31–49; Morrison, J. (2017, September 7). “Are craft breweries the next
coffeehouses?” Smithsonian Magazine. Accessed from: https://www.smithsonianmag.com/arts-
culture/are-craft-breweries-next-coffeehouses-180964739/
4 Seman, M. (2018). Colorado’s Music Industry: An Analysis and Look Forward. Prepared for Colorado
Creative Industries and the Bohemian Foundation. University of Colorado Denver College of Arts &
Media.
5 Wolf, S. (2020, March 2). “Can this bill save Colorado’s film industry from the brink after decades of
movie studio neglect?” Colorado Public Radio. Accessed from: https://www.cpr.org/2020/03/02/can-
this-bill-save-colorados-film-industry-from-the-brink-after-decades-of-movie-studio-neglect/
6 Kohler, J. (2019, January 25). “Colorado’s outdoor recreation economy grows to $62.5 billion, new
report says.” The Denver Post. Accessed from: https://tinyurl.com/r95ljdw; Rabimov, S. (2020,
January 22). “Denver Fashion Week helps American designers to succeed.” Forbes. Accessed from:
https://www.forbes.com/sites/stephanrabimov/2020/01/22/denver-fashion-week-helps-american-
designers-to-succeed/#542ab5f23bae
7 Goldman Sachs: Economic Research. (2020, March 20). “US Daily: A sudden stop for the US economy.”
The Goldman Sachs Group, Inc. New York, NY. Accessed from: https://www.goldmansachs.com/insi
ghts/pages/gs-research/us-daily-20-mar-2020/report.pdf; Swagel, P. (2020, April 2). “CBO’s current
projections of output, employment, and interest rates and a preliminary look at federal deficits for
2020 and 2021.” Congressional Budget Office. Washington, D.C. Accessed from: https://www.cbo.gov
/publication/56335.
8 Markusen, A., Wassall, G. H., DeNatale, D., and Cohen, R. (2008). “Defining the creative economy:
Industry and occupational approaches.” Economic Development Quarterly, 22(1): 24–45.