Embed Size (px)
Citation preview
rev: 20200901
2020 Climate Survey on Diversity, Equity, and Inclusion
Final School Report
Prepared for:
Prepared by: Angie Baker & Robert H. Young [email protected] 734-527-2151 August 2020
INTRODUCTIONTheEvergreenStateCollege,inOlympia,Washington,isdedicatedtocultivatingauniversitycommunitythatfostersconstructiveparticipationinadiverse,multiculturalworld.Thecollegehasahistoryofsupportinginitiativesthatfosterlearningandworkingenvironmentsthataresafeandinclusive.
Toassesscurrentcampusclimate,TheEvergreenStateCollegeconductedasurveyduringWinterTerm2020onDiversity,Equity,andInclusion.ThisstudywasdesignedtohelpTheEvergreenStateCollegedevelopabaselineunderstandingofperceptions,experiencesandperspectivesregardingseveralaspectsofthesetopicsamongstudents,faculty,andstaff.
TheEvergreenStateCollegeCampusClimateSurveyonDiversity,Equity,andInclusion(TESC-DEI)wasdesignedtohelpadministratorsestablishastrongknowledgearoundissuesrelatingtodiversity,equity,andinclusionbylearningaboutthecommunity’sperspectives,opinions,andexperiencesrelatedtothesetopics.Faculty,staff,andstudentsweresurveyedinthisstudy.DatacollectedwillhelpcampusleadersdevelopacomprehensiveunderstandingofDEItopicsfromtheviewpointsoftheindividualswhocomprisetheoverallEvergreencommunity.Specifically,thedatacollectedintheDEIsurveywillallowTheEvergreenStateCollegetoestablishabaselineunderstandingofthepresentclimateatEvergreen,helpinformcurrentandfuturedecisionsaboutsupportingadiverse,inclusiveandvibrantcampuscommunity,andserveasabenchmarkagainstwhichtomeasurechangeovertime.
TheTESC-DEIwasconductedinWinterTerm2020,withactivedatacollectionfromJanuary13,2020throughFebruary28,2020.ThisreportsummarizesthestudyresultsforfacultyandstaffemployedatTheEvergreenStateCollegeasofDecember05,2019andforstudentsenrolledatTheEvergreenStateCollegeasofJanuary6,2020initiallyandthenlaterupdatedonJanuary24,2020toreflectcurrentenrollment.
1
BACKGROUND&METHODSTESC-DEIStudyGroups
AlleligibleEvergreenfaculty,staffandstudentswereinvitedtoparticipateintheTESC-DEIsurvey,thus,forallofthesegroups,theDEIstudywasacensus.
EligibilitytoparticipateintheDEIwasdefinedasindividualsatTheEvergreenStateCollegeage18orolderwhowere:EnrolledasanUndergraduateStudent(part-orfull-timeasofJanuary6,2020andthenupdatedonJanuary24,2020)EmployedasStaff(asofDecember24,2020)EmployedasFaculty(asofDecember24,2020)
TheEvergreenStateCollegeRegistrarprovidedthelist(2,664students)forthestudents.TheEvergreenStateCollegeHumanResourcesdepartmentprovidedthelistsforthefaculty(199faculty)andstaff(498staff).FortheTESC-DEI,atotalof3,361individualswereinvitedtoparticipateinthesurvey.
2020TESC-DEISurvey
The2020TESC-DEIsurveywasdevelopedviaacollaborationbetweenSoundRocket,anindependentresearchcompanythatprovidescustomaswellasstandardizedsurveyservices,andTheEvergreenStateCollege.Theinstrumentdesignwasguided,inpart,bytheNationalCampusClimateSurvey,conductedattheUniversityofMichigan,AnnArbor,andavailableasastandardizedinstrumentforotherinstitutions.ThisstandardizedinstrumentwasmodifiedtofocusonTheEvergreenStateCollegeandusedfilteringtodirectrespondentstoappropriatequestionsthroughoutthesurveybasedontheirdesignationasastudent,faculty,orstaffatEvergreen.ItshouldbenotedthattheofficeoftheFirstPeoplesMulticultural,Trans,AndQueerSupportServicesatTheEvergreenStateCollegegaveinput,whichwasusedtohelpdevelopandrefinethequestionsincludedinthesurvey.Thesurveywasdesignedasaself-administered,interactive,web-basedsurveythatwouldtakelessthan15minutestocompleteonaverage.
ThefinalTESC-DEIsurveywasstructuredasfollows:
WelcomeAbriefdescriptionoftheresearchanditskeyobjectives,astatementofconfidentiality,anoteregardingvoluntaryparticipationandsurveylength,informationaboutincentives,andcontactinformationfortheSoundRocketsurveyteam.
ConsentAninformed,passiveconsent,whereinstudydetailsaboutthenatureandpurposeoftheresearchwereprovidedandparticipantsclicked“Next”iftheyagreedtoparticipate.
Demographics–SurveyPartIQuestionswereaskedtocapturethedemographicsofeachparticipant,including:gender,race/ethnicity,sexualorientation,religiousaffiliation,disability,militarystatus,andcitizenship.Studentswereaskedabouttheirmajorsandenrollmentstatus;staffandfacultywereaskedabouttheirprimarydepartment/unit.
CampusClimate–SurveyPartIIQuestionsabout:satisfactionwithTheEvergreenStateCollegecampusclimatewithrespecttoDEI;perceptionsofEvergreenoverallonvariousattributesrelatedtodiversity,equity,andinclusion;feelingsofsafetyonandaroundcampus;individualopinionsaboutDEIaspectsregardingEvergreenasawholefromstudent,facultyorstaffmemberperspectives;frequencyofinteractionswithdiversepeopleatEvergreen;discriminatoryeventspersonallyexperienced;andratingsregardingparticularaspectsofbeingastaff,facultyorstudentatTheEvergreenStateCollege.
ThankYouAfinalpagethankingparticipantsfortheirtimeandinput.
2
TESC-DEI:DataCollection
The2020TheEvergreenStateCollegeDEIwasadministeredasanon-linewebsurvey;thesurveywasoptimizedsothatitcouldbecompletedsuccessfullyonmobiledevicesandtablets,aswellasondesktoporlaptopcomputers.Mobileoptimizationwasimplementeddynamicallyduringthesurvey–ifthesystemdetectedthatamobile-sizedscreenwasinuse,itautomaticallyadjustedtheviewtoaccommodatethedevice.
RespondentIncentives
Toencourageparticipation,alleligibleTESC-DEIstudyparticipants–regardlessofwhethertheyactuallyparticipatedinthesurvey–wereenteredintoarandomdrawingtowinoneoffiveEvergreenswagprizeswithineachgroup(faculty,staff,andstudents).
DataCollection
Theoveralldatacollectiondesignprotocolincluded:Anemailinvitationtoparticipateintheweb-basedsurvey;emailedbetweenJanuary13andJanuary29,2020.Aseriesoffouremailreminderstoparticipateintheweb-basedsurveyweresenttoanynon-responders;spacedatapproximately4-dayintervals,deliveredbetweenJanuary14andFebruary15,2020.
SurveyCompletionTime
Determiningtheactualtimetakentoparticipateinaweb-basedsurveyisnotastraightforwardcalculation;however,standardpracticeswereemployedtocalculatetheaveragelengthoftimeforrespondentstocompletetheTESC-DEIsurvey.Tocomputeanaccuratesurveycompletiontime,calculationsfocusspecificallyoncasesinwhichanindividualclickedthroughtheentiresurveyandsubmittedtheirresponses.
Thesurveyswereprogrammedtocaptureadateandtimestampatthestartandendofasurvey,andacalculationisusedtodeterminetheelapsedtimeinminutesbetweenthosetwopoints;becauserespondentscouldleavethesurveyandreturntoitlater–spansofafewweeksinsomecases–asimplesubtractionfromstart-toend-timedoesnotalwaysreflectcompletiontimefromonesitting.Toidentifyoutliers,acountofthetotalnumberofloginstothewebsurveyiscaptured;thus,ifarespondentstartsasurveyonMonday,leavesandreturnsonWednesday,theirrecordshowstwologins.Thislogincountallowsallcaseswith2ormoreloginstobeexcludedfromtimetocompleteanalysis.Alongwithmultiplelogins,anotherdifficultyinascertainingsurveycompletiontimeisthatsomebrowsersmaintainanactivelinkwiththesurveysystem;thismeansthatrespondentsarenotloggedoutwhilethesurveyisopenbuttherespondentisnotactivelyengagedinthesurvey.
Astandardsurveypracticeidentifiesacutofffortop-endoutliersbymultiplyingtheinitialmedianvalueofsinglelogincasesbythreeandexcludingcasesabovethecutoff.Forexample,intheTESC-DEI,theinitialmediancompletiontimeforstudentswas15minutes;anystudentwhotookmorethan45minuteswasunlikelytobeactivelyengagedinthesurveyduringthatentiretimeandisthusexcludedfromtheaveragecompletiontimecalculation.Usingthismethod,thetopendtrimmingvalueidentifiedforTESCfacultywas30minutes;forstaffwas36minutes,andforstudentswas45minutes.
Topreserveconfidentiality,ifacellinanytablehasfewerthan5cases(responses),thedataissuppressed(i.e.,notshown).Whereappropriatethroughoutthereport,thisisindicatedinthetablesbyadash(–)symbol.Additionally,anycellthathas0cases(responses)isintentionallyleftblank.
Table1showsfinalestimatesforthelengthoftheweb-basedsurvey.
Table1:TheEvergreenStateCollegeDiversity,Equity,andInclusivityCampusClimateSurveyCompletionTime–Faculty,Staff,&Students
MeanCompletionTime(minutes)
MedianCompletionTime(minutes)
StandardDeviation(minutes)
NumberofCases(n)
Faculty 10 10 - -Staff 11.3 11 1.5 -Students 16.9 14 7.8 299AllTESC 16.8 14 7.8 303
3
Dispositions&ResponseRates
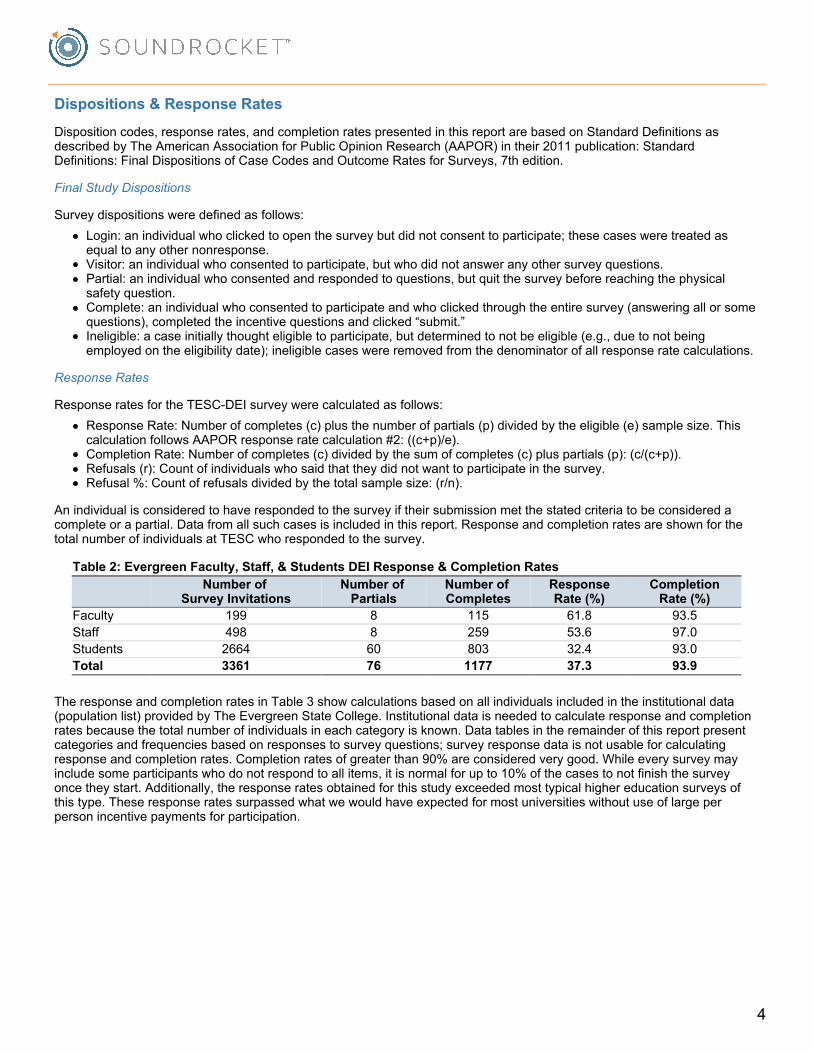
Dispositioncodes,responserates,andcompletionratespresentedinthisreportarebasedonStandardDefinitionsasdescribedbyTheAmericanAssociationforPublicOpinionResearch(AAPOR)intheir2011publication:StandardDefinitions:FinalDispositionsofCaseCodesandOutcomeRatesforSurveys,7thedition.
FinalStudyDispositions
Surveydispositionsweredefinedasfollows:Login:anindividualwhoclickedtoopenthesurveybutdidnotconsenttoparticipate;thesecasesweretreatedasequaltoanyothernonresponse.Visitor:anindividualwhoconsentedtoparticipate,butwhodidnotansweranyothersurveyquestions.Partial:anindividualwhoconsentedandrespondedtoquestions,butquitthesurveybeforereachingthephysicalsafetyquestion.Complete:anindividualwhoconsentedtoparticipateandwhoclickedthroughtheentiresurvey(answeringallorsomequestions),completedtheincentivequestionsandclicked“submit.”Ineligible:acaseinitiallythoughteligibletoparticipate,butdeterminedtonotbeeligible(e.g.,duetonotbeingemployedontheeligibilitydate);ineligiblecaseswereremovedfromthedenominatorofallresponseratecalculations.
ResponseRates
ResponseratesfortheTESC-DEIsurveywerecalculatedasfollows:ResponseRate:Numberofcompletes(c)plusthenumberofpartials(p)dividedbytheeligible(e)samplesize.ThiscalculationfollowsAAPORresponseratecalculation#2:((c+p)/e).CompletionRate:Numberofcompletes(c)dividedbythesumofcompletes(c)pluspartials(p):(c/(c+p)).Refusals(r):Countofindividualswhosaidthattheydidnotwanttoparticipateinthesurvey.Refusal%:Countofrefusalsdividedbythetotalsamplesize:(r/n).
Anindividualisconsideredtohaverespondedtothesurveyiftheirsubmissionmetthestatedcriteriatobeconsideredacompleteorapartial.Datafromallsuchcasesisincludedinthisreport.ResponseandcompletionratesareshownforthetotalnumberofindividualsatTESCwhorespondedtothesurvey.
Table2:EvergreenFaculty,Staff,&StudentsDEIResponse&CompletionRatesNumberof
SurveyInvitationsNumberofPartials
NumberofCompletes
ResponseRate(%)
CompletionRate(%)
Faculty 199 8 115 61.8 93.5Staff 498 8 259 53.6 97.0Students 2664 60 803 32.4 93.0Total 3361 76 1177 37.3 93.9
TheresponseandcompletionratesinTable3showcalculationsbasedonallindividualsincludedintheinstitutionaldata(populationlist)providedbyTheEvergreenStateCollege.Institutionaldataisneededtocalculateresponseandcompletionratesbecausethetotalnumberofindividualsineachcategoryisknown.Datatablesintheremainderofthisreportpresentcategoriesandfrequenciesbasedonresponsestosurveyquestions;surveyresponsedataisnotusableforcalculatingresponseandcompletionrates.Completionratesofgreaterthan90%areconsideredverygood.Whileeverysurveymayincludesomeparticipantswhodonotrespondtoallitems,itisnormalforupto10%ofthecasestonotfinishthesurveyoncetheystart.Additionally,theresponseratesobtainedforthisstudyexceededmosttypicalhighereducationsurveysofthistype.Theseresponseratessurpassedwhatwewouldhaveexpectedformostuniversitieswithoutuseoflargeperpersonincentivepaymentsforparticipation.
4
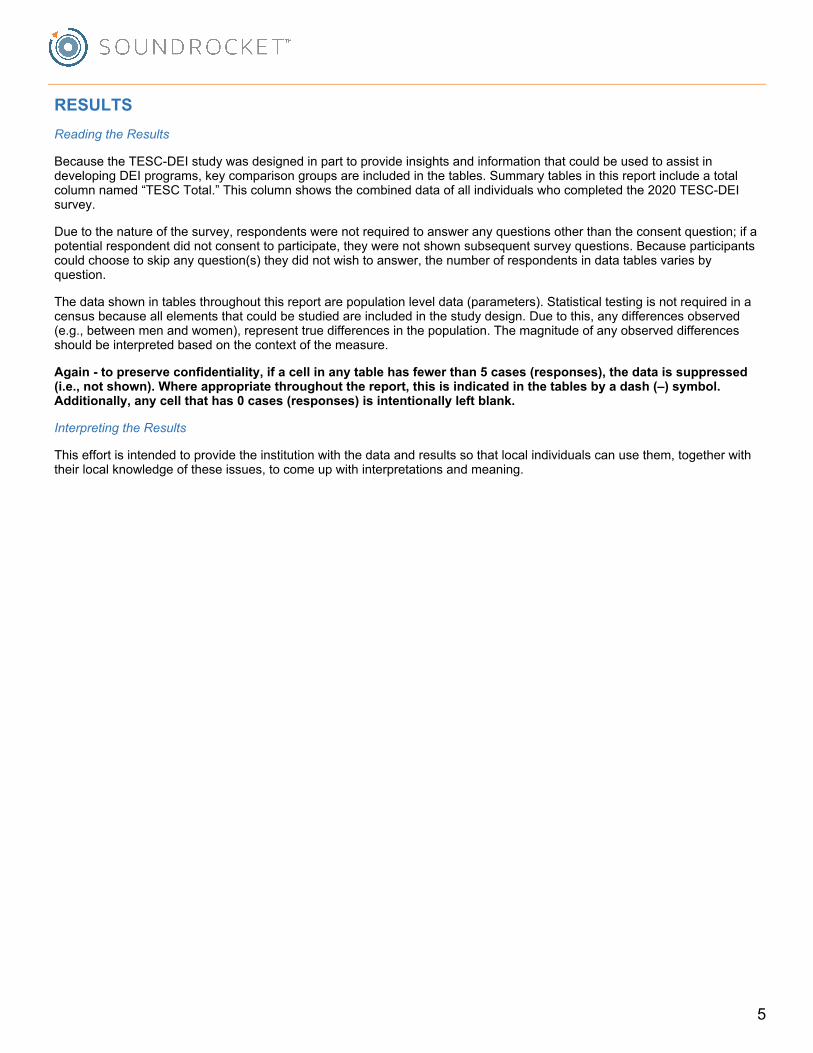
RESULTSReadingtheResults
BecausetheTESC-DEIstudywasdesignedinparttoprovideinsightsandinformationthatcouldbeusedtoassistindevelopingDEIprograms,keycomparisongroupsareincludedinthetables.Summarytablesinthisreportincludeatotalcolumnnamed“TESCTotal.”Thiscolumnshowsthecombineddataofallindividualswhocompletedthe2020TESC-DEIsurvey.
Duetothenatureofthesurvey,respondentswerenotrequiredtoansweranyquestionsotherthantheconsentquestion;ifapotentialrespondentdidnotconsenttoparticipate,theywerenotshownsubsequentsurveyquestions.Becauseparticipantscouldchoosetoskipanyquestion(s)theydidnotwishtoanswer,thenumberofrespondentsindatatablesvariesbyquestion.
Thedatashownintablesthroughoutthisreportarepopulationleveldata(parameters).Statisticaltestingisnotrequiredinacensusbecauseallelementsthatcouldbestudiedareincludedinthestudydesign.Duetothis,anydifferencesobserved(e.g.,betweenmenandwomen),representtruedifferencesinthepopulation.Themagnitudeofanyobserveddifferencesshouldbeinterpretedbasedonthecontextofthemeasure.
Again-topreserveconfidentiality,ifacellinanytablehasfewerthan5cases(responses),thedataissuppressed(i.e.,notshown).Whereappropriatethroughoutthereport,thisisindicatedinthetablesbyadash(–)symbol.Additionally,anycellthathas0cases(responses)isintentionallyleftblank.
InterpretingtheResults
Thiseffortisintendedtoprovidetheinstitutionwiththedataandresultssothatlocalindividualscanusethem,togetherwiththeirlocalknowledgeoftheseissues,tocomeupwithinterpretationsandmeaning.
5
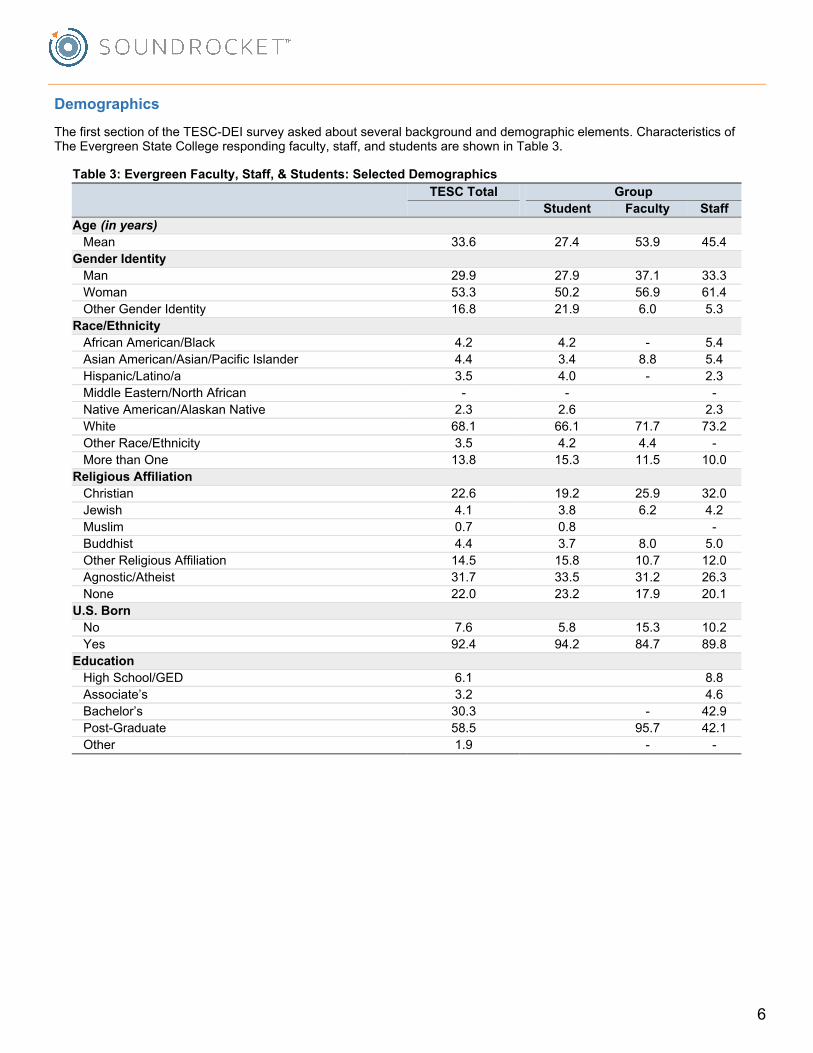
Demographics
ThefirstsectionoftheTESC-DEIsurveyaskedaboutseveralbackgroundanddemographicelements.CharacteristicsofTheEvergreenStateCollegerespondingfaculty,staff,andstudentsareshowninTable3.
Table3:EvergreenFaculty,Staff,&Students:SelectedDemographicsTESCTotal Group
Student Faculty StaffAge(inyears)Mean 33.6 27.4 53.9 45.4GenderIdentityMan 29.9 27.9 37.1 33.3Woman 53.3 50.2 56.9 61.4OtherGenderIdentity 16.8 21.9 6.0 5.3Race/EthnicityAfricanAmerican/Black 4.2 4.2 - 5.4AsianAmerican/Asian/PacificIslander 4.4 3.4 8.8 5.4Hispanic/Latino/a 3.5 4.0 - 2.3MiddleEastern/NorthAfrican - - -NativeAmerican/AlaskanNative 2.3 2.6 2.3White 68.1 66.1 71.7 73.2OtherRace/Ethnicity 3.5 4.2 4.4 -MorethanOne 13.8 15.3 11.5 10.0ReligiousAffiliationChristian 22.6 19.2 25.9 32.0Jewish 4.1 3.8 6.2 4.2Muslim 0.7 0.8 -Buddhist 4.4 3.7 8.0 5.0OtherReligiousAffiliation 14.5 15.8 10.7 12.0Agnostic/Atheist 31.7 33.5 31.2 26.3None 22.0 23.2 17.9 20.1U.S.BornNo 7.6 5.8 15.3 10.2Yes 92.4 94.2 84.7 89.8EducationHighSchool/GED 6.1 8.8Associate’s 3.2 4.6Bachelor’s 30.3 - 42.9Post-Graduate 58.5 95.7 42.1Other 1.9 - -
6
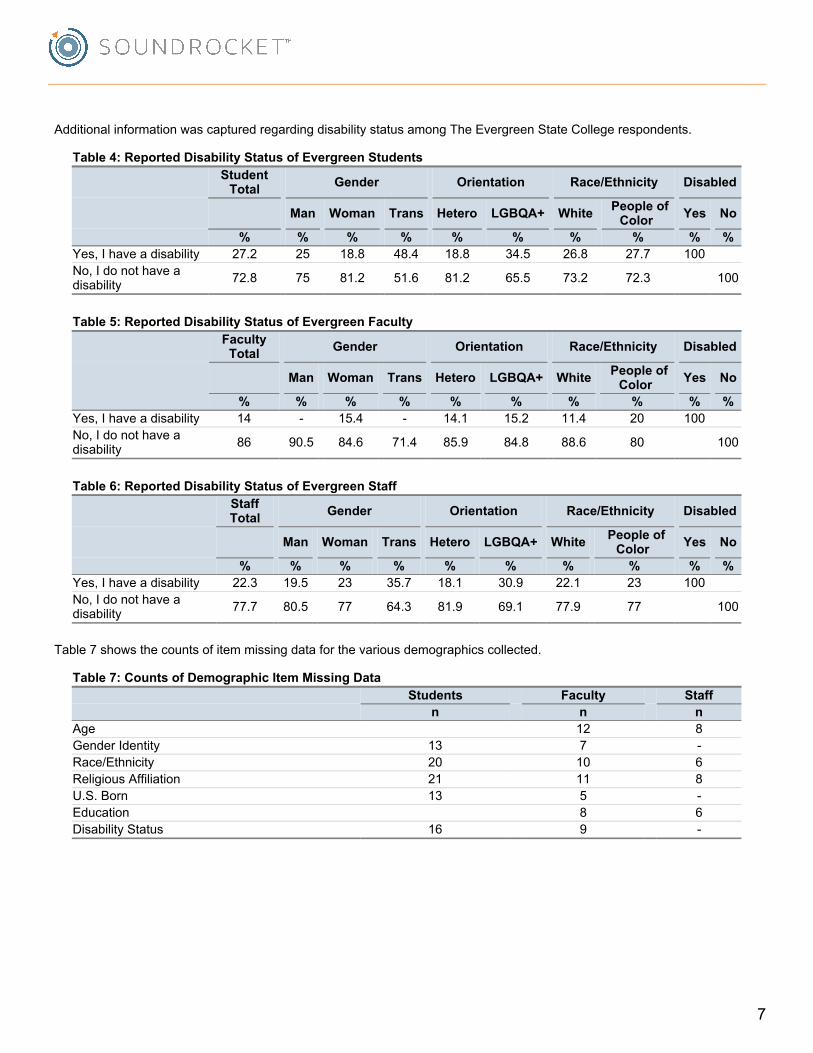
AdditionalinformationwascapturedregardingdisabilitystatusamongTheEvergreenStateCollegerespondents.
Table4:ReportedDisabilityStatusofEvergreenStudentsStudentTotal Gender Orientation Race/Ethnicity Disabled
Man Woman Trans Hetero LGBQA+ White PeopleofColor Yes No
% % % % % % % % % %Yes,Ihaveadisability 27.2 25 18.8 48.4 18.8 34.5 26.8 27.7 100 No,Idonothaveadisability 72.8 75 81.2 51.6 81.2 65.5 73.2 72.3 100
Table5:ReportedDisabilityStatusofEvergreenFacultyFacultyTotal Gender Orientation Race/Ethnicity Disabled
Man Woman Trans Hetero LGBQA+ White PeopleofColor Yes No
% % % % % % % % % %Yes,Ihaveadisability 14 - 15.4 - 14.1 15.2 11.4 20 100 No,Idonothaveadisability 86 90.5 84.6 71.4 85.9 84.8 88.6 80 100
Table6:ReportedDisabilityStatusofEvergreenStaffStaffTotal Gender Orientation Race/Ethnicity Disabled
Man Woman Trans Hetero LGBQA+ White PeopleofColor Yes No
% % % % % % % % % %Yes,Ihaveadisability 22.3 19.5 23 35.7 18.1 30.9 22.1 23 100 No,Idonothaveadisability 77.7 80.5 77 64.3 81.9 69.1 77.9 77 100
Table7showsthecountsofitemmissingdataforthevariousdemographicscollected.
Table7:CountsofDemographicItemMissingDataStudents Faculty Staff
n n nAge 12 8GenderIdentity 13 7 -Race/Ethnicity 20 10 6ReligiousAffiliation 21 11 8U.S.Born 13 5 -Education 8 6DisabilityStatus 16 9 -
7
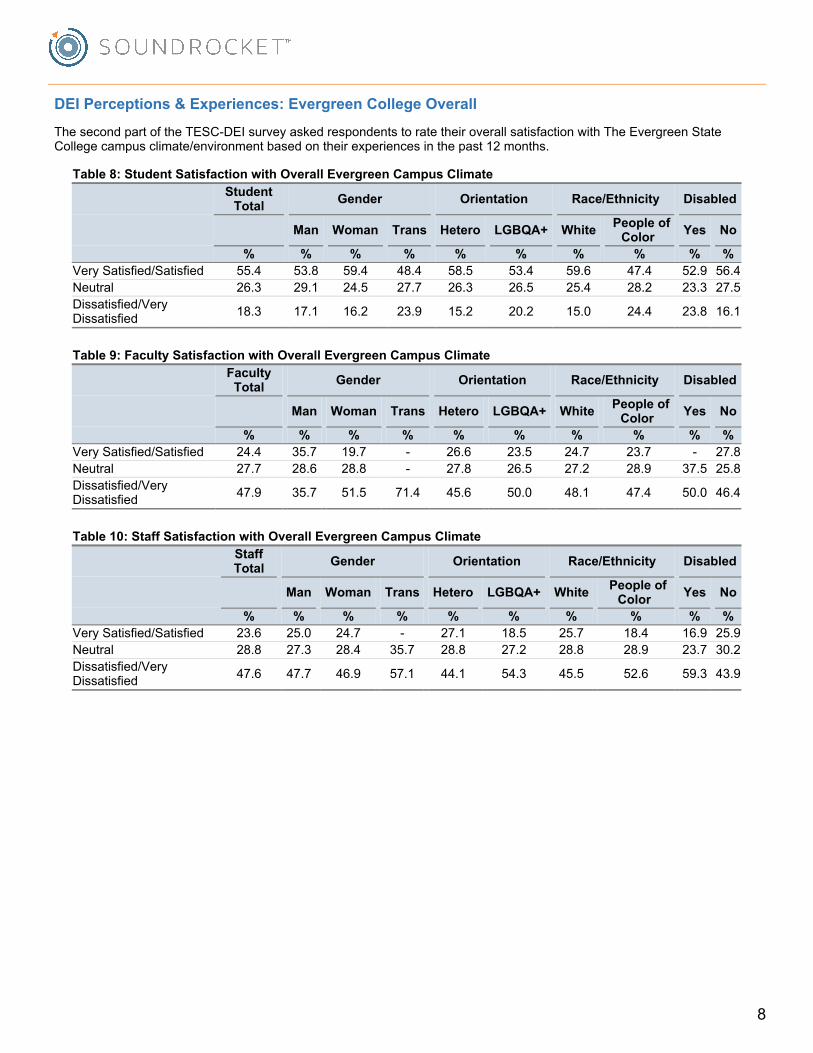
DEIPerceptions&Experiences:EvergreenCollegeOverall
ThesecondpartoftheTESC-DEIsurveyaskedrespondentstoratetheiroverallsatisfactionwithTheEvergreenStateCollegecampusclimate/environmentbasedontheirexperiencesinthepast12months.
Table8:StudentSatisfactionwithOverallEvergreenCampusClimateStudentTotal Gender Orientation Race/Ethnicity Disabled
Man Woman Trans Hetero LGBQA+ White PeopleofColor Yes No
% % % % % % % % % %VerySatisfied/Satisfied 55.4 53.8 59.4 48.4 58.5 53.4 59.6 47.4 52.9 56.4Neutral 26.3 29.1 24.5 27.7 26.3 26.5 25.4 28.2 23.3 27.5Dissatisfied/VeryDissatisfied 18.3 17.1 16.2 23.9 15.2 20.2 15.0 24.4 23.8 16.1
Table9:FacultySatisfactionwithOverallEvergreenCampusClimateFacultyTotal Gender Orientation Race/Ethnicity Disabled
Man Woman Trans Hetero LGBQA+ White PeopleofColor Yes No
% % % % % % % % % %VerySatisfied/Satisfied 24.4 35.7 19.7 - 26.6 23.5 24.7 23.7 - 27.8Neutral 27.7 28.6 28.8 - 27.8 26.5 27.2 28.9 37.5 25.8Dissatisfied/VeryDissatisfied 47.9 35.7 51.5 71.4 45.6 50.0 48.1 47.4 50.0 46.4
Table10:StaffSatisfactionwithOverallEvergreenCampusClimateStaffTotal Gender Orientation Race/Ethnicity Disabled
Man Woman Trans Hetero LGBQA+ White PeopleofColor Yes No
% % % % % % % % % %VerySatisfied/Satisfied 23.6 25.0 24.7 - 27.1 18.5 25.7 18.4 16.9 25.9Neutral 28.8 27.3 28.4 35.7 28.8 27.2 28.8 28.9 23.7 30.2Dissatisfied/VeryDissatisfied 47.6 47.7 46.9 57.1 44.1 54.3 45.5 52.6 59.3 43.9
8
5.15.3
4.54.6
4.85
4.34.3
4.34.4
3.84.1
55.2
4.24.4
4.34.6
3.83.8
4.95.2
4.24.3
4.64.9
4.14.1
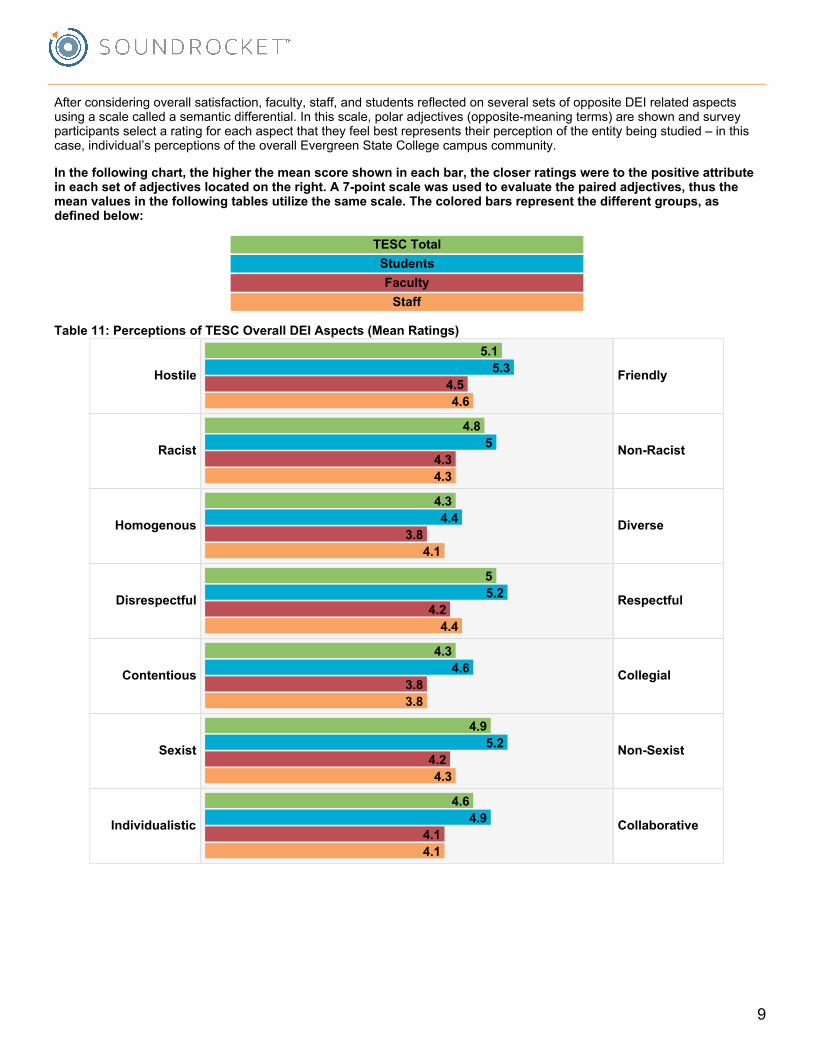
Afterconsideringoverallsatisfaction,faculty,staff,andstudentsreflectedonseveralsetsofoppositeDEIrelatedaspectsusingascalecalledasemanticdifferential.Inthisscale,polaradjectives(opposite-meaningterms)areshownandsurveyparticipantsselectaratingforeachaspectthattheyfeelbestrepresentstheirperceptionoftheentitybeingstudied–inthiscase,individual’sperceptionsoftheoverallEvergreenStateCollegecampuscommunity.
Inthefollowingchart,thehigherthemeanscoreshownineachbar,thecloserratingsweretothepositiveattributeineachsetofadjectiveslocatedontheright.A7-pointscalewasusedtoevaluatethepairedadjectives,thusthemeanvaluesinthefollowingtablesutilizethesamescale.Thecoloredbarsrepresentthedifferentgroups,asdefinedbelow:
TESCTotalStudentsFacultyStaff
Table11:PerceptionsofTESCOverallDEIAspects(MeanRatings)
Hostile Friendly
Racist Non-Racist
Homogenous Diverse
Disrespectful Respectful
Contentious Collegial
Sexist Non-Sexist
Individualistic Collaborative
9
5.25.4
4.84.6
5.96.1
5.85.5
55.3
4.14.4
4.95.2
4.54.2
5.15.4
4.34.6
4.54.7
4.43.8
5.85.9
5.75.4
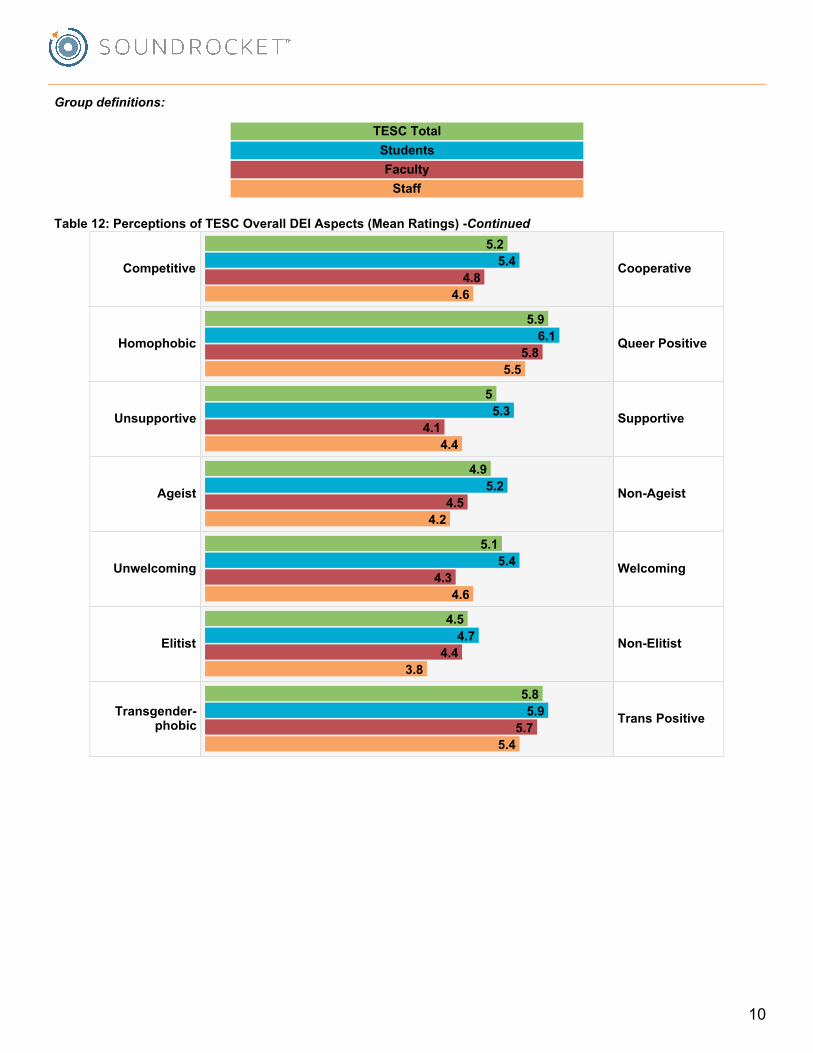
Groupdefinitions:
TESCTotalStudentsFacultyStaff
Table12:PerceptionsofTESCOverallDEIAspects(MeanRatings)-Continued
Competitive Cooperative
Homophobic QueerPositive
Unsupportive Supportive
Ageist Non-Ageist
Unwelcoming Welcoming
Elitist Non-Elitist
Transgender-phobic TransPositive
10
GeneralClimateElementsFactorHostile/Friendly
Homogenous/DiverseDisrespectful/RespectfulContentious/Collegial
Individualistic/CollaborativeCompetitive/CooperativeUnsupportive/SupportiveUnwelcoming/Welcoming
Elitist/Non-elitist
DEIClimateElementsFactorRacist/Non-RacistSexist/Non-Sexist
Homophobic/Queer-PositiveAgeist/Non-Ageist
Transgender-phobic/TransPositive
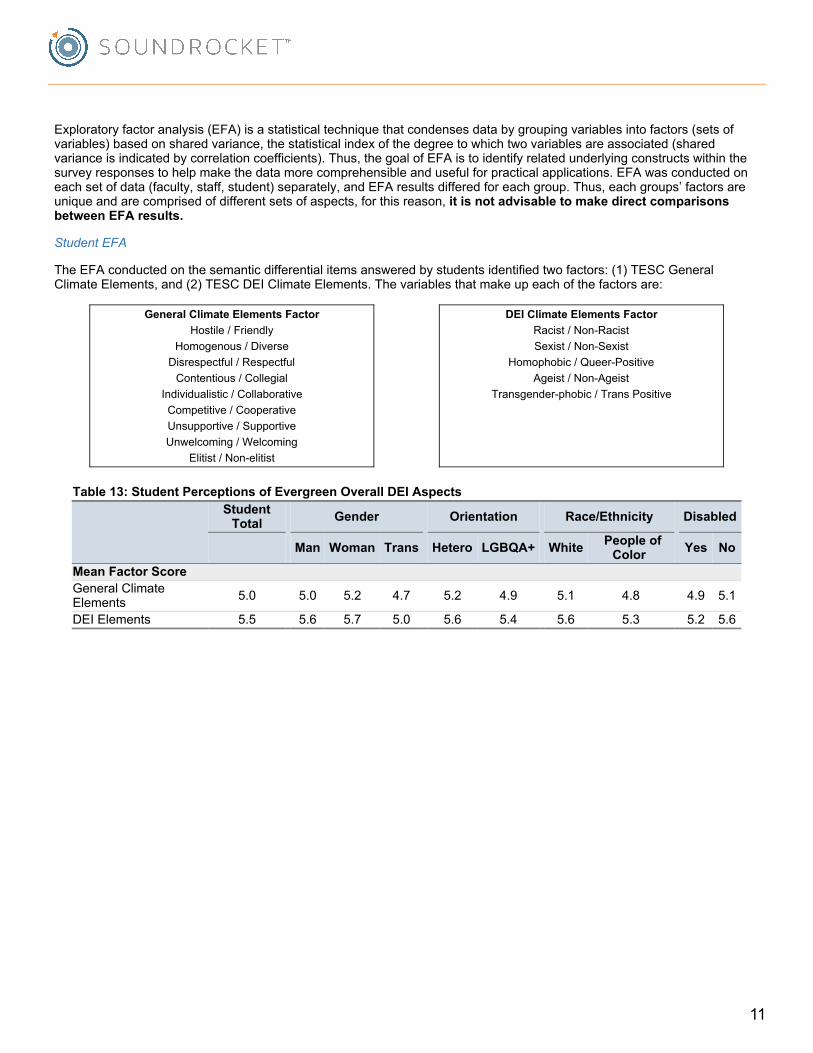
Exploratoryfactoranalysis(EFA)isastatisticaltechniquethatcondensesdatabygroupingvariablesintofactors(setsofvariables)basedonsharedvariance,thestatisticalindexofthedegreetowhichtwovariablesareassociated(sharedvarianceisindicatedbycorrelationcoefficients).Thus,thegoalofEFAistoidentifyrelatedunderlyingconstructswithinthesurveyresponsestohelpmakethedatamorecomprehensibleandusefulforpracticalapplications.EFAwasconductedoneachsetofdata(faculty,staff,student)separately,andEFAresultsdifferedforeachgroup.Thus,eachgroups’factorsareuniqueandarecomprisedofdifferentsetsofaspects,forthisreason,itisnotadvisabletomakedirectcomparisonsbetweenEFAresults.
StudentEFA
TheEFAconductedonthesemanticdifferentialitemsansweredbystudentsidentifiedtwofactors:(1)TESCGeneralClimateElements,and(2)TESCDEIClimateElements.Thevariablesthatmakeupeachofthefactorsare:
Table13:StudentPerceptionsofEvergreenOverallDEIAspectsStudentTotal Gender Orientation Race/Ethnicity Disabled
Man Woman Trans Hetero LGBQA+ White PeopleofColor Yes No
MeanFactorScoreGeneralClimateElements 5.0 5.0 5.2 4.7 5.2 4.9 5.1 4.8 4.9 5.1
DEIElements 5.5 5.6 5.7 5.0 5.6 5.4 5.6 5.3 5.2 5.6
11
GeneralClimateElementsFactorHostile/Friendly
Homogenous/DiverseDisrespectful/RespectfulContentious/Collegial
Individualistic/CollaborativeCompetitive/CooperativeUnsupportive/SupportiveUnwelcoming/Welcoming
DEIClimateElementsFactorRacist/Non-RacistSexist/Non-Sexist
Homophobic/Queer-PositiveTransgender-phobic/TransPositive
SocialCategorizationFactorElitist/Non-elitistAgeist/Non-Ageist
GeneralClimateElementsFactorHostile/Friendly
Disrespectful/RespectfulContentious/Collegial
Individualistic/CollaborativeCompetitive/CooperativeUnsupportive/SupportiveUnwelcoming/Welcoming
Elitist/Non-elitistAgeist/Non-Ageist
DEIClimateElementsFactorRacist/Non-Racist
Homogenous/DiverseSexist/Non-Sexist
Homophobic/Queer-PositiveTransgender-phobic/TransPositive
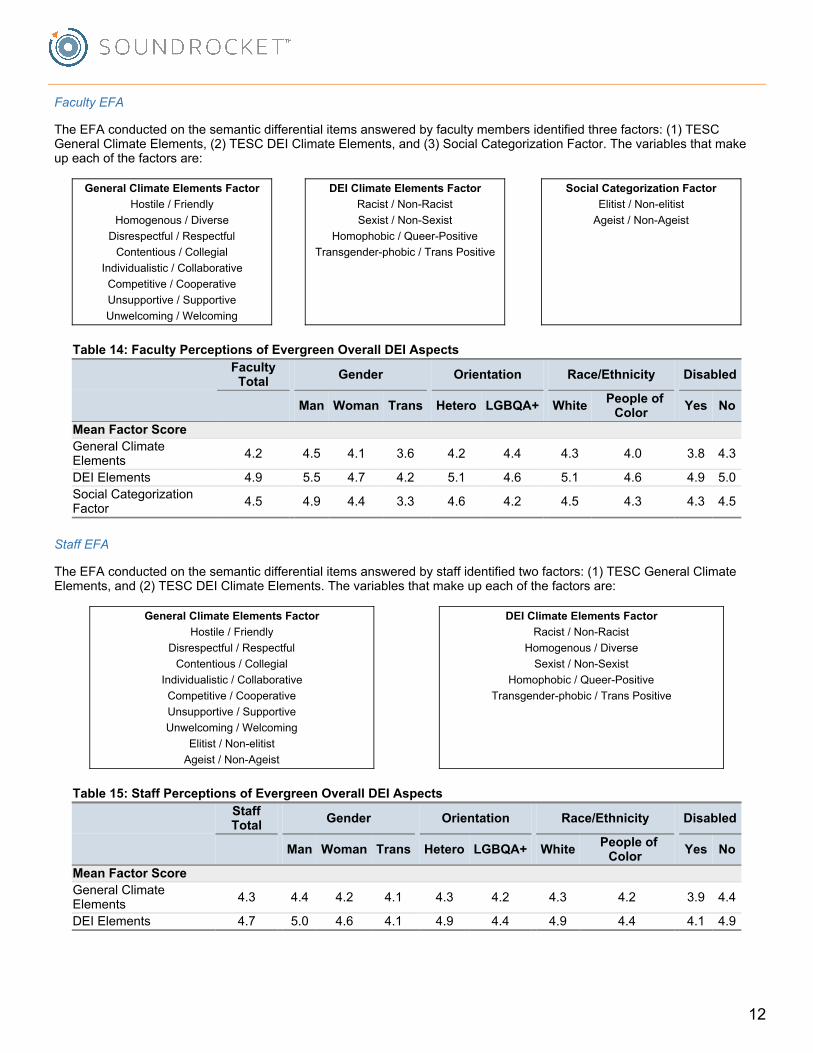
FacultyEFA
TheEFAconductedonthesemanticdifferentialitemsansweredbyfacultymembersidentifiedthreefactors:(1)TESCGeneralClimateElements,(2)TESCDEIClimateElements,and(3)SocialCategorizationFactor.Thevariablesthatmakeupeachofthefactorsare:
Table14:FacultyPerceptionsofEvergreenOverallDEIAspectsFacultyTotal Gender Orientation Race/Ethnicity Disabled
Man Woman Trans Hetero LGBQA+ White PeopleofColor Yes No
MeanFactorScoreGeneralClimateElements 4.2 4.5 4.1 3.6 4.2 4.4 4.3 4.0 3.8 4.3
DEIElements 4.9 5.5 4.7 4.2 5.1 4.6 5.1 4.6 4.9 5.0SocialCategorizationFactor 4.5 4.9 4.4 3.3 4.6 4.2 4.5 4.3 4.3 4.5
StaffEFA
TheEFAconductedonthesemanticdifferentialitemsansweredbystaffidentifiedtwofactors:(1)TESCGeneralClimateElements,and(2)TESCDEIClimateElements.Thevariablesthatmakeupeachofthefactorsare:
Table15:StaffPerceptionsofEvergreenOverallDEIAspectsStaffTotal Gender Orientation Race/Ethnicity Disabled
Man Woman Trans Hetero LGBQA+ White PeopleofColor Yes No
MeanFactorScoreGeneralClimateElements 4.3 4.4 4.2 4.1 4.3 4.2 4.3 4.2 3.9 4.4
DEIElements 4.7 5.0 4.6 4.1 4.9 4.4 4.9 4.4 4.1 4.9
12
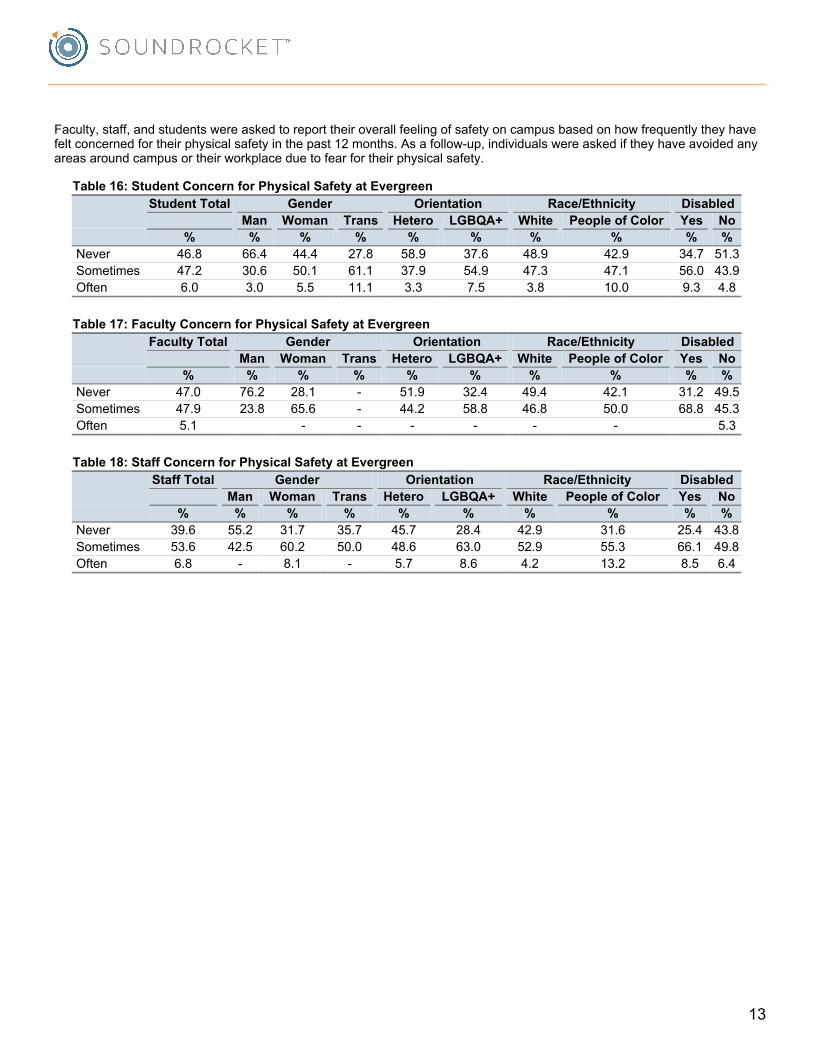
Faculty,staff,andstudentswereaskedtoreporttheiroverallfeelingofsafetyoncampusbasedonhowfrequentlytheyhavefeltconcernedfortheirphysicalsafetyinthepast12months.Asafollow-up,individualswereaskediftheyhaveavoidedanyareasaroundcampusortheirworkplaceduetofearfortheirphysicalsafety.
Table16:StudentConcernforPhysicalSafetyatEvergreenStudentTotal Gender Orientation Race/Ethnicity Disabled
Man Woman Trans Hetero LGBQA+ White PeopleofColor Yes No% % % % % % % % % %
Never 46.8 66.4 44.4 27.8 58.9 37.6 48.9 42.9 34.7 51.3Sometimes 47.2 30.6 50.1 61.1 37.9 54.9 47.3 47.1 56.0 43.9Often 6.0 3.0 5.5 11.1 3.3 7.5 3.8 10.0 9.3 4.8
Table17:FacultyConcernforPhysicalSafetyatEvergreenFacultyTotal Gender Orientation Race/Ethnicity Disabled
Man Woman Trans Hetero LGBQA+ White PeopleofColor Yes No% % % % % % % % % %
Never 47.0 76.2 28.1 - 51.9 32.4 49.4 42.1 31.2 49.5Sometimes 47.9 23.8 65.6 - 44.2 58.8 46.8 50.0 68.8 45.3Often 5.1 - - - - - - 5.3
Table18:StaffConcernforPhysicalSafetyatEvergreenStaffTotal Gender Orientation Race/Ethnicity Disabled
Man Woman Trans Hetero LGBQA+ White PeopleofColor Yes No% % % % % % % % % %
Never 39.6 55.2 31.7 35.7 45.7 28.4 42.9 31.6 25.4 43.8Sometimes 53.6 42.5 60.2 50.0 48.6 63.0 52.9 55.3 66.1 49.8Often 6.8 - 8.1 - 5.7 8.6 4.2 13.2 8.5 6.4
13
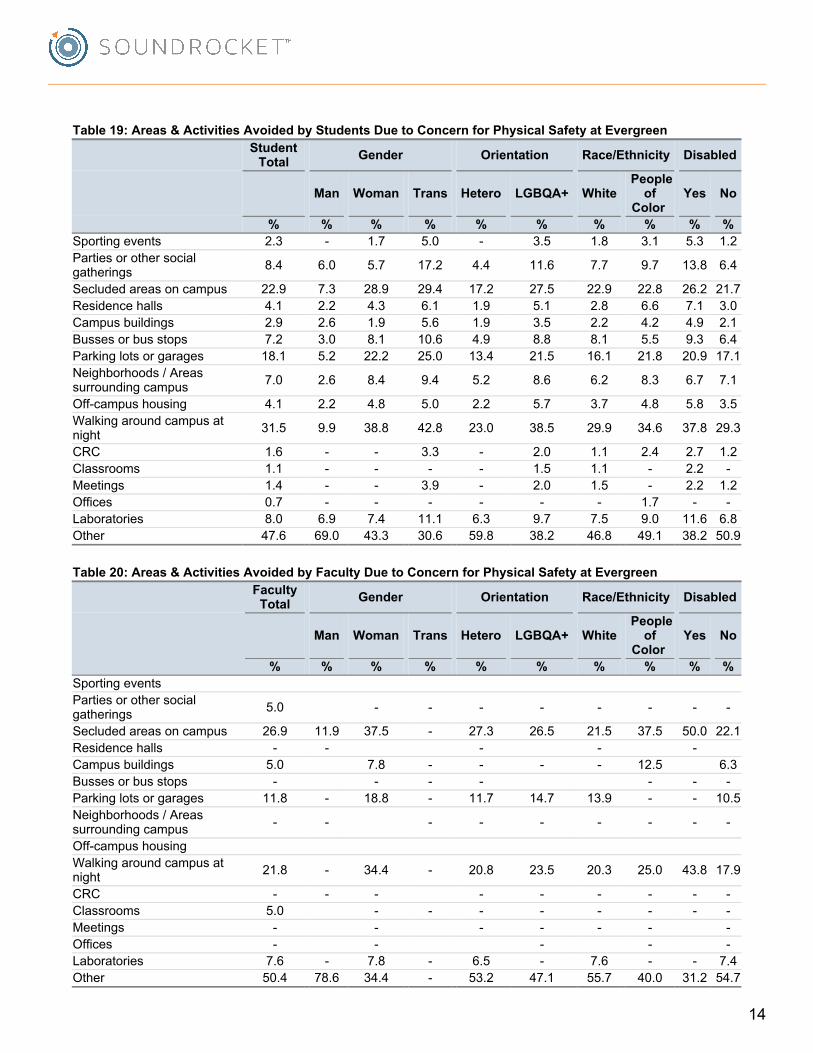
Table19:Areas&ActivitiesAvoidedbyStudentsDuetoConcernforPhysicalSafetyatEvergreenStudentTotal Gender Orientation Race/Ethnicity Disabled
Man Woman Trans Hetero LGBQA+ White People
ofColor
Yes No
% % % % % % % % % %Sportingevents 2.3 - 1.7 5.0 - 3.5 1.8 3.1 5.3 1.2Partiesorothersocialgatherings 8.4 6.0 5.7 17.2 4.4 11.6 7.7 9.7 13.8 6.4
Secludedareasoncampus 22.9 7.3 28.9 29.4 17.2 27.5 22.9 22.8 26.2 21.7Residencehalls 4.1 2.2 4.3 6.1 1.9 5.1 2.8 6.6 7.1 3.0Campusbuildings 2.9 2.6 1.9 5.6 1.9 3.5 2.2 4.2 4.9 2.1Bussesorbusstops 7.2 3.0 8.1 10.6 4.9 8.8 8.1 5.5 9.3 6.4Parkinglotsorgarages 18.1 5.2 22.2 25.0 13.4 21.5 16.1 21.8 20.9 17.1Neighborhoods/Areassurroundingcampus 7.0 2.6 8.4 9.4 5.2 8.6 6.2 8.3 6.7 7.1
Off-campushousing 4.1 2.2 4.8 5.0 2.2 5.7 3.7 4.8 5.8 3.5Walkingaroundcampusatnight 31.5 9.9 38.8 42.8 23.0 38.5 29.9 34.6 37.8 29.3
CRC 1.6 - - 3.3 - 2.0 1.1 2.4 2.7 1.2Classrooms 1.1 - - - - 1.5 1.1 - 2.2 -Meetings 1.4 - - 3.9 - 2.0 1.5 - 2.2 1.2Offices 0.7 - - - - - - 1.7 - -Laboratories 8.0 6.9 7.4 11.1 6.3 9.7 7.5 9.0 11.6 6.8Other 47.6 69.0 43.3 30.6 59.8 38.2 46.8 49.1 38.2 50.9
Table20:Areas&ActivitiesAvoidedbyFacultyDuetoConcernforPhysicalSafetyatEvergreenFacultyTotal Gender Orientation Race/Ethnicity Disabled
Man Woman Trans Hetero LGBQA+ White People
ofColor
Yes No
% % % % % % % % % %Sportingevents Partiesorothersocialgatherings 5.0 - - - - - - - -
Secludedareasoncampus 26.9 11.9 37.5 - 27.3 26.5 21.5 37.5 50.0 22.1Residencehalls - - - - - Campusbuildings 5.0 7.8 - - - - 12.5 6.3Bussesorbusstops - - - - - - -Parkinglotsorgarages 11.8 - 18.8 - 11.7 14.7 13.9 - - 10.5Neighborhoods/Areassurroundingcampus - - - - - - - - -
Off-campushousing Walkingaroundcampusatnight 21.8 - 34.4 - 20.8 23.5 20.3 25.0 43.8 17.9
CRC - - - - - - - - -Classrooms 5.0 - - - - - - - -Meetings - - - - - - -Offices - - - - -Laboratories 7.6 - 7.8 - 6.5 - 7.6 - - 7.4Other 50.4 78.6 34.4 - 53.2 47.1 55.7 40.0 31.2 54.7
14
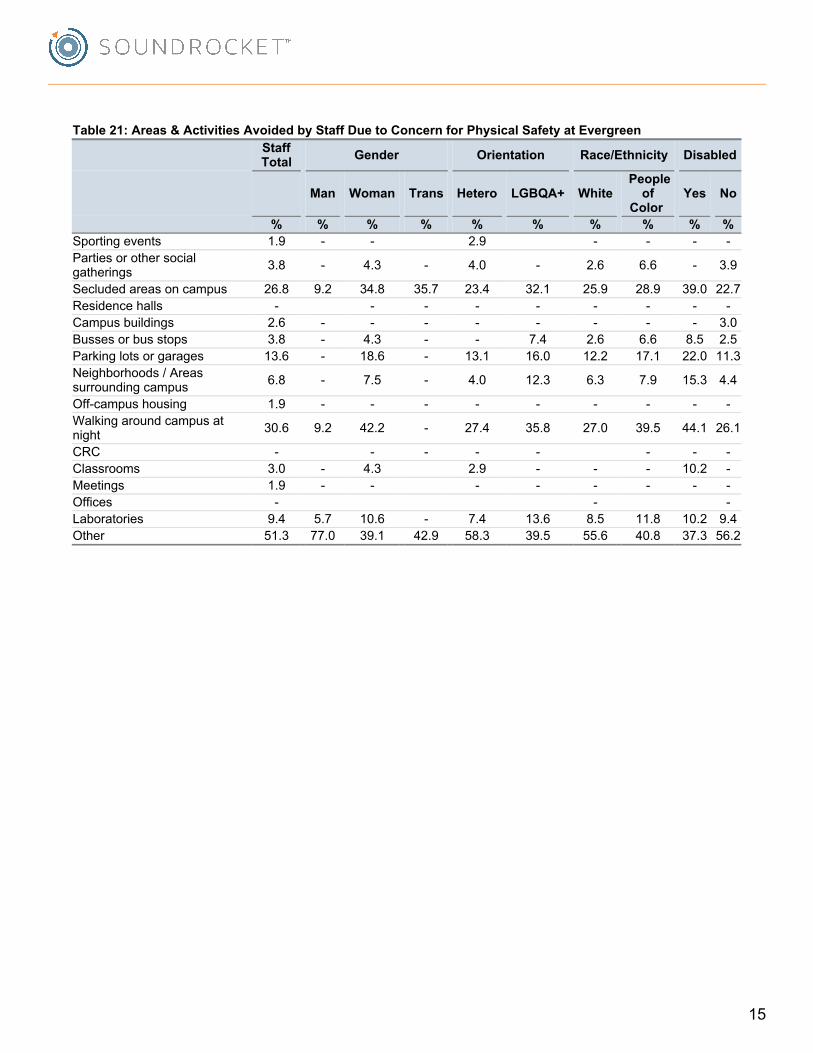
Table21:Areas&ActivitiesAvoidedbyStaffDuetoConcernforPhysicalSafetyatEvergreenStaffTotal Gender Orientation Race/Ethnicity Disabled
Man Woman Trans Hetero LGBQA+ White People
ofColor
Yes No
% % % % % % % % % %Sportingevents 1.9 - - 2.9 - - - -Partiesorothersocialgatherings 3.8 - 4.3 - 4.0 - 2.6 6.6 - 3.9
Secludedareasoncampus 26.8 9.2 34.8 35.7 23.4 32.1 25.9 28.9 39.0 22.7Residencehalls - - - - - - - - -Campusbuildings 2.6 - - - - - - - - 3.0Bussesorbusstops 3.8 - 4.3 - - 7.4 2.6 6.6 8.5 2.5Parkinglotsorgarages 13.6 - 18.6 - 13.1 16.0 12.2 17.1 22.0 11.3Neighborhoods/Areassurroundingcampus 6.8 - 7.5 - 4.0 12.3 6.3 7.9 15.3 4.4
Off-campushousing 1.9 - - - - - - - - -Walkingaroundcampusatnight 30.6 9.2 42.2 - 27.4 35.8 27.0 39.5 44.1 26.1
CRC - - - - - - - -Classrooms 3.0 - 4.3 2.9 - - - 10.2 -Meetings 1.9 - - - - - - - -Offices - - -Laboratories 9.4 5.7 10.6 - 7.4 13.6 8.5 11.8 10.2 9.4Other 51.3 77.0 39.1 42.9 58.3 39.5 55.6 40.8 37.3 56.2
15
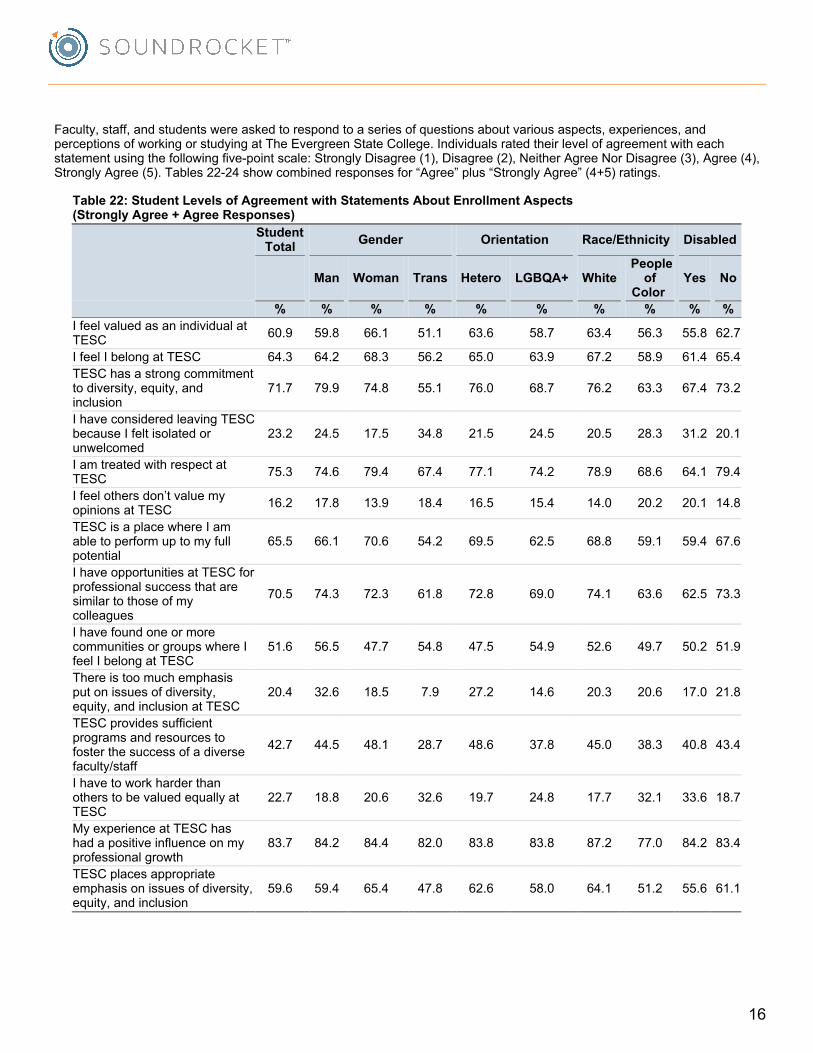
Faculty,staff,andstudentswereaskedtorespondtoaseriesofquestionsaboutvariousaspects,experiences,andperceptionsofworkingorstudyingatTheEvergreenStateCollege.Individualsratedtheirlevelofagreementwitheachstatementusingthefollowingfive-pointscale:StronglyDisagree(1),Disagree(2),NeitherAgreeNorDisagree(3),Agree(4),StronglyAgree(5).Tables22-24showcombinedresponsesfor“Agree”plus“StronglyAgree”(4+5)ratings.
Table22:StudentLevelsofAgreementwithStatementsAboutEnrollmentAspects(StronglyAgree+AgreeResponses)
StudentTotal Gender Orientation Race/Ethnicity Disabled
Man Woman Trans Hetero LGBQA+ White People
ofColor
Yes No
% % % % % % % % % %IfeelvaluedasanindividualatTESC 60.9 59.8 66.1 51.1 63.6 58.7 63.4 56.3 55.8 62.7
IfeelIbelongatTESC 64.3 64.2 68.3 56.2 65.0 63.9 67.2 58.9 61.4 65.4TESChasastrongcommitmenttodiversity,equity,andinclusion
71.7 79.9 74.8 55.1 76.0 68.7 76.2 63.3 67.4 73.2
IhaveconsideredleavingTESCbecauseIfeltisolatedorunwelcomed
23.2 24.5 17.5 34.8 21.5 24.5 20.5 28.3 31.2 20.1
IamtreatedwithrespectatTESC 75.3 74.6 79.4 67.4 77.1 74.2 78.9 68.6 64.1 79.4
Ifeelothersdon’tvaluemyopinionsatTESC 16.2 17.8 13.9 18.4 16.5 15.4 14.0 20.2 20.1 14.8
TESCisaplacewhereIamabletoperformuptomyfullpotential
65.5 66.1 70.6 54.2 69.5 62.5 68.8 59.1 59.4 67.6
IhaveopportunitiesatTESCforprofessionalsuccessthataresimilartothoseofmycolleagues
70.5 74.3 72.3 61.8 72.8 69.0 74.1 63.6 62.5 73.3
IhavefoundoneormorecommunitiesorgroupswhereIfeelIbelongatTESC
51.6 56.5 47.7 54.8 47.5 54.9 52.6 49.7 50.2 51.9
Thereistoomuchemphasisputonissuesofdiversity,equity,andinclusionatTESC
20.4 32.6 18.5 7.9 27.2 14.6 20.3 20.6 17.0 21.8
TESCprovidessufficientprogramsandresourcestofosterthesuccessofadiversefaculty/staff
42.7 44.5 48.1 28.7 48.6 37.8 45.0 38.3 40.8 43.4
IhavetoworkharderthanotherstobevaluedequallyatTESC
22.7 18.8 20.6 32.6 19.7 24.8 17.7 32.1 33.6 18.7
MyexperienceatTESChashadapositiveinfluenceonmyprofessionalgrowth
83.7 84.2 84.4 82.0 83.8 83.8 87.2 77.0 84.2 83.4
TESCplacesappropriateemphasisonissuesofdiversity,equity,andinclusion
59.6 59.4 65.4 47.8 62.6 58.0 64.1 51.2 55.6 61.1
16
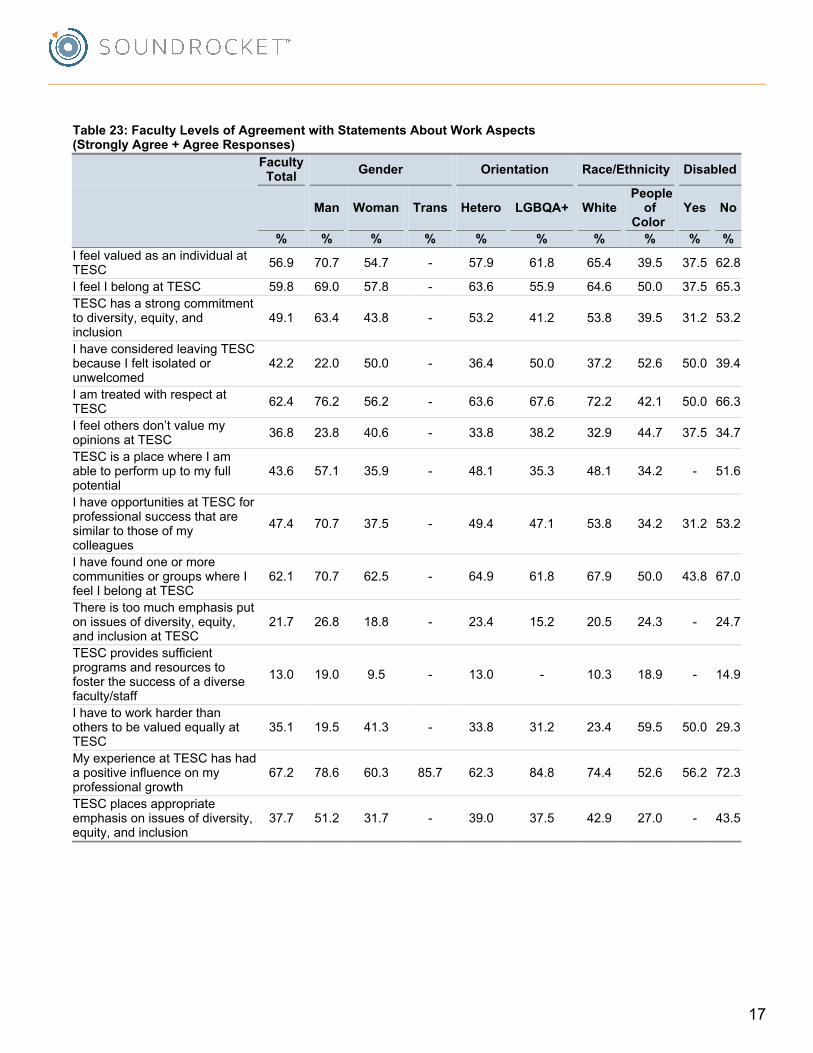
Table23:FacultyLevelsofAgreementwithStatementsAboutWorkAspects(StronglyAgree+AgreeResponses)
FacultyTotal Gender Orientation Race/Ethnicity Disabled
Man Woman Trans Hetero LGBQA+ White People
ofColor
Yes No
% % % % % % % % % %IfeelvaluedasanindividualatTESC 56.9 70.7 54.7 - 57.9 61.8 65.4 39.5 37.5 62.8
IfeelIbelongatTESC 59.8 69.0 57.8 - 63.6 55.9 64.6 50.0 37.5 65.3TESChasastrongcommitmenttodiversity,equity,andinclusion
49.1 63.4 43.8 - 53.2 41.2 53.8 39.5 31.2 53.2
IhaveconsideredleavingTESCbecauseIfeltisolatedorunwelcomed
42.2 22.0 50.0 - 36.4 50.0 37.2 52.6 50.0 39.4
IamtreatedwithrespectatTESC 62.4 76.2 56.2 - 63.6 67.6 72.2 42.1 50.0 66.3
Ifeelothersdon’tvaluemyopinionsatTESC 36.8 23.8 40.6 - 33.8 38.2 32.9 44.7 37.5 34.7
TESCisaplacewhereIamabletoperformuptomyfullpotential
43.6 57.1 35.9 - 48.1 35.3 48.1 34.2 - 51.6
IhaveopportunitiesatTESCforprofessionalsuccessthataresimilartothoseofmycolleagues
47.4 70.7 37.5 - 49.4 47.1 53.8 34.2 31.2 53.2
IhavefoundoneormorecommunitiesorgroupswhereIfeelIbelongatTESC
62.1 70.7 62.5 - 64.9 61.8 67.9 50.0 43.8 67.0
Thereistoomuchemphasisputonissuesofdiversity,equity,andinclusionatTESC
21.7 26.8 18.8 - 23.4 15.2 20.5 24.3 - 24.7
TESCprovidessufficientprogramsandresourcestofosterthesuccessofadiversefaculty/staff
13.0 19.0 9.5 - 13.0 - 10.3 18.9 - 14.9
IhavetoworkharderthanotherstobevaluedequallyatTESC
35.1 19.5 41.3 - 33.8 31.2 23.4 59.5 50.0 29.3
MyexperienceatTESChashadapositiveinfluenceonmyprofessionalgrowth
67.2 78.6 60.3 85.7 62.3 84.8 74.4 52.6 56.2 72.3
TESCplacesappropriateemphasisonissuesofdiversity,equity,andinclusion
37.7 51.2 31.7 - 39.0 37.5 42.9 27.0 - 43.5
17
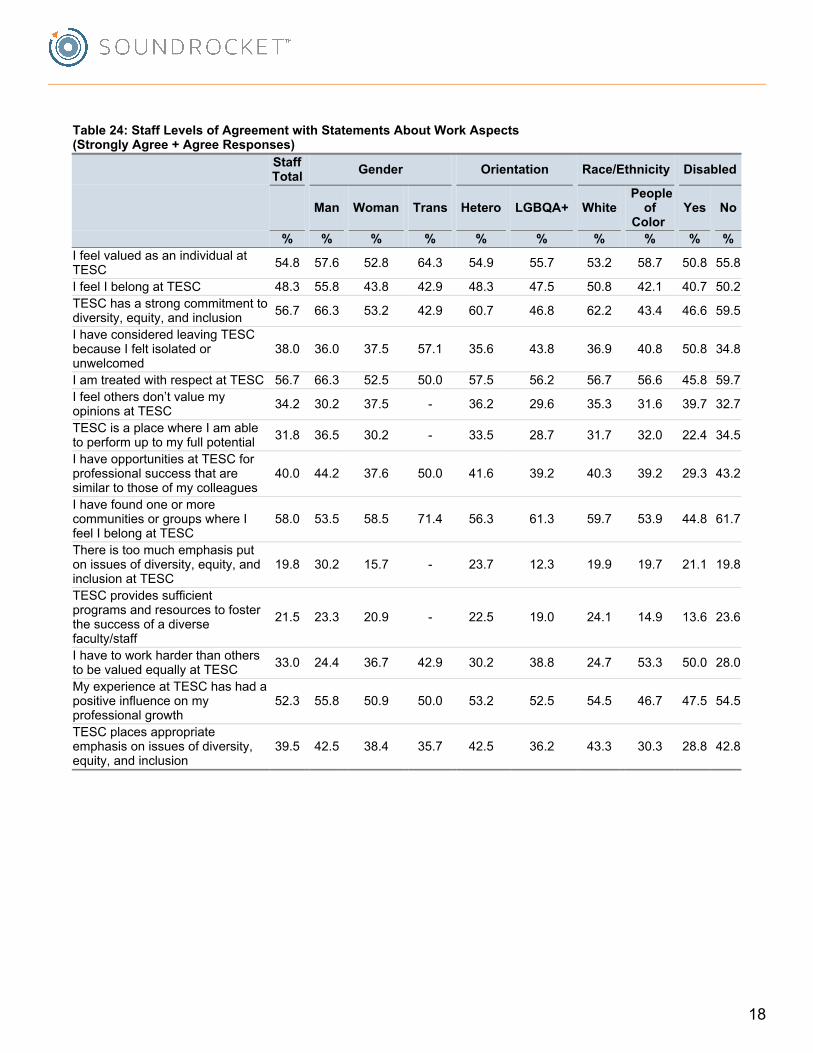
Table24:StaffLevelsofAgreementwithStatementsAboutWorkAspects(StronglyAgree+AgreeResponses)
StaffTotal Gender Orientation Race/Ethnicity Disabled
Man Woman Trans Hetero LGBQA+ White People
ofColor
Yes No
% % % % % % % % % %IfeelvaluedasanindividualatTESC 54.8 57.6 52.8 64.3 54.9 55.7 53.2 58.7 50.8 55.8
IfeelIbelongatTESC 48.3 55.8 43.8 42.9 48.3 47.5 50.8 42.1 40.7 50.2TESChasastrongcommitmenttodiversity,equity,andinclusion 56.7 66.3 53.2 42.9 60.7 46.8 62.2 43.4 46.6 59.5
IhaveconsideredleavingTESCbecauseIfeltisolatedorunwelcomed
38.0 36.0 37.5 57.1 35.6 43.8 36.9 40.8 50.8 34.8
IamtreatedwithrespectatTESC 56.7 66.3 52.5 50.0 57.5 56.2 56.7 56.6 45.8 59.7Ifeelothersdon’tvaluemyopinionsatTESC 34.2 30.2 37.5 - 36.2 29.6 35.3 31.6 39.7 32.7
TESCisaplacewhereIamabletoperformuptomyfullpotential 31.8 36.5 30.2 - 33.5 28.7 31.7 32.0 22.4 34.5
IhaveopportunitiesatTESCforprofessionalsuccessthataresimilartothoseofmycolleagues
40.0 44.2 37.6 50.0 41.6 39.2 40.3 39.2 29.3 43.2
IhavefoundoneormorecommunitiesorgroupswhereIfeelIbelongatTESC
58.0 53.5 58.5 71.4 56.3 61.3 59.7 53.9 44.8 61.7
Thereistoomuchemphasisputonissuesofdiversity,equity,andinclusionatTESC
19.8 30.2 15.7 - 23.7 12.3 19.9 19.7 21.1 19.8
TESCprovidessufficientprogramsandresourcestofosterthesuccessofadiversefaculty/staff
21.5 23.3 20.9 - 22.5 19.0 24.1 14.9 13.6 23.6
IhavetoworkharderthanotherstobevaluedequallyatTESC 33.0 24.4 36.7 42.9 30.2 38.8 24.7 53.3 50.0 28.0
MyexperienceatTESChashadapositiveinfluenceonmyprofessionalgrowth
52.3 55.8 50.9 50.0 53.2 52.5 54.5 46.7 47.5 54.5
TESCplacesappropriateemphasisonissuesofdiversity,equity,andinclusion
39.5 42.5 38.4 35.7 42.5 36.2 43.3 30.3 28.8 42.8
18
Meaningfulinteraction(s)withpeople…
Meaningfulinteraction(s)withpeople…
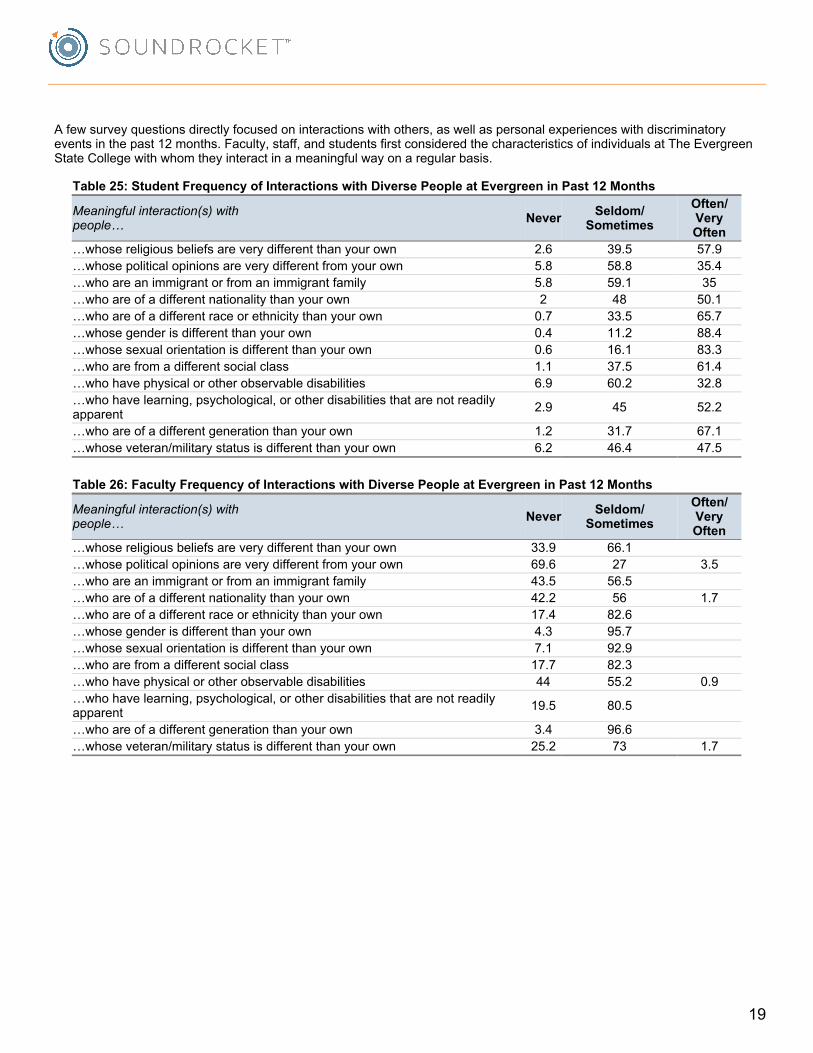
Afewsurveyquestionsdirectlyfocusedoninteractionswithothers,aswellaspersonalexperienceswithdiscriminatoryeventsinthepast12months.Faculty,staff,andstudentsfirstconsideredthecharacteristicsofindividualsatTheEvergreenStateCollegewithwhomtheyinteractinameaningfulwayonaregularbasis.
Table25:StudentFrequencyofInteractionswithDiversePeopleatEvergreeninPast12Months
Never Seldom/Sometimes
Often/VeryOften
…whosereligiousbeliefsareverydifferentthanyourown 2.6 39.5 57.9…whosepoliticalopinionsareverydifferentfromyourown 5.8 58.8 35.4…whoareanimmigrantorfromanimmigrantfamily 5.8 59.1 35…whoareofadifferentnationalitythanyourown 2 48 50.1…whoareofadifferentraceorethnicitythanyourown 0.7 33.5 65.7…whosegenderisdifferentthanyourown 0.4 11.2 88.4…whosesexualorientationisdifferentthanyourown 0.6 16.1 83.3…whoarefromadifferentsocialclass 1.1 37.5 61.4…whohavephysicalorotherobservabledisabilities 6.9 60.2 32.8…whohavelearning,psychological,orotherdisabilitiesthatarenotreadilyapparent 2.9 45 52.2
…whoareofadifferentgenerationthanyourown 1.2 31.7 67.1…whoseveteran/militarystatusisdifferentthanyourown 6.2 46.4 47.5
Table26:FacultyFrequencyofInteractionswithDiversePeopleatEvergreeninPast12Months
Never Seldom/Sometimes
Often/VeryOften
…whosereligiousbeliefsareverydifferentthanyourown 33.9 66.1…whosepoliticalopinionsareverydifferentfromyourown 69.6 27 3.5…whoareanimmigrantorfromanimmigrantfamily 43.5 56.5…whoareofadifferentnationalitythanyourown 42.2 56 1.7…whoareofadifferentraceorethnicitythanyourown 17.4 82.6…whosegenderisdifferentthanyourown 4.3 95.7…whosesexualorientationisdifferentthanyourown 7.1 92.9…whoarefromadifferentsocialclass 17.7 82.3…whohavephysicalorotherobservabledisabilities 44 55.2 0.9…whohavelearning,psychological,orotherdisabilitiesthatarenotreadilyapparent 19.5 80.5
…whoareofadifferentgenerationthanyourown 3.4 96.6…whoseveteran/militarystatusisdifferentthanyourown 25.2 73 1.7
19
Meaningfulinteraction(s)withpeople…
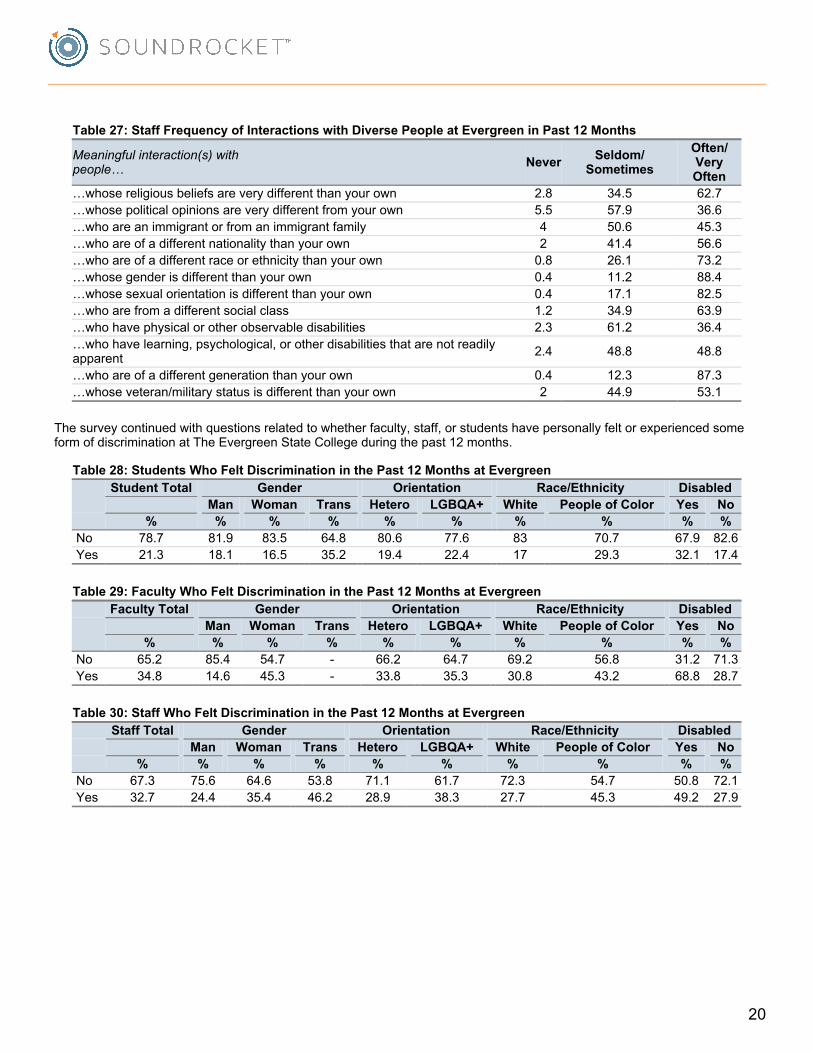
Table27:StaffFrequencyofInteractionswithDiversePeopleatEvergreeninPast12Months
Never Seldom/Sometimes
Often/VeryOften
…whosereligiousbeliefsareverydifferentthanyourown 2.8 34.5 62.7…whosepoliticalopinionsareverydifferentfromyourown 5.5 57.9 36.6…whoareanimmigrantorfromanimmigrantfamily 4 50.6 45.3…whoareofadifferentnationalitythanyourown 2 41.4 56.6…whoareofadifferentraceorethnicitythanyourown 0.8 26.1 73.2…whosegenderisdifferentthanyourown 0.4 11.2 88.4…whosesexualorientationisdifferentthanyourown 0.4 17.1 82.5…whoarefromadifferentsocialclass 1.2 34.9 63.9…whohavephysicalorotherobservabledisabilities 2.3 61.2 36.4…whohavelearning,psychological,orotherdisabilitiesthatarenotreadilyapparent 2.4 48.8 48.8
…whoareofadifferentgenerationthanyourown 0.4 12.3 87.3…whoseveteran/militarystatusisdifferentthanyourown 2 44.9 53.1
Thesurveycontinuedwithquestionsrelatedtowhetherfaculty,staff,orstudentshavepersonallyfeltorexperiencedsomeformofdiscriminationatTheEvergreenStateCollegeduringthepast12months.
Table28:StudentsWhoFeltDiscriminationinthePast12MonthsatEvergreenStudentTotal Gender Orientation Race/Ethnicity Disabled
Man Woman Trans Hetero LGBQA+ White PeopleofColor Yes No% % % % % % % % % %
No 78.7 81.9 83.5 64.8 80.6 77.6 83 70.7 67.9 82.6Yes 21.3 18.1 16.5 35.2 19.4 22.4 17 29.3 32.1 17.4
Table29:FacultyWhoFeltDiscriminationinthePast12MonthsatEvergreenFacultyTotal Gender Orientation Race/Ethnicity Disabled
Man Woman Trans Hetero LGBQA+ White PeopleofColor Yes No% % % % % % % % % %
No 65.2 85.4 54.7 - 66.2 64.7 69.2 56.8 31.2 71.3Yes 34.8 14.6 45.3 - 33.8 35.3 30.8 43.2 68.8 28.7
Table30:StaffWhoFeltDiscriminationinthePast12MonthsatEvergreenStaffTotal Gender Orientation Race/Ethnicity Disabled
Man Woman Trans Hetero LGBQA+ White PeopleofColor Yes No% % % % % % % % % %
No 67.3 75.6 64.6 53.8 71.1 61.7 72.3 54.7 50.8 72.1Yes 32.7 24.4 35.4 46.2 28.9 38.3 27.7 45.3 49.2 27.9
20
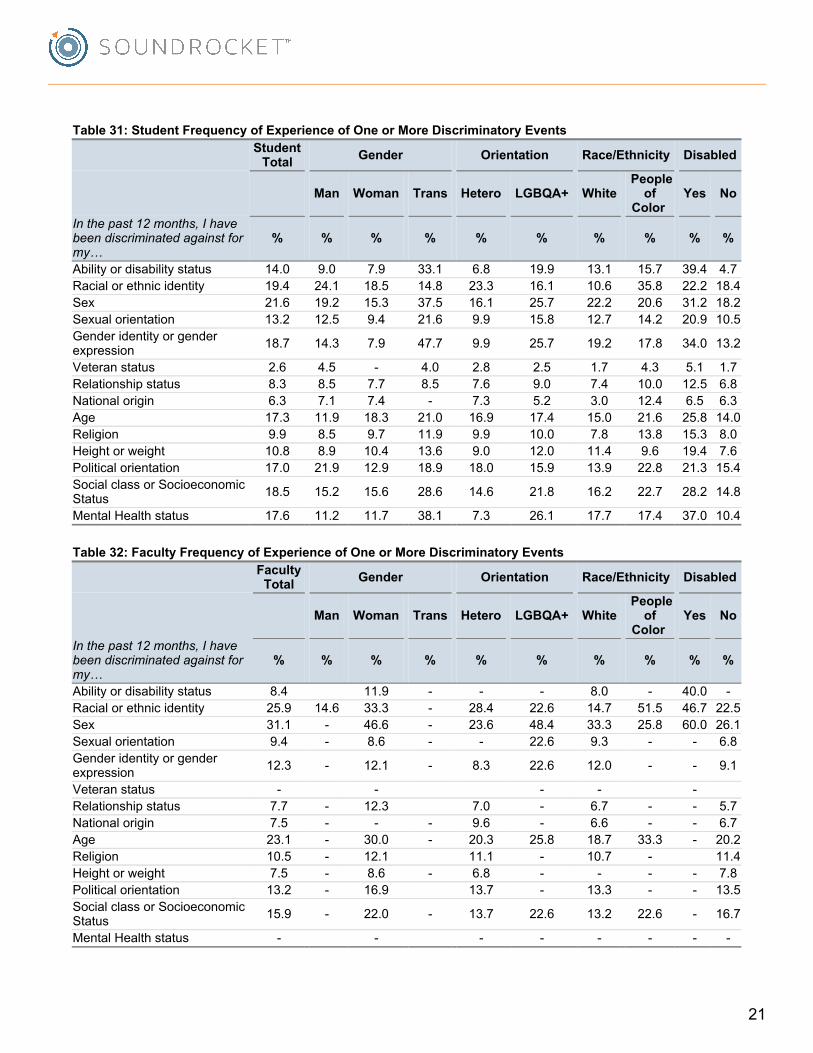
Inthepast12months,Ihavebeendiscriminatedagainstformy…
Inthepast12months,Ihavebeendiscriminatedagainstformy…
Table31:StudentFrequencyofExperienceofOneorMoreDiscriminatoryEventsStudentTotal Gender Orientation Race/Ethnicity Disabled
Man Woman Trans Hetero LGBQA+ White People
ofColor
Yes No
% % % % % % % % % %
Abilityordisabilitystatus 14.0 9.0 7.9 33.1 6.8 19.9 13.1 15.7 39.4 4.7Racialorethnicidentity 19.4 24.1 18.5 14.8 23.3 16.1 10.6 35.8 22.2 18.4Sex 21.6 19.2 15.3 37.5 16.1 25.7 22.2 20.6 31.2 18.2Sexualorientation 13.2 12.5 9.4 21.6 9.9 15.8 12.7 14.2 20.9 10.5Genderidentityorgenderexpression 18.7 14.3 7.9 47.7 9.9 25.7 19.2 17.8 34.0 13.2
Veteranstatus 2.6 4.5 - 4.0 2.8 2.5 1.7 4.3 5.1 1.7Relationshipstatus 8.3 8.5 7.7 8.5 7.6 9.0 7.4 10.0 12.5 6.8Nationalorigin 6.3 7.1 7.4 - 7.3 5.2 3.0 12.4 6.5 6.3Age 17.3 11.9 18.3 21.0 16.9 17.4 15.0 21.6 25.8 14.0Religion 9.9 8.5 9.7 11.9 9.9 10.0 7.8 13.8 15.3 8.0Heightorweight 10.8 8.9 10.4 13.6 9.0 12.0 11.4 9.6 19.4 7.6Politicalorientation 17.0 21.9 12.9 18.9 18.0 15.9 13.9 22.8 21.3 15.4SocialclassorSocioeconomicStatus 18.5 15.2 15.6 28.6 14.6 21.8 16.2 22.7 28.2 14.8
MentalHealthstatus 17.6 11.2 11.7 38.1 7.3 26.1 17.7 17.4 37.0 10.4
Table32:FacultyFrequencyofExperienceofOneorMoreDiscriminatoryEventsFacultyTotal Gender Orientation Race/Ethnicity Disabled
Man Woman Trans Hetero LGBQA+ White People
ofColor
Yes No
% % % % % % % % % %
Abilityordisabilitystatus 8.4 11.9 - - - 8.0 - 40.0 -Racialorethnicidentity 25.9 14.6 33.3 - 28.4 22.6 14.7 51.5 46.7 22.5Sex 31.1 - 46.6 - 23.6 48.4 33.3 25.8 60.0 26.1Sexualorientation 9.4 - 8.6 - - 22.6 9.3 - - 6.8Genderidentityorgenderexpression 12.3 - 12.1 - 8.3 22.6 12.0 - - 9.1
Veteranstatus - - - - - Relationshipstatus 7.7 - 12.3 7.0 - 6.7 - - 5.7Nationalorigin 7.5 - - - 9.6 - 6.6 - - 6.7Age 23.1 - 30.0 - 20.3 25.8 18.7 33.3 - 20.2Religion 10.5 - 12.1 11.1 - 10.7 - 11.4Heightorweight 7.5 - 8.6 - 6.8 - - - - 7.8Politicalorientation 13.2 - 16.9 13.7 - 13.3 - - 13.5SocialclassorSocioeconomicStatus 15.9 - 22.0 - 13.7 22.6 13.2 22.6 - 16.7
MentalHealthstatus - - - - - - - -
21
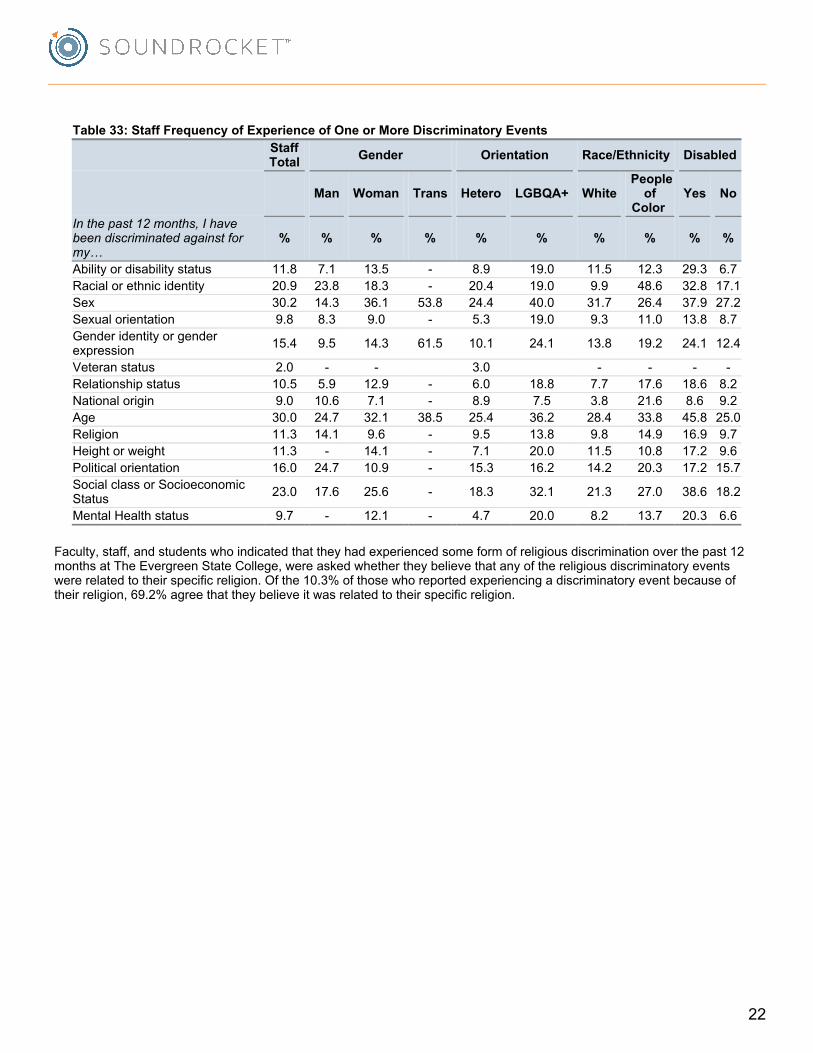
Inthepast12months,Ihavebeendiscriminatedagainstformy…
Table33:StaffFrequencyofExperienceofOneorMoreDiscriminatoryEventsStaffTotal Gender Orientation Race/Ethnicity Disabled
Man Woman Trans Hetero LGBQA+ White People
ofColor
Yes No
% % % % % % % % % %
Abilityordisabilitystatus 11.8 7.1 13.5 - 8.9 19.0 11.5 12.3 29.3 6.7Racialorethnicidentity 20.9 23.8 18.3 - 20.4 19.0 9.9 48.6 32.8 17.1Sex 30.2 14.3 36.1 53.8 24.4 40.0 31.7 26.4 37.9 27.2Sexualorientation 9.8 8.3 9.0 - 5.3 19.0 9.3 11.0 13.8 8.7Genderidentityorgenderexpression 15.4 9.5 14.3 61.5 10.1 24.1 13.8 19.2 24.1 12.4
Veteranstatus 2.0 - - 3.0 - - - -Relationshipstatus 10.5 5.9 12.9 - 6.0 18.8 7.7 17.6 18.6 8.2Nationalorigin 9.0 10.6 7.1 - 8.9 7.5 3.8 21.6 8.6 9.2Age 30.0 24.7 32.1 38.5 25.4 36.2 28.4 33.8 45.8 25.0Religion 11.3 14.1 9.6 - 9.5 13.8 9.8 14.9 16.9 9.7Heightorweight 11.3 - 14.1 - 7.1 20.0 11.5 10.8 17.2 9.6Politicalorientation 16.0 24.7 10.9 - 15.3 16.2 14.2 20.3 17.2 15.7SocialclassorSocioeconomicStatus 23.0 17.6 25.6 - 18.3 32.1 21.3 27.0 38.6 18.2
MentalHealthstatus 9.7 - 12.1 - 4.7 20.0 8.2 13.7 20.3 6.6
Faculty,staff,andstudentswhoindicatedthattheyhadexperiencedsomeformofreligiousdiscriminationoverthepast12monthsatTheEvergreenStateCollege,wereaskedwhethertheybelievethatanyofthereligiousdiscriminatoryeventswererelatedtotheirspecificreligion.Ofthe10.3%ofthosewhoreportedexperiencingadiscriminatoryeventbecauseoftheirreligion,69.2%agreethattheybelieveitwasrelatedtotheirspecificreligion.
22
Howwouldyoudescribetheracial/ethniccompositionofthecommunitywhereyougrewup?
Inclassroomandclassroomsettings,Ifeellistenedtoby…
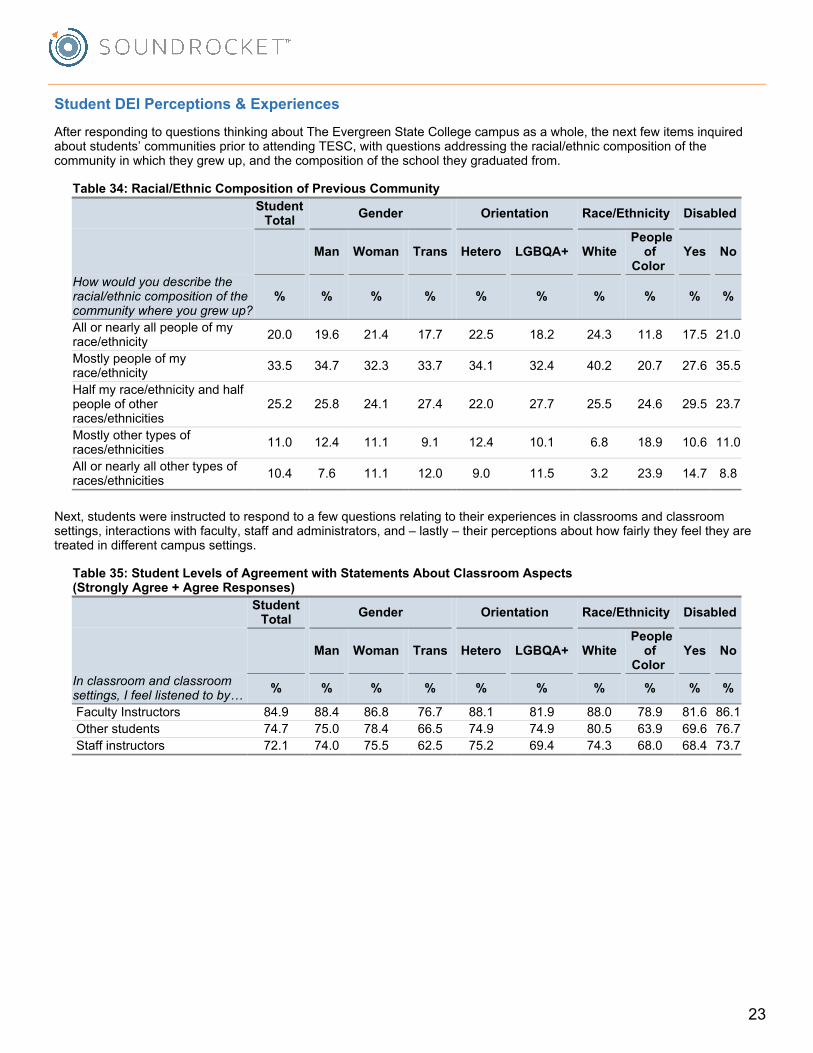
StudentDEIPerceptions&Experiences
AfterrespondingtoquestionsthinkingaboutTheEvergreenStateCollegecampusasawhole,thenextfewitemsinquiredaboutstudents’communitiespriortoattendingTESC,withquestionsaddressingtheracial/ethniccompositionofthecommunityinwhichtheygrewup,andthecompositionoftheschooltheygraduatedfrom.
Table34:Racial/EthnicCompositionofPreviousCommunityStudentTotal Gender Orientation Race/Ethnicity Disabled
Man Woman Trans Hetero LGBQA+ White People
ofColor
Yes No
% % % % % % % % % %
Allornearlyallpeopleofmyrace/ethnicity 20.0 19.6 21.4 17.7 22.5 18.2 24.3 11.8 17.5 21.0
Mostlypeopleofmyrace/ethnicity 33.5 34.7 32.3 33.7 34.1 32.4 40.2 20.7 27.6 35.5
Halfmyrace/ethnicityandhalfpeopleofotherraces/ethnicities
25.2 25.8 24.1 27.4 22.0 27.7 25.5 24.6 29.5 23.7
Mostlyothertypesofraces/ethnicities 11.0 12.4 11.1 9.1 12.4 10.1 6.8 18.9 10.6 11.0
Allornearlyallothertypesofraces/ethnicities 10.4 7.6 11.1 12.0 9.0 11.5 3.2 23.9 14.7 8.8
Next,studentswereinstructedtorespondtoafewquestionsrelatingtotheirexperiencesinclassroomsandclassroomsettings,interactionswithfaculty,staffandadministrators,and–lastly–theirperceptionsabouthowfairlytheyfeeltheyaretreatedindifferentcampussettings.
Table35:StudentLevelsofAgreementwithStatementsAboutClassroomAspects(StronglyAgree+AgreeResponses)
StudentTotal Gender Orientation Race/Ethnicity Disabled
Man Woman Trans Hetero LGBQA+ White People
ofColor
Yes No
% % % % % % % % % %
FacultyInstructors 84.9 88.4 86.8 76.7 88.1 81.9 88.0 78.9 81.6 86.1Otherstudents 74.7 75.0 78.4 66.5 74.9 74.9 80.5 63.9 69.6 76.7Staffinstructors 72.1 74.0 75.5 62.5 75.2 69.4 74.3 68.0 68.4 73.7
23
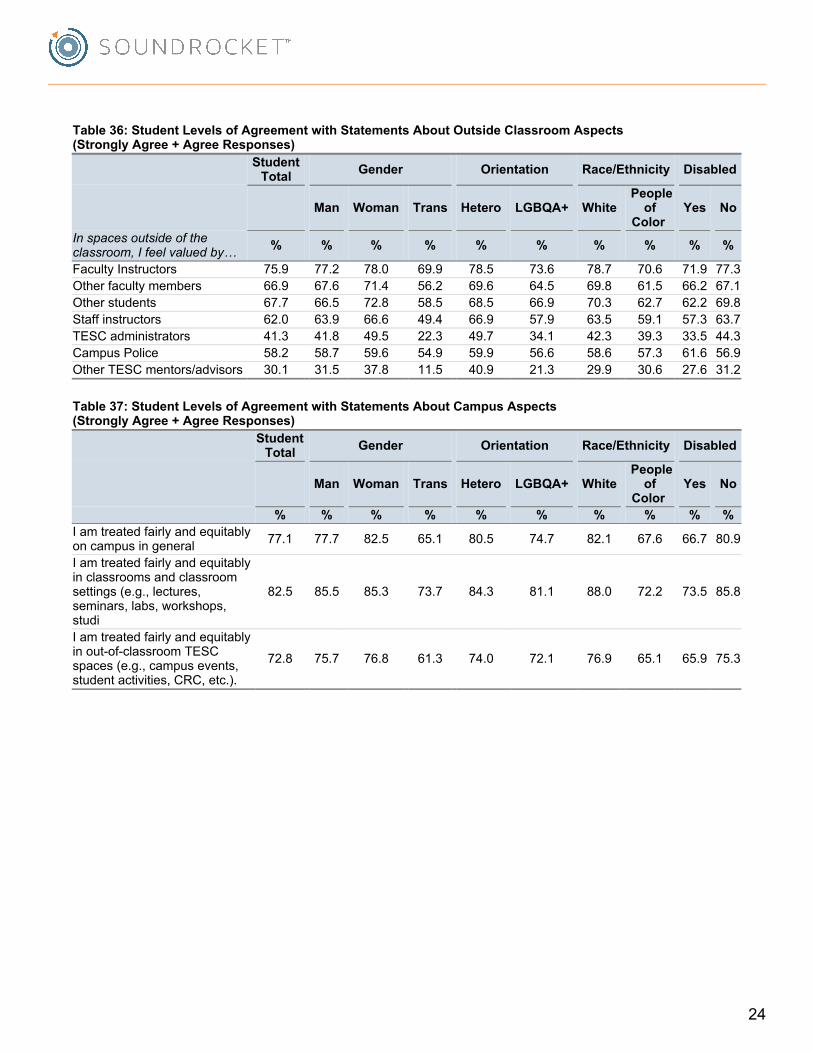
Inspacesoutsideoftheclassroom,Ifeelvaluedby…
Table36:StudentLevelsofAgreementwithStatementsAboutOutsideClassroomAspects(StronglyAgree+AgreeResponses)
StudentTotal Gender Orientation Race/Ethnicity Disabled
Man Woman Trans Hetero LGBQA+ White People
ofColor
Yes No
% % % % % % % % % %
FacultyInstructors 75.9 77.2 78.0 69.9 78.5 73.6 78.7 70.6 71.9 77.3Otherfacultymembers 66.9 67.6 71.4 56.2 69.6 64.5 69.8 61.5 66.2 67.1Otherstudents 67.7 66.5 72.8 58.5 68.5 66.9 70.3 62.7 62.2 69.8Staffinstructors 62.0 63.9 66.6 49.4 66.9 57.9 63.5 59.1 57.3 63.7TESCadministrators 41.3 41.8 49.5 22.3 49.7 34.1 42.3 39.3 33.5 44.3CampusPolice 58.2 58.7 59.6 54.9 59.9 56.6 58.6 57.3 61.6 56.9OtherTESCmentors/advisors 30.1 31.5 37.8 11.5 40.9 21.3 29.9 30.6 27.6 31.2
Table37:StudentLevelsofAgreementwithStatementsAboutCampusAspects(StronglyAgree+AgreeResponses)
StudentTotal Gender Orientation Race/Ethnicity Disabled
Man Woman Trans Hetero LGBQA+ White People
ofColor
Yes No
% % % % % % % % % %Iamtreatedfairlyandequitablyoncampusingeneral 77.1 77.7 82.5 65.1 80.5 74.7 82.1 67.6 66.7 80.9
Iamtreatedfairlyandequitablyinclassroomsandclassroomsettings(e.g.,lectures,seminars,labs,workshops,studi
82.5 85.5 85.3 73.7 84.3 81.1 88.0 72.2 73.5 85.8
Iamtreatedfairlyandequitablyinout-of-classroomTESCspaces(e.g.,campusevents,studentactivities,CRC,etc.).
72.8 75.7 76.8 61.3 74.0 72.1 76.9 65.1 65.9 75.3
24
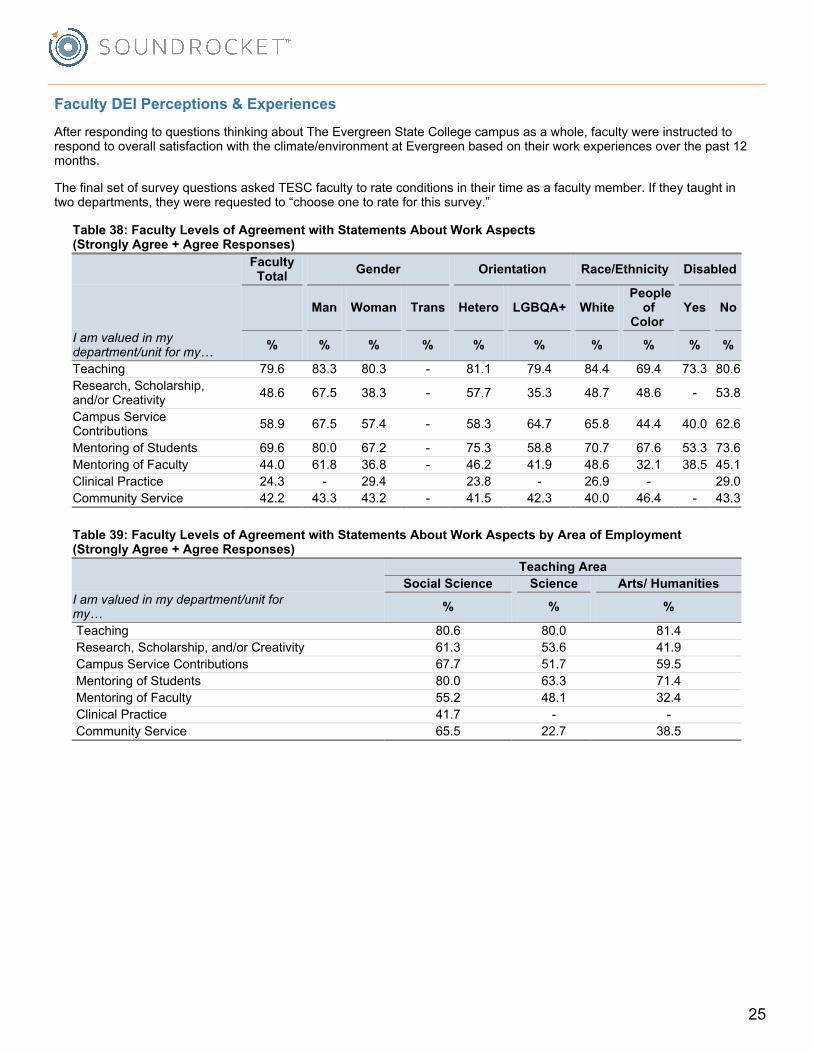
Iamvaluedinmydepartment/unitformy…
Iamvaluedinmydepartment/unitformy…
FacultyDEIPerceptions&Experiences
AfterrespondingtoquestionsthinkingaboutTheEvergreenStateCollegecampusasawhole,facultywereinstructedtorespondtooverallsatisfactionwiththeclimate/environmentatEvergreenbasedontheirworkexperiencesoverthepast12months.
ThefinalsetofsurveyquestionsaskedTESCfacultytorateconditionsintheirtimeasafacultymember.Iftheytaughtintwodepartments,theywererequestedto“chooseonetorateforthissurvey.”
Table38:FacultyLevelsofAgreementwithStatementsAboutWorkAspects(StronglyAgree+AgreeResponses)
FacultyTotal Gender Orientation Race/Ethnicity Disabled
Man Woman Trans Hetero LGBQA+ White People
ofColor
Yes No
% % % % % % % % % %
Teaching 79.6 83.3 80.3 - 81.1 79.4 84.4 69.4 73.3 80.6Research,Scholarship,and/orCreativity 48.6 67.5 38.3 - 57.7 35.3 48.7 48.6 - 53.8
CampusServiceContributions 58.9 67.5 57.4 - 58.3 64.7 65.8 44.4 40.0 62.6
MentoringofStudents 69.6 80.0 67.2 - 75.3 58.8 70.7 67.6 53.3 73.6MentoringofFaculty 44.0 61.8 36.8 - 46.2 41.9 48.6 32.1 38.5 45.1ClinicalPractice 24.3 - 29.4 23.8 - 26.9 - 29.0CommunityService 42.2 43.3 43.2 - 41.5 42.3 40.0 46.4 - 43.3
Table39:FacultyLevelsofAgreementwithStatementsAboutWorkAspectsbyAreaofEmployment(StronglyAgree+AgreeResponses)
TeachingAreaSocialScience Science Arts/Humanities
% % %
Teaching 80.6 80.0 81.4Research,Scholarship,and/orCreativity 61.3 53.6 41.9CampusServiceContributions 67.7 51.7 59.5MentoringofStudents 80.0 63.3 71.4MentoringofFaculty 55.2 48.1 32.4ClinicalPractice 41.7 - -CommunityService 65.5 22.7 38.5
25
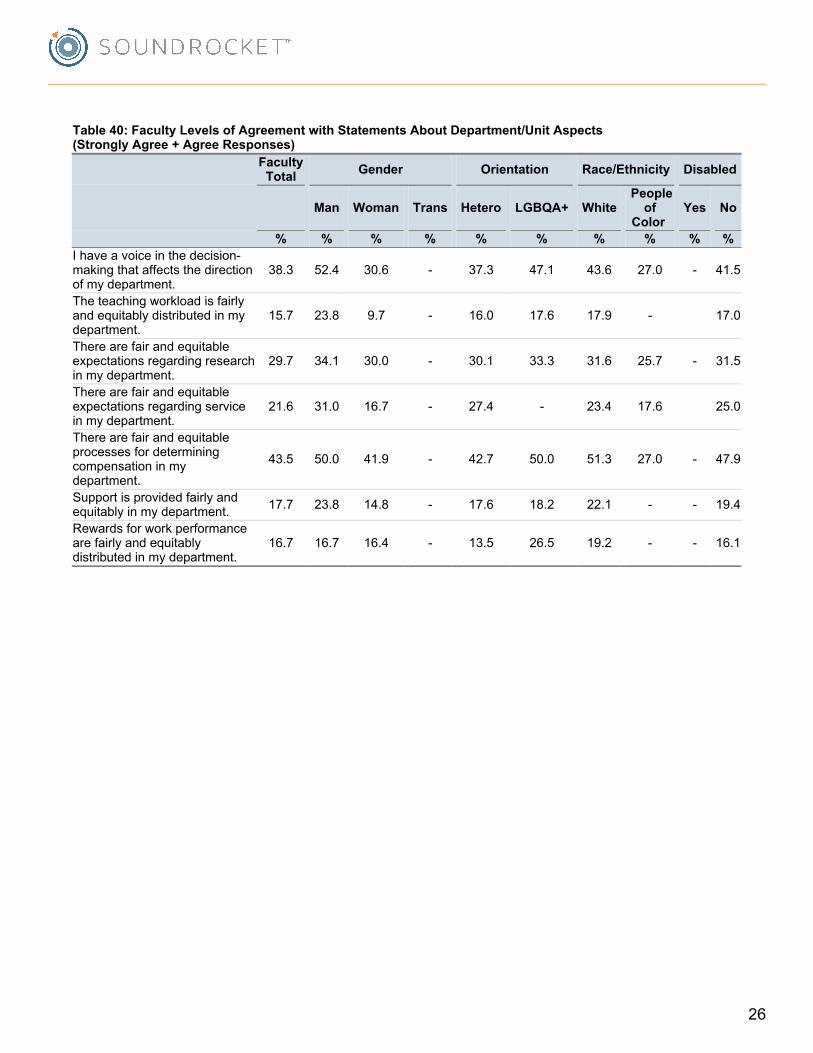
Table40:FacultyLevelsofAgreementwithStatementsAboutDepartment/UnitAspects(StronglyAgree+AgreeResponses)
FacultyTotal Gender Orientation Race/Ethnicity Disabled
Man Woman Trans Hetero LGBQA+ White People
ofColor
Yes No
% % % % % % % % % %Ihaveavoiceinthedecision-makingthataffectsthedirectionofmydepartment.
38.3 52.4 30.6 - 37.3 47.1 43.6 27.0 - 41.5
Theteachingworkloadisfairlyandequitablydistributedinmydepartment.
15.7 23.8 9.7 - 16.0 17.6 17.9 - 17.0
Therearefairandequitableexpectationsregardingresearchinmydepartment.
29.7 34.1 30.0 - 30.1 33.3 31.6 25.7 - 31.5
Therearefairandequitableexpectationsregardingserviceinmydepartment.
21.6 31.0 16.7 - 27.4 - 23.4 17.6 25.0
Therearefairandequitableprocessesfordeterminingcompensationinmydepartment.
43.5 50.0 41.9 - 42.7 50.0 51.3 27.0 - 47.9
Supportisprovidedfairlyandequitablyinmydepartment. 17.7 23.8 14.8 - 17.6 18.2 22.1 - - 19.4
Rewardsforworkperformancearefairlyandequitablydistributedinmydepartment.
16.7 16.7 16.4 - 13.5 26.5 19.2 - - 16.1
26
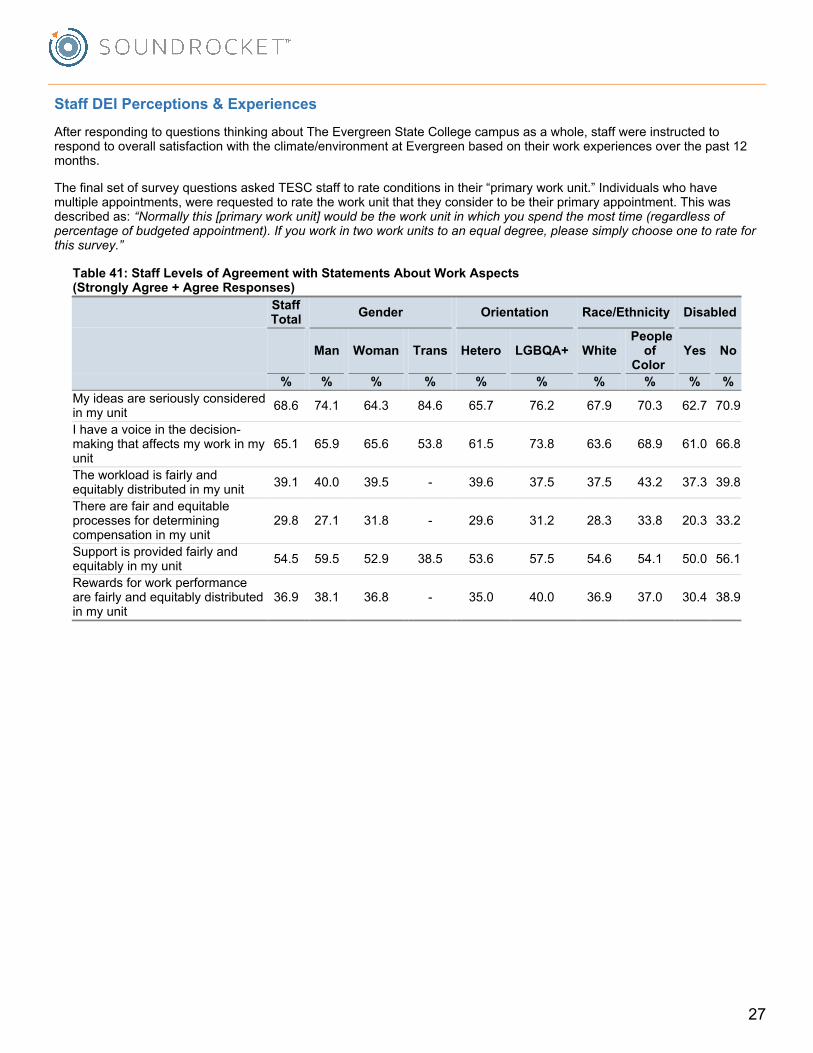
StaffDEIPerceptions&Experiences
AfterrespondingtoquestionsthinkingaboutTheEvergreenStateCollegecampusasawhole,staffwereinstructedtorespondtooverallsatisfactionwiththeclimate/environmentatEvergreenbasedontheirworkexperiencesoverthepast12months.
ThefinalsetofsurveyquestionsaskedTESCstafftorateconditionsintheir“primaryworkunit.”Individualswhohavemultipleappointments,wererequestedtoratetheworkunitthattheyconsidertobetheirprimaryappointment.Thiswasdescribedas:“Normallythis[primaryworkunit]wouldbetheworkunitinwhichyouspendthemosttime(regardlessofpercentageofbudgetedappointment).Ifyouworkintwoworkunitstoanequaldegree,pleasesimplychooseonetorateforthissurvey.”
Table41:StaffLevelsofAgreementwithStatementsAboutWorkAspects(StronglyAgree+AgreeResponses)
StaffTotal Gender Orientation Race/Ethnicity Disabled
Man Woman Trans Hetero LGBQA+ White People
ofColor
Yes No
% % % % % % % % % %Myideasareseriouslyconsideredinmyunit 68.6 74.1 64.3 84.6 65.7 76.2 67.9 70.3 62.7 70.9
Ihaveavoiceinthedecision-makingthataffectsmyworkinmyunit
65.1 65.9 65.6 53.8 61.5 73.8 63.6 68.9 61.0 66.8
Theworkloadisfairlyandequitablydistributedinmyunit 39.1 40.0 39.5 - 39.6 37.5 37.5 43.2 37.3 39.8
Therearefairandequitableprocessesfordeterminingcompensationinmyunit
29.8 27.1 31.8 - 29.6 31.2 28.3 33.8 20.3 33.2
Supportisprovidedfairlyandequitablyinmyunit 54.5 59.5 52.9 38.5 53.6 57.5 54.6 54.1 50.0 56.1
Rewardsforworkperformancearefairlyandequitablydistributedinmyunit
36.9 38.1 36.8 - 35.0 40.0 36.9 37.0 30.4 38.9
27
UseOfFindingsAndNextSteps
TheresultsofthissurveyunderscoretheimportanceofregularlycollectingdatatoappriseTheEvergreenStateCollegecampusleadershipandthebroadercommunityaboutfaculty,staff,andstudentexperiencessurroundingdiversity,equity,andinclusion.FurtheranalysesofsurveyresultswillbeconductedtoinformtheworkofTheEvergreenStateCollegeindevelopingenhancededucationandprogrammingefforts,toensurethatamplesupportisavailableforindividualswhoexperiencediscriminatoryevents,andtobridgegapsinknowledgeand/orunderstandingofallpoliciesandresourcesregardingDEIatEvergreen.
Confidentiality
Toensuresuccessofthissurvey,giventhesensitivenatureofseveralofthequestions,akeyelementofthestudydesignwastolimitdirectaccessbetweenTheEvergreenStateCollegeadministrationandthoseindividualswhowerebeingsurveyed.Integraltothiseffortwastheuseofanindependentcontractor(SoundRocket)fordatacollectionefforts,whichprovidedafirewallbetweenrespondents’identityandtheirsurveyresponses.Consistentwithstandardpracticesforlargedatacollectionssuchasthis,SoundRocketwasrequiredtouseencryptiontechnologies(includingSSLforallweb-basedinterfaces)andadheretostrictguidelinestomaintaindatasecurityandconfidentiality.SoundRockethasbeencollectingsensitivedatafromuniversitypopulationsforover15years.Ourcommunications,stafftraining,processesandqualityinspectionsallfocusonminimizingdisclosurerisk.SoundRocketagreedtobeheldtoallstandardsprescribedbyanindependentIRBreviewboard,NewEnglandIRB(NEIRB),toprotectrespondentsbefore,during,andafterthestudy.
AftertheparticipantlistwasprovidedtoSoundRocket,noEvergreenStateCollegeemployeeevercameintocontactwithanyidentifyinginformationonanypotentialsurveyrespondentinawaythatwouldallowthemtolinksurveyresponsetoindividualidentity.AllstaffwereSoundRocketemployeesand/orcontractors.Thisfactwasopenlydisclosedduringcontactswithrespondentssothattheywereassuredthattheirresponseswouldnotbelinkedbacktothem.Afterthestudywascompleted,SoundRocketdestroyedallidentifiabledata(electronicandpaper)thatwasreceivedintheeffort.
DEIResources
TheTESC-DEIClimateSurveyStudyisonecomponentofthecomprehensivecampuswideplantofosterandstrengthenDiversity,Equity,andInclusion(DEI)atTheEvergreenStateCollege.TheinformationincludedinthisreportmaybeusedtohelpshapeDEIplansacrossEvergreen–aswellaswithinuniversitycolleges,units,anddepartments.Forquestionsaboutthe2020EvergreenStateCollegeCampusClimateSurvey,pleasecontactInclusiveExcellenceandStudentSuccessat360-867-5133oremailatinclusiveexcellence@evergreen.edu.Forquestionsaboutstudyresults,analysesofdatacollected,orthestudymethodology,[email protected],orbyphoneat734-527-2150.
28