Embed Size (px)
Citation preview
G:\GE\PRJ\GE_Loeffel_Drainageways_RIFS\Reports and Presentations\2020\12-22 2020 Fish Report\Letter Report\DL 2020 Fish Report.docx
Arcadis of New York, Inc.
One Lincoln Center
110 West Fayette Street
Suite 300
Syracuse
New York 13202
Tel 315 446 9120
www.arcadis.com
Page:
1/6
Mr. Kevin Mooney
Senior Project Manager
General Electric Company
1 Plastics Avenue
Pittsfield, MA 01201
Subject:
2020 Biological Monitoring Data Summary
Dewey Loeffel Landfill Superfund Site
RI/FS Order for Drainageways (Index No. CERCLA 02-2013-2030)
Nassau, New York
Dear Mr. Mooney:
This letter report summarizes the fish tissue polychlorinated biphenyl (PCB) data
collected in 2020 by Arcadis US, Inc. (Arcadis) on behalf of the General Electric
Company (GE) at the Dewey Loeffel Landfill Superfund Site located in Nassau,
New York (Site). Fish tissue samples were collected from the western surface
water drainageway (the Western Drainageway) leading from the former Dewey
Loeffel Landfill (the Landfill), including the Valatie Kill and Nassau Lake. Due to
the ongoing removal action in the Northwest Drainage Ditch, Former Mead Road
Pond drainage channel, and Tributary T11A, fish samples were not collected in
those areas in 2020.1
The activities described herein were completed in general accordance with the
Phase 1 Remedial Investigation (RI) Work Plan originally submitted to the United
States Environmental Protection Agency (USEPA) on January 22, 2014, and last
revised on June 1, 2015, with revisions to the fish collection plan on July 21,
2016 and July 3, 2017.
This letter report also provides an analysis of trends in fish tissue PCB
concentrations. The fish tissue PCB data are presented in a series of tables and
figures, including box and whisker plots of wet-weight and lipid-normalized PCB
1 Although the Nassau Town Board voted in October 2018 to change the name of Tributary T11A to Little Thunder Brook, for consistency throughout site-related documents, the drainageway is referred to as Tributary T11A herein.
ENVIRONMENT
Date:
December 22, 2020
Contact:
Donald Sauda, P.E.
Phone:
315.671.9214
Email:
Our ref:
ARC10073
arcadis.com G:\GE\PRJ\GE_Loeffel_Drainageways_RIFS\Reports and Presentations\2020\12-22 2020 Fish Report\Letter Report\DL 2020 Fish Report.docx
Mr. Kevin Mooney
December 22, 2020
Page:
2/6
concentrations for individual fish species and combinations of species over time at various locations
within the Western Drainageway.
This letter report is similar to previous biological monitoring data summaries but is updated to include the
2020 fish tissue data. Specifically, this letter report contains the following:
• The text presents a summary of the fish monitoring program, a description of the 2020 fish collection
activities, and a summary of temporal trends in fish PCB concentrations;
• Figure 1 depicts the 12 fish sampling stations;
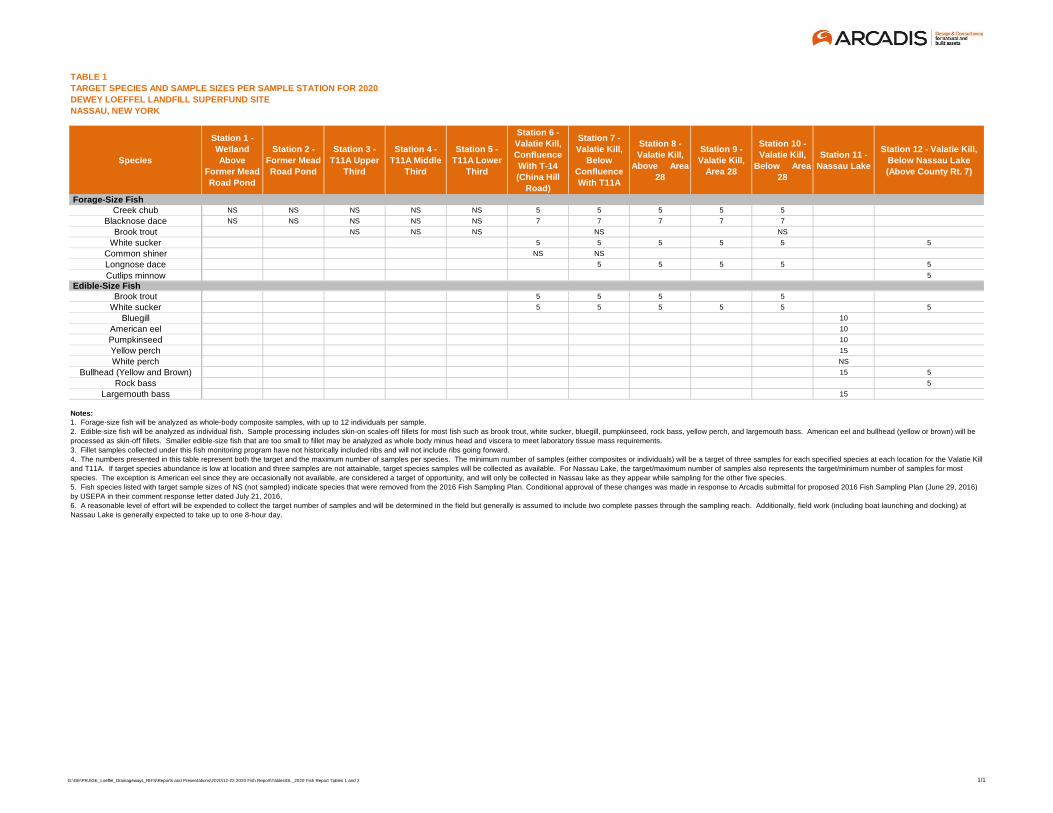
• Table 1 contains a summary table for 2020 targeted species and sample sizes for each sampling
station;
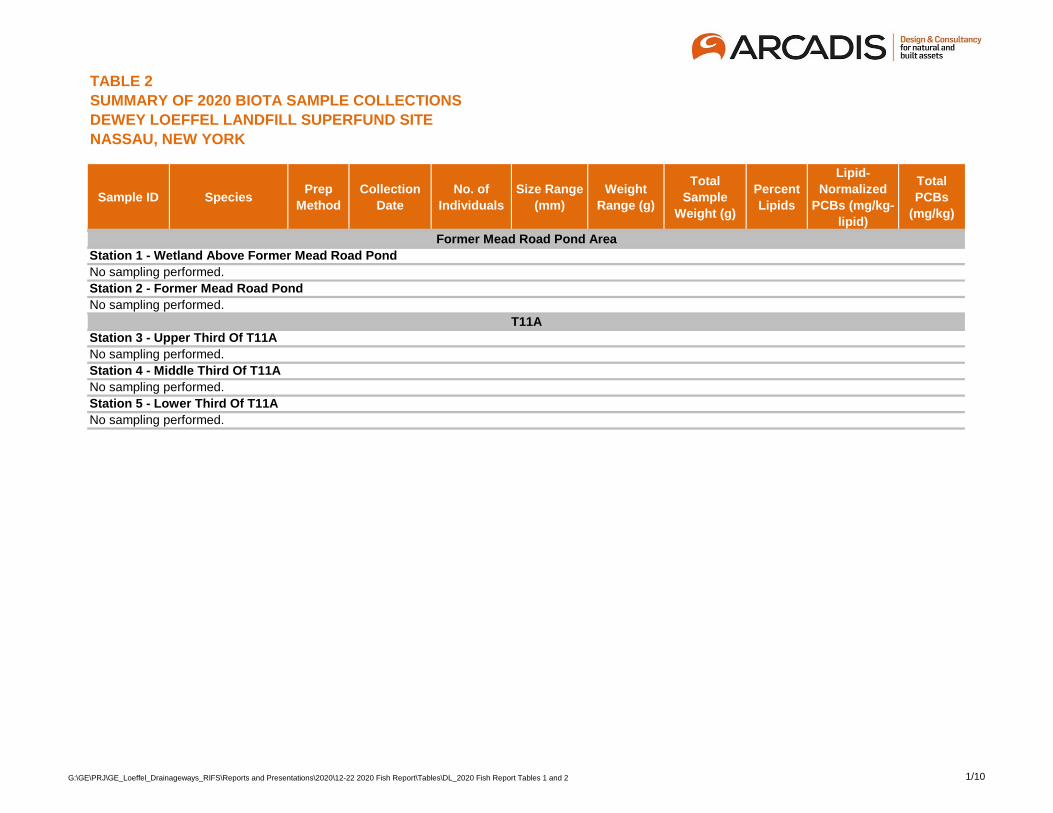
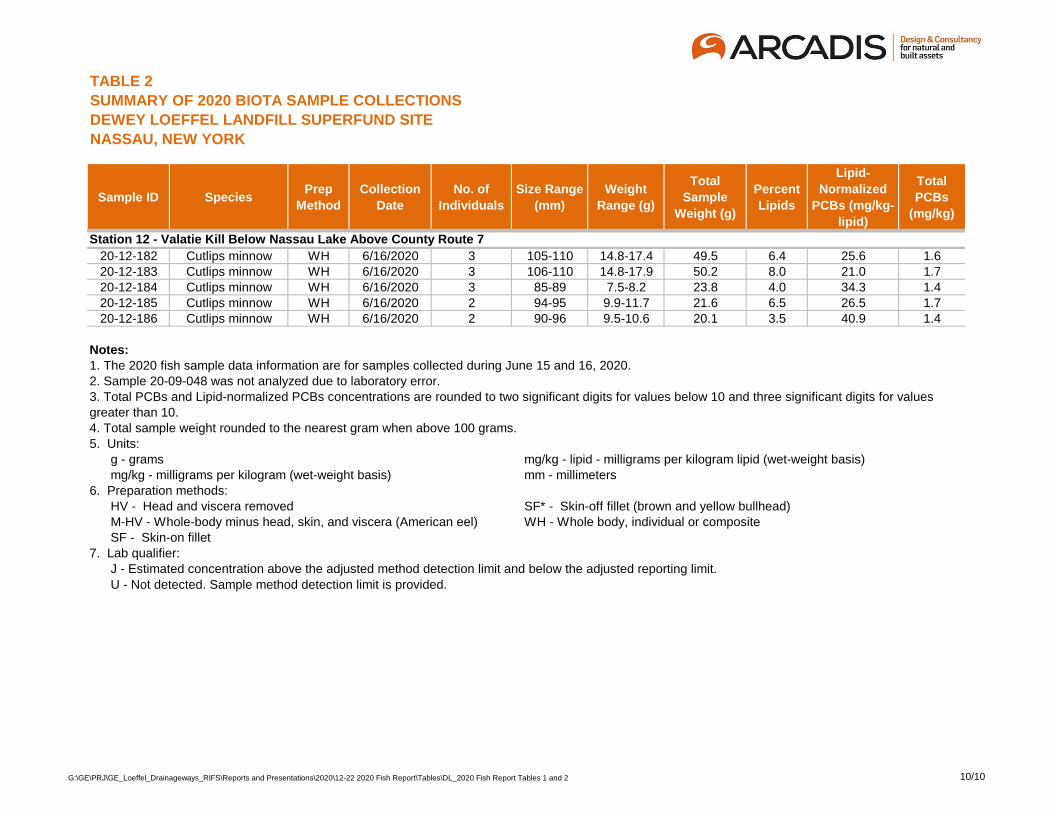
• Table 2 contains a summary of the 2020 fish analytical data by sampling station; and
• Tables 3A to 3D contain updated summaries of annual average PCB concentrations for the targeted
fish species by sampling station.
The compact disk accompanying this letter report includes the following appendices;
• Appendix A contains an updated trend evaluation of fish tissue PCB data;
• Appendix B contains box and whisker plots of wet-weight and lipid-normalized PCB concentrations for
individual species by sampling station and collection year;
• Appendix C contains copies of field notes and chain-of-custody (COC) forms for the 2020 fish
sampling; and
• Appendix D contains copies of laboratory analytical data reports for the 2020 fish tissue samples.
SUMMARY OF HISTORICAL FISH MONITORING PROGRAM
Fish tissue sampling has been conducted at the Site since the late 1970s. From 2002 through 2008, fish
sampling was conducted by NYSDEC in general accordance with the Long-Term Monitoring of PCB in
Biota of the Valatie Kill Drainage System (NYSDEC, 2002). NYSDEC led the fish sampling during this
time period, with manpower and equipment assistance by Arcadis (formerly Blasland, Bouck and Lee,
Inc.) on behalf of GE, which also funded the fish tissue laboratory analyses.
In 2008, at NYSDEC’s request, GE developed a Statement of Work (SOW) for the fish monitoring
program associated with the Western Drainageway leading from the Landfill. The SOW was originally
submitted to NYSDEC on December 22, 2008 and described a fish monitoring program for the Site to be
implemented during 2009 and 2010. NYSDEC provided comments on February 17, 2009, and GE
provided a revised SOW and responded to NYSDEC’s comments in a March 20, 2009 letter. On April 23,
2009, NYSDEC approved the revised SOW for implementation of the fish monitoring program in 2009
and 2010. GE subsequently agreed to also implement the revised SOW in 2011 and 2012. In 2013, GE
implemented the revised SOW to conduct the fish monitoring program and expanded upon the target
sample sizes for several species.
arcadis.com G:\GE\PRJ\GE_Loeffel_Drainageways_RIFS\Reports and Presentations\2020\12-22 2020 Fish Report\Letter Report\DL 2020 Fish Report.docx
Mr. Kevin Mooney
December 22, 2020
Page:
3/6
The 2014 fish monitoring was conducted in general accordance with a draft Phase 1 RI Work Plan, which
had been submitted to USEPA on January 22, 2014. Although the Phase 1 RI Work Plan had not yet
been approved, GE and USEPA agreed to proceed with the fish monitoring in 2014 as described in the
Phase 1 RI Work Plan. Similarly, the fish monitoring in 2015 was conducted in accordance with the Phase
1 RI Work Plan, last revised on June 1, 2015, which was approved by USEPA on August 6, 2015. On
June 29, 2016, GE submitted to USEPA a letter and supporting information describing the proposed fish
collection plan for 2016. Based on USEPA’s July 21, 2016 response letter, several changes from the
Phase 1 RI Work Plan were approved and implemented for 2016. On May 30, 2017, GE submitted to
USEPA a letter and supporting information describing the proposed fish collection plan for 2017. Based
on USEPA’s July 3, 2017 response letter, similar changes implemented in 2016 were also approved, and
implemented for 2017 sampling. The changes to the sampling program included the following:
• Stations 1, 2, 3, 4, and 5: fish collection was based on number of individuals observed to avoid
overfishing when limited numbers were present. If two or fewer individuals were observed per target
species over the sample area, these fish were released. If three or more individuals were observed
per target species over the sample area, these fish were retained for analysis;
• Stations 6 and 7: common shiner were removed from the monitoring program;
• Stations 7 and 10: forage-size brook trout were removed from the monitoring program; however, the
numbers of forage-size brook trout individuals observed in the field were recorded; and
• Station 11: white perch were removed from the monitoring program.
In 2018, 2019 and 2020, the monitoring program did not include fish sampling from the Northwest
Drainage Ditch, Former Mead Road Pond drainage channel, and Tributary T11A stations, based on
supplemental sediment and soil investigations and remediation being performed under the Tributary T11A
Removal Action under Paragraph 47.f Administrative Settlement Agreement and Order on Consent for a
Removal Action (Index No. CERCLA 02-2012-2005). Therefore, trend evaluations presented in this
annual report do not include Stations 1 through 5.
Fish monitoring in 2020 targeted collection of up to 120 forage-size fish composite samples and up to 135
edible-size fish samples (as summarized in Table 1 of this report). The monitoring included six sampling
stations (identified as S6 through S12) in the Valatie Kill (including both upstream of the Tributary T11A
confluence and downstream of the Nassau Lake Dam) and Nassau Lake (see Figure 1).
SUMMARY OF 2020 FISH SAMPLING ACTIVITIES
The 2020 fish sampling activities consisted of the following:
• On June 15, 2020, Arcadis, along with Chelsea Krieg of WSP (formerly Louis Berger, representing
USEPA), performed fish tissue sampling within the Valatie Kill above Kroner Road and Area 28
(sampling station S8), at Area 28 (sampling station S9), and downstream of Area 28 (sampling station
S10). A total of 51 forage-size fish composite samples and 25 edible-size fish samples from these
three stations were collected, field processed, and retained for analysis. Insufficient numbers of fish
were collected to achieve the target number of blacknose dace samples (n=7) at sampling stations S8
and S10. Creek chub were not observed at sampling station S10 and sample target size (n=5) was
arcadis.com G:\GE\PRJ\GE_Loeffel_Drainageways_RIFS\Reports and Presentations\2020\12-22 2020 Fish Report\Letter Report\DL 2020 Fish Report.docx
Mr. Kevin Mooney
December 22, 2020
Page:
4/6
not achieved at sampling station S9. One hundred forage-sized brook trout were observed at
sampling station S10.
• On June 16, 2020, Arcadis, along with Chelsea Krieg of WSP, collected fish within the Valatie Kill
within the background location near China Hill Road (sampling station S6), downstream of Tributary
T11 confluence (sampling station S7), and downstream of Nassau Lake (sampling station S12). A
total of 54 forage-size fish composite samples and 26 edible-size fish samples from these three
stations were collected, field processed, and retained for analysis. At sampling station S12, edible
target sample sizes were not met for bullhead and white sucker and no edible-sized rock bass were
collected. Twelve forage-sized brook trout were observed at sampling station S7.
• On June 16, 2020, Arcadis collected fish within Nassau Lake (sampling station S11). A total of 66
edible-size fish were collected, field processed, and retained for analysis; all target species were
included. Targets of opportunity for Nassau Lake are white perch and American eel. White perch
were not observed, and one American eel was collected.
For the 2020 biota monitoring program, a total of 105 forage-size fish composite samples and 117 edible-
size fish samples were submitted for laboratory analysis. These samples consisted of target number of
samples for each species from each sampling station, as defined in Table 1, with the exception of those
species not observed or where target sample sizes were not met as described above. Prior to shipment,
samples were packed in coolers with ice, along with appropriate sample COC forms, and sent to Pace
Analytical, Inc. (Pace) in Green Bay, Wisconsin for analysis of PCBs and percent lipids. The laboratory
processed each sample according to the sample-specific tissue preparation method detailed on the COC
forms (included in Appendix C). For edible-size fish samples, the laboratory followed the NYSDEC
standard operating procedures for filleting, which are consistent with historical procedures utilized for the
Site. The samples were analyzed by Pace for total PCBs using USEPA Method SW-846 8082 and lipids
content using standard gravimetric analysis. One forage-size fish composite sample (20-09-048) was
submitted to Pace but was not analyzed due to laboratory error.
RESULTS
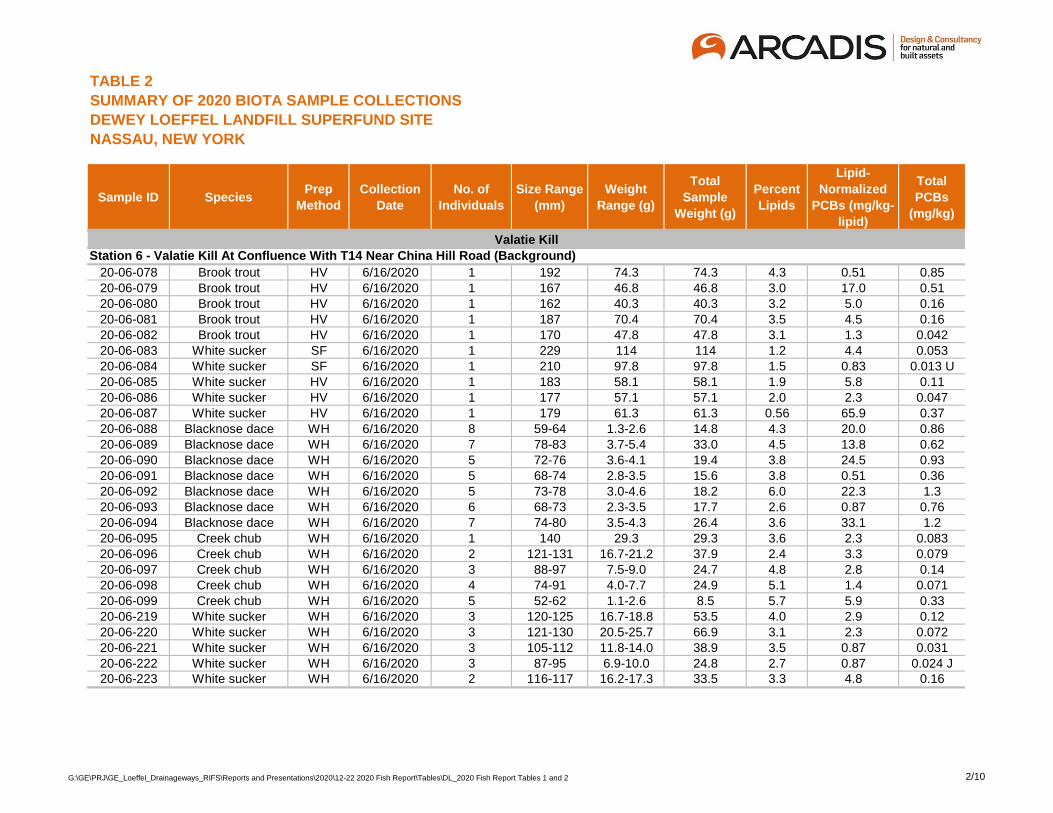
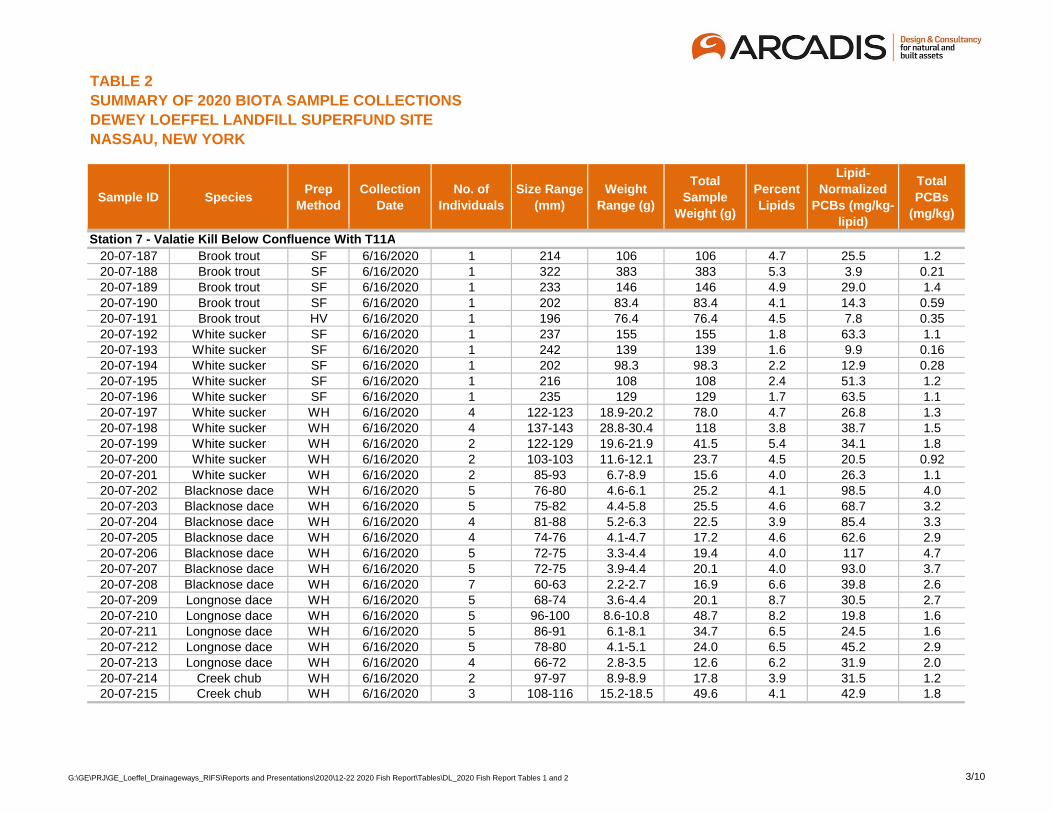
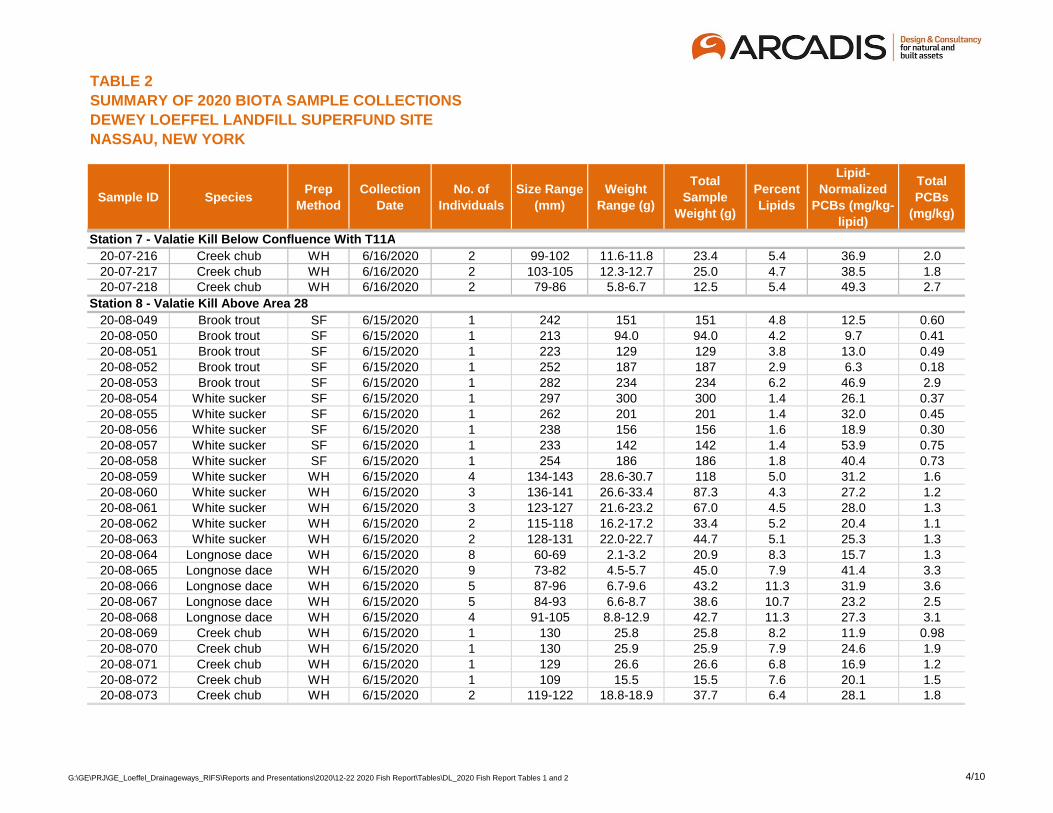
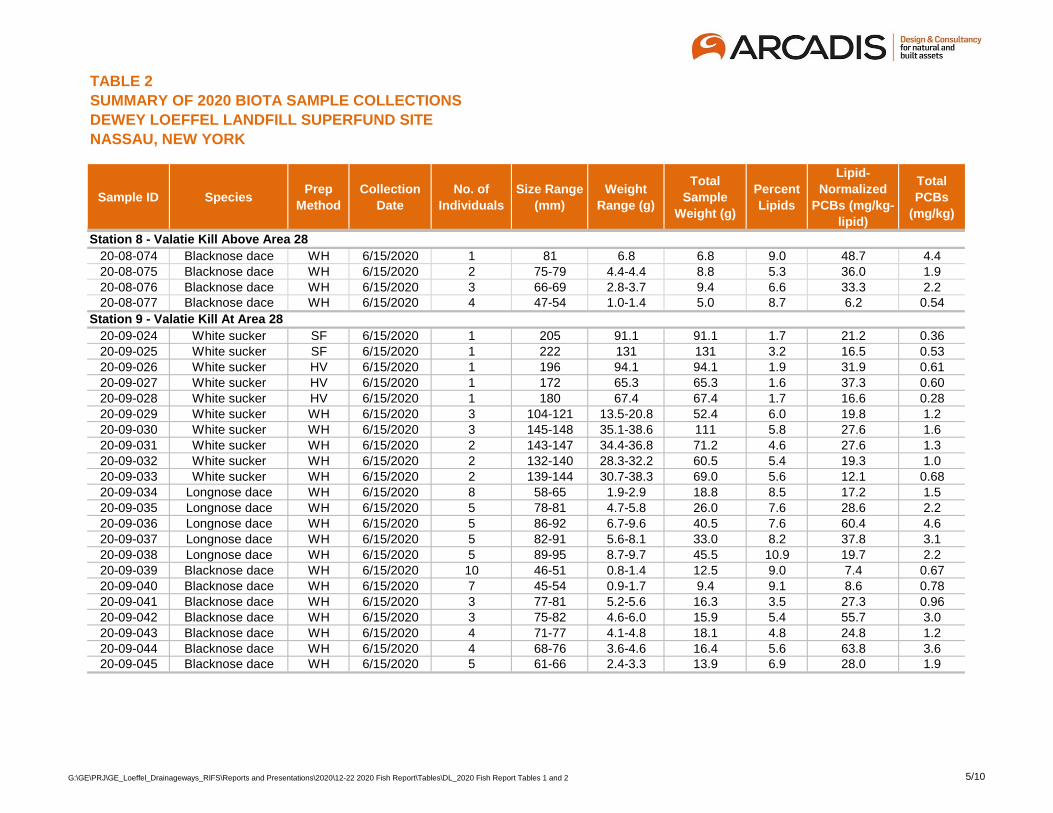
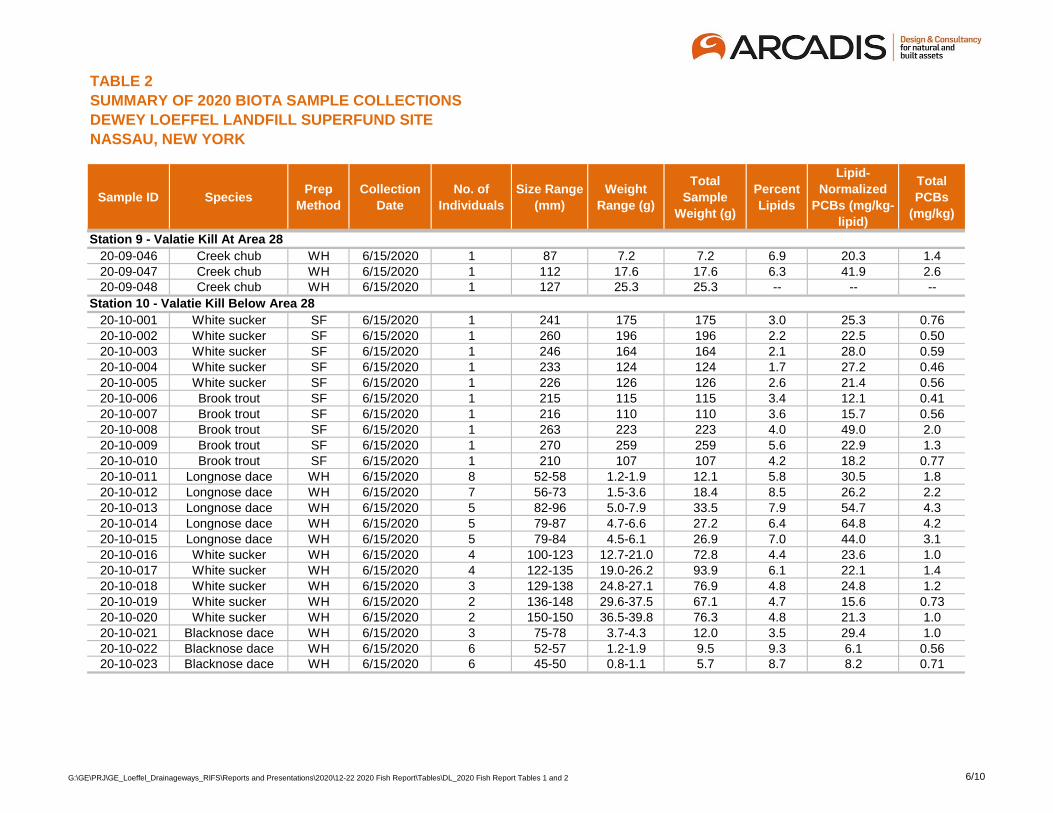
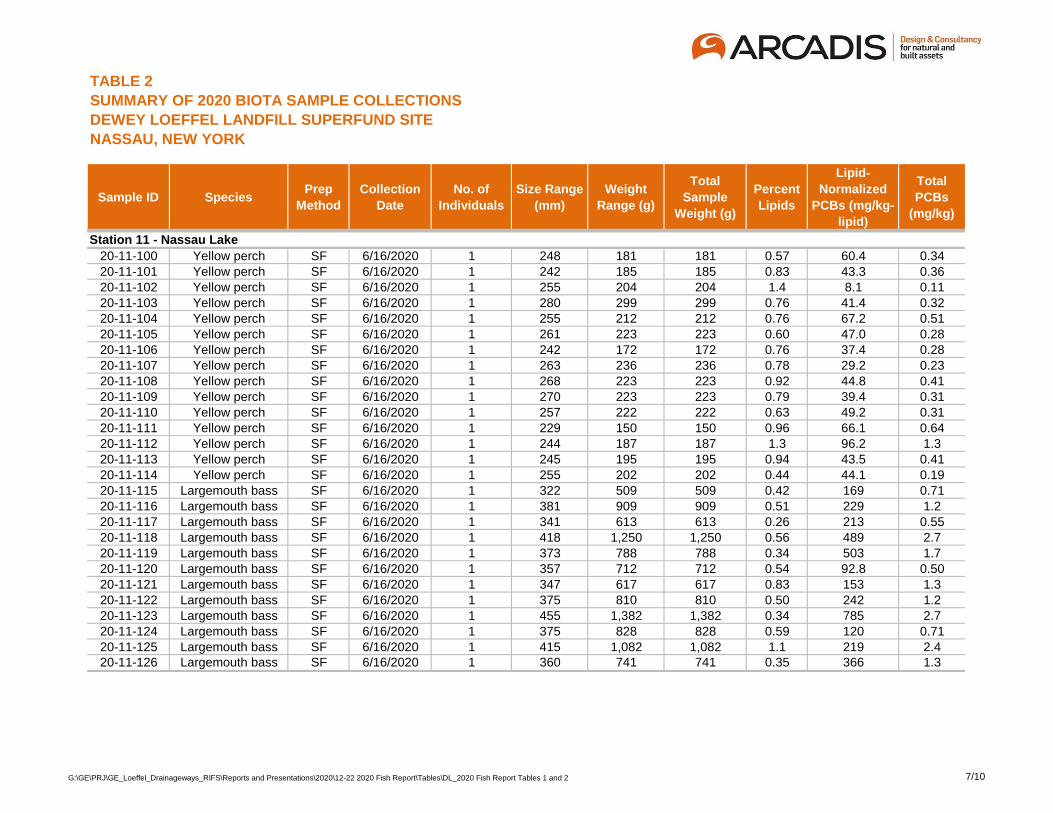
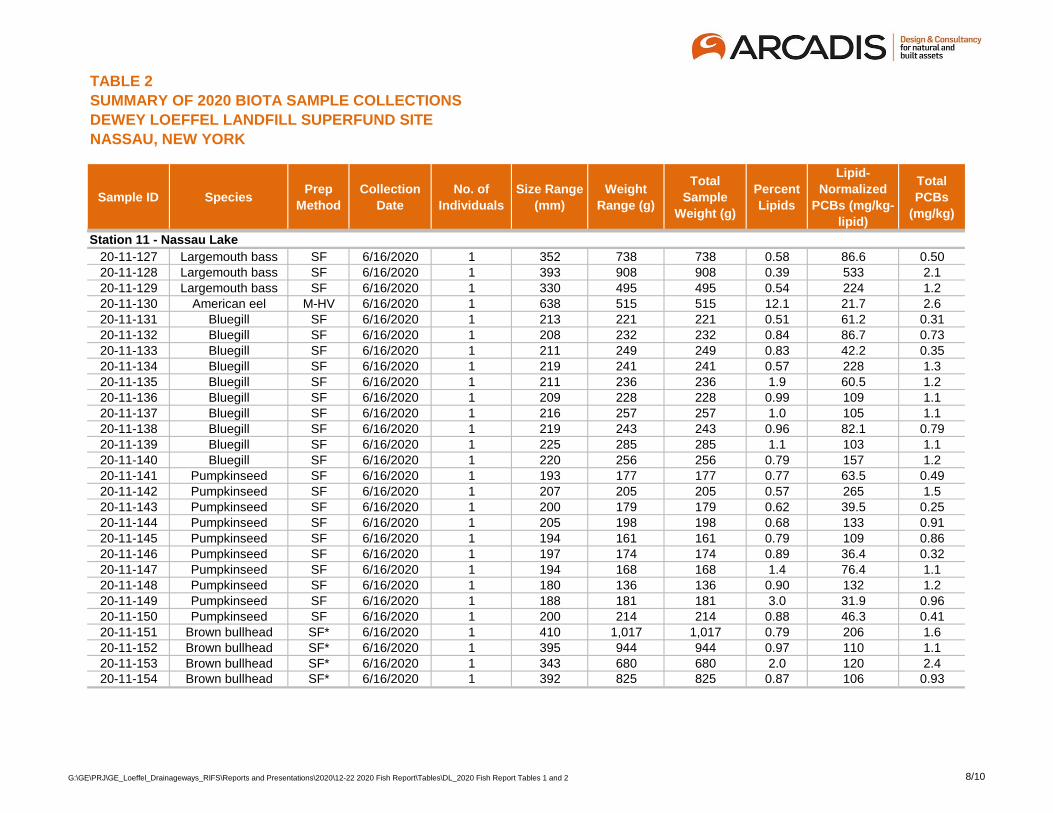
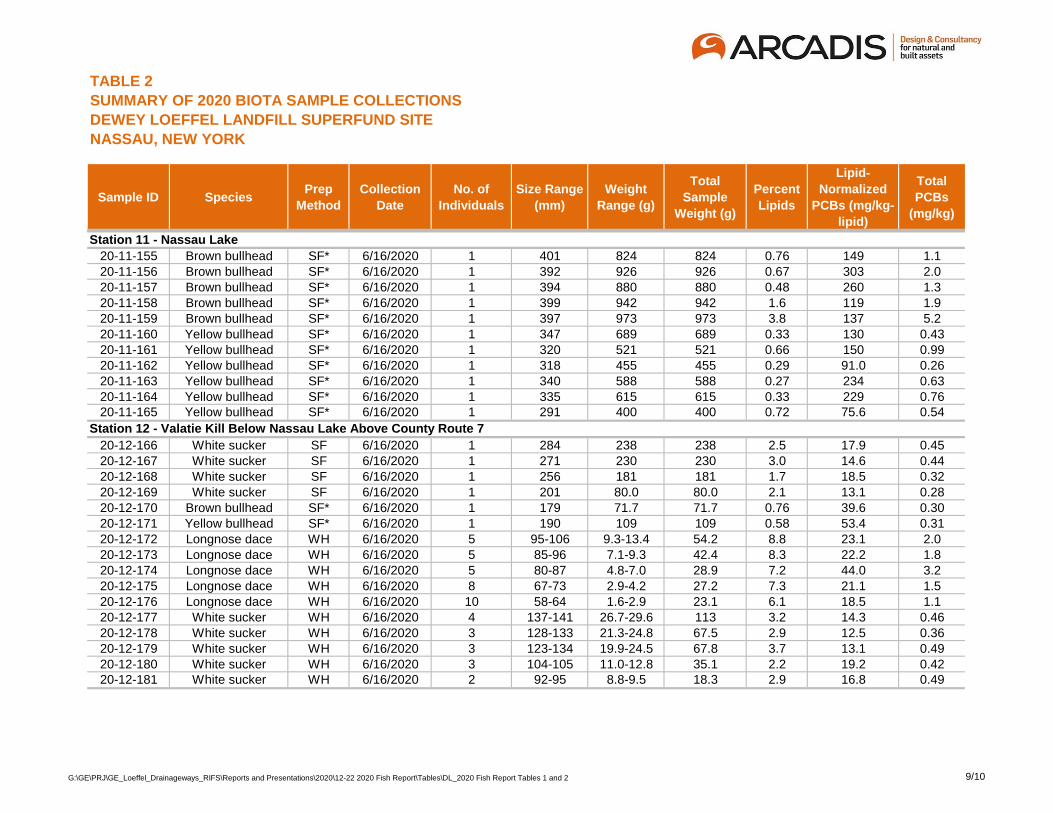
The 2020 fish tissue PCB and lipid data are provided in Table 2. PCB Aroclors were quantified by the
laboratory and results are provided in Appendix D. PCBs were detected in each of the fish tissue samples
and were quantified as Aroclor 1260. Table 2 also includes the lipid-normalized PCB values, calculated
as the wet-weight PCB concentration (in milligrams per kilogram [mg/kg], equivalent to parts per million
[ppm]) divided by the decimal fraction lipids (yielding units of ppm-lipid).
Annual average fish tissue PCB concentrations (both wet-weight and lipid-normalized) are presented in
Tables 3A to 3D, and species that were collected in 2020 are bolded. Additionally, box and whisker plots
were developed for each species by location and collection year to visualize data trends are presented in
Appendix B. Summary statistics by plot and collection year for these are provided in Attachment 1 of
Appendix B.
arcadis.com G:\GE\PRJ\GE_Loeffel_Drainageways_RIFS\Reports and Presentations\2020\12-22 2020 Fish Report\Letter Report\DL 2020 Fish Report.docx
Mr. Kevin Mooney
December 22, 2020
Page:
5/6
EVALUATION OF TEMPORAL TRENDS
Appendix A evaluates temporal trends in fish tissue PCB concentrations within the Western Drainageway,
based on over 4,800 fish tissue samples collected from 1979 through 2020. The temporal analysis
concludes the following:
• Fish tissue PCB concentrations at the Valatie Kill background (sampling station S6) at China Hill
Road (located about 1.1 miles upstream of the confluence of Tributary T11A with the Valatie Kill)
typically range from 0.0125 to 0.05 ppm (Attachment 2, Figures BKGRD-1 and -2). These
concentrations may reflect potential for fish migration from downstream areas (there are no barriers to
the upstream migration of certain fish species to the background location).
• The species/locations with complete target sample sizes throughout the monitoring period (Table 1)
are most useful for evaluating temporal trends. Data for both individual species and combined
species (grouped into either forage-size or edible-size samples) indicate that fish tissue PCB
concentrations in the Valatie Kill between Tributary T11A and Nassau Lake for all fish species
(stations S7, S8, S9, and S10) have generally declined since remediation activities were conducted in
the former Mead Road Pond area and Tributary T11A between 2001 and 2003, and in Area 28 of the
Valatie Kill (located about 0.8 miles upstream from Nassau Lake) in late 2003. Tables 3B and 3C
provide the annual summary of PCB concentrations to allow comparison of pre-remedial to post-
remedial annual arithmetic means by target species per location for both forage-size and edible fish
target species from stations S7 through S10. In all comparisons by species and location, declines are
observed. Forage-fish average (combined data for blacknose dace, creek chub, longnose dace,
white sucker) PCB concentrations in 2020 are among the lowest on record for sampling stations S7,
S8, S9, and S10 (as shown in Attachment 3, Figures VK-2, VK-4, VK-6, and VK-8). Similarly, edible
brook trout and white sucker average PCB concentrations in 2020 are among the lowest on record for
sampling stations S7, S8, S9, and S10 (as shown in Attachment 3, Figures VK-3, VK-5, and VK-7).
• PCB concentrations in 2020 are among the lowest on record for several species/location
combinations within the Valatie Kill. For example, edible size white sucker from above Area 28 [S8]
and edible size brook trout and white sucker from below Area 28 [S10] (as shown in Table 3C annual
average comparisons), blacknose dace from Valatie Kill Below Confluence with Tributary T11A [S7],
creek chub from below Area 28 [S10], longnose dace from above Area 28 [S8] and from Area 28 [S9],
and white sucker from stations S7 to S10 (as shown in Table 3B).
• Fish tissue PCB concentrations in edible fish (combined data for American eel, bluegill, bullhead,
largemouth bass, pumpkinseed, yellow perch) from Nassau Lake (station S11, located about 3 miles
downstream from the Landfill) have declined over time. PCB concentrations in 2020 are similar to
those observed in 2010 through 2019 and at far lower levels than during the prior three decades
(1980-1989; 1990-1999; 2000-2009) (as shown in Attachment 4, Figure 1). Mean fish tissue PCB
concentrations are continually decreasing for the periods from 1980 to 1989, 1990 to 1999, 2000 to
2009, and 2010 to 2019. During the last four years (2017 to 2020), mean PCB concentrations were
among the lowest on record for bullhead (brown and yellow), largemouth bass, and yellow perch (as
shown in Table 3D). Downward trends in fish tissue PCB concentrations are less dramatic over time
as concentrations approach background levels. This is evident by observations from 2016 to 2020
which indicate that while average PCBs are around 1 ppm or lower for most species, concentrations
arcadis.com G:\GE\PRJ\GE_Loeffel_Drainageways_RIFS\Reports and Presentations\2020\12-22 2020 Fish Report\Letter Report\DL 2020 Fish Report.docx
Mr. Kevin Mooney
December 22, 2020
Page:
6/6
in certain species such as bullhead and largemouth bass recently have had slower rates of decline
and may have begun to plateau.
• Overall, fish tissue PCB concentrations have decreased over time, and generally reflect the
effectiveness of remedial activities performed for the Site. In some instances, PCB concentrations are
declining at a slower rate for certain species and stations. An example of this slower rate of decline is
whole-body fish (combined data for blacknose dace, creek chub, longnose dace, white sucker) at
station S10, where average PCB concentrations have consistently ranged from 1.6 to 1.8 ppm over the
last six years.
SUMMARY
This letter report summarizes the fish tissue sampling activities and PCB data that were collected in 2020
by Arcadis at the Site. Detailed evaluation of the 2020 PCB data (and the historical data) indicate that fish
tissue PCB levels have decreased substantially compared to earlier data.
If you have any questions regarding these data, please contact me at 315.671.9214.
Sincerely,
Arcadis US, Inc.
Donald F. Sauda, P.E.
Vice President

TABLES
Species
Station 1 -
Wetland
Above
Former Mead
Road Pond
Station 2 -
Former Mead
Road Pond
Station 3 -
T11A Upper
Third
Station 4 -
T11A Middle
Third
Station 5 -
T11A Lower
Third
Station 6 -
Valatie Kill,
Confluence
With T-14
(China Hill
Road)
Station 7 -
Valatie Kill,
Below
Confluence
With T11A
Station 8 -
Valatie Kill,
Above Area
28
Station 9 -
Valatie Kill,
Area 28
Station 10 -
Valatie Kill,
Below Area
28
Station 11 -
Nassau Lake
Station 12 - Valatie Kill,
Below Nassau Lake
(Above County Rt. 7)
Creek chub NS NS NS NS NS 5 5 5 5 5
Blacknose dace NS NS NS NS NS 7 7 7 7 7
Brook trout NS NS NS NS NS
White sucker 5 5 5 5 5 5
Common shiner NS NS
Longnose dace 5 5 5 5 5
Cutlips minnow 5
Brook trout 5 5 5 5
White sucker 5 5 5 5 5 5
Bluegill 10
American eel 10
Pumpkinseed 10
Yellow perch 15
White perch NS
Bullhead (Yellow and Brown) 15 5
Rock bass 5
Largemouth bass 15
Notes:
TABLE 1
TARGET SPECIES AND SAMPLE SIZES PER SAMPLE STATION FOR 2020
DEWEY LOEFFEL LANDFILL SUPERFUND SITE
NASSAU, NEW YORK
4. The numbers presented in this table represent both the target and the maximum number of samples per species. The minimum number of samples (either composites or individuals) will be a target of three samples for each specified species at each location for the Valatie Kill
and T11A. If target species abundance is low at location and three samples are not attainable, target species samples will be collected as available. For Nassau Lake, the target/maximum number of samples also represents the target/minimum number of samples for most
species. The exception is American eel since they are occasionally not available, are considered a target of opportunity, and will only be collected in Nassau lake as they appear while sampling for the other five species.
6. A reasonable level of effort will be expended to collect the target number of samples and will be determined in the field but generally is assumed to include two complete passes through the sampling reach. Additionally, field work (including boat launching and docking) at
Nassau Lake is generally expected to take up to one 8-hour day.
3. Fillet samples collected under this fish monitoring program have not historically included ribs and will not include ribs going forward.
Forage-Size Fish
Edible-Size Fish
1. Forage-size fish will be analyzed as whole-body composite samples, with up to 12 individuals per sample.
2. Edible-size fish will be analyzed as individual fish. Sample processing includes skin-on scales-off fillets for most fish such as brook trout, white sucker, bluegill, pumpkinseed, rock bass, yellow perch, and largemouth bass. American eel and bullhead (yellow or brown) will be
processed as skin-off fillets. Smaller edible-size fish that are too small to fillet may be analyzed as whole body minus head and viscera to meet laboratory tissue mass requirements.
5. Fish species listed with target sample sizes of NS (not sampled) indicate species that were removed from the 2016 Fish Sampling Plan. Conditional approval of these changes was made in response to Arcadis submittal for proposed 2016 Fish Sampling Plan (June 29, 2016)
by USEPA in their comment response letter dated July 21, 2016,
G:\GE\PRJ\GE_Loeffel_Drainageways_RIFS\Reports and Presentations\2020\12-22 2020 Fish Report\Tables\DL_2020 Fish Report Tables 1 and 2 1/1
Percent
Lipids
Lipid-
Normalized
PCBs (mg/kg-
lipid)
Total
PCBs
(mg/kg)
Former Mead Road Pond Area
Station 1 - Wetland Above Former Mead Road Pond
Weight
Range (g)
Total
Sample
Weight (g)
No sampling performed.
No sampling performed.
No sampling performed.
T11A
Station 3 - Upper Third Of T11A
Station 4 - Middle Third Of T11A
Station 2 - Former Mead Road Pond
Station 5 - Lower Third Of T11A
TABLE 2
SUMMARY OF 2020 BIOTA SAMPLE COLLECTIONS
DEWEY LOEFFEL LANDFILL SUPERFUND SITE
NASSAU, NEW YORK
Sample ID SpeciesPrep
Method
Collection
Date
No. of
Individuals
Size Range
(mm)
No sampling performed.
No sampling performed.
G:\GE\PRJ\GE_Loeffel_Drainageways_RIFS\Reports and Presentations\2020\12-22 2020 Fish Report\Tables\DL_2020 Fish Report Tables 1 and 2 1/10
Percent
Lipids
Lipid-
Normalized
PCBs (mg/kg-
lipid)
Total
PCBs
(mg/kg)
Former Mead Road Pond Area
Weight
Range (g)
Total
Sample
Weight (g)
TABLE 2
SUMMARY OF 2020 BIOTA SAMPLE COLLECTIONS
DEWEY LOEFFEL LANDFILL SUPERFUND SITE
NASSAU, NEW YORK
Sample ID SpeciesPrep
Method
Collection
Date
No. of
Individuals
Size Range
(mm)
20-06-078 Brook trout HV 6/16/2020 1 192 74.3 74.3 4.3 0.51 0.8520-06-079 Brook trout HV 6/16/2020 1 167 46.8 46.8 3.0 17.0 0.5120-06-080 Brook trout HV 6/16/2020 1 162 40.3 40.3 3.2 5.0 0.1620-06-081 Brook trout HV 6/16/2020 1 187 70.4 70.4 3.5 4.5 0.1620-06-082 Brook trout HV 6/16/2020 1 170 47.8 47.8 3.1 1.3 0.04220-06-083 White sucker SF 6/16/2020 1 229 114 114 1.2 4.4 0.05320-06-084 White sucker SF 6/16/2020 1 210 97.8 97.8 1.5 0.83 0.013 U20-06-085 White sucker HV 6/16/2020 1 183 58.1 58.1 1.9 5.8 0.1120-06-086 White sucker HV 6/16/2020 1 177 57.1 57.1 2.0 2.3 0.04720-06-087 White sucker HV 6/16/2020 1 179 61.3 61.3 0.56 65.9 0.3720-06-088 Blacknose dace WH 6/16/2020 8 59-64 1.3-2.6 14.8 4.3 20.0 0.8620-06-089 Blacknose dace WH 6/16/2020 7 78-83 3.7-5.4 33.0 4.5 13.8 0.6220-06-090 Blacknose dace WH 6/16/2020 5 72-76 3.6-4.1 19.4 3.8 24.5 0.9320-06-091 Blacknose dace WH 6/16/2020 5 68-74 2.8-3.5 15.6 3.8 0.51 0.3620-06-092 Blacknose dace WH 6/16/2020 5 73-78 3.0-4.6 18.2 6.0 22.3 1.320-06-093 Blacknose dace WH 6/16/2020 6 68-73 2.3-3.5 17.7 2.6 0.87 0.7620-06-094 Blacknose dace WH 6/16/2020 7 74-80 3.5-4.3 26.4 3.6 33.1 1.220-06-095 Creek chub WH 6/16/2020 1 140 29.3 29.3 3.6 2.3 0.08320-06-096 Creek chub WH 6/16/2020 2 121-131 16.7-21.2 37.9 2.4 3.3 0.07920-06-097 Creek chub WH 6/16/2020 3 88-97 7.5-9.0 24.7 4.8 2.8 0.1420-06-098 Creek chub WH 6/16/2020 4 74-91 4.0-7.7 24.9 5.1 1.4 0.07120-06-099 Creek chub WH 6/16/2020 5 52-62 1.1-2.6 8.5 5.7 5.9 0.3320-06-219 White sucker WH 6/16/2020 3 120-125 16.7-18.8 53.5 4.0 2.9 0.1220-06-220 White sucker WH 6/16/2020 3 121-130 20.5-25.7 66.9 3.1 2.3 0.07220-06-221 White sucker WH 6/16/2020 3 105-112 11.8-14.0 38.9 3.5 0.87 0.03120-06-222 White sucker WH 6/16/2020 3 87-95 6.9-10.0 24.8 2.7 0.87 0.024 J20-06-223 White sucker WH 6/16/2020 2 116-117 16.2-17.3 33.5 3.3 4.8 0.16
Valatie Kill
Station 6 - Valatie Kill At Confluence With T14 Near China Hill Road (Background)
G:\GE\PRJ\GE_Loeffel_Drainageways_RIFS\Reports and Presentations\2020\12-22 2020 Fish Report\Tables\DL_2020 Fish Report Tables 1 and 2 2/10
Percent
Lipids
Lipid-
Normalized
PCBs (mg/kg-
lipid)
Total
PCBs
(mg/kg)
Former Mead Road Pond Area
Weight
Range (g)
Total
Sample
Weight (g)
TABLE 2
SUMMARY OF 2020 BIOTA SAMPLE COLLECTIONS
DEWEY LOEFFEL LANDFILL SUPERFUND SITE
NASSAU, NEW YORK
Sample ID SpeciesPrep
Method
Collection
Date
No. of
Individuals
Size Range
(mm)
20-07-187 Brook trout SF 6/16/2020 1 214 106 106 4.7 25.5 1.220-07-188 Brook trout SF 6/16/2020 1 322 383 383 5.3 3.9 0.2120-07-189 Brook trout SF 6/16/2020 1 233 146 146 4.9 29.0 1.420-07-190 Brook trout SF 6/16/2020 1 202 83.4 83.4 4.1 14.3 0.5920-07-191 Brook trout HV 6/16/2020 1 196 76.4 76.4 4.5 7.8 0.3520-07-192 White sucker SF 6/16/2020 1 237 155 155 1.8 63.3 1.120-07-193 White sucker SF 6/16/2020 1 242 139 139 1.6 9.9 0.1620-07-194 White sucker SF 6/16/2020 1 202 98.3 98.3 2.2 12.9 0.2820-07-195 White sucker SF 6/16/2020 1 216 108 108 2.4 51.3 1.220-07-196 White sucker SF 6/16/2020 1 235 129 129 1.7 63.5 1.120-07-197 White sucker WH 6/16/2020 4 122-123 18.9-20.2 78.0 4.7 26.8 1.320-07-198 White sucker WH 6/16/2020 4 137-143 28.8-30.4 118 3.8 38.7 1.520-07-199 White sucker WH 6/16/2020 2 122-129 19.6-21.9 41.5 5.4 34.1 1.820-07-200 White sucker WH 6/16/2020 2 103-103 11.6-12.1 23.7 4.5 20.5 0.9220-07-201 White sucker WH 6/16/2020 2 85-93 6.7-8.9 15.6 4.0 26.3 1.120-07-202 Blacknose dace WH 6/16/2020 5 76-80 4.6-6.1 25.2 4.1 98.5 4.020-07-203 Blacknose dace WH 6/16/2020 5 75-82 4.4-5.8 25.5 4.6 68.7 3.220-07-204 Blacknose dace WH 6/16/2020 4 81-88 5.2-6.3 22.5 3.9 85.4 3.320-07-205 Blacknose dace WH 6/16/2020 4 74-76 4.1-4.7 17.2 4.6 62.6 2.920-07-206 Blacknose dace WH 6/16/2020 5 72-75 3.3-4.4 19.4 4.0 117 4.720-07-207 Blacknose dace WH 6/16/2020 5 72-75 3.9-4.4 20.1 4.0 93.0 3.720-07-208 Blacknose dace WH 6/16/2020 7 60-63 2.2-2.7 16.9 6.6 39.8 2.620-07-209 Longnose dace WH 6/16/2020 5 68-74 3.6-4.4 20.1 8.7 30.5 2.720-07-210 Longnose dace WH 6/16/2020 5 96-100 8.6-10.8 48.7 8.2 19.8 1.620-07-211 Longnose dace WH 6/16/2020 5 86-91 6.1-8.1 34.7 6.5 24.5 1.620-07-212 Longnose dace WH 6/16/2020 5 78-80 4.1-5.1 24.0 6.5 45.2 2.920-07-213 Longnose dace WH 6/16/2020 4 66-72 2.8-3.5 12.6 6.2 31.9 2.020-07-214 Creek chub WH 6/16/2020 2 97-97 8.9-8.9 17.8 3.9 31.5 1.220-07-215 Creek chub WH 6/16/2020 3 108-116 15.2-18.5 49.6 4.1 42.9 1.8
Station 7 - Valatie Kill Below Confluence With T11A
G:\GE\PRJ\GE_Loeffel_Drainageways_RIFS\Reports and Presentations\2020\12-22 2020 Fish Report\Tables\DL_2020 Fish Report Tables 1 and 2 3/10
Percent
Lipids
Lipid-
Normalized
PCBs (mg/kg-
lipid)
Total
PCBs
(mg/kg)
Former Mead Road Pond Area
Weight
Range (g)
Total
Sample
Weight (g)
TABLE 2
SUMMARY OF 2020 BIOTA SAMPLE COLLECTIONS
DEWEY LOEFFEL LANDFILL SUPERFUND SITE
NASSAU, NEW YORK
Sample ID SpeciesPrep
Method
Collection
Date
No. of
Individuals
Size Range
(mm)
20-07-216 Creek chub WH 6/16/2020 2 99-102 11.6-11.8 23.4 5.4 36.9 2.020-07-217 Creek chub WH 6/16/2020 2 103-105 12.3-12.7 25.0 4.7 38.5 1.820-07-218 Creek chub WH 6/16/2020 2 79-86 5.8-6.7 12.5 5.4 49.3 2.7
20-08-049 Brook trout SF 6/15/2020 1 242 151 151 4.8 12.5 0.6020-08-050 Brook trout SF 6/15/2020 1 213 94.0 94.0 4.2 9.7 0.4120-08-051 Brook trout SF 6/15/2020 1 223 129 129 3.8 13.0 0.4920-08-052 Brook trout SF 6/15/2020 1 252 187 187 2.9 6.3 0.1820-08-053 Brook trout SF 6/15/2020 1 282 234 234 6.2 46.9 2.920-08-054 White sucker SF 6/15/2020 1 297 300 300 1.4 26.1 0.3720-08-055 White sucker SF 6/15/2020 1 262 201 201 1.4 32.0 0.4520-08-056 White sucker SF 6/15/2020 1 238 156 156 1.6 18.9 0.3020-08-057 White sucker SF 6/15/2020 1 233 142 142 1.4 53.9 0.7520-08-058 White sucker SF 6/15/2020 1 254 186 186 1.8 40.4 0.7320-08-059 White sucker WH 6/15/2020 4 134-143 28.6-30.7 118 5.0 31.2 1.620-08-060 White sucker WH 6/15/2020 3 136-141 26.6-33.4 87.3 4.3 27.2 1.220-08-061 White sucker WH 6/15/2020 3 123-127 21.6-23.2 67.0 4.5 28.0 1.320-08-062 White sucker WH 6/15/2020 2 115-118 16.2-17.2 33.4 5.2 20.4 1.120-08-063 White sucker WH 6/15/2020 2 128-131 22.0-22.7 44.7 5.1 25.3 1.320-08-064 Longnose dace WH 6/15/2020 8 60-69 2.1-3.2 20.9 8.3 15.7 1.320-08-065 Longnose dace WH 6/15/2020 9 73-82 4.5-5.7 45.0 7.9 41.4 3.320-08-066 Longnose dace WH 6/15/2020 5 87-96 6.7-9.6 43.2 11.3 31.9 3.620-08-067 Longnose dace WH 6/15/2020 5 84-93 6.6-8.7 38.6 10.7 23.2 2.520-08-068 Longnose dace WH 6/15/2020 4 91-105 8.8-12.9 42.7 11.3 27.3 3.120-08-069 Creek chub WH 6/15/2020 1 130 25.8 25.8 8.2 11.9 0.9820-08-070 Creek chub WH 6/15/2020 1 130 25.9 25.9 7.9 24.6 1.920-08-071 Creek chub WH 6/15/2020 1 129 26.6 26.6 6.8 16.9 1.220-08-072 Creek chub WH 6/15/2020 1 109 15.5 15.5 7.6 20.1 1.520-08-073 Creek chub WH 6/15/2020 2 119-122 18.8-18.9 37.7 6.4 28.1 1.8
Station 8 - Valatie Kill Above Area 28
Station 7 - Valatie Kill Below Confluence With T11A
G:\GE\PRJ\GE_Loeffel_Drainageways_RIFS\Reports and Presentations\2020\12-22 2020 Fish Report\Tables\DL_2020 Fish Report Tables 1 and 2 4/10
Percent
Lipids
Lipid-
Normalized
PCBs (mg/kg-
lipid)
Total
PCBs
(mg/kg)
Former Mead Road Pond Area
Weight
Range (g)
Total
Sample
Weight (g)
TABLE 2
SUMMARY OF 2020 BIOTA SAMPLE COLLECTIONS
DEWEY LOEFFEL LANDFILL SUPERFUND SITE
NASSAU, NEW YORK
Sample ID SpeciesPrep
Method
Collection
Date
No. of
Individuals
Size Range
(mm)
20-08-074 Blacknose dace WH 6/15/2020 1 81 6.8 6.8 9.0 48.7 4.420-08-075 Blacknose dace WH 6/15/2020 2 75-79 4.4-4.4 8.8 5.3 36.0 1.920-08-076 Blacknose dace WH 6/15/2020 3 66-69 2.8-3.7 9.4 6.6 33.3 2.220-08-077 Blacknose dace WH 6/15/2020 4 47-54 1.0-1.4 5.0 8.7 6.2 0.54
20-09-024 White sucker SF 6/15/2020 1 205 91.1 91.1 1.7 21.2 0.3620-09-025 White sucker SF 6/15/2020 1 222 131 131 3.2 16.5 0.5320-09-026 White sucker HV 6/15/2020 1 196 94.1 94.1 1.9 31.9 0.6120-09-027 White sucker HV 6/15/2020 1 172 65.3 65.3 1.6 37.3 0.6020-09-028 White sucker HV 6/15/2020 1 180 67.4 67.4 1.7 16.6 0.2820-09-029 White sucker WH 6/15/2020 3 104-121 13.5-20.8 52.4 6.0 19.8 1.220-09-030 White sucker WH 6/15/2020 3 145-148 35.1-38.6 111 5.8 27.6 1.620-09-031 White sucker WH 6/15/2020 2 143-147 34.4-36.8 71.2 4.6 27.6 1.320-09-032 White sucker WH 6/15/2020 2 132-140 28.3-32.2 60.5 5.4 19.3 1.020-09-033 White sucker WH 6/15/2020 2 139-144 30.7-38.3 69.0 5.6 12.1 0.6820-09-034 Longnose dace WH 6/15/2020 8 58-65 1.9-2.9 18.8 8.5 17.2 1.520-09-035 Longnose dace WH 6/15/2020 5 78-81 4.7-5.8 26.0 7.6 28.6 2.220-09-036 Longnose dace WH 6/15/2020 5 86-92 6.7-9.6 40.5 7.6 60.4 4.620-09-037 Longnose dace WH 6/15/2020 5 82-91 5.6-8.1 33.0 8.2 37.8 3.120-09-038 Longnose dace WH 6/15/2020 5 89-95 8.7-9.7 45.5 10.9 19.7 2.220-09-039 Blacknose dace WH 6/15/2020 10 46-51 0.8-1.4 12.5 9.0 7.4 0.6720-09-040 Blacknose dace WH 6/15/2020 7 45-54 0.9-1.7 9.4 9.1 8.6 0.7820-09-041 Blacknose dace WH 6/15/2020 3 77-81 5.2-5.6 16.3 3.5 27.3 0.9620-09-042 Blacknose dace WH 6/15/2020 3 75-82 4.6-6.0 15.9 5.4 55.7 3.020-09-043 Blacknose dace WH 6/15/2020 4 71-77 4.1-4.8 18.1 4.8 24.8 1.220-09-044 Blacknose dace WH 6/15/2020 4 68-76 3.6-4.6 16.4 5.6 63.8 3.620-09-045 Blacknose dace WH 6/15/2020 5 61-66 2.4-3.3 13.9 6.9 28.0 1.9
Station 8 - Valatie Kill Above Area 28
Station 9 - Valatie Kill At Area 28
G:\GE\PRJ\GE_Loeffel_Drainageways_RIFS\Reports and Presentations\2020\12-22 2020 Fish Report\Tables\DL_2020 Fish Report Tables 1 and 2 5/10
Percent
Lipids
Lipid-
Normalized
PCBs (mg/kg-
lipid)
Total
PCBs
(mg/kg)
Former Mead Road Pond Area
Weight
Range (g)
Total
Sample
Weight (g)
TABLE 2
SUMMARY OF 2020 BIOTA SAMPLE COLLECTIONS
DEWEY LOEFFEL LANDFILL SUPERFUND SITE
NASSAU, NEW YORK
Sample ID SpeciesPrep
Method
Collection
Date
No. of
Individuals
Size Range
(mm)
20-09-046 Creek chub WH 6/15/2020 1 87 7.2 7.2 6.9 20.3 1.420-09-047 Creek chub WH 6/15/2020 1 112 17.6 17.6 6.3 41.9 2.620-09-048 Creek chub WH 6/15/2020 1 127 25.3 25.3 -- -- --
20-10-001 White sucker SF 6/15/2020 1 241 175 175 3.0 25.3 0.7620-10-002 White sucker SF 6/15/2020 1 260 196 196 2.2 22.5 0.5020-10-003 White sucker SF 6/15/2020 1 246 164 164 2.1 28.0 0.5920-10-004 White sucker SF 6/15/2020 1 233 124 124 1.7 27.2 0.4620-10-005 White sucker SF 6/15/2020 1 226 126 126 2.6 21.4 0.5620-10-006 Brook trout SF 6/15/2020 1 215 115 115 3.4 12.1 0.4120-10-007 Brook trout SF 6/15/2020 1 216 110 110 3.6 15.7 0.5620-10-008 Brook trout SF 6/15/2020 1 263 223 223 4.0 49.0 2.020-10-009 Brook trout SF 6/15/2020 1 270 259 259 5.6 22.9 1.320-10-010 Brook trout SF 6/15/2020 1 210 107 107 4.2 18.2 0.7720-10-011 Longnose dace WH 6/15/2020 8 52-58 1.2-1.9 12.1 5.8 30.5 1.820-10-012 Longnose dace WH 6/15/2020 7 56-73 1.5-3.6 18.4 8.5 26.2 2.220-10-013 Longnose dace WH 6/15/2020 5 82-96 5.0-7.9 33.5 7.9 54.7 4.320-10-014 Longnose dace WH 6/15/2020 5 79-87 4.7-6.6 27.2 6.4 64.8 4.220-10-015 Longnose dace WH 6/15/2020 5 79-84 4.5-6.1 26.9 7.0 44.0 3.120-10-016 White sucker WH 6/15/2020 4 100-123 12.7-21.0 72.8 4.4 23.6 1.020-10-017 White sucker WH 6/15/2020 4 122-135 19.0-26.2 93.9 6.1 22.1 1.420-10-018 White sucker WH 6/15/2020 3 129-138 24.8-27.1 76.9 4.8 24.8 1.220-10-019 White sucker WH 6/15/2020 2 136-148 29.6-37.5 67.1 4.7 15.6 0.7320-10-020 White sucker WH 6/15/2020 2 150-150 36.5-39.8 76.3 4.8 21.3 1.020-10-021 Blacknose dace WH 6/15/2020 3 75-78 3.7-4.3 12.0 3.5 29.4 1.020-10-022 Blacknose dace WH 6/15/2020 6 52-57 1.2-1.9 9.5 9.3 6.1 0.5620-10-023 Blacknose dace WH 6/15/2020 6 45-50 0.8-1.1 5.7 8.7 8.2 0.71
Station 9 - Valatie Kill At Area 28
Station 10 - Valatie Kill Below Area 28
G:\GE\PRJ\GE_Loeffel_Drainageways_RIFS\Reports and Presentations\2020\12-22 2020 Fish Report\Tables\DL_2020 Fish Report Tables 1 and 2 6/10
Percent
Lipids
Lipid-
Normalized
PCBs (mg/kg-
lipid)
Total
PCBs
(mg/kg)
Former Mead Road Pond Area
Weight
Range (g)
Total
Sample
Weight (g)
TABLE 2
SUMMARY OF 2020 BIOTA SAMPLE COLLECTIONS
DEWEY LOEFFEL LANDFILL SUPERFUND SITE
NASSAU, NEW YORK
Sample ID SpeciesPrep
Method
Collection
Date
No. of
Individuals
Size Range
(mm)
20-11-100 Yellow perch SF 6/16/2020 1 248 181 181 0.57 60.4 0.3420-11-101 Yellow perch SF 6/16/2020 1 242 185 185 0.83 43.3 0.3620-11-102 Yellow perch SF 6/16/2020 1 255 204 204 1.4 8.1 0.1120-11-103 Yellow perch SF 6/16/2020 1 280 299 299 0.76 41.4 0.3220-11-104 Yellow perch SF 6/16/2020 1 255 212 212 0.76 67.2 0.5120-11-105 Yellow perch SF 6/16/2020 1 261 223 223 0.60 47.0 0.2820-11-106 Yellow perch SF 6/16/2020 1 242 172 172 0.76 37.4 0.2820-11-107 Yellow perch SF 6/16/2020 1 263 236 236 0.78 29.2 0.2320-11-108 Yellow perch SF 6/16/2020 1 268 223 223 0.92 44.8 0.4120-11-109 Yellow perch SF 6/16/2020 1 270 223 223 0.79 39.4 0.3120-11-110 Yellow perch SF 6/16/2020 1 257 222 222 0.63 49.2 0.3120-11-111 Yellow perch SF 6/16/2020 1 229 150 150 0.96 66.1 0.6420-11-112 Yellow perch SF 6/16/2020 1 244 187 187 1.3 96.2 1.320-11-113 Yellow perch SF 6/16/2020 1 245 195 195 0.94 43.5 0.4120-11-114 Yellow perch SF 6/16/2020 1 255 202 202 0.44 44.1 0.1920-11-115 Largemouth bass SF 6/16/2020 1 322 509 509 0.42 169 0.7120-11-116 Largemouth bass SF 6/16/2020 1 381 909 909 0.51 229 1.220-11-117 Largemouth bass SF 6/16/2020 1 341 613 613 0.26 213 0.5520-11-118 Largemouth bass SF 6/16/2020 1 418 1,250 1,250 0.56 489 2.720-11-119 Largemouth bass SF 6/16/2020 1 373 788 788 0.34 503 1.720-11-120 Largemouth bass SF 6/16/2020 1 357 712 712 0.54 92.8 0.5020-11-121 Largemouth bass SF 6/16/2020 1 347 617 617 0.83 153 1.320-11-122 Largemouth bass SF 6/16/2020 1 375 810 810 0.50 242 1.220-11-123 Largemouth bass SF 6/16/2020 1 455 1,382 1,382 0.34 785 2.720-11-124 Largemouth bass SF 6/16/2020 1 375 828 828 0.59 120 0.7120-11-125 Largemouth bass SF 6/16/2020 1 415 1,082 1,082 1.1 219 2.420-11-126 Largemouth bass SF 6/16/2020 1 360 741 741 0.35 366 1.3
Station 11 - Nassau Lake
G:\GE\PRJ\GE_Loeffel_Drainageways_RIFS\Reports and Presentations\2020\12-22 2020 Fish Report\Tables\DL_2020 Fish Report Tables 1 and 2 7/10
Percent
Lipids
Lipid-
Normalized
PCBs (mg/kg-
lipid)
Total
PCBs
(mg/kg)
Former Mead Road Pond Area
Weight
Range (g)
Total
Sample
Weight (g)
TABLE 2
SUMMARY OF 2020 BIOTA SAMPLE COLLECTIONS
DEWEY LOEFFEL LANDFILL SUPERFUND SITE
NASSAU, NEW YORK
Sample ID SpeciesPrep
Method
Collection
Date
No. of
Individuals
Size Range
(mm)
20-11-127 Largemouth bass SF 6/16/2020 1 352 738 738 0.58 86.6 0.5020-11-128 Largemouth bass SF 6/16/2020 1 393 908 908 0.39 533 2.120-11-129 Largemouth bass SF 6/16/2020 1 330 495 495 0.54 224 1.220-11-130 American eel M-HV 6/16/2020 1 638 515 515 12.1 21.7 2.620-11-131 Bluegill SF 6/16/2020 1 213 221 221 0.51 61.2 0.3120-11-132 Bluegill SF 6/16/2020 1 208 232 232 0.84 86.7 0.7320-11-133 Bluegill SF 6/16/2020 1 211 249 249 0.83 42.2 0.3520-11-134 Bluegill SF 6/16/2020 1 219 241 241 0.57 228 1.320-11-135 Bluegill SF 6/16/2020 1 211 236 236 1.9 60.5 1.220-11-136 Bluegill SF 6/16/2020 1 209 228 228 0.99 109 1.120-11-137 Bluegill SF 6/16/2020 1 216 257 257 1.0 105 1.120-11-138 Bluegill SF 6/16/2020 1 219 243 243 0.96 82.1 0.7920-11-139 Bluegill SF 6/16/2020 1 225 285 285 1.1 103 1.120-11-140 Bluegill SF 6/16/2020 1 220 256 256 0.79 157 1.220-11-141 Pumpkinseed SF 6/16/2020 1 193 177 177 0.77 63.5 0.4920-11-142 Pumpkinseed SF 6/16/2020 1 207 205 205 0.57 265 1.520-11-143 Pumpkinseed SF 6/16/2020 1 200 179 179 0.62 39.5 0.2520-11-144 Pumpkinseed SF 6/16/2020 1 205 198 198 0.68 133 0.9120-11-145 Pumpkinseed SF 6/16/2020 1 194 161 161 0.79 109 0.8620-11-146 Pumpkinseed SF 6/16/2020 1 197 174 174 0.89 36.4 0.3220-11-147 Pumpkinseed SF 6/16/2020 1 194 168 168 1.4 76.4 1.120-11-148 Pumpkinseed SF 6/16/2020 1 180 136 136 0.90 132 1.220-11-149 Pumpkinseed SF 6/16/2020 1 188 181 181 3.0 31.9 0.9620-11-150 Pumpkinseed SF 6/16/2020 1 200 214 214 0.88 46.3 0.4120-11-151 Brown bullhead SF* 6/16/2020 1 410 1,017 1,017 0.79 206 1.620-11-152 Brown bullhead SF* 6/16/2020 1 395 944 944 0.97 110 1.120-11-153 Brown bullhead SF* 6/16/2020 1 343 680 680 2.0 120 2.420-11-154 Brown bullhead SF* 6/16/2020 1 392 825 825 0.87 106 0.93
Station 11 - Nassau Lake
G:\GE\PRJ\GE_Loeffel_Drainageways_RIFS\Reports and Presentations\2020\12-22 2020 Fish Report\Tables\DL_2020 Fish Report Tables 1 and 2 8/10
Percent
Lipids
Lipid-
Normalized
PCBs (mg/kg-
lipid)
Total
PCBs
(mg/kg)
Former Mead Road Pond Area
Weight
Range (g)
Total
Sample
Weight (g)
TABLE 2
SUMMARY OF 2020 BIOTA SAMPLE COLLECTIONS
DEWEY LOEFFEL LANDFILL SUPERFUND SITE
NASSAU, NEW YORK
Sample ID SpeciesPrep
Method
Collection
Date
No. of
Individuals
Size Range
(mm)
20-11-155 Brown bullhead SF* 6/16/2020 1 401 824 824 0.76 149 1.120-11-156 Brown bullhead SF* 6/16/2020 1 392 926 926 0.67 303 2.020-11-157 Brown bullhead SF* 6/16/2020 1 394 880 880 0.48 260 1.320-11-158 Brown bullhead SF* 6/16/2020 1 399 942 942 1.6 119 1.920-11-159 Brown bullhead SF* 6/16/2020 1 397 973 973 3.8 137 5.220-11-160 Yellow bullhead SF* 6/16/2020 1 347 689 689 0.33 130 0.4320-11-161 Yellow bullhead SF* 6/16/2020 1 320 521 521 0.66 150 0.9920-11-162 Yellow bullhead SF* 6/16/2020 1 318 455 455 0.29 91.0 0.2620-11-163 Yellow bullhead SF* 6/16/2020 1 340 588 588 0.27 234 0.6320-11-164 Yellow bullhead SF* 6/16/2020 1 335 615 615 0.33 229 0.7620-11-165 Yellow bullhead SF* 6/16/2020 1 291 400 400 0.72 75.6 0.54
20-12-166 White sucker SF 6/16/2020 1 284 238 238 2.5 17.9 0.4520-12-167 White sucker SF 6/16/2020 1 271 230 230 3.0 14.6 0.4420-12-168 White sucker SF 6/16/2020 1 256 181 181 1.7 18.5 0.3220-12-169 White sucker SF 6/16/2020 1 201 80.0 80.0 2.1 13.1 0.2820-12-170 Brown bullhead SF* 6/16/2020 1 179 71.7 71.7 0.76 39.6 0.3020-12-171 Yellow bullhead SF* 6/16/2020 1 190 109 109 0.58 53.4 0.3120-12-172 Longnose dace WH 6/16/2020 5 95-106 9.3-13.4 54.2 8.8 23.1 2.020-12-173 Longnose dace WH 6/16/2020 5 85-96 7.1-9.3 42.4 8.3 22.2 1.820-12-174 Longnose dace WH 6/16/2020 5 80-87 4.8-7.0 28.9 7.2 44.0 3.220-12-175 Longnose dace WH 6/16/2020 8 67-73 2.9-4.2 27.2 7.3 21.1 1.520-12-176 Longnose dace WH 6/16/2020 10 58-64 1.6-2.9 23.1 6.1 18.5 1.120-12-177 White sucker WH 6/16/2020 4 137-141 26.7-29.6 113 3.2 14.3 0.4620-12-178 White sucker WH 6/16/2020 3 128-133 21.3-24.8 67.5 2.9 12.5 0.3620-12-179 White sucker WH 6/16/2020 3 123-134 19.9-24.5 67.8 3.7 13.1 0.4920-12-180 White sucker WH 6/16/2020 3 104-105 11.0-12.8 35.1 2.2 19.2 0.4220-12-181 White sucker WH 6/16/2020 2 92-95 8.8-9.5 18.3 2.9 16.8 0.49
Station 12 - Valatie Kill Below Nassau Lake Above County Route 7
Station 11 - Nassau Lake
G:\GE\PRJ\GE_Loeffel_Drainageways_RIFS\Reports and Presentations\2020\12-22 2020 Fish Report\Tables\DL_2020 Fish Report Tables 1 and 2 9/10
Percent
Lipids
Lipid-
Normalized
PCBs (mg/kg-
lipid)
Total
PCBs
(mg/kg)
Former Mead Road Pond Area
Weight
Range (g)
Total
Sample
Weight (g)
TABLE 2
SUMMARY OF 2020 BIOTA SAMPLE COLLECTIONS
DEWEY LOEFFEL LANDFILL SUPERFUND SITE
NASSAU, NEW YORK
Sample ID SpeciesPrep
Method
Collection
Date
No. of
Individuals
Size Range
(mm)
20-12-182 Cutlips minnow WH 6/16/2020 3 105-110 14.8-17.4 49.5 6.4 25.6 1.620-12-183 Cutlips minnow WH 6/16/2020 3 106-110 14.8-17.9 50.2 8.0 21.0 1.720-12-184 Cutlips minnow WH 6/16/2020 3 85-89 7.5-8.2 23.8 4.0 34.3 1.420-12-185 Cutlips minnow WH 6/16/2020 2 94-95 9.9-11.7 21.6 6.5 26.5 1.720-12-186 Cutlips minnow WH 6/16/2020 2 90-96 9.5-10.6 20.1 3.5 40.9 1.4
Notes:1. The 2020 fish sample data information are for samples collected during June 15 and 16, 2020.2. Sample 20-09-048 was not analyzed due to laboratory error.
4. Total sample weight rounded to the nearest gram when above 100 grams.5. Units:
g - grams mg/kg - lipid - milligrams per kilogram lipid (wet-weight basis)mg/kg - milligrams per kilogram (wet-weight basis) mm - millimeters
6. Preparation methods: HV - Head and viscera removed SF* - Skin-off fillet (brown and yellow bullhead)M-HV - Whole-body minus head, skin, and viscera (American eel) WH - Whole body, individual or composite SF - Skin-on fillet
J - Estimated concentration above the adjusted method detection limit and below the adjusted reporting limit.
3. Total PCBs and Lipid-normalized PCBs concentrations are rounded to two significant digits for values below 10 and three significant digits for values greater than 10.
Station 12 - Valatie Kill Below Nassau Lake Above County Route 7
7. Lab qualifier:
U - Not detected. Sample method detection limit is provided.
G:\GE\PRJ\GE_Loeffel_Drainageways_RIFS\Reports and Presentations\2020\12-22 2020 Fish Report\Tables\DL_2020 Fish Report Tables 1 and 2 10/10
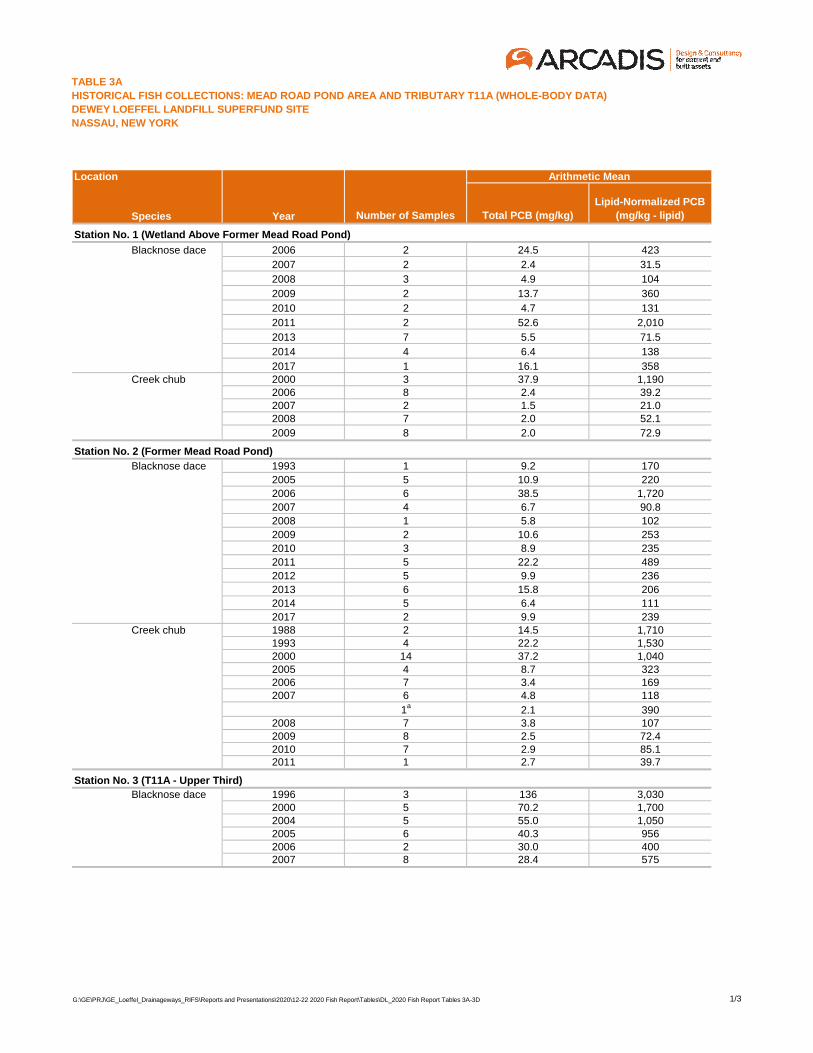
TABLE 3A
HISTORICAL FISH COLLECTIONS: MEAD ROAD POND AREA AND TRIBUTARY T11A (WHOLE-BODY DATA)
DEWEY LOEFFEL LANDFILL SUPERFUND SITE
NASSAU, NEW YORK
Location Arithmetic Mean
Species Year Number of Samples Total PCB (mg/kg)
Lipid-Normalized PCB
(mg/kg - lipid)
Station No. 1 (Wetland Above Former Mead Road Pond)
Blacknose dace 2006 2 24.5 423
2007 2 2.4 31.5
2008 3 4.9 104
2009 2 13.7 360
2010 2 4.7 131
2011 2 52.6 2,010
2013 7 5.5 71.5
2014 4 6.4 138
2017 1 16.1 358Creek chub 2000 3 37.9 1,190
2006 8 2.4 39.22007 2 1.5 21.02008 7 2.0 52.1
2009 8 2.0 72.9
Blacknose dace 1993 1 9.2 170
2005 5 10.9 220
2006 6 38.5 1,720
2007 4 6.7 90.8
2008 1 5.8 102
2009 2 10.6 253
2010 3 8.9 235
2011 5 22.2 489
2012 5 9.9 236
2013 6 15.8 206
2014 5 6.4 111
2017 2 9.9 239Creek chub 1988 2 14.5 1,710
1993 4 22.2 1,5302000 14 37.2 1,0402005 4 8.7 3232006 7 3.4 1692007 6 4.8 118
1a
2.1 3902008 7 3.8 1072009 8 2.5 72.42010 7 2.9 85.12011 1 2.7 39.7
Blacknose dace 1996 3 136 3,0302000 5 70.2 1,7002004 5 55.0 1,0502005 6 40.3 9562006 2 30.0 4002007 8 28.4 575
Station No. 3 (T11A - Upper Third)
Station No. 2 (Former Mead Road Pond)
G:\GE\PRJ\GE_Loeffel_Drainageways_RIFS\Reports and Presentations\2020\12-22 2020 Fish Report\Tables\DL_2020 Fish Report Tables 3A-3D 1/3
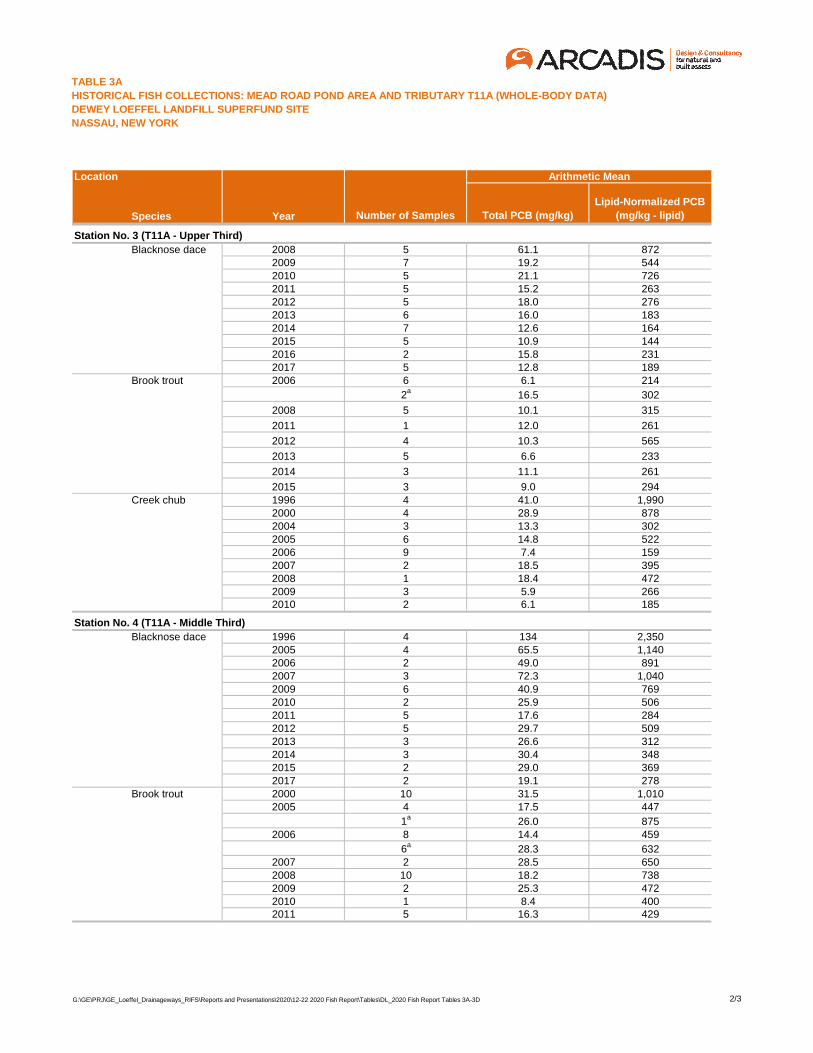
TABLE 3A
HISTORICAL FISH COLLECTIONS: MEAD ROAD POND AREA AND TRIBUTARY T11A (WHOLE-BODY DATA)
DEWEY LOEFFEL LANDFILL SUPERFUND SITE
NASSAU, NEW YORK
Location Arithmetic Mean
Species Year Number of Samples Total PCB (mg/kg)
Lipid-Normalized PCB
(mg/kg - lipid)
Blacknose dace 2008 5 61.1 8722009 7 19.2 5442010 5 21.1 7262011 5 15.2 2632012 5 18.0 2762013 6 16.0 1832014 7 12.6 1642015 5 10.9 1442016 2 15.8 2312017 5 12.8 189
Brook trout 2006 6 6.1 214
2a16.5 302
2008 5 10.1 315
2011 1 12.0 261
2012 4 10.3 565
2013 5 6.6 233
2014 3 11.1 261
2015 3 9.0 294Creek chub 1996 4 41.0 1,990
2000 4 28.9 8782004 3 13.3 3022005 6 14.8 5222006 9 7.4 1592007 2 18.5 3952008 1 18.4 4722009 3 5.9 2662010 2 6.1 185
Blacknose dace 1996 4 134 2,3502005 4 65.5 1,1402006 2 49.0 8912007 3 72.3 1,0402009 6 40.9 7692010 2 25.9 5062011 5 17.6 2842012 5 29.7 5092013 3 26.6 3122014 3 30.4 3482015 2 29.0 3692017 2 19.1 278
Brook trout 2000 10 31.5 1,0102005 4 17.5 447
1a26.0 875
2006 8 14.4 459
6a
28.3 6322007 2 28.5 6502008 10 18.2 7382009 2 25.3 4722010 1 8.4 4002011 5 16.3 429
Station No. 4 (T11A - Middle Third)
Station No. 3 (T11A - Upper Third)
G:\GE\PRJ\GE_Loeffel_Drainageways_RIFS\Reports and Presentations\2020\12-22 2020 Fish Report\Tables\DL_2020 Fish Report Tables 3A-3D 2/3
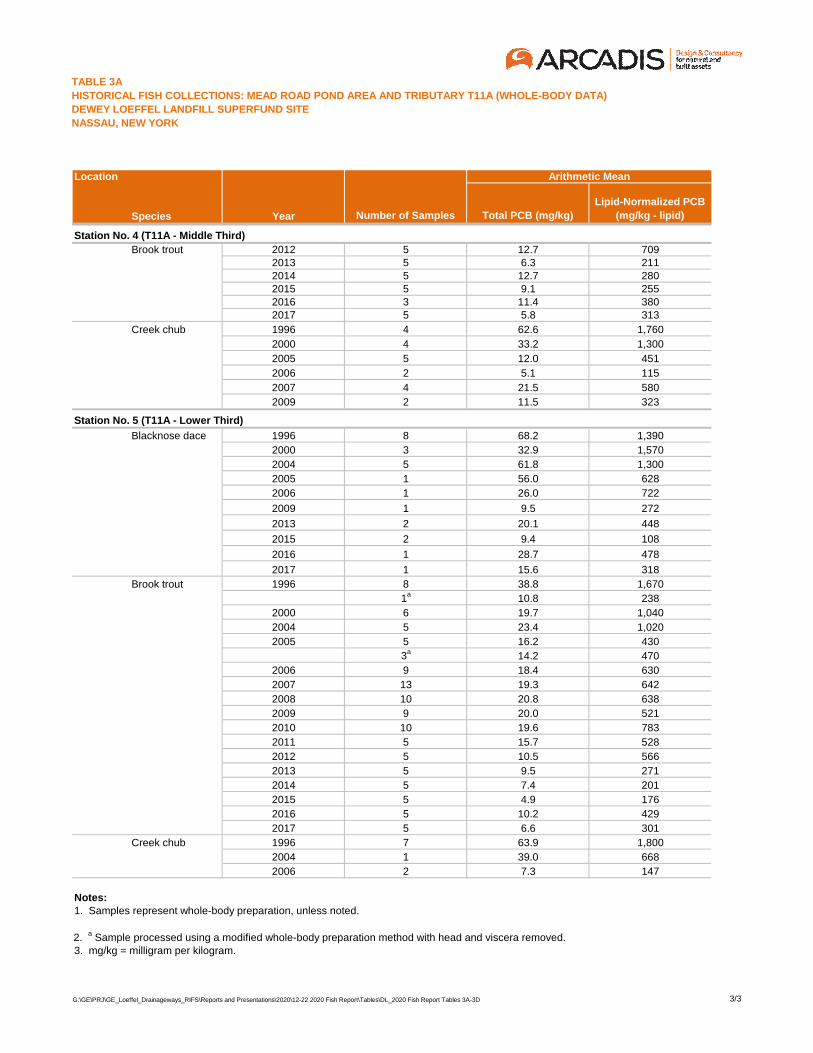
TABLE 3A
HISTORICAL FISH COLLECTIONS: MEAD ROAD POND AREA AND TRIBUTARY T11A (WHOLE-BODY DATA)
DEWEY LOEFFEL LANDFILL SUPERFUND SITE
NASSAU, NEW YORK
Location Arithmetic Mean
Species Year Number of Samples Total PCB (mg/kg)
Lipid-Normalized PCB
(mg/kg - lipid)
Brook trout 2012 5 12.7 7092013 5 6.3 2112014 5 12.7 2802015 5 9.1 2552016 3 11.4 3802017 5 5.8 313
Creek chub 1996 4 62.6 1,760
2000 4 33.2 1,300
2005 5 12.0 451
2006 2 5.1 115
2007 4 21.5 580
2009 2 11.5 323
Blacknose dace 1996 8 68.2 1,390
2000 3 32.9 1,570
2004 5 61.8 1,300
2005 1 56.0 628
2006 1 26.0 722
2009 1 9.5 272
2013 2 20.1 448
2015 2 9.4 108
2016 1 28.7 478
2017 1 15.6 318
Brook trout 1996 8 38.8 1,670
1a10.8 238
2000 6 19.7 1,040
2004 5 23.4 1,020
2005 5 16.2 430
3a
14.2 470
2006 9 18.4 630
2007 13 19.3 642
2008 10 20.8 638
2009 9 20.0 521
2010 10 19.6 783
2011 5 15.7 528
2012 5 10.5 566
2013 5 9.5 271
2014 5 7.4 201
2015 5 4.9 176
2016 5 10.2 429
2017 5 6.6 301
Creek chub 1996 7 63.9 1,800
2004 1 39.0 668
2006 2 7.3 147
Notes:
3. mg/kg = milligram per kilogram.2. a Sample processed using a modified whole-body preparation method with head and viscera removed.
1. Samples represent whole-body preparation, unless noted.
Station No. 4 (T11A - Middle Third)
Station No. 5 (T11A - Lower Third)
G:\GE\PRJ\GE_Loeffel_Drainageways_RIFS\Reports and Presentations\2020\12-22 2020 Fish Report\Tables\DL_2020 Fish Report Tables 3A-3D 3/3
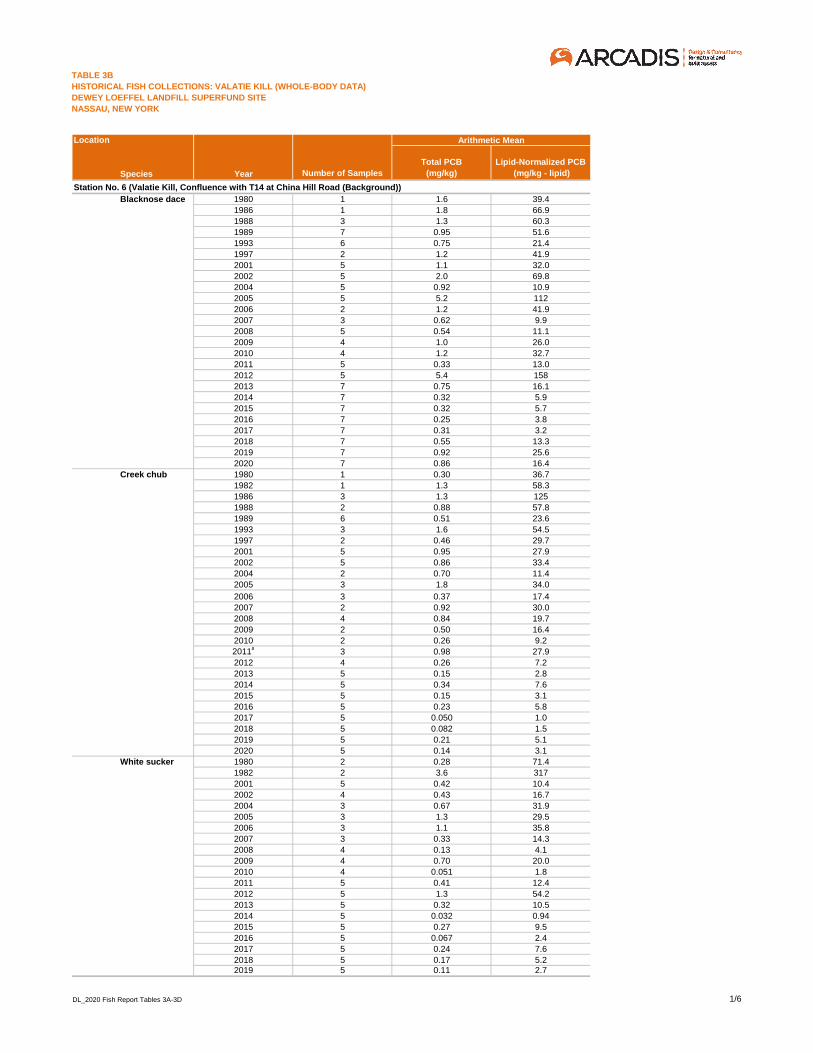
TABLE 3B
HISTORICAL FISH COLLECTIONS: VALATIE KILL (WHOLE-BODY DATA)
DEWEY LOEFFEL LANDFILL SUPERFUND SITE
NASSAU, NEW YORK
Arithmetic Mean
Species Year Number of Samples
Total PCB
(mg/kg)
Lipid-Normalized PCB
(mg/kg - lipid)
Station No. 6 (Valatie Kill, Confluence with T14 at China Hill Road (Background))
Blacknose dace 1980 1 1.6 39.4
1986 1 1.8 66.9
1988 3 1.3 60.3
1989 7 0.95 51.6
1993 6 0.75 21.4
1997 2 1.2 41.9
2001 5 1.1 32.0
2002 5 2.0 69.8
2004 5 0.92 10.9
2005 5 5.2 112
2006 2 1.2 41.9
2007 3 0.62 9.9
2008 5 0.54 11.1
2009 4 1.0 26.0
2010 4 1.2 32.7
2011 5 0.33 13.0
2012 5 5.4 158
2013 7 0.75 16.1
2014 7 0.32 5.9
2015 7 0.32 5.7
2016 7 0.25 3.8
2017 7 0.31 3.2
2018 7 0.55 13.3
2019 7 0.92 25.6
2020 7 0.86 16.4
Creek chub 1980 1 0.30 36.7
1982 1 1.3 58.3
1986 3 1.3 125
1988 2 0.88 57.8
1989 6 0.51 23.6
1993 3 1.6 54.5
1997 2 0.46 29.7
2001 5 0.95 27.9
2002 5 0.86 33.4
2004 2 0.70 11.4
2005 3 1.8 34.0
2006 3 0.37 17.4
2007 2 0.92 30.0
2008 4 0.84 19.7
2009 2 0.50 16.4
2010 2 0.26 9.2
2011a3 0.98 27.9
2012 4 0.26 7.2
2013 5 0.15 2.8
2014 5 0.34 7.6
2015 5 0.15 3.1
2016 5 0.23 5.8
2017 5 0.050 1.0
2018 5 0.082 1.5
2019 5 0.21 5.1
2020 5 0.14 3.1
White sucker 1980 2 0.28 71.4
1982 2 3.6 317
2001 5 0.42 10.4
2002 4 0.43 16.7
2004 3 0.67 31.9
2005 3 1.3 29.5
2006 3 1.1 35.8
2007 3 0.33 14.3
2008 4 0.13 4.1
2009 4 0.70 20.0
2010 4 0.051 1.8
2011 5 0.41 12.4
2012 5 1.3 54.2
2013 5 0.32 10.5
2014 5 0.032 0.94
2015 5 0.27 9.5
2016 5 0.067 2.4
2017 5 0.24 7.6
2018 5 0.17 5.22019 5 0.11 2.7
Location
DL_2020 Fish Report Tables 3A-3D 1/6
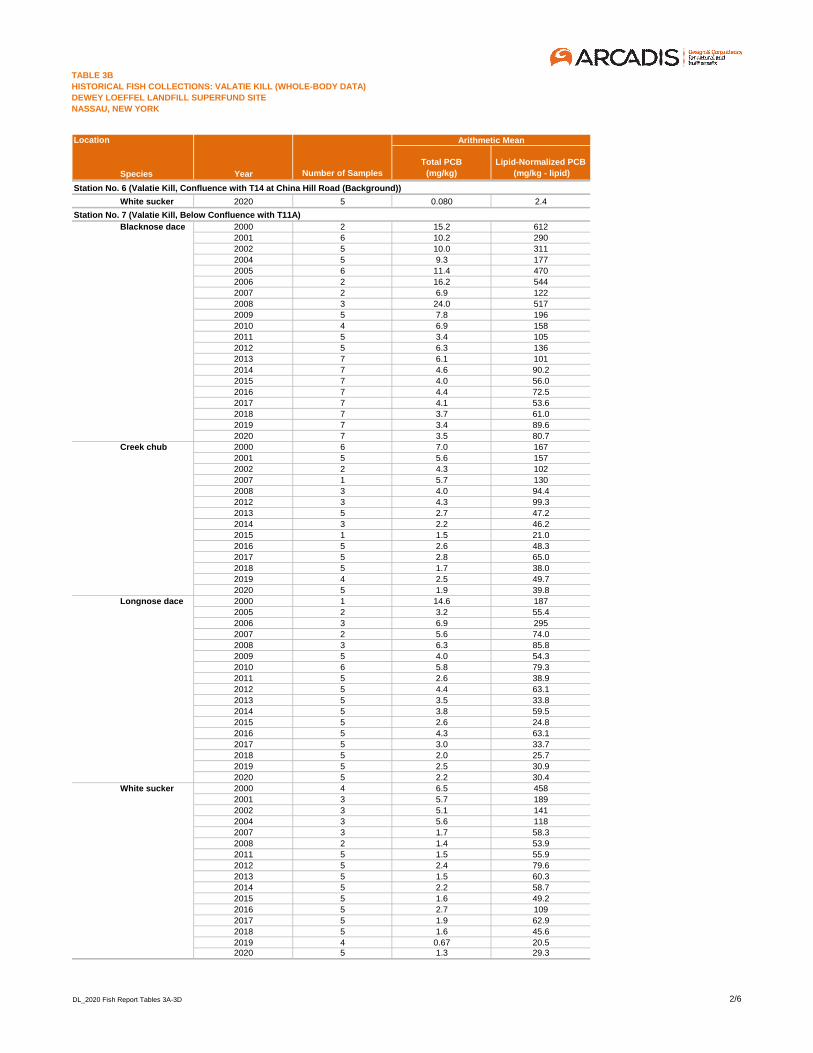
TABLE 3B
HISTORICAL FISH COLLECTIONS: VALATIE KILL (WHOLE-BODY DATA)
DEWEY LOEFFEL LANDFILL SUPERFUND SITE
NASSAU, NEW YORK
Arithmetic Mean
Species Year Number of Samples
Total PCB
(mg/kg)
Lipid-Normalized PCB
(mg/kg - lipid)
Location
Station No. 6 (Valatie Kill, Confluence with T14 at China Hill Road (Background))
White sucker 2020 5 0.080 2.4
Station No. 7 (Valatie Kill, Below Confluence with T11A)
Blacknose dace 2000 2 15.2 612
2001 6 10.2 290
2002 5 10.0 311
2004 5 9.3 177
2005 6 11.4 470
2006 2 16.2 544
2007 2 6.9 122
2008 3 24.0 517
2009 5 7.8 196
2010 4 6.9 158
2011 5 3.4 105
2012 5 6.3 136
2013 7 6.1 101
2014 7 4.6 90.2
2015 7 4.0 56.0
2016 7 4.4 72.5
2017 7 4.1 53.6
2018 7 3.7 61.0
2019 7 3.4 89.6
2020 7 3.5 80.7
Creek chub 2000 6 7.0 167
2001 5 5.6 157
2002 2 4.3 102
2007 1 5.7 130
2008 3 4.0 94.4
2012 3 4.3 99.3
2013 5 2.7 47.2
2014 3 2.2 46.2
2015 1 1.5 21.0
2016 5 2.6 48.3
2017 5 2.8 65.0
2018 5 1.7 38.0
2019 4 2.5 49.7
2020 5 1.9 39.8
Longnose dace 2000 1 14.6 187
2005 2 3.2 55.4
2006 3 6.9 295
2007 2 5.6 74.0
2008 3 6.3 85.8
2009 5 4.0 54.3
2010 6 5.8 79.3
2011 5 2.6 38.9
2012 5 4.4 63.1
2013 5 3.5 33.8
2014 5 3.8 59.5
2015 5 2.6 24.8
2016 5 4.3 63.1
2017 5 3.0 33.7
2018 5 2.0 25.7
2019 5 2.5 30.9
2020 5 2.2 30.4
White sucker 2000 4 6.5 458
2001 3 5.7 189
2002 3 5.1 141
2004 3 5.6 118
2007 3 1.7 58.3
2008 2 1.4 53.9
2011 5 1.5 55.9
2012 5 2.4 79.6
2013 5 1.5 60.3
2014 5 2.2 58.7
2015 5 1.6 49.2
2016 5 2.7 109
2017 5 1.9 62.9
2018 5 1.6 45.6
2019 4 0.67 20.52020 5 1.3 29.3
DL_2020 Fish Report Tables 3A-3D 2/6
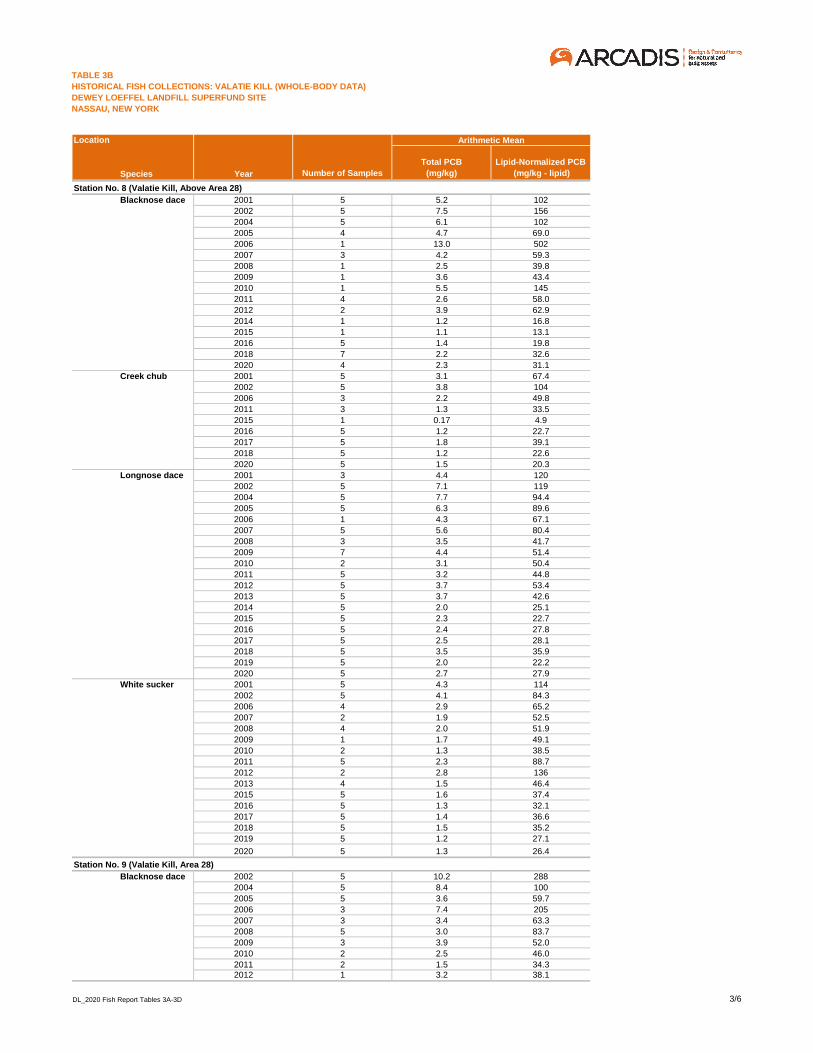
TABLE 3B
HISTORICAL FISH COLLECTIONS: VALATIE KILL (WHOLE-BODY DATA)
DEWEY LOEFFEL LANDFILL SUPERFUND SITE
NASSAU, NEW YORK
Arithmetic Mean
Species Year Number of Samples
Total PCB
(mg/kg)
Lipid-Normalized PCB
(mg/kg - lipid)
Location
Station No. 8 (Valatie Kill, Above Area 28)
Blacknose dace 2001 5 5.2 102
2002 5 7.5 156
2004 5 6.1 102
2005 4 4.7 69.0
2006 1 13.0 502
2007 3 4.2 59.3
2008 1 2.5 39.8
2009 1 3.6 43.4
2010 1 5.5 145
2011 4 2.6 58.0
2012 2 3.9 62.9
2014 1 1.2 16.8
2015 1 1.1 13.1
2016 5 1.4 19.8
2018 7 2.2 32.6
2020 4 2.3 31.1
Creek chub 2001 5 3.1 67.4
2002 5 3.8 104
2006 3 2.2 49.8
2011 3 1.3 33.5
2015 1 0.17 4.9
2016 5 1.2 22.7
2017 5 1.8 39.1
2018 5 1.2 22.6
2020 5 1.5 20.3
Longnose dace 2001 3 4.4 120
2002 5 7.1 119
2004 5 7.7 94.4
2005 5 6.3 89.6
2006 1 4.3 67.1
2007 5 5.6 80.4
2008 3 3.5 41.7
2009 7 4.4 51.4
2010 2 3.1 50.4
2011 5 3.2 44.8
2012 5 3.7 53.4
2013 5 3.7 42.6
2014 5 2.0 25.1
2015 5 2.3 22.7
2016 5 2.4 27.8
2017 5 2.5 28.1
2018 5 3.5 35.9
2019 5 2.0 22.2
2020 5 2.7 27.9
White sucker 2001 5 4.3 114
2002 5 4.1 84.3
2006 4 2.9 65.2
2007 2 1.9 52.5
2008 4 2.0 51.9
2009 1 1.7 49.1
2010 2 1.3 38.5
2011 5 2.3 88.7
2012 2 2.8 136
2013 4 1.5 46.4
2015 5 1.6 37.4
2016 5 1.3 32.1
2017 5 1.4 36.6
2018 5 1.5 35.2
2019 5 1.2 27.1
2020 5 1.3 26.4
Station No. 9 (Valatie Kill, Area 28)
Blacknose dace 2002 5 10.2 288
2004 5 8.4 100
2005 5 3.6 59.7
2006 3 7.4 205
2007 3 3.4 63.3
2008 5 3.0 83.7
2009 3 3.9 52.0
2010 2 2.5 46.0
2011 2 1.5 34.32012 1 3.2 38.1
DL_2020 Fish Report Tables 3A-3D 3/6
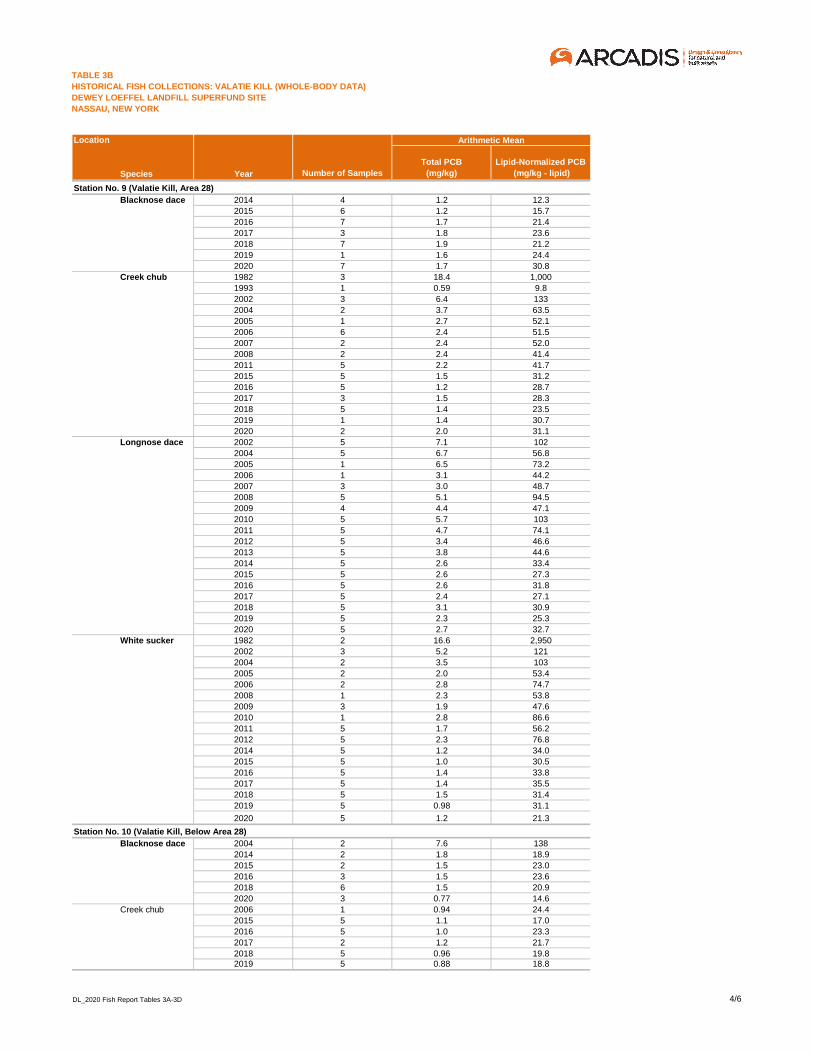
TABLE 3B
HISTORICAL FISH COLLECTIONS: VALATIE KILL (WHOLE-BODY DATA)
DEWEY LOEFFEL LANDFILL SUPERFUND SITE
NASSAU, NEW YORK
Arithmetic Mean
Species Year Number of Samples
Total PCB
(mg/kg)
Lipid-Normalized PCB
(mg/kg - lipid)
Location
Station No. 9 (Valatie Kill, Area 28)
Blacknose dace 2014 4 1.2 12.3
2015 6 1.2 15.7
2016 7 1.7 21.4
2017 3 1.8 23.6
2018 7 1.9 21.2
2019 1 1.6 24.4
2020 7 1.7 30.8
Creek chub 1982 3 18.4 1,000
1993 1 0.59 9.8
2002 3 6.4 133
2004 2 3.7 63.5
2005 1 2.7 52.1
2006 6 2.4 51.5
2007 2 2.4 52.0
2008 2 2.4 41.4
2011 5 2.2 41.7
2015 5 1.5 31.2
2016 5 1.2 28.7
2017 3 1.5 28.3
2018 5 1.4 23.5
2019 1 1.4 30.7
2020 2 2.0 31.1
Longnose dace 2002 5 7.1 102
2004 5 6.7 56.8
2005 1 6.5 73.2
2006 1 3.1 44.2
2007 3 3.0 48.7
2008 5 5.1 94.5
2009 4 4.4 47.1
2010 5 5.7 103
2011 5 4.7 74.1
2012 5 3.4 46.6
2013 5 3.8 44.6
2014 5 2.6 33.4
2015 5 2.6 27.3
2016 5 2.6 31.8
2017 5 2.4 27.1
2018 5 3.1 30.9
2019 5 2.3 25.3
2020 5 2.7 32.7
White sucker 1982 2 16.6 2,950
2002 3 5.2 121
2004 2 3.5 103
2005 2 2.0 53.4
2006 2 2.8 74.7
2008 1 2.3 53.8
2009 3 1.9 47.6
2010 1 2.8 86.6
2011 5 1.7 56.2
2012 5 2.3 76.8
2014 5 1.2 34.0
2015 5 1.0 30.5
2016 5 1.4 33.8
2017 5 1.4 35.5
2018 5 1.5 31.4
2019 5 0.98 31.1
2020 5 1.2 21.3
Station No. 10 (Valatie Kill, Below Area 28)
Blacknose dace 2004 2 7.6 138
2014 2 1.8 18.9
2015 2 1.5 23.0
2016 3 1.5 23.6
2018 6 1.5 20.9
2020 3 0.77 14.6
Creek chub 2006 1 0.94 24.4
2015 5 1.1 17.0
2016 5 1.0 23.3
2017 2 1.2 21.7
2018 5 0.96 19.82019 5 0.88 18.8
DL_2020 Fish Report Tables 3A-3D 4/6
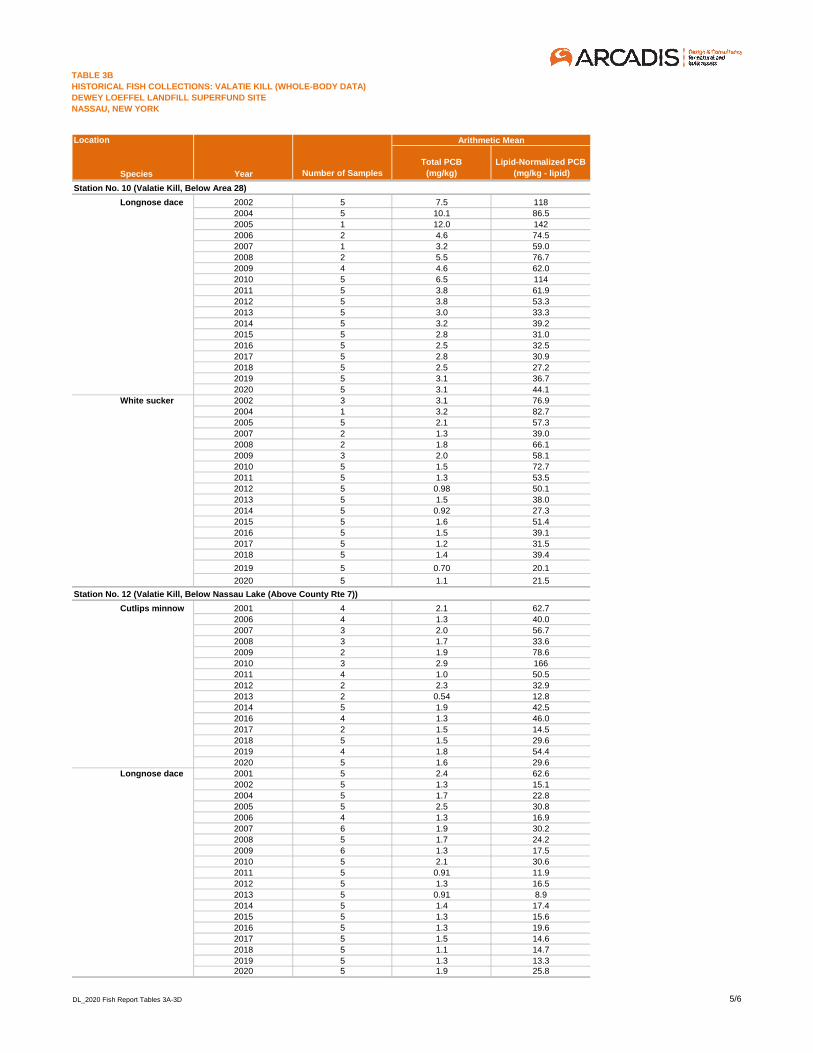
TABLE 3B
HISTORICAL FISH COLLECTIONS: VALATIE KILL (WHOLE-BODY DATA)
DEWEY LOEFFEL LANDFILL SUPERFUND SITE
NASSAU, NEW YORK
Arithmetic Mean
Species Year Number of Samples
Total PCB
(mg/kg)
Lipid-Normalized PCB
(mg/kg - lipid)
Location
Station No. 10 (Valatie Kill, Below Area 28)
Longnose dace 2002 5 7.5 118
2004 5 10.1 86.5
2005 1 12.0 142
2006 2 4.6 74.5
2007 1 3.2 59.0
2008 2 5.5 76.7
2009 4 4.6 62.0
2010 5 6.5 114
2011 5 3.8 61.9
2012 5 3.8 53.3
2013 5 3.0 33.3
2014 5 3.2 39.2
2015 5 2.8 31.0
2016 5 2.5 32.5
2017 5 2.8 30.9
2018 5 2.5 27.2
2019 5 3.1 36.7
2020 5 3.1 44.1
White sucker 2002 3 3.1 76.9
2004 1 3.2 82.7
2005 5 2.1 57.3
2007 2 1.3 39.0
2008 2 1.8 66.1
2009 3 2.0 58.1
2010 5 1.5 72.7
2011 5 1.3 53.5
2012 5 0.98 50.1
2013 5 1.5 38.0
2014 5 0.92 27.3
2015 5 1.6 51.4
2016 5 1.5 39.1
2017 5 1.2 31.5
2018 5 1.4 39.4
2019 5 0.70 20.1
2020 5 1.1 21.5
Station No. 12 (Valatie Kill, Below Nassau Lake (Above County Rte 7))
Cutlips minnow 2001 4 2.1 62.7
2006 4 1.3 40.0
2007 3 2.0 56.7
2008 3 1.7 33.6
2009 2 1.9 78.6
2010 3 2.9 166
2011 4 1.0 50.5
2012 2 2.3 32.9
2013 2 0.54 12.8
2014 5 1.9 42.5
2016 4 1.3 46.0
2017 2 1.5 14.5
2018 5 1.5 29.6
2019 4 1.8 54.4
2020 5 1.6 29.6
Longnose dace 2001 5 2.4 62.6
2002 5 1.3 15.1
2004 5 1.7 22.8
2005 5 2.5 30.8
2006 4 1.3 16.9
2007 6 1.9 30.2
2008 5 1.7 24.2
2009 6 1.3 17.5
2010 5 2.1 30.6
2011 5 0.91 11.9
2012 5 1.3 16.5
2013 5 0.91 8.9
2014 5 1.4 17.4
2015 5 1.3 15.6
2016 5 1.3 19.6
2017 5 1.5 14.6
2018 5 1.1 14.7
2019 5 1.3 13.32020 5 1.9 25.8
DL_2020 Fish Report Tables 3A-3D 5/6
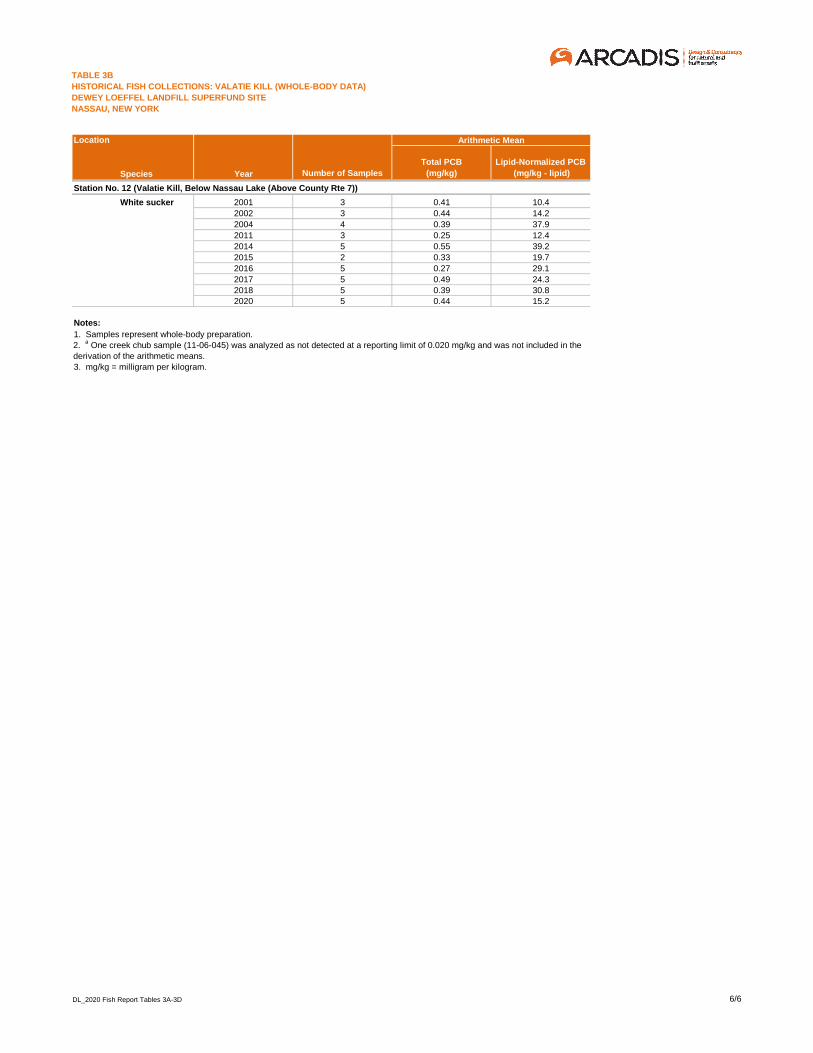
TABLE 3B
HISTORICAL FISH COLLECTIONS: VALATIE KILL (WHOLE-BODY DATA)
DEWEY LOEFFEL LANDFILL SUPERFUND SITE
NASSAU, NEW YORK
Arithmetic Mean
Species Year Number of Samples
Total PCB
(mg/kg)
Lipid-Normalized PCB
(mg/kg - lipid)
Location
Station No. 12 (Valatie Kill, Below Nassau Lake (Above County Rte 7))
White sucker 2001 3 0.41 10.4
2002 3 0.44 14.2
2004 4 0.39 37.9
2011 3 0.25 12.4
2014 5 0.55 39.2
2015 2 0.33 19.7
2016 5 0.27 29.1
2017 5 0.49 24.3
2018 5 0.39 30.8
2020 5 0.44 15.2
Notes:
3. mg/kg = milligram per kilogram.
1. Samples represent whole-body preparation.
2. a One creek chub sample (11-06-045) was analyzed as not detected at a reporting limit of 0.020 mg/kg and was not included in the
derivation of the arithmetic means.
DL_2020 Fish Report Tables 3A-3D 6/6
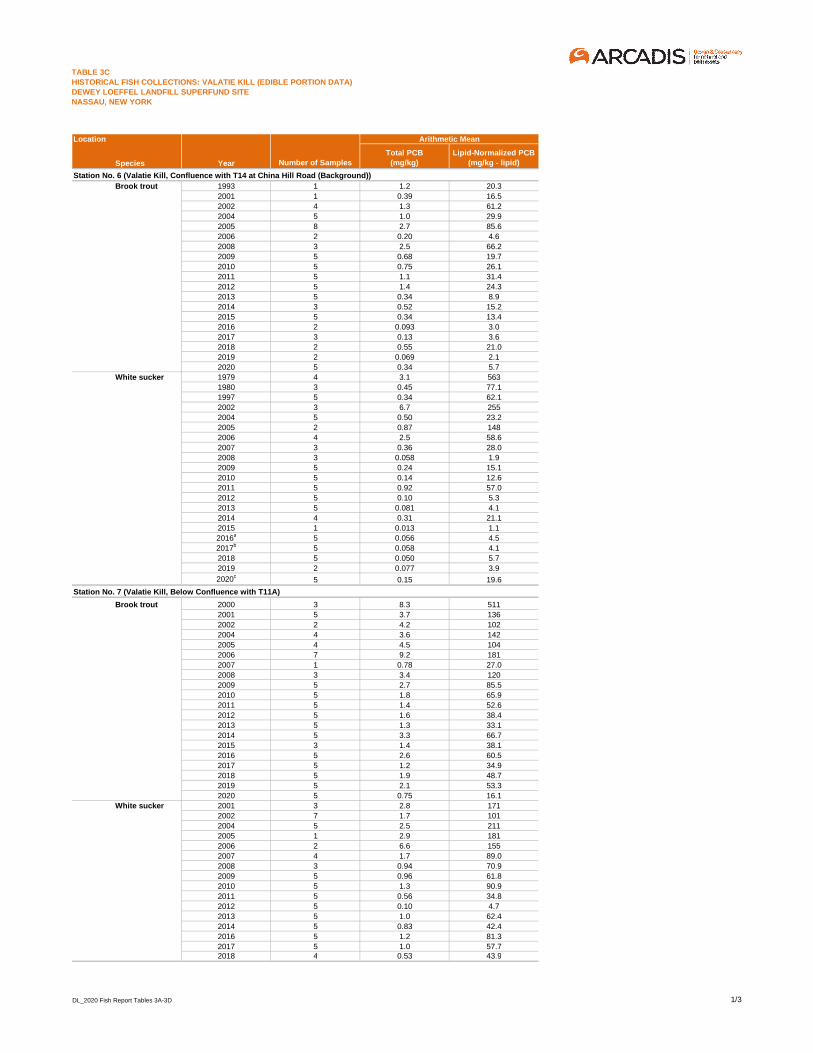
TABLE 3C
HISTORICAL FISH COLLECTIONS: VALATIE KILL (EDIBLE PORTION DATA)
DEWEY LOEFFEL LANDFILL SUPERFUND SITE
NASSAU, NEW YORK
Location Arithmetic Mean
Species Year Number of Samples
Total PCB
(mg/kg)
Lipid-Normalized PCB
(mg/kg - lipid)
Station No. 6 (Valatie Kill, Confluence with T14 at China Hill Road (Background))
Brook trout 1993 1 1.2 20.3
2001 1 0.39 16.5
2002 4 1.3 61.2
2004 5 1.0 29.9
2005 8 2.7 85.6
2006 2 0.20 4.6
2008 3 2.5 66.2
2009 5 0.68 19.7
2010 5 0.75 26.1
2011 5 1.1 31.4
2012 5 1.4 24.3
2013 5 0.34 8.9
2014 3 0.52 15.2
2015 5 0.34 13.4
2016 2 0.093 3.0
2017 3 0.13 3.6
2018 2 0.55 21.0
2019 2 0.069 2.1
2020 5 0.34 5.7
White sucker 1979 4 3.1 563
1980 3 0.45 77.1
1997 5 0.34 62.1
2002 3 6.7 255
2004 5 0.50 23.2
2005 2 0.87 148
2006 4 2.5 58.6
2007 3 0.36 28.0
2008 3 0.058 1.9
2009 5 0.24 15.1
2010 5 0.14 12.6
2011 5 0.92 57.0
2012 5 0.10 5.3
2013 5 0.081 4.1
2014 4 0.31 21.1
2015 1 0.013 1.1
2016a 5 0.056 4.5
2017b 5 0.058 4.1
2018 5 0.050 5.7
2019 2 0.077 3.9
2020c5 0.15 19.6
Station No. 7 (Valatie Kill, Below Confluence with T11A)
Brook trout 2000 3 8.3 511
2001 5 3.7 136
2002 2 4.2 102
2004 4 3.6 142
2005 4 4.5 104
2006 7 9.2 181
2007 1 0.78 27.0
2008 3 3.4 120
2009 5 2.7 85.5
2010 5 1.8 65.9
2011 5 1.4 52.6
2012 5 1.6 38.4
2013 5 1.3 33.1
2014 5 3.3 66.7
2015 3 1.4 38.1
2016 5 2.6 60.5
2017 5 1.2 34.9
2018 5 1.9 48.7
2019 5 2.1 53.3
2020 5 0.75 16.1
White sucker 2001 3 2.8 171
2002 7 1.7 101
2004 5 2.5 211
2005 1 2.9 181
2006 2 6.6 155
2007 4 1.7 89.0
2008 3 0.94 70.9
2009 5 0.96 61.8
2010 5 1.3 90.9
2011 5 0.56 34.8
2012 5 0.10 4.7
2013 5 1.0 62.4
2014 5 0.83 42.4
2016 5 1.2 81.3
2017 5 1.0 57.72018 4 0.53 43.9
DL_2020 Fish Report Tables 3A-3D 1/3
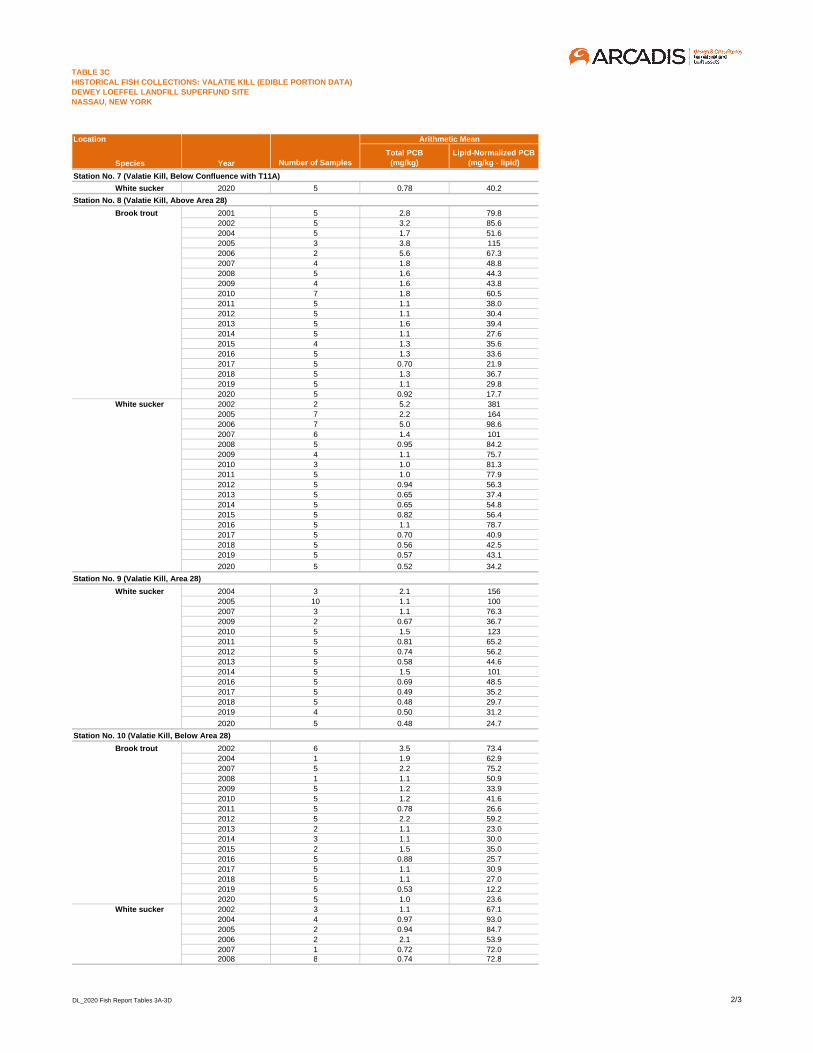
TABLE 3C
HISTORICAL FISH COLLECTIONS: VALATIE KILL (EDIBLE PORTION DATA)
DEWEY LOEFFEL LANDFILL SUPERFUND SITE
NASSAU, NEW YORK
Location Arithmetic Mean
Species Year Number of Samples
Total PCB
(mg/kg)
Lipid-Normalized PCB
(mg/kg - lipid)
Station No. 7 (Valatie Kill, Below Confluence with T11A)
White sucker 2020 5 0.78 40.2
Station No. 8 (Valatie Kill, Above Area 28)
Brook trout 2001 5 2.8 79.8
2002 5 3.2 85.6
2004 5 1.7 51.6
2005 3 3.8 115
2006 2 5.6 67.3
2007 4 1.8 48.8
2008 5 1.6 44.3
2009 4 1.6 43.8
2010 7 1.8 60.5
2011 5 1.1 38.0
2012 5 1.1 30.4
2013 5 1.6 39.4
2014 5 1.1 27.6
2015 4 1.3 35.6
2016 5 1.3 33.6
2017 5 0.70 21.9
2018 5 1.3 36.7
2019 5 1.1 29.8
2020 5 0.92 17.7
White sucker 2002 2 5.2 381
2005 7 2.2 164
2006 7 5.0 98.6
2007 6 1.4 101
2008 5 0.95 84.2
2009 4 1.1 75.7
2010 3 1.0 81.3
2011 5 1.0 77.9
2012 5 0.94 56.3
2013 5 0.65 37.4
2014 5 0.65 54.8
2015 5 0.82 56.4
2016 5 1.1 78.7
2017 5 0.70 40.9
2018 5 0.56 42.5
2019 5 0.57 43.1
2020 5 0.52 34.2
Station No. 9 (Valatie Kill, Area 28)
White sucker 2004 3 2.1 156
2005 10 1.1 100
2007 3 1.1 76.3
2009 2 0.67 36.7
2010 5 1.5 123
2011 5 0.81 65.2
2012 5 0.74 56.2
2013 5 0.58 44.6
2014 5 1.5 101
2016 5 0.69 48.5
2017 5 0.49 35.2
2018 5 0.48 29.7
2019 4 0.50 31.2
2020 5 0.48 24.7
Station No. 10 (Valatie Kill, Below Area 28)
Brook trout 2002 6 3.5 73.4
2004 1 1.9 62.9
2007 5 2.2 75.2
2008 1 1.1 50.9
2009 5 1.2 33.9
2010 5 1.2 41.6
2011 5 0.78 26.6
2012 5 2.2 59.2
2013 2 1.1 23.0
2014 3 1.1 30.0
2015 2 1.5 35.0
2016 5 0.88 25.7
2017 5 1.1 30.9
2018 5 1.1 27.0
2019 5 0.53 12.2
2020 5 1.0 23.6
White sucker 2002 3 1.1 67.1
2004 4 0.97 93.0
2005 2 0.94 84.7
2006 2 2.1 53.9
2007 1 0.72 72.02008 8 0.74 72.8
DL_2020 Fish Report Tables 3A-3D 2/3
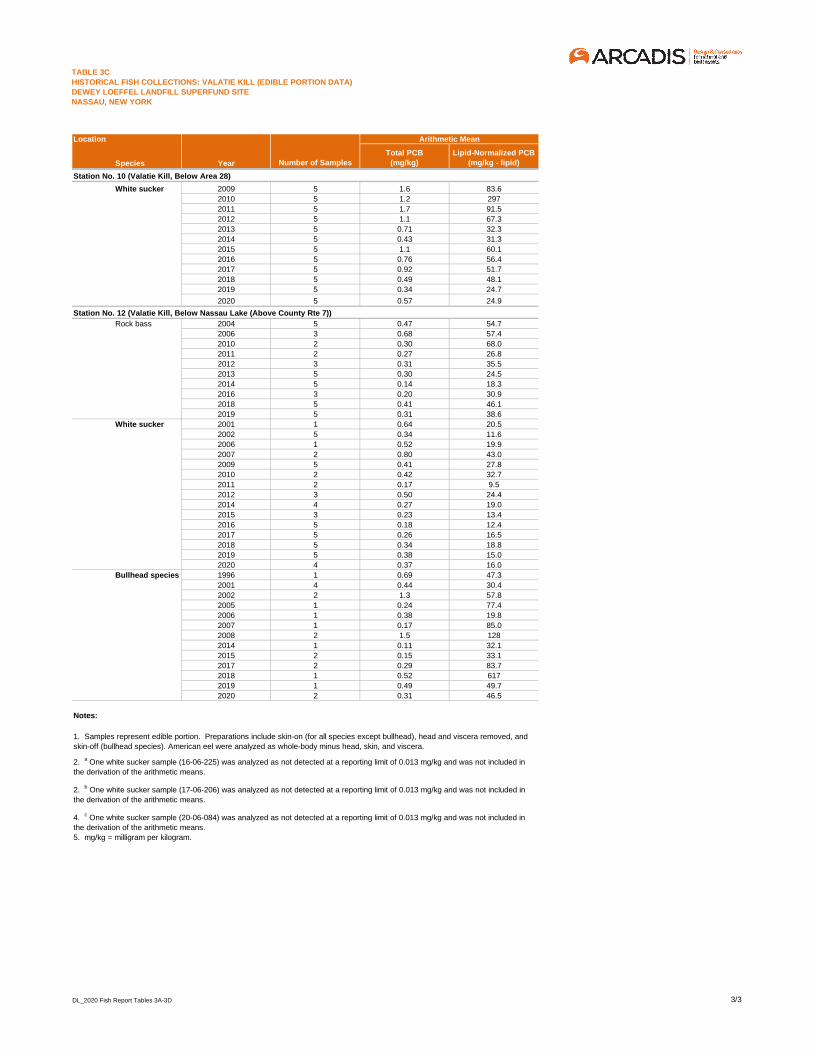
TABLE 3C
HISTORICAL FISH COLLECTIONS: VALATIE KILL (EDIBLE PORTION DATA)
DEWEY LOEFFEL LANDFILL SUPERFUND SITE
NASSAU, NEW YORK
Location Arithmetic Mean
Species Year Number of Samples
Total PCB
(mg/kg)
Lipid-Normalized PCB
(mg/kg - lipid)
Station No. 10 (Valatie Kill, Below Area 28)
White sucker 2009 5 1.6 83.6
2010 5 1.2 297
2011 5 1.7 91.5
2012 5 1.1 67.3
2013 5 0.71 32.3
2014 5 0.43 31.3
2015 5 1.1 60.1
2016 5 0.76 56.4
2017 5 0.92 51.7
2018 5 0.49 48.1
2019 5 0.34 24.7
2020 5 0.57 24.9
Station No. 12 (Valatie Kill, Below Nassau Lake (Above County Rte 7))
Rock bass 2004 5 0.47 54.7
2006 3 0.68 57.4
2010 2 0.30 68.0
2011 2 0.27 26.8
2012 3 0.31 35.5
2013 5 0.30 24.5
2014 5 0.14 18.3
2016 3 0.20 30.9
2018 5 0.41 46.1
2019 5 0.31 38.6
White sucker 2001 1 0.64 20.5
2002 5 0.34 11.6
2006 1 0.52 19.9
2007 2 0.80 43.0
2009 5 0.41 27.8
2010 2 0.42 32.7
2011 2 0.17 9.5
2012 3 0.50 24.4
2014 4 0.27 19.0
2015 3 0.23 13.4
2016 5 0.18 12.4
2017 5 0.26 16.5
2018 5 0.34 18.8
2019 5 0.38 15.0
2020 4 0.37 16.0
Bullhead species 1996 1 0.69 47.3
2001 4 0.44 30.4
2002 2 1.3 57.8
2005 1 0.24 77.4
2006 1 0.38 19.8
2007 1 0.17 85.0
2008 2 1.5 128
2014 1 0.11 32.1
2015 2 0.15 33.1
2017 2 0.29 83.7
2018 1 0.52 617
2019 1 0.49 49.7
2020 2 0.31 46.5
Notes:
5. mg/kg = milligram per kilogram.
1. Samples represent edible portion. Preparations include skin-on (for all species except bullhead), head and viscera removed, and
skin-off (bullhead species). American eel were analyzed as whole-body minus head, skin, and viscera.
2. a One white sucker sample (16-06-225) was analyzed as not detected at a reporting limit of 0.013 mg/kg and was not included in
the derivation of the arithmetic means.
4. c One white sucker sample (20-06-084) was analyzed as not detected at a reporting limit of 0.013 mg/kg and was not included in
the derivation of the arithmetic means.
2. b One white sucker sample (17-06-206) was analyzed as not detected at a reporting limit of 0.013 mg/kg and was not included in
the derivation of the arithmetic means.
DL_2020 Fish Report Tables 3A-3D 3/3
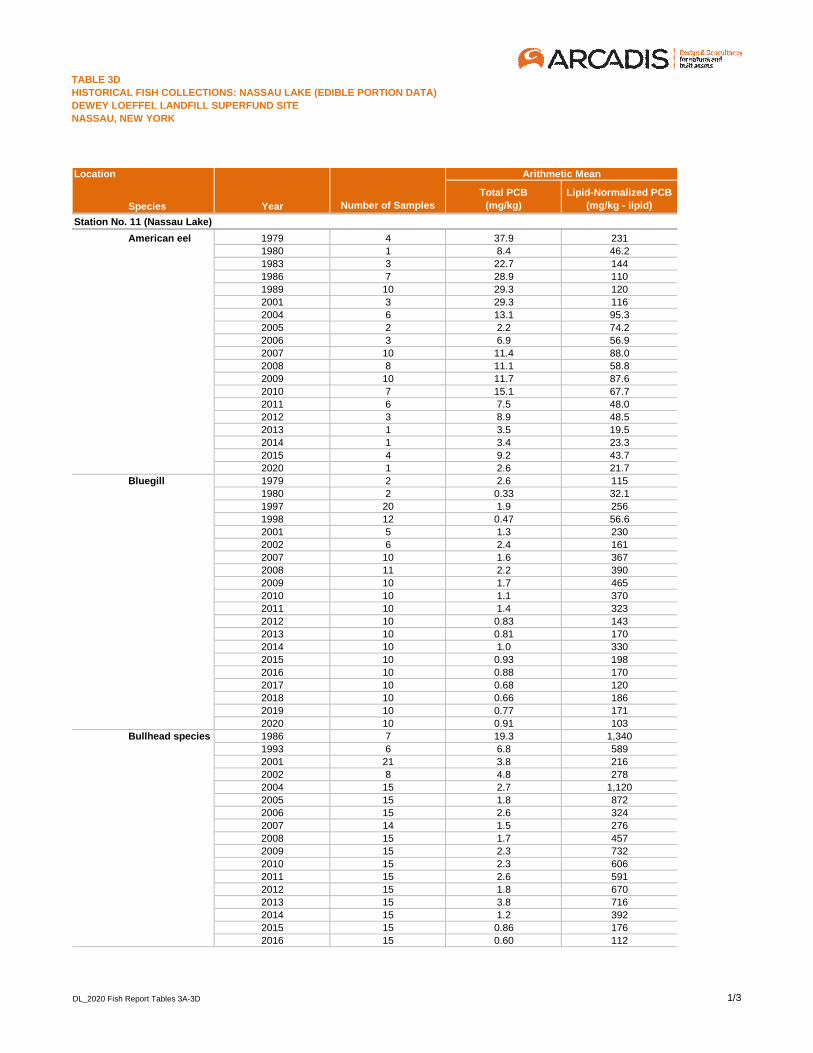
TABLE 3D
HISTORICAL FISH COLLECTIONS: NASSAU LAKE (EDIBLE PORTION DATA)
DEWEY LOEFFEL LANDFILL SUPERFUND SITE
NASSAU, NEW YORK
Location Arithmetic Mean
Species Year Number of Samples
Total PCB
(mg/kg)
Lipid-Normalized PCB
(mg/kg - lipid)
Station No. 11 (Nassau Lake)
American eel 1979 4 37.9 231
1980 1 8.4 46.2
1983 3 22.7 144
1986 7 28.9 110
1989 10 29.3 120
2001 3 29.3 116
2004 6 13.1 95.3
2005 2 2.2 74.2
2006 3 6.9 56.9
2007 10 11.4 88.0
2008 8 11.1 58.8
2009 10 11.7 87.6
2010 7 15.1 67.7
2011 6 7.5 48.0
2012 3 8.9 48.5
2013 1 3.5 19.5
2014 1 3.4 23.3
2015 4 9.2 43.7
2020 1 2.6 21.7
Bluegill 1979 2 2.6 115
1980 2 0.33 32.1
1997 20 1.9 256
1998 12 0.47 56.6
2001 5 1.3 230
2002 6 2.4 161
2007 10 1.6 367
2008 11 2.2 390
2009 10 1.7 465
2010 10 1.1 370
2011 10 1.4 323
2012 10 0.83 143
2013 10 0.81 170
2014 10 1.0 330
2015 10 0.93 198
2016 10 0.88 170
2017 10 0.68 120
2018 10 0.66 186
2019 10 0.77 171
2020 10 0.91 103
Bullhead species 1986 7 19.3 1,340
1993 6 6.8 589
2001 21 3.8 216
2002 8 4.8 278
2004 15 2.7 1,120
2005 15 1.8 872
2006 15 2.6 324
2007 14 1.5 276
2008 15 1.7 457
2009 15 2.3 732
2010 15 2.3 606
2011 15 2.6 591
2012 15 1.8 670
2013 15 3.8 716
2014 15 1.2 392
2015 15 0.86 176
2016 15 0.60 112
DL_2020 Fish Report Tables 3A-3D 1/3
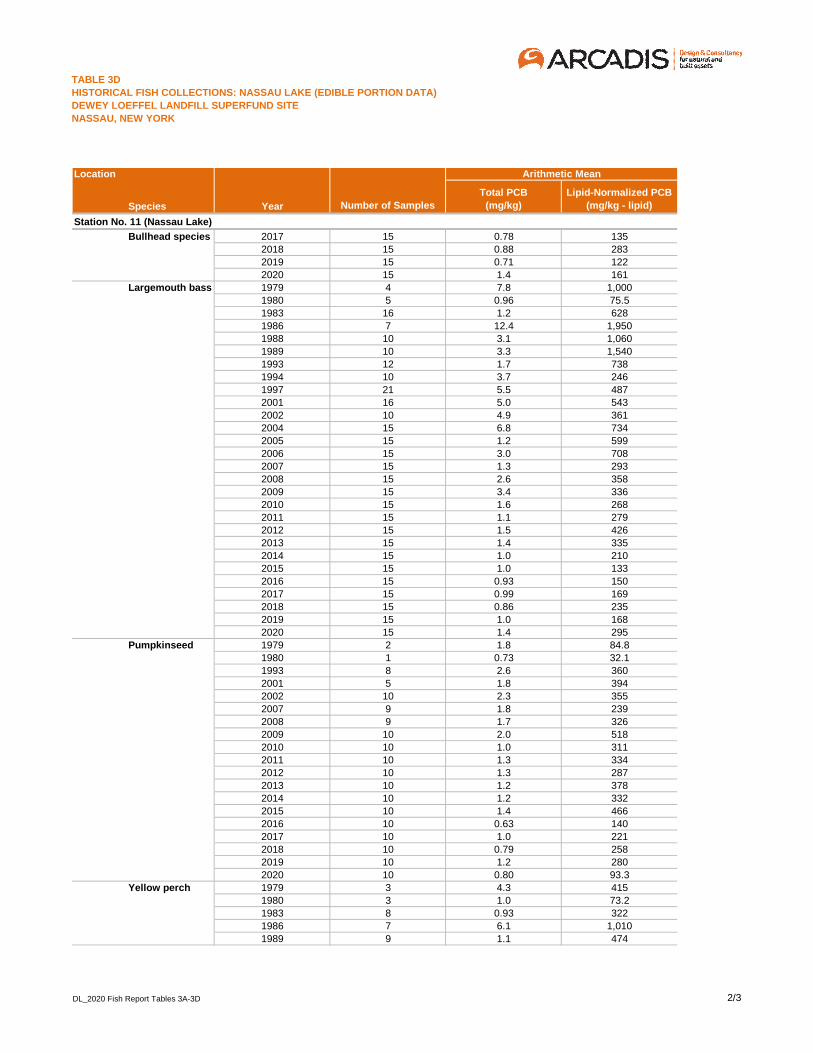
TABLE 3D
HISTORICAL FISH COLLECTIONS: NASSAU LAKE (EDIBLE PORTION DATA)
DEWEY LOEFFEL LANDFILL SUPERFUND SITE
NASSAU, NEW YORK
Location Arithmetic Mean
Species Year Number of Samples
Total PCB
(mg/kg)
Lipid-Normalized PCB
(mg/kg - lipid)
Station No. 11 (Nassau Lake)
Bullhead species 2017 15 0.78 135
2018 15 0.88 283
2019 15 0.71 122
2020 15 1.4 161
Largemouth bass 1979 4 7.8 1,000
1980 5 0.96 75.5
1983 16 1.2 628
1986 7 12.4 1,950
1988 10 3.1 1,060
1989 10 3.3 1,540
1993 12 1.7 738
1994 10 3.7 246
1997 21 5.5 487
2001 16 5.0 543
2002 10 4.9 361
2004 15 6.8 734
2005 15 1.2 599
2006 15 3.0 708
2007 15 1.3 293
2008 15 2.6 358
2009 15 3.4 336
2010 15 1.6 268
2011 15 1.1 279
2012 15 1.5 426
2013 15 1.4 335
2014 15 1.0 210
2015 15 1.0 133
2016 15 0.93 150
2017 15 0.99 169
2018 15 0.86 235
2019 15 1.0 168
2020 15 1.4 295
Pumpkinseed 1979 2 1.8 84.8
1980 1 0.73 32.1
1993 8 2.6 360
2001 5 1.8 394
2002 10 2.3 355
2007 9 1.8 239
2008 9 1.7 326
2009 10 2.0 518
2010 10 1.0 311
2011 10 1.3 334
2012 10 1.3 287
2013 10 1.2 378
2014 10 1.2 332
2015 10 1.4 466
2016 10 0.63 140
2017 10 1.0 221
2018 10 0.79 258
2019 10 1.2 280
2020 10 0.80 93.3
Yellow perch 1979 3 4.3 415
1980 3 1.0 73.2
1983 8 0.93 322
1986 7 6.1 1,010
1989 9 1.1 474
DL_2020 Fish Report Tables 3A-3D 2/3
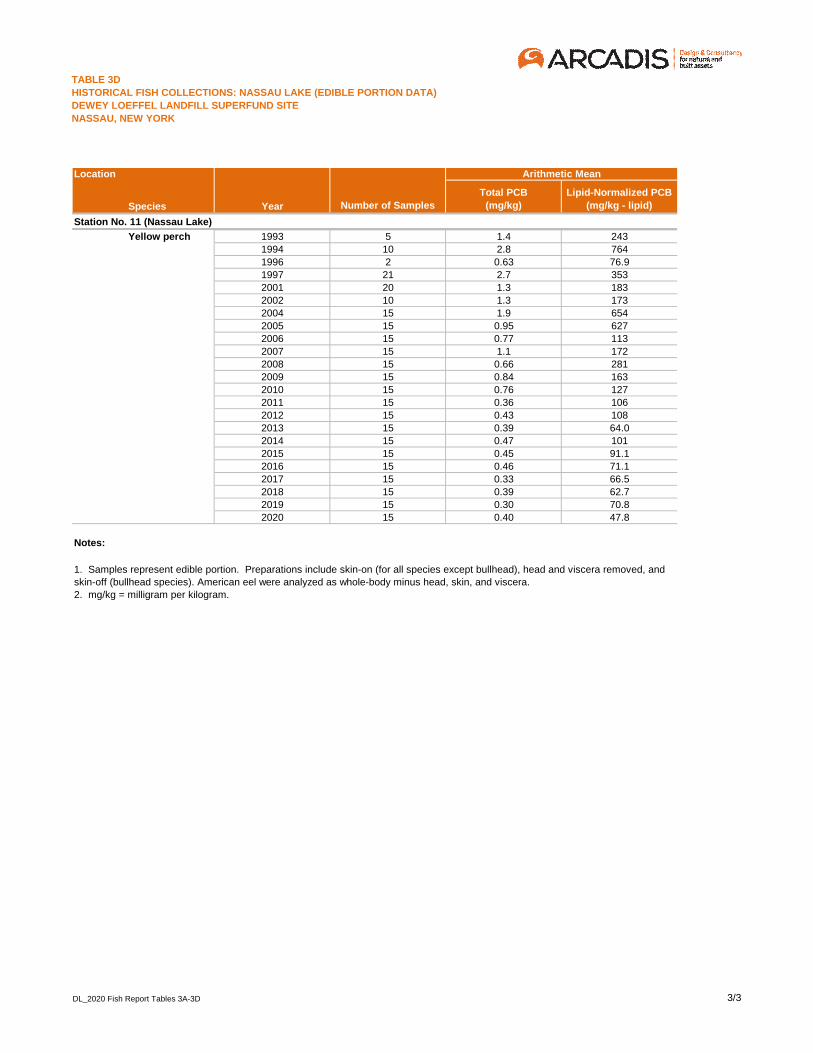
TABLE 3D
HISTORICAL FISH COLLECTIONS: NASSAU LAKE (EDIBLE PORTION DATA)
DEWEY LOEFFEL LANDFILL SUPERFUND SITE
NASSAU, NEW YORK
Location Arithmetic Mean
Species Year Number of Samples
Total PCB
(mg/kg)
Lipid-Normalized PCB
(mg/kg - lipid)
Station No. 11 (Nassau Lake)
Yellow perch 1993 5 1.4 243
1994 10 2.8 764
1996 2 0.63 76.9
1997 21 2.7 353
2001 20 1.3 183
2002 10 1.3 173
2004 15 1.9 654
2005 15 0.95 627
2006 15 0.77 113
2007 15 1.1 172
2008 15 0.66 281
2009 15 0.84 163
2010 15 0.76 127
2011 15 0.36 106
2012 15 0.43 108
2013 15 0.39 64.0
2014 15 0.47 101
2015 15 0.45 91.1
2016 15 0.46 71.1
2017 15 0.33 66.5
2018 15 0.39 62.7
2019 15 0.30 70.8
2020 15 0.40 47.8
Notes:
2. mg/kg = milligram per kilogram.
1. Samples represent edible portion. Preparations include skin-on (for all species except bullhead), head and viscera removed, and
skin-off (bullhead species). American eel were analyzed as whole-body minus head, skin, and viscera.
DL_2020 Fish Report Tables 3A-3D 3/3

FIGURE

SOUTHEAST
DRAINAGE
DITCH
N
A
S
S
A
U
-
A
V
E
R
I
L
L
P
A
R
K
R
O
A
D
C
U
R
T
I
S
H
I
L
L
R
O
A
D
C
E
N
T
R
A
L N
A
S
S
A
U
R
O
A
D
USGS
GAGING
STATION
V
A
L
L
E
Y
S
T
R
E
A
M
TR
IB
UT
AR
Y T
8
T
R
I
B
U
T
A
R
Y
T
8
A
UNNAMED
TRIBUTARIES
AREA 28
NASSAU
LAKE
TRIBUTARY T11A
NORTHWEST
DRAINAGE
DITCH
WD
SD
SD
DEWEY
LOEFFEL
LANDFILL
FORMER
MEAD ROAD
POND
M
E
A
D
R
O
A
D
HOAGS CORNERS ROAD
TRIBUTARY T14
V
A
L
A
T
I
E
K
I
L
L
SMITH POND
V
A
L
L
E
Y
S
T
R
E
A
M
K
R
O
U
N
E
R
R
O
A
D
LEGEND:
LOCATION
STATION
NUMBER
10
9
8
7
96
5
4
3
2
1
11
12
12
11
8
5
4
3
2
1
10
9
7
6
FISH SAMPLING LOCATIONS -
WESTERN DRAINAGEWAY
IM
AG
ES
:X
RE
FS
:
10073X
01
CIT
Y: S
YR
AC
US
E, N
Y D
IV
/G
RO
UP
: E
NV
/R
EM
-W
/IM
-D
V D
B: P
. LIS
TE
R, K
.S
AR
TO
RI P
M/T
M: D
. S
AU
DA
LY
R:(O
pt)O
N=
*;O
FF
=*R
EF
*
G:\G
E\E
NV
CA
D\S
YR
AC
US
E\A
CT
\C
\B
0010073\0106\00001\D
WG
\10073B
02.D
WG
LA
YO
UT
: 1
S
AV
ED
: 3/18/2015 8:38 A
M A
CA
DV
ER
: 19.1S
(LM
S T
EC
H) P
AG
ES
ET
UP
: C
-LD
2B
-P
DF
-G
MS
P
LO
TS
TY
LE
TA
BLE
: P
LT
FU
LL.C
TB
P
LO
TT
ED
: 3/11/2016 10:19 A
M B
Y: H
OW
ES
, D
AV
ID
FIGURE
DEWEY LOEFFEL LANDFILL SUPERFUND SITE
NASSAU, NEW YORK
1
APPENDIX A
Technical Memorandum
Temporal Trends in Fish Tissue Samples
for the Western Drainageway from the
Dewey Loeffel Landfill
1
Dl_2020 Fish Sampling Report Appendix A
Technical Memorandum Temporal Trends in Fish Tissue Samples for the Western Drainageway from the Dewey Loeffel Landfill Superfund Site
1. Background
This Technical Memorandum summarizes the fish tissue polychlorinated biphenyl (PCB) data from the Western Drainageway of the former Dewey Loeffel Landfill Superfund Site (Site). This Technical Memorandum is similar to the previous Technical Memorandum included as Appendix A to the 2019 Fish Sampling Report but is updated to include the 2020 fish tissue data. This Technical Memorandum focuses on fish tissue data from the Valatie Kill and Nassau Lake and does not include data for Tributary T11A because fish tissue sampling was not conducted in Tributary T11A in 2018, 2019, and 2020. Please refer to the Technical Memorandum included as Appendix A to the 2017 Fish Sampling Report for information on fish tissue data from Tributary T11A.
Since 1979, over 4,800 fish tissue samples have been collected from the Western Drainageway, including over 3,600 samples since the completion of remedial actions in 2004. The fish tissue samples include “whole-body” samples and “edible-portion” samples (which are typically from larger fish). Samples have been collected from 12 sampling stations: five stations between the former Dewey Loeffel Landfill (the Landfill) and the confluence of Tributary T11A with the Valatie Kill; six stations within the Valatie Kill (between its confluence with Tributary T14 near China Hill Road and a location below the Nassau Lake dam and above County Route 7); and Nassau Lake. These stations are designated S1 through S12 (Attachment 1). Valatie Kill station S6 (north of its confluence with Tributary T11A) has been used to represent background conditions by the New York State Department of Environmental Control since fish monitoring started in 1979 and was included in their 2002 Long-Term Monitoring of PCB in Biota of the Valatie Kill Drainage Systemplan to represent a background condition.
Numerous figures have been developed that illustrate the trends in fish tissue data collected through 2020. These figures, which are included as attachments to this Technical Memorandum, present fish tissue PCB concentrations in two ways: as total “wet-weight” PCBs, and as “lipid-normalized” PCBs that adjusts the detected total PCB concentration based on the amount of lipid (fat) measured in the sample.
Total PCBs are calculated as the sum of detected Aroclors. Fish tissue PCBs have historically been characterized as Aroclor 1260, with infrequent identification of other Aroclors. From 2005 to 2020 only 80 out of 3,691 fish tissue samples (2.2%) have detections besides Aroclor 1260 (14 samples [0.40%] detected Aroclor 1248 and 66 samples [1.9%] detected Aroclor 1254). Most recently PCBs in two yellow perch from Nassau Lake collected in 2018 included Aroclor 1248. The percent contribution of Aroclor 1248 towards the total PCB concentration has ranged from 0 to 8%, with an average of 1.2%. The percent contribution of Aroclor 1254 toward the total PCB concentration has ranged from 0 to 33%, with an average of 11%.
The Technical Memorandum figures show PCB concentrations over time, using both individual species and all combined species for each station. Grouping of the data allows additional interpretation of potential temporal trends for individual locations or species. The figures display fish tissue PCB concentrations in a series of data plots. The box and whisker plots show individual sample results, outliers (mild and extreme), and various percentiles (90th, 75th, 50th, 25th and 10th). Summary statistics for the plots for this appendix are detailed by plot for each collection year within Attachment 5.
2. Assessment of Temporal Trends in PCB Concentrations in Fish Tissue Samples Collected in the Valatie Kill and Nassau Lake
This section describes the temporal trends in fish tissue PCB concentrations for two general areas: 1) the Valatie Kill between Tributary T11A and Nassau Lake (stations S7 through S10) (Attachment 3); and 2) Nassau Lake (station S11) (Attachment 4). Data from background station S6 on the Valatie Kill upstream from Tributary T11A are provided in Attachment 2.
2
Dl_2020 Fish Sampling Report Appendix A
Overall, fish tissue PCB concentrations have declined over time throughout the Valatie Kill drainage system, and post-remedial PCB concentrations are lower than pre-remedial PCB concentrations. Ongoing post-remediation declines in fish tissue PCB concentrations are also evident for many species and locations. Some species have shown a slower rate of decline in recent years and fish tissue PCB concentration in these species may be plateauing.
Fish tissue data reflect a gradient in PCB concentrations. PCB concentrations tend to be higher in Tributary T11A (about 0.2 to 0.5 miles downstream from the Landfill) compared to the Valatie Kill (beginning about 0.5 miles downstream from the Landfill) and Nassau Lake (about 3 miles downstream from the Landfill). In addition, PCBs have been detected in fish from the background location (station S6, located on the Valatie Kill about 1.1 miles upstream of the confluence of Tributary T11A with the Valatie Kill). These background concentrations may reflect potential for fish migration from downstream areas (there are no barriers to the upstream migration of some fish species to the background sampling location).
2.1 Valatie Kill between Tributary T11A and Nassau Lake (Stations S7, S8, S9 and S10) – see Figures in Attachments 2 and 3
Data from the Valatie Kill background station S6 at China Hill Road (1.1 miles upstream of the confluence of T11A with the Valatie Kill) show that fish tissue PCBs are above detection limits. These concentrations may reflect potential for some fish species to migrate from downstream areas. The presence of PCBs at concentrations well above detection limits (i.e., typically 0.0125 to 0.050 ppm from 2009 to present) in fish tissue samples at station S6, as reflected in edible-portion and whole-body samples, is illustrated in Figures BKGRD-1 and BKGRD-2 in Attachment 1. These data indicate a relatively consistent pattern, as 2020 PCB data are within the range of detected concentrations observed over the last six years (i.e., 2014 to current), with the overall mean for edible species of 0.25 ppm and whole body of 0.42 ppm.
Fish tissue PCB concentrations in the Valatie Kill between Tributary T11A and Nassau Lake (stations S7, S8, S9 and S10) have declined since remediation activities were conducted in the Western Drainageway upstream of the Valatie Kill (2001-2003) and in Area 28 of the Valatie Kill (2003-2004). The Valatie Kill is about 0.5 miles downstream from the Landfill while Area 28 is about 0.8 miles upstream from Nassau Lake. The overall decline in fish tissue PCB concentrations in the Valatie Kill immediately below the confluence of Tributary T11A (station S7) and the three stations located immediately above, at, and immediately below Area 28 (stationsS8, S9 and S10, respectively) is evident from both wet-weight and lipid-normalized PCB data for whole-body and edible-portion samples. For the last several years PCBs in individual species at some of these stations are among the lowest concentrations ever detected. The decline in fish tissue PCB concentrations in the Valatie Kill is illustrated in several of the figures included in Attachment 3, as discussed further below. Additional species-specific plots useful for further evaluating trends in Valatie Kill fish are provided in Appendix B. Summary statistics for these species-specific plots are detailed by plot for each collection year within Attachment 1 of Appendix B.
Edible-Portion Sample Data
o PCB data for edible-portion fish tissue samples for all species combined from stations S7, S8, S9 and S10 are presented in Figures VK-1, VK-3, VK-5 and VK-7, respectively. Although there is variability among years and stations (and between wet-weight and lipid-normalized data), these figures generally show an overall decrease in PCB concentrations over time. The decrease is most evident from the review of edible-portion fish tissue samples collected from 2011 to 2020 which indicate decreases in PCB concentrations from early post-remedial conditions (i.e., 2005 to 2006).
3
Dl_2020 Fish Sampling Report Appendix A
Whole-Body Sample Data
o PCB data for whole-body fish tissue samples for all species combined from stations S7, S8, S9 and S10 are presented in Figures VK-2, VK-4, VK-6 and VK-8, respectively. These plots also show an overall decrease in PCBs over time at most of these stations. The decrease is most evident from the review of the whole-body fish tissue samples collected from 2015 to 2020, which indicate decreases in PCB concentrations from early post-remedial conditions (i.e., 2005 to 2006).
Overall, both edible-portion and whole-body fish tissue PCB concentrations have decreased over time. These decreases generally reflect the effectiveness of remedial activities performed for the Site. In some instances, PCB concentrations are declining at a slower rate for certain species and stations. An example of this slower rate of decline is whole-body fish at station S10, where the average PCB concentrations have consistently ranged from 1.6 to 1.8 ppm over the last six years.
2.2 Nassau Lake (Station S11) – see Figures in Attachment 4
Fish tissue PCB concentrations in edible-size fish from Nassau Lake (station S11) have declined over time, and PCB concentrations in 2020 are similar to those observed in 2010-2019 and at far lower levels than during the prior three decades (1980-1989, 1990-1999, 2000-2009). The decline in fish tissue PCB concentrations in Nassau Lake is evident from both wet-weight and lipid-normalized data from edible-portion samples (which are the only types of fish tissue samples collected in Nassau Lake). The decrease is shown in the figures presented in Attachment 4, as discussed further below.
o All of the samples collected from Nassau Lake are edible-portion tissue samples from larger, edible-size fish. It is important to consider that the larger fish are several years old and PCB body burdens may not reflect current conditions. As such, trends in PCB concentrations in the larger edible-size fish may lag compared to small (younger) fish.
o Several species have been collected from Nassau Lake, including sunfish (bluegill and pumpkinseed), yellow perch, largemouth bass, bullhead (brown and yellow) and American eel. PCB concentrations vary significantly among these species, depending on factors such as trophic level, lipid content and size or age of the individual fish. Therefore, species-specific plots are useful for further evaluating trends in Nassau Lake fish (see Appendix B).
o PCB data for all combined species from Nassau Lake reveal considerable year-to-year variability, but show an overall decrease in PCBs over time (Figure NL-1). The overall decrease is particularly evident in the fact that the highest detected concentrations between 2016 and 2020 are much lower than many of the historic maximum detected concentrations, and often represent a decrease of 50% or more compared to historic maximum detected concentrations.
As noted previously, uncertainty exists in the background contribution to PCB levels; which may potentially reduce or slow thedecline of PCB concentrations in Nassau Lake fish. This is evident by observations from 2016 to 2020 which indicate that while average PCBs are around 1 ppm or lower for most species, certain species like bullhead and largemouth bass may have had slower rates of decline during this period and may have begun to reach a plateau.
List of Attachments 1 Figure 1 – Fish Sampling Locations 2 Fish Data Trend Plots – Background Area (Valatie Kill Upstream from Tributary T11A) 3 Fish Data Trend Plots – Valatie Kill Downstream from Tributary T11A 4 Fish Data Trend Plots – Nassau Lake 5 Fish Data Trend Plots – Summary Statistics
ATTACHMENT 1
Figure 1 – Fish Sampling Locations

SOUTHEAST
DRAINAGE
DITCH
N
A
S
S
A
U
-
A
V
E
R
I
L
L
P
A
R
K
R
O
A
D
C
U
R
T
I
S
H
I
L
L
R
O
A
D
C
E
N
T
R
A
L N
A
S
S
A
U
R
O
A
D
USGS
GAGING
STATION
V
A
L
L
E
Y
S
T
R
E
A
M
TR
IB
UT
AR
Y T
8
T
R
I
B
U
T
A
R
Y
T
8
A
UNNAMED
TRIBUTARIES
AREA 28
NASSAU
LAKE
TRIBUTARY T11A
NORTHWEST
DRAINAGE
DITCH
WD
SD
SD
DEWEY
LOEFFEL
LANDFILL
FORMER
MEAD ROAD
POND
M
E
A
D
R
O
A
D
HOAGS CORNERS ROAD
TRIBUTARY T14
V
A
L
A
T
I
E
K
I
L
L
SMITH POND
V
A
L
L
E
Y
S
T
R
E
A
M
K
R
O
U
N
E
R
R
O
A
D
LEGEND:
LOCATION
STATION
NUMBER
10
9
8
7
96
5
4
3
2
1
11
12
12
11
8
5
4
3
2
1
10
9
7
6
FISH SAMPLING LOCATIONS -
WESTERN DRAINAGEWAY
IM
AG
ES
:X
RE
FS
:
10073X
01
CIT
Y: S
YR
AC
US
E, N
Y D
IV
/G
RO
UP
: E
NV
/R
EM
-W
/IM
-D
V D
B: P
. LIS
TE
R, K
.S
AR
TO
RI P
M/T
M: D
. S
AU
DA
LY
R:(O
pt)O
N=
*;O
FF
=*R
EF
*
G:\G
E\E
NV
CA
D\S
YR
AC
US
E\A
CT
\C
\B
0010073\0106\00001\D
WG
\10073B
02.D
WG
LA
YO
UT
: 1
S
AV
ED
: 3/18/2015 8:38 A
M A
CA
DV
ER
: 19.1S
(LM
S T
EC
H) P
AG
ES
ET
UP
: C
-LD
2B
-P
DF
-G
MS
P
LO
TS
TY
LE
TA
BLE
: P
LT
FU
LL.C
TB
P
LO
TT
ED
: 3/11/2016 10:19 A
M B
Y: H
OW
ES
, D
AV
ID
FIGURE
DEWEY LOEFFEL LANDFILL SUPERFUND SITE
NASSAU, NEW YORK
1
ATTACHMENT 2 Fish Data Trend Plots – Background Area (Valatie Kill Upstream from Tributary T11A)
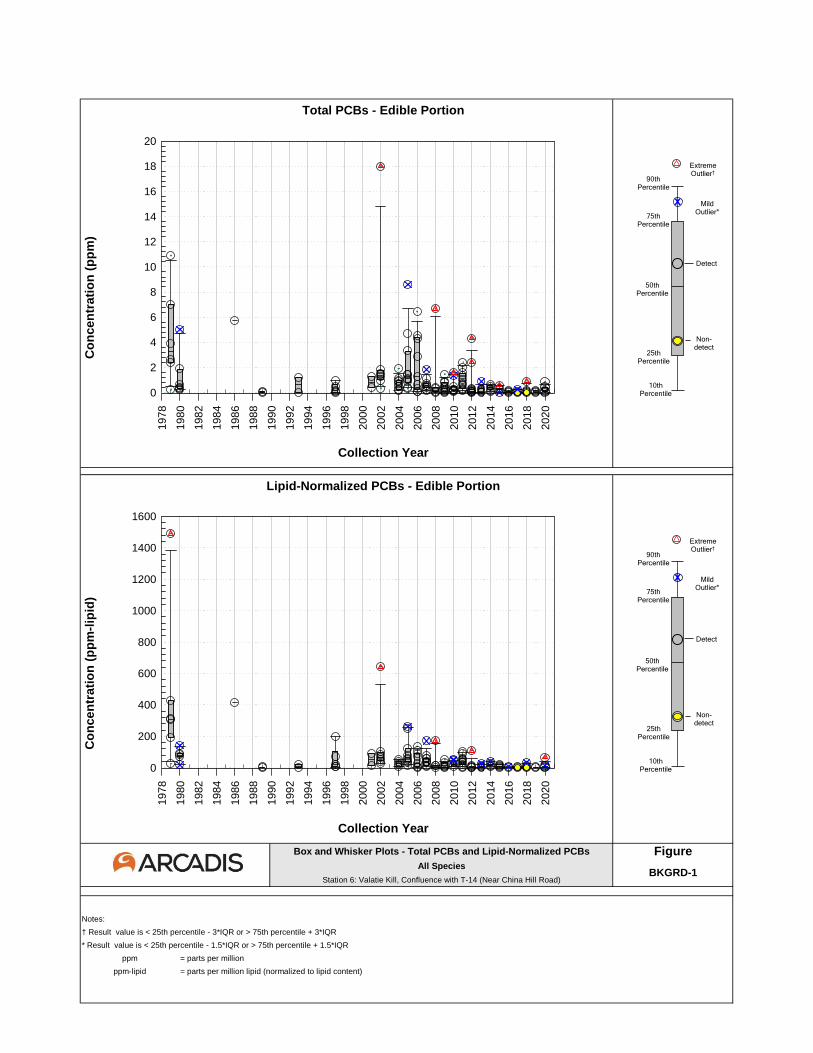
Box and Whisker Plots - Total PCBs and Lipid-Normalized PCBs FigureAll Species
Station 6: Valatie Kill, Confluence with T-14 (Near China Hill Road)
Notes:
† Result value is < 25th percentile - 3*IQR or > 75th percentile + 3*IQR
* Result value is < 25th percentile - 1.5*IQR or > 75th percentile + 1.5*IQR
ppm = parts per million
ppm-lipid = parts per million lipid (normalized to lipid content)
BKGRD-1
Total PCBs - Edible Portion
Co
ncen
trati
on
(p
pm
)
Collection Year
Lipid-Normalized PCBs - Edible Portion
Co
ncen
trati
on
(p
pm
-lip
id)
Collection Year
page intentionally blank
x
10th Percentile
90th Percentile
75th Percentile
25th Percentile
Non-detect
Detect
50th Percentile
MildOutlier*
ExtremeOutlier†
page intentionally blank
x
10th Percentile
90th Percentile
75th Percentile
25th Percentile
Non-detect
Detect
50th Percentile
MildOutlier*
ExtremeOutlier†
1978
1980
1982
1984
1986
1988
1990
1992
1994
1996
1998
2000
2002
2004
2006
2008
2010
2012
2014
2016
2018
2020
0
2
4
6
8
10
12
14
16
18
20
1978
1980
1982
1984
1986
1988
1990
1992
1994
1996
1998
2000
2002
2004
2006
2008
2010
2012
2014
2016
2018
2020
0
200
400
600
800
1000
1200
1400
1600
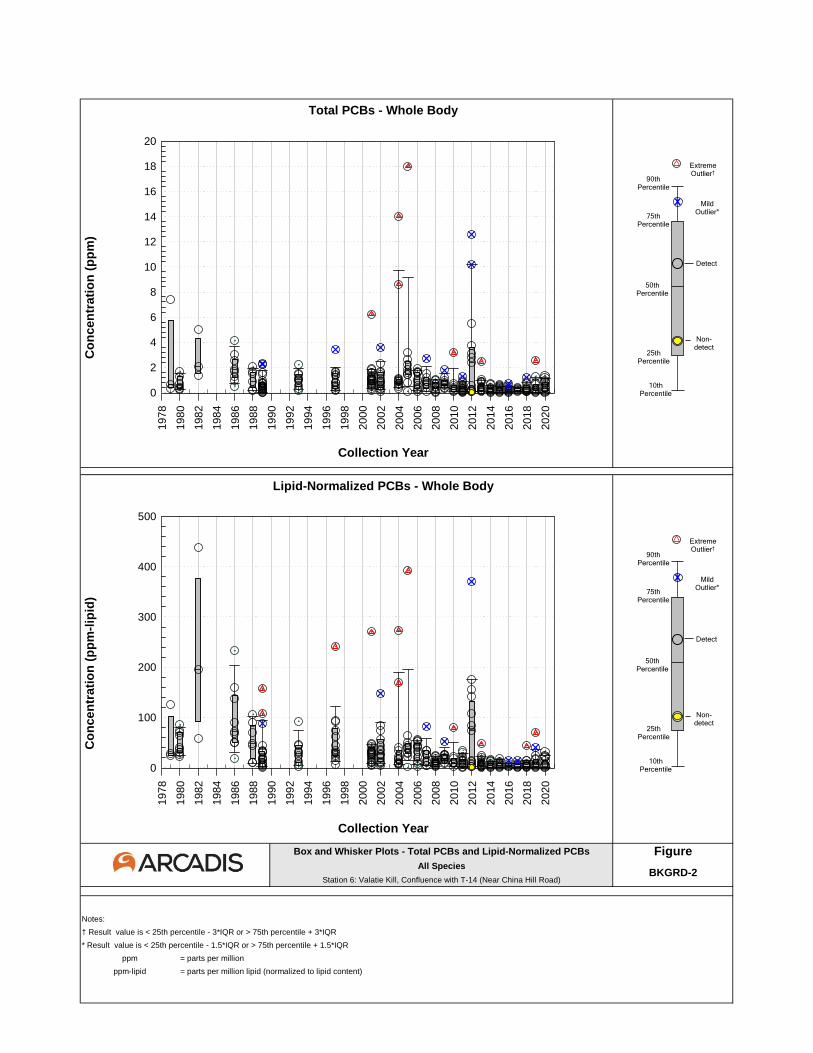
Box and Whisker Plots - Total PCBs and Lipid-Normalized PCBs FigureAll Species
Station 6: Valatie Kill, Confluence with T-14 (Near China Hill Road)
Notes:
† Result value is < 25th percentile - 3*IQR or > 75th percentile + 3*IQR
* Result value is < 25th percentile - 1.5*IQR or > 75th percentile + 1.5*IQR
ppm = parts per million
ppm-lipid = parts per million lipid (normalized to lipid content)
BKGRD-2
Total PCBs - Whole Body
Co
ncen
trati
on
(p
pm
)
Collection Year
Lipid-Normalized PCBs - Whole Body
Co
ncen
trati
on
(p
pm
-lip
id)
Collection Year
page intentionally blank
x
10th Percentile
90th Percentile
75th Percentile
25th Percentile
Non-detect
Detect
50th Percentile
MildOutlier*
ExtremeOutlier†
page intentionally blank
x
10th Percentile
90th Percentile
75th Percentile
25th Percentile
Non-detect
Detect
50th Percentile
MildOutlier*
ExtremeOutlier†
1978
1980
1982
1984
1986
1988
1990
1992
1994
1996
1998
2000
2002
2004
2006
2008
2010
2012
2014
2016
2018
2020
0
2
4
6
8
10
12
14
16
18
20
1978
1980
1982
1984
1986
1988
1990
1992
1994
1996
1998
2000
2002
2004
2006
2008
2010
2012
2014
2016
2018
2020
0
100
200
300
400
500
ATTACHMENT 3
Fish Data Trend Plots
(Valatie Kill Downstream from Tributary T11A)
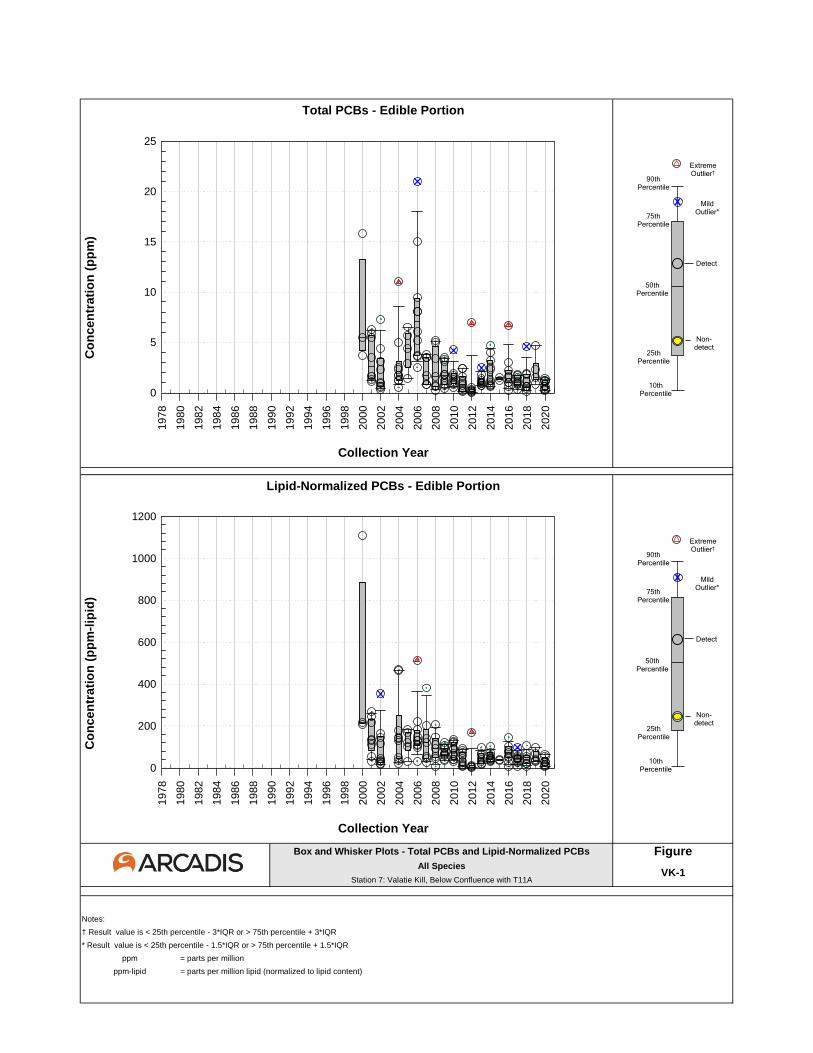
Box and Whisker Plots - Total PCBs and Lipid-Normalized PCBs FigureAll Species
Station 7: Valatie Kill, Below Confluence with T11A
Notes:
† Result value is < 25th percentile - 3*IQR or > 75th percentile + 3*IQR
* Result value is < 25th percentile - 1.5*IQR or > 75th percentile + 1.5*IQR
ppm = parts per million
ppm-lipid = parts per million lipid (normalized to lipid content)
VK-1
Total PCBs - Edible Portion
Co
ncen
trati
on
(p
pm
)
Collection Year
Lipid-Normalized PCBs - Edible Portion
Co
ncen
trati
on
(p
pm
-lip
id)
Collection Year
page intentionally blank
x
10th Percentile
90th Percentile
75th Percentile
25th Percentile
Non-detect
Detect
50th Percentile
MildOutlier*
ExtremeOutlier†
page intentionally blank
x
10th Percentile
90th Percentile
75th Percentile
25th Percentile
Non-detect
Detect
50th Percentile
MildOutlier*
ExtremeOutlier†
1978
1980
1982
1984
1986
1988
1990
1992
1994
1996
1998
2000
2002
2004
2006
2008
2010
2012
2014
2016
2018
2020
0
5
10
15
20
25
1978
1980
1982
1984
1986
1988
1990
1992
1994
1996
1998
2000
2002
2004
2006
2008
2010
2012
2014
2016
2018
2020
0
200
400
600
800
1000
1200
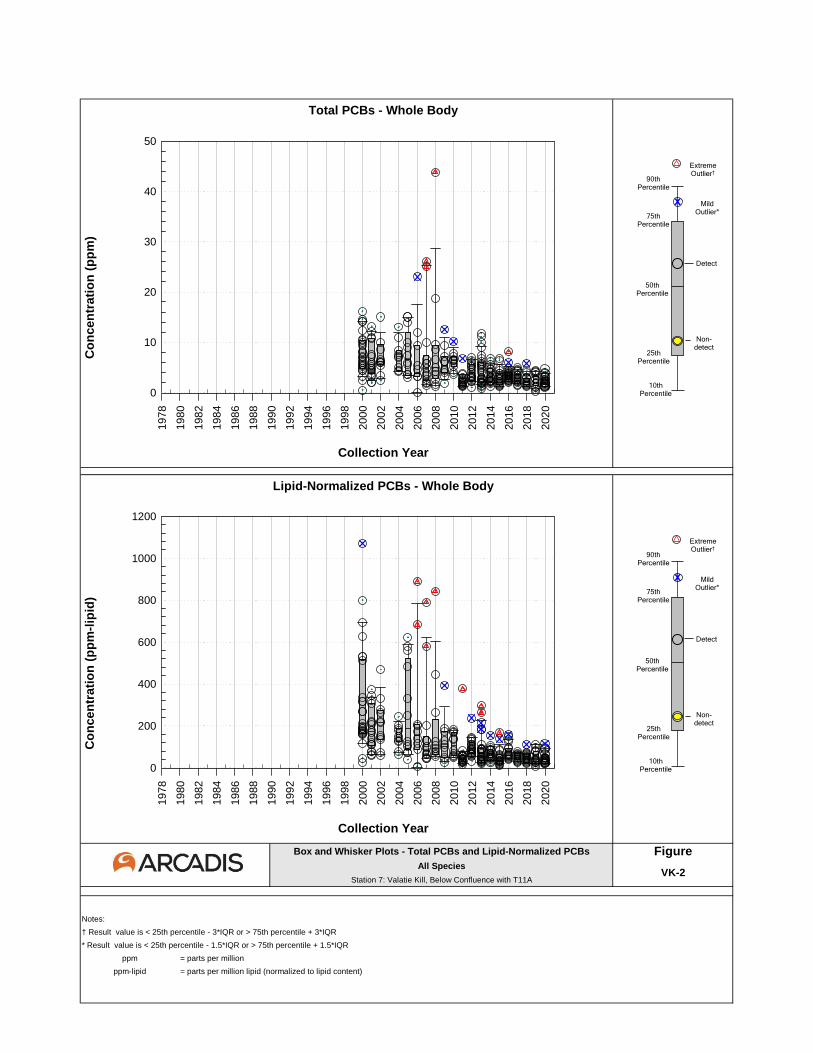
Box and Whisker Plots - Total PCBs and Lipid-Normalized PCBs FigureAll Species
Station 7: Valatie Kill, Below Confluence with T11A
Notes:
† Result value is < 25th percentile - 3*IQR or > 75th percentile + 3*IQR
* Result value is < 25th percentile - 1.5*IQR or > 75th percentile + 1.5*IQR
ppm = parts per million
ppm-lipid = parts per million lipid (normalized to lipid content)
VK-2
Total PCBs - Whole Body
Co
ncen
trati
on
(p
pm
)
Collection Year
Lipid-Normalized PCBs - Whole Body
Co
ncen
trati
on
(p
pm
-lip
id)
Collection Year
page intentionally blank
x
10th Percentile
90th Percentile
75th Percentile
25th Percentile
Non-detect
Detect
50th Percentile
MildOutlier*
ExtremeOutlier†
page intentionally blank
x
10th Percentile
90th Percentile
75th Percentile
25th Percentile
Non-detect
Detect
50th Percentile
MildOutlier*
ExtremeOutlier†
1978
1980
1982
1984
1986
1988
1990
1992
1994
1996
1998
2000
2002
2004
2006
2008
2010
2012
2014
2016
2018
2020
0
10
20
30
40
50
1978
1980
1982
1984
1986
1988
1990
1992
1994
1996
1998
2000
2002
2004
2006
2008
2010
2012
2014
2016
2018
2020
0
200
400
600
800
1000
1200
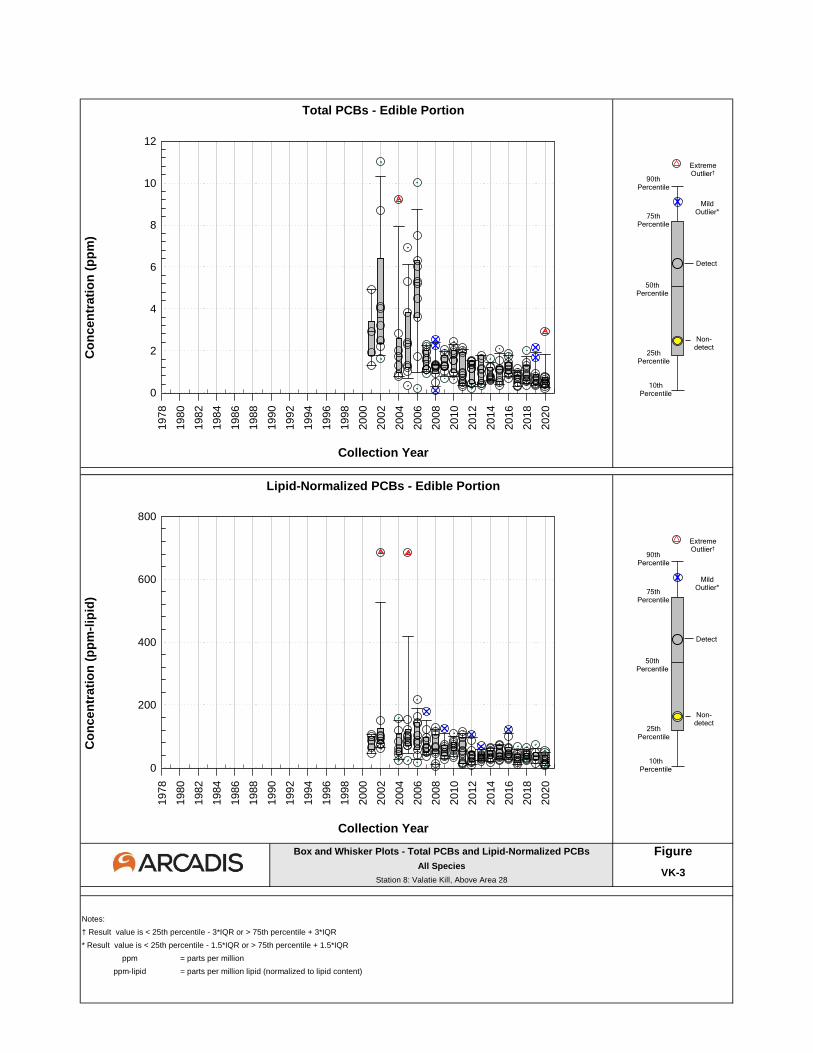
Box and Whisker Plots - Total PCBs and Lipid-Normalized PCBs FigureAll Species
Station 8: Valatie Kill, Above Area 28
Notes:
† Result value is < 25th percentile - 3*IQR or > 75th percentile + 3*IQR
* Result value is < 25th percentile - 1.5*IQR or > 75th percentile + 1.5*IQR
ppm = parts per million
ppm-lipid = parts per million lipid (normalized to lipid content)
VK-3
Total PCBs - Edible Portion
Co
ncen
trati
on
(p
pm
)
Collection Year
Lipid-Normalized PCBs - Edible Portion
Co
ncen
trati
on
(p
pm
-lip
id)
Collection Year
page intentionally blank
x
10th Percentile
90th Percentile
75th Percentile
25th Percentile
Non-detect
Detect
50th Percentile
MildOutlier*
ExtremeOutlier†
page intentionally blank
x
10th Percentile
90th Percentile
75th Percentile
25th Percentile
Non-detect
Detect
50th Percentile
MildOutlier*
ExtremeOutlier†
1978
1980
1982
1984
1986
1988
1990
1992
1994
1996
1998
2000
2002
2004
2006
2008
2010
2012
2014
2016
2018
2020
0
2
4
6
8
10
12
1978
1980
1982
1984
1986
1988
1990
1992
1994
1996
1998
2000
2002
2004
2006
2008
2010
2012
2014
2016
2018
2020
0
200
400
600
800
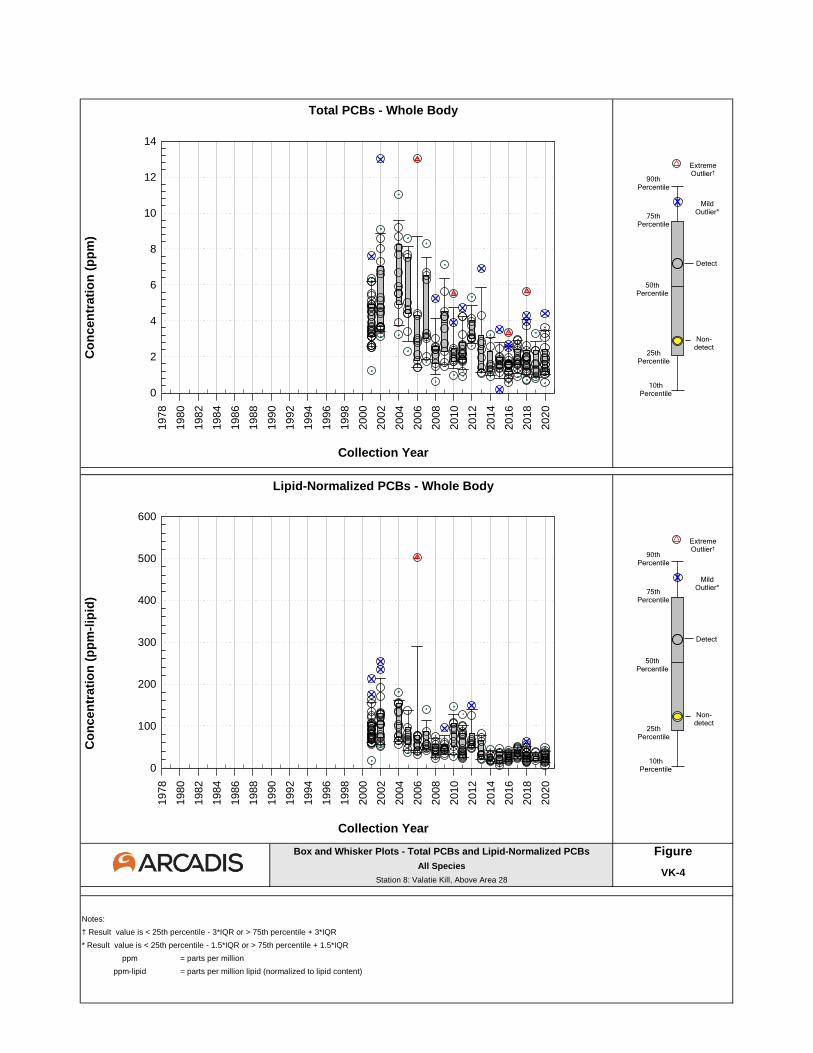
Box and Whisker Plots - Total PCBs and Lipid-Normalized PCBs FigureAll Species
Station 8: Valatie Kill, Above Area 28
Notes:
† Result value is < 25th percentile - 3*IQR or > 75th percentile + 3*IQR
* Result value is < 25th percentile - 1.5*IQR or > 75th percentile + 1.5*IQR
ppm = parts per million
ppm-lipid = parts per million lipid (normalized to lipid content)
VK-4
Total PCBs - Whole Body
Co
ncen
trati
on
(p
pm
)
Collection Year
Lipid-Normalized PCBs - Whole Body
Co
ncen
trati
on
(p
pm
-lip
id)
Collection Year
page intentionally blank
x
10th Percentile
90th Percentile
75th Percentile
25th Percentile
Non-detect
Detect
50th Percentile
MildOutlier*
ExtremeOutlier†
page intentionally blank
x
10th Percentile
90th Percentile
75th Percentile
25th Percentile
Non-detect
Detect
50th Percentile
MildOutlier*
ExtremeOutlier†
1978
1980
1982
1984
1986
1988
1990
1992
1994
1996
1998
2000
2002
2004
2006
2008
2010
2012
2014
2016
2018
2020
0
2
4
6
8
10
12
14
1978
1980
1982
1984
1986
1988
1990
1992
1994
1996
1998
2000
2002
2004
2006
2008
2010
2012
2014
2016
2018
2020
0
100
200
300
400
500
600
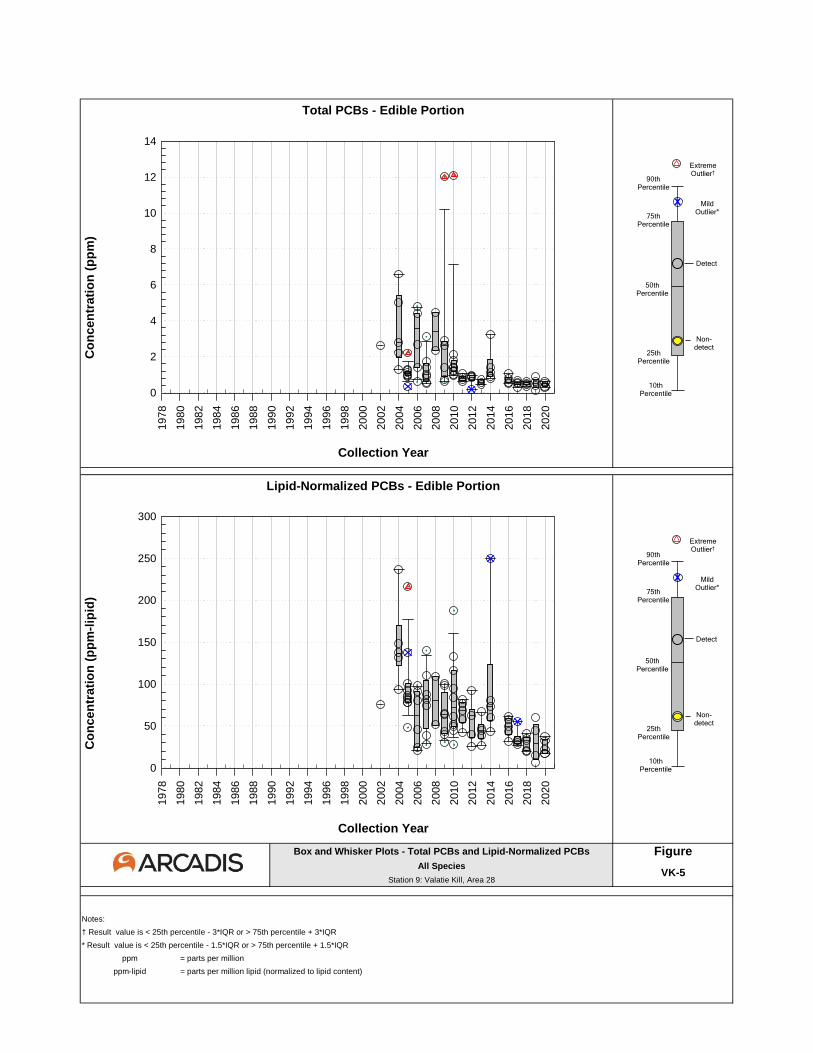
Box and Whisker Plots - Total PCBs and Lipid-Normalized PCBs FigureAll Species
Station 9: Valatie Kill, Area 28
Notes:
† Result value is < 25th percentile - 3*IQR or > 75th percentile + 3*IQR
* Result value is < 25th percentile - 1.5*IQR or > 75th percentile + 1.5*IQR
ppm = parts per million
ppm-lipid = parts per million lipid (normalized to lipid content)
VK-5
Total PCBs - Edible Portion
Co
ncen
trati
on
(p
pm
)
Collection Year
Lipid-Normalized PCBs - Edible Portion
Co
ncen
trati
on
(p
pm
-lip
id)
Collection Year
page intentionally blank
x
10th Percentile
90th Percentile
75th Percentile
25th Percentile
Non-detect
Detect
50th Percentile
MildOutlier*
ExtremeOutlier†
page intentionally blank
x
10th Percentile
90th Percentile
75th Percentile
25th Percentile
Non-detect
Detect
50th Percentile
MildOutlier*
ExtremeOutlier†
1978
1980
1982
1984
1986
1988
1990
1992
1994
1996
1998
2000
2002
2004
2006
2008
2010
2012
2014
2016
2018
2020
0
2
4
6
8
10
12
14
1978
1980
1982
1984
1986
1988
1990
1992
1994
1996
1998
2000
2002
2004
2006
2008
2010
2012
2014
2016
2018
2020
0
50
100
150
200
250
300
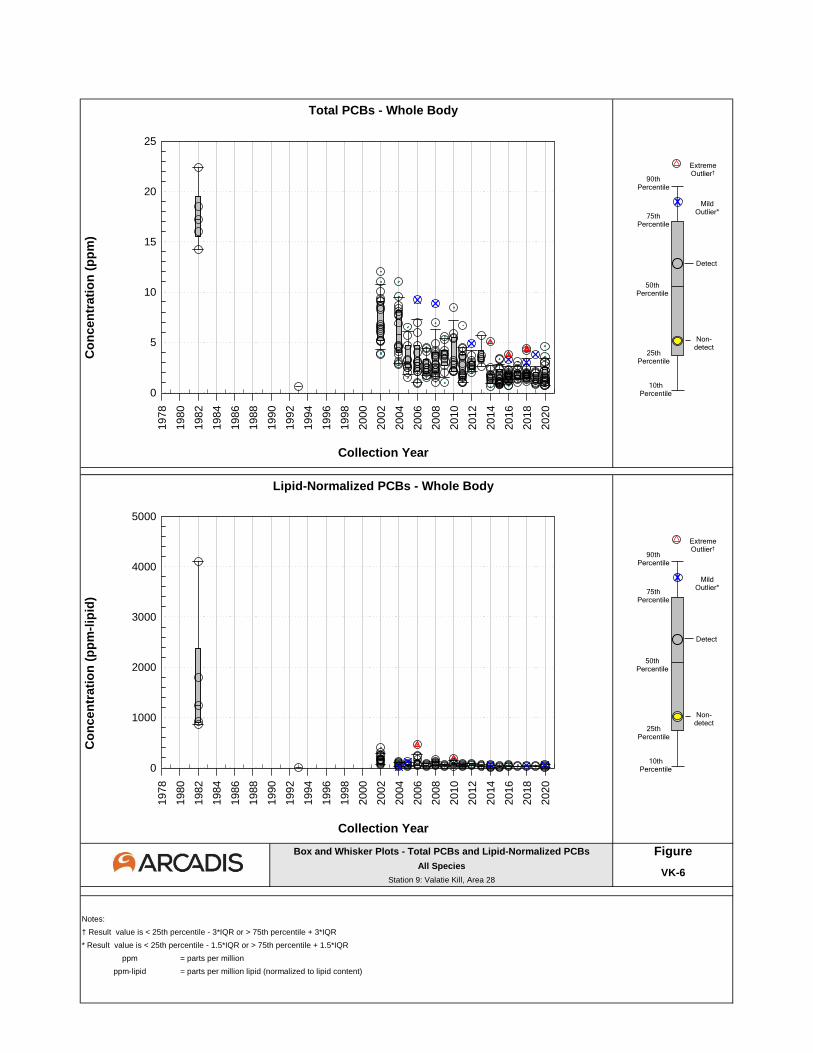
Box and Whisker Plots - Total PCBs and Lipid-Normalized PCBs FigureAll Species
Station 9: Valatie Kill, Area 28
Notes:
† Result value is < 25th percentile - 3*IQR or > 75th percentile + 3*IQR
* Result value is < 25th percentile - 1.5*IQR or > 75th percentile + 1.5*IQR
ppm = parts per million
ppm-lipid = parts per million lipid (normalized to lipid content)
VK-6
Total PCBs - Whole Body
Co
ncen
trati
on
(p
pm
)
Collection Year
Lipid-Normalized PCBs - Whole Body
Co
ncen
trati
on
(p
pm
-lip
id)
Collection Year
page intentionally blank
x
10th Percentile
90th Percentile
75th Percentile
25th Percentile
Non-detect
Detect
50th Percentile
MildOutlier*
ExtremeOutlier†
page intentionally blank
x
10th Percentile
90th Percentile
75th Percentile
25th Percentile
Non-detect
Detect
50th Percentile
MildOutlier*
ExtremeOutlier†
1978
1980
1982
1984
1986
1988
1990
1992
1994
1996
1998
2000
2002
2004
2006
2008
2010
2012
2014
2016
2018
2020
0
5
10
15
20
25
1978
1980
1982
1984
1986
1988
1990
1992
1994
1996
1998
2000
2002
2004
2006
2008
2010
2012
2014
2016
2018
2020
0
1000
2000
3000
4000
5000
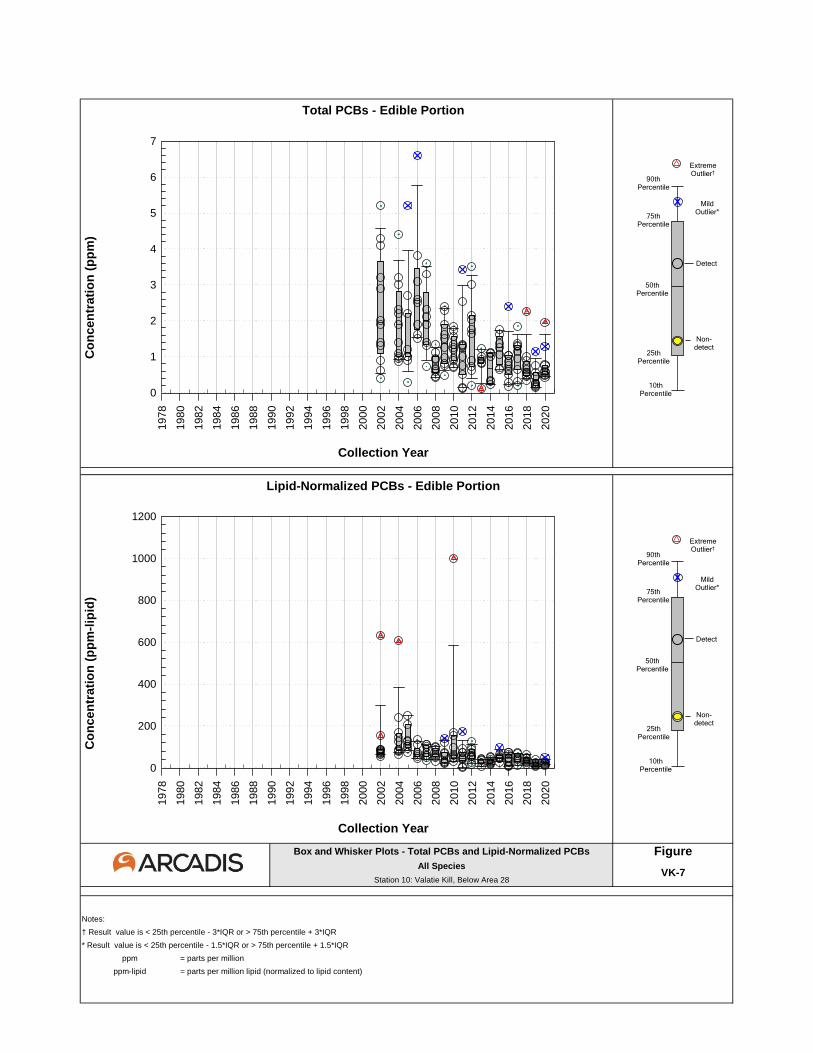
Box and Whisker Plots - Total PCBs and Lipid-Normalized PCBs FigureAll Species
Station 10: Valatie Kill, Below Area 28
Notes:
† Result value is < 25th percentile - 3*IQR or > 75th percentile + 3*IQR
* Result value is < 25th percentile - 1.5*IQR or > 75th percentile + 1.5*IQR
ppm = parts per million
ppm-lipid = parts per million lipid (normalized to lipid content)
VK-7
Total PCBs - Edible Portion
Co
ncen
trati
on
(p
pm
)
Collection Year
Lipid-Normalized PCBs - Edible Portion
Co
ncen
trati
on
(p
pm
-lip
id)
Collection Year
page intentionally blank
x
10th Percentile
90th Percentile
75th Percentile
25th Percentile
Non-detect
Detect
50th Percentile
MildOutlier*
ExtremeOutlier†
page intentionally blank
x
10th Percentile
90th Percentile
75th Percentile
25th Percentile
Non-detect
Detect
50th Percentile
MildOutlier*
ExtremeOutlier†
1978
1980
1982
1984
1986
1988
1990
1992
1994
1996
1998
2000
2002
2004
2006
2008
2010
2012
2014
2016
2018
2020
0
1
2
3
4
5
6
7
1978
1980
1982
1984
1986
1988
1990
1992
1994
1996
1998
2000
2002
2004
2006
2008
2010
2012
2014
2016
2018
2020
0
200
400
600
800
1000
1200
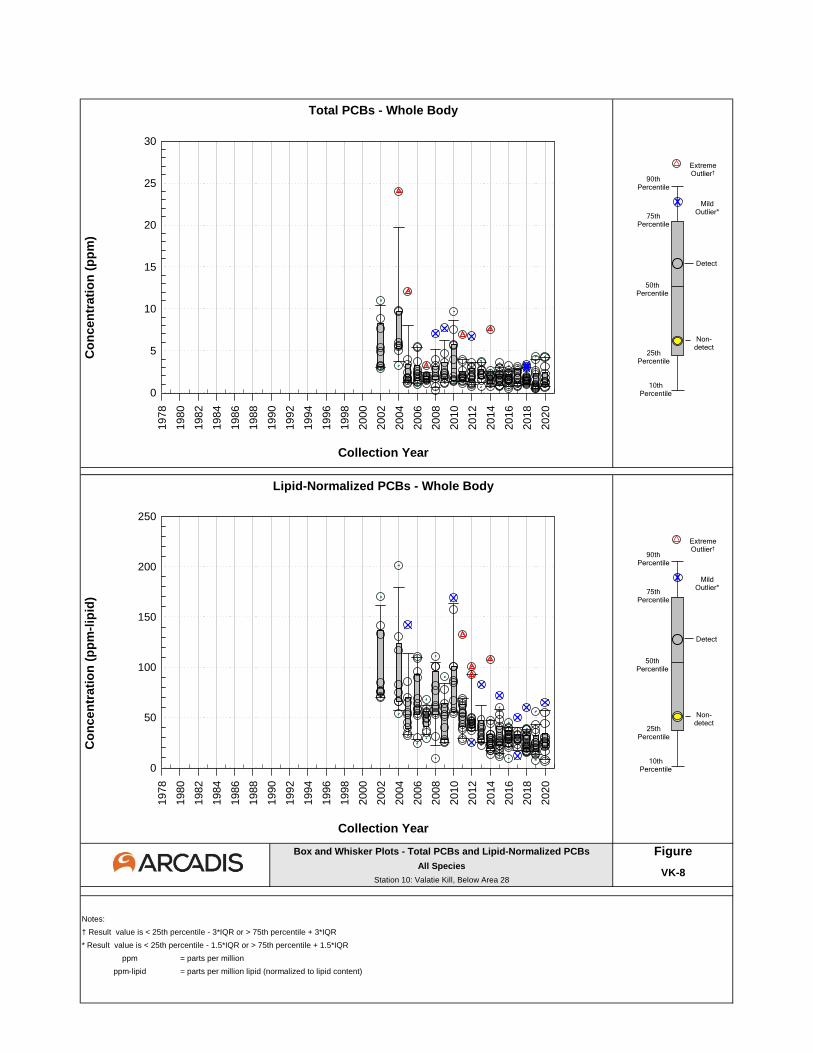
Box and Whisker Plots - Total PCBs and Lipid-Normalized PCBs FigureAll Species
Station 10: Valatie Kill, Below Area 28
Notes:
† Result value is < 25th percentile - 3*IQR or > 75th percentile + 3*IQR
* Result value is < 25th percentile - 1.5*IQR or > 75th percentile + 1.5*IQR
ppm = parts per million
ppm-lipid = parts per million lipid (normalized to lipid content)
VK-8
Total PCBs - Whole Body
Co
ncen
trati
on
(p
pm
)
Collection Year
Lipid-Normalized PCBs - Whole Body
Co
ncen
trati
on
(p
pm
-lip
id)
Collection Year
page intentionally blank
x
10th Percentile
90th Percentile
75th Percentile
25th Percentile
Non-detect
Detect
50th Percentile
MildOutlier*
ExtremeOutlier†
page intentionally blank
x
10th Percentile
90th Percentile
75th Percentile
25th Percentile
Non-detect
Detect
50th Percentile
MildOutlier*
ExtremeOutlier†
1978
1980
1982
1984
1986
1988
1990
1992
1994
1996
1998
2000
2002
2004
2006
2008
2010
2012
2014
2016
2018
2020
0
5
10
15
20
25
30
1978
1980
1982
1984
1986
1988
1990
1992
1994
1996
1998
2000
2002
2004
2006
2008
2010
2012
2014
2016
2018
2020
0
50
100
150
200
250
ATTACHMENT 4
Fish Data Trend Plots –
Nassau Lake
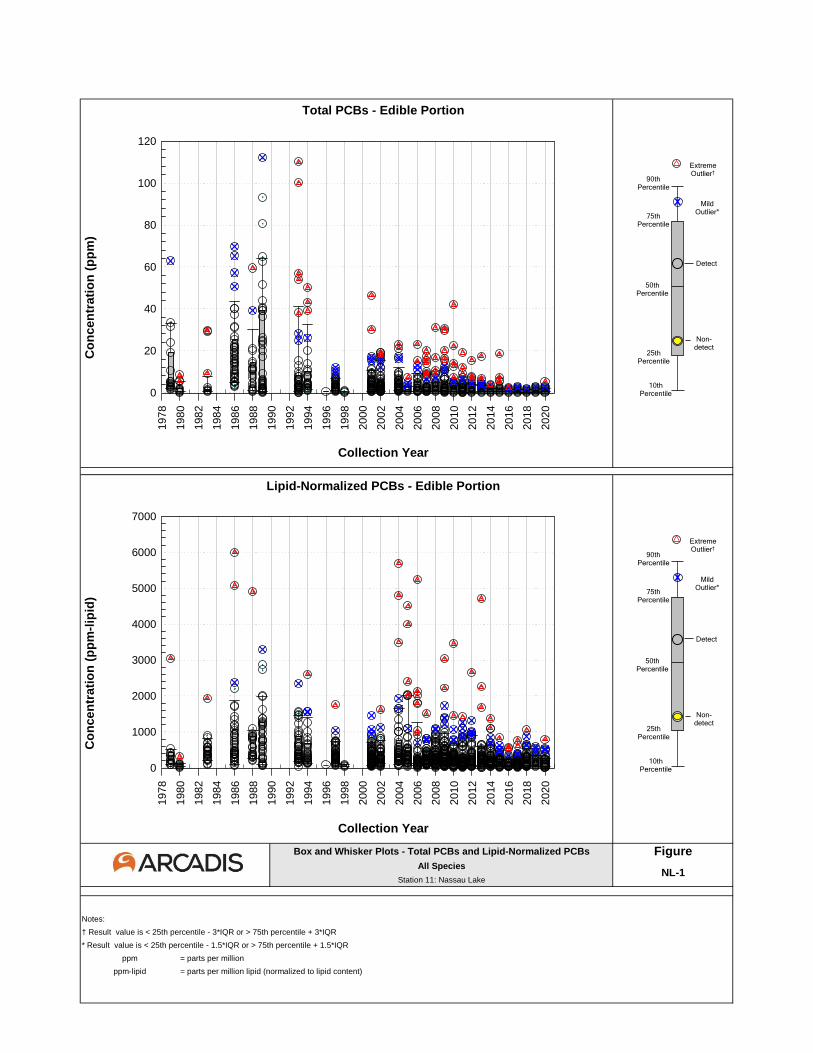
Box and Whisker Plots - Total PCBs and Lipid-Normalized PCBs FigureAll Species
Station 11: Nassau Lake
Notes:
† Result value is < 25th percentile - 3*IQR or > 75th percentile + 3*IQR
* Result value is < 25th percentile - 1.5*IQR or > 75th percentile + 1.5*IQR
ppm = parts per million
ppm-lipid = parts per million lipid (normalized to lipid content)
NL-1
Total PCBs - Edible Portion
Co
ncen
trati
on
(p
pm
)
Collection Year
Lipid-Normalized PCBs - Edible Portion
Co
ncen
trati
on
(p
pm
-lip
id)
Collection Year
page intentionally blank
x
10th Percentile
90th Percentile
75th Percentile
25th Percentile
Non-detect
Detect
50th Percentile
MildOutlier*
ExtremeOutlier†
page intentionally blank
x
10th Percentile
90th Percentile
75th Percentile
25th Percentile
Non-detect
Detect
50th Percentile
MildOutlier*
ExtremeOutlier†
1978
1980
1982
1984
1986
1988
1990
1992
1994
1996
1998
2000
2002
2004
2006
2008
2010
2012
2014
2016
2018
2020
0
20
40
60
80
100
120
1978
1980
1982
1984
1986
1988
1990
1992
1994
1996
1998
2000
2002
2004
2006
2008
2010
2012
2014
2016
2018
2020
0
1000
2000
3000
4000
5000
6000
7000

ATTACHMENT 5
Fish Data Trend Plots –
Summary Statistics
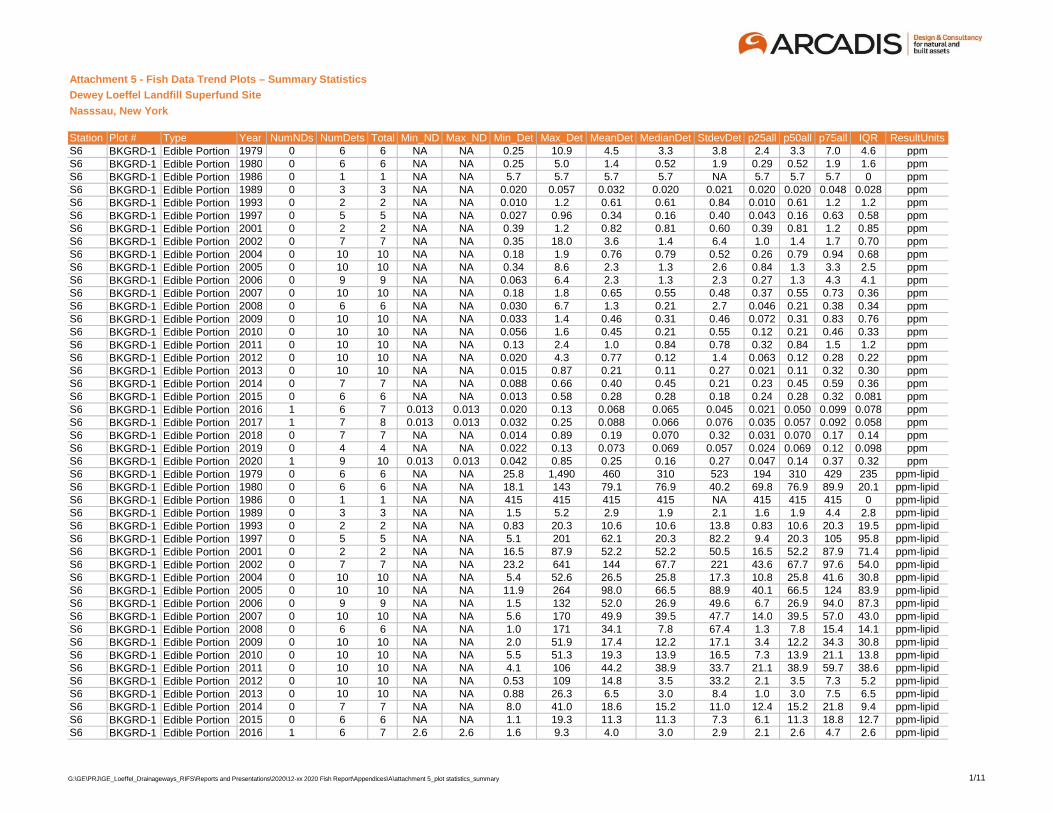
Attachment 5 - Fish Data Trend Plots – Summary Statistics
Dewey Loeffel Landfill Superfund Site
Nasssau, New York
Station Plot # Type Year NumNDs NumDets Total Min_ND Max_ND Min_Det Max_Det MeanDet MedianDet StdevDet p25all p50all p75all IQR ResultUnitsS6 BKGRD-1 Edible Portion 1979 0 6 6 NA NA 0.25 10.9 4.5 3.3 3.8 2.4 3.3 7.0 4.6 ppmS6 BKGRD-1 Edible Portion 1980 0 6 6 NA NA 0.25 5.0 1.4 0.52 1.9 0.29 0.52 1.9 1.6 ppmS6 BKGRD-1 Edible Portion 1986 0 1 1 NA NA 5.7 5.7 5.7 5.7 NA 5.7 5.7 5.7 0 ppmS6 BKGRD-1 Edible Portion 1989 0 3 3 NA NA 0.020 0.057 0.032 0.020 0.021 0.020 0.020 0.048 0.028 ppmS6 BKGRD-1 Edible Portion 1993 0 2 2 NA NA 0.010 1.2 0.61 0.61 0.84 0.010 0.61 1.2 1.2 ppmS6 BKGRD-1 Edible Portion 1997 0 5 5 NA NA 0.027 0.96 0.34 0.16 0.40 0.043 0.16 0.63 0.58 ppmS6 BKGRD-1 Edible Portion 2001 0 2 2 NA NA 0.39 1.2 0.82 0.81 0.60 0.39 0.81 1.2 0.85 ppmS6 BKGRD-1 Edible Portion 2002 0 7 7 NA NA 0.35 18.0 3.6 1.4 6.4 1.0 1.4 1.7 0.70 ppmS6 BKGRD-1 Edible Portion 2004 0 10 10 NA NA 0.18 1.9 0.76 0.79 0.52 0.26 0.79 0.94 0.68 ppmS6 BKGRD-1 Edible Portion 2005 0 10 10 NA NA 0.34 8.6 2.3 1.3 2.6 0.84 1.3 3.3 2.5 ppmS6 BKGRD-1 Edible Portion 2006 0 9 9 NA NA 0.063 6.4 2.3 1.3 2.3 0.27 1.3 4.3 4.1 ppmS6 BKGRD-1 Edible Portion 2007 0 10 10 NA NA 0.18 1.8 0.65 0.55 0.48 0.37 0.55 0.73 0.36 ppmS6 BKGRD-1 Edible Portion 2008 0 6 6 NA NA 0.030 6.7 1.3 0.21 2.7 0.046 0.21 0.38 0.34 ppmS6 BKGRD-1 Edible Portion 2009 0 10 10 NA NA 0.033 1.4 0.46 0.31 0.46 0.072 0.31 0.83 0.76 ppmS6 BKGRD-1 Edible Portion 2010 0 10 10 NA NA 0.056 1.6 0.45 0.21 0.55 0.12 0.21 0.46 0.33 ppmS6 BKGRD-1 Edible Portion 2011 0 10 10 NA NA 0.13 2.4 1.0 0.84 0.78 0.32 0.84 1.5 1.2 ppmS6 BKGRD-1 Edible Portion 2012 0 10 10 NA NA 0.020 4.3 0.77 0.12 1.4 0.063 0.12 0.28 0.22 ppmS6 BKGRD-1 Edible Portion 2013 0 10 10 NA NA 0.015 0.87 0.21 0.11 0.27 0.021 0.11 0.32 0.30 ppmS6 BKGRD-1 Edible Portion 2014 0 7 7 NA NA 0.088 0.66 0.40 0.45 0.21 0.23 0.45 0.59 0.36 ppmS6 BKGRD-1 Edible Portion 2015 0 6 6 NA NA 0.013 0.58 0.28 0.28 0.18 0.24 0.28 0.32 0.081 ppmS6 BKGRD-1 Edible Portion 2016 1 6 7 0.013 0.013 0.020 0.13 0.068 0.065 0.045 0.021 0.050 0.099 0.078 ppmS6 BKGRD-1 Edible Portion 2017 1 7 8 0.013 0.013 0.032 0.25 0.088 0.066 0.076 0.035 0.057 0.092 0.058 ppmS6 BKGRD-1 Edible Portion 2018 0 7 7 NA NA 0.014 0.89 0.19 0.070 0.32 0.031 0.070 0.17 0.14 ppmS6 BKGRD-1 Edible Portion 2019 0 4 4 NA NA 0.022 0.13 0.073 0.069 0.057 0.024 0.069 0.12 0.098 ppmS6 BKGRD-1 Edible Portion 2020 1 9 10 0.013 0.013 0.042 0.85 0.25 0.16 0.27 0.047 0.14 0.37 0.32 ppmS6 BKGRD-1 Edible Portion 1979 0 6 6 NA NA 25.8 1,490 460 310 523 194 310 429 235 ppm-lipidS6 BKGRD-1 Edible Portion 1980 0 6 6 NA NA 18.1 143 79.1 76.9 40.2 69.8 76.9 89.9 20.1 ppm-lipidS6 BKGRD-1 Edible Portion 1986 0 1 1 NA NA 415 415 415 415 NA 415 415 415 0 ppm-lipidS6 BKGRD-1 Edible Portion 1989 0 3 3 NA NA 1.5 5.2 2.9 1.9 2.1 1.6 1.9 4.4 2.8 ppm-lipidS6 BKGRD-1 Edible Portion 1993 0 2 2 NA NA 0.83 20.3 10.6 10.6 13.8 0.83 10.6 20.3 19.5 ppm-lipidS6 BKGRD-1 Edible Portion 1997 0 5 5 NA NA 5.1 201 62.1 20.3 82.2 9.4 20.3 105 95.8 ppm-lipidS6 BKGRD-1 Edible Portion 2001 0 2 2 NA NA 16.5 87.9 52.2 52.2 50.5 16.5 52.2 87.9 71.4 ppm-lipidS6 BKGRD-1 Edible Portion 2002 0 7 7 NA NA 23.2 641 144 67.7 221 43.6 67.7 97.6 54.0 ppm-lipidS6 BKGRD-1 Edible Portion 2004 0 10 10 NA NA 5.4 52.6 26.5 25.8 17.3 10.8 25.8 41.6 30.8 ppm-lipidS6 BKGRD-1 Edible Portion 2005 0 10 10 NA NA 11.9 264 98.0 66.5 88.9 40.1 66.5 124 83.9 ppm-lipidS6 BKGRD-1 Edible Portion 2006 0 9 9 NA NA 1.5 132 52.0 26.9 49.6 6.7 26.9 94.0 87.3 ppm-lipidS6 BKGRD-1 Edible Portion 2007 0 10 10 NA NA 5.6 170 49.9 39.5 47.7 14.0 39.5 57.0 43.0 ppm-lipidS6 BKGRD-1 Edible Portion 2008 0 6 6 NA NA 1.0 171 34.1 7.8 67.4 1.3 7.8 15.4 14.1 ppm-lipidS6 BKGRD-1 Edible Portion 2009 0 10 10 NA NA 2.0 51.9 17.4 12.2 17.1 3.4 12.2 34.3 30.8 ppm-lipidS6 BKGRD-1 Edible Portion 2010 0 10 10 NA NA 5.5 51.3 19.3 13.9 16.5 7.3 13.9 21.1 13.8 ppm-lipidS6 BKGRD-1 Edible Portion 2011 0 10 10 NA NA 4.1 106 44.2 38.9 33.7 21.1 38.9 59.7 38.6 ppm-lipidS6 BKGRD-1 Edible Portion 2012 0 10 10 NA NA 0.53 109 14.8 3.5 33.2 2.1 3.5 7.3 5.2 ppm-lipidS6 BKGRD-1 Edible Portion 2013 0 10 10 NA NA 0.88 26.3 6.5 3.0 8.4 1.0 3.0 7.5 6.5 ppm-lipidS6 BKGRD-1 Edible Portion 2014 0 7 7 NA NA 8.0 41.0 18.6 15.2 11.0 12.4 15.2 21.8 9.4 ppm-lipidS6 BKGRD-1 Edible Portion 2015 0 6 6 NA NA 1.1 19.3 11.3 11.3 7.3 6.1 11.3 18.8 12.7 ppm-lipidS6 BKGRD-1 Edible Portion 2016 1 6 7 2.6 2.6 1.6 9.3 4.0 3.0 2.9 2.1 2.6 4.7 2.6 ppm-lipid
G:\GE\PRJ\GE_Loeffel_Drainageways_RIFS\Reports and Presentations\2020\12-xx 2020 Fish Report\Appendices\A\attachment 5_plot statistics_summary 1/11
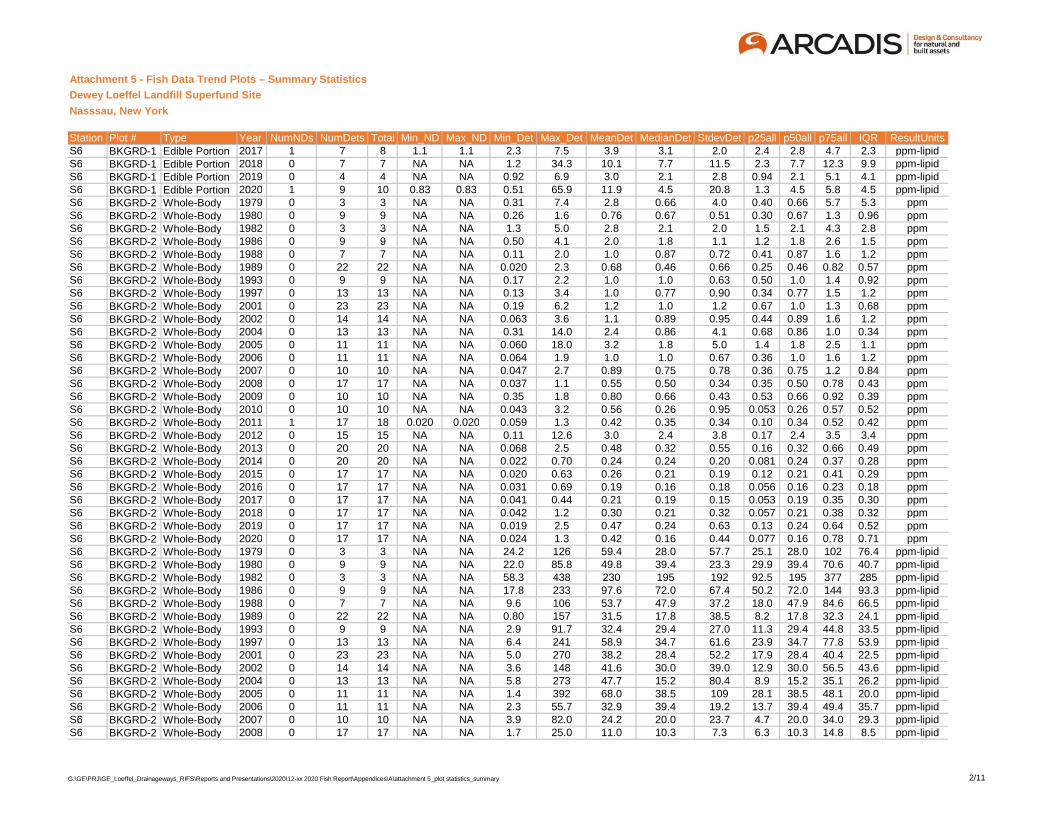
Attachment 5 - Fish Data Trend Plots – Summary Statistics
Dewey Loeffel Landfill Superfund Site
Nasssau, New York
Station Plot # Type Year NumNDs NumDets Total Min_ND Max_ND Min_Det Max_Det MeanDet MedianDet StdevDet p25all p50all p75all IQR ResultUnitsS6 BKGRD-1 Edible Portion 2017 1 7 8 1.1 1.1 2.3 7.5 3.9 3.1 2.0 2.4 2.8 4.7 2.3 ppm-lipidS6 BKGRD-1 Edible Portion 2018 0 7 7 NA NA 1.2 34.3 10.1 7.7 11.5 2.3 7.7 12.3 9.9 ppm-lipidS6 BKGRD-1 Edible Portion 2019 0 4 4 NA NA 0.92 6.9 3.0 2.1 2.8 0.94 2.1 5.1 4.1 ppm-lipidS6 BKGRD-1 Edible Portion 2020 1 9 10 0.83 0.83 0.51 65.9 11.9 4.5 20.8 1.3 4.5 5.8 4.5 ppm-lipidS6 BKGRD-2 Whole-Body 1979 0 3 3 NA NA 0.31 7.4 2.8 0.66 4.0 0.40 0.66 5.7 5.3 ppmS6 BKGRD-2 Whole-Body 1980 0 9 9 NA NA 0.26 1.6 0.76 0.67 0.51 0.30 0.67 1.3 0.96 ppmS6 BKGRD-2 Whole-Body 1982 0 3 3 NA NA 1.3 5.0 2.8 2.1 2.0 1.5 2.1 4.3 2.8 ppmS6 BKGRD-2 Whole-Body 1986 0 9 9 NA NA 0.50 4.1 2.0 1.8 1.1 1.2 1.8 2.6 1.5 ppmS6 BKGRD-2 Whole-Body 1988 0 7 7 NA NA 0.11 2.0 1.0 0.87 0.72 0.41 0.87 1.6 1.2 ppmS6 BKGRD-2 Whole-Body 1989 0 22 22 NA NA 0.020 2.3 0.68 0.46 0.66 0.25 0.46 0.82 0.57 ppmS6 BKGRD-2 Whole-Body 1993 0 9 9 NA NA 0.17 2.2 1.0 1.0 0.63 0.50 1.0 1.4 0.92 ppmS6 BKGRD-2 Whole-Body 1997 0 13 13 NA NA 0.13 3.4 1.0 0.77 0.90 0.34 0.77 1.5 1.2 ppmS6 BKGRD-2 Whole-Body 2001 0 23 23 NA NA 0.19 6.2 1.2 1.0 1.2 0.67 1.0 1.3 0.68 ppmS6 BKGRD-2 Whole-Body 2002 0 14 14 NA NA 0.063 3.6 1.1 0.89 0.95 0.44 0.89 1.6 1.2 ppmS6 BKGRD-2 Whole-Body 2004 0 13 13 NA NA 0.31 14.0 2.4 0.86 4.1 0.68 0.86 1.0 0.34 ppmS6 BKGRD-2 Whole-Body 2005 0 11 11 NA NA 0.060 18.0 3.2 1.8 5.0 1.4 1.8 2.5 1.1 ppmS6 BKGRD-2 Whole-Body 2006 0 11 11 NA NA 0.064 1.9 1.0 1.0 0.67 0.36 1.0 1.6 1.2 ppmS6 BKGRD-2 Whole-Body 2007 0 10 10 NA NA 0.047 2.7 0.89 0.75 0.78 0.36 0.75 1.2 0.84 ppmS6 BKGRD-2 Whole-Body 2008 0 17 17 NA NA 0.037 1.1 0.55 0.50 0.34 0.35 0.50 0.78 0.43 ppmS6 BKGRD-2 Whole-Body 2009 0 10 10 NA NA 0.35 1.8 0.80 0.66 0.43 0.53 0.66 0.92 0.39 ppmS6 BKGRD-2 Whole-Body 2010 0 10 10 NA NA 0.043 3.2 0.56 0.26 0.95 0.053 0.26 0.57 0.52 ppmS6 BKGRD-2 Whole-Body 2011 1 17 18 0.020 0.020 0.059 1.3 0.42 0.35 0.34 0.10 0.34 0.52 0.42 ppmS6 BKGRD-2 Whole-Body 2012 0 15 15 NA NA 0.11 12.6 3.0 2.4 3.8 0.17 2.4 3.5 3.4 ppmS6 BKGRD-2 Whole-Body 2013 0 20 20 NA NA 0.068 2.5 0.48 0.32 0.55 0.16 0.32 0.66 0.49 ppmS6 BKGRD-2 Whole-Body 2014 0 20 20 NA NA 0.022 0.70 0.24 0.24 0.20 0.081 0.24 0.37 0.28 ppmS6 BKGRD-2 Whole-Body 2015 0 17 17 NA NA 0.020 0.63 0.26 0.21 0.19 0.12 0.21 0.41 0.29 ppmS6 BKGRD-2 Whole-Body 2016 0 17 17 NA NA 0.031 0.69 0.19 0.16 0.18 0.056 0.16 0.23 0.18 ppmS6 BKGRD-2 Whole-Body 2017 0 17 17 NA NA 0.041 0.44 0.21 0.19 0.15 0.053 0.19 0.35 0.30 ppmS6 BKGRD-2 Whole-Body 2018 0 17 17 NA NA 0.042 1.2 0.30 0.21 0.32 0.057 0.21 0.38 0.32 ppmS6 BKGRD-2 Whole-Body 2019 0 17 17 NA NA 0.019 2.5 0.47 0.24 0.63 0.13 0.24 0.64 0.52 ppmS6 BKGRD-2 Whole-Body 2020 0 17 17 NA NA 0.024 1.3 0.42 0.16 0.44 0.077 0.16 0.78 0.71 ppmS6 BKGRD-2 Whole-Body 1979 0 3 3 NA NA 24.2 126 59.4 28.0 57.7 25.1 28.0 102 76.4 ppm-lipidS6 BKGRD-2 Whole-Body 1980 0 9 9 NA NA 22.0 85.8 49.8 39.4 23.3 29.9 39.4 70.6 40.7 ppm-lipidS6 BKGRD-2 Whole-Body 1982 0 3 3 NA NA 58.3 438 230 195 192 92.5 195 377 285 ppm-lipidS6 BKGRD-2 Whole-Body 1986 0 9 9 NA NA 17.8 233 97.6 72.0 67.4 50.2 72.0 144 93.3 ppm-lipidS6 BKGRD-2 Whole-Body 1988 0 7 7 NA NA 9.6 106 53.7 47.9 37.2 18.0 47.9 84.6 66.5 ppm-lipidS6 BKGRD-2 Whole-Body 1989 0 22 22 NA NA 0.80 157 31.5 17.8 38.5 8.2 17.8 32.3 24.1 ppm-lipidS6 BKGRD-2 Whole-Body 1993 0 9 9 NA NA 2.9 91.7 32.4 29.4 27.0 11.3 29.4 44.8 33.5 ppm-lipidS6 BKGRD-2 Whole-Body 1997 0 13 13 NA NA 6.4 241 58.9 34.7 61.6 23.9 34.7 77.8 53.9 ppm-lipidS6 BKGRD-2 Whole-Body 2001 0 23 23 NA NA 5.0 270 38.2 28.4 52.2 17.9 28.4 40.4 22.5 ppm-lipidS6 BKGRD-2 Whole-Body 2002 0 14 14 NA NA 3.6 148 41.6 30.0 39.0 12.9 30.0 56.5 43.6 ppm-lipidS6 BKGRD-2 Whole-Body 2004 0 13 13 NA NA 5.8 273 47.7 15.2 80.4 8.9 15.2 35.1 26.2 ppm-lipidS6 BKGRD-2 Whole-Body 2005 0 11 11 NA NA 1.4 392 68.0 38.5 109 28.1 38.5 48.1 20.0 ppm-lipidS6 BKGRD-2 Whole-Body 2006 0 11 11 NA NA 2.3 55.7 32.9 39.4 19.2 13.7 39.4 49.4 35.7 ppm-lipidS6 BKGRD-2 Whole-Body 2007 0 10 10 NA NA 3.9 82.0 24.2 20.0 23.7 4.7 20.0 34.0 29.3 ppm-lipidS6 BKGRD-2 Whole-Body 2008 0 17 17 NA NA 1.7 25.0 11.0 10.3 7.3 6.3 10.3 14.8 8.5 ppm-lipid
G:\GE\PRJ\GE_Loeffel_Drainageways_RIFS\Reports and Presentations\2020\12-xx 2020 Fish Report\Appendices\A\attachment 5_plot statistics_summary 2/11
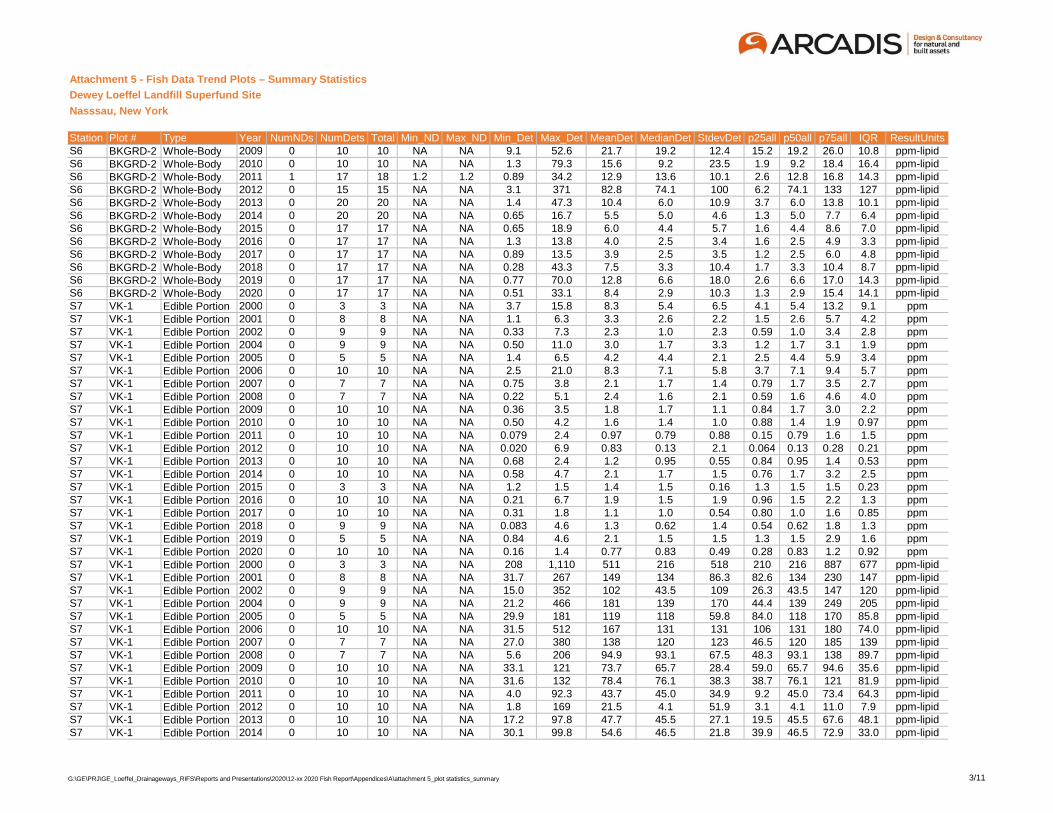
Attachment 5 - Fish Data Trend Plots – Summary Statistics
Dewey Loeffel Landfill Superfund Site
Nasssau, New York
Station Plot # Type Year NumNDs NumDets Total Min_ND Max_ND Min_Det Max_Det MeanDet MedianDet StdevDet p25all p50all p75all IQR ResultUnitsS6 BKGRD-2 Whole-Body 2009 0 10 10 NA NA 9.1 52.6 21.7 19.2 12.4 15.2 19.2 26.0 10.8 ppm-lipidS6 BKGRD-2 Whole-Body 2010 0 10 10 NA NA 1.3 79.3 15.6 9.2 23.5 1.9 9.2 18.4 16.4 ppm-lipidS6 BKGRD-2 Whole-Body 2011 1 17 18 1.2 1.2 0.89 34.2 12.9 13.6 10.1 2.6 12.8 16.8 14.3 ppm-lipidS6 BKGRD-2 Whole-Body 2012 0 15 15 NA NA 3.1 371 82.8 74.1 100 6.2 74.1 133 127 ppm-lipidS6 BKGRD-2 Whole-Body 2013 0 20 20 NA NA 1.4 47.3 10.4 6.0 10.9 3.7 6.0 13.8 10.1 ppm-lipidS6 BKGRD-2 Whole-Body 2014 0 20 20 NA NA 0.65 16.7 5.5 5.0 4.6 1.3 5.0 7.7 6.4 ppm-lipidS6 BKGRD-2 Whole-Body 2015 0 17 17 NA NA 0.65 18.9 6.0 4.4 5.7 1.6 4.4 8.6 7.0 ppm-lipidS6 BKGRD-2 Whole-Body 2016 0 17 17 NA NA 1.3 13.8 4.0 2.5 3.4 1.6 2.5 4.9 3.3 ppm-lipidS6 BKGRD-2 Whole-Body 2017 0 17 17 NA NA 0.89 13.5 3.9 2.5 3.5 1.2 2.5 6.0 4.8 ppm-lipidS6 BKGRD-2 Whole-Body 2018 0 17 17 NA NA 0.28 43.3 7.5 3.3 10.4 1.7 3.3 10.4 8.7 ppm-lipidS6 BKGRD-2 Whole-Body 2019 0 17 17 NA NA 0.77 70.0 12.8 6.6 18.0 2.6 6.6 17.0 14.3 ppm-lipidS6 BKGRD-2 Whole-Body 2020 0 17 17 NA NA 0.51 33.1 8.4 2.9 10.3 1.3 2.9 15.4 14.1 ppm-lipidS7 VK-1 Edible Portion 2000 0 3 3 NA NA 3.7 15.8 8.3 5.4 6.5 4.1 5.4 13.2 9.1 ppmS7 VK-1 Edible Portion 2001 0 8 8 NA NA 1.1 6.3 3.3 2.6 2.2 1.5 2.6 5.7 4.2 ppmS7 VK-1 Edible Portion 2002 0 9 9 NA NA 0.33 7.3 2.3 1.0 2.3 0.59 1.0 3.4 2.8 ppmS7 VK-1 Edible Portion 2004 0 9 9 NA NA 0.50 11.0 3.0 1.7 3.3 1.2 1.7 3.1 1.9 ppmS7 VK-1 Edible Portion 2005 0 5 5 NA NA 1.4 6.5 4.2 4.4 2.1 2.5 4.4 5.9 3.4 ppmS7 VK-1 Edible Portion 2006 0 10 10 NA NA 2.5 21.0 8.3 7.1 5.8 3.7 7.1 9.4 5.7 ppmS7 VK-1 Edible Portion 2007 0 7 7 NA NA 0.75 3.8 2.1 1.7 1.4 0.79 1.7 3.5 2.7 ppmS7 VK-1 Edible Portion 2008 0 7 7 NA NA 0.22 5.1 2.4 1.6 2.1 0.59 1.6 4.6 4.0 ppmS7 VK-1 Edible Portion 2009 0 10 10 NA NA 0.36 3.5 1.8 1.7 1.1 0.84 1.7 3.0 2.2 ppmS7 VK-1 Edible Portion 2010 0 10 10 NA NA 0.50 4.2 1.6 1.4 1.0 0.88 1.4 1.9 0.97 ppmS7 VK-1 Edible Portion 2011 0 10 10 NA NA 0.079 2.4 0.97 0.79 0.88 0.15 0.79 1.6 1.5 ppmS7 VK-1 Edible Portion 2012 0 10 10 NA NA 0.020 6.9 0.83 0.13 2.1 0.064 0.13 0.28 0.21 ppmS7 VK-1 Edible Portion 2013 0 10 10 NA NA 0.68 2.4 1.2 0.95 0.55 0.84 0.95 1.4 0.53 ppmS7 VK-1 Edible Portion 2014 0 10 10 NA NA 0.58 4.7 2.1 1.7 1.5 0.76 1.7 3.2 2.5 ppmS7 VK-1 Edible Portion 2015 0 3 3 NA NA 1.2 1.5 1.4 1.5 0.16 1.3 1.5 1.5 0.23 ppmS7 VK-1 Edible Portion 2016 0 10 10 NA NA 0.21 6.7 1.9 1.5 1.9 0.96 1.5 2.2 1.3 ppmS7 VK-1 Edible Portion 2017 0 10 10 NA NA 0.31 1.8 1.1 1.0 0.54 0.80 1.0 1.6 0.85 ppmS7 VK-1 Edible Portion 2018 0 9 9 NA NA 0.083 4.6 1.3 0.62 1.4 0.54 0.62 1.8 1.3 ppmS7 VK-1 Edible Portion 2019 0 5 5 NA NA 0.84 4.6 2.1 1.5 1.5 1.3 1.5 2.9 1.6 ppmS7 VK-1 Edible Portion 2020 0 10 10 NA NA 0.16 1.4 0.77 0.83 0.49 0.28 0.83 1.2 0.92 ppmS7 VK-1 Edible Portion 2000 0 3 3 NA NA 208 1,110 511 216 518 210 216 887 677 ppm-lipidS7 VK-1 Edible Portion 2001 0 8 8 NA NA 31.7 267 149 134 86.3 82.6 134 230 147 ppm-lipidS7 VK-1 Edible Portion 2002 0 9 9 NA NA 15.0 352 102 43.5 109 26.3 43.5 147 120 ppm-lipidS7 VK-1 Edible Portion 2004 0 9 9 NA NA 21.2 466 181 139 170 44.4 139 249 205 ppm-lipidS7 VK-1 Edible Portion 2005 0 5 5 NA NA 29.9 181 119 118 59.8 84.0 118 170 85.8 ppm-lipidS7 VK-1 Edible Portion 2006 0 10 10 NA NA 31.5 512 167 131 131 106 131 180 74.0 ppm-lipidS7 VK-1 Edible Portion 2007 0 7 7 NA NA 27.0 380 138 120 123 46.5 120 185 139 ppm-lipidS7 VK-1 Edible Portion 2008 0 7 7 NA NA 5.6 206 94.9 93.1 67.5 48.3 93.1 138 89.7 ppm-lipidS7 VK-1 Edible Portion 2009 0 10 10 NA NA 33.1 121 73.7 65.7 28.4 59.0 65.7 94.6 35.6 ppm-lipidS7 VK-1 Edible Portion 2010 0 10 10 NA NA 31.6 132 78.4 76.1 38.3 38.7 76.1 121 81.9 ppm-lipidS7 VK-1 Edible Portion 2011 0 10 10 NA NA 4.0 92.3 43.7 45.0 34.9 9.2 45.0 73.4 64.3 ppm-lipidS7 VK-1 Edible Portion 2012 0 10 10 NA NA 1.8 169 21.5 4.1 51.9 3.1 4.1 11.0 7.9 ppm-lipidS7 VK-1 Edible Portion 2013 0 10 10 NA NA 17.2 97.8 47.7 45.5 27.1 19.5 45.5 67.6 48.1 ppm-lipidS7 VK-1 Edible Portion 2014 0 10 10 NA NA 30.1 99.8 54.6 46.5 21.8 39.9 46.5 72.9 33.0 ppm-lipid
G:\GE\PRJ\GE_Loeffel_Drainageways_RIFS\Reports and Presentations\2020\12-xx 2020 Fish Report\Appendices\A\attachment 5_plot statistics_summary 3/11
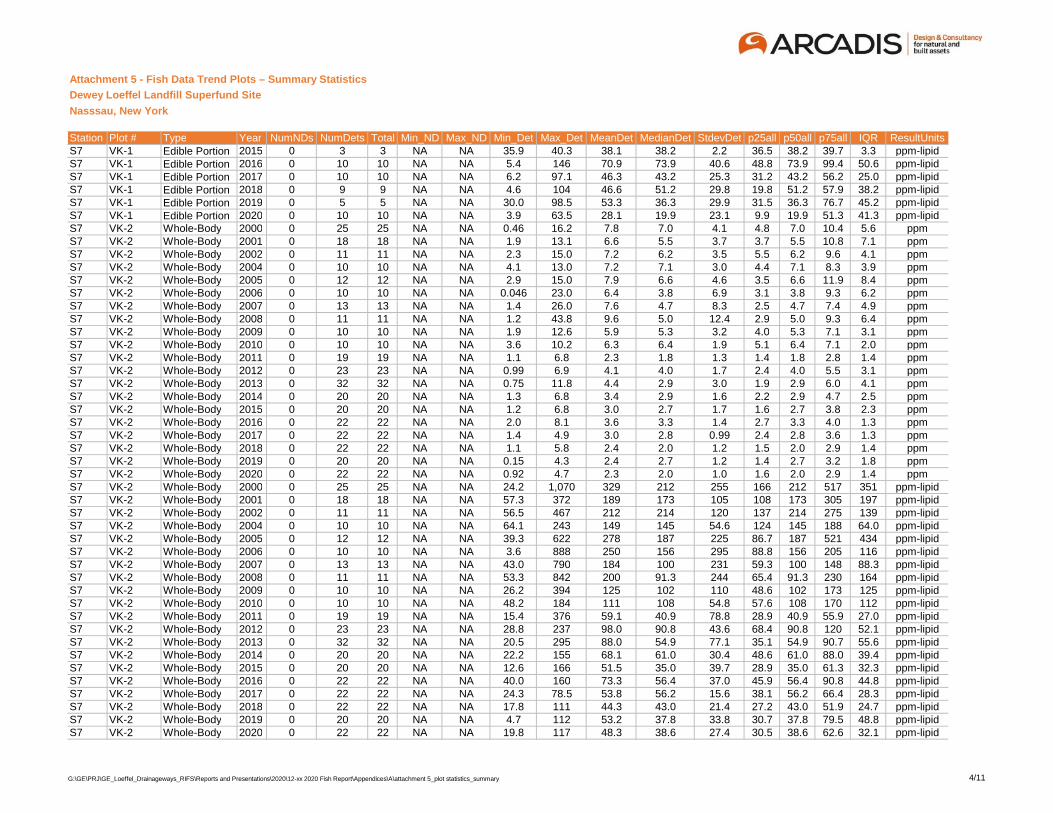
Attachment 5 - Fish Data Trend Plots – Summary Statistics
Dewey Loeffel Landfill Superfund Site
Nasssau, New York
Station Plot # Type Year NumNDs NumDets Total Min_ND Max_ND Min_Det Max_Det MeanDet MedianDet StdevDet p25all p50all p75all IQR ResultUnitsS7 VK-1 Edible Portion 2015 0 3 3 NA NA 35.9 40.3 38.1 38.2 2.2 36.5 38.2 39.7 3.3 ppm-lipidS7 VK-1 Edible Portion 2016 0 10 10 NA NA 5.4 146 70.9 73.9 40.6 48.8 73.9 99.4 50.6 ppm-lipidS7 VK-1 Edible Portion 2017 0 10 10 NA NA 6.2 97.1 46.3 43.2 25.3 31.2 43.2 56.2 25.0 ppm-lipidS7 VK-1 Edible Portion 2018 0 9 9 NA NA 4.6 104 46.6 51.2 29.8 19.8 51.2 57.9 38.2 ppm-lipidS7 VK-1 Edible Portion 2019 0 5 5 NA NA 30.0 98.5 53.3 36.3 29.9 31.5 36.3 76.7 45.2 ppm-lipidS7 VK-1 Edible Portion 2020 0 10 10 NA NA 3.9 63.5 28.1 19.9 23.1 9.9 19.9 51.3 41.3 ppm-lipidS7 VK-2 Whole-Body 2000 0 25 25 NA NA 0.46 16.2 7.8 7.0 4.1 4.8 7.0 10.4 5.6 ppmS7 VK-2 Whole-Body 2001 0 18 18 NA NA 1.9 13.1 6.6 5.5 3.7 3.7 5.5 10.8 7.1 ppmS7 VK-2 Whole-Body 2002 0 11 11 NA NA 2.3 15.0 7.2 6.2 3.5 5.5 6.2 9.6 4.1 ppmS7 VK-2 Whole-Body 2004 0 10 10 NA NA 4.1 13.0 7.2 7.1 3.0 4.4 7.1 8.3 3.9 ppmS7 VK-2 Whole-Body 2005 0 12 12 NA NA 2.9 15.0 7.9 6.6 4.6 3.5 6.6 11.9 8.4 ppmS7 VK-2 Whole-Body 2006 0 10 10 NA NA 0.046 23.0 6.4 3.8 6.9 3.1 3.8 9.3 6.2 ppmS7 VK-2 Whole-Body 2007 0 13 13 NA NA 1.4 26.0 7.6 4.7 8.3 2.5 4.7 7.4 4.9 ppmS7 VK-2 Whole-Body 2008 0 11 11 NA NA 1.2 43.8 9.6 5.0 12.4 2.9 5.0 9.3 6.4 ppmS7 VK-2 Whole-Body 2009 0 10 10 NA NA 1.9 12.6 5.9 5.3 3.2 4.0 5.3 7.1 3.1 ppmS7 VK-2 Whole-Body 2010 0 10 10 NA NA 3.6 10.2 6.3 6.4 1.9 5.1 6.4 7.1 2.0 ppmS7 VK-2 Whole-Body 2011 0 19 19 NA NA 1.1 6.8 2.3 1.8 1.3 1.4 1.8 2.8 1.4 ppmS7 VK-2 Whole-Body 2012 0 23 23 NA NA 0.99 6.9 4.1 4.0 1.7 2.4 4.0 5.5 3.1 ppmS7 VK-2 Whole-Body 2013 0 32 32 NA NA 0.75 11.8 4.4 2.9 3.0 1.9 2.9 6.0 4.1 ppmS7 VK-2 Whole-Body 2014 0 20 20 NA NA 1.3 6.8 3.4 2.9 1.6 2.2 2.9 4.7 2.5 ppmS7 VK-2 Whole-Body 2015 0 20 20 NA NA 1.2 6.8 3.0 2.7 1.7 1.6 2.7 3.8 2.3 ppmS7 VK-2 Whole-Body 2016 0 22 22 NA NA 2.0 8.1 3.6 3.3 1.4 2.7 3.3 4.0 1.3 ppmS7 VK-2 Whole-Body 2017 0 22 22 NA NA 1.4 4.9 3.0 2.8 0.99 2.4 2.8 3.6 1.3 ppmS7 VK-2 Whole-Body 2018 0 22 22 NA NA 1.1 5.8 2.4 2.0 1.2 1.5 2.0 2.9 1.4 ppmS7 VK-2 Whole-Body 2019 0 20 20 NA NA 0.15 4.3 2.4 2.7 1.2 1.4 2.7 3.2 1.8 ppmS7 VK-2 Whole-Body 2020 0 22 22 NA NA 0.92 4.7 2.3 2.0 1.0 1.6 2.0 2.9 1.4 ppmS7 VK-2 Whole-Body 2000 0 25 25 NA NA 24.2 1,070 329 212 255 166 212 517 351 ppm-lipidS7 VK-2 Whole-Body 2001 0 18 18 NA NA 57.3 372 189 173 105 108 173 305 197 ppm-lipidS7 VK-2 Whole-Body 2002 0 11 11 NA NA 56.5 467 212 214 120 137 214 275 139 ppm-lipidS7 VK-2 Whole-Body 2004 0 10 10 NA NA 64.1 243 149 145 54.6 124 145 188 64.0 ppm-lipidS7 VK-2 Whole-Body 2005 0 12 12 NA NA 39.3 622 278 187 225 86.7 187 521 434 ppm-lipidS7 VK-2 Whole-Body 2006 0 10 10 NA NA 3.6 888 250 156 295 88.8 156 205 116 ppm-lipidS7 VK-2 Whole-Body 2007 0 13 13 NA NA 43.0 790 184 100 231 59.3 100 148 88.3 ppm-lipidS7 VK-2 Whole-Body 2008 0 11 11 NA NA 53.3 842 200 91.3 244 65.4 91.3 230 164 ppm-lipidS7 VK-2 Whole-Body 2009 0 10 10 NA NA 26.2 394 125 102 110 48.6 102 173 125 ppm-lipidS7 VK-2 Whole-Body 2010 0 10 10 NA NA 48.2 184 111 108 54.8 57.6 108 170 112 ppm-lipidS7 VK-2 Whole-Body 2011 0 19 19 NA NA 15.4 376 59.1 40.9 78.8 28.9 40.9 55.9 27.0 ppm-lipidS7 VK-2 Whole-Body 2012 0 23 23 NA NA 28.8 237 98.0 90.8 43.6 68.4 90.8 120 52.1 ppm-lipidS7 VK-2 Whole-Body 2013 0 32 32 NA NA 20.5 295 88.0 54.9 77.1 35.1 54.9 90.7 55.6 ppm-lipidS7 VK-2 Whole-Body 2014 0 20 20 NA NA 22.2 155 68.1 61.0 30.4 48.6 61.0 88.0 39.4 ppm-lipidS7 VK-2 Whole-Body 2015 0 20 20 NA NA 12.6 166 51.5 35.0 39.7 28.9 35.0 61.3 32.3 ppm-lipidS7 VK-2 Whole-Body 2016 0 22 22 NA NA 40.0 160 73.3 56.4 37.0 45.9 56.4 90.8 44.8 ppm-lipidS7 VK-2 Whole-Body 2017 0 22 22 NA NA 24.3 78.5 53.8 56.2 15.6 38.1 56.2 66.4 28.3 ppm-lipidS7 VK-2 Whole-Body 2018 0 22 22 NA NA 17.8 111 44.3 43.0 21.4 27.2 43.0 51.9 24.7 ppm-lipidS7 VK-2 Whole-Body 2019 0 20 20 NA NA 4.7 112 53.2 37.8 33.8 30.7 37.8 79.5 48.8 ppm-lipidS7 VK-2 Whole-Body 2020 0 22 22 NA NA 19.8 117 48.3 38.6 27.4 30.5 38.6 62.6 32.1 ppm-lipid
G:\GE\PRJ\GE_Loeffel_Drainageways_RIFS\Reports and Presentations\2020\12-xx 2020 Fish Report\Appendices\A\attachment 5_plot statistics_summary 4/11
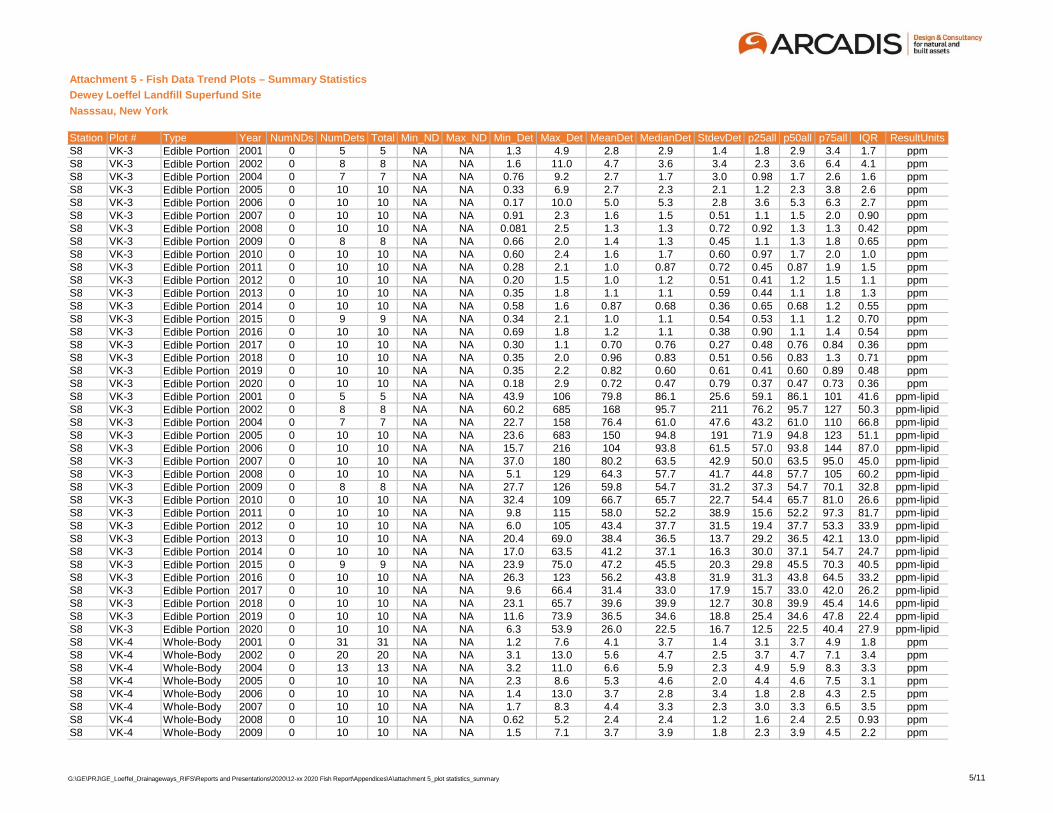
Attachment 5 - Fish Data Trend Plots – Summary Statistics
Dewey Loeffel Landfill Superfund Site
Nasssau, New York
Station Plot # Type Year NumNDs NumDets Total Min_ND Max_ND Min_Det Max_Det MeanDet MedianDet StdevDet p25all p50all p75all IQR ResultUnitsS8 VK-3 Edible Portion 2001 0 5 5 NA NA 1.3 4.9 2.8 2.9 1.4 1.8 2.9 3.4 1.7 ppmS8 VK-3 Edible Portion 2002 0 8 8 NA NA 1.6 11.0 4.7 3.6 3.4 2.3 3.6 6.4 4.1 ppmS8 VK-3 Edible Portion 2004 0 7 7 NA NA 0.76 9.2 2.7 1.7 3.0 0.98 1.7 2.6 1.6 ppmS8 VK-3 Edible Portion 2005 0 10 10 NA NA 0.33 6.9 2.7 2.3 2.1 1.2 2.3 3.8 2.6 ppmS8 VK-3 Edible Portion 2006 0 10 10 NA NA 0.17 10.0 5.0 5.3 2.8 3.6 5.3 6.3 2.7 ppmS8 VK-3 Edible Portion 2007 0 10 10 NA NA 0.91 2.3 1.6 1.5 0.51 1.1 1.5 2.0 0.90 ppmS8 VK-3 Edible Portion 2008 0 10 10 NA NA 0.081 2.5 1.3 1.3 0.72 0.92 1.3 1.3 0.42 ppmS8 VK-3 Edible Portion 2009 0 8 8 NA NA 0.66 2.0 1.4 1.3 0.45 1.1 1.3 1.8 0.65 ppmS8 VK-3 Edible Portion 2010 0 10 10 NA NA 0.60 2.4 1.6 1.7 0.60 0.97 1.7 2.0 1.0 ppmS8 VK-3 Edible Portion 2011 0 10 10 NA NA 0.28 2.1 1.0 0.87 0.72 0.45 0.87 1.9 1.5 ppmS8 VK-3 Edible Portion 2012 0 10 10 NA NA 0.20 1.5 1.0 1.2 0.51 0.41 1.2 1.5 1.1 ppmS8 VK-3 Edible Portion 2013 0 10 10 NA NA 0.35 1.8 1.1 1.1 0.59 0.44 1.1 1.8 1.3 ppmS8 VK-3 Edible Portion 2014 0 10 10 NA NA 0.58 1.6 0.87 0.68 0.36 0.65 0.68 1.2 0.55 ppmS8 VK-3 Edible Portion 2015 0 9 9 NA NA 0.34 2.1 1.0 1.1 0.54 0.53 1.1 1.2 0.70 ppmS8 VK-3 Edible Portion 2016 0 10 10 NA NA 0.69 1.8 1.2 1.1 0.38 0.90 1.1 1.4 0.54 ppmS8 VK-3 Edible Portion 2017 0 10 10 NA NA 0.30 1.1 0.70 0.76 0.27 0.48 0.76 0.84 0.36 ppmS8 VK-3 Edible Portion 2018 0 10 10 NA NA 0.35 2.0 0.96 0.83 0.51 0.56 0.83 1.3 0.71 ppmS8 VK-3 Edible Portion 2019 0 10 10 NA NA 0.35 2.2 0.82 0.60 0.61 0.41 0.60 0.89 0.48 ppmS8 VK-3 Edible Portion 2020 0 10 10 NA NA 0.18 2.9 0.72 0.47 0.79 0.37 0.47 0.73 0.36 ppmS8 VK-3 Edible Portion 2001 0 5 5 NA NA 43.9 106 79.8 86.1 25.6 59.1 86.1 101 41.6 ppm-lipidS8 VK-3 Edible Portion 2002 0 8 8 NA NA 60.2 685 168 95.7 211 76.2 95.7 127 50.3 ppm-lipidS8 VK-3 Edible Portion 2004 0 7 7 NA NA 22.7 158 76.4 61.0 47.6 43.2 61.0 110 66.8 ppm-lipidS8 VK-3 Edible Portion 2005 0 10 10 NA NA 23.6 683 150 94.8 191 71.9 94.8 123 51.1 ppm-lipidS8 VK-3 Edible Portion 2006 0 10 10 NA NA 15.7 216 104 93.8 61.5 57.0 93.8 144 87.0 ppm-lipidS8 VK-3 Edible Portion 2007 0 10 10 NA NA 37.0 180 80.2 63.5 42.9 50.0 63.5 95.0 45.0 ppm-lipidS8 VK-3 Edible Portion 2008 0 10 10 NA NA 5.1 129 64.3 57.7 41.7 44.8 57.7 105 60.2 ppm-lipidS8 VK-3 Edible Portion 2009 0 8 8 NA NA 27.7 126 59.8 54.7 31.2 37.3 54.7 70.1 32.8 ppm-lipidS8 VK-3 Edible Portion 2010 0 10 10 NA NA 32.4 109 66.7 65.7 22.7 54.4 65.7 81.0 26.6 ppm-lipidS8 VK-3 Edible Portion 2011 0 10 10 NA NA 9.8 115 58.0 52.2 38.9 15.6 52.2 97.3 81.7 ppm-lipidS8 VK-3 Edible Portion 2012 0 10 10 NA NA 6.0 105 43.4 37.7 31.5 19.4 37.7 53.3 33.9 ppm-lipidS8 VK-3 Edible Portion 2013 0 10 10 NA NA 20.4 69.0 38.4 36.5 13.7 29.2 36.5 42.1 13.0 ppm-lipidS8 VK-3 Edible Portion 2014 0 10 10 NA NA 17.0 63.5 41.2 37.1 16.3 30.0 37.1 54.7 24.7 ppm-lipidS8 VK-3 Edible Portion 2015 0 9 9 NA NA 23.9 75.0 47.2 45.5 20.3 29.8 45.5 70.3 40.5 ppm-lipidS8 VK-3 Edible Portion 2016 0 10 10 NA NA 26.3 123 56.2 43.8 31.9 31.3 43.8 64.5 33.2 ppm-lipidS8 VK-3 Edible Portion 2017 0 10 10 NA NA 9.6 66.4 31.4 33.0 17.9 15.7 33.0 42.0 26.2 ppm-lipidS8 VK-3 Edible Portion 2018 0 10 10 NA NA 23.1 65.7 39.6 39.9 12.7 30.8 39.9 45.4 14.6 ppm-lipidS8 VK-3 Edible Portion 2019 0 10 10 NA NA 11.6 73.9 36.5 34.6 18.8 25.4 34.6 47.8 22.4 ppm-lipidS8 VK-3 Edible Portion 2020 0 10 10 NA NA 6.3 53.9 26.0 22.5 16.7 12.5 22.5 40.4 27.9 ppm-lipidS8 VK-4 Whole-Body 2001 0 31 31 NA NA 1.2 7.6 4.1 3.7 1.4 3.1 3.7 4.9 1.8 ppmS8 VK-4 Whole-Body 2002 0 20 20 NA NA 3.1 13.0 5.6 4.7 2.5 3.7 4.7 7.1 3.4 ppmS8 VK-4 Whole-Body 2004 0 13 13 NA NA 3.2 11.0 6.6 5.9 2.3 4.9 5.9 8.3 3.3 ppmS8 VK-4 Whole-Body 2005 0 10 10 NA NA 2.3 8.6 5.3 4.6 2.0 4.4 4.6 7.5 3.1 ppmS8 VK-4 Whole-Body 2006 0 10 10 NA NA 1.4 13.0 3.7 2.8 3.4 1.8 2.8 4.3 2.5 ppmS8 VK-4 Whole-Body 2007 0 10 10 NA NA 1.7 8.3 4.4 3.3 2.3 3.0 3.3 6.5 3.5 ppmS8 VK-4 Whole-Body 2008 0 10 10 NA NA 0.62 5.2 2.4 2.4 1.2 1.6 2.4 2.5 0.93 ppmS8 VK-4 Whole-Body 2009 0 10 10 NA NA 1.5 7.1 3.7 3.9 1.8 2.3 3.9 4.5 2.2 ppm
G:\GE\PRJ\GE_Loeffel_Drainageways_RIFS\Reports and Presentations\2020\12-xx 2020 Fish Report\Appendices\A\attachment 5_plot statistics_summary 5/11
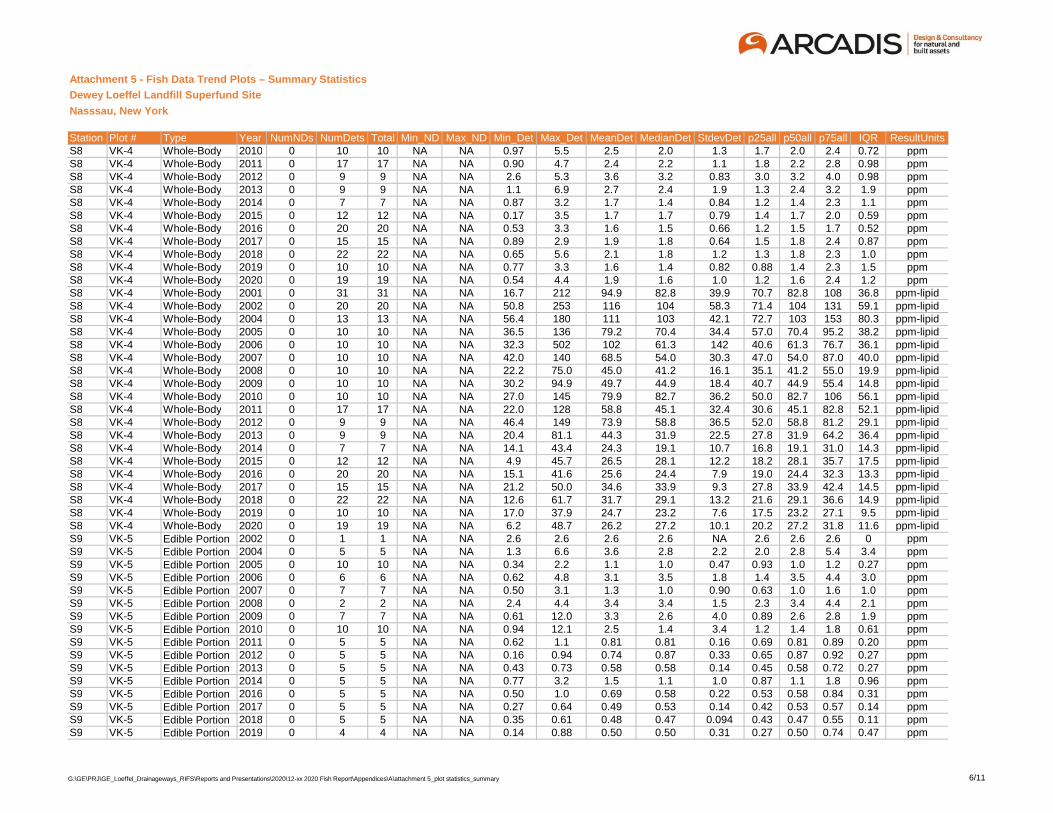
Attachment 5 - Fish Data Trend Plots – Summary Statistics
Dewey Loeffel Landfill Superfund Site
Nasssau, New York
Station Plot # Type Year NumNDs NumDets Total Min_ND Max_ND Min_Det Max_Det MeanDet MedianDet StdevDet p25all p50all p75all IQR ResultUnitsS8 VK-4 Whole-Body 2010 0 10 10 NA NA 0.97 5.5 2.5 2.0 1.3 1.7 2.0 2.4 0.72 ppmS8 VK-4 Whole-Body 2011 0 17 17 NA NA 0.90 4.7 2.4 2.2 1.1 1.8 2.2 2.8 0.98 ppmS8 VK-4 Whole-Body 2012 0 9 9 NA NA 2.6 5.3 3.6 3.2 0.83 3.0 3.2 4.0 0.98 ppmS8 VK-4 Whole-Body 2013 0 9 9 NA NA 1.1 6.9 2.7 2.4 1.9 1.3 2.4 3.2 1.9 ppmS8 VK-4 Whole-Body 2014 0 7 7 NA NA 0.87 3.2 1.7 1.4 0.84 1.2 1.4 2.3 1.1 ppmS8 VK-4 Whole-Body 2015 0 12 12 NA NA 0.17 3.5 1.7 1.7 0.79 1.4 1.7 2.0 0.59 ppmS8 VK-4 Whole-Body 2016 0 20 20 NA NA 0.53 3.3 1.6 1.5 0.66 1.2 1.5 1.7 0.52 ppmS8 VK-4 Whole-Body 2017 0 15 15 NA NA 0.89 2.9 1.9 1.8 0.64 1.5 1.8 2.4 0.87 ppmS8 VK-4 Whole-Body 2018 0 22 22 NA NA 0.65 5.6 2.1 1.8 1.2 1.3 1.8 2.3 1.0 ppmS8 VK-4 Whole-Body 2019 0 10 10 NA NA 0.77 3.3 1.6 1.4 0.82 0.88 1.4 2.3 1.5 ppmS8 VK-4 Whole-Body 2020 0 19 19 NA NA 0.54 4.4 1.9 1.6 1.0 1.2 1.6 2.4 1.2 ppmS8 VK-4 Whole-Body 2001 0 31 31 NA NA 16.7 212 94.9 82.8 39.9 70.7 82.8 108 36.8 ppm-lipidS8 VK-4 Whole-Body 2002 0 20 20 NA NA 50.8 253 116 104 58.3 71.4 104 131 59.1 ppm-lipidS8 VK-4 Whole-Body 2004 0 13 13 NA NA 56.4 180 111 103 42.1 72.7 103 153 80.3 ppm-lipidS8 VK-4 Whole-Body 2005 0 10 10 NA NA 36.5 136 79.2 70.4 34.4 57.0 70.4 95.2 38.2 ppm-lipidS8 VK-4 Whole-Body 2006 0 10 10 NA NA 32.3 502 102 61.3 142 40.6 61.3 76.7 36.1 ppm-lipidS8 VK-4 Whole-Body 2007 0 10 10 NA NA 42.0 140 68.5 54.0 30.3 47.0 54.0 87.0 40.0 ppm-lipidS8 VK-4 Whole-Body 2008 0 10 10 NA NA 22.2 75.0 45.0 41.2 16.1 35.1 41.2 55.0 19.9 ppm-lipidS8 VK-4 Whole-Body 2009 0 10 10 NA NA 30.2 94.9 49.7 44.9 18.4 40.7 44.9 55.4 14.8 ppm-lipidS8 VK-4 Whole-Body 2010 0 10 10 NA NA 27.0 145 79.9 82.7 36.2 50.0 82.7 106 56.1 ppm-lipidS8 VK-4 Whole-Body 2011 0 17 17 NA NA 22.0 128 58.8 45.1 32.4 30.6 45.1 82.8 52.1 ppm-lipidS8 VK-4 Whole-Body 2012 0 9 9 NA NA 46.4 149 73.9 58.8 36.5 52.0 58.8 81.2 29.1 ppm-lipidS8 VK-4 Whole-Body 2013 0 9 9 NA NA 20.4 81.1 44.3 31.9 22.5 27.8 31.9 64.2 36.4 ppm-lipidS8 VK-4 Whole-Body 2014 0 7 7 NA NA 14.1 43.4 24.3 19.1 10.7 16.8 19.1 31.0 14.3 ppm-lipidS8 VK-4 Whole-Body 2015 0 12 12 NA NA 4.9 45.7 26.5 28.1 12.2 18.2 28.1 35.7 17.5 ppm-lipidS8 VK-4 Whole-Body 2016 0 20 20 NA NA 15.1 41.6 25.6 24.4 7.9 19.0 24.4 32.3 13.3 ppm-lipidS8 VK-4 Whole-Body 2017 0 15 15 NA NA 21.2 50.0 34.6 33.9 9.3 27.8 33.9 42.4 14.5 ppm-lipidS8 VK-4 Whole-Body 2018 0 22 22 NA NA 12.6 61.7 31.7 29.1 13.2 21.6 29.1 36.6 14.9 ppm-lipidS8 VK-4 Whole-Body 2019 0 10 10 NA NA 17.0 37.9 24.7 23.2 7.6 17.5 23.2 27.1 9.5 ppm-lipidS8 VK-4 Whole-Body 2020 0 19 19 NA NA 6.2 48.7 26.2 27.2 10.1 20.2 27.2 31.8 11.6 ppm-lipidS9 VK-5 Edible Portion 2002 0 1 1 NA NA 2.6 2.6 2.6 2.6 NA 2.6 2.6 2.6 0 ppmS9 VK-5 Edible Portion 2004 0 5 5 NA NA 1.3 6.6 3.6 2.8 2.2 2.0 2.8 5.4 3.4 ppmS9 VK-5 Edible Portion 2005 0 10 10 NA NA 0.34 2.2 1.1 1.0 0.47 0.93 1.0 1.2 0.27 ppmS9 VK-5 Edible Portion 2006 0 6 6 NA NA 0.62 4.8 3.1 3.5 1.8 1.4 3.5 4.4 3.0 ppmS9 VK-5 Edible Portion 2007 0 7 7 NA NA 0.50 3.1 1.3 1.0 0.90 0.63 1.0 1.6 1.0 ppmS9 VK-5 Edible Portion 2008 0 2 2 NA NA 2.4 4.4 3.4 3.4 1.5 2.3 3.4 4.4 2.1 ppmS9 VK-5 Edible Portion 2009 0 7 7 NA NA 0.61 12.0 3.3 2.6 4.0 0.89 2.6 2.8 1.9 ppmS9 VK-5 Edible Portion 2010 0 10 10 NA NA 0.94 12.1 2.5 1.4 3.4 1.2 1.4 1.8 0.61 ppmS9 VK-5 Edible Portion 2011 0 5 5 NA NA 0.62 1.1 0.81 0.81 0.16 0.69 0.81 0.89 0.20 ppmS9 VK-5 Edible Portion 2012 0 5 5 NA NA 0.16 0.94 0.74 0.87 0.33 0.65 0.87 0.92 0.27 ppmS9 VK-5 Edible Portion 2013 0 5 5 NA NA 0.43 0.73 0.58 0.58 0.14 0.45 0.58 0.72 0.27 ppmS9 VK-5 Edible Portion 2014 0 5 5 NA NA 0.77 3.2 1.5 1.1 1.0 0.87 1.1 1.8 0.96 ppmS9 VK-5 Edible Portion 2016 0 5 5 NA NA 0.50 1.0 0.69 0.58 0.22 0.53 0.58 0.84 0.31 ppmS9 VK-5 Edible Portion 2017 0 5 5 NA NA 0.27 0.64 0.49 0.53 0.14 0.42 0.53 0.57 0.14 ppmS9 VK-5 Edible Portion 2018 0 5 5 NA NA 0.35 0.61 0.48 0.47 0.094 0.43 0.47 0.55 0.11 ppmS9 VK-5 Edible Portion 2019 0 4 4 NA NA 0.14 0.88 0.50 0.50 0.31 0.27 0.50 0.74 0.47 ppm
G:\GE\PRJ\GE_Loeffel_Drainageways_RIFS\Reports and Presentations\2020\12-xx 2020 Fish Report\Appendices\A\attachment 5_plot statistics_summary 6/11
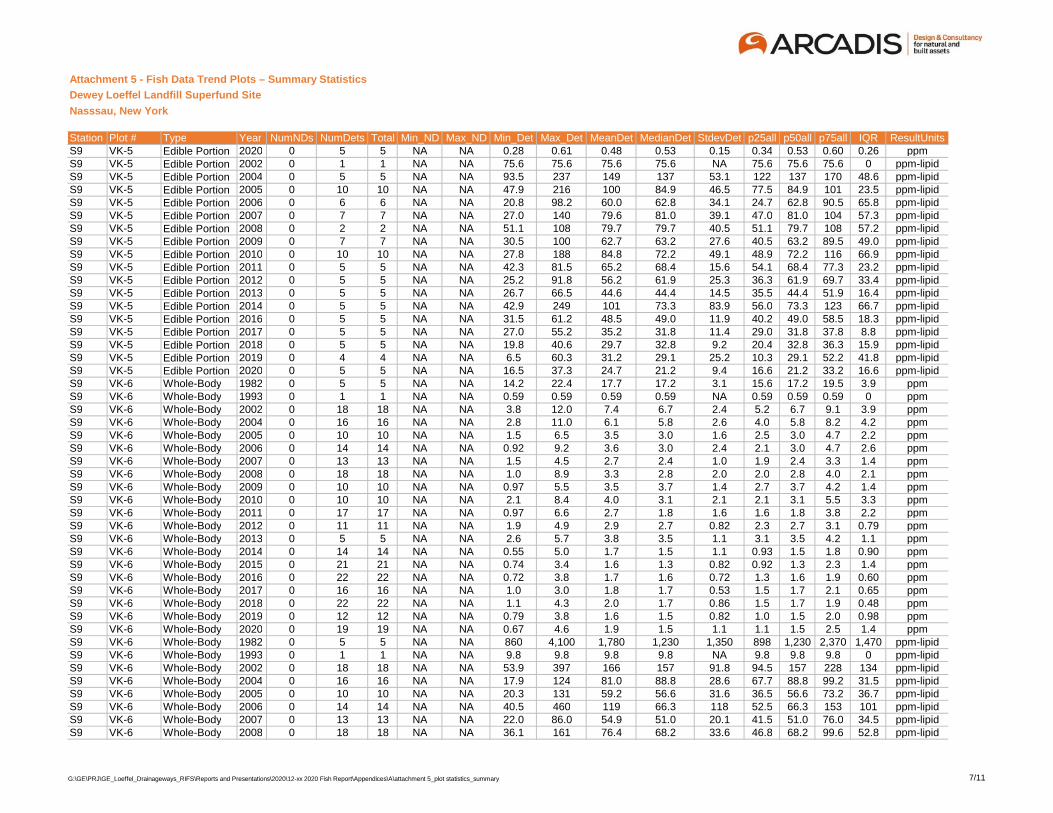
Attachment 5 - Fish Data Trend Plots – Summary Statistics
Dewey Loeffel Landfill Superfund Site
Nasssau, New York
Station Plot # Type Year NumNDs NumDets Total Min_ND Max_ND Min_Det Max_Det MeanDet MedianDet StdevDet p25all p50all p75all IQR ResultUnitsS9 VK-5 Edible Portion 2020 0 5 5 NA NA 0.28 0.61 0.48 0.53 0.15 0.34 0.53 0.60 0.26 ppmS9 VK-5 Edible Portion 2002 0 1 1 NA NA 75.6 75.6 75.6 75.6 NA 75.6 75.6 75.6 0 ppm-lipidS9 VK-5 Edible Portion 2004 0 5 5 NA NA 93.5 237 149 137 53.1 122 137 170 48.6 ppm-lipidS9 VK-5 Edible Portion 2005 0 10 10 NA NA 47.9 216 100 84.9 46.5 77.5 84.9 101 23.5 ppm-lipidS9 VK-5 Edible Portion 2006 0 6 6 NA NA 20.8 98.2 60.0 62.8 34.1 24.7 62.8 90.5 65.8 ppm-lipidS9 VK-5 Edible Portion 2007 0 7 7 NA NA 27.0 140 79.6 81.0 39.1 47.0 81.0 104 57.3 ppm-lipidS9 VK-5 Edible Portion 2008 0 2 2 NA NA 51.1 108 79.7 79.7 40.5 51.1 79.7 108 57.2 ppm-lipidS9 VK-5 Edible Portion 2009 0 7 7 NA NA 30.5 100 62.7 63.2 27.6 40.5 63.2 89.5 49.0 ppm-lipidS9 VK-5 Edible Portion 2010 0 10 10 NA NA 27.8 188 84.8 72.2 49.1 48.9 72.2 116 66.9 ppm-lipidS9 VK-5 Edible Portion 2011 0 5 5 NA NA 42.3 81.5 65.2 68.4 15.6 54.1 68.4 77.3 23.2 ppm-lipidS9 VK-5 Edible Portion 2012 0 5 5 NA NA 25.2 91.8 56.2 61.9 25.3 36.3 61.9 69.7 33.4 ppm-lipidS9 VK-5 Edible Portion 2013 0 5 5 NA NA 26.7 66.5 44.6 44.4 14.5 35.5 44.4 51.9 16.4 ppm-lipidS9 VK-5 Edible Portion 2014 0 5 5 NA NA 42.9 249 101 73.3 83.9 56.0 73.3 123 66.7 ppm-lipidS9 VK-5 Edible Portion 2016 0 5 5 NA NA 31.5 61.2 48.5 49.0 11.9 40.2 49.0 58.5 18.3 ppm-lipidS9 VK-5 Edible Portion 2017 0 5 5 NA NA 27.0 55.2 35.2 31.8 11.4 29.0 31.8 37.8 8.8 ppm-lipidS9 VK-5 Edible Portion 2018 0 5 5 NA NA 19.8 40.6 29.7 32.8 9.2 20.4 32.8 36.3 15.9 ppm-lipidS9 VK-5 Edible Portion 2019 0 4 4 NA NA 6.5 60.3 31.2 29.1 25.2 10.3 29.1 52.2 41.8 ppm-lipidS9 VK-5 Edible Portion 2020 0 5 5 NA NA 16.5 37.3 24.7 21.2 9.4 16.6 21.2 33.2 16.6 ppm-lipidS9 VK-6 Whole-Body 1982 0 5 5 NA NA 14.2 22.4 17.7 17.2 3.1 15.6 17.2 19.5 3.9 ppmS9 VK-6 Whole-Body 1993 0 1 1 NA NA 0.59 0.59 0.59 0.59 NA 0.59 0.59 0.59 0 ppmS9 VK-6 Whole-Body 2002 0 18 18 NA NA 3.8 12.0 7.4 6.7 2.4 5.2 6.7 9.1 3.9 ppmS9 VK-6 Whole-Body 2004 0 16 16 NA NA 2.8 11.0 6.1 5.8 2.6 4.0 5.8 8.2 4.2 ppmS9 VK-6 Whole-Body 2005 0 10 10 NA NA 1.5 6.5 3.5 3.0 1.6 2.5 3.0 4.7 2.2 ppmS9 VK-6 Whole-Body 2006 0 14 14 NA NA 0.92 9.2 3.6 3.0 2.4 2.1 3.0 4.7 2.6 ppmS9 VK-6 Whole-Body 2007 0 13 13 NA NA 1.5 4.5 2.7 2.4 1.0 1.9 2.4 3.3 1.4 ppmS9 VK-6 Whole-Body 2008 0 18 18 NA NA 1.0 8.9 3.3 2.8 2.0 2.0 2.8 4.0 2.1 ppmS9 VK-6 Whole-Body 2009 0 10 10 NA NA 0.97 5.5 3.5 3.7 1.4 2.7 3.7 4.2 1.4 ppmS9 VK-6 Whole-Body 2010 0 10 10 NA NA 2.1 8.4 4.0 3.1 2.1 2.1 3.1 5.5 3.3 ppmS9 VK-6 Whole-Body 2011 0 17 17 NA NA 0.97 6.6 2.7 1.8 1.6 1.6 1.8 3.8 2.2 ppmS9 VK-6 Whole-Body 2012 0 11 11 NA NA 1.9 4.9 2.9 2.7 0.82 2.3 2.7 3.1 0.79 ppmS9 VK-6 Whole-Body 2013 0 5 5 NA NA 2.6 5.7 3.8 3.5 1.1 3.1 3.5 4.2 1.1 ppmS9 VK-6 Whole-Body 2014 0 14 14 NA NA 0.55 5.0 1.7 1.5 1.1 0.93 1.5 1.8 0.90 ppmS9 VK-6 Whole-Body 2015 0 21 21 NA NA 0.74 3.4 1.6 1.3 0.82 0.92 1.3 2.3 1.4 ppmS9 VK-6 Whole-Body 2016 0 22 22 NA NA 0.72 3.8 1.7 1.6 0.72 1.3 1.6 1.9 0.60 ppmS9 VK-6 Whole-Body 2017 0 16 16 NA NA 1.0 3.0 1.8 1.7 0.53 1.5 1.7 2.1 0.65 ppmS9 VK-6 Whole-Body 2018 0 22 22 NA NA 1.1 4.3 2.0 1.7 0.86 1.5 1.7 1.9 0.48 ppmS9 VK-6 Whole-Body 2019 0 12 12 NA NA 0.79 3.8 1.6 1.5 0.82 1.0 1.5 2.0 0.98 ppmS9 VK-6 Whole-Body 2020 0 19 19 NA NA 0.67 4.6 1.9 1.5 1.1 1.1 1.5 2.5 1.4 ppmS9 VK-6 Whole-Body 1982 0 5 5 NA NA 860 4,100 1,780 1,230 1,350 898 1,230 2,370 1,470 ppm-lipidS9 VK-6 Whole-Body 1993 0 1 1 NA NA 9.8 9.8 9.8 9.8 NA 9.8 9.8 9.8 0 ppm-lipidS9 VK-6 Whole-Body 2002 0 18 18 NA NA 53.9 397 166 157 91.8 94.5 157 228 134 ppm-lipidS9 VK-6 Whole-Body 2004 0 16 16 NA NA 17.9 124 81.0 88.8 28.6 67.7 88.8 99.2 31.5 ppm-lipidS9 VK-6 Whole-Body 2005 0 10 10 NA NA 20.3 131 59.2 56.6 31.6 36.5 56.6 73.2 36.7 ppm-lipidS9 VK-6 Whole-Body 2006 0 14 14 NA NA 40.5 460 119 66.3 118 52.5 66.3 153 101 ppm-lipidS9 VK-6 Whole-Body 2007 0 13 13 NA NA 22.0 86.0 54.9 51.0 20.1 41.5 51.0 76.0 34.5 ppm-lipidS9 VK-6 Whole-Body 2008 0 18 18 NA NA 36.1 161 76.4 68.2 33.6 46.8 68.2 99.6 52.8 ppm-lipid
G:\GE\PRJ\GE_Loeffel_Drainageways_RIFS\Reports and Presentations\2020\12-xx 2020 Fish Report\Appendices\A\attachment 5_plot statistics_summary 7/11
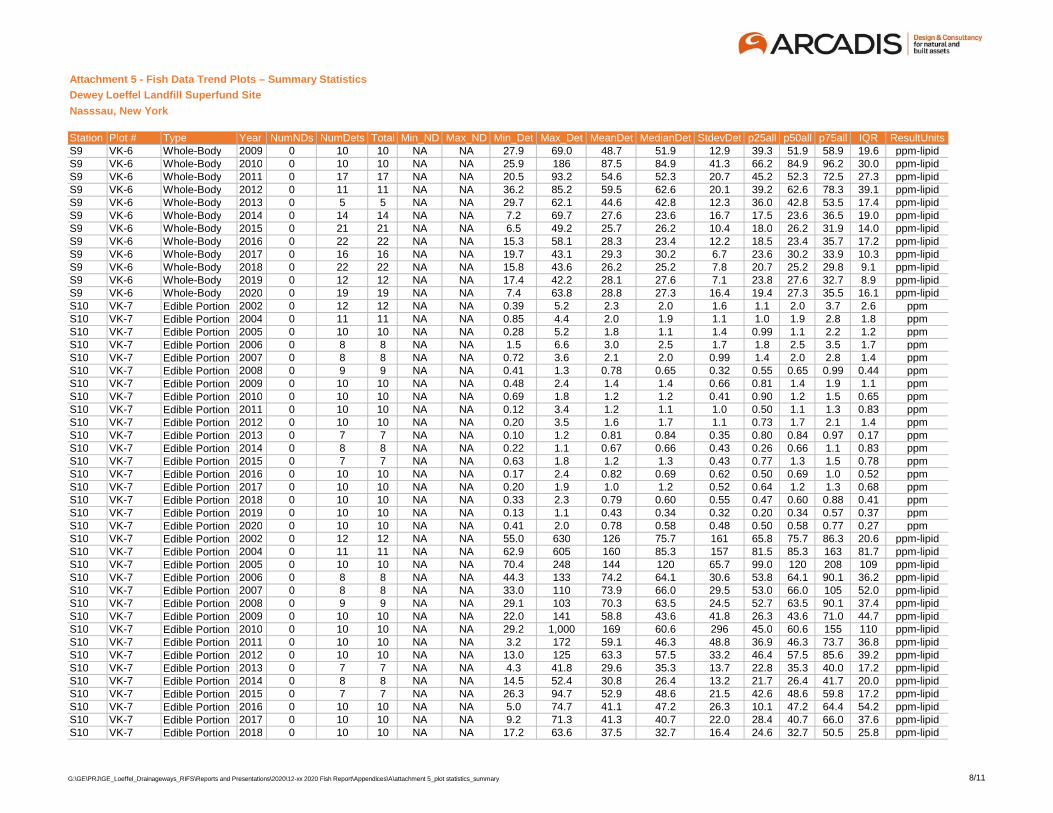
Attachment 5 - Fish Data Trend Plots – Summary Statistics
Dewey Loeffel Landfill Superfund Site
Nasssau, New York
Station Plot # Type Year NumNDs NumDets Total Min_ND Max_ND Min_Det Max_Det MeanDet MedianDet StdevDet p25all p50all p75all IQR ResultUnitsS9 VK-6 Whole-Body 2009 0 10 10 NA NA 27.9 69.0 48.7 51.9 12.9 39.3 51.9 58.9 19.6 ppm-lipidS9 VK-6 Whole-Body 2010 0 10 10 NA NA 25.9 186 87.5 84.9 41.3 66.2 84.9 96.2 30.0 ppm-lipidS9 VK-6 Whole-Body 2011 0 17 17 NA NA 20.5 93.2 54.6 52.3 20.7 45.2 52.3 72.5 27.3 ppm-lipidS9 VK-6 Whole-Body 2012 0 11 11 NA NA 36.2 85.2 59.5 62.6 20.1 39.2 62.6 78.3 39.1 ppm-lipidS9 VK-6 Whole-Body 2013 0 5 5 NA NA 29.7 62.1 44.6 42.8 12.3 36.0 42.8 53.5 17.4 ppm-lipidS9 VK-6 Whole-Body 2014 0 14 14 NA NA 7.2 69.7 27.6 23.6 16.7 17.5 23.6 36.5 19.0 ppm-lipidS9 VK-6 Whole-Body 2015 0 21 21 NA NA 6.5 49.2 25.7 26.2 10.4 18.0 26.2 31.9 14.0 ppm-lipidS9 VK-6 Whole-Body 2016 0 22 22 NA NA 15.3 58.1 28.3 23.4 12.2 18.5 23.4 35.7 17.2 ppm-lipidS9 VK-6 Whole-Body 2017 0 16 16 NA NA 19.7 43.1 29.3 30.2 6.7 23.6 30.2 33.9 10.3 ppm-lipidS9 VK-6 Whole-Body 2018 0 22 22 NA NA 15.8 43.6 26.2 25.2 7.8 20.7 25.2 29.8 9.1 ppm-lipidS9 VK-6 Whole-Body 2019 0 12 12 NA NA 17.4 42.2 28.1 27.6 7.1 23.8 27.6 32.7 8.9 ppm-lipidS9 VK-6 Whole-Body 2020 0 19 19 NA NA 7.4 63.8 28.8 27.3 16.4 19.4 27.3 35.5 16.1 ppm-lipidS10 VK-7 Edible Portion 2002 0 12 12 NA NA 0.39 5.2 2.3 2.0 1.6 1.1 2.0 3.7 2.6 ppmS10 VK-7 Edible Portion 2004 0 11 11 NA NA 0.85 4.4 2.0 1.9 1.1 1.0 1.9 2.8 1.8 ppmS10 VK-7 Edible Portion 2005 0 10 10 NA NA 0.28 5.2 1.8 1.1 1.4 0.99 1.1 2.2 1.2 ppmS10 VK-7 Edible Portion 2006 0 8 8 NA NA 1.5 6.6 3.0 2.5 1.7 1.8 2.5 3.5 1.7 ppmS10 VK-7 Edible Portion 2007 0 8 8 NA NA 0.72 3.6 2.1 2.0 0.99 1.4 2.0 2.8 1.4 ppmS10 VK-7 Edible Portion 2008 0 9 9 NA NA 0.41 1.3 0.78 0.65 0.32 0.55 0.65 0.99 0.44 ppmS10 VK-7 Edible Portion 2009 0 10 10 NA NA 0.48 2.4 1.4 1.4 0.66 0.81 1.4 1.9 1.1 ppmS10 VK-7 Edible Portion 2010 0 10 10 NA NA 0.69 1.8 1.2 1.2 0.41 0.90 1.2 1.5 0.65 ppmS10 VK-7 Edible Portion 2011 0 10 10 NA NA 0.12 3.4 1.2 1.1 1.0 0.50 1.1 1.3 0.83 ppmS10 VK-7 Edible Portion 2012 0 10 10 NA NA 0.20 3.5 1.6 1.7 1.1 0.73 1.7 2.1 1.4 ppmS10 VK-7 Edible Portion 2013 0 7 7 NA NA 0.10 1.2 0.81 0.84 0.35 0.80 0.84 0.97 0.17 ppmS10 VK-7 Edible Portion 2014 0 8 8 NA NA 0.22 1.1 0.67 0.66 0.43 0.26 0.66 1.1 0.83 ppmS10 VK-7 Edible Portion 2015 0 7 7 NA NA 0.63 1.8 1.2 1.3 0.43 0.77 1.3 1.5 0.78 ppmS10 VK-7 Edible Portion 2016 0 10 10 NA NA 0.17 2.4 0.82 0.69 0.62 0.50 0.69 1.0 0.52 ppmS10 VK-7 Edible Portion 2017 0 10 10 NA NA 0.20 1.9 1.0 1.2 0.52 0.64 1.2 1.3 0.68 ppmS10 VK-7 Edible Portion 2018 0 10 10 NA NA 0.33 2.3 0.79 0.60 0.55 0.47 0.60 0.88 0.41 ppmS10 VK-7 Edible Portion 2019 0 10 10 NA NA 0.13 1.1 0.43 0.34 0.32 0.20 0.34 0.57 0.37 ppmS10 VK-7 Edible Portion 2020 0 10 10 NA NA 0.41 2.0 0.78 0.58 0.48 0.50 0.58 0.77 0.27 ppmS10 VK-7 Edible Portion 2002 0 12 12 NA NA 55.0 630 126 75.7 161 65.8 75.7 86.3 20.6 ppm-lipidS10 VK-7 Edible Portion 2004 0 11 11 NA NA 62.9 605 160 85.3 157 81.5 85.3 163 81.7 ppm-lipidS10 VK-7 Edible Portion 2005 0 10 10 NA NA 70.4 248 144 120 65.7 99.0 120 208 109 ppm-lipidS10 VK-7 Edible Portion 2006 0 8 8 NA NA 44.3 133 74.2 64.1 30.6 53.8 64.1 90.1 36.2 ppm-lipidS10 VK-7 Edible Portion 2007 0 8 8 NA NA 33.0 110 73.9 66.0 29.5 53.0 66.0 105 52.0 ppm-lipidS10 VK-7 Edible Portion 2008 0 9 9 NA NA 29.1 103 70.3 63.5 24.5 52.7 63.5 90.1 37.4 ppm-lipidS10 VK-7 Edible Portion 2009 0 10 10 NA NA 22.0 141 58.8 43.6 41.8 26.3 43.6 71.0 44.7 ppm-lipidS10 VK-7 Edible Portion 2010 0 10 10 NA NA 29.2 1,000 169 60.6 296 45.0 60.6 155 110 ppm-lipidS10 VK-7 Edible Portion 2011 0 10 10 NA NA 3.2 172 59.1 46.3 48.8 36.9 46.3 73.7 36.8 ppm-lipidS10 VK-7 Edible Portion 2012 0 10 10 NA NA 13.0 125 63.3 57.5 33.2 46.4 57.5 85.6 39.2 ppm-lipidS10 VK-7 Edible Portion 2013 0 7 7 NA NA 4.3 41.8 29.6 35.3 13.7 22.8 35.3 40.0 17.2 ppm-lipidS10 VK-7 Edible Portion 2014 0 8 8 NA NA 14.5 52.4 30.8 26.4 13.2 21.7 26.4 41.7 20.0 ppm-lipidS10 VK-7 Edible Portion 2015 0 7 7 NA NA 26.3 94.7 52.9 48.6 21.5 42.6 48.6 59.8 17.2 ppm-lipidS10 VK-7 Edible Portion 2016 0 10 10 NA NA 5.0 74.7 41.1 47.2 26.3 10.1 47.2 64.4 54.2 ppm-lipidS10 VK-7 Edible Portion 2017 0 10 10 NA NA 9.2 71.3 41.3 40.7 22.0 28.4 40.7 66.0 37.6 ppm-lipidS10 VK-7 Edible Portion 2018 0 10 10 NA NA 17.2 63.6 37.5 32.7 16.4 24.6 32.7 50.5 25.8 ppm-lipid
G:\GE\PRJ\GE_Loeffel_Drainageways_RIFS\Reports and Presentations\2020\12-xx 2020 Fish Report\Appendices\A\attachment 5_plot statistics_summary 8/11
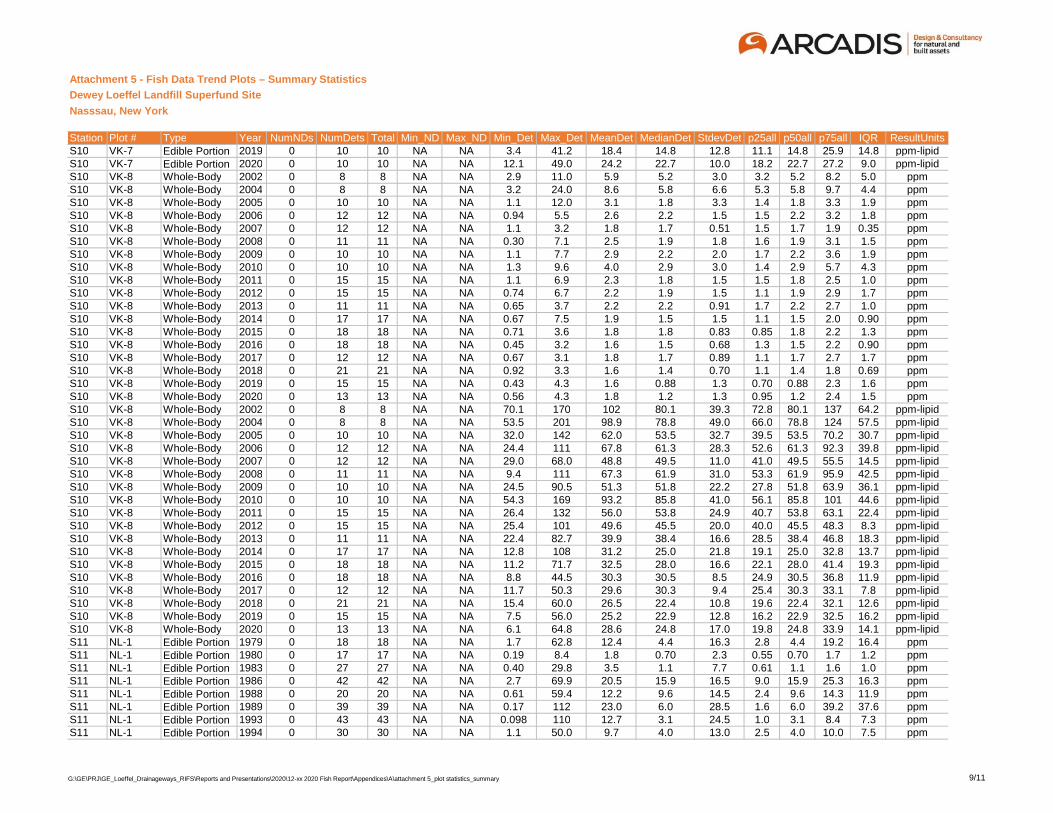
Attachment 5 - Fish Data Trend Plots – Summary Statistics
Dewey Loeffel Landfill Superfund Site
Nasssau, New York
Station Plot # Type Year NumNDs NumDets Total Min_ND Max_ND Min_Det Max_Det MeanDet MedianDet StdevDet p25all p50all p75all IQR ResultUnitsS10 VK-7 Edible Portion 2019 0 10 10 NA NA 3.4 41.2 18.4 14.8 12.8 11.1 14.8 25.9 14.8 ppm-lipidS10 VK-7 Edible Portion 2020 0 10 10 NA NA 12.1 49.0 24.2 22.7 10.0 18.2 22.7 27.2 9.0 ppm-lipidS10 VK-8 Whole-Body 2002 0 8 8 NA NA 2.9 11.0 5.9 5.2 3.0 3.2 5.2 8.2 5.0 ppmS10 VK-8 Whole-Body 2004 0 8 8 NA NA 3.2 24.0 8.6 5.8 6.6 5.3 5.8 9.7 4.4 ppmS10 VK-8 Whole-Body 2005 0 10 10 NA NA 1.1 12.0 3.1 1.8 3.3 1.4 1.8 3.3 1.9 ppmS10 VK-8 Whole-Body 2006 0 12 12 NA NA 0.94 5.5 2.6 2.2 1.5 1.5 2.2 3.2 1.8 ppmS10 VK-8 Whole-Body 2007 0 12 12 NA NA 1.1 3.2 1.8 1.7 0.51 1.5 1.7 1.9 0.35 ppmS10 VK-8 Whole-Body 2008 0 11 11 NA NA 0.30 7.1 2.5 1.9 1.8 1.6 1.9 3.1 1.5 ppmS10 VK-8 Whole-Body 2009 0 10 10 NA NA 1.1 7.7 2.9 2.2 2.0 1.7 2.2 3.6 1.9 ppmS10 VK-8 Whole-Body 2010 0 10 10 NA NA 1.3 9.6 4.0 2.9 3.0 1.4 2.9 5.7 4.3 ppmS10 VK-8 Whole-Body 2011 0 15 15 NA NA 1.1 6.9 2.3 1.8 1.5 1.5 1.8 2.5 1.0 ppmS10 VK-8 Whole-Body 2012 0 15 15 NA NA 0.74 6.7 2.2 1.9 1.5 1.1 1.9 2.9 1.7 ppmS10 VK-8 Whole-Body 2013 0 11 11 NA NA 0.65 3.7 2.2 2.2 0.91 1.7 2.2 2.7 1.0 ppmS10 VK-8 Whole-Body 2014 0 17 17 NA NA 0.67 7.5 1.9 1.5 1.5 1.1 1.5 2.0 0.90 ppmS10 VK-8 Whole-Body 2015 0 18 18 NA NA 0.71 3.6 1.8 1.8 0.83 0.85 1.8 2.2 1.3 ppmS10 VK-8 Whole-Body 2016 0 18 18 NA NA 0.45 3.2 1.6 1.5 0.68 1.3 1.5 2.2 0.90 ppmS10 VK-8 Whole-Body 2017 0 12 12 NA NA 0.67 3.1 1.8 1.7 0.89 1.1 1.7 2.7 1.7 ppmS10 VK-8 Whole-Body 2018 0 21 21 NA NA 0.92 3.3 1.6 1.4 0.70 1.1 1.4 1.8 0.69 ppmS10 VK-8 Whole-Body 2019 0 15 15 NA NA 0.43 4.3 1.6 0.88 1.3 0.70 0.88 2.3 1.6 ppmS10 VK-8 Whole-Body 2020 0 13 13 NA NA 0.56 4.3 1.8 1.2 1.3 0.95 1.2 2.4 1.5 ppmS10 VK-8 Whole-Body 2002 0 8 8 NA NA 70.1 170 102 80.1 39.3 72.8 80.1 137 64.2 ppm-lipidS10 VK-8 Whole-Body 2004 0 8 8 NA NA 53.5 201 98.9 78.8 49.0 66.0 78.8 124 57.5 ppm-lipidS10 VK-8 Whole-Body 2005 0 10 10 NA NA 32.0 142 62.0 53.5 32.7 39.5 53.5 70.2 30.7 ppm-lipidS10 VK-8 Whole-Body 2006 0 12 12 NA NA 24.4 111 67.8 61.3 28.3 52.6 61.3 92.3 39.8 ppm-lipidS10 VK-8 Whole-Body 2007 0 12 12 NA NA 29.0 68.0 48.8 49.5 11.0 41.0 49.5 55.5 14.5 ppm-lipidS10 VK-8 Whole-Body 2008 0 11 11 NA NA 9.4 111 67.3 61.9 31.0 53.3 61.9 95.9 42.5 ppm-lipidS10 VK-8 Whole-Body 2009 0 10 10 NA NA 24.5 90.5 51.3 51.8 22.2 27.8 51.8 63.9 36.1 ppm-lipidS10 VK-8 Whole-Body 2010 0 10 10 NA NA 54.3 169 93.2 85.8 41.0 56.1 85.8 101 44.6 ppm-lipidS10 VK-8 Whole-Body 2011 0 15 15 NA NA 26.4 132 56.0 53.8 24.9 40.7 53.8 63.1 22.4 ppm-lipidS10 VK-8 Whole-Body 2012 0 15 15 NA NA 25.4 101 49.6 45.5 20.0 40.0 45.5 48.3 8.3 ppm-lipidS10 VK-8 Whole-Body 2013 0 11 11 NA NA 22.4 82.7 39.9 38.4 16.6 28.5 38.4 46.8 18.3 ppm-lipidS10 VK-8 Whole-Body 2014 0 17 17 NA NA 12.8 108 31.2 25.0 21.8 19.1 25.0 32.8 13.7 ppm-lipidS10 VK-8 Whole-Body 2015 0 18 18 NA NA 11.2 71.7 32.5 28.0 16.6 22.1 28.0 41.4 19.3 ppm-lipidS10 VK-8 Whole-Body 2016 0 18 18 NA NA 8.8 44.5 30.3 30.5 8.5 24.9 30.5 36.8 11.9 ppm-lipidS10 VK-8 Whole-Body 2017 0 12 12 NA NA 11.7 50.3 29.6 30.3 9.4 25.4 30.3 33.1 7.8 ppm-lipidS10 VK-8 Whole-Body 2018 0 21 21 NA NA 15.4 60.0 26.5 22.4 10.8 19.6 22.4 32.1 12.6 ppm-lipidS10 VK-8 Whole-Body 2019 0 15 15 NA NA 7.5 56.0 25.2 22.9 12.8 16.2 22.9 32.5 16.2 ppm-lipidS10 VK-8 Whole-Body 2020 0 13 13 NA NA 6.1 64.8 28.6 24.8 17.0 19.8 24.8 33.9 14.1 ppm-lipidS11 NL-1 Edible Portion 1979 0 18 18 NA NA 1.7 62.8 12.4 4.4 16.3 2.8 4.4 19.2 16.4 ppmS11 NL-1 Edible Portion 1980 0 17 17 NA NA 0.19 8.4 1.8 0.70 2.3 0.55 0.70 1.7 1.2 ppmS11 NL-1 Edible Portion 1983 0 27 27 NA NA 0.40 29.8 3.5 1.1 7.7 0.61 1.1 1.6 1.0 ppmS11 NL-1 Edible Portion 1986 0 42 42 NA NA 2.7 69.9 20.5 15.9 16.5 9.0 15.9 25.3 16.3 ppmS11 NL-1 Edible Portion 1988 0 20 20 NA NA 0.61 59.4 12.2 9.6 14.5 2.4 9.6 14.3 11.9 ppmS11 NL-1 Edible Portion 1989 0 39 39 NA NA 0.17 112 23.0 6.0 28.5 1.6 6.0 39.2 37.6 ppmS11 NL-1 Edible Portion 1993 0 43 43 NA NA 0.098 110 12.7 3.1 24.5 1.0 3.1 8.4 7.3 ppmS11 NL-1 Edible Portion 1994 0 30 30 NA NA 1.1 50.0 9.7 4.0 13.0 2.5 4.0 10.0 7.5 ppm
G:\GE\PRJ\GE_Loeffel_Drainageways_RIFS\Reports and Presentations\2020\12-xx 2020 Fish Report\Appendices\A\attachment 5_plot statistics_summary 9/11
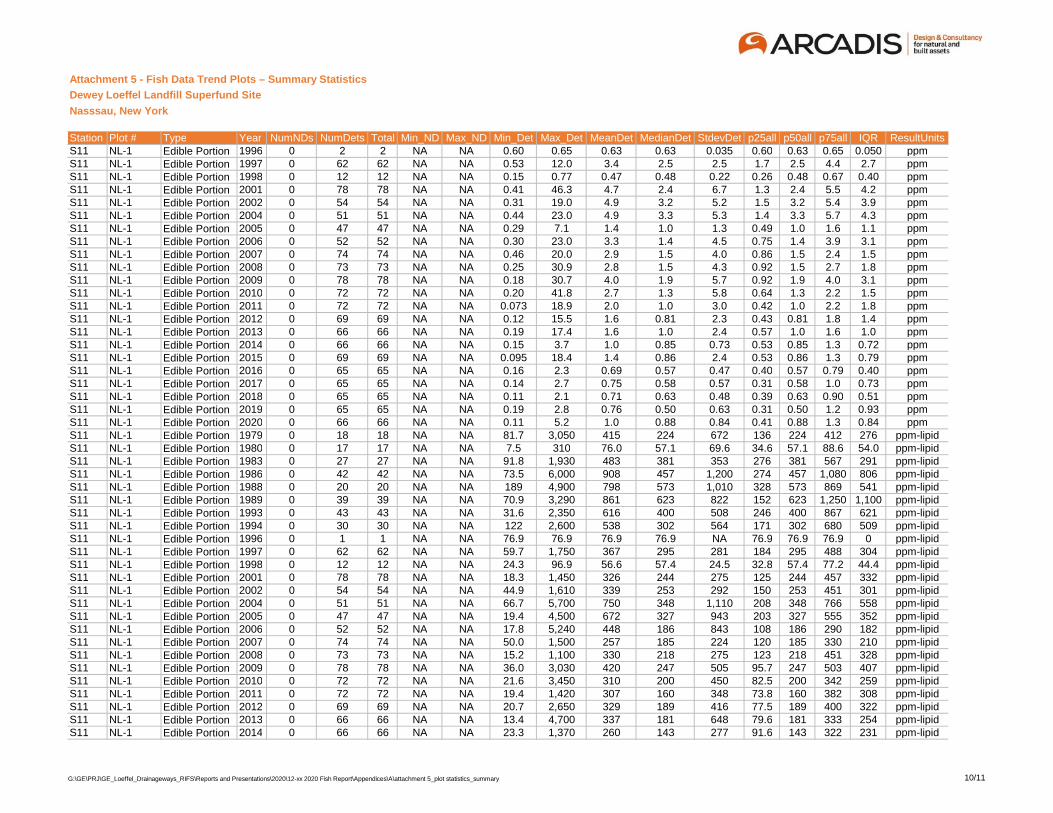
Attachment 5 - Fish Data Trend Plots – Summary Statistics
Dewey Loeffel Landfill Superfund Site
Nasssau, New York
Station Plot # Type Year NumNDs NumDets Total Min_ND Max_ND Min_Det Max_Det MeanDet MedianDet StdevDet p25all p50all p75all IQR ResultUnitsS11 NL-1 Edible Portion 1996 0 2 2 NA NA 0.60 0.65 0.63 0.63 0.035 0.60 0.63 0.65 0.050 ppmS11 NL-1 Edible Portion 1997 0 62 62 NA NA 0.53 12.0 3.4 2.5 2.5 1.7 2.5 4.4 2.7 ppmS11 NL-1 Edible Portion 1998 0 12 12 NA NA 0.15 0.77 0.47 0.48 0.22 0.26 0.48 0.67 0.40 ppmS11 NL-1 Edible Portion 2001 0 78 78 NA NA 0.41 46.3 4.7 2.4 6.7 1.3 2.4 5.5 4.2 ppmS11 NL-1 Edible Portion 2002 0 54 54 NA NA 0.31 19.0 4.9 3.2 5.2 1.5 3.2 5.4 3.9 ppmS11 NL-1 Edible Portion 2004 0 51 51 NA NA 0.44 23.0 4.9 3.3 5.3 1.4 3.3 5.7 4.3 ppmS11 NL-1 Edible Portion 2005 0 47 47 NA NA 0.29 7.1 1.4 1.0 1.3 0.49 1.0 1.6 1.1 ppmS11 NL-1 Edible Portion 2006 0 52 52 NA NA 0.30 23.0 3.3 1.4 4.5 0.75 1.4 3.9 3.1 ppmS11 NL-1 Edible Portion 2007 0 74 74 NA NA 0.46 20.0 2.9 1.5 4.0 0.86 1.5 2.4 1.5 ppmS11 NL-1 Edible Portion 2008 0 73 73 NA NA 0.25 30.9 2.8 1.5 4.3 0.92 1.5 2.7 1.8 ppmS11 NL-1 Edible Portion 2009 0 78 78 NA NA 0.18 30.7 4.0 1.9 5.7 0.92 1.9 4.0 3.1 ppmS11 NL-1 Edible Portion 2010 0 72 72 NA NA 0.20 41.8 2.7 1.3 5.8 0.64 1.3 2.2 1.5 ppmS11 NL-1 Edible Portion 2011 0 72 72 NA NA 0.073 18.9 2.0 1.0 3.0 0.42 1.0 2.2 1.8 ppmS11 NL-1 Edible Portion 2012 0 69 69 NA NA 0.12 15.5 1.6 0.81 2.3 0.43 0.81 1.8 1.4 ppmS11 NL-1 Edible Portion 2013 0 66 66 NA NA 0.19 17.4 1.6 1.0 2.4 0.57 1.0 1.6 1.0 ppmS11 NL-1 Edible Portion 2014 0 66 66 NA NA 0.15 3.7 1.0 0.85 0.73 0.53 0.85 1.3 0.72 ppmS11 NL-1 Edible Portion 2015 0 69 69 NA NA 0.095 18.4 1.4 0.86 2.4 0.53 0.86 1.3 0.79 ppmS11 NL-1 Edible Portion 2016 0 65 65 NA NA 0.16 2.3 0.69 0.57 0.47 0.40 0.57 0.79 0.40 ppmS11 NL-1 Edible Portion 2017 0 65 65 NA NA 0.14 2.7 0.75 0.58 0.57 0.31 0.58 1.0 0.73 ppmS11 NL-1 Edible Portion 2018 0 65 65 NA NA 0.11 2.1 0.71 0.63 0.48 0.39 0.63 0.90 0.51 ppmS11 NL-1 Edible Portion 2019 0 65 65 NA NA 0.19 2.8 0.76 0.50 0.63 0.31 0.50 1.2 0.93 ppmS11 NL-1 Edible Portion 2020 0 66 66 NA NA 0.11 5.2 1.0 0.88 0.84 0.41 0.88 1.3 0.84 ppmS11 NL-1 Edible Portion 1979 0 18 18 NA NA 81.7 3,050 415 224 672 136 224 412 276 ppm-lipidS11 NL-1 Edible Portion 1980 0 17 17 NA NA 7.5 310 76.0 57.1 69.6 34.6 57.1 88.6 54.0 ppm-lipidS11 NL-1 Edible Portion 1983 0 27 27 NA NA 91.8 1,930 483 381 353 276 381 567 291 ppm-lipidS11 NL-1 Edible Portion 1986 0 42 42 NA NA 73.5 6,000 908 457 1,200 274 457 1,080 806 ppm-lipidS11 NL-1 Edible Portion 1988 0 20 20 NA NA 189 4,900 798 573 1,010 328 573 869 541 ppm-lipidS11 NL-1 Edible Portion 1989 0 39 39 NA NA 70.9 3,290 861 623 822 152 623 1,250 1,100 ppm-lipidS11 NL-1 Edible Portion 1993 0 43 43 NA NA 31.6 2,350 616 400 508 246 400 867 621 ppm-lipidS11 NL-1 Edible Portion 1994 0 30 30 NA NA 122 2,600 538 302 564 171 302 680 509 ppm-lipidS11 NL-1 Edible Portion 1996 0 1 1 NA NA 76.9 76.9 76.9 76.9 NA 76.9 76.9 76.9 0 ppm-lipidS11 NL-1 Edible Portion 1997 0 62 62 NA NA 59.7 1,750 367 295 281 184 295 488 304 ppm-lipidS11 NL-1 Edible Portion 1998 0 12 12 NA NA 24.3 96.9 56.6 57.4 24.5 32.8 57.4 77.2 44.4 ppm-lipidS11 NL-1 Edible Portion 2001 0 78 78 NA NA 18.3 1,450 326 244 275 125 244 457 332 ppm-lipidS11 NL-1 Edible Portion 2002 0 54 54 NA NA 44.9 1,610 339 253 292 150 253 451 301 ppm-lipidS11 NL-1 Edible Portion 2004 0 51 51 NA NA 66.7 5,700 750 348 1,110 208 348 766 558 ppm-lipidS11 NL-1 Edible Portion 2005 0 47 47 NA NA 19.4 4,500 672 327 943 203 327 555 352 ppm-lipidS11 NL-1 Edible Portion 2006 0 52 52 NA NA 17.8 5,240 448 186 843 108 186 290 182 ppm-lipidS11 NL-1 Edible Portion 2007 0 74 74 NA NA 50.0 1,500 257 185 224 120 185 330 210 ppm-lipidS11 NL-1 Edible Portion 2008 0 73 73 NA NA 15.2 1,100 330 218 275 123 218 451 328 ppm-lipidS11 NL-1 Edible Portion 2009 0 78 78 NA NA 36.0 3,030 420 247 505 95.7 247 503 407 ppm-lipidS11 NL-1 Edible Portion 2010 0 72 72 NA NA 21.6 3,450 310 200 450 82.5 200 342 259 ppm-lipidS11 NL-1 Edible Portion 2011 0 72 72 NA NA 19.4 1,420 307 160 348 73.8 160 382 308 ppm-lipidS11 NL-1 Edible Portion 2012 0 69 69 NA NA 20.7 2,650 329 189 416 77.5 189 400 322 ppm-lipidS11 NL-1 Edible Portion 2013 0 66 66 NA NA 13.4 4,700 337 181 648 79.6 181 333 254 ppm-lipidS11 NL-1 Edible Portion 2014 0 66 66 NA NA 23.3 1,370 260 143 277 91.6 143 322 231 ppm-lipid
G:\GE\PRJ\GE_Loeffel_Drainageways_RIFS\Reports and Presentations\2020\12-xx 2020 Fish Report\Appendices\A\attachment 5_plot statistics_summary 10/11
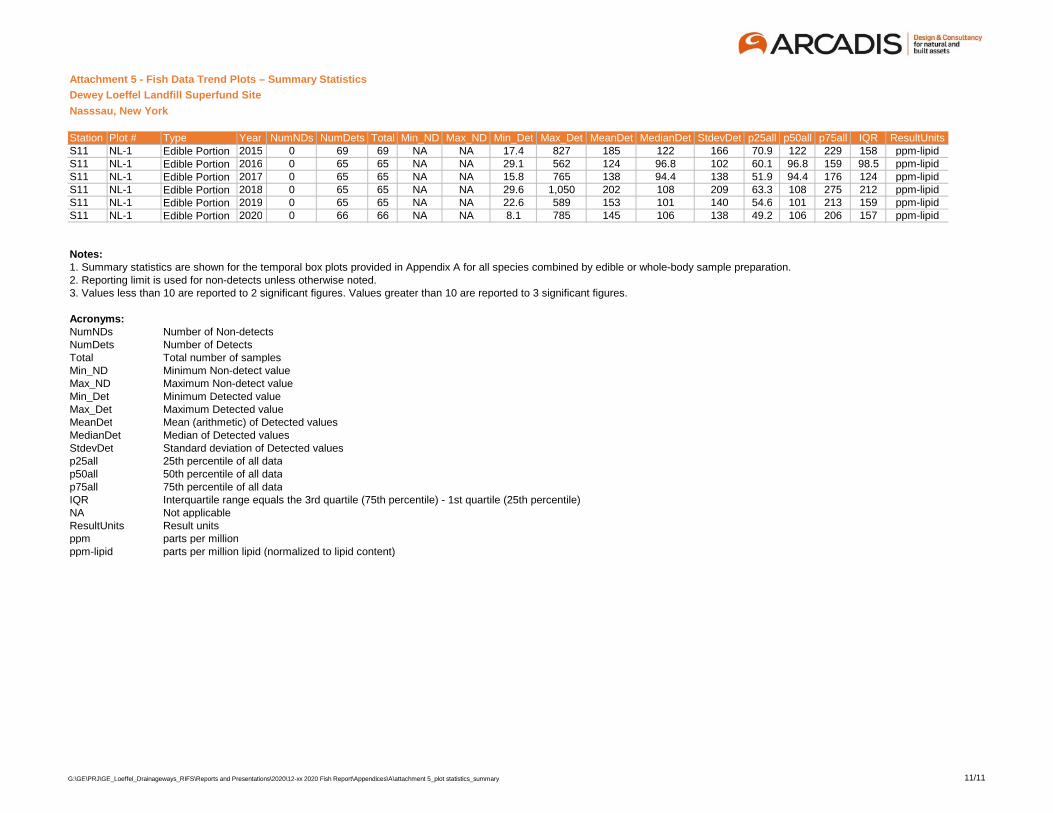
Attachment 5 - Fish Data Trend Plots – Summary Statistics
Dewey Loeffel Landfill Superfund Site
Nasssau, New York
Station Plot # Type Year NumNDs NumDets Total Min_ND Max_ND Min_Det Max_Det MeanDet MedianDet StdevDet p25all p50all p75all IQR ResultUnitsS11 NL-1 Edible Portion 2015 0 69 69 NA NA 17.4 827 185 122 166 70.9 122 229 158 ppm-lipidS11 NL-1 Edible Portion 2016 0 65 65 NA NA 29.1 562 124 96.8 102 60.1 96.8 159 98.5 ppm-lipidS11 NL-1 Edible Portion 2017 0 65 65 NA NA 15.8 765 138 94.4 138 51.9 94.4 176 124 ppm-lipidS11 NL-1 Edible Portion 2018 0 65 65 NA NA 29.6 1,050 202 108 209 63.3 108 275 212 ppm-lipidS11 NL-1 Edible Portion 2019 0 65 65 NA NA 22.6 589 153 101 140 54.6 101 213 159 ppm-lipidS11 NL-1 Edible Portion 2020 0 66 66 NA NA 8.1 785 145 106 138 49.2 106 206 157 ppm-lipid
Notes:1. Summary statistics are shown for the temporal box plots provided in Appendix A for all species combined by edible or whole-body sample preparation.2. Reporting limit is used for non-detects unless otherwise noted.3. Values less than 10 are reported to 2 significant figures. Values greater than 10 are reported to 3 significant figures.
Acronyms:NumNDs Number of Non-detectsNumDets Number of DetectsTotal Total number of samplesMin_ND Minimum Non-detect valueMax_ND Maximum Non-detect valueMin_Det Minimum Detected valueMax_Det Maximum Detected valueMeanDet Mean (arithmetic) of Detected valuesMedianDet Median of Detected valuesStdevDet Standard deviation of Detected valuesp25all 25th percentile of all datap50all 50th percentile of all datap75all 75th percentile of all dataIQR Interquartile range equals the 3rd quartile (75th percentile) - 1st quartile (25th percentile)NA Not applicableResultUnits Result unitsppm parts per millionppm-lipid parts per million lipid (normalized to lipid content)
G:\GE\PRJ\GE_Loeffel_Drainageways_RIFS\Reports and Presentations\2020\12-xx 2020 Fish Report\Appendices\A\attachment 5_plot statistics_summary 11/11
APPENDIX B Fish PCB Box & Whisker Plots
FISH SAMPLING LOCATIONS
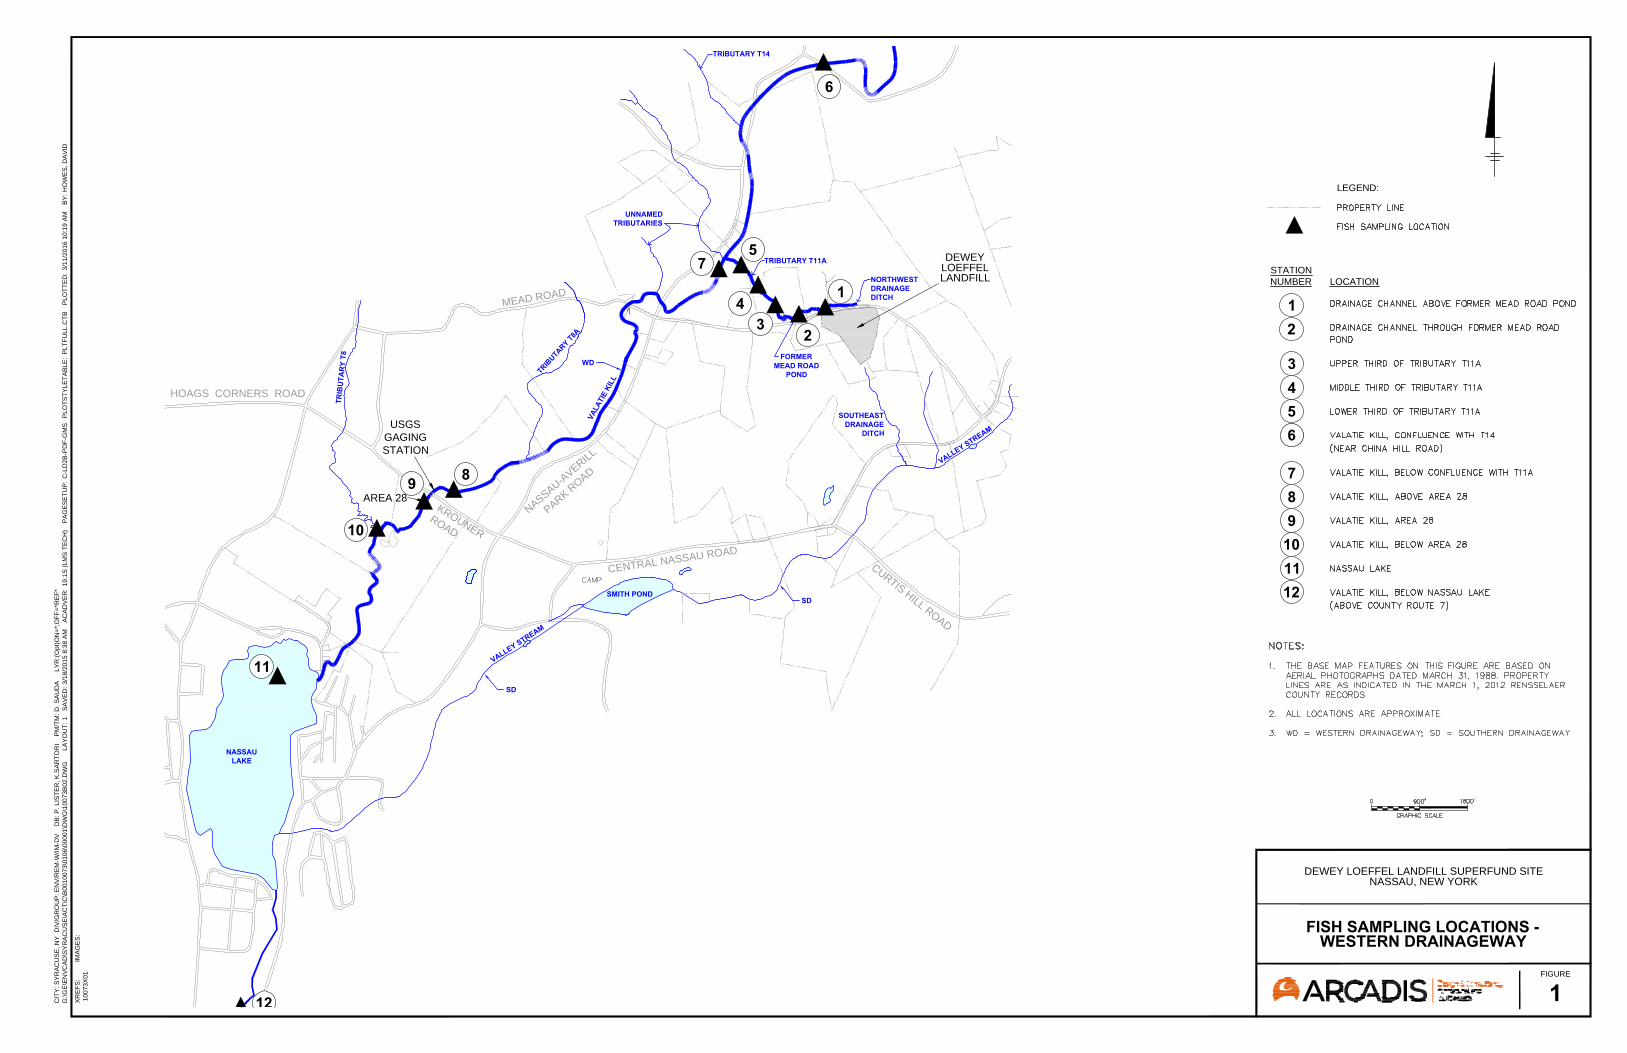
SOUTHEAST
DRAINAGE
DITCH
N
A
S
S
A
U
-
A
V
E
R
I
L
L
P
A
R
K
R
O
A
D
C
U
R
T
I
S
H
I
L
L
R
O
A
D
C
E
N
T
R
A
L N
A
S
S
A
U
R
O
A
D
USGS
GAGING
STATION
V
A
L
L
E
Y
S
T
R
E
A
M
TR
IB
UT
AR
Y T
8
T
R
I
B
U
T
A
R
Y
T
8
A
UNNAMED
TRIBUTARIES
AREA 28
NASSAU
LAKE
TRIBUTARY T11A
NORTHWEST
DRAINAGE
DITCH
WD
SD
SD
DEWEY
LOEFFEL
LANDFILL
FORMER
MEAD ROAD
POND
M
E
A
D
R
O
A
D
HOAGS CORNERS ROAD
TRIBUTARY T14
V
A
L
A
T
I
E
K
I
L
L
SMITH POND
V
A
L
L
E
Y
S
T
R
E
A
M
K
R
O
U
N
E
R
R
O
A
D
LEGEND:
LOCATION
STATION
NUMBER
10
9
8
7
96
5
4
3
2
1
11
12
12
11
8
5
4
3
2
1
10
9
7
6
FISH SAMPLING LOCATIONS -
WESTERN DRAINAGEWAY
IM
AG
ES
:X
RE
FS
:
10073X
01
CIT
Y: S
YR
AC
US
E, N
Y D
IV
/G
RO
UP
: E
NV
/R
EM
-W
/IM
-D
V D
B: P
. LIS
TE
R, K
.S
AR
TO
RI P
M/T
M: D
. S
AU
DA
LY
R:(O
pt)O
N=
*;O
FF
=*R
EF
*
G:\G
E\E
NV
CA
D\S
YR
AC
US
E\A
CT
\C
\B
0010073\0106\00001\D
WG
\10073B
02.D
WG
LA
YO
UT
: 1
S
AV
ED
: 3/18/2015 8:38 A
M A
CA
DV
ER
: 19.1S
(LM
S T
EC
H) P
AG
ES
ET
UP
: C
-LD
2B
-P
DF
-G
MS
P
LO
TS
TY
LE
TA
BLE
: P
LT
FU
LL.C
TB
P
LO
TT
ED
: 3/11/2016 10:19 A
M B
Y: H
OW
ES
, D
AV
ID
FIGURE
DEWEY LOEFFEL LANDFILL SUPERFUND SITE
NASSAU, NEW YORK
1

PLOT INDEX
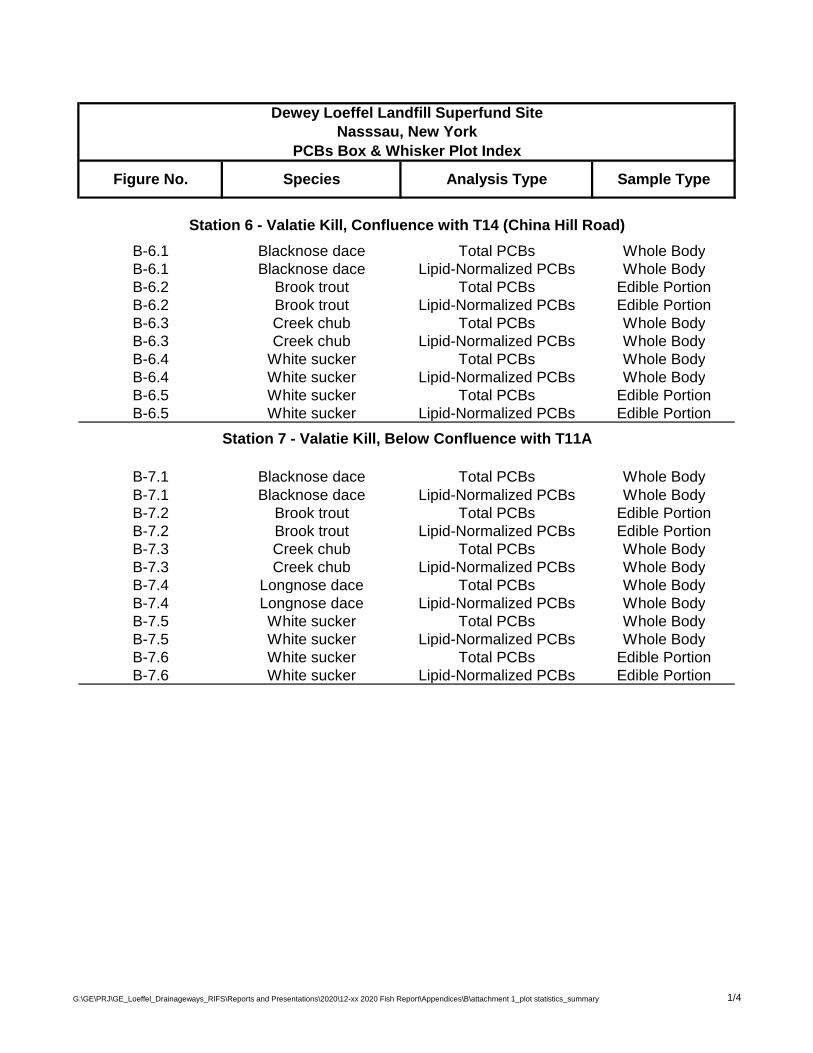
B-6.1 Blacknose dace Total PCBs Whole BodyB-6.1 Blacknose dace Lipid-Normalized PCBs Whole BodyB-6.2 Brook trout Total PCBs Edible PortionB-6.2 Brook trout Lipid-Normalized PCBs Edible PortionB-6.3 Creek chub Total PCBs Whole BodyB-6.3 Creek chub Lipid-Normalized PCBs Whole BodyB-6.4 White sucker Total PCBs Whole BodyB-6.4 White sucker Lipid-Normalized PCBs Whole BodyB-6.5 White sucker Total PCBs Edible PortionB-6.5 White sucker Lipid-Normalized PCBs Edible Portion
B-7.1 Blacknose dace Total PCBs Whole BodyB-7.1 Blacknose dace Lipid-Normalized PCBs Whole BodyB-7.2 Brook trout Total PCBs Edible PortionB-7.2 Brook trout Lipid-Normalized PCBs Edible PortionB-7.3 Creek chub Total PCBs Whole BodyB-7.3 Creek chub Lipid-Normalized PCBs Whole BodyB-7.4 Longnose dace Total PCBs Whole BodyB-7.4 Longnose dace Lipid-Normalized PCBs Whole BodyB-7.5 White sucker Total PCBs Whole BodyB-7.5 White sucker Lipid-Normalized PCBs Whole BodyB-7.6 White sucker Total PCBs Edible PortionB-7.6 White sucker Lipid-Normalized PCBs Edible Portion
Dewey Loeffel Landfill Superfund SiteNasssau, New York
PCBs Box & Whisker Plot Index
Figure No. Species Analysis Type Sample Type
Station 6 - Valatie Kill, Confluence with T14 (China Hill Road)
Station 7 - Valatie Kill, Below Confluence with T11A
G:\GE\PRJ\GE_Loeffel_Drainageways_RIFS\Reports and Presentations\2020\12-xx 2020 Fish Report\Appendices\B\attachment 1_plot statistics_summary 1/4
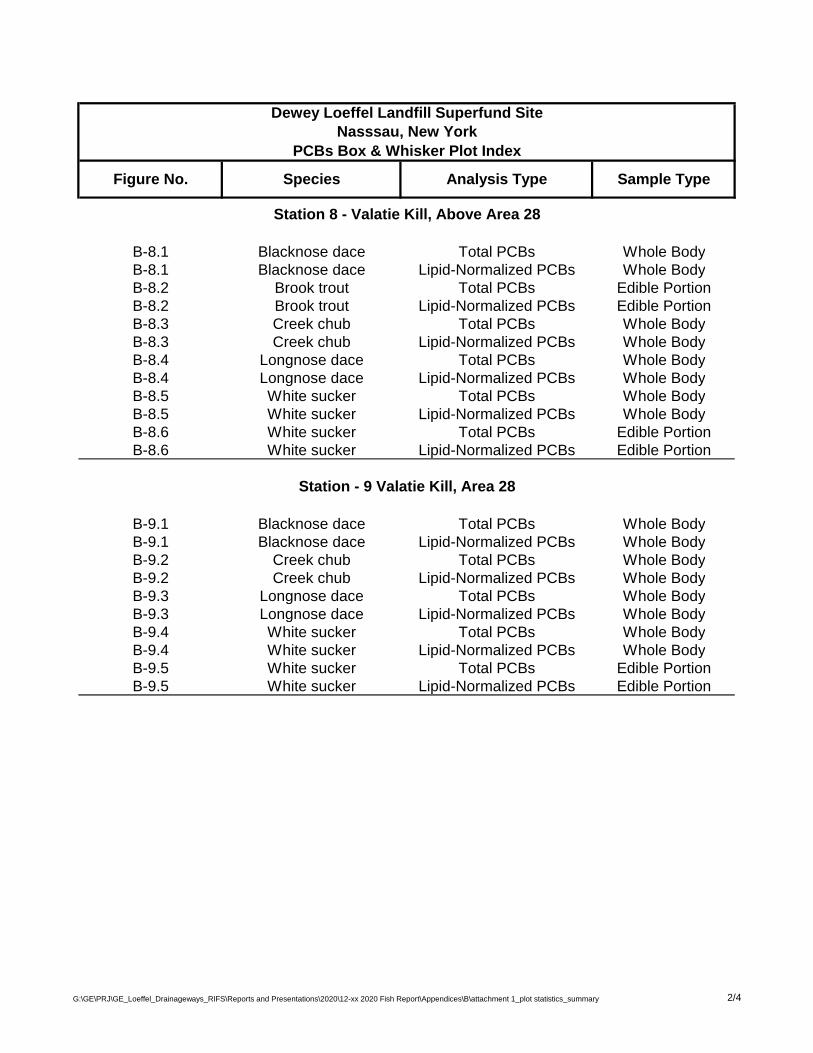
B-8.1 Blacknose dace Total PCBs Whole BodyB-8.1 Blacknose dace Lipid-Normalized PCBs Whole BodyB-8.2 Brook trout Total PCBs Edible PortionB-8.2 Brook trout Lipid-Normalized PCBs Edible PortionB-8.3 Creek chub Total PCBs Whole BodyB-8.3 Creek chub Lipid-Normalized PCBs Whole BodyB-8.4 Longnose dace Total PCBs Whole BodyB-8.4 Longnose dace Lipid-Normalized PCBs Whole BodyB-8.5 White sucker Total PCBs Whole BodyB-8.5 White sucker Lipid-Normalized PCBs Whole BodyB-8.6 White sucker Total PCBs Edible PortionB-8.6 White sucker Lipid-Normalized PCBs Edible Portion
B-9.1 Blacknose dace Total PCBs Whole BodyB-9.1 Blacknose dace Lipid-Normalized PCBs Whole BodyB-9.2 Creek chub Total PCBs Whole BodyB-9.2 Creek chub Lipid-Normalized PCBs Whole BodyB-9.3 Longnose dace Total PCBs Whole BodyB-9.3 Longnose dace Lipid-Normalized PCBs Whole BodyB-9.4 White sucker Total PCBs Whole BodyB-9.4 White sucker Lipid-Normalized PCBs Whole BodyB-9.5 White sucker Total PCBs Edible PortionB-9.5 White sucker Lipid-Normalized PCBs Edible Portion
Dewey Loeffel Landfill Superfund SiteNasssau, New York
PCBs Box & Whisker Plot Index
Figure No. Species Analysis Type Sample Type
Station 8 - Valatie Kill, Above Area 28
Station - 9 Valatie Kill, Area 28
G:\GE\PRJ\GE_Loeffel_Drainageways_RIFS\Reports and Presentations\2020\12-xx 2020 Fish Report\Appendices\B\attachment 1_plot statistics_summary 2/4
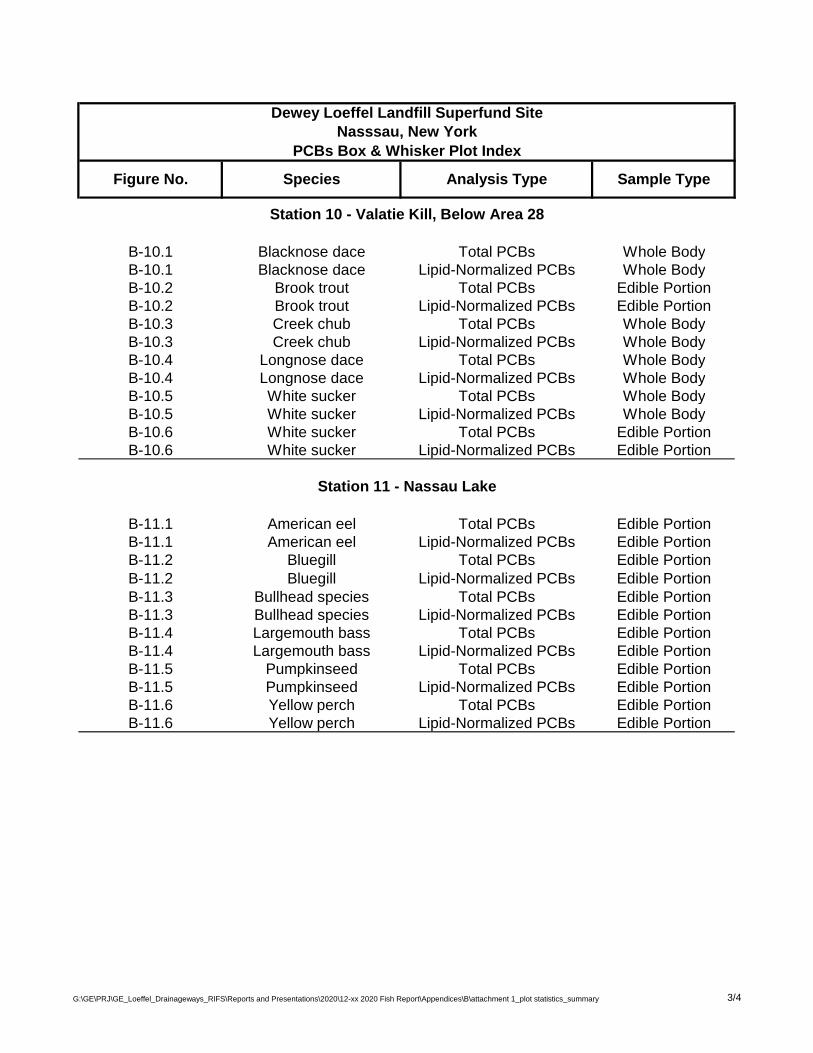
B-10.1 Blacknose dace Total PCBs Whole BodyB-10.1 Blacknose dace Lipid-Normalized PCBs Whole BodyB-10.2 Brook trout Total PCBs Edible PortionB-10.2 Brook trout Lipid-Normalized PCBs Edible PortionB-10.3 Creek chub Total PCBs Whole BodyB-10.3 Creek chub Lipid-Normalized PCBs Whole BodyB-10.4 Longnose dace Total PCBs Whole BodyB-10.4 Longnose dace Lipid-Normalized PCBs Whole BodyB-10.5 White sucker Total PCBs Whole BodyB-10.5 White sucker Lipid-Normalized PCBs Whole BodyB-10.6 White sucker Total PCBs Edible PortionB-10.6 White sucker Lipid-Normalized PCBs Edible Portion
B-11.1 American eel Total PCBs Edible PortionB-11.1 American eel Lipid-Normalized PCBs Edible PortionB-11.2 Bluegill Total PCBs Edible PortionB-11.2 Bluegill Lipid-Normalized PCBs Edible PortionB-11.3 Bullhead species Total PCBs Edible PortionB-11.3 Bullhead species Lipid-Normalized PCBs Edible PortionB-11.4 Largemouth bass Total PCBs Edible PortionB-11.4 Largemouth bass Lipid-Normalized PCBs Edible PortionB-11.5 Pumpkinseed Total PCBs Edible PortionB-11.5 Pumpkinseed Lipid-Normalized PCBs Edible PortionB-11.6 Yellow perch Total PCBs Edible PortionB-11.6 Yellow perch Lipid-Normalized PCBs Edible Portion
Figure No. Species Analysis Type Sample Type
Dewey Loeffel Landfill Superfund SiteNasssau, New York
PCBs Box & Whisker Plot Index
Station 10 - Valatie Kill, Below Area 28
Station 11 - Nassau Lake
G:\GE\PRJ\GE_Loeffel_Drainageways_RIFS\Reports and Presentations\2020\12-xx 2020 Fish Report\Appendices\B\attachment 1_plot statistics_summary 3/4
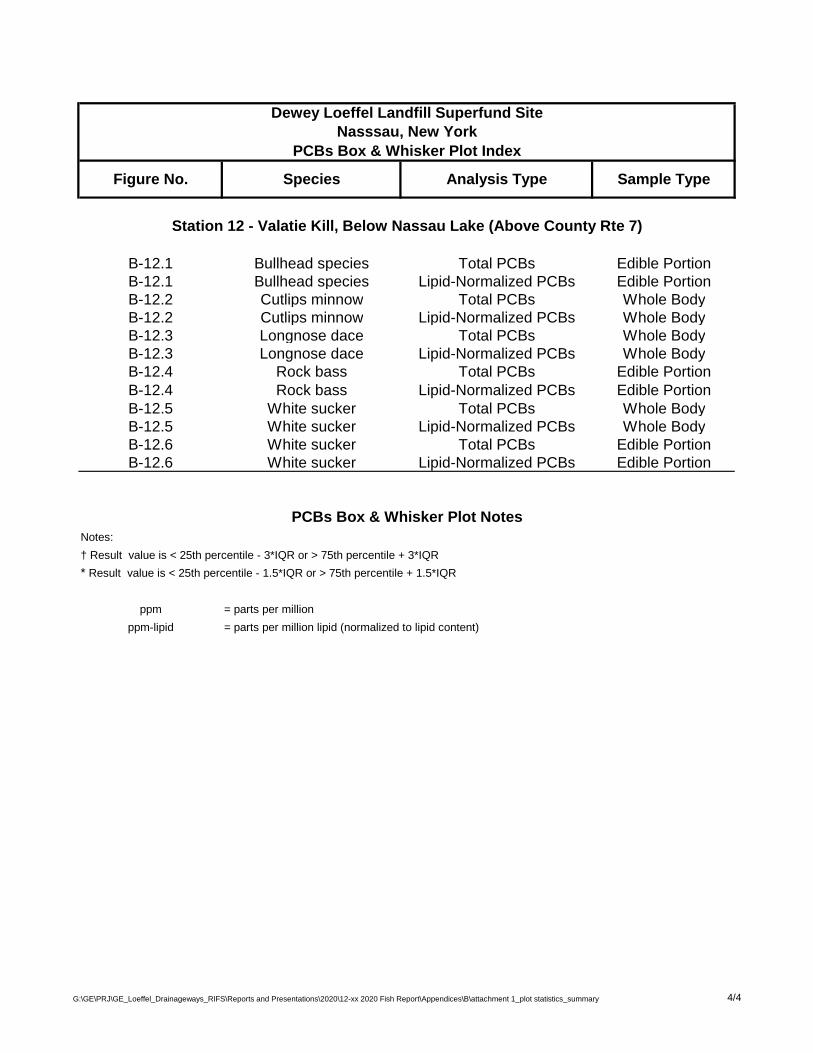
B-12.1 Bullhead species Total PCBs Edible PortionB-12.1 Bullhead species Lipid-Normalized PCBs Edible PortionB-12.2 Cutlips minnow Total PCBs Whole BodyB-12.2 Cutlips minnow Lipid-Normalized PCBs Whole BodyB-12.3 Longnose dace Total PCBs Whole BodyB-12.3 Longnose dace Lipid-Normalized PCBs Whole BodyB-12.4 Rock bass Total PCBs Edible PortionB-12.4 Rock bass Lipid-Normalized PCBs Edible PortionB-12.5 White sucker Total PCBs Whole BodyB-12.5 White sucker Lipid-Normalized PCBs Whole BodyB-12.6 White sucker Total PCBs Edible PortionB-12.6 White sucker Lipid-Normalized PCBs Edible Portion
Notes:
† Result value is < 25th percentile - 3*IQR or > 75th percentile + 3*IQR
* Result value is < 25th percentile - 1.5*IQR or > 75th percentile + 1.5*IQR
ppm = parts per million
ppm-lipid = parts per million lipid (normalized to lipid content)
Station 12 - Valatie Kill, Below Nassau Lake (Above County Rte 7)
PCBs Box & Whisker Plot Notes
Dewey Loeffel Landfill Superfund SiteNasssau, New York
PCBs Box & Whisker Plot Index
Figure No. Species Analysis Type Sample Type
G:\GE\PRJ\GE_Loeffel_Drainageways_RIFS\Reports and Presentations\2020\12-xx 2020 Fish Report\Appendices\B\attachment 1_plot statistics_summary 4/4

STATION 6
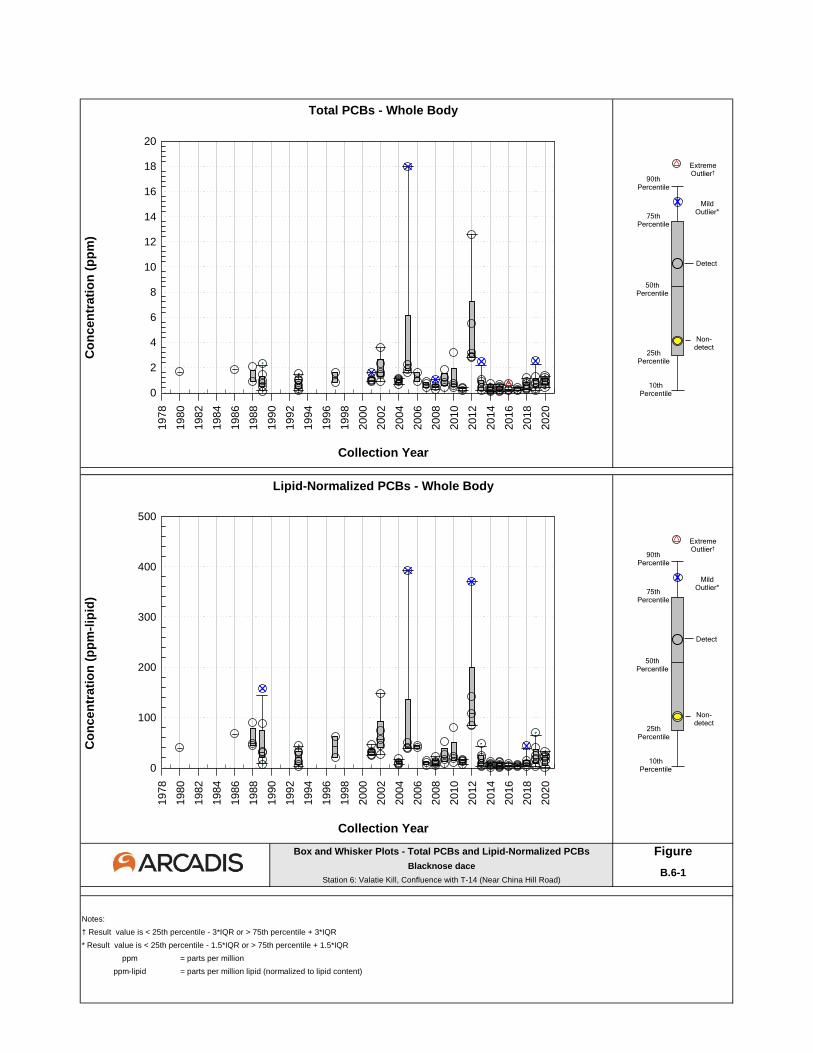
Box and Whisker Plots - Total PCBs and Lipid-Normalized PCBs FigureBlacknose dace
Station 6: Valatie Kill, Confluence with T-14 (Near China Hill Road)
Notes:
† Result value is < 25th percentile - 3*IQR or > 75th percentile + 3*IQR
* Result value is < 25th percentile - 1.5*IQR or > 75th percentile + 1.5*IQR
ppm = parts per million
ppm-lipid = parts per million lipid (normalized to lipid content)
B.6-1
Total PCBs - Whole Body
Co
ncen
trati
on
(p
pm
)
Collection Year
Lipid-Normalized PCBs - Whole Body
Co
ncen
trati
on
(p
pm
-lip
id)
Collection Year
page intentionally blank
x
10th Percentile
90th Percentile
75th Percentile
25th Percentile
Non-detect
Detect
50th Percentile
MildOutlier*
ExtremeOutlier†
page intentionally blank
x
10th Percentile
90th Percentile
75th Percentile
25th Percentile
Non-detect
Detect
50th Percentile
MildOutlier*
ExtremeOutlier†
1978
1980
1982
1984
1986
1988
1990
1992
1994
1996
1998
2000
2002
2004
2006
2008
2010
2012
2014
2016
2018
2020
0
2
4
6
8
10
12
14
16
18
20
1978
1980
1982
1984
1986
1988
1990
1992
1994
1996
1998
2000
2002
2004
2006
2008
2010
2012
2014
2016
2018
2020
0
100
200
300
400
500
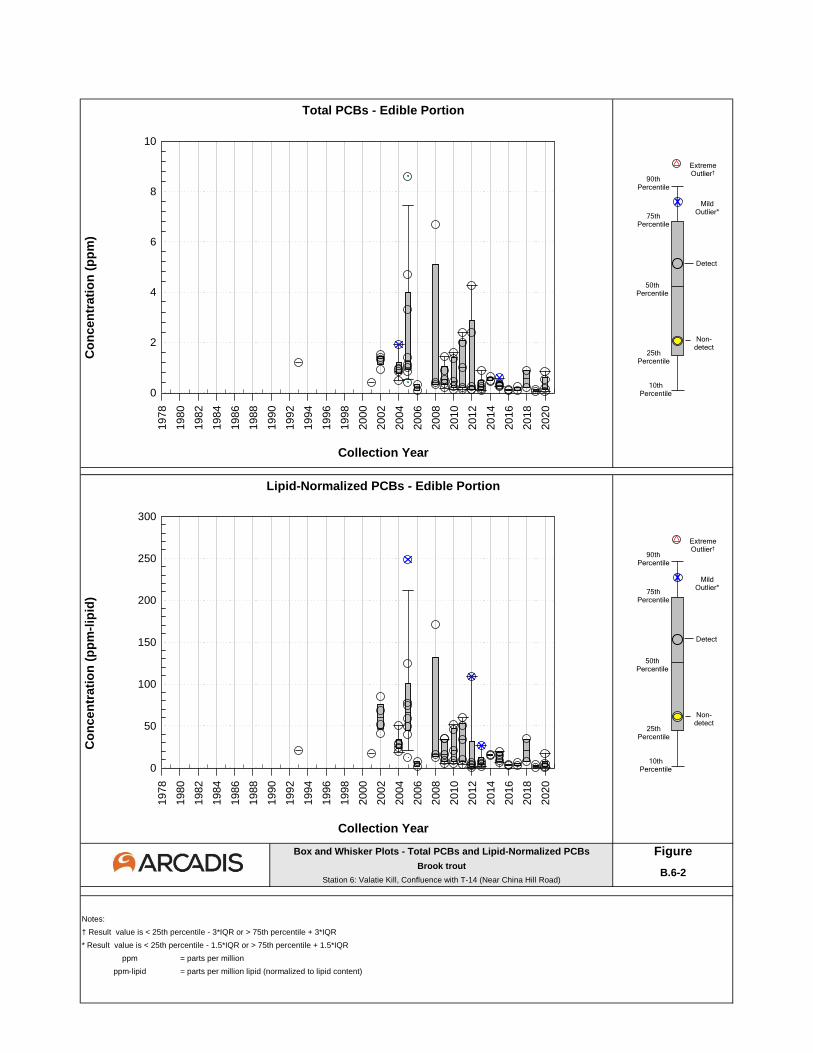
Box and Whisker Plots - Total PCBs and Lipid-Normalized PCBs FigureBrook trout
Station 6: Valatie Kill, Confluence with T-14 (Near China Hill Road)
Notes:
† Result value is < 25th percentile - 3*IQR or > 75th percentile + 3*IQR
* Result value is < 25th percentile - 1.5*IQR or > 75th percentile + 1.5*IQR
ppm = parts per million
ppm-lipid = parts per million lipid (normalized to lipid content)
B.6-2
Total PCBs - Edible Portion
Co
ncen
trati
on
(p
pm
)
Collection Year
Lipid-Normalized PCBs - Edible Portion
Co
ncen
trati
on
(p
pm
-lip
id)
Collection Year
page intentionally blank
x
10th Percentile
90th Percentile
75th Percentile
25th Percentile
Non-detect
Detect
50th Percentile
MildOutlier*
ExtremeOutlier†
page intentionally blank
x
10th Percentile
90th Percentile
75th Percentile
25th Percentile
Non-detect
Detect
50th Percentile
MildOutlier*
ExtremeOutlier†
1978
1980
1982
1984
1986
1988
1990
1992
1994
1996
1998
2000
2002
2004
2006
2008
2010
2012
2014
2016
2018
2020
0
2
4
6
8
10
1978
1980
1982
1984
1986
1988
1990
1992
1994
1996
1998
2000
2002
2004
2006
2008
2010
2012
2014
2016
2018
2020
0
50
100
150
200
250
300
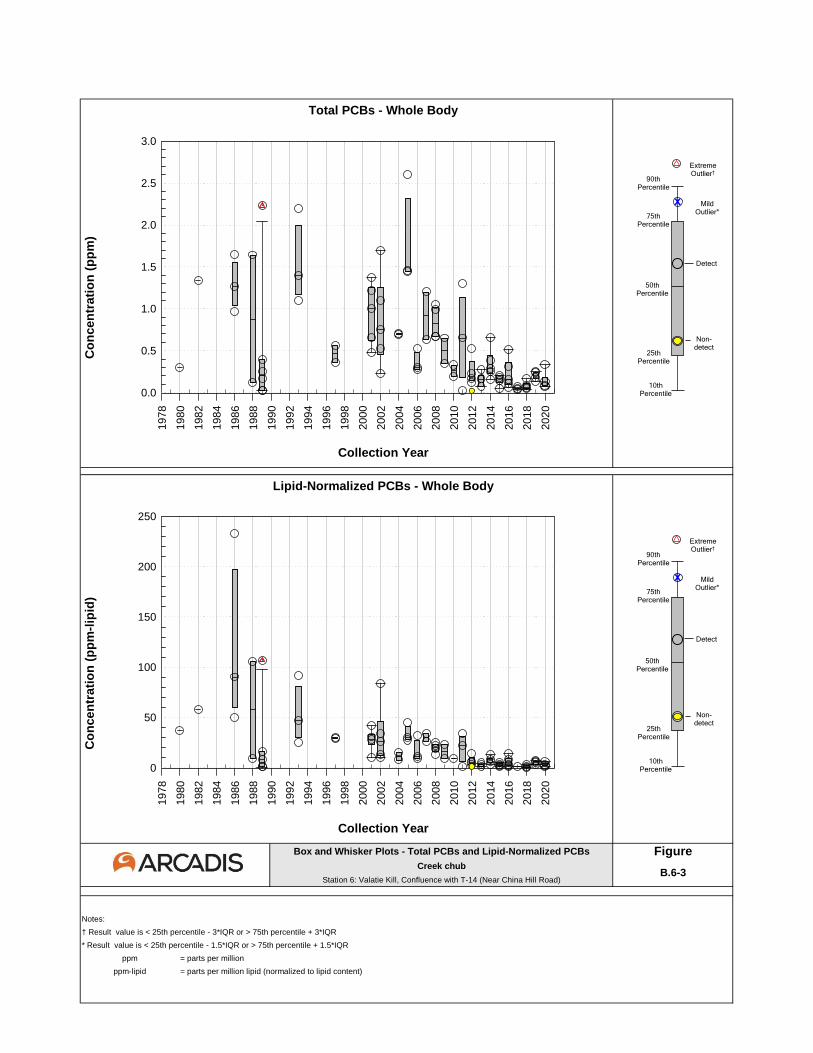
Box and Whisker Plots - Total PCBs and Lipid-Normalized PCBs FigureCreek chub
Station 6: Valatie Kill, Confluence with T-14 (Near China Hill Road)
Notes:
† Result value is < 25th percentile - 3*IQR or > 75th percentile + 3*IQR
* Result value is < 25th percentile - 1.5*IQR or > 75th percentile + 1.5*IQR
ppm = parts per million
ppm-lipid = parts per million lipid (normalized to lipid content)
B.6-3
Total PCBs - Whole Body
Co
ncen
trati
on
(p
pm
)
Collection Year
Lipid-Normalized PCBs - Whole Body
Co
ncen
trati
on
(p
pm
-lip
id)
Collection Year
page intentionally blank
x
10th Percentile
90th Percentile
75th Percentile
25th Percentile
Non-detect
Detect
50th Percentile
MildOutlier*
ExtremeOutlier†
page intentionally blank
x
10th Percentile
90th Percentile
75th Percentile
25th Percentile
Non-detect
Detect
50th Percentile
MildOutlier*
ExtremeOutlier†
1978
1980
1982
1984
1986
1988
1990
1992
1994
1996
1998
2000
2002
2004
2006
2008
2010
2012
2014
2016
2018
2020
0.0
0.5
1.0
1.5
2.0
2.5
3.0
1978
1980
1982
1984
1986
1988
1990
1992
1994
1996
1998
2000
2002
2004
2006
2008
2010
2012
2014
2016
2018
2020
0
50
100
150
200
250
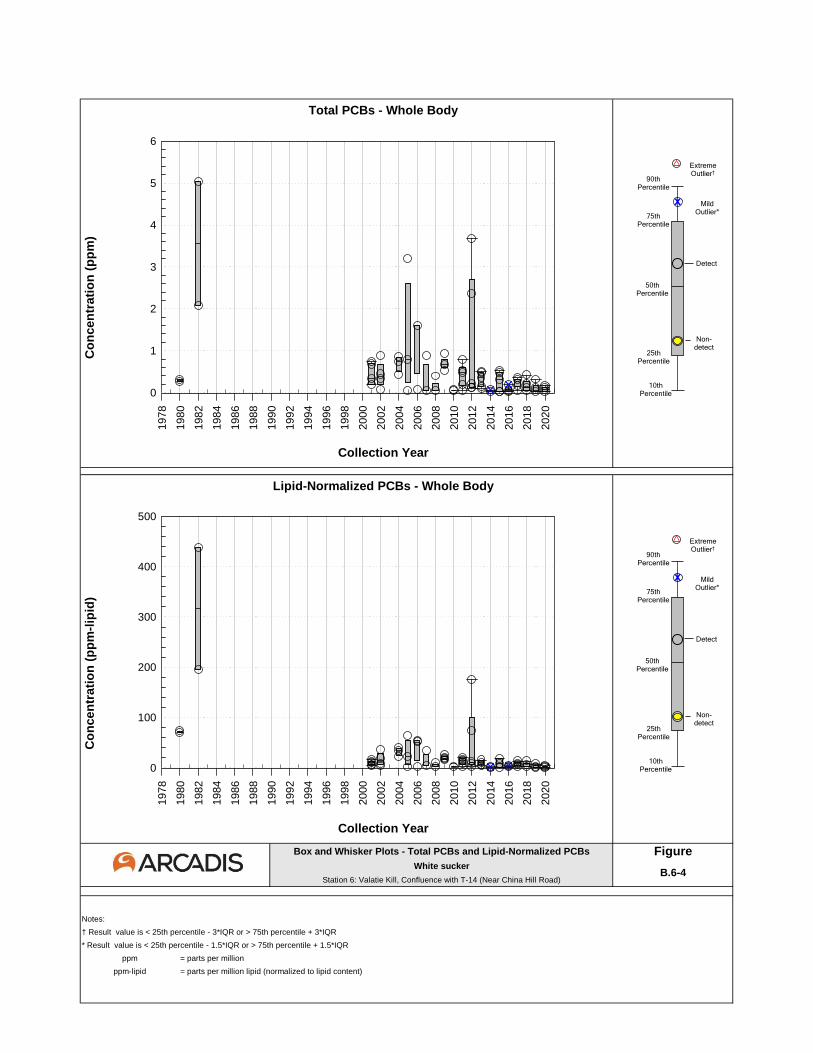
Box and Whisker Plots - Total PCBs and Lipid-Normalized PCBs FigureWhite sucker
Station 6: Valatie Kill, Confluence with T-14 (Near China Hill Road)
Notes:
† Result value is < 25th percentile - 3*IQR or > 75th percentile + 3*IQR
* Result value is < 25th percentile - 1.5*IQR or > 75th percentile + 1.5*IQR
ppm = parts per million
ppm-lipid = parts per million lipid (normalized to lipid content)
B.6-4
Total PCBs - Whole Body
Co
ncen
trati
on
(p
pm
)
Collection Year
Lipid-Normalized PCBs - Whole Body
Co
ncen
trati
on
(p
pm
-lip
id)
Collection Year
page intentionally blank
x
10th Percentile
90th Percentile
75th Percentile
25th Percentile
Non-detect
Detect
50th Percentile
MildOutlier*
ExtremeOutlier†
page intentionally blank
x
10th Percentile
90th Percentile
75th Percentile
25th Percentile
Non-detect
Detect
50th Percentile
MildOutlier*
ExtremeOutlier†
1978
1980
1982
1984
1986
1988
1990
1992
1994
1996
1998
2000
2002
2004
2006
2008
2010
2012
2014
2016
2018
2020
0
1
2
3
4
5
6
1978
1980
1982
1984
1986
1988
1990
1992
1994
1996
1998
2000
2002
2004
2006
2008
2010
2012
2014
2016
2018
2020
0
100
200
300
400
500
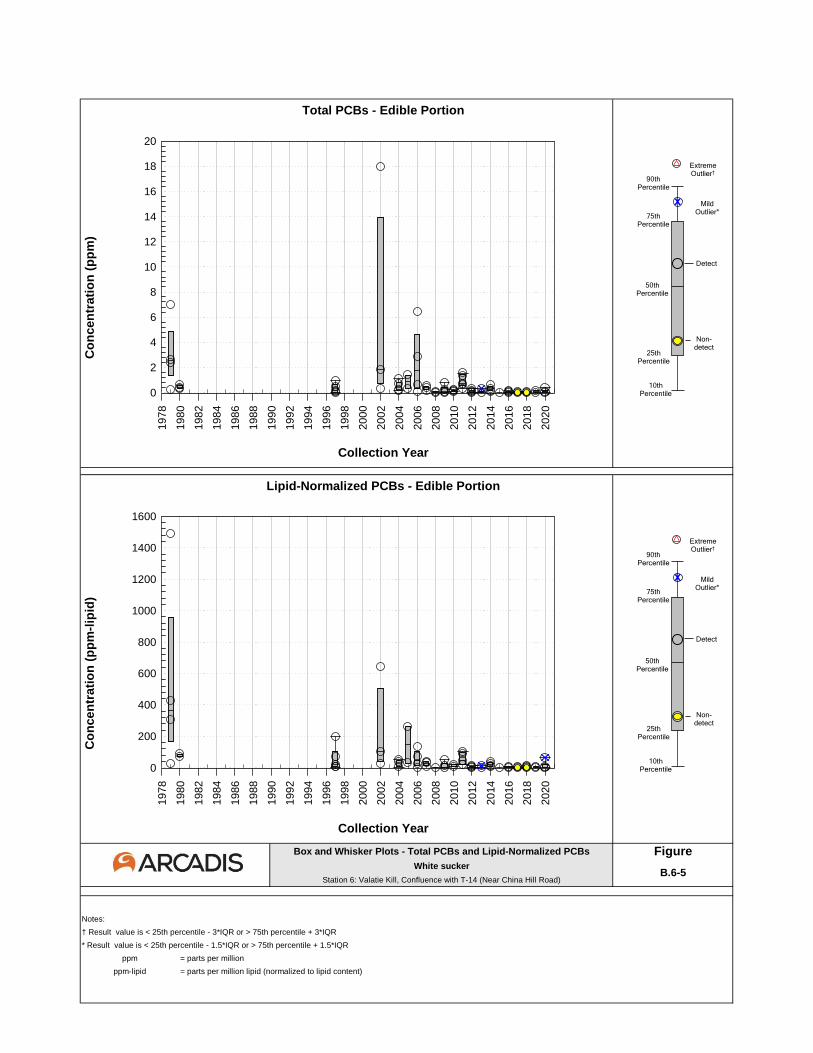
Box and Whisker Plots - Total PCBs and Lipid-Normalized PCBs FigureWhite sucker
Station 6: Valatie Kill, Confluence with T-14 (Near China Hill Road)
Notes:
† Result value is < 25th percentile - 3*IQR or > 75th percentile + 3*IQR
* Result value is < 25th percentile - 1.5*IQR or > 75th percentile + 1.5*IQR
ppm = parts per million
ppm-lipid = parts per million lipid (normalized to lipid content)
B.6-5
Total PCBs - Edible Portion
Co
ncen
trati
on
(p
pm
)
Collection Year
Lipid-Normalized PCBs - Edible Portion
Co
ncen
trati
on
(p
pm
-lip
id)
Collection Year
page intentionally blank
x
10th Percentile
90th Percentile
75th Percentile
25th Percentile
Non-detect
Detect
50th Percentile
MildOutlier*
ExtremeOutlier†
page intentionally blank
x
10th Percentile
90th Percentile
75th Percentile
25th Percentile
Non-detect
Detect
50th Percentile
MildOutlier*
ExtremeOutlier†
1978
1980
1982
1984
1986
1988
1990
1992
1994
1996
1998
2000
2002
2004
2006
2008
2010
2012
2014
2016
2018
2020
0
2
4
6
8
10
12
14
16
18
20
1978
1980
1982
1984
1986
1988
1990
1992
1994
1996
1998
2000
2002
2004
2006
2008
2010
2012
2014
2016
2018
2020
0
200
400
600
800
1000
1200
1400
1600

STATION 7
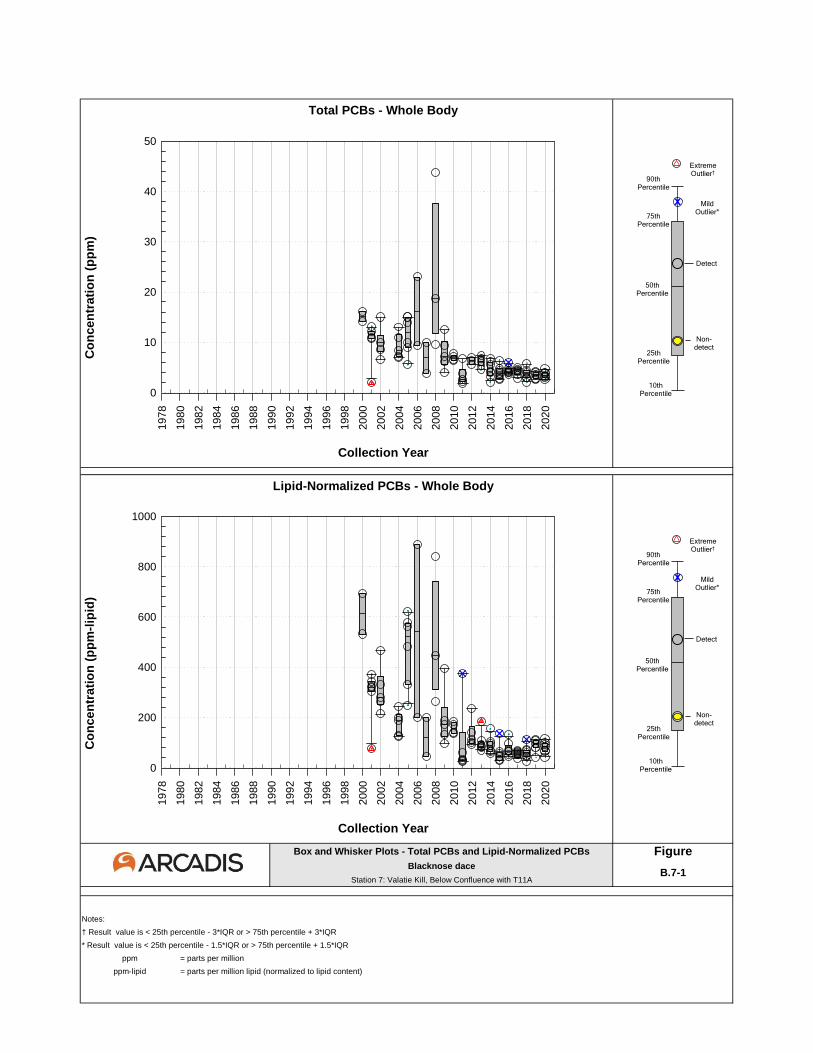
Box and Whisker Plots - Total PCBs and Lipid-Normalized PCBs FigureBlacknose dace
Station 7: Valatie Kill, Below Confluence with T11A
Notes:
† Result value is < 25th percentile - 3*IQR or > 75th percentile + 3*IQR
* Result value is < 25th percentile - 1.5*IQR or > 75th percentile + 1.5*IQR
ppm = parts per million
ppm-lipid = parts per million lipid (normalized to lipid content)
B.7-1
Total PCBs - Whole Body
Co
ncen
trati
on
(p
pm
)
Collection Year
Lipid-Normalized PCBs - Whole Body
Co
ncen
trati
on
(p
pm
-lip
id)
Collection Year
page intentionally blank
x
10th Percentile
90th Percentile
75th Percentile
25th Percentile
Non-detect
Detect
50th Percentile
MildOutlier*
ExtremeOutlier†
page intentionally blank
x
10th Percentile
90th Percentile
75th Percentile
25th Percentile
Non-detect
Detect
50th Percentile
MildOutlier*
ExtremeOutlier†
1978
1980
1982
1984
1986
1988
1990
1992
1994
1996
1998
2000
2002
2004
2006
2008
2010
2012
2014
2016
2018
2020
0
10
20
30
40
50
1978
1980
1982
1984
1986
1988
1990
1992
1994
1996
1998
2000
2002
2004
2006
2008
2010
2012
2014
2016
2018
2020
0
200
400
600
800
1000
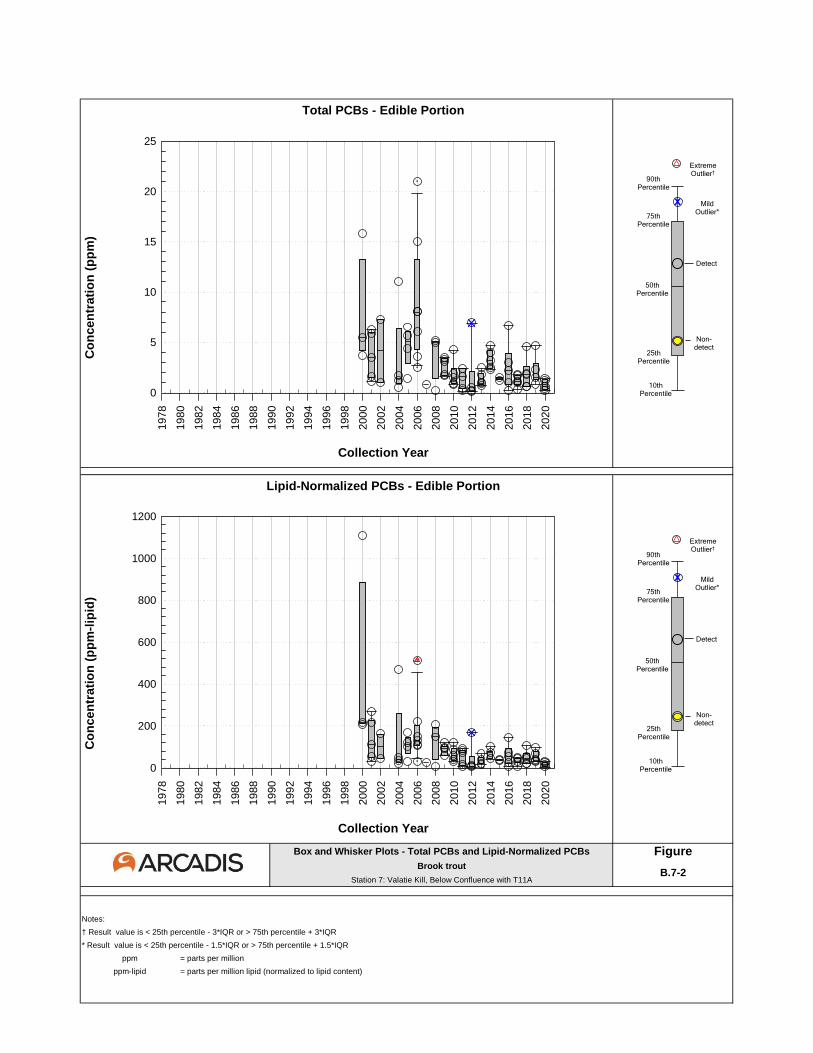
Box and Whisker Plots - Total PCBs and Lipid-Normalized PCBs FigureBrook trout
Station 7: Valatie Kill, Below Confluence with T11A
Notes:
† Result value is < 25th percentile - 3*IQR or > 75th percentile + 3*IQR
* Result value is < 25th percentile - 1.5*IQR or > 75th percentile + 1.5*IQR
ppm = parts per million
ppm-lipid = parts per million lipid (normalized to lipid content)
B.7-2
Total PCBs - Edible Portion
Co
ncen
trati
on
(p
pm
)
Collection Year
Lipid-Normalized PCBs - Edible Portion
Co
ncen
trati
on
(p
pm
-lip
id)
Collection Year
page intentionally blank
x
10th Percentile
90th Percentile
75th Percentile
25th Percentile
Non-detect
Detect
50th Percentile
MildOutlier*
ExtremeOutlier†
page intentionally blank
x
10th Percentile
90th Percentile
75th Percentile
25th Percentile
Non-detect
Detect
50th Percentile
MildOutlier*
ExtremeOutlier†
1978
1980
1982
1984
1986
1988
1990
1992
1994
1996
1998
2000
2002
2004
2006
2008
2010
2012
2014
2016
2018
2020
0
5
10
15
20
25
1978
1980
1982
1984
1986
1988
1990
1992
1994
1996
1998
2000
2002
2004
2006
2008
2010
2012
2014
2016
2018
2020
0
200
400
600
800
1000
1200
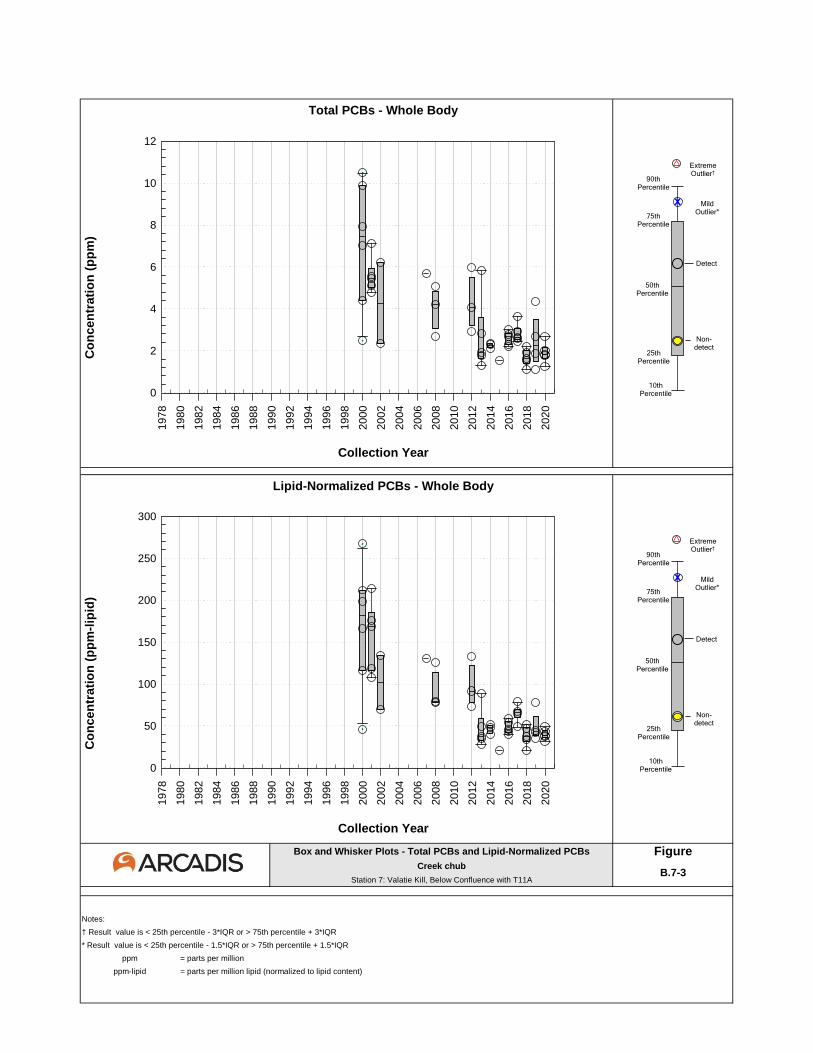
Box and Whisker Plots - Total PCBs and Lipid-Normalized PCBs FigureCreek chub
Station 7: Valatie Kill, Below Confluence with T11A
Notes:
† Result value is < 25th percentile - 3*IQR or > 75th percentile + 3*IQR
* Result value is < 25th percentile - 1.5*IQR or > 75th percentile + 1.5*IQR
ppm = parts per million
ppm-lipid = parts per million lipid (normalized to lipid content)
B.7-3
Total PCBs - Whole Body
Co
ncen
trati
on
(p
pm
)
Collection Year
Lipid-Normalized PCBs - Whole Body
Co
ncen
trati
on
(p
pm
-lip
id)
Collection Year
page intentionally blank
x
10th Percentile
90th Percentile
75th Percentile
25th Percentile
Non-detect
Detect
50th Percentile
MildOutlier*
ExtremeOutlier†
page intentionally blank
x
10th Percentile
90th Percentile
75th Percentile
25th Percentile
Non-detect
Detect
50th Percentile
MildOutlier*
ExtremeOutlier†
1978
1980
1982
1984
1986
1988
1990
1992
1994
1996
1998
2000
2002
2004
2006
2008
2010
2012
2014
2016
2018
2020
0
2
4
6
8
10
12
1978
1980
1982
1984
1986
1988
1990
1992
1994
1996
1998
2000
2002
2004
2006
2008
2010
2012
2014
2016
2018
2020
0
50
100
150
200
250
300
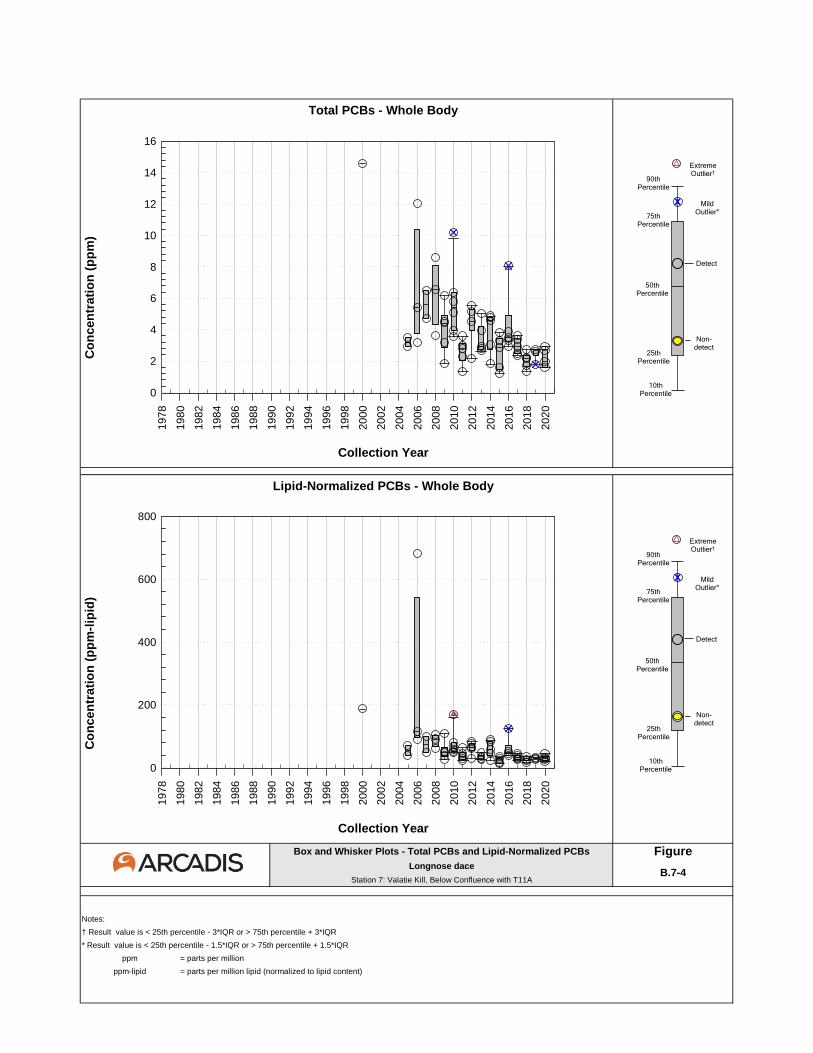
Box and Whisker Plots - Total PCBs and Lipid-Normalized PCBs FigureLongnose dace
Station 7: Valatie Kill, Below Confluence with T11A
Notes:
† Result value is < 25th percentile - 3*IQR or > 75th percentile + 3*IQR
* Result value is < 25th percentile - 1.5*IQR or > 75th percentile + 1.5*IQR
ppm = parts per million
ppm-lipid = parts per million lipid (normalized to lipid content)
B.7-4
Total PCBs - Whole Body
Co
ncen
trati
on
(p
pm
)
Collection Year
Lipid-Normalized PCBs - Whole Body
Co
ncen
trati
on
(p
pm
-lip
id)
Collection Year
page intentionally blank
x
10th Percentile
90th Percentile
75th Percentile
25th Percentile
Non-detect
Detect
50th Percentile
MildOutlier*
ExtremeOutlier†
page intentionally blank
x
10th Percentile
90th Percentile
75th Percentile
25th Percentile
Non-detect
Detect
50th Percentile
MildOutlier*
ExtremeOutlier†
1978
1980
1982
1984
1986
1988
1990
1992
1994
1996
1998
2000
2002
2004
2006
2008
2010
2012
2014
2016
2018
2020
0
2
4
6
8
10
12
14
16
1978
1980
1982
1984
1986
1988
1990
1992
1994
1996
1998
2000
2002
2004
2006
2008
2010
2012
2014
2016
2018
2020
0
200
400
600
800
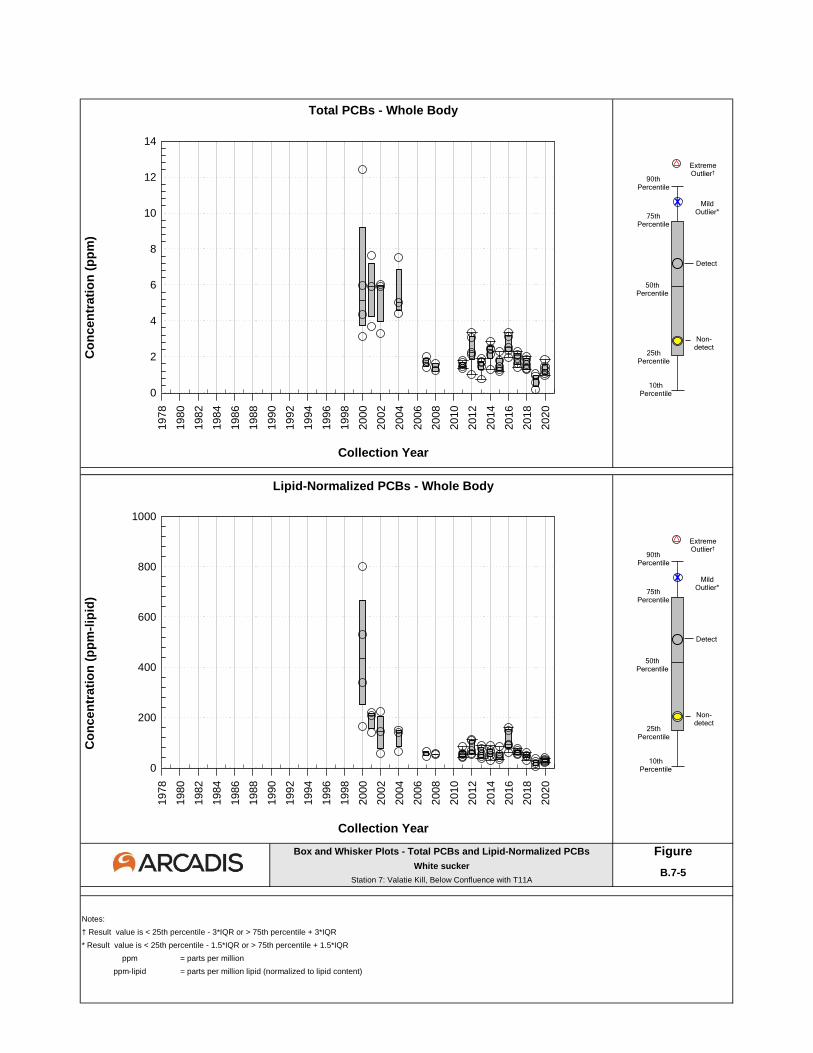
Box and Whisker Plots - Total PCBs and Lipid-Normalized PCBs FigureWhite sucker
Station 7: Valatie Kill, Below Confluence with T11A
Notes:
† Result value is < 25th percentile - 3*IQR or > 75th percentile + 3*IQR
* Result value is < 25th percentile - 1.5*IQR or > 75th percentile + 1.5*IQR
ppm = parts per million
ppm-lipid = parts per million lipid (normalized to lipid content)
B.7-5
Total PCBs - Whole Body
Co
ncen
trati
on
(p
pm
)
Collection Year
Lipid-Normalized PCBs - Whole Body
Co
ncen
trati
on
(p
pm
-lip
id)
Collection Year
page intentionally blank
x
10th Percentile
90th Percentile
75th Percentile
25th Percentile
Non-detect
Detect
50th Percentile
MildOutlier*
ExtremeOutlier†
page intentionally blank
x
10th Percentile
90th Percentile
75th Percentile
25th Percentile
Non-detect
Detect
50th Percentile
MildOutlier*
ExtremeOutlier†
1978
1980
1982
1984
1986
1988
1990
1992
1994
1996
1998
2000
2002
2004
2006
2008
2010
2012
2014
2016
2018
2020
0
2
4
6
8
10
12
14
1978
1980
1982
1984
1986
1988
1990
1992
1994
1996
1998
2000
2002
2004
2006
2008
2010
2012
2014
2016
2018
2020
0
200
400
600
800
1000
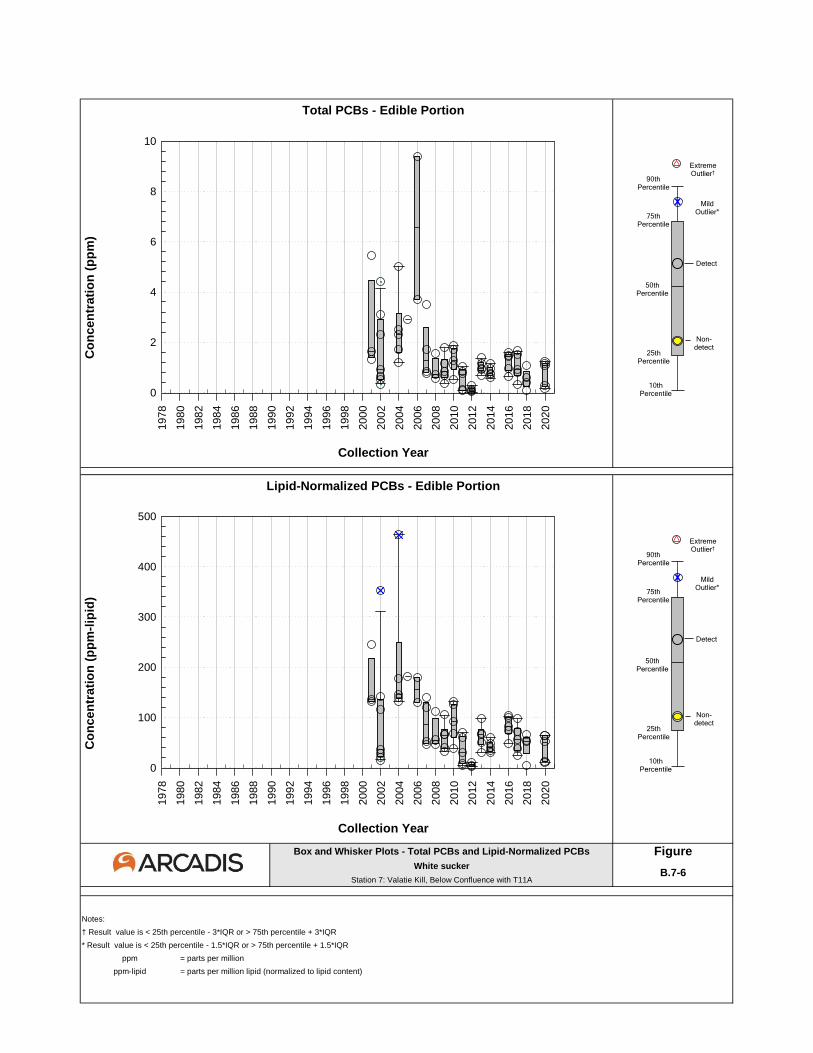
Box and Whisker Plots - Total PCBs and Lipid-Normalized PCBs FigureWhite sucker
Station 7: Valatie Kill, Below Confluence with T11A
Notes:
† Result value is < 25th percentile - 3*IQR or > 75th percentile + 3*IQR
* Result value is < 25th percentile - 1.5*IQR or > 75th percentile + 1.5*IQR
ppm = parts per million
ppm-lipid = parts per million lipid (normalized to lipid content)
B.7-6
Total PCBs - Edible Portion
Co
ncen
trati
on
(p
pm
)
Collection Year
Lipid-Normalized PCBs - Edible Portion
Co
ncen
trati
on
(p
pm
-lip
id)
Collection Year
page intentionally blank
x
10th Percentile
90th Percentile
75th Percentile
25th Percentile
Non-detect
Detect
50th Percentile
MildOutlier*
ExtremeOutlier†
page intentionally blank
x
10th Percentile
90th Percentile
75th Percentile
25th Percentile
Non-detect
Detect
50th Percentile
MildOutlier*
ExtremeOutlier†
1978
1980
1982
1984
1986
1988
1990
1992
1994
1996
1998
2000
2002
2004
2006
2008
2010
2012
2014
2016
2018
2020
0
2
4
6
8
10
1978
1980
1982
1984
1986
1988
1990
1992
1994
1996
1998
2000
2002
2004
2006
2008
2010
2012
2014
2016
2018
2020
0
100
200
300
400
500

STATION 8
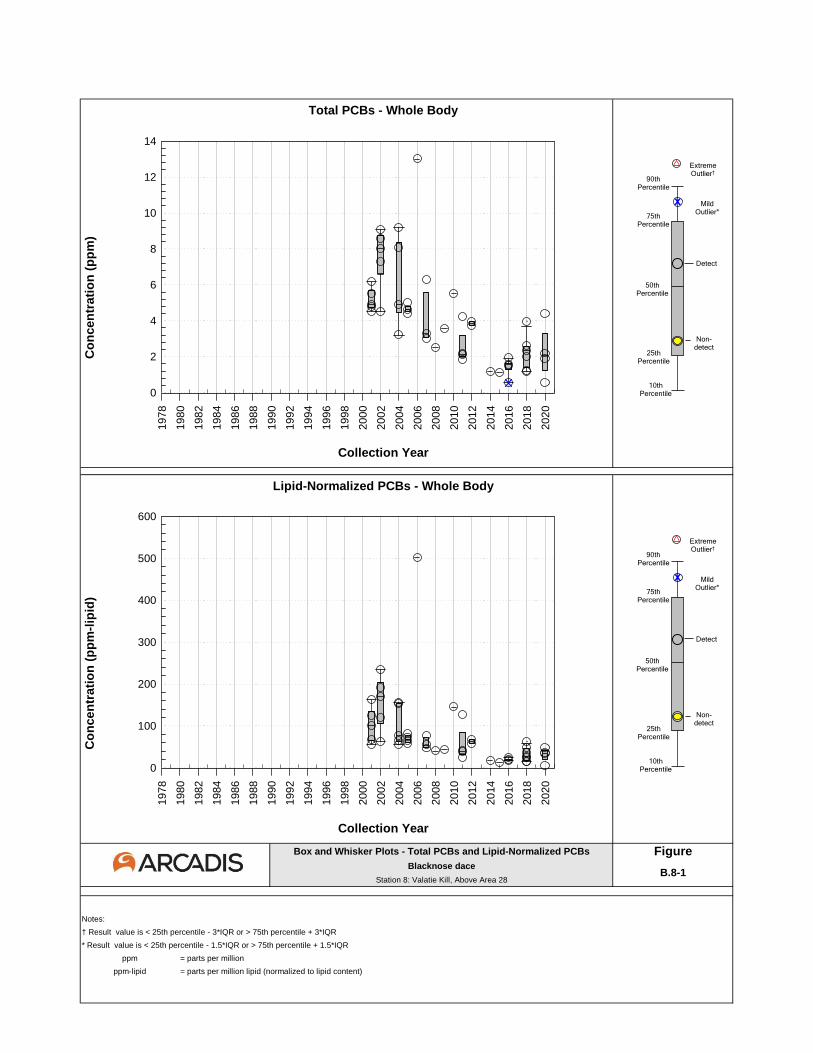
Box and Whisker Plots - Total PCBs and Lipid-Normalized PCBs FigureBlacknose dace
Station 8: Valatie Kill, Above Area 28
Notes:
† Result value is < 25th percentile - 3*IQR or > 75th percentile + 3*IQR
* Result value is < 25th percentile - 1.5*IQR or > 75th percentile + 1.5*IQR
ppm = parts per million
ppm-lipid = parts per million lipid (normalized to lipid content)
B.8-1
Total PCBs - Whole Body
Co
ncen
trati
on
(p
pm
)
Collection Year
Lipid-Normalized PCBs - Whole Body
Co
ncen
trati
on
(p
pm
-lip
id)
Collection Year
page intentionally blank
x
10th Percentile
90th Percentile
75th Percentile
25th Percentile
Non-detect
Detect
50th Percentile
MildOutlier*
ExtremeOutlier†
page intentionally blank
x
10th Percentile
90th Percentile
75th Percentile
25th Percentile
Non-detect
Detect
50th Percentile
MildOutlier*
ExtremeOutlier†
1978
1980
1982
1984
1986
1988
1990
1992
1994
1996
1998
2000
2002
2004
2006
2008
2010
2012
2014
2016
2018
2020
0
2
4
6
8
10
12
14
1978
1980
1982
1984
1986
1988
1990
1992
1994
1996
1998
2000
2002
2004
2006
2008
2010
2012
2014
2016
2018
2020
0
100
200
300
400
500
600
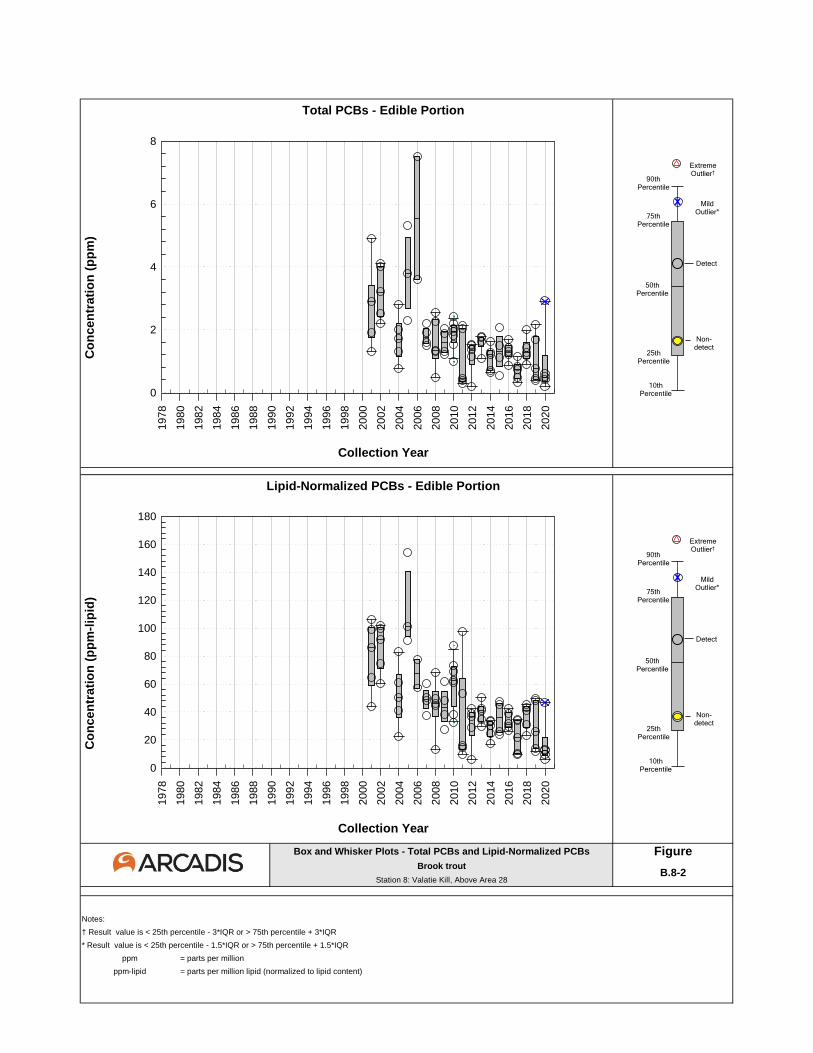
Box and Whisker Plots - Total PCBs and Lipid-Normalized PCBs FigureBrook trout
Station 8: Valatie Kill, Above Area 28
Notes:
† Result value is < 25th percentile - 3*IQR or > 75th percentile + 3*IQR
* Result value is < 25th percentile - 1.5*IQR or > 75th percentile + 1.5*IQR
ppm = parts per million
ppm-lipid = parts per million lipid (normalized to lipid content)
B.8-2
Total PCBs - Edible Portion
Co
ncen
trati
on
(p
pm
)
Collection Year
Lipid-Normalized PCBs - Edible Portion
Co
ncen
trati
on
(p
pm
-lip
id)
Collection Year
page intentionally blank
x
10th Percentile
90th Percentile
75th Percentile
25th Percentile
Non-detect
Detect
50th Percentile
MildOutlier*
ExtremeOutlier†
page intentionally blank
x
10th Percentile
90th Percentile
75th Percentile
25th Percentile
Non-detect
Detect
50th Percentile
MildOutlier*
ExtremeOutlier†
1978
1980
1982
1984
1986
1988
1990
1992
1994
1996
1998
2000
2002
2004
2006
2008
2010
2012
2014
2016
2018
2020
0
2
4
6
8
1978
1980
1982
1984
1986
1988
1990
1992
1994
1996
1998
2000
2002
2004
2006
2008
2010
2012
2014
2016
2018
2020
0
20
40
60
80
100
120
140
160
180
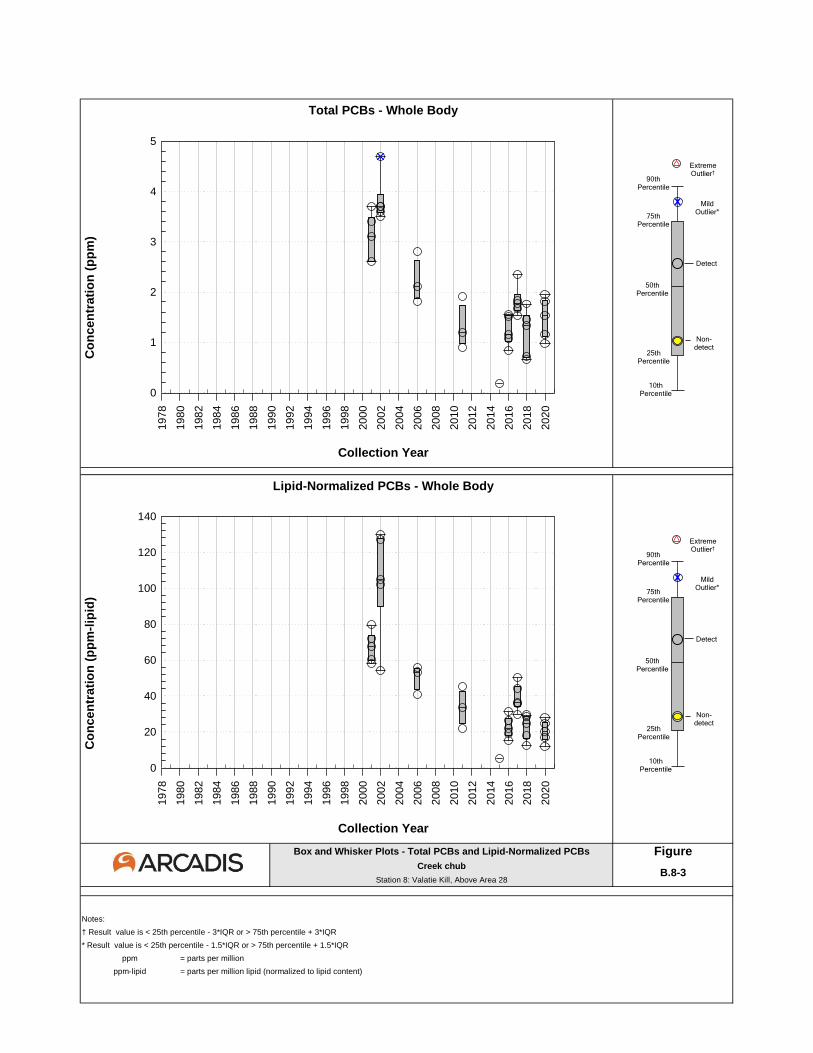
Box and Whisker Plots - Total PCBs and Lipid-Normalized PCBs FigureCreek chub
Station 8: Valatie Kill, Above Area 28
Notes:
† Result value is < 25th percentile - 3*IQR or > 75th percentile + 3*IQR
* Result value is < 25th percentile - 1.5*IQR or > 75th percentile + 1.5*IQR
ppm = parts per million
ppm-lipid = parts per million lipid (normalized to lipid content)
B.8-3
Total PCBs - Whole Body
Co
ncen
trati
on
(p
pm
)
Collection Year
Lipid-Normalized PCBs - Whole Body
Co
ncen
trati
on
(p
pm
-lip
id)
Collection Year
page intentionally blank
x
10th Percentile
90th Percentile
75th Percentile
25th Percentile
Non-detect
Detect
50th Percentile
MildOutlier*
ExtremeOutlier†
page intentionally blank
x
10th Percentile
90th Percentile
75th Percentile
25th Percentile
Non-detect
Detect
50th Percentile
MildOutlier*
ExtremeOutlier†
1978
1980
1982
1984
1986
1988
1990
1992
1994
1996
1998
2000
2002
2004
2006
2008
2010
2012
2014
2016
2018
2020
0
1
2
3
4
5
1978
1980
1982
1984
1986
1988
1990
1992
1994
1996
1998
2000
2002
2004
2006
2008
2010
2012
2014
2016
2018
2020
0
20
40
60
80
100
120
140
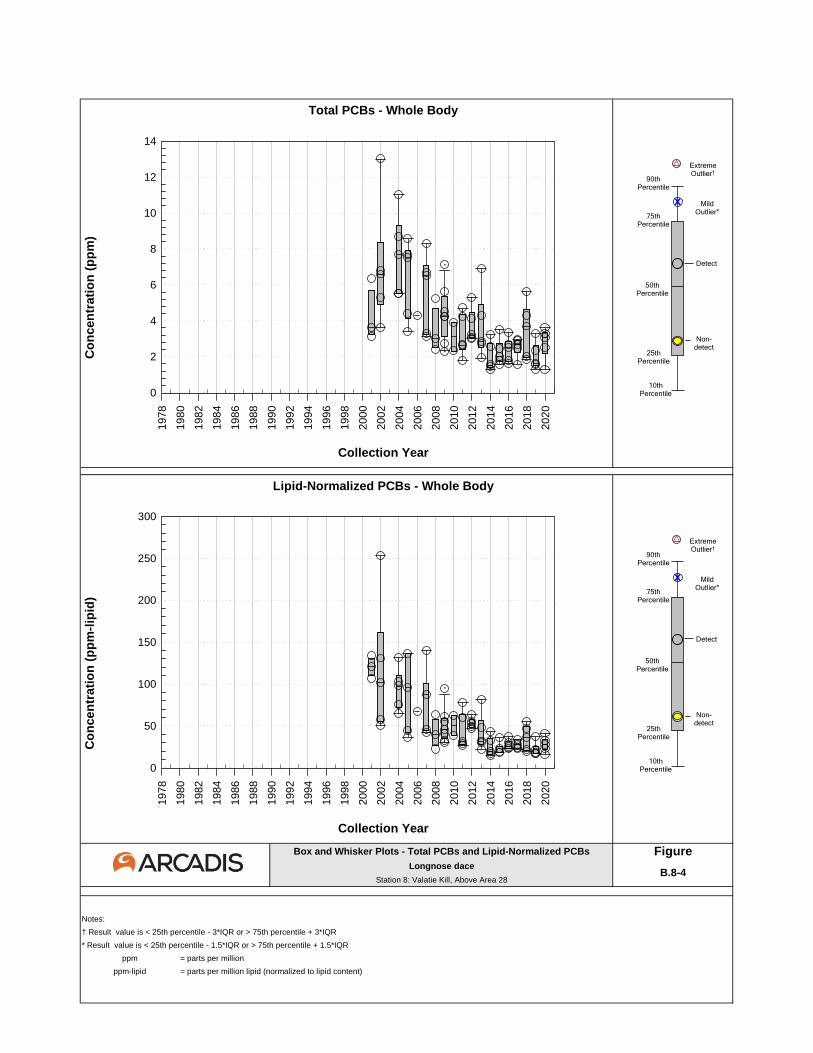
Box and Whisker Plots - Total PCBs and Lipid-Normalized PCBs FigureLongnose dace
Station 8: Valatie Kill, Above Area 28
Notes:
† Result value is < 25th percentile - 3*IQR or > 75th percentile + 3*IQR
* Result value is < 25th percentile - 1.5*IQR or > 75th percentile + 1.5*IQR
ppm = parts per million
ppm-lipid = parts per million lipid (normalized to lipid content)
B.8-4
Total PCBs - Whole Body
Co
ncen
trati
on
(p
pm
)
Collection Year
Lipid-Normalized PCBs - Whole Body
Co
ncen
trati
on
(p
pm
-lip
id)
Collection Year
page intentionally blank
x
10th Percentile
90th Percentile
75th Percentile
25th Percentile
Non-detect
Detect
50th Percentile
MildOutlier*
ExtremeOutlier†
page intentionally blank
x
10th Percentile
90th Percentile
75th Percentile
25th Percentile
Non-detect
Detect
50th Percentile
MildOutlier*
ExtremeOutlier†
1978
1980
1982
1984
1986
1988
1990
1992
1994
1996
1998
2000
2002
2004
2006
2008
2010
2012
2014
2016
2018
2020
0
2
4
6
8
10
12
14
1978
1980
1982
1984
1986
1988
1990
1992
1994
1996
1998
2000
2002
2004
2006
2008
2010
2012
2014
2016
2018
2020
0
50
100
150
200
250
300
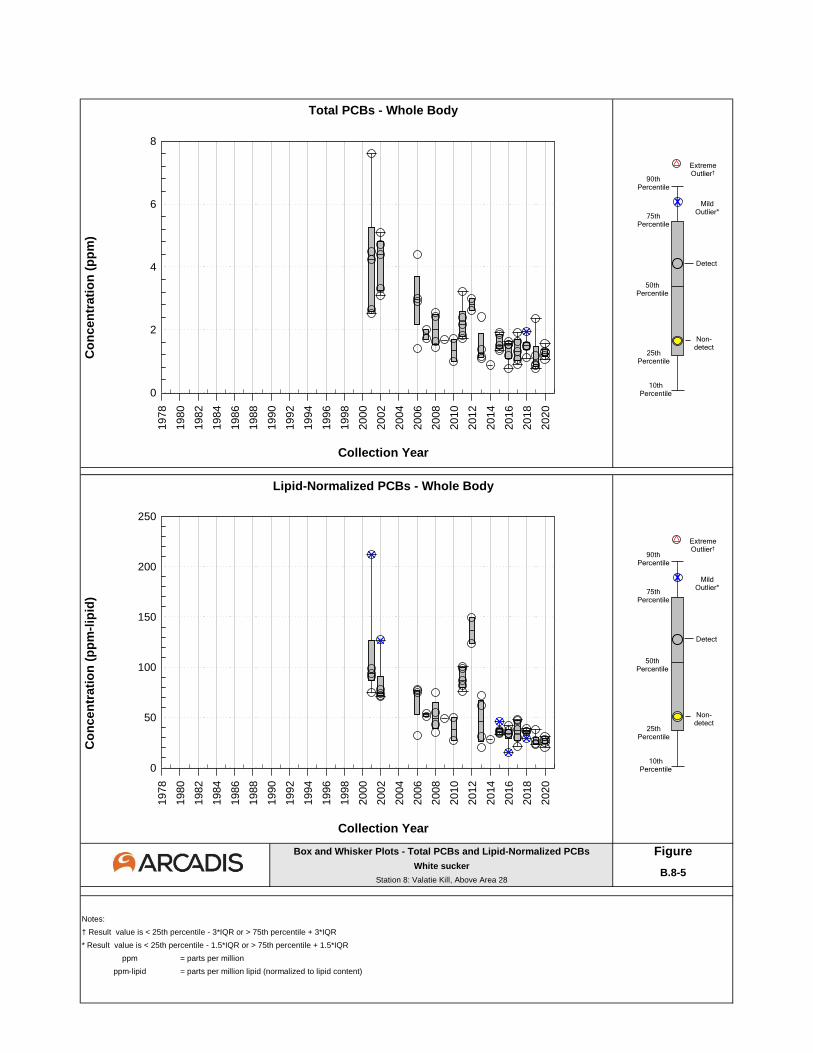
Box and Whisker Plots - Total PCBs and Lipid-Normalized PCBs FigureWhite sucker
Station 8: Valatie Kill, Above Area 28
Notes:
† Result value is < 25th percentile - 3*IQR or > 75th percentile + 3*IQR
* Result value is < 25th percentile - 1.5*IQR or > 75th percentile + 1.5*IQR
ppm = parts per million
ppm-lipid = parts per million lipid (normalized to lipid content)
B.8-5
Total PCBs - Whole Body
Co
ncen
trati
on
(p
pm
)
Collection Year
Lipid-Normalized PCBs - Whole Body
Co
ncen
trati
on
(p
pm
-lip
id)
Collection Year
page intentionally blank
x
10th Percentile
90th Percentile
75th Percentile
25th Percentile
Non-detect
Detect
50th Percentile
MildOutlier*
ExtremeOutlier†
page intentionally blank
x
10th Percentile
90th Percentile
75th Percentile
25th Percentile
Non-detect
Detect
50th Percentile
MildOutlier*
ExtremeOutlier†
1978
1980
1982
1984
1986
1988
1990
1992
1994
1996
1998
2000
2002
2004
2006
2008
2010
2012
2014
2016
2018
2020
0
2
4
6
8
1978
1980
1982
1984
1986
1988
1990
1992
1994
1996
1998
2000
2002
2004
2006
2008
2010
2012
2014
2016
2018
2020
0
50
100
150
200
250
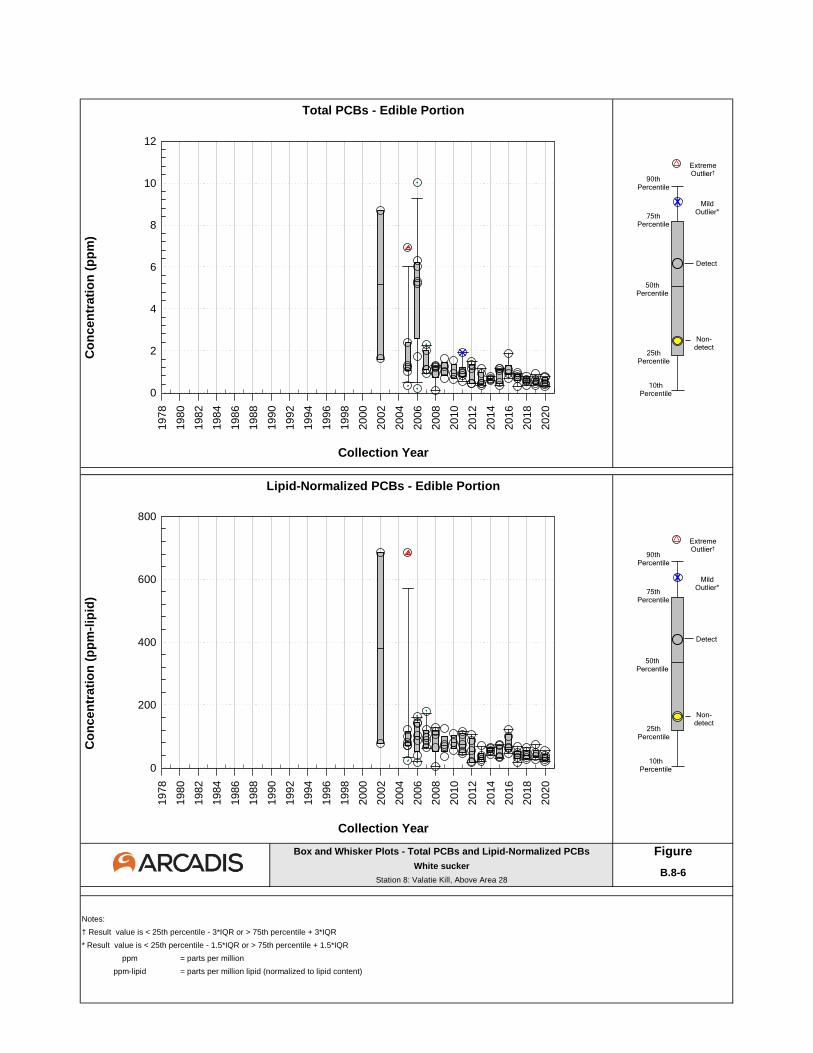
Box and Whisker Plots - Total PCBs and Lipid-Normalized PCBs FigureWhite sucker
Station 8: Valatie Kill, Above Area 28
Notes:
† Result value is < 25th percentile - 3*IQR or > 75th percentile + 3*IQR
* Result value is < 25th percentile - 1.5*IQR or > 75th percentile + 1.5*IQR
ppm = parts per million
ppm-lipid = parts per million lipid (normalized to lipid content)
B.8-6
Total PCBs - Edible Portion
Co
ncen
trati
on
(p
pm
)
Collection Year
Lipid-Normalized PCBs - Edible Portion
Co
ncen
trati
on
(p
pm
-lip
id)
Collection Year
page intentionally blank
x
10th Percentile
90th Percentile
75th Percentile
25th Percentile
Non-detect
Detect
50th Percentile
MildOutlier*
ExtremeOutlier†
page intentionally blank
x
10th Percentile
90th Percentile
75th Percentile
25th Percentile
Non-detect
Detect
50th Percentile
MildOutlier*
ExtremeOutlier†
1978
1980
1982
1984
1986
1988
1990
1992
1994
1996
1998
2000
2002
2004
2006
2008
2010
2012
2014
2016
2018
2020
0
2
4
6
8
10
12
1978
1980
1982
1984
1986
1988
1990
1992
1994
1996
1998
2000
2002
2004
2006
2008
2010
2012
2014
2016
2018
2020
0
200
400
600
800

STATION 9
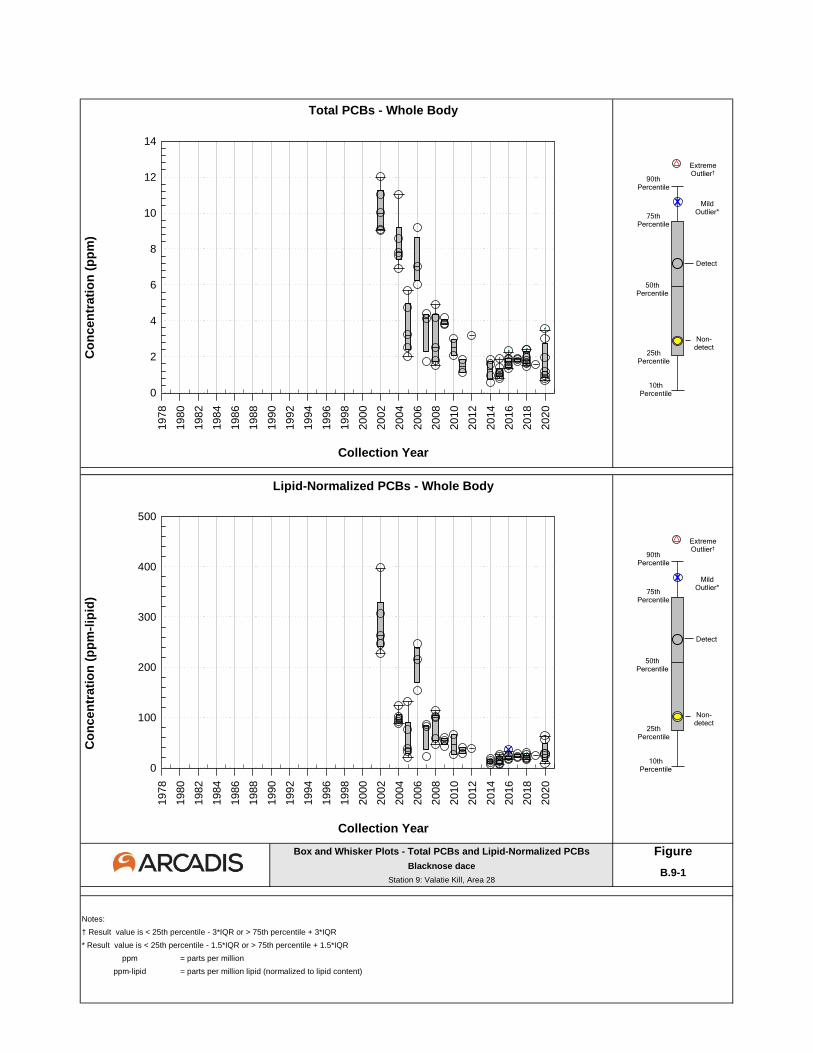
Box and Whisker Plots - Total PCBs and Lipid-Normalized PCBs FigureBlacknose dace
Station 9: Valatie Kill, Area 28
Notes:
† Result value is < 25th percentile - 3*IQR or > 75th percentile + 3*IQR
* Result value is < 25th percentile - 1.5*IQR or > 75th percentile + 1.5*IQR
ppm = parts per million
ppm-lipid = parts per million lipid (normalized to lipid content)
B.9-1
Total PCBs - Whole Body
Co
ncen
trati
on
(p
pm
)
Collection Year
Lipid-Normalized PCBs - Whole Body
Co
ncen
trati
on
(p
pm
-lip
id)
Collection Year
page intentionally blank
x
10th Percentile
90th Percentile
75th Percentile
25th Percentile
Non-detect
Detect
50th Percentile
MildOutlier*
ExtremeOutlier†
page intentionally blank
x
10th Percentile
90th Percentile
75th Percentile
25th Percentile
Non-detect
Detect
50th Percentile
MildOutlier*
ExtremeOutlier†
1978
1980
1982
1984
1986
1988
1990
1992
1994
1996
1998
2000
2002
2004
2006
2008
2010
2012
2014
2016
2018
2020
0
2
4
6
8
10
12
14
1978
1980
1982
1984
1986
1988
1990
1992
1994
1996
1998
2000
2002
2004
2006
2008
2010
2012
2014
2016
2018
2020
0
100
200
300
400
500
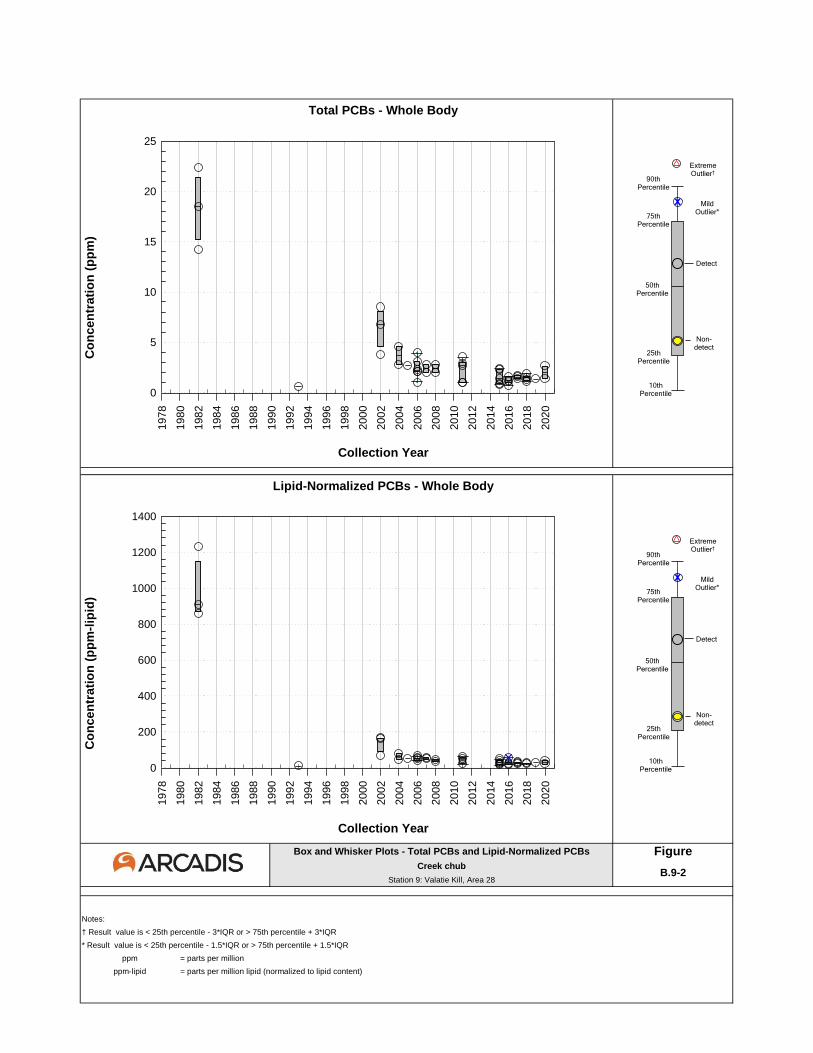
Box and Whisker Plots - Total PCBs and Lipid-Normalized PCBs FigureCreek chub
Station 9: Valatie Kill, Area 28
Notes:
† Result value is < 25th percentile - 3*IQR or > 75th percentile + 3*IQR
* Result value is < 25th percentile - 1.5*IQR or > 75th percentile + 1.5*IQR
ppm = parts per million
ppm-lipid = parts per million lipid (normalized to lipid content)
B.9-2
Total PCBs - Whole Body
Co
ncen
trati
on
(p
pm
)
Collection Year
Lipid-Normalized PCBs - Whole Body
Co
ncen
trati
on
(p
pm
-lip
id)
Collection Year
page intentionally blank
x
10th Percentile
90th Percentile
75th Percentile
25th Percentile
Non-detect
Detect
50th Percentile
MildOutlier*
ExtremeOutlier†
page intentionally blank
x
10th Percentile
90th Percentile
75th Percentile
25th Percentile
Non-detect
Detect
50th Percentile
MildOutlier*
ExtremeOutlier†
1978
1980
1982
1984
1986
1988
1990
1992
1994
1996
1998
2000
2002
2004
2006
2008
2010
2012
2014
2016
2018
2020
0
5
10
15
20
25
1978
1980
1982
1984
1986
1988
1990
1992
1994
1996
1998
2000
2002
2004
2006
2008
2010
2012
2014
2016
2018
2020
0
200
400
600
800
1000
1200
1400
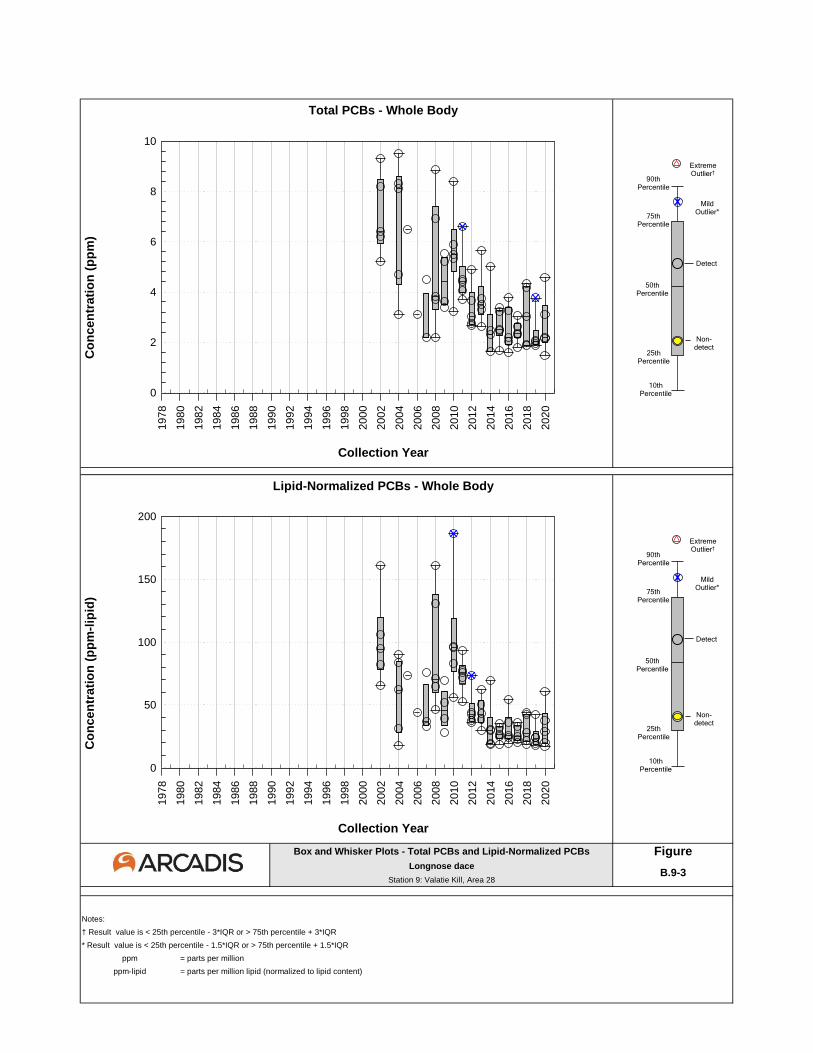
Box and Whisker Plots - Total PCBs and Lipid-Normalized PCBs FigureLongnose dace
Station 9: Valatie Kill, Area 28
Notes:
† Result value is < 25th percentile - 3*IQR or > 75th percentile + 3*IQR
* Result value is < 25th percentile - 1.5*IQR or > 75th percentile + 1.5*IQR
ppm = parts per million
ppm-lipid = parts per million lipid (normalized to lipid content)
B.9-3
Total PCBs - Whole Body
Co
ncen
trati
on
(p
pm
)
Collection Year
Lipid-Normalized PCBs - Whole Body
Co
ncen
trati
on
(p
pm
-lip
id)
Collection Year
page intentionally blank
x
10th Percentile
90th Percentile
75th Percentile
25th Percentile
Non-detect
Detect
50th Percentile
MildOutlier*
ExtremeOutlier†
page intentionally blank
x
10th Percentile
90th Percentile
75th Percentile
25th Percentile
Non-detect
Detect
50th Percentile
MildOutlier*
ExtremeOutlier†
1978
1980
1982
1984
1986
1988
1990
1992
1994
1996
1998
2000
2002
2004
2006
2008
2010
2012
2014
2016
2018
2020
0
2
4
6
8
10
1978
1980
1982
1984
1986
1988
1990
1992
1994
1996
1998
2000
2002
2004
2006
2008
2010
2012
2014
2016
2018
2020
0
50
100
150
200
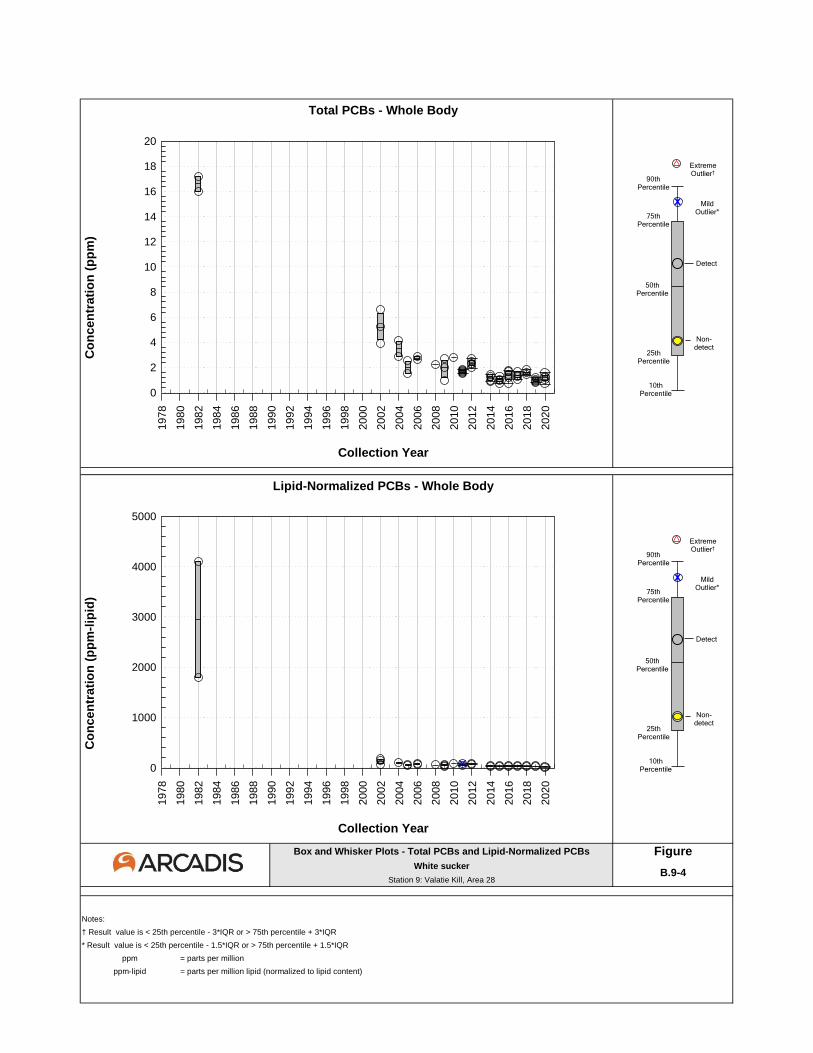
Box and Whisker Plots - Total PCBs and Lipid-Normalized PCBs FigureWhite sucker
Station 9: Valatie Kill, Area 28
Notes:
† Result value is < 25th percentile - 3*IQR or > 75th percentile + 3*IQR
* Result value is < 25th percentile - 1.5*IQR or > 75th percentile + 1.5*IQR
ppm = parts per million
ppm-lipid = parts per million lipid (normalized to lipid content)
B.9-4
Total PCBs - Whole Body
Co
ncen
trati
on
(p
pm
)
Collection Year
Lipid-Normalized PCBs - Whole Body
Co
ncen
trati
on
(p
pm
-lip
id)
Collection Year
page intentionally blank
x
10th Percentile
90th Percentile
75th Percentile
25th Percentile
Non-detect
Detect
50th Percentile
MildOutlier*
ExtremeOutlier†
page intentionally blank
x
10th Percentile
90th Percentile
75th Percentile
25th Percentile
Non-detect
Detect
50th Percentile
MildOutlier*
ExtremeOutlier†
1978
1980
1982
1984
1986
1988
1990
1992
1994
1996
1998
2000
2002
2004
2006
2008
2010
2012
2014
2016
2018
2020
0
2
4
6
8
10
12
14
16
18
20
1978
1980
1982
1984
1986
1988
1990
1992
1994
1996
1998
2000
2002
2004
2006
2008
2010
2012
2014
2016
2018
2020
0
1000
2000
3000
4000
5000
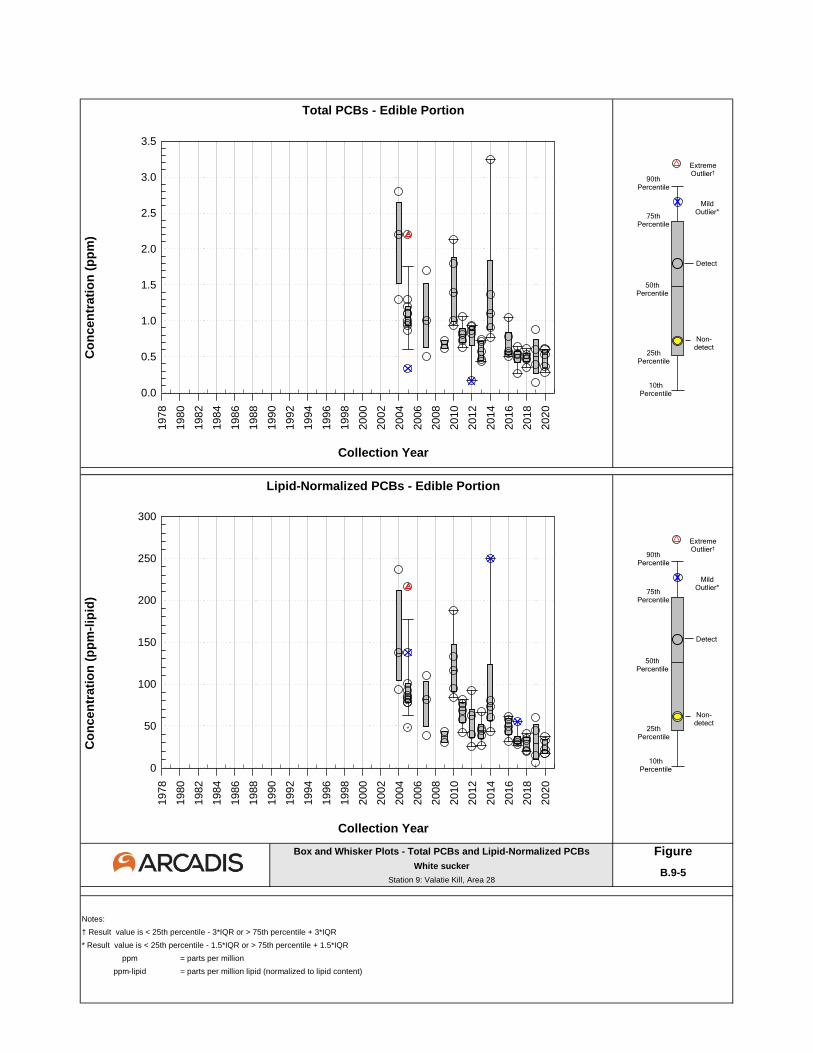
Box and Whisker Plots - Total PCBs and Lipid-Normalized PCBs FigureWhite sucker
Station 9: Valatie Kill, Area 28
Notes:
† Result value is < 25th percentile - 3*IQR or > 75th percentile + 3*IQR
* Result value is < 25th percentile - 1.5*IQR or > 75th percentile + 1.5*IQR
ppm = parts per million
ppm-lipid = parts per million lipid (normalized to lipid content)
B.9-5
Total PCBs - Edible Portion
Co
ncen
trati
on
(p
pm
)
Collection Year
Lipid-Normalized PCBs - Edible Portion
Co
ncen
trati
on
(p
pm
-lip
id)
Collection Year
page intentionally blank
x
10th Percentile
90th Percentile
75th Percentile
25th Percentile
Non-detect
Detect
50th Percentile
MildOutlier*
ExtremeOutlier†
page intentionally blank
x
10th Percentile
90th Percentile
75th Percentile
25th Percentile
Non-detect
Detect
50th Percentile
MildOutlier*
ExtremeOutlier†
1978
1980
1982
1984
1986
1988
1990
1992
1994
1996
1998
2000
2002
2004
2006
2008
2010
2012
2014
2016
2018
2020
0.0
0.5
1.0
1.5
2.0
2.5
3.0
3.5
1978
1980
1982
1984
1986
1988
1990
1992
1994
1996
1998
2000
2002
2004
2006
2008
2010
2012
2014
2016
2018
2020
0
50
100
150
200
250
300

STATION 10
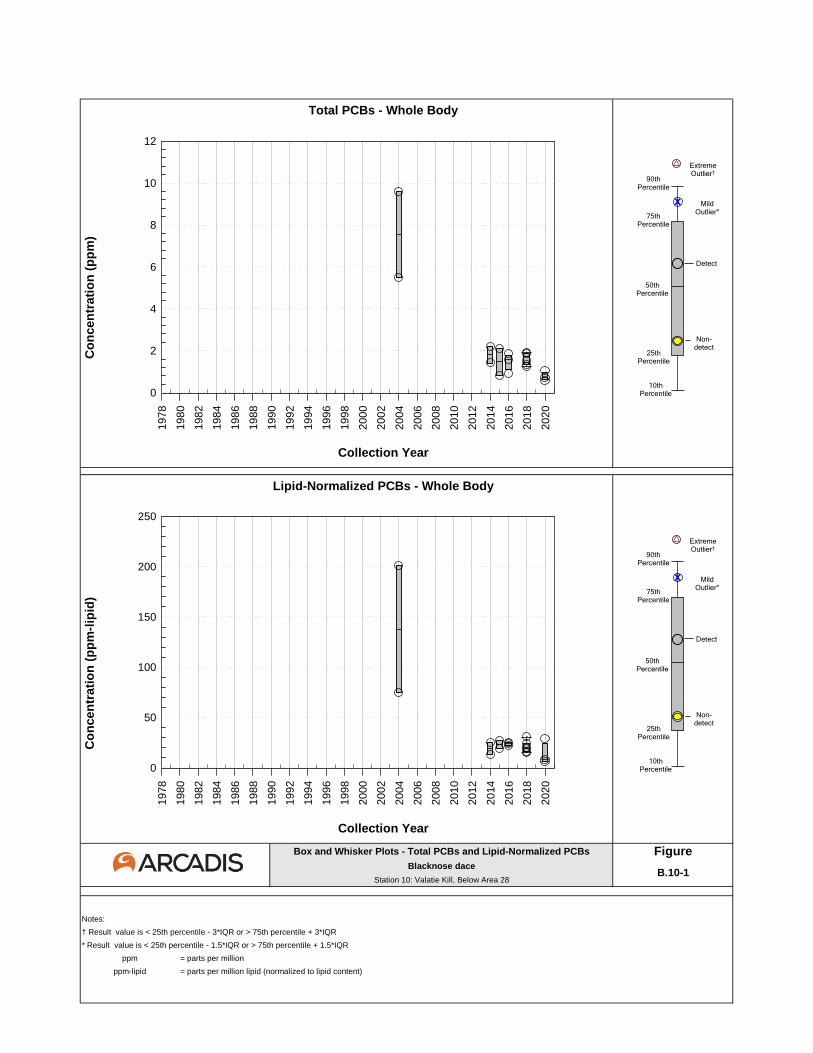
Box and Whisker Plots - Total PCBs and Lipid-Normalized PCBs FigureBlacknose dace
Station 10: Valatie Kill, Below Area 28
Notes:
† Result value is < 25th percentile - 3*IQR or > 75th percentile + 3*IQR
* Result value is < 25th percentile - 1.5*IQR or > 75th percentile + 1.5*IQR
ppm = parts per million
ppm-lipid = parts per million lipid (normalized to lipid content)
B.10-1
Total PCBs - Whole Body
Co
ncen
trati
on
(p
pm
)
Collection Year
Lipid-Normalized PCBs - Whole Body
Co
ncen
trati
on
(p
pm
-lip
id)
Collection Year
page intentionally blank
x
10th Percentile
90th Percentile
75th Percentile
25th Percentile
Non-detect
Detect
50th Percentile
MildOutlier*
ExtremeOutlier†
page intentionally blank
x
10th Percentile
90th Percentile
75th Percentile
25th Percentile
Non-detect
Detect
50th Percentile
MildOutlier*
ExtremeOutlier†
1978
1980
1982
1984
1986
1988
1990
1992
1994
1996
1998
2000
2002
2004
2006
2008
2010
2012
2014
2016
2018
2020
0
2
4
6
8
10
12
1978
1980
1982
1984
1986
1988
1990
1992
1994
1996
1998
2000
2002
2004
2006
2008
2010
2012
2014
2016
2018
2020
0
50
100
150
200
250
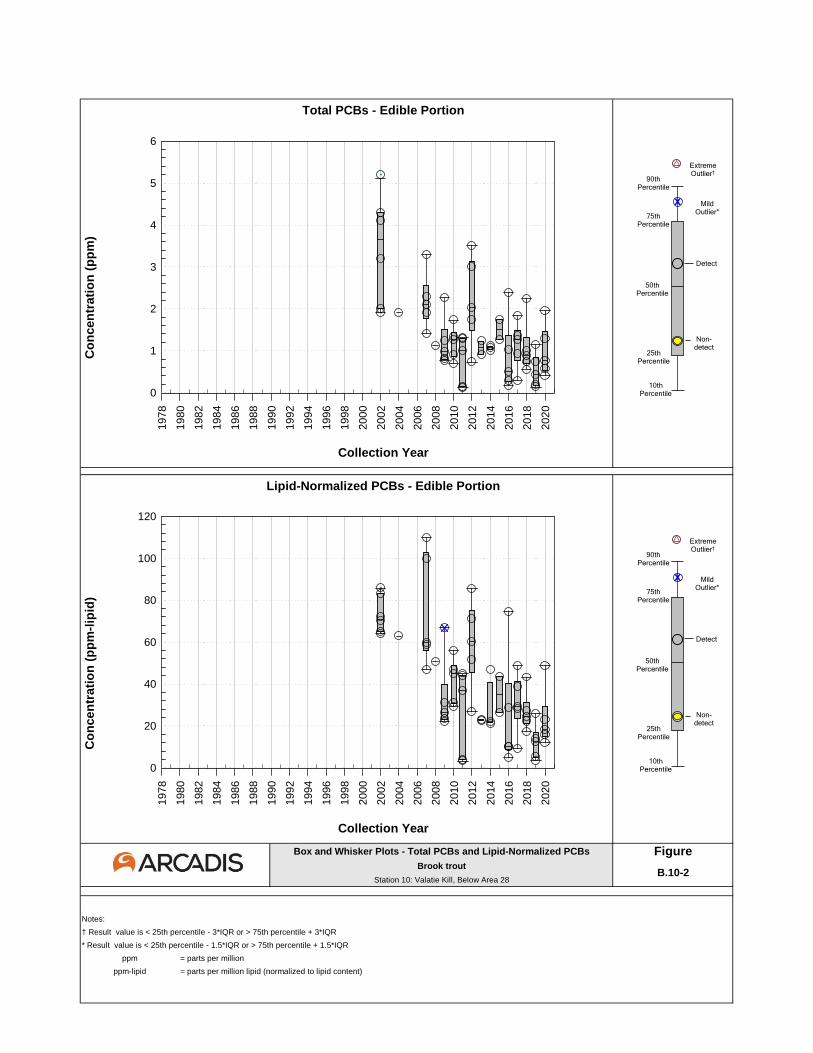
Box and Whisker Plots - Total PCBs and Lipid-Normalized PCBs FigureBrook trout
Station 10: Valatie Kill, Below Area 28
Notes:
† Result value is < 25th percentile - 3*IQR or > 75th percentile + 3*IQR
* Result value is < 25th percentile - 1.5*IQR or > 75th percentile + 1.5*IQR
ppm = parts per million
ppm-lipid = parts per million lipid (normalized to lipid content)
B.10-2
Total PCBs - Edible Portion
Co
ncen
trati
on
(p
pm
)
Collection Year
Lipid-Normalized PCBs - Edible Portion
Co
ncen
trati
on
(p
pm
-lip
id)
Collection Year
page intentionally blank
x
10th Percentile
90th Percentile
75th Percentile
25th Percentile
Non-detect
Detect
50th Percentile
MildOutlier*
ExtremeOutlier†
page intentionally blank
x
10th Percentile
90th Percentile
75th Percentile
25th Percentile
Non-detect
Detect
50th Percentile
MildOutlier*
ExtremeOutlier†
1978
1980
1982
1984
1986
1988
1990
1992
1994
1996
1998
2000
2002
2004
2006
2008
2010
2012
2014
2016
2018
2020
0
1
2
3
4
5
6
1978
1980
1982
1984
1986
1988
1990
1992
1994
1996
1998
2000
2002
2004
2006
2008
2010
2012
2014
2016
2018
2020
0
20
40
60
80
100
120
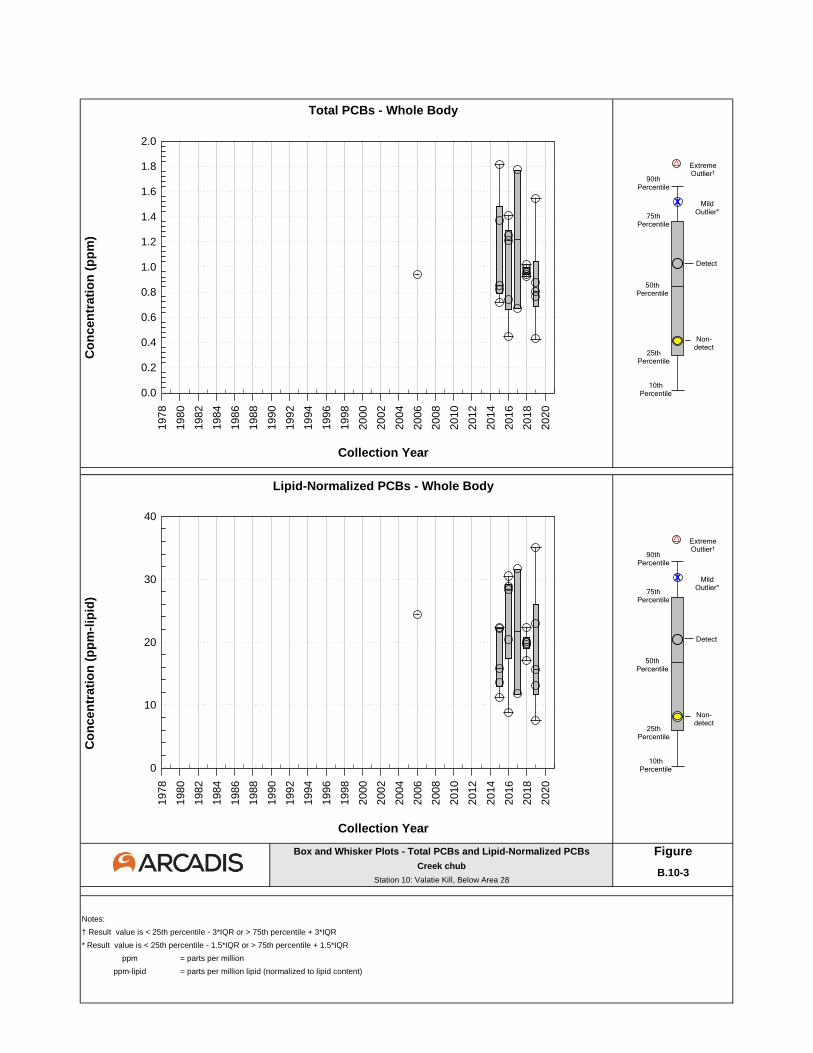
Box and Whisker Plots - Total PCBs and Lipid-Normalized PCBs FigureCreek chub
Station 10: Valatie Kill, Below Area 28
Notes:
† Result value is < 25th percentile - 3*IQR or > 75th percentile + 3*IQR
* Result value is < 25th percentile - 1.5*IQR or > 75th percentile + 1.5*IQR
ppm = parts per million
ppm-lipid = parts per million lipid (normalized to lipid content)
B.10-3
Total PCBs - Whole Body
Co
ncen
trati
on
(p
pm
)
Collection Year
Lipid-Normalized PCBs - Whole Body
Co
ncen
trati
on
(p
pm
-lip
id)
Collection Year
page intentionally blank
x
10th Percentile
90th Percentile
75th Percentile
25th Percentile
Non-detect
Detect
50th Percentile
MildOutlier*
ExtremeOutlier†
page intentionally blank
x
10th Percentile
90th Percentile
75th Percentile
25th Percentile
Non-detect
Detect
50th Percentile
MildOutlier*
ExtremeOutlier†
1978
1980
1982
1984
1986
1988
1990
1992
1994
1996
1998
2000
2002
2004
2006
2008
2010
2012
2014
2016
2018
2020
0.0
0.2
0.4
0.6
0.8
1.0
1.2
1.4
1.6
1.8
2.0
1978
1980
1982
1984
1986
1988
1990
1992
1994
1996
1998
2000
2002
2004
2006
2008
2010
2012
2014
2016
2018
2020
0
10
20
30
40
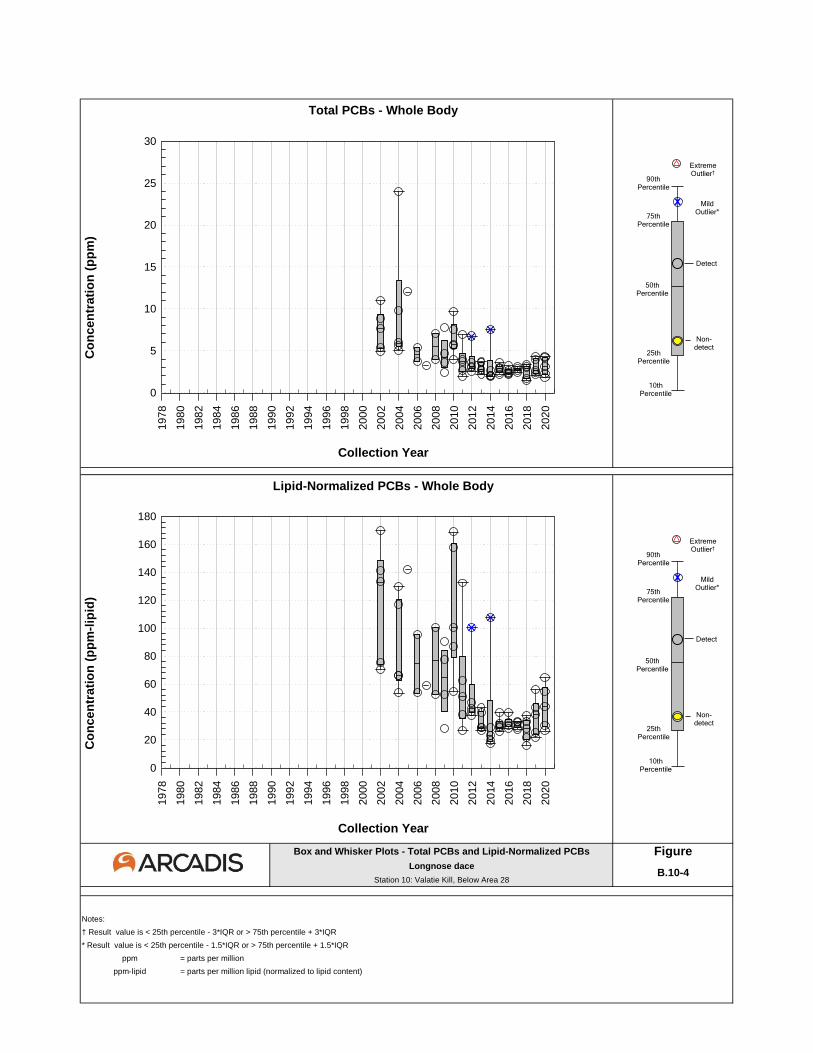
Box and Whisker Plots - Total PCBs and Lipid-Normalized PCBs FigureLongnose dace
Station 10: Valatie Kill, Below Area 28
Notes:
† Result value is < 25th percentile - 3*IQR or > 75th percentile + 3*IQR
* Result value is < 25th percentile - 1.5*IQR or > 75th percentile + 1.5*IQR
ppm = parts per million
ppm-lipid = parts per million lipid (normalized to lipid content)
B.10-4
Total PCBs - Whole Body
Co
ncen
trati
on
(p
pm
)
Collection Year
Lipid-Normalized PCBs - Whole Body
Co
ncen
trati
on
(p
pm
-lip
id)
Collection Year
page intentionally blank
x
10th Percentile
90th Percentile
75th Percentile
25th Percentile
Non-detect
Detect
50th Percentile
MildOutlier*
ExtremeOutlier†
page intentionally blank
x
10th Percentile
90th Percentile
75th Percentile
25th Percentile
Non-detect
Detect
50th Percentile
MildOutlier*
ExtremeOutlier†
1978
1980
1982
1984
1986
1988
1990
1992
1994
1996
1998
2000
2002
2004
2006
2008
2010
2012
2014
2016
2018
2020
0
5
10
15
20
25
30
1978
1980
1982
1984
1986
1988
1990
1992
1994
1996
1998
2000
2002
2004
2006
2008
2010
2012
2014
2016
2018
2020
0
20
40
60
80
100
120
140
160
180
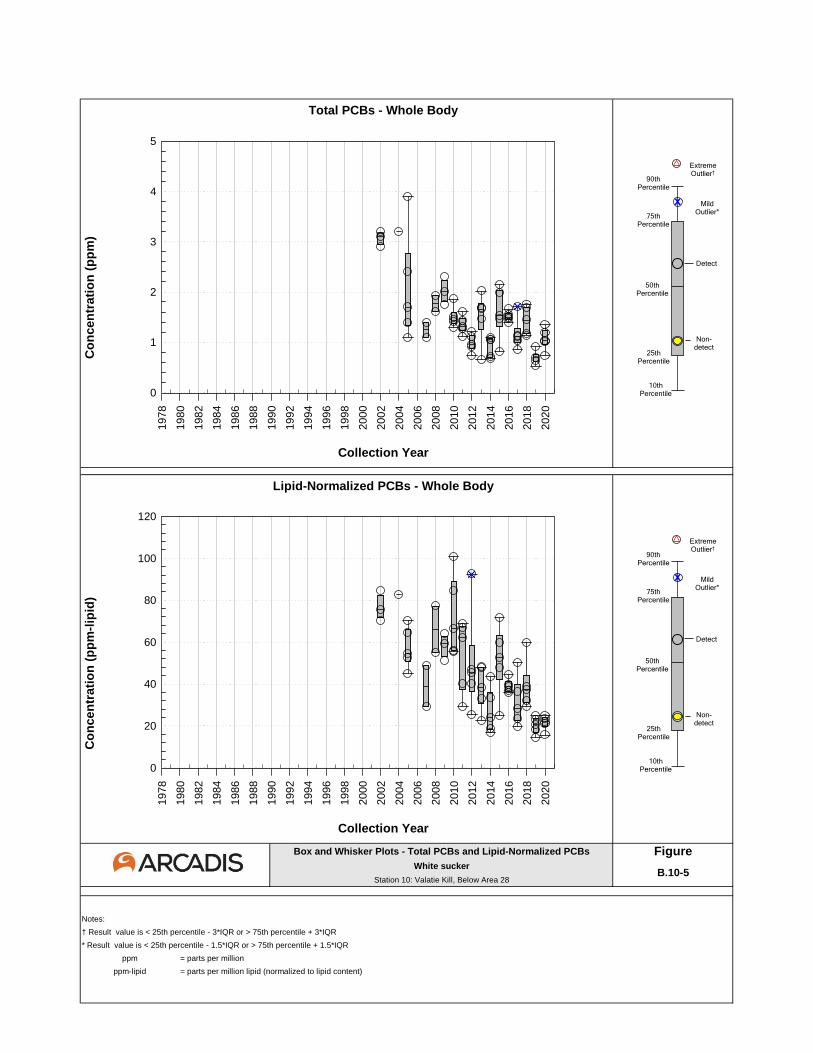
Box and Whisker Plots - Total PCBs and Lipid-Normalized PCBs FigureWhite sucker
Station 10: Valatie Kill, Below Area 28
Notes:
† Result value is < 25th percentile - 3*IQR or > 75th percentile + 3*IQR
* Result value is < 25th percentile - 1.5*IQR or > 75th percentile + 1.5*IQR
ppm = parts per million
ppm-lipid = parts per million lipid (normalized to lipid content)
B.10-5
Total PCBs - Whole Body
Co
ncen
trati
on
(p
pm
)
Collection Year
Lipid-Normalized PCBs - Whole Body
Co
ncen
trati
on
(p
pm
-lip
id)
Collection Year
page intentionally blank
x
10th Percentile
90th Percentile
75th Percentile
25th Percentile
Non-detect
Detect
50th Percentile
MildOutlier*
ExtremeOutlier†
page intentionally blank
x
10th Percentile
90th Percentile
75th Percentile
25th Percentile
Non-detect
Detect
50th Percentile
MildOutlier*
ExtremeOutlier†
1978
1980
1982
1984
1986
1988
1990
1992
1994
1996
1998
2000
2002
2004
2006
2008
2010
2012
2014
2016
2018
2020
0
1
2
3
4
5
1978
1980
1982
1984
1986
1988
1990
1992
1994
1996
1998
2000
2002
2004
2006
2008
2010
2012
2014
2016
2018
2020
0
20
40
60
80
100
120
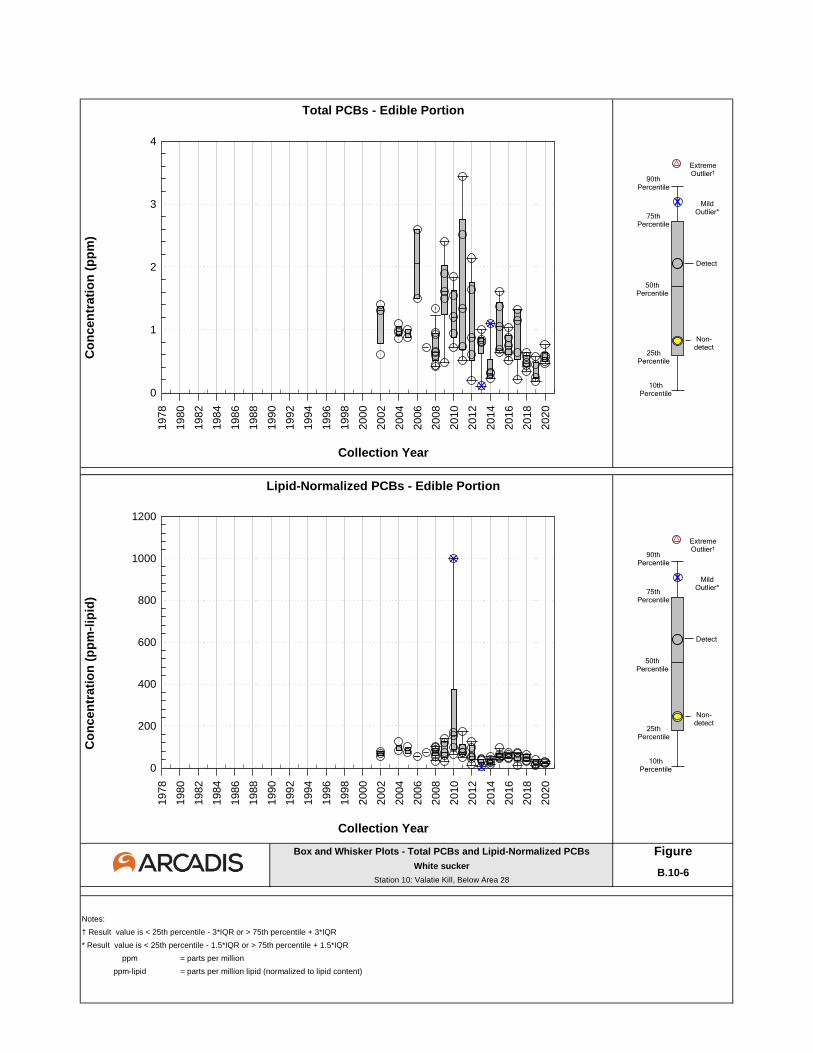
Box and Whisker Plots - Total PCBs and Lipid-Normalized PCBs FigureWhite sucker
Station 10: Valatie Kill, Below Area 28
Notes:
† Result value is < 25th percentile - 3*IQR or > 75th percentile + 3*IQR
* Result value is < 25th percentile - 1.5*IQR or > 75th percentile + 1.5*IQR
ppm = parts per million
ppm-lipid = parts per million lipid (normalized to lipid content)
B.10-6
Total PCBs - Edible Portion
Co
ncen
trati
on
(p
pm
)
Collection Year
Lipid-Normalized PCBs - Edible Portion
Co
ncen
trati
on
(p
pm
-lip
id)
Collection Year
page intentionally blank
x
10th Percentile
90th Percentile
75th Percentile
25th Percentile
Non-detect
Detect
50th Percentile
MildOutlier*
ExtremeOutlier†
page intentionally blank
x
10th Percentile
90th Percentile
75th Percentile
25th Percentile
Non-detect
Detect
50th Percentile
MildOutlier*
ExtremeOutlier†
1978
1980
1982
1984
1986
1988
1990
1992
1994
1996
1998
2000
2002
2004
2006
2008
2010
2012
2014
2016
2018
2020
0
1
2
3
4
1978
1980
1982
1984
1986
1988
1990
1992
1994
1996
1998
2000
2002
2004
2006
2008
2010
2012
2014
2016
2018
2020
0
200
400
600
800
1000
1200

STATION 11
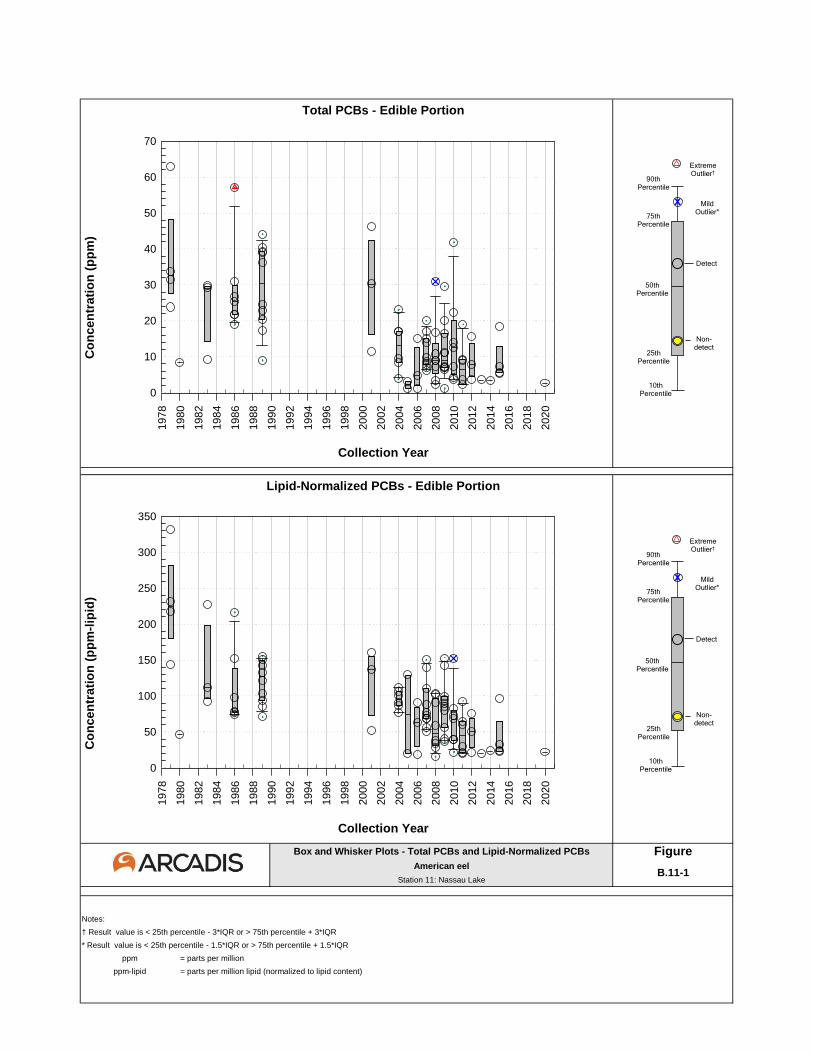
Box and Whisker Plots - Total PCBs and Lipid-Normalized PCBs FigureAmerican eel
Station 11: Nassau Lake
Notes:
† Result value is < 25th percentile - 3*IQR or > 75th percentile + 3*IQR
* Result value is < 25th percentile - 1.5*IQR or > 75th percentile + 1.5*IQR
ppm = parts per million
ppm-lipid = parts per million lipid (normalized to lipid content)
B.11-1
Total PCBs - Edible Portion
Co
ncen
trati
on
(p
pm
)
Collection Year
Lipid-Normalized PCBs - Edible Portion
Co
ncen
trati
on
(p
pm
-lip
id)
Collection Year
page intentionally blank
x
10th Percentile
90th Percentile
75th Percentile
25th Percentile
Non-detect
Detect
50th Percentile
MildOutlier*
ExtremeOutlier†
page intentionally blank
x
10th Percentile
90th Percentile
75th Percentile
25th Percentile
Non-detect
Detect
50th Percentile
MildOutlier*
ExtremeOutlier†
1978
1980
1982
1984
1986
1988
1990
1992
1994
1996
1998
2000
2002
2004
2006
2008
2010
2012
2014
2016
2018
2020
0
10
20
30
40
50
60
70
1978
1980
1982
1984
1986
1988
1990
1992
1994
1996
1998
2000
2002
2004
2006
2008
2010
2012
2014
2016
2018
2020
0
50
100
150
200
250
300
350
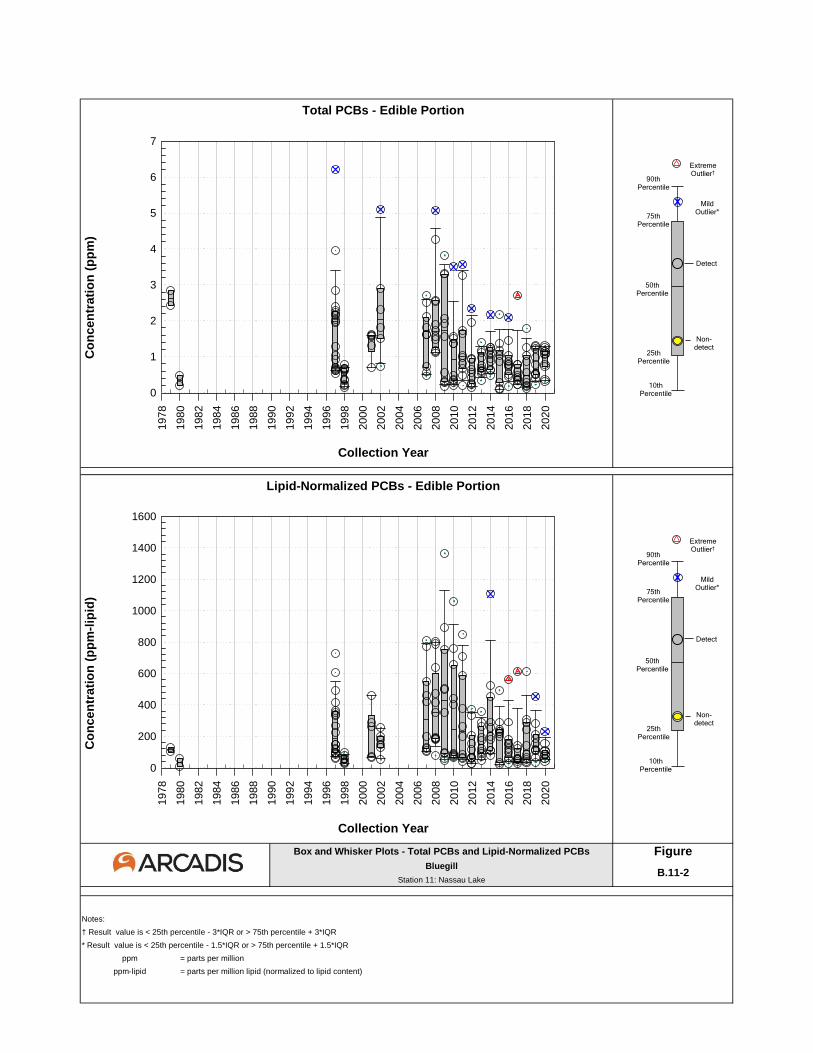
Box and Whisker Plots - Total PCBs and Lipid-Normalized PCBs FigureBluegill
Station 11: Nassau Lake
Notes:
† Result value is < 25th percentile - 3*IQR or > 75th percentile + 3*IQR
* Result value is < 25th percentile - 1.5*IQR or > 75th percentile + 1.5*IQR
ppm = parts per million
ppm-lipid = parts per million lipid (normalized to lipid content)
B.11-2
Total PCBs - Edible Portion
Co
ncen
trati
on
(p
pm
)
Collection Year
Lipid-Normalized PCBs - Edible Portion
Co
ncen
trati
on
(p
pm
-lip
id)
Collection Year
page intentionally blank
x
10th Percentile
90th Percentile
75th Percentile
25th Percentile
Non-detect
Detect
50th Percentile
MildOutlier*
ExtremeOutlier†
page intentionally blank
x
10th Percentile
90th Percentile
75th Percentile
25th Percentile
Non-detect
Detect
50th Percentile
MildOutlier*
ExtremeOutlier†
1978
1980
1982
1984
1986
1988
1990
1992
1994
1996
1998
2000
2002
2004
2006
2008
2010
2012
2014
2016
2018
2020
0
1
2
3
4
5
6
7
1978
1980
1982
1984
1986
1988
1990
1992
1994
1996
1998
2000
2002
2004
2006
2008
2010
2012
2014
2016
2018
2020
0
200
400
600
800
1000
1200
1400
1600
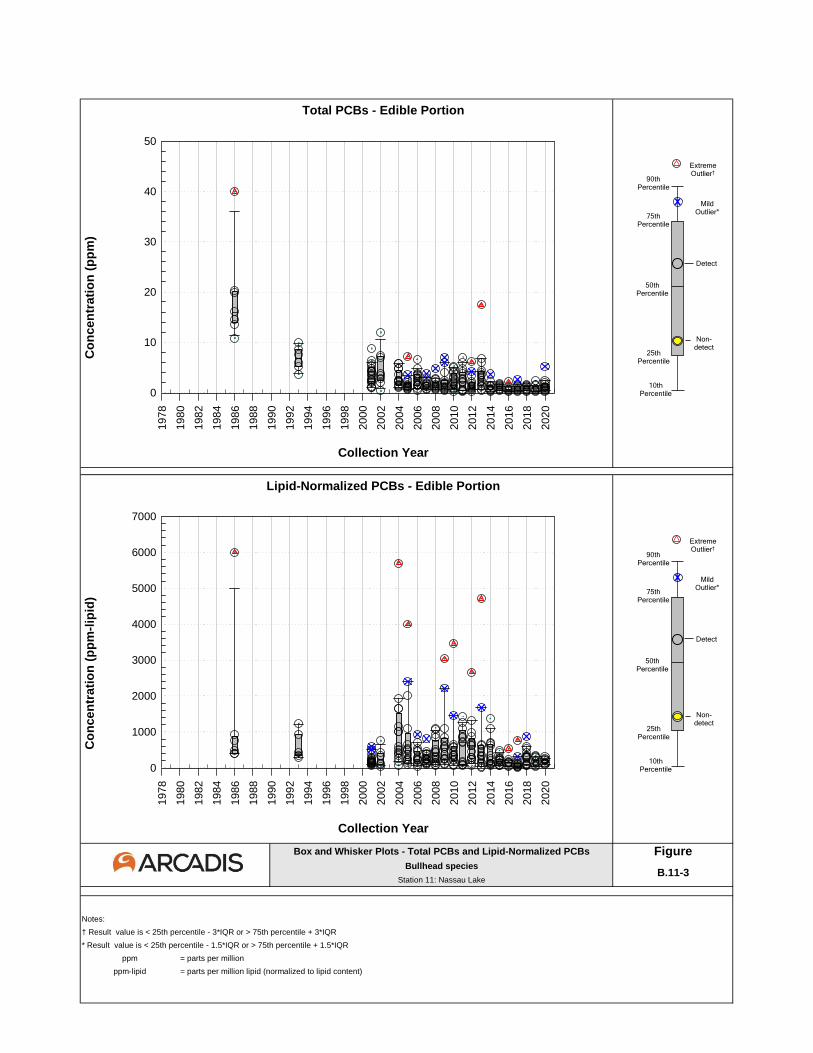
Box and Whisker Plots - Total PCBs and Lipid-Normalized PCBs FigureBullhead species
Station 11: Nassau Lake
Notes:
† Result value is < 25th percentile - 3*IQR or > 75th percentile + 3*IQR
* Result value is < 25th percentile - 1.5*IQR or > 75th percentile + 1.5*IQR
ppm = parts per million
ppm-lipid = parts per million lipid (normalized to lipid content)
B.11-3
Total PCBs - Edible Portion
Co
ncen
trati
on
(p
pm
)
Collection Year
Lipid-Normalized PCBs - Edible Portion
Co
ncen
trati
on
(p
pm
-lip
id)
Collection Year
page intentionally blank
x
10th Percentile
90th Percentile
75th Percentile
25th Percentile
Non-detect
Detect
50th Percentile
MildOutlier*
ExtremeOutlier†
page intentionally blank
x
10th Percentile
90th Percentile
75th Percentile
25th Percentile
Non-detect
Detect
50th Percentile
MildOutlier*
ExtremeOutlier†
1978
1980
1982
1984
1986
1988
1990
1992
1994
1996
1998
2000
2002
2004
2006
2008
2010
2012
2014
2016
2018
2020
0
10
20
30
40
50
1978
1980
1982
1984
1986
1988
1990
1992
1994
1996
1998
2000
2002
2004
2006
2008
2010
2012
2014
2016
2018
2020
0
1000
2000
3000
4000
5000
6000
7000
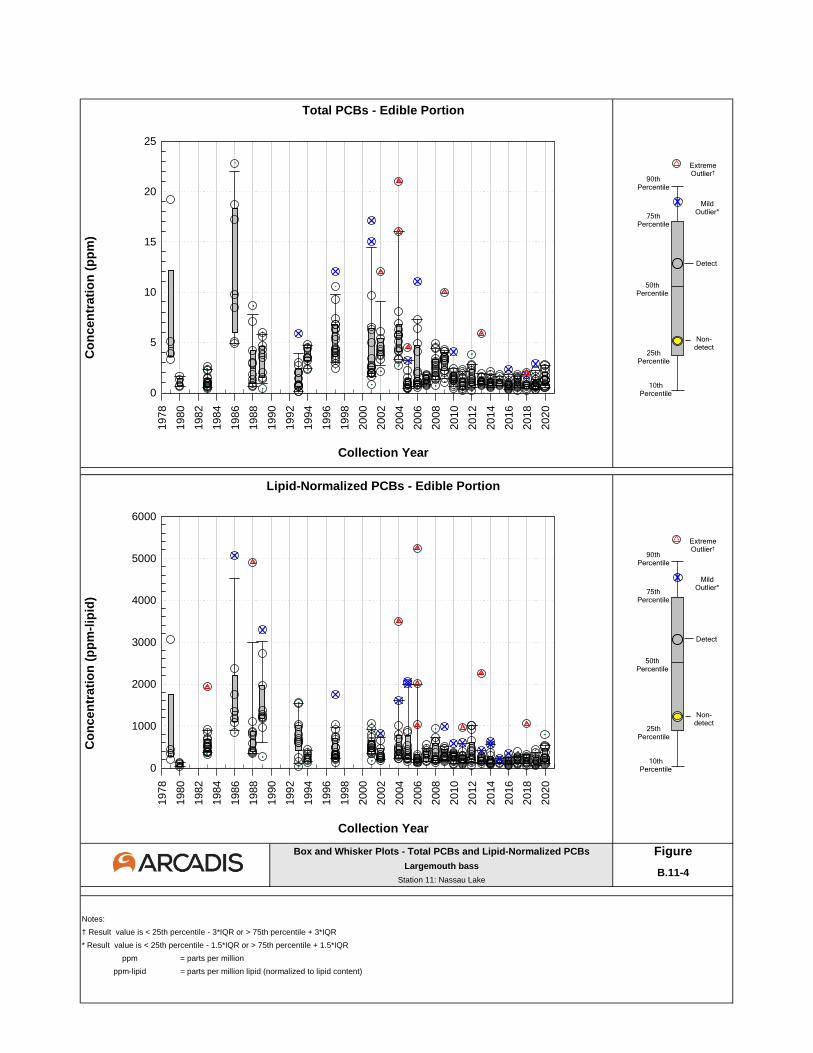
Box and Whisker Plots - Total PCBs and Lipid-Normalized PCBs FigureLargemouth bass
Station 11: Nassau Lake
Notes:
† Result value is < 25th percentile - 3*IQR or > 75th percentile + 3*IQR
* Result value is < 25th percentile - 1.5*IQR or > 75th percentile + 1.5*IQR
ppm = parts per million
ppm-lipid = parts per million lipid (normalized to lipid content)
B.11-4
Total PCBs - Edible Portion
Co
ncen
trati
on
(p
pm
)
Collection Year
Lipid-Normalized PCBs - Edible Portion
Co
ncen
trati
on
(p
pm
-lip
id)
Collection Year
page intentionally blank
x
10th Percentile
90th Percentile
75th Percentile
25th Percentile
Non-detect
Detect
50th Percentile
MildOutlier*
ExtremeOutlier†
page intentionally blank
x
10th Percentile
90th Percentile
75th Percentile
25th Percentile
Non-detect
Detect
50th Percentile
MildOutlier*
ExtremeOutlier†
1978
1980
1982
1984
1986
1988
1990
1992
1994
1996
1998
2000
2002
2004
2006
2008
2010
2012
2014
2016
2018
2020
0
5
10
15
20
25
1978
1980
1982
1984
1986
1988
1990
1992
1994
1996
1998
2000
2002
2004
2006
2008
2010
2012
2014
2016
2018
2020
0
1000
2000
3000
4000
5000
6000
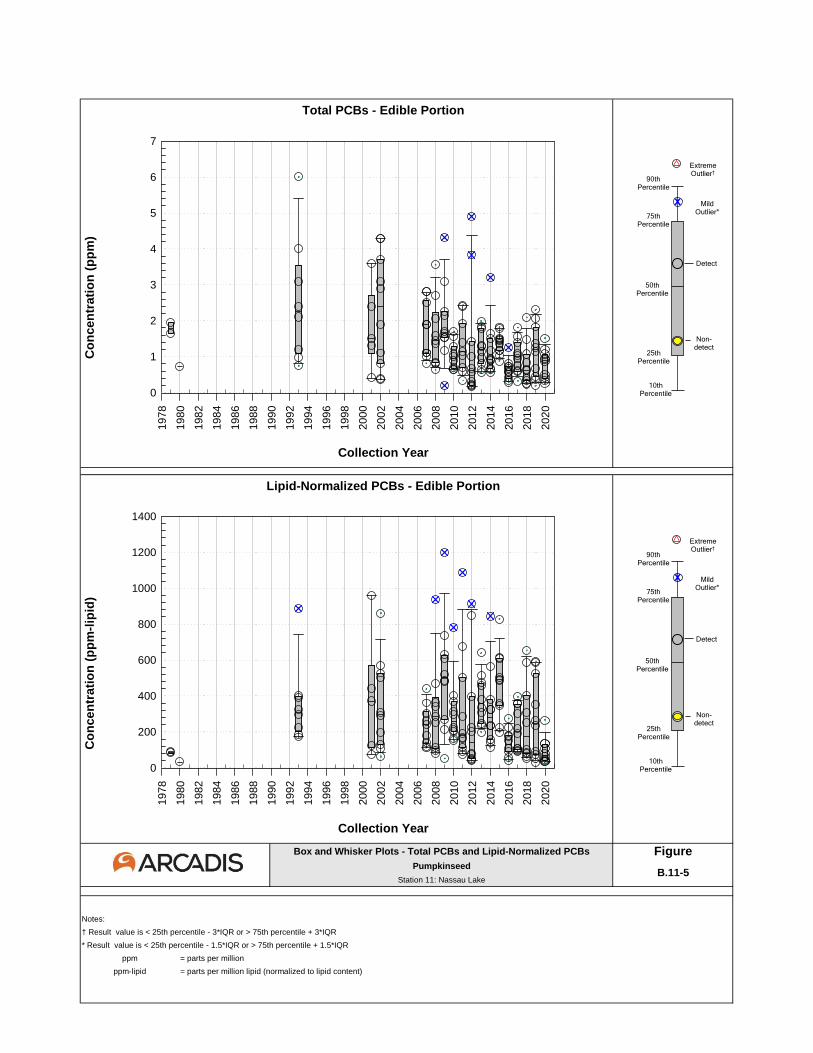
Box and Whisker Plots - Total PCBs and Lipid-Normalized PCBs FigurePumpkinseed
Station 11: Nassau Lake
Notes:
† Result value is < 25th percentile - 3*IQR or > 75th percentile + 3*IQR
* Result value is < 25th percentile - 1.5*IQR or > 75th percentile + 1.5*IQR
ppm = parts per million
ppm-lipid = parts per million lipid (normalized to lipid content)
B.11-5
Total PCBs - Edible Portion
Co
ncen
trati
on
(p
pm
)
Collection Year
Lipid-Normalized PCBs - Edible Portion
Co
ncen
trati
on
(p
pm
-lip
id)
Collection Year
page intentionally blank
x
10th Percentile
90th Percentile
75th Percentile
25th Percentile
Non-detect
Detect
50th Percentile
MildOutlier*
ExtremeOutlier†
page intentionally blank
x
10th Percentile
90th Percentile
75th Percentile
25th Percentile
Non-detect
Detect
50th Percentile
MildOutlier*
ExtremeOutlier†
1978
1980
1982
1984
1986
1988
1990
1992
1994
1996
1998
2000
2002
2004
2006
2008
2010
2012
2014
2016
2018
2020
0
1
2
3
4
5
6
7
1978
1980
1982
1984
1986
1988
1990
1992
1994
1996
1998
2000
2002
2004
2006
2008
2010
2012
2014
2016
2018
2020
0
200
400
600
800
1000
1200
1400
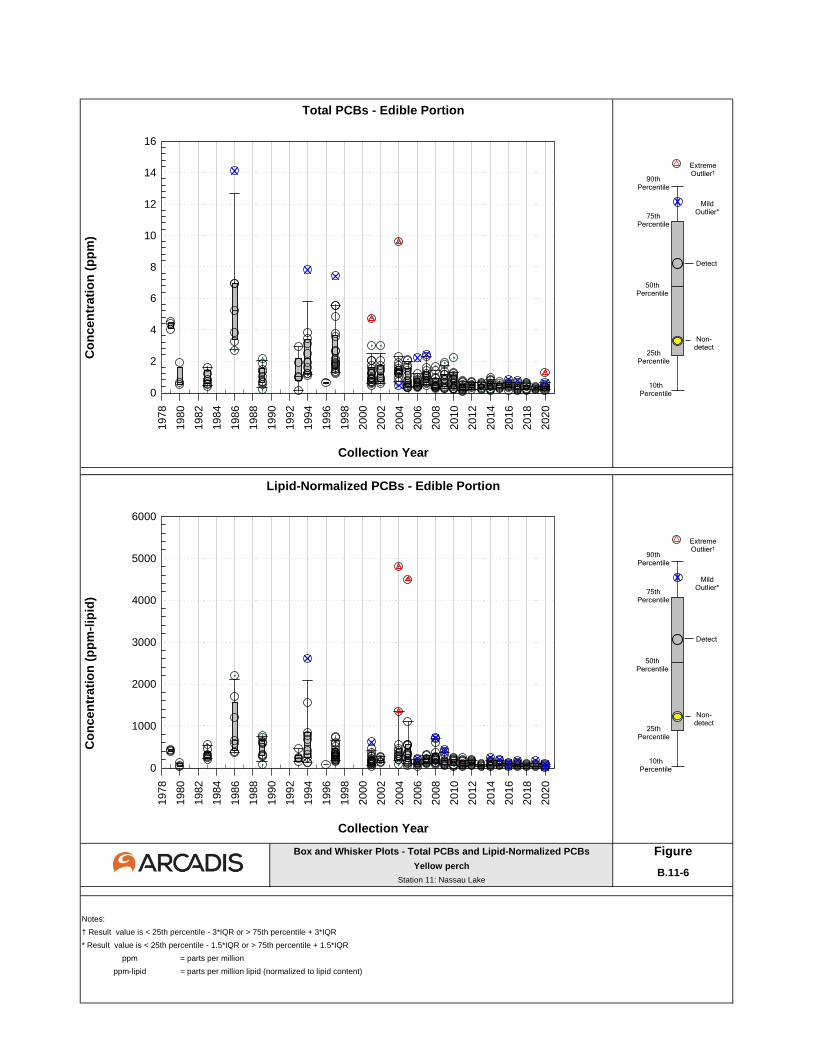
Box and Whisker Plots - Total PCBs and Lipid-Normalized PCBs FigureYellow perch
Station 11: Nassau Lake
Notes:
† Result value is < 25th percentile - 3*IQR or > 75th percentile + 3*IQR
* Result value is < 25th percentile - 1.5*IQR or > 75th percentile + 1.5*IQR
ppm = parts per million
ppm-lipid = parts per million lipid (normalized to lipid content)
B.11-6
Total PCBs - Edible Portion
Co
ncen
trati
on
(p
pm
)
Collection Year
Lipid-Normalized PCBs - Edible Portion
Co
ncen
trati
on
(p
pm
-lip
id)
Collection Year
page intentionally blank
x
10th Percentile
90th Percentile
75th Percentile
25th Percentile
Non-detect
Detect
50th Percentile
MildOutlier*
ExtremeOutlier†
page intentionally blank
x
10th Percentile
90th Percentile
75th Percentile
25th Percentile
Non-detect
Detect
50th Percentile
MildOutlier*
ExtremeOutlier†
1978
1980
1982
1984
1986
1988
1990
1992
1994
1996
1998
2000
2002
2004
2006
2008
2010
2012
2014
2016
2018
2020
0
2
4
6
8
10
12
14
16
1978
1980
1982
1984
1986
1988
1990
1992
1994
1996
1998
2000
2002
2004
2006
2008
2010
2012
2014
2016
2018
2020
0
1000
2000
3000
4000
5000
6000

STATION 12
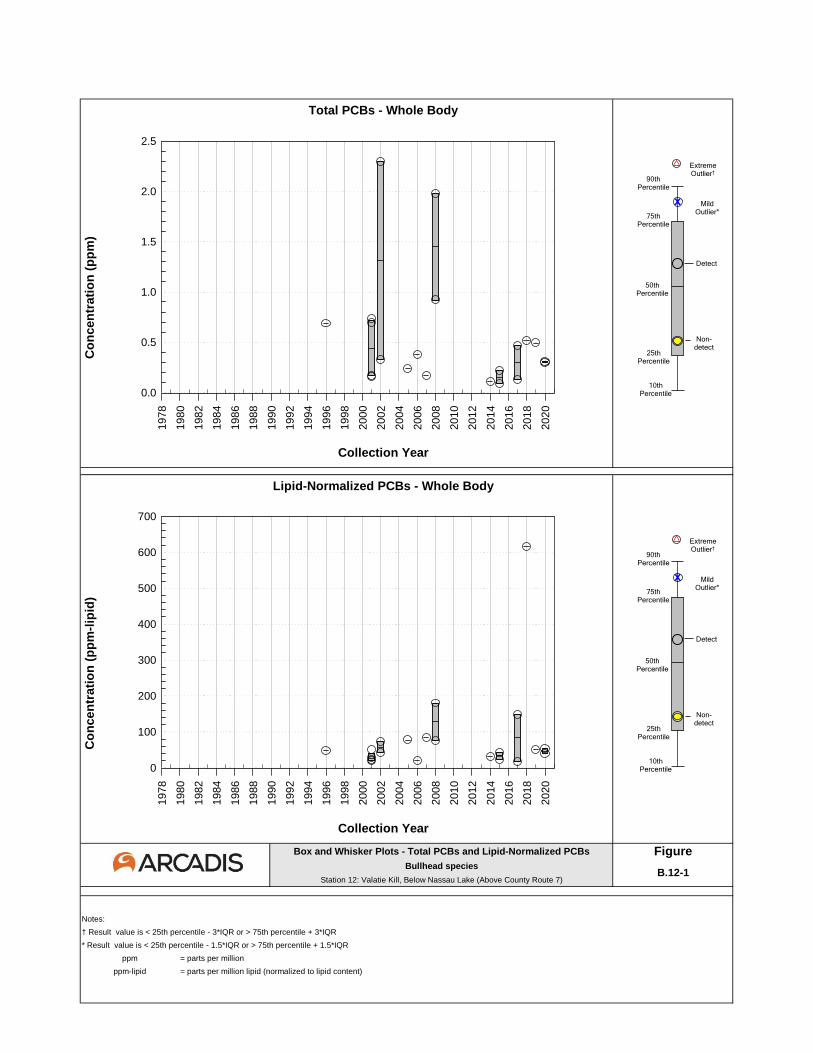
Box and Whisker Plots - Total PCBs and Lipid-Normalized PCBs FigureBullhead species
Station 12: Valatie Kill, Below Nassau Lake (Above County Route 7)
Notes:
† Result value is < 25th percentile - 3*IQR or > 75th percentile + 3*IQR
* Result value is < 25th percentile - 1.5*IQR or > 75th percentile + 1.5*IQR
ppm = parts per million
ppm-lipid = parts per million lipid (normalized to lipid content)
B.12-1
Total PCBs - Whole Body
Co
ncen
trati
on
(p
pm
)
Collection Year
Lipid-Normalized PCBs - Whole Body
Co
ncen
trati
on
(p
pm
-lip
id)
Collection Year
page intentionally blank
x
10th Percentile
90th Percentile
75th Percentile
25th Percentile
Non-detect
Detect
50th Percentile
MildOutlier*
ExtremeOutlier†
page intentionally blank
x
10th Percentile
90th Percentile
75th Percentile
25th Percentile
Non-detect
Detect
50th Percentile
MildOutlier*
ExtremeOutlier†
1978
1980
1982
1984
1986
1988
1990
1992
1994
1996
1998
2000
2002
2004
2006
2008
2010
2012
2014
2016
2018
2020
0.0
0.5
1.0
1.5
2.0
2.5
1978
1980
1982
1984
1986
1988
1990
1992
1994
1996
1998
2000
2002
2004
2006
2008
2010
2012
2014
2016
2018
2020
0
100
200
300
400
500
600
700

Box and Whisker Plots - Total PCBs and Lipid-Normalized PCBs FigureCutlips minnow
Station 12: Valatie Kill, Below Nassau Lake (Above County Route 7)
Notes:
† Result value is < 25th percentile - 3*IQR or > 75th percentile + 3*IQR
* Result value is < 25th percentile - 1.5*IQR or > 75th percentile + 1.5*IQR
ppm = parts per million
ppm-lipid = parts per million lipid (normalized to lipid content)
B.12-2
Total PCBs - Whole Body
Co
ncen
trati
on
(p
pm
)
Collection Year
Lipid-Normalized PCBs - Whole Body
Co
ncen
trati
on
(p
pm
-lip
id)
Collection Year
page intentionally blank
x
10th Percentile
90th Percentile
75th Percentile
25th Percentile
Non-detect
Detect
50th Percentile
MildOutlier*
ExtremeOutlier†
page intentionally blank
x
10th Percentile
90th Percentile
75th Percentile
25th Percentile
Non-detect
Detect
50th Percentile
MildOutlier*
ExtremeOutlier†
1978
1980
1982
1984
1986
1988
1990
1992
1994
1996
1998
2000
2002
2004
2006
2008
2010
2012
2014
2016
2018
2020
0
1
2
3
4
5
1978
1980
1982
1984
1986
1988
1990
1992
1994
1996
1998
2000
2002
2004
2006
2008
2010
2012
2014
2016
2018
2020
0
50
100
150
200
250
300
350
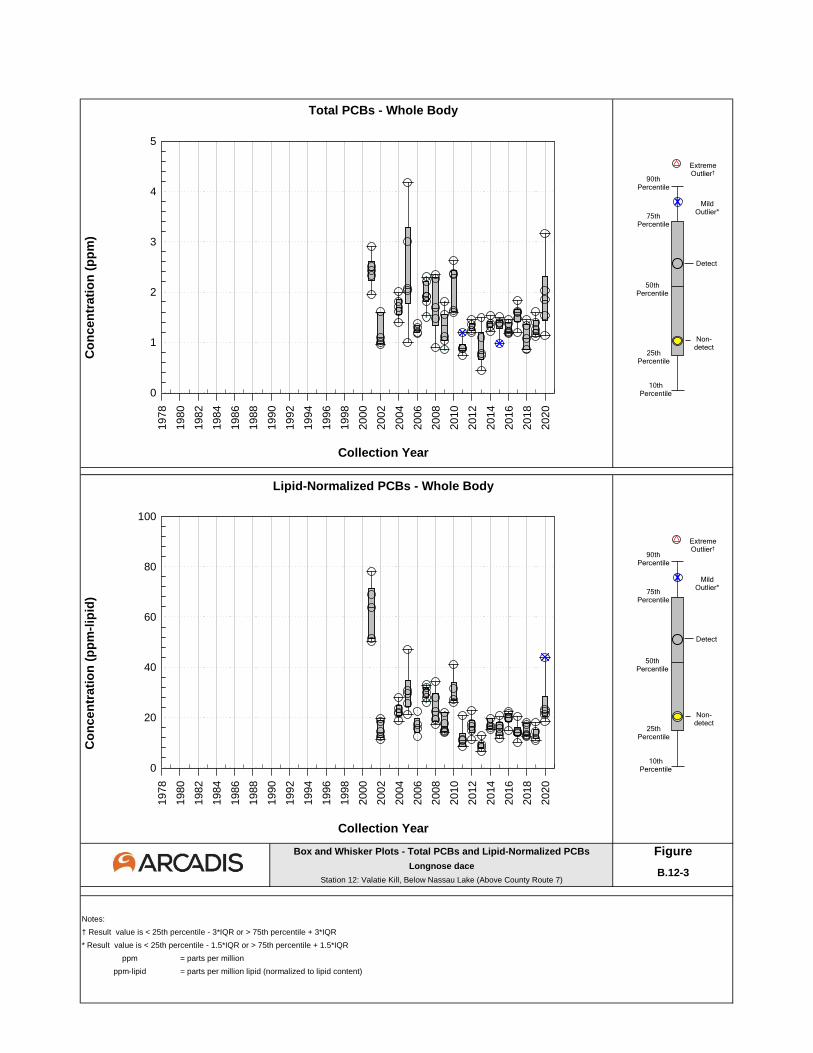
Box and Whisker Plots - Total PCBs and Lipid-Normalized PCBs FigureLongnose dace
Station 12: Valatie Kill, Below Nassau Lake (Above County Route 7)
Notes:
† Result value is < 25th percentile - 3*IQR or > 75th percentile + 3*IQR
* Result value is < 25th percentile - 1.5*IQR or > 75th percentile + 1.5*IQR
ppm = parts per million
ppm-lipid = parts per million lipid (normalized to lipid content)
B.12-3
Total PCBs - Whole Body
Co
ncen
trati
on
(p
pm
)
Collection Year
Lipid-Normalized PCBs - Whole Body
Co
ncen
trati
on
(p
pm
-lip
id)
Collection Year
page intentionally blank
x
10th Percentile
90th Percentile
75th Percentile
25th Percentile
Non-detect
Detect
50th Percentile
MildOutlier*
ExtremeOutlier†
page intentionally blank
x
10th Percentile
90th Percentile
75th Percentile
25th Percentile
Non-detect
Detect
50th Percentile
MildOutlier*
ExtremeOutlier†
1978
1980
1982
1984
1986
1988
1990
1992
1994
1996
1998
2000
2002
2004
2006
2008
2010
2012
2014
2016
2018
2020
0
1
2
3
4
5
1978
1980
1982
1984
1986
1988
1990
1992
1994
1996
1998
2000
2002
2004
2006
2008
2010
2012
2014
2016
2018
2020
0
20
40
60
80
100

Box and Whisker Plots - Total PCBs and Lipid-Normalized PCBs FigureRock bass
Station 12: Valatie Kill, Below Nassau Lake (Above County Route 7)
Notes:
† Result value is < 25th percentile - 3*IQR or > 75th percentile + 3*IQR
* Result value is < 25th percentile - 1.5*IQR or > 75th percentile + 1.5*IQR
ppm = parts per million
ppm-lipid = parts per million lipid (normalized to lipid content)
B.12-4
Total PCBs - Edible Portion
Co
ncen
trati
on
(p
pm
)
Collection Year
Lipid-Normalized PCBs - Edible Portion
Co
ncen
trati
on
(p
pm
-lip
id)
Collection Year
page intentionally blank
x
10th Percentile
90th Percentile
75th Percentile
25th Percentile
Non-detect
Detect
50th Percentile
MildOutlier*
ExtremeOutlier†
page intentionally blank
x
10th Percentile
90th Percentile
75th Percentile
25th Percentile
Non-detect
Detect
50th Percentile
MildOutlier*
ExtremeOutlier†
1978
1980
1982
1984
1986
1988
1990
1992
1994
1996
1998
2000
2002
2004
2006
2008
2010
2012
2014
2016
2018
2020
0.0
0.2
0.4
0.6
0.8
1.0
1978
1980
1982
1984
1986
1988
1990
1992
1994
1996
1998
2000
2002
2004
2006
2008
2010
2012
2014
2016
2018
2020
0
20
40
60
80
100
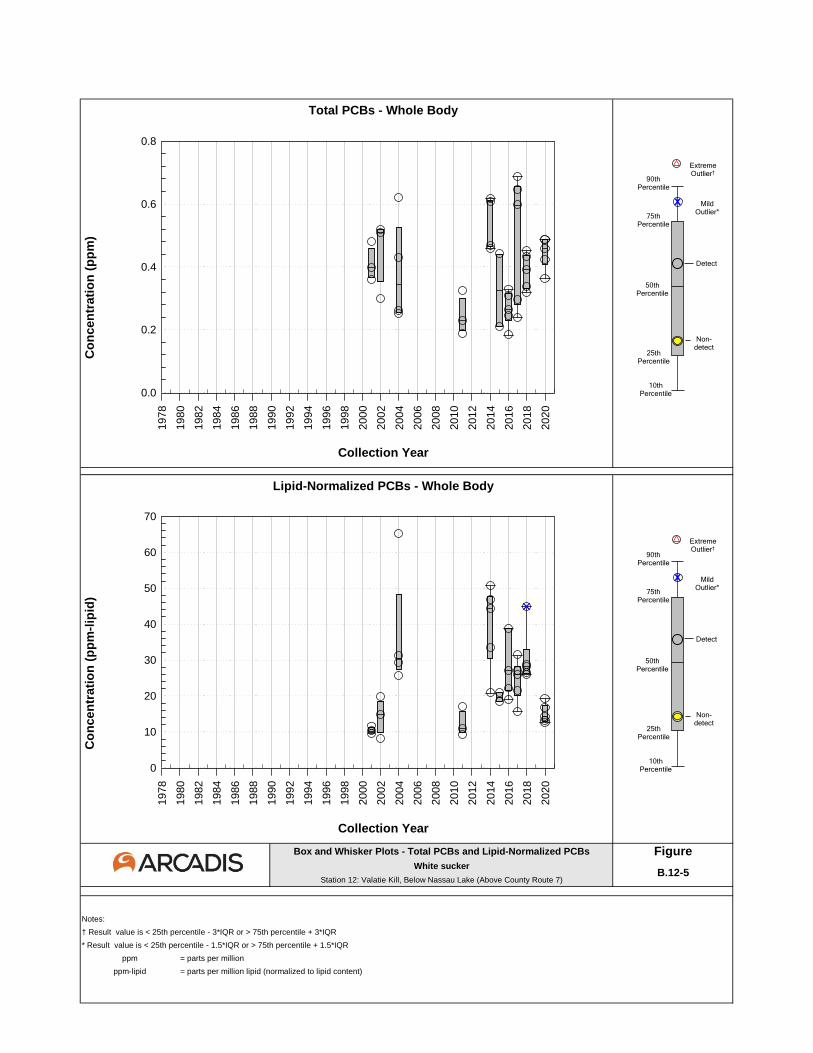
Box and Whisker Plots - Total PCBs and Lipid-Normalized PCBs FigureWhite sucker
Station 12: Valatie Kill, Below Nassau Lake (Above County Route 7)
Notes:
† Result value is < 25th percentile - 3*IQR or > 75th percentile + 3*IQR
* Result value is < 25th percentile - 1.5*IQR or > 75th percentile + 1.5*IQR
ppm = parts per million
ppm-lipid = parts per million lipid (normalized to lipid content)
B.12-5
Total PCBs - Whole Body
Co
ncen
trati
on
(p
pm
)
Collection Year
Lipid-Normalized PCBs - Whole Body
Co
ncen
trati
on
(p
pm
-lip
id)
Collection Year
page intentionally blank
x
10th Percentile
90th Percentile
75th Percentile
25th Percentile
Non-detect
Detect
50th Percentile
MildOutlier*
ExtremeOutlier†
page intentionally blank
x
10th Percentile
90th Percentile
75th Percentile
25th Percentile
Non-detect
Detect
50th Percentile
MildOutlier*
ExtremeOutlier†
1978
1980
1982
1984
1986
1988
1990
1992
1994
1996
1998
2000
2002
2004
2006
2008
2010
2012
2014
2016
2018
2020
0.0
0.2
0.4
0.6
0.8
1978
1980
1982
1984
1986
1988
1990
1992
1994
1996
1998
2000
2002
2004
2006
2008
2010
2012
2014
2016
2018
2020
0
10
20
30
40
50
60
70
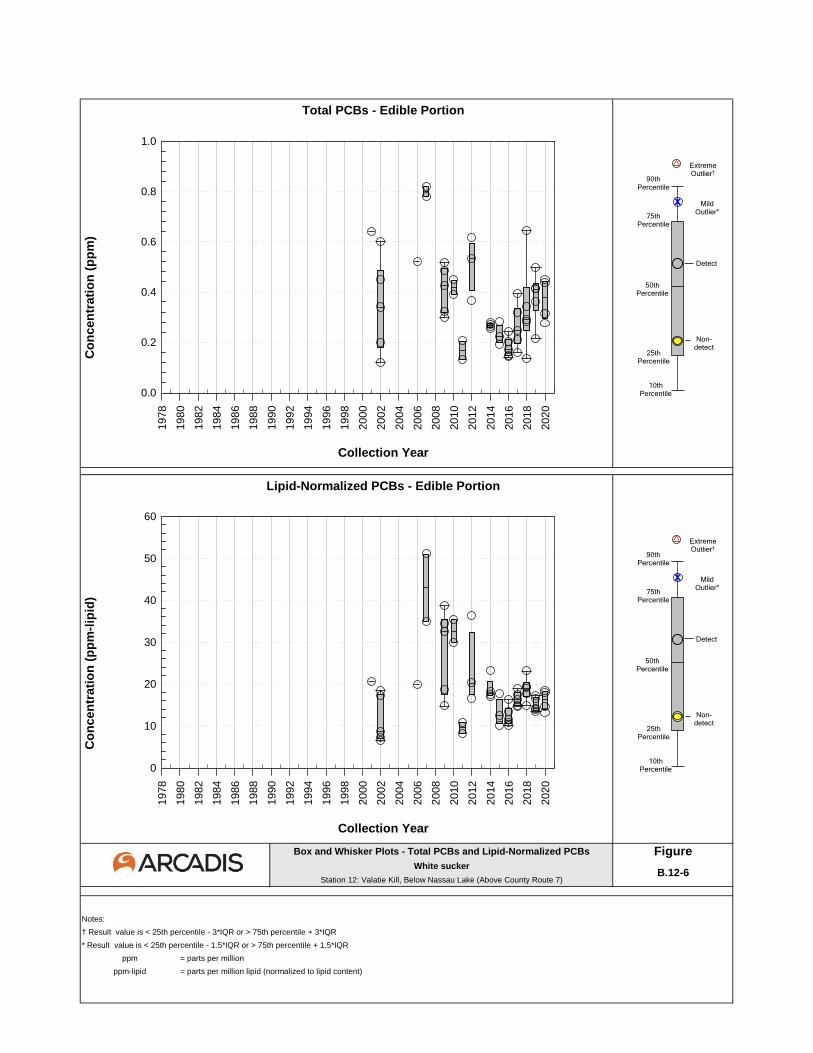
Box and Whisker Plots - Total PCBs and Lipid-Normalized PCBs FigureWhite sucker
Station 12: Valatie Kill, Below Nassau Lake (Above County Route 7)
Notes:
† Result value is < 25th percentile - 3*IQR or > 75th percentile + 3*IQR
* Result value is < 25th percentile - 1.5*IQR or > 75th percentile + 1.5*IQR
ppm = parts per million
ppm-lipid = parts per million lipid (normalized to lipid content)
B.12-6
Total PCBs - Edible Portion
Co
ncen
trati
on
(p
pm
)
Collection Year
Lipid-Normalized PCBs - Edible Portion
Co
ncen
trati
on
(p
pm
-lip
id)
Collection Year
page intentionally blank
x
10th Percentile
90th Percentile
75th Percentile
25th Percentile
Non-detect
Detect
50th Percentile
MildOutlier*
ExtremeOutlier†
page intentionally blank
x
10th Percentile
90th Percentile
75th Percentile
25th Percentile
Non-detect
Detect
50th Percentile
MildOutlier*
ExtremeOutlier†
1978
1980
1982
1984
1986
1988
1990
1992
1994
1996
1998
2000
2002
2004
2006
2008
2010
2012
2014
2016
2018
2020
0.0
0.2
0.4
0.6
0.8
1.0
1978
1980
1982
1984
1986
1988
1990
1992
1994
1996
1998
2000
2002
2004
2006
2008
2010
2012
2014
2016
2018
2020
0
10
20
30
40
50
60

APPENDIX C
Field Notes and Chains of Custody
APPENDIX D Laboratory Analytical Data Reports


![Biological Monitoring two.ppt [Read-Only]](https://img.pdfslide.us/doc/110x75/61bd3e8561276e740b10cf81/biological-monitoring-twoppt-read-only.jpg)


