Embed Size (px)
Citation preview

2020 Annual Report to Shareholders

2020 Annual Report


UNITED STATESSECURITIES AND EXCHANGE COMMISSION
Washington, D.C. 20549
FORM 10-K
Í ANNUAL REPORT PURSUANT TO SECTION 13 OR 15(d) OF THE SECURITIES EXCHANGE ACT OF 1934FOR THE FISCAL YEAR ENDED May 31, 2020
‘ TRANSITION REPORT PURSUANT TO SECTION 13 OR 15(d) OF THE SECURITIES EXCHANGE ACT OF1934 FOR THE TRANSITION PERIOD FROM TO
Commission file number: 001-01185
GENERAL MILLS, INC.(Exact name of registrant as specified in its charter)
Delaware 41-0274440(State or other jurisdiction of (I.R.S. Employerincorporation or organization) Identification No.)
Number One General Mills BoulevardMinneapolis, Minnesota 55426
(Address of principal executive offices) (Zip Code)
(763) 764-7600(Registrant’s telephone number, including area code)
Securities registered pursuant to Section 12(b) of the Act:
Title of each class Trading Symbol(s)Name of each exchange
on which registered
Common Stock, $.10 par value GIS New York Stock Exchange2.100% Notes due 2020 GIS20 New York Stock Exchange1.000% Notes due 2023 GIS23A New York Stock Exchange0.450% Notes due 2026 GIS26 New York Stock Exchange1.500% Notes due 2027 GIS27 New York Stock Exchange
Securities registered pursuant to Section 12(g) of the Act: None
Indicate by check mark if the registrant is a well-known seasoned issuer, as defined in Rule 405 of the Securities Act. Yes ÍNo ‘
Indicate by check mark if the registrant is not required to file reports pursuant to Section 13 or Section 15(d) of the Act. Yes ‘No Í
Indicate by check mark whether the registrant (1) has filed all reports required to be filed by Section 13 or 15(d) of theSecurities Exchange Act of 1934 during the preceding 12 months (or for such shorter period that the registrant was required tofile such reports), and (2) has been subject to such filing requirements for the past 90 days.
Yes Í No ‘
Indicate by check mark whether the registrant has submitted electronically every Interactive Data File required to besubmitted pursuant to Rule 405 of Regulation S-T during the preceding 12 months (or for such shorter period that theregistrant was required to submit such files). Yes Í No ‘
Indicate by check mark whether the registrant is a large accelerated filer, an accelerated filer, a non-accelerated filer, a smallerreporting company, or an emerging growth company. See the definitions of “large accelerated filer,” “accelerated filer,”“smaller reporting company,” and “emerging growth company” in Rule 12b-2 of the Exchange Act. (Check one):
Large accelerated filer Í Accelerated filer ‘ Non-accelerated filer ‘ Smaller reporting company ‘
Emerging growth company ‘
If an emerging growth company, indicate by check mark if the registrant has elected not to use the extended transition periodfor complying with any new or revised financial accounting standards provided pursuant to Section 13(a) of the ExchangeAct. ‘
Indicate by check mark whether the registrant has filed a report on and attestation to its management’s assessment of theeffectiveness of its internal control over financial reporting under Section 404(b) of the Sarbanes-Oxley Act (15 U.S.C.7262(b)) by the registered public accounting firm that prepared or issued its audit report. Í
Indicate by check mark whether the registrant is a shell company (as defined in Rule 12b-2 of the Act).Yes ‘ No Í
Aggregate market value of Common Stock held by non-affiliates of the registrant, based on the closing price of $52.69 pershare as reported on the New York Stock Exchange on November 24, 2019 (the last business day of the registrant’s mostrecently completed second fiscal quarter): $31,856.1 million.
Number of shares of Common Stock outstanding as of June 15, 2020: 609,869,264 (excluding 144,744,064 shares held in thetreasury).
DOCUMENTS INCORPORATED BY REFERENCE
Portions of the registrant’s Proxy Statement for its 2020 Annual Meeting of Shareholders are incorporated by reference intoPart III.

Table of Contents
Page
Part IItem 1 Business 3Item 1A Risk Factors 8Item 1B Unresolved Staff Comments 16Item 2 Properties 16Item 3 Legal Proceedings 17Item 4 Mine Safety Disclosures 18Part IIItem 5 Market for Registrant’s Common Equity, Related Stockholder Matters and Issuer Purchases of
Equity Securities 18Item 6 Selected Financial Data 19Item 7 Management’s Discussion and Analysis of Financial Condition and Results of Operations 20Item 7A Quantitative and Qualitative Disclosures About Market Risk 51Item 8 Financial Statements and Supplementary Data 52Item 9 Changes in and Disagreements With Accountants on Accounting and Financial Disclosure 110Item 9A Controls and Procedures 110Item 9B Other Information 111Part IIIItem 10 Directors, Executive Officers and Corporate Governance 111Item 11 Executive Compensation 112Item 12 Security Ownership of Certain Beneficial Owners and Management and Related Stockholder
Matters 112Item 13 Certain Relationships and Related Transactions, and Director Independence 113Item 14 Principal Accounting Fees and Services 113Part IVItem 15 Exhibits and Financial Statement Schedules 113Item 16 Form 10-K Summary 117Signatures 118
2

PART I
ITEM 1 - Business
General Mills, Inc. was incorporated in Delaware in 1928. The terms “General Mills,” “Company,” “registrant,”“we,” “us,” and “our” mean General Mills, Inc. and all subsidiaries included in the Consolidated FinancialStatements in Item 8 of this report unless the context indicates otherwise.
Certain terms used throughout this report are defined in a glossary in Item 8 of this report.
COMPANY OVERVIEW
We are a leading global manufacturer and marketer of branded consumer foods sold through retail stores. Wealso are a leading supplier of branded and unbranded food products to the North American foodservice andcommercial baking industries. We are also a leading manufacturer and marketer in the wholesome natural petfood category. We manufacture our products in 13 countries and market them in more than 100 countries. Inaddition to our consolidated operations, we have 50 percent interests in two strategic joint ventures thatmanufacture and market food products sold in more than 130 countries worldwide.
The results of our Pet operating segment include 13 months of results in fiscal 2020 as we changed the Petoperating segment’s reporting period from an April fiscal year end to a May fiscal year end to match our fiscalcalendar. Fiscal 2019 included 12 months of results, and fiscal 2018 did not include results for the Pet operatingsegment.
We manage and review the financial results of our business under five operating segments: North AmericaRetail; Convenience Stores & Foodservice; Europe & Australia; Asia & Latin America; and Pet. SeeManagement’s Discussion and Analysis of Financial Condition and Results of Operations (MD&A) in Item 7 ofthis report for a description of our segments.
We offer a variety of food products that provide great taste, nutrition, convenience, and value for consumersaround the world. Our business is focused on the following large, global categories:
• snacks, including grain, fruit and savory snacks, nutrition bars, and frozen hot snacks;
• ready-to-eat cereal;
• convenient meals, including meal kits, ethnic meals, pizza, soup, side dish mixes, frozen breakfast, andfrozen entrees;
• yogurt;
• wholesome natural pet food;
• super-premium ice cream;
• baking mixes and ingredients; and
• refrigerated and frozen dough.
Our Cereal Partners Worldwide (CPW) joint venture with Nestlé S.A. (Nestlé) competes in the ready-to-eatcereal category in markets outside North America, and our Häagen-Dazs Japan, Inc. (HDJ) joint venturecompetes in the super-premium ice cream category in Japan. For net sales contributed by each class of similarproducts, please see Note 17 to the Consolidated Financial Statements in Item 8 of this report.
3

Customers
Our primary customers are grocery stores, mass merchandisers, membership stores, natural food chains, drug,dollar and discount chains, e-commerce retailers, commercial and noncommercial foodservice distributors andoperators, restaurants, convenience stores, and pet specialty stores. We generally sell to these customers throughour direct sales force. We use broker and distribution arrangements for certain products and to serve certain typesof customers. For further information on our customer credit and product return practices, please refer to Note 2to the Consolidated Financial Statements in Item 8 of this report. During fiscal 2020, Walmart Inc. and itsaffiliates (Walmart) accounted for 21 percent of our consolidated net sales and 30 percent of net sales of ourNorth America Retail segment. No other customer accounted for 10 percent or more of our consolidated netsales. For further information on significant customers, please refer to Note 8 to the Consolidated FinancialStatements in Item 8 of this report.
Competition
The packaged and pet food categories are highly competitive, with numerous manufacturers of varying sizes inthe United States and throughout the world. The categories in which we participate also are very competitive.Our principal competitors in these categories are manufacturers, as well as retailers with their own brandedproducts. Competitors market and sell their products through brick-and-mortar stores and e-commerce. All of ourprincipal competitors have substantial financial, marketing, and other resources. Competition in our productcategories is based on product innovation, product quality, price, brand recognition and loyalty, effectiveness ofmarketing, promotional activity, convenient ordering and delivery to the consumer, and the ability to identify andsatisfy consumer preferences. Our principal strategies for competing in each of our segments include uniqueconsumer insights, effective customer relationships, superior product quality, innovative advertising, productpromotion, product innovation aligned with consumers’ needs, an efficient supply chain, and price. In mostproduct categories, we compete not only with other widely advertised, branded products, but also with regionalbrands and with generic and private label products that are generally sold at lower prices. Internationally, wecompete with both multi-national and local manufacturers, and each country includes a unique group ofcompetitors.
Raw materials, ingredients, and packaging
The principal raw materials that we use are grains (wheat, oats, and corn), dairy products, sugar, fruits, vegetableoils, meats, nuts, vegetables, and other agricultural products. We also use substantial quantities of carton board,corrugated, plastic and metal packaging materials, operating supplies, and energy. Most of these inputs for ourdomestic and Canadian operations are purchased from suppliers in the United States. In our other internationaloperations, inputs that are not locally available in adequate supply may be imported from other countries. Thecost of these inputs may fluctuate widely due to external conditions such as weather, climate change, productscarcity, limited sources of supply, commodity market fluctuations, currency fluctuations, trade tariffs,pandemics (including the COVID-19 pandemic), and changes in governmental agricultural and energy policiesand regulations. We have some long-term fixed price contracts, but the majority of our inputs are purchased onthe open market. We believe that we will be able to obtain an adequate supply of needed inputs. Occasionally andwhere possible, we make advance purchases of items significant to our business in order to ensure continuity ofoperations. Our objective is to procure materials meeting both our quality standards and our production needs atprice levels that allow a targeted profit margin. Since these inputs generally represent the largest variable cost inmanufacturing our products, to the extent possible, we often manage the risk associated with adverse pricemovements for some inputs using a variety of risk management strategies. We also have a grain merchandisingoperation that provides us efficient access to, and more informed knowledge of, various commodity markets,principally wheat and oats. This operation holds physical inventories that are carried at net realizable value anduses derivatives to manage its net inventory position and minimize its market exposures.
4

RESEARCH AND DEVELOPMENT
Our research and development resources are focused on new product development, product improvement,process design and improvement, packaging, and exploratory research in new business and technology areas.Research and development expenditures were $224 million in fiscal 2020 and $222 million in fiscal 2019.
TRADEMARKS AND PATENTS
Our products are marketed under a variety of valuable trademarks. Some of the more important trademarks usedin our global operations (set forth in italics in this report) include Annie’s, Betty Crocker, Bisquick, Blue Buffalo,Blue Basics, Blue Freedom, Blue Wilderness, Bugles, Cascadian Farm, Cheerios, Chex, Cinnamon ToastCrunch, Cocoa Puffs, Cookie Crisp, EPIC, Fiber One, Food Should Taste Good, Fruit by the Foot, FruitGushers, Fruit Roll-Ups, Gardetto’s, Go-Gurt, Gold Medal, Golden Grahams, Häagen-Dazs, Helpers, Jus-Rol,Kitano, Kix, Lärabar, Latina, Liberté, Lucky Charms, Muir Glen, Nature Valley, Oatmeal Crisp, Old El Paso,Oui, Pillsbury, Progresso, Raisin Nut Bran, Total, Totino’s, Trix, Wanchai Ferry, Wheaties, Yoki, and Yoplait.We protect these marks as appropriate through registrations in the United States and other jurisdictions.Depending on the jurisdiction, trademarks are generally valid as long as they are in use or their registrations areproperly maintained and they have not been found to have become generic. Registrations of trademarks can alsogenerally be renewed indefinitely for as long as the trademarks are in use.
Some of our products are marketed under or in combination with trademarks that have been licensed from othersfor both long-standing products (e.g., Reese’s Puffs for cereal, Green Giant for vegetables in certain countries,and Cinnabon for refrigerated dough, frozen pastries, and baking products) and shorter term promotionalproducts (e.g., fruit snacks sold under various third party equities).
Our cereal trademarks are licensed to CPW and may be used in association with the Nestlé trademark. Nestlélicenses certain of its trademarks to CPW, including the Nestlé and Uncle Toby’s trademarks. The Häagen-Dazstrademark is licensed royalty-free and exclusively to Nestlé for ice cream and other frozen dessert products in theUnited States and Canada. The Häagen-Dazs trademark is also licensed to HDJ. The Pillsbury brand and thePillsbury Doughboy character are subject to an exclusive, royalty-free license that was granted to a third partyand its successors in the dessert mix and baking mix categories in the United States and under limitedcircumstances in Canada and Mexico.
The Yoplait trademark and other related trademarks are owned by Yoplait Marques SNC, an entity in which weown a 50 percent interest. These marks are licensed exclusively to Yoplait SAS, an entity in which we own a51 percent interest. Yoplait SAS licenses these trademarks to its franchisees. The Liberté trademark and otherrelated trademarks are owned by Liberté Marques Sàrl, an entity in which we own a 50 percent interest.
We continue our focus on developing and marketing innovative, proprietary products, many of which useproprietary expertise, recipes and formulations. We consider the collective rights under our various patents,which expire from time to time, a valuable asset, but we do not believe that our businesses are materiallydependent upon any single patent or group of related patents.
SEASONALITY
In general, demand for our products is evenly balanced throughout the year. However, within our North AmericaRetail segment demand for refrigerated dough, frozen baked goods, and baking products is stronger in the fourthcalendar quarter. Demand for Progresso soup is higher during the fall and winter months. Internationally, withinour Europe & Australia and Asia & Latin America segments, demand for Häagen-Dazs ice cream is higherduring the summer months and demand for baking mix and dough products increases during winter months. Dueto the offsetting impact of these demand trends, as well as the different seasons in the northern and southernhemispheres, our international segments’ net sales are generally evenly balanced throughout the year.
5

BACKLOG
Orders are generally filled within a few days of receipt and are subject to cancellation at any time prior toshipment. In the fourth quarter of fiscal 2020, we experienced increased demand in our retail businesses as theCOVID-19 pandemic and related governmental restrictions resulted in a significant increase in at-home foodconsumption. We have taken steps to increase our production capacity to meet the increased demand for ourretail products, including increasing production time at our manufacturing facilities and prioritizing certainproduct lines to increase manufacturing efficiency. Notwithstanding these efforts, we have been, and continue tobe, unable to fulfill all orders we receive from our customers.
WORKING CAPITAL
A description of our working capital is included in the Liquidity section of MD&A in Item 7 of this report. Ourproduct return practices are described in Note 2 to the Consolidated Financial Statements in Item 8 of this report.
EMPLOYEES
As of May 31, 2020, we had approximately 35,000 full- and part-time employees.
QUALITY AND SAFETY REGULATION
The manufacture and sale of consumer and pet food products is highly regulated. In the United States, ouractivities are subject to regulation by various federal government agencies, including the Food and DrugAdministration, Department of Agriculture, Federal Trade Commission, Department of Commerce, andEnvironmental Protection Agency, as well as various state and local agencies. Our business is also regulated bysimilar agencies outside of the United States.
ENVIRONMENTAL MATTERS
As of May 31, 2020, we were involved with two response actions associated with the alleged or threatenedrelease of hazardous substances or wastes located in Minneapolis, Minnesota and Moonachie, New Jersey.
Our operations are subject to the Clean Air Act, Clean Water Act, Resource Conservation and Recovery Act,Comprehensive Environmental Response, Compensation, and Liability Act, and the Federal Insecticide,Fungicide, and Rodenticide Act, and all similar state, local, and foreign environmental laws and regulationsapplicable to the jurisdictions in which we operate.
Based on current facts and circumstances, we believe that neither the results of our environmental proceedingsnor our compliance in general with environmental laws or regulations will have a material adverse effect uponour capital expenditures, earnings, or competitive position.
INFORMATION ABOUT OUR EXECUTIVE OFFICERS
The section below provides information regarding our executive officers as of July 2, 2020:
Richard C. Allendorf, age 59, is General Counsel and Secretary. Mr. Allendorf joined General Mills in 2001from The Pillsbury Company. He was promoted to Vice President, Deputy General Counsel in 2010, firstoverseeing the legal affairs of the U.S. Retail segment and Consumer Food Sales and then, in 2012, overseeingthe legal affairs of the International segment and Global Ethics and Compliance. He was named to his presentposition in February 2015. Prior to joining General Mills, he practiced law with the Shearman and Sterling andMackall, Crounse and Moore law firms. He was in finance with General Electric prior to his legal career.
6

Jodi Benson, age 55, is Chief Innovation, Technology and Quality Officer. Ms. Benson joined General Mills in2001 from The Pillsbury Company. She held a variety of positions before becoming the leader of our One GlobalDairy Platform from 2011 to March 2016. She was named Vice President for our International business segmentfrom April 2016 to March 2017, and Vice President of the Global Innovation, Technology, and QualityCapabilities Group from April 2017 to July 2018. She was named to her current position in August 2018.
Kofi A. Bruce, age 50, is Chief Financial Officer. Mr. Bruce joined General Mills in 2009 as Vice President,Treasurer after serving in a variety of senior management positions with Ecolab and Ford Motor Company. Heserved as Treasurer until 2010 when he was named Vice President, Finance for Yoplait. Mr. Bruce reassumed hisrole as Vice President, Treasurer from 2012 until 2014 when he was named Vice President, Finance forConvenience Stores & Foodservice. He was named Vice President, Controller in August 2017, Vice President,Financial Operations in September 2019, and to his present position in February 2020.
John R. Church, age 54, is Chief Supply Chain and Global Business Solutions Officer. Mr. Church joinedGeneral Mills in 1988 as a Product Developer in the Big G cereals division and held various positions beforebecoming Vice President, Engineering in 2003. In 2005, his role was expanded to include development of theCompany’s strategy for the global sourcing of raw materials and manufacturing capabilities. He was named VicePresident, Supply Chain Operations in 2007, Senior Vice President, Supply Chain in 2008, Executive VicePresident, Supply Chain in 2013, and to his present position in June 2017.
Jeffrey L. Harmening, age 53, is Chairman of the Board and Chief Executive Officer. Mr. Harmening joinedGeneral Mills in 1994 and served in various marketing roles in the Betty Crocker, Yoplait, and Big G cerealdivisions. He was named Vice President, Marketing for CPW in 2003 and Vice President of the Big G cerealdivision in 2007. In 2011, he was promoted to Senior Vice President for the Big G cereal division.Mr. Harmening was appointed Senior Vice President, Chief Executive Officer of CPW in 2012. Mr. Harmeningreturned from CPW in 2014 and was named Executive Vice President, Chief Operating Officer, U.S. Retail. Hebecame President, Chief Operating Officer in July 2016. He was named Chief Executive Officer in June 2017and Chairman of the Board in January 2018. Mr. Harmening is a director of The Toro Company.
Dana M. McNabb, age 44, is Group President, Europe & Australia. Ms. McNabb joined General Mills in 1999and held a variety of marketing roles in Cereal, Snacks, Meals, and New Products before becoming VicePresident, Marketing for CPW in 2011 and Vice President, Marketing for the Circle of Champions Business Unitin October 2015. She was promoted to President, U.S. Cereal Operating Unit in December 2016 and named toher present position in January 2020.
Jaime Montemayor, age 56, is Chief Digital and Technology Officer. He spent 21 years at PepsiCo, Inc., servingin roles of increasing responsibility, including most recently as Senior Vice President and Chief InformationOfficer of PepsiCo’s Americas Foods segment from 2013 to October 2015, and Senior Vice President and ChiefInformation Officer, Digital Innovation, Data and Analytics, PepsiCo from November 2015 to July 2016.Mr. Montemayor served as Chief Technology Officer of 7-Eleven Inc. from April 2017 until October 2017. Heassumed his current role in February 2020 after founding and operating a digital technology consulting companyfrom November 2017 until January 2020.
Jon J. Nudi, age 50, is Group President, North America Retail. Mr. Nudi joined General Mills in 1993 as a SalesRepresentative and held a variety of roles in Consumer Foods Sales. In 2005, he moved into marketing roles inthe Meals division and was elected Vice President in 2007. Mr. Nudi was named Vice President; President,Snacks, in 2010, Senior Vice President, President, Europe/Australasia in 2014, and Senior Vice President;President, U.S. Retail in September 2016. He was named to his present position in January 2017.
Shawn P. O’Grady, age 56, is Group President, Convenience Stores & Foodservice and Chief RevenueDevelopment Officer. Mr. O’Grady joined General Mills in 1990 and held several marketing roles in the Snacks,Meals, and Big G cereal divisions. He was promoted to Vice President in 1998 and held marketing positions in
7

the Betty Crocker and Pillsbury USA divisions. In 2004, he moved into Consumer Foods Sales, becoming VicePresident, President, U.S. Retail Sales in 2007, Senior Vice President, President, Consumer Foods Sales Divisionin 2010, and Senior Vice President, President, Sales & Channel Development in 2012. He was named to hiscurrent position in January 2017.
Mark A. Pallot, age 47, is Vice President, Chief Accounting Officer. Mr. Pallot joined General Mills in 2007 andserved as Director, Financial Reporting until August 2017, when he was named Vice President, AssistantController. He was elected to his present position in February 2020. Prior to joining General Mills, Mr. Pallotheld accounting and financial reporting positions at Residential Capital, LLC, Metris, Inc., CIT Group Inc., andErnst & Young, LLP.
Ivan Pollard, age 58, is Global Chief Marketing Officer. Mr. Pollard assumed his current role in July 2017 whenhe joined General Mills from The Coca-Cola Company. At Coca-Cola, from 2011 to 2014, Mr. Pollard served asVice President, Global Connections until he was promoted to Senior Vice President, Strategic Marketing, a rolehe held until June 2017. Prior to joining The Coca-Cola Company, Mr. Pollard was a global partner at NakedCommunications, a connections planning company. His prior communications planning experience includedwork at the BMP, DDP Needham, and Wieden+Kennedy advertising agencies.
Bethany Quam, age 49, is Group President, Pet. Ms. Quam joined General Mills in 1993 and held a variety ofpositions before becoming Vice President, Strategic Planning in 2007. She was promoted to Vice President, FieldSales, Channels in 2012, Vice President; President, Convenience Stores & Foodservice in 2014, and Senior VicePresident; President, Europe & Australia in August 2016, and Group President; Europe & Australia in January2017. She was named to her current position in October 2019.
Sean Walker, age 54, is Group President, Asia & Latin America. Mr. Walker joined General Mills in 1989 andheld a variety of positions before becoming Vice President, President of Latin America in 2009. He was namedSenior Vice President, President Latin America in 2012 and Senior Vice President, Corporate Strategy inSeptember 2016. He was named to his current position in February 2019.
Jacqueline Williams-Roll, age 51, is Chief Human Resources Officer. Ms. Williams-Roll joined General Mills in1995. She held human resources leadership roles in Supply Chain, Finance, Marketing, and OrganizationEffectiveness, and she also worked a large part of her career on businesses outside of the United States. She wasnamed Vice President, Human Resources, International in 2010, and then promoted to Senior Vice President,Human Resources Operations in 2013. She was named to her present position in September 2014. Prior to joiningGeneral Mills, she held sales and management roles with Jenny Craig International.
WEBSITE ACCESS
Our website is www.GeneralMills.com. We make available, free of charge in the “Investors” portion of thiswebsite, annual reports on Form 10-K, quarterly reports on Form 10-Q, current reports on Form 8-K, andamendments to those reports filed or furnished pursuant to Section 13(a) or 15(d) of the Securities Exchange Actof 1934 (1934 Act) as soon as reasonably practicable after we electronically file such material with, or furnish itto, the Securities and Exchange Commission (SEC). All such filings are available on the SEC’s website atwww.sec.gov. Reports of beneficial ownership filed pursuant to Section 16(a) of the 1934 Act are also availableon our website.
ITEM 1A - Risk Factors
Our business is subject to various risks and uncertainties. Any of the risks described below could materially,adversely affect our business, financial condition, and results of operations.
8

Global health developments and economic uncertainty resulting from the COVID-19 pandemic couldmaterially and adversely affect our business, financial condition, and results of operations.
The public health crisis caused by the COVID-19 pandemic and the measures being taken by governments,businesses, including us, and the public at large to limit COVID-19’s spread have had, and we expect willcontinue to have, certain negative impacts on our business, financial condition, and results of operationsincluding, without limitation, the following:
• We have experienced, and may continue to experience, a decrease in sales of certain of our products inmarkets around the world that have been affected by the COVID-19 pandemic. In particular, sales of ourproducts in the away-from-home food outlets across all our major markets have been negatively affected byreduced consumer traffic resulting from shelter-in-place regulations or recommendations and closings ofrestaurants, schools and cafeterias. If the COVID-19 pandemic persists or intensifies, its negative impacts onour sales, particularly in away-from-home food outlets, could be more prolonged and may become moresevere.
• Deteriorating economic and political conditions in our major markets affected by the COVID-19 pandemic,such as increased unemployment, decreases in disposable income, declines in consumer confidence, oreconomic slowdowns or recessions, could cause a decrease in demand for our products.
• We have experienced minor temporary workforce disruptions in our supply chain as a result of theCOVID-19 pandemic. We have implemented employee safety measures, based on guidance from theCenters for Disease Control and Prevention and World Health Organization, across all our supply chainfacilities, including proper hygiene, social distancing, mask use, and temperature screenings. These measuresmay not be sufficient to prevent the spread of COVID-19 among our employees. Illness, travel restrictions,absenteeism, or other workforce disruptions could negatively affect our supply chain, manufacturing,distribution, or other business processes. We may face additional production disruptions in the future, whichmay place constraints on our ability to produce products in a timely manner or may increase our costs.
• Changes and volatility in consumer purchasing and consumption patterns may increase demand for ourproducts in one quarter (such as occurred in the fourth quarter of fiscal 2020), resulting in decreasedconsumer demand for our products in subsequent quarters. While we experienced increased demand for ourproducts in the fourth quarter of fiscal 2020, this increase may moderate or reverse if consumers alter theirpurchasing habits. Short term or sustained increases in consumer demand at our retail customers may exceedour production capacity or otherwise strain our supply chain.
• The failure of third parties on which we rely, including those third parties who supply our ingredients,packaging, capital equipment and other necessary operating materials, contract manufacturers, distributors,contractors, commercial banks, and external business partners, to meet their obligations to us, or significantdisruptions in their ability to do so, may negatively impact our operations.
• Significant changes in the political conditions in markets in which we manufacture, sell, or distribute ourproducts (including quarantines, import/export restrictions, price controls, governmental or regulatoryactions, closures or other restrictions that limit or close our operating and manufacturing facilities, restrictour employees’ ability to travel or perform necessary business functions, or otherwise prevent our third-partypartners, suppliers, or customers from sufficiently staffing operations, including operations necessary for theproduction, distribution, and sale of our products) could adversely impact our operations and results.
• Actions we have taken or may take, or decisions we have made or may make, as a consequence of theCOVID-19 pandemic may result in investigations, legal claims or litigation against us.
The categories in which we participate are very competitive, and if we are not able to compete effectively,our results of operations could be adversely affected.
The consumer and pet food categories in which we participate are very competitive. Our principal competitors inthese categories are manufacturers, as well as retailers with their own branded and private label products.
9

Competitors market and sell their products through brick-and-mortar stores and e-commerce. All of our principalcompetitors have substantial financial, marketing, and other resources. In most product categories, we competenot only with other widely advertised branded products, but also with regional brands and with generic andprivate label products that are generally sold at lower prices. Competition in our product categories is based onproduct innovation, product quality, price, brand recognition and loyalty, effectiveness of marketing, promotionalactivity, convenient ordering and delivery to the consumer, and the ability to identify and satisfy consumerpreferences. If our large competitors were to seek an advantage through pricing or promotional changes, wecould choose to do the same, which could adversely affect our margins and profitability. If we did not do thesame, our revenues and market share could be adversely affected. Our market share and revenue growth couldalso be adversely impacted if we are not successful in introducing innovative products in response to changingconsumer demands or by new product introductions of our competitors. If we are unable to build and sustainbrand equity by offering recognizably superior product quality, we may be unable to maintain premium pricingover generic and private label products.
We may be unable to maintain our profit margins in the face of a consolidating retail environment.
There has been significant consolidation in the grocery industry, resulting in customers with increasedpurchasing power. In addition, large retail customers may seek to use their position to improve their profitabilitythrough improved efficiency, lower pricing, increased reliance on their own brand name products, increasedemphasis on generic and other economy brands, and increased promotional programs. If we are unable to use ourscale, marketing expertise, product innovation, knowledge of consumers’ needs, and category leadershippositions to respond to these demands, our profitability and volume growth could be negatively impacted. Inaddition, the loss of any large customer could adversely affect our sales and profits. In fiscal 2020, Walmartaccounted for 21 percent of our consolidated net sales and 30 percent of net sales of our North America Retailsegment. For more information on significant customers, please see Note 8 to the Consolidated FinancialStatements in Item 8 of this report.
Price changes for the commodities we depend on for raw materials, packaging, and energy may adverselyaffect our profitability.
The principal raw materials that we use are commodities that experience price volatility caused by externalconditions such as weather, climate change, product scarcity, limited sources of supply, commodity marketfluctuations, currency fluctuations, trade tariffs, pandemics (such as the COVID-19 pandemic), and changes ingovernmental agricultural and energy policies and regulations. Commodity prices have become, and maycontinue to be, more volatile during the COVID-19 pandemic. Commodity price changes may result inunexpected increases in raw material, packaging, and energy costs. If we are unable to increase productivity tooffset these increased costs or increase our prices, we may experience reduced margins and profitability. We donot fully hedge against changes in commodity prices, and the risk management procedures that we do use maynot always work as we intend.
Volatility in the market value of derivatives we use to manage exposures to fluctuations in commodityprices will cause volatility in our gross margins and net earnings.
We utilize derivatives to manage price risk for some of our principal ingredient and energy costs, includinggrains (oats, wheat, and corn), oils (principally soybean), dairy products, natural gas, and diesel fuel. Changes inthe values of these derivatives are recorded in earnings currently, resulting in volatility in both gross margin andnet earnings. These gains and losses are reported in cost of sales in our Consolidated Statements of Earnings andin unallocated corporate items outside our segment operating results until we utilize the underlying input in ourmanufacturing process, at which time the gains and losses are reclassified to segment operating profit. We alsorecord our grain inventories at net realizable value. We may experience volatile earnings as a result of theseaccounting treatments.
10

If we are not efficient in our production, our profitability could suffer as a result of the highly competitiveenvironment in which we operate.
Our future success and earnings growth depend in part on our ability to be efficient in the production andmanufacture of our products in highly competitive markets. Gaining additional efficiencies may become moredifficult over time. Our failure to reduce costs through productivity gains or by eliminating redundant costsresulting from acquisitions or divestitures could adversely affect our profitability and weaken our competitiveposition. Many productivity initiatives involve complex reorganization of manufacturing facilities and productionlines. Such manufacturing realignment may result in the interruption of production, which may negatively impactproduct volume and margins. We periodically engage in restructuring and cost savings initiatives designed toincrease our efficiency and reduce expenses. If we are unable to execute those initiatives as planned, we may notrealize all or any of the anticipated benefits, which could adversely affect our business and results of operations.
Disruption of our supply chain could adversely affect our business.
Our ability to make, move, and sell products is critical to our success. Damage or disruption to raw materialsupplies or our manufacturing or distribution capabilities due to weather, climate change, natural disaster, fire,terrorism, cyber-attack, pandemics (such as the COVID-19 pandemic), governmental restrictions or mandates,strikes, import/export restrictions, or other factors could impair our ability to manufacture or sell our products.Many of our product lines are manufactured at a single location or sourced from a single supplier. The failure ofthird parties on which we rely, including those third parties who supply our ingredients, packaging, capitalequipment and other necessary operating materials, contract manufacturers, distributors, contractors, and externalbusiness partners, to meet their obligations to us, or significant disruptions in their ability to do so, maynegatively impact our operations. Our suppliers’ policies and practices can damage our reputation and the qualityand safety of our products. Disputes with significant suppliers, including disputes regarding pricing orperformance, could adversely affect our ability to supply products to our customers and could materially andadversely affect our sales, financial condition, and results of operations. Failure to take adequate steps to mitigatethe likelihood or potential impact of such events, or to effectively manage such events if they occur, particularlywhen a product is sourced from a single location or supplier, could adversely affect our business and results ofoperations, as well as require additional resources to restore our supply chain.
We have experienced minor temporary workforce disruptions in our supply chain as a result of the COVID-19pandemic. We have implemented employee safety measures, based on guidance from the Centers for DiseaseControl and Prevention and World Health Organization, across all our supply chain facilities, including properhygiene, social distancing, mask use, and temperature screenings. These measures may not be sufficient toprevent the spread of COVID-19 among our employees. Illness, travel restrictions, absenteeism, or otherworkforce disruptions could negatively affect our supply chain, manufacturing, distribution, or other businessprocesses. We may face additional production disruptions in the future, which may place constraints on ourability to produce products in a timely manner or may increase our costs.
We experienced increased demand for our products in the fourth quarter of fiscal 2020 and were, and continue tobe, unable to fill all customer orders. Short term or sustained increases in consumer demand at our retailcustomers may exceed our production capacity or otherwise strain our supply chain. Our failure to meet thedemand for our products could adversely affect our business and results of operations.
Concerns with the safety and quality of our products could cause consumers to avoid certain products oringredients.
We could be adversely affected if consumers in our principal markets lose confidence in the safety and quality ofcertain of our products or ingredients. Adverse publicity about these types of concerns, whether or not valid, maydiscourage consumers from buying our products or cause production and delivery disruptions.
11

If our products become adulterated, misbranded, or mislabeled, we might need to recall those items andmay experience product liability claims if consumers or their pets are injured.
We may need to recall some of our products if they become adulterated, misbranded, or mislabeled. Awidespread product recall could result in significant losses due to the costs of a recall, the destruction of productinventory, and lost sales due to the unavailability of product for a period of time. We could also suffer lossesfrom a significant product liability judgment against us. A significant product recall or product liability casecould also result in adverse publicity, damage to our reputation, and a loss of consumer confidence in ourproducts, which could have an adverse effect on our business results and the value of our brands.
We may be unable to anticipate changes in consumer preferences and trends, which may result indecreased demand for our products.
Our success depends in part on our ability to anticipate the tastes, eating habits, and purchasing behaviors ofconsumers and to offer products that appeal to their preferences in channels where they shop. Consumerpreferences and category-level consumption may change from time to time and can be affected by a number ofdifferent trends and other factors. If we fail to anticipate, identify or react to these changes and trends, such asadapting to emerging e-commerce channels, or to introduce new and improved products on a timely basis, wemay experience reduced demand for our products, which would in turn cause our revenues and profitability tosuffer. Similarly, demand for our products could be affected by consumer concerns regarding the health effects ofingredients such as sodium, trans fats, genetically modified organisms, sugar, processed wheat, grain-free orlegume-rich pet food, or other product ingredients or attributes.
We may be unable to grow our market share or add products that are in faster growing and moreprofitable categories.
The food industry’s growth potential is constrained by population growth. Our success depends in part on ourability to grow our business faster than populations are growing in the markets that we serve. One way to achievethat growth is to enhance our portfolio by adding innovative new products in faster growing and more profitablecategories. Our future results will also depend on our ability to increase market share in our existing productcategories. If we do not succeed in developing innovative products for new and existing categories, our growthand profitability could be adversely affected.
Economic downturns could limit consumer demand for our products.
The willingness of consumers to purchase our products depends in part on local economic conditions. In periodsof economic uncertainty, consumers may purchase more generic, private label, and other economy brands andmay forego certain purchases altogether. In those circumstances, we could experience a reduction in sales ofhigher margin products or a shift in our product mix to lower margin offerings. In addition, as a result ofeconomic conditions or competitive actions, we may be unable to raise our prices sufficiently to protect margins.Consumers may also reduce the amount of food that they consume away from home at customers that purchaseproducts from our Convenience Stores & Foodservice segment. Any of these events could have an adverse effecton our results of operations.
Deteriorating economic and political conditions in our major markets affected by the COVID-19 pandemic, suchas increased unemployment, decreases in disposable income, declines in consumer confidence, or economicslowdowns or recessions, could cause a decrease in demand for our products.
Our results may be negatively impacted if consumers do not maintain their favorable perception of ourbrands.
Maintaining and continually enhancing the value of our many iconic brands is critical to the success of ourbusiness. The value of our brands is based in large part on the degree to which consumers react and respond
12
positively to these brands. Brand value could diminish significantly due to a number of factors, includingconsumer perception that we have acted in an irresponsible manner, adverse publicity about our products, ourfailure to maintain the quality of our products, the failure of our products to deliver consistently positiveconsumer experiences, concerns about food safety, or our products becoming unavailable to consumers.Consumer demand for our products may also be impacted by changes in the level of advertising or promotionalsupport. The use of social and digital media by consumers, us, and third parties increases the speed and extentthat information or misinformation and opinions can be shared. Negative posts or comments about us, ourbrands, or our products on social or digital media could seriously damage our brands and reputation. If we do notmaintain the favorable perception of our brands, our business results could be negatively impacted.
Our international operations are subject to political and economic risks.
In fiscal 2020, 24 percent of our consolidated net sales were generated outside of the United States. We areaccordingly subject to a number of risks relating to doing business internationally, any of which couldsignificantly harm our business. These risks include:
• political and economic instability;• exchange controls and currency exchange rates;• tariffs on products and ingredients that we import and export;• nationalization or government control of operations;• compliance with anti-corruption regulations;• uncertainty relating to the impact of the United Kingdom’s exit from the European Union;• foreign tax treaties and policies; and• restriction on the transfer of funds to and from foreign countries, including potentially negative tax
consequences.
Our financial performance on a U.S. dollar denominated basis is subject to fluctuations in currency exchangerates. These fluctuations could cause material variations in our results of operations. Our principal exposures areto the Australian dollar, Brazilian real, British pound sterling, Canadian dollar, Chinese renminbi, euro, Japaneseyen, Mexican peso, and Swiss franc. From time to time, we enter into agreements that are intended to reduce theeffects of our exposure to currency fluctuations, but these agreements may not be effective in significantlyreducing our exposure.
A strengthening in the U.S. dollar relative to other currencies in the countries in which we operate, such as hasgenerally occurred during the COVID-19 pandemic to-date, would negatively affect our reported results ofoperations and financial results due to currency translation losses and currency transaction losses.
New regulations or regulatory-based claims could adversely affect our business.
Our facilities and products are subject to many laws and regulations administered by the United StatesDepartment of Agriculture, the Federal Food and Drug Administration, the Occupational Safety and HealthAdministration, and other federal, state, local, and foreign governmental agencies relating to the production,packaging, labelling, storage, distribution, quality, and safety of food products and the health and safety of ouremployees. Our failure to comply with such laws and regulations could subject us to lawsuits, administrativepenalties, and civil remedies, including fines, injunctions, and recalls of our products. We advertise our productsand could be the target of claims relating to alleged false or deceptive advertising under federal, state, and foreignlaws and regulations. We may also be subject to new laws or regulations restricting our right to advertise ourproducts, including restrictions on the audience to whom products are marketed. Changes in laws or regulationsthat impose additional regulatory requirements on us could increase our cost of doing business or restrict ouractions, causing our results of operations to be adversely affected.
13
Significant COVID-19 related changes in the political conditions in markets in which we manufacture, sell ordistribute our products (including quarantines, import/export restrictions, price controls, governmental orregulatory actions, closures or other restrictions that limit or close our operating and manufacturing facilities,restrict our employees’ ability to travel or perform necessary business functions or otherwise prevent our third-party partners, suppliers, or customers from sufficiently staffing operations, including operations necessary forthe production, distribution, sale, and support of our products) could adversely impact our operations and results.
We are subject to various federal, state, local, and foreign environmental laws and regulations. Our failure tocomply with environmental laws and regulations could subject us to lawsuits, administrative penalties, and civilremedies. We are currently party to a variety of environmental remediation obligations. Due to regulatorycomplexities, uncertainties inherent in litigation, and the risk of unidentified contaminants on current and formerproperties of ours, the potential exists for remediation, liability, indemnification, and compliance costs to differfrom our estimates. We cannot guarantee that our costs in relation to these matters, or compliance withenvironmental laws in general, will not exceed our established liabilities or otherwise have an adverse effect onour business and results of operations.
We have a substantial amount of indebtedness, which could limit financing and other options and in somecases adversely affect our ability to pay dividends.
As of May 31, 2020, we had total debt, redeemable interests, and noncontrolling interests of $14.4 billion. Theagreements under which we have issued indebtedness do not prevent us from incurring additional unsecuredindebtedness in the future. Our level of indebtedness may limit our:
• ability to obtain additional financing for working capital, capital expenditures, or general corporatepurposes, particularly if the ratings assigned to our debt securities by rating organizations were reviseddownward; and
• flexibility to adjust to changing business and market conditions and may make us more vulnerable to adownturn in general economic conditions.
There are various financial covenants and other restrictions in our debt instruments and noncontrolling interests.If we fail to comply with any of these requirements, the related indebtedness, and other unrelated indebtedness,could become due and payable prior to its stated maturity and our ability to obtain additional or alternativefinancing may also be adversely affected.
Our ability to make scheduled payments on or to refinance our debt and other obligations will depend on ouroperating and financial performance, which in turn is subject to prevailing economic conditions and to financial,business, and other factors beyond our control.
Global capital and credit market issues could negatively affect our liquidity, increase our costs ofborrowing, and disrupt the operations of our suppliers and customers.
We depend on stable, liquid, and well-functioning capital and credit markets to fund our operations. Although webelieve that our operating cash flows, financial assets, access to capital and credit markets, and revolving creditagreements will permit us to meet our financing needs for the foreseeable future, there can be no assurance thatfuture volatility or disruption in the capital and credit markets will not impair our liquidity or increase our costsof borrowing. We also utilize interest rate derivatives to reduce the volatility of our financing costs. If we are noteffective in hedging this volatility, we may experience an increase in our costs of borrowing. Our business couldalso be negatively impacted if our suppliers or customers experience disruptions resulting from tighter capitaland credit markets or a slowdown in the general economy.
The COVID-19 pandemic has increased volatility and pricing in the capital markets. We may not have access topreferred sources of liquidity when needed or on terms we find acceptable, and our borrowing costs could
14

increase. An economic or credit crisis could occur and impair credit availability and our ability to raise capitalwhen needed. A disruption in the financial markets may have a negative effect on our derivative counterpartiesand could impair our banking or other business partners, on whom we rely for access to capital and ascounterparties to our derivative contracts.
From time to time, we issue variable rate securities based on interbank offered rates (IBORs) and enter intointerest rate swaps that contain a variable element based on an IBOR. There is currently uncertainty whethercertain IBORs will continue to be available after 2021. If certain IBORs cease to be available, we may need toamend affected agreements, and we cannot predict what alternative index would be negotiated with ourcounterparties and security holders. As a result, our interest expense could increase and our available cash flowfor general corporate requirements may be adversely affected.
Volatility in the securities markets, interest rates, and other factors could substantially increase ourdefined benefit pension, other postretirement benefit, and postemployment benefit costs.
We sponsor a number of defined benefit plans for employees in the United States, Canada, and various foreignlocations, including defined benefit pension, retiree health and welfare, severance, and other postemploymentplans. Our major defined benefit pension plans are funded with trust assets invested in a globally diversifiedportfolio of securities and other investments. Changes in interest rates, mortality rates, health care costs, earlyretirement rates, investment returns, and the market value of plan assets can affect the funded status of ourdefined benefit plans and cause volatility in the net periodic benefit cost and future funding requirements of theplans. A significant increase in our obligations or future funding requirements could have a negative impact onour results of operations and cash flows from operations.
Our business operations could be disrupted if our information technology systems fail to performadequately or are breached.
Information technology serves an important role in the efficient and effective operation of our business. We relyon information technology networks and systems, including the internet, to process, transmit, and store electronicinformation to manage a variety of business processes and to comply with regulatory, legal, and taxrequirements. Our information technology systems and infrastructure are critical to effectively manage our keybusiness processes including digital marketing, order entry and fulfillment, supply chain management, finance,administration, and other business processes. These technologies enable internal and external communicationamong our locations, employees, suppliers, customers, and others and include the receipt and storage of personalinformation about our employees, consumers, and proprietary business information. Our information technologysystems, some of which are dependent on services provided by third parties, may be vulnerable to damage,interruption, or shutdown due to any number of causes such as catastrophic events, natural disasters, fires, poweroutages, systems failures, telecommunications failures, security breaches, computer viruses, hackers, employeeerror or malfeasance, and other causes. Increased cyber-security threats pose a potential risk to the security andviability of our information technology systems, as well as the confidentiality, integrity, and availability of thedata stored on those systems. The failure of our information technology systems to perform as we anticipatecould disrupt our business and result in transaction errors, processing inefficiencies, data loss, legal claims orproceedings, regulatory penalties, and the loss of sales and customers. Any interruption of our informationtechnology systems could have operational, reputational, legal, and financial impacts that may have a materialadverse effect on our business.
A change in the assumptions regarding the future performance of our businesses or a different weighted-average cost of capital used to value our reporting units or our indefinite-lived intangible assets couldnegatively affect our consolidated results of operations and net worth.
As of May 31, 2020, we had $20.5 billion of goodwill and indefinite-lived intangible assets. Goodwill for each ofour reporting units is tested for impairment annually and whenever events or changes in circumstances indicate
15

that impairment may have occurred. We compare the carrying value of the reporting unit, including goodwill, tothe fair value of the reporting unit. If the fair value of the reporting unit is less than the carrying value of thereporting unit, including goodwill, impairment has occurred. Our estimates of fair value are determined based ona discounted cash flow model. Growth rates for sales and profits are determined using inputs from our long-rangeplanning process. We also make estimates of discount rates, perpetuity growth assumptions, market comparables,and other factors. If current expectations for growth rates for sales and profits are not met, or other market factorsand macroeconomic conditions that could be affected by the COVID-19 pandemic or otherwise were to change,then our reporting units could become significantly impaired. Our Europe & Australia reporting unit hadexperienced declining business performance, and we continue to monitor this business. While we currentlybelieve that our goodwill is not impaired, different assumptions regarding the future performance of ourbusinesses could result in significant impairment losses.
We evaluate the useful lives of our intangible assets, primarily intangible assets associated with the Blue Buffalo,Pillsbury, Totino’s, Progresso, Yoplait, Old El Paso, Yoki, Häagen-Dazs, and Annie’s brands, to determine ifthey are finite or indefinite-lived. Reaching a determination on useful life requires significant judgments andassumptions regarding the future effects of obsolescence, demand, competition, other economic factors (such asthe stability of the industry, known technological advances, legislative action that results in an uncertain orchanging regulatory environment, and expected changes in distribution channels), the level of requiredmaintenance expenditures, and the expected lives of other related groups of assets.
Our indefinite-lived intangible assets are also tested for impairment annually and whenever events or changes incircumstances indicate that impairment may have occurred. Our estimate of the fair value of the brands is basedon a discounted cash flow model using inputs including projected revenues from our long-range plan, assumedroyalty rates which could be payable if we did not own the brands, and a discount rate. If current expectations forgrowth rates for sales and margins are not met, or other market factors and macroeconomic conditions that couldbe affected by the COVID-19 pandemic or otherwise were to change, then our indefinite-lived intangible assetscould become significantly impaired. Our Pillsbury and Progresso brands had experienced declining businessperformance, and we continue to monitor these businesses.
For further information on goodwill and intangible assets, please refer to Note 6 to the Consolidated FinancialStatements in Item 8 of this report.
Our failure to successfully integrate acquisitions into our existing operations could adversely affect ourfinancial results.
From time to time, we evaluate potential acquisitions or joint ventures that would further our strategic objectives.Our success depends, in part, upon our ability to integrate acquired and existing operations. If we are unable tosuccessfully integrate acquisitions, our financial results could suffer. Additional potential risks associated withacquisitions include additional debt leverage, the loss of key employees and customers of the acquired business,the assumption of unknown liabilities, the inherent risk associated with entering a geographic area or line ofbusiness in which we have no or limited prior experience, failure to achieve anticipated synergies, and theimpairment of goodwill or other acquisition-related intangible assets.
ITEM 1B - Unresolved Staff Comments
None.
ITEM 2 - Properties
We own our principal executive offices and main research facilities, which are located in the Minneapolis,Minnesota metropolitan area. We operate numerous manufacturing facilities and maintain many sales andadministrative offices, warehouses, and distribution centers around the world.
16

As of May 31, 2020, we operated 47 facilities for the production of a wide variety of food products. Of thesefacilities, 24 are located in the United States (1 of which is leased), 4 in the Greater China region, 1 in the Asia/Middle East/Africa Region, 2 in Canada (1 of which is leased), 8 in Europe/Australia, and 8 in Latin Americaand Mexico. The following is a list of the locations of our principal production facilities, which primarily supportthe segment noted:
North America Retail
• St. Hyacinthe, Canada• Covington, Georgia• Belvidere, Illinois• Geneva, Illinois• Cedar Rapids, Iowa
• Irapuato, Mexico• Reed City, Michigan• Fridley, Minnesota• Hannibal, Missouri• Albuquerque, New Mexico
• Buffalo, New York• Cincinnati, Ohio• Wellston, Ohio• Murfreesboro, Tennessee• Milwaukee, Wisconsin
Convenience Stores & Foodservice
• Chanhassen, Minnesota • Joplin, Missouri
Europe & Australia
• Rooty Hill, Australia• Arras, France• Labatut, France
• Le Mans, France• Moneteau, France• Vienne, France
• Inofita, Greece• San Adrian, Spain
Asia & Latin America
• Cambara, Brazil• Campo Novo do Pareceis, Brazil• Nova Prata, Brazil• Paranavai, Brazil
• Pouso Alegre, Brazil• Recife, Brazil• Ribeirao Claro, Brazil• Guangzhou, China
• Nanjing, China• Sanhe, China• Shanghai, China• Nashik, India
Pet
• Joplin, Missouri • Richmond, Indiana
We operate numerous grain elevators in the United States in support of our domestic manufacturing activities.We also utilize approximately 15 million square feet of warehouse and distribution space, nearly all of which isleased, that primarily supports our North America Retail segment. We own and lease a number of dedicated salesand administrative offices around the world, totaling approximately 3 million square feet. We have additionalwarehouse, distribution, and office space in our plant locations.
As part of our Häagen-Dazs business in our Europe & Australia and Asia & Latin America segments, we operate500 (all leased) and franchise 358 branded ice cream parlors in various countries around the world, all outside ofthe United States and Canada.
ITEM 3 - Legal Proceedings
We are the subject of various pending or threatened legal actions in the ordinary course of our business. All suchmatters are subject to many uncertainties and outcomes that are not predictable with assurance. In our opinion,there were no claims or litigation pending as of May 31, 2020, that were reasonably likely to have a materialadverse effect on our consolidated financial position or results of operations. See the information contained underthe section entitled “Environmental Matters” in Item 1 of this report for a discussion of environmental matters inwhich we are involved.
17

ITEM 4 - Mine Safety Disclosures
None.
PART II
ITEM 5 - Market for Registrant’s Common Equity, Related Stockholder Matters and Issuer Purchases ofEquity Securities
Our common stock is listed on the New York Stock Exchange under the symbol “GIS.” On June 15, 2020, therewere approximately 27,000 record holders of our common stock.
18

ITEM 6 - Selected Financial Data
The following table sets forth selected financial data for each of the fiscal years in the five-year period endedMay 31, 2020:
Fiscal Year
In Millions, Except Per Share Data,Percentages and Ratios 2020 (a) 2019 2018 2017 2016
Operating data:Net sales $ 17,626.6 $ 16,865.2 $ 15,740.4 $ 15,619.8 $ 16,563.1Gross margin (b) (d) 6,129.9 5,756.8 5,435.6 5,567.8 5,843.3Selling, general, and administrative
expenses (d) 3,151.6 2,935.8 2,850.1 2,888.8 3,141.4Operating profit (d) 2,953.9 2,515.9 2,419.9 2,492.1 2,719.1Net earnings attributable to General Mills 2,181.2 1,752.7 2,131.0 1,657.5 1,697.4Advertising and media expense 691.8 601.6 575.9 623.8 754.4Research and development expense 224.4 221.9 219.1 218.2 222.1Average shares outstanding:
Diluted 613.3 605.4 585.7 598.0 611.9Earnings per share:
Diluted $ 3.56 $ 2.90 $ 3.64 $ 2.77 $ 2.77Adjusted diluted (b) (c) $ 3.61 $ 3.22 $ 3.11 $ 3.08 $ 2.92
Operating ratios:Gross margin as a percentage of
net sales (d) 34.8% 34.1% 34.5% 35.6% 35.3%Selling, general, and administrative
expenses as a percentage ofnet sales (d) 17.9% 17.4% 18.1% 18.5% 19.0%
Operating profit as a percentage ofnet sales (d) 16.8% 14.9% 15.4% 16.0% 16.4%
Adjusted operating profit as a percentageof net sales (b) (c) (d) 17.3% 16.9% 16.6% 17.6% 16.8%
Effective income tax rate 18.5% 17.7% 2.7% 28.8% 31.4%Balance sheet data:Land, buildings, and equipment $ 3,580.6 $ 3,787.2 $ 4,047.2 $ 3,687.7 $ 3,743.6Total assets 30,806.7 30,111.2 30,624.0 21,812.6 21,712.3Long-term debt, excluding
current portion 10,929.0 11,624.8 12,668.7 7,642.9 7,057.7Total debt (b) 13,539.5 14,490.0 15,818.6 9,481.7 8,430.9Cash flow data:Net cash provided by
operating activities (e) $ 3,676.2 $ 2,807.0 $ 2,841.0 $ 2,415.2 $ 2,764.2Capital expenditures 460.8 537.6 622.7 684.4 729.3
Free cash flow (b) 3,215.4 2,269.4 2,218.3 1,730.8 2,034.9Share data:Cash dividends per common share $ 1.96 $ 1.96 $ 1.96 $ 1.92 $ 1.78
(a) Fiscal 2020 was a 53-week year; all other fiscal years were 52 weeks.(b) See “Glossary” in Item 8 of this report for definition.(c) See “Non-GAAP Measures” in Item 7 of this report for our discussion of this measure not defined by generally accepted accounting
principles.(d) In fiscal 2019, we retrospectively adopted new accounting requirements related to the presentation of net periodic defined benefit pension
expense, net periodic postretirement benefit expense, and net periodic postemployment benefit expense. Please see Note 2 to theConsolidated Financial Statements in Item 8 of this report.
(e) In fiscal 2018, we adopted new requirements for the accounting and presentation of stock-based payments. This resulted in thereclassification of realized windfall tax benefits and employee tax withholdings in our Consolidated Statements of Cash Flows. Please seeNote 2 to the Consolidated Financial Statements in Item 8 of this report.
19

ITEM 7 - Management’s Discussion and Analysis of Financial Condition and Results of Operations
EXECUTIVE OVERVIEW
We are a global packaged foods company. We develop distinctive value-added food products and market themunder unique brand names. We work continuously to improve our core products and to create new products thatmeet consumers’ evolving needs and preferences. In addition, we build the equity of our brands over time withstrong consumer-directed marketing, innovative new products, and effective merchandising. We believe ourbrand-building strategy is the key to winning and sustaining leading share positions in markets around the globe.
Our fundamental financial goal is to generate superior returns for our shareholders over the long term. Webelieve achieving that goal requires us to generate a consistent balance of net sales growth, margin expansion,cash conversion, and cash return to shareholders over time.
Fiscal 2020 was a year of significant challenge and change in the external environment, and we adapted andexecuted to deliver strong financial results while remaining focused on the health and safety of our employeesand our company purpose of making food the world loves. Prior to the outbreak of the COVID-19 pandemic, weexpected to meet or exceed each of our key fiscal 2020 financial targets. The virus outbreak had a profoundimpact on consumer demand across our major markets, including driving an unprecedented increase in demandfor food at home and a corresponding decrease in demand for away-from-home food, resulting from efforts toreduce virus transmission. After the onset of the pandemic, elevated at-home food demand accelerated net salesgrowth in the fourth quarter in the North America Retail segment, where a significant share of net sales comesfrom categories that were most impacted by at-home eating, including meals, baking, and cereal. The impact ofelevated at-home demand was less pronounced in the Europe & Australia segment, reflecting its lower proportionof net sales in those categories. The Pet segment experienced increased demand early in the fourth quarter fromstock-up purchasing, which partially unwound by the end of the quarter. Lower away-from-home food demandreduced growth for the Convenience Stores & Foodservice and Asia & Latin America segments. Consequently,our full-year results significantly exceeded our initial annual targets for organic net sales growth, constant-currency growth in adjusted operating profit and adjusted diluted earnings per share (EPS), and free cash flowconversion.
We delivered on the three key priorities we outlined at the beginning of fiscal 2020:
First, we accelerated our organic net sales growth rate compared to our fiscal 2019 performance, driven bystrong execution to meet elevated demand during the COVID-19 pandemic, healthy levels of innovation,and a significant increase in capabilities and brand-building investment. We experienced robust growth inorganic net sales in North America Retail, aided by our ability to meet the pandemic-related increase indemand for meals and baking categories during the fourth quarter, as well as consistently strong results inU.S. cereal and important improvements in U.S. snack bars and U.S. yogurt throughout the year. Weexceeded our organic net sales growth goal for our Pet segment, driven by a successful expansion of BLUEinto additional customer outlets and a significant increase in household penetration for the brand. Organicnet sales results in our Convenience Stores & Foodservice, Europe & Australia, and Asia & Latin Americasegments were below fiscal 2019 levels, due to a slow start to the year in each of those segments, as well asthe pandemic-related headwinds impacting Convenience Stores & Foodservice and Asia & Latin America inthe second half of the year.
20

Second, we maintained our strong adjusted operating profit margins. The combination of our continuedstrong levels of Holistic Margin Management (HMM) savings, volume growth, and positive net pricerealization and mix offset input cost inflation and increased investments in brand building and capabilities,resulting in significant growth in constant-currency adjusted operating profit and adjusted diluted EPS.
Third, we reduced our leverage. Our continued cash discipline delivered a significant reduction in coreworking capital and strong free cash flow conversion, resulting in reduced debt and an important decrease inour leverage ratio.
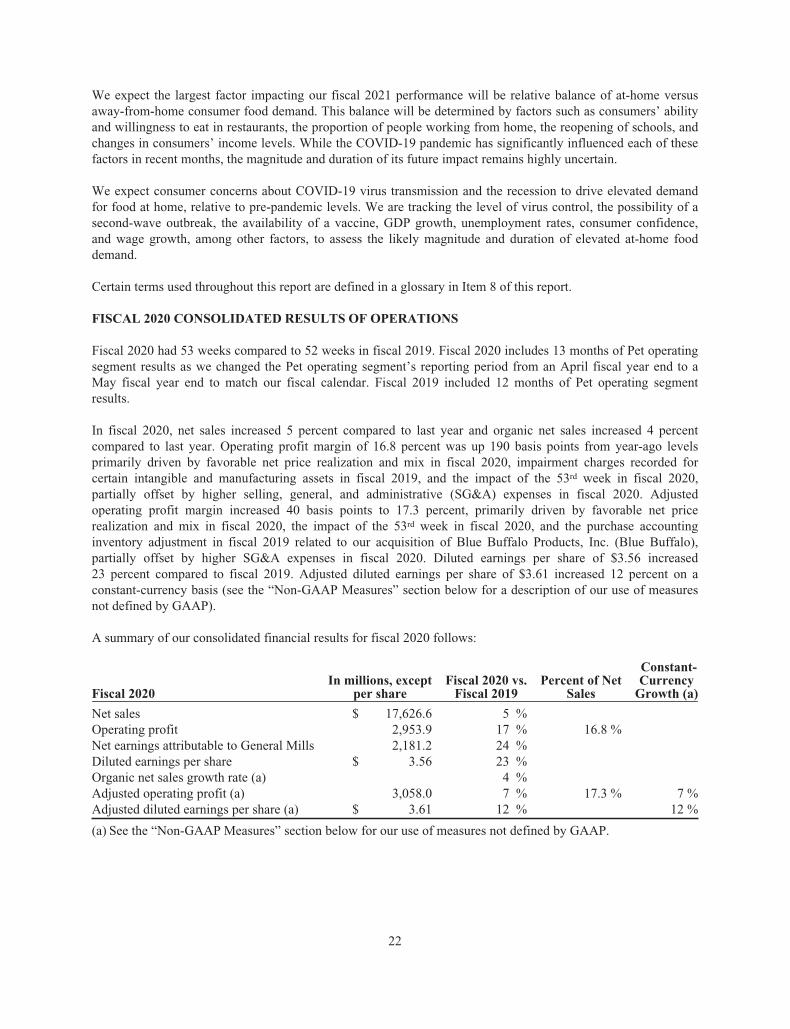
Our consolidated net sales for fiscal 2020 rose 5 percent to $17.6 billion. On an organic basis, net sales increased4 percent compared to year-ago levels. Operating profit of $3.0 billion increased 17 percent. Adjusted operatingprofit of $3.0 billion increased 7 percent on a constant-currency basis. Diluted EPS of $3.56 was up 23 percentcompared to fiscal 2019 results. Adjusted diluted EPS of $3.61 increased 12 percent on a constant-currency basis(See the “Non-GAAP Measures” section below for a description of our use of measures not defined by generallyaccepted accounting principles (GAAP)).
Net cash provided by operations totaled $3.7 billion in fiscal 2020 representing a conversion rate of 166 percentof net earnings, including earnings attributable to redeemable and noncontrolling interests. This cash generationsupported capital investments totaling $461 million, and our resulting free cash flow was $3.2 billion at aconversion rate of 143 percent of adjusted net earnings, including earnings attributable to redeemable andnoncontrolling interests. We also returned cash to shareholders through dividends totaling $1.2 billion andreduced total debt outstanding by $1.0 billion. Our ratio of net debt-to-operating cash flow was 3.2 in fiscal 2020,and our net debt-to-adjusted earnings before net interest, income taxes, depreciation and amortization (netdebt-to-adjusted EBITDA) ratio was 3.2, which was favorable to our fiscal 2020 target of 3.5 (See the“Non-GAAP Measures” section below for a description of our use of measures not defined by GAAP).
A detailed review of our fiscal 2020 performance compared to fiscal 2019 appears below in the section titled“Fiscal 2020 Consolidated Results of Operations.” A detailed review of our fiscal 2019 performance compared toour fiscal 2018 performance is set forth in Part II, Item 7 of our Form 10-K for the fiscal year ended May 26,2019 under the caption “Management’s Discussion and Analysis of Financial Condition and Results ofOperations – Fiscal 2019 Results of Consolidated Operations,” which is incorporated herein by reference.
We have outlined three key priorities for fiscal 2021 that we expect will allow us to generate competitiveperformance while continuing to advance our long-term goals:
1) Compete effectively, everywhere we play, leading to increased brand penetration, competitive servicelevels, strengthened customer partnerships, and market share gains in our key categories. We expect netsales growth in fiscal 2021 will be positively impacted by superior execution as well as elevatedat-home food demand, relative to the pre-pandemic period. We anticipate headwinds to fiscal 2021 netsales growth from comparisons against the 53rd week, the extra month of Pet segment results, and thepandemic-related increase in demand in the fourth quarter of fiscal 2020. Additionally, fiscal 2021 netsales growth may be negatively impacted by a potential reduction in consumers’ at-home foodinventory, which has been elevated during the pandemic.
2) Drive efficiency to fuel investment. We anticipate that the combination of benefits from our HMMinitiatives and volume leverage and headwinds from input cost inflation, increased investment in ourbrands and capabilities, higher costs to service elevated demand, and higher ongoing health and safety-related expenses will result in an adjusted operating profit margin that is approximately in line withfiscal 2020 levels.
3) Reduce leverage to increase financial flexibility. We expect to make further progress in fiscal 2021in reducing our net debt-to-adjusted EBITDA ratio.
21
We expect the largest factor impacting our fiscal 2021 performance will be relative balance of at-home versusaway-from-home consumer food demand. This balance will be determined by factors such as consumers’ abilityand willingness to eat in restaurants, the proportion of people working from home, the reopening of schools, andchanges in consumers’ income levels. While the COVID-19 pandemic has significantly influenced each of thesefactors in recent months, the magnitude and duration of its future impact remains highly uncertain.
We expect consumer concerns about COVID-19 virus transmission and the recession to drive elevated demandfor food at home, relative to pre-pandemic levels. We are tracking the level of virus control, the possibility of asecond-wave outbreak, the availability of a vaccine, GDP growth, unemployment rates, consumer confidence,and wage growth, among other factors, to assess the likely magnitude and duration of elevated at-home fooddemand.
Certain terms used throughout this report are defined in a glossary in Item 8 of this report.
FISCAL 2020 CONSOLIDATED RESULTS OF OPERATIONS
Fiscal 2020 had 53 weeks compared to 52 weeks in fiscal 2019. Fiscal 2020 includes 13 months of Pet operatingsegment results as we changed the Pet operating segment’s reporting period from an April fiscal year end to aMay fiscal year end to match our fiscal calendar. Fiscal 2019 included 12 months of Pet operating segmentresults.
In fiscal 2020, net sales increased 5 percent compared to last year and organic net sales increased 4 percentcompared to last year. Operating profit margin of 16.8 percent was up 190 basis points from year-ago levelsprimarily driven by favorable net price realization and mix in fiscal 2020, impairment charges recorded forcertain intangible and manufacturing assets in fiscal 2019, and the impact of the 53rd week in fiscal 2020,partially offset by higher selling, general, and administrative (SG&A) expenses in fiscal 2020. Adjustedoperating profit margin increased 40 basis points to 17.3 percent, primarily driven by favorable net pricerealization and mix in fiscal 2020, the impact of the 53rd week in fiscal 2020, and the purchase accountinginventory adjustment in fiscal 2019 related to our acquisition of Blue Buffalo Products, Inc. (Blue Buffalo),partially offset by higher SG&A expenses in fiscal 2020. Diluted earnings per share of $3.56 increased23 percent compared to fiscal 2019. Adjusted diluted earnings per share of $3.61 increased 12 percent on aconstant-currency basis (see the “Non-GAAP Measures” section below for a description of our use of measuresnot defined by GAAP).
A summary of our consolidated financial results for fiscal 2020 follows:
Fiscal 2020In millions, except
per shareFiscal 2020 vs.
Fiscal 2019Percent of Net
Sales
Constant-Currency
Growth (a)
Net sales $ 17,626.6 5 %Operating profit 2,953.9 17 % 16.8 %Net earnings attributable to General Mills 2,181.2 24 %Diluted earnings per share $ 3.56 23 %Organic net sales growth rate (a) 4 %Adjusted operating profit (a) 3,058.0 7 % 17.3 % 7 %Adjusted diluted earnings per share (a) $ 3.61 12 % 12 %
(a) See the “Non-GAAP Measures” section below for our use of measures not defined by GAAP.
22

Consolidated net sales were as follows:
Fiscal 2020Fiscal 2020 vs.
Fiscal 2019 Fiscal 2019
Net sales (in millions) $ 17,626.6 5 % $ 16,865.2
Contributions from volume growth (a) 4 ptsNet price realization and mix 2 ptsForeign currency exchange (1)pt
Note: Table may not foot due to rounding(a) Measured in tons based on the stated weight of our product shipments.
The 5 percent increase in net sales in fiscal 2020 reflects higher contributions from volume growth and favorablenet price realization and mix, partially offset by unfavorable foreign currency exchange. The 53rd week in fiscal2020 contributed 2 percentage points of net sales growth, reflecting 2 percentage points of growth from volume.The fiscal 2020 increase in net sales growth includes approximately 3 points of net sales growth due to theimpact of the COVID-19 pandemic.
Components of organic net sales growth are shown in the following table:
Fiscal 2020 vs. Fiscal 2019
Contributions from organic volume growth (a) 2 ptsOrganic net price realization and mix 2 pts
Organic net sales growth 4 ptsForeign currency exchange (1)ptDivestitures Flat53rd week 2 pts
Net sales growth 5 pts
Note: Table may not foot due to rounding(a) Measured in tons based on the stated weight of our product shipments.
Organic net sales in fiscal 2020 increased 4 percent compared to fiscal 2019, driven by increased contributionsfrom organic volume growth and favorable organic net price realization and mix. The increase in organic netsales growth includes approximately 3 points of organic net sales growth due to the impact of the COVID-19pandemic.
The disclosed impacts attributable to the COVID-19 pandemic on net sales and organic net sales were calculatedbased upon net sales in excess of our expectations prior to the net increase in demand resulting from theCOVID-19 pandemic. The impacts disclosed are approximate and reflect our best estimate of the impact of theCOVID-19 pandemic.
Cost of sales increased $388 million in fiscal 2020 to $11,497 million. The increase was primarily driven by a$397 million increase due to higher volume. In fiscal 2020, we recorded a $19 million charge related to a productrecall in our international Green Giant business, an $18 million increase in certain compensation and benefitsexpenses, and a $1 million increase attributable to product rate and mix. In fiscal 2019, we recorded a$53 million charge related to the fair value adjustment of inventory acquired in the Blue Buffalo acquisition. Werecorded a $25 million net increase in cost of sales related to mark-to-market valuation of certain commoditypositions and grain inventories in fiscal 2020 compared to a net increase of $36 million in fiscal 2019 (please seeNote 8 to the Consolidated Financial Statements in Item 8 of this report for additional information). In fiscal2020, we recorded $26 million of restructuring charges in cost of sales compared to $10 million in fiscal 2019.We also recorded $2 million of restructuring initiative project-related costs in cost of sales in fiscal 2020
23

compared to $1 million in fiscal 2019 (please see Note 4 to the Consolidated Financial Statements in Item 8 ofthis report for additional information).
Gross margin increased 6 percent in fiscal 2020 versus fiscal 2019. Gross margin as a percent of net salesincreased 70 basis points to 34.8 percent compared to fiscal 2019.
SG&A expenses increased $216 million to $3,152 million in fiscal 2020 compared to fiscal 2019. The increasein SG&A expenses primarily reflects increased compensation and benefits expenses and media and advertisingexpenses, partially offset by lower other consumer-related expenses. SG&A expenses as a percent of net sales infiscal 2020 increased 50 basis points compared to fiscal 2019.
Divestitures loss totaled $30 million in fiscal 2019 from the sale of our La Salteña fresh pasta and refrigerateddough business in Argentina and the sale of our yogurt business in China.
Restructuring, impairment, and other exit costs totaled $24 million in fiscal 2020 compared to $275 million infiscal 2019. We did not undertake any new restructuring actions in fiscal 2020. In fiscal 2019, we recorded$193 million of impairment charges related to certain brand intangible assets and a $15 million charge related tothe impairment of certain manufacturing assets in our North America Retail and Asia & Latin America segments.In fiscal 2019, we also recorded $80 million of restructuring charges related to actions to drive efficiencies intargeted areas of our global supply chain. Please see Note 4 to the Consolidated Financial Statements in Item 8 ofthis report for additional information.
Benefit plan non-service income totaled $113 million in fiscal 2020 compared to $88 million in fiscal 2019,primarily reflecting lower interest costs (please see Note 2 to the Consolidated Financial Statements in Item 8 ofthis report for additional information).
Interest, net for fiscal 2020 totaled $466 million, $56 million lower than fiscal 2019, primarily driven by loweraverage debt levels.
Our effective tax rate for fiscal 2020 was 18.5 percent compared to 17.7 percent in fiscal 2019. The 0.8percentage point increase was primarily due to certain nonrecurring discrete tax benefits in fiscal 2019, partiallyoffset by the benefit from the reorganization of certain wholly-owned subsidiaries and favorable changes inearnings mix by jurisdiction in fiscal 2020. Our adjusted effective tax rate was 20.7 percent in fiscal 2020compared to 21.8 percent in fiscal 2019 (see the “Non-GAAP Measures” section below for a description of ouruse of measures not defined by GAAP).
After-tax earnings from joint ventures increased 27 percent to $91 million in fiscal 2020 compared to fiscal2019, primarily driven by higher net sales at CPW partially reflecting the impact of the COVID-19 pandemic inthe month of March and our share of lower after-tax restructuring charges compared to fiscal 2019. On aconstant-currency basis, after-tax earnings from joint ventures increased 31 percent (see the “Non-GAAPMeasures” section below for a description of our use of measures not defined by GAAP). The components of ourjoint ventures’ net sales growth are shown in the following table:
Fiscal 2020 vs. Fiscal 2019 CPW HDJ Total
Contributions from volume growth (a) 2 pts (11) ptsNet price realization and mix 3 pts 7 pts
Net sales growth in constant currency 4 pts (4) pts 3 ptsForeign currency exchange (4) pts 3 pts (3) pts
Net sales growth Flat (1) pt Flat
Note: Table may not foot due to rounding(a) Measured in tons based on the stated weight of our product shipments
24

Average diluted shares outstanding increased by 8 million in fiscal 2020 from fiscal 2019 due to optionexercises.
RESULTS OF SEGMENT OPERATIONS
Our businesses are organized into five operating segments: North America Retail; Convenience Stores &Foodservice; Europe & Australia; Asia & Latin America; and Pet. Fiscal 2020 includes 13 months of Petoperating segment results as we changed the Pet operating segment’s reporting period from an April fiscal yearend to a May fiscal year end to match our fiscal calendar. Fiscal 2019 included 12 months of results.
The following tables provide the dollar amount and percentage of net sales and operating profit from eachsegment for fiscal 2020 and fiscal 2019:
Fiscal Year
2020 2019
In Millions DollarsPercent of
Total DollarsPercent of
Total
Net SalesNorth America Retail $ 10,750.5 61% $ 9,925.2 59%Europe & Australia 1,838.9 10 1,886.7 11Convenience Stores & Foodservice 1,816.4 10 1,969.1 12Pet 1,694.6 10 1,430.9 8Asia & Latin America 1,526.2 9 1,653.3 10
Total $ 17,626.6 100% $ 16,865.2 100%
Segment Operating ProfitNorth America Retail $ 2,627.0 75% $ 2,277.2 72%Europe & Australia 113.8 3 123.3 4Convenience Stores & Foodservice 337.2 10 419.5 13Pet 390.7 11 268.4 9Asia & Latin America 18.7 1 72.4 2
Total $ 3,487.4 100% $ 3,160.8 100%
Segment operating profit as reviewed by our executive management excludes unallocated corporate items, netgain/loss on divestitures, and restructuring, impairment, and other exit costs that are centrally managed.
NORTH AMERICA RETAIL SEGMENT
Our North America Retail operating segment reflects business with a wide variety of grocery stores, massmerchandisers, membership stores, natural food chains, drug, dollar and discount chains, and e-commercegrocery providers. Our product categories in this business segment are ready-to-eat cereals, refrigerated yogurt,soup, meal kits, refrigerated and frozen dough products, dessert and baking mixes, frozen pizza and pizza snacks,snack bars, fruit snacks, savory snacks, and a wide variety of organic products including ready-to-eat cereal,frozen and shelf-stable vegetables, meal kits, fruit snacks, snack bars, and refrigerated yogurt.
25

North America Retail net sales were as follows:
Fiscal2020
Fiscal2020 vs. 2019
Percentage ChangeFiscal2019
Net sales (in millions) $10,750.5 8 % $ 9,925.2
Contributions from volume growth (a) 10 ptsNet price realization and mix (1) ptForeign currency exchange Flat
Note: Table may not foot due to rounding.(a) Measured in tons based on the stated weight of our product shipments.
The 8 percent increase in North America Retail net sales for fiscal 2020 was primarily driven by the impact ofthe COVID-19 pandemic. The increase in net sales includes an increase in contributions from volume growth,including 2 percentage points resulting from the 53rd week, partially offset by unfavorable net price realizationand mix.
The components of North America Retail organic net sales growth are shown in the following table:
Fiscal2020 vs. 2019
Percentage Change
Contributions from organic volume growth (a) 8 ptsOrganic net price realization and mix (1) pt
Organic net sales growth 6 ptsForeign currency exchange Flat53rd week 2 pts
Net sales growth 8 pts
Note: Table may not foot due to rounding.(a) Measured in tons based on the stated weight of our product shipments.
North America Retail organic net sales increased 6 percent in fiscal 2020 compared to fiscal 2019, primarilydriven by the impact of the COVID-19 pandemic. The increase in organic net sales includes an increase incontributions from organic volume growth, partially offset by unfavorable organic net price realization and mix.
Net sales for our North America Retail operating units are shown in the following table:
In MillionsFiscal2020
Fiscal2020 vs. 2019
Percentage ChangeFiscal2019
U.S. Meals & Baking $ 4,408.5 15% $ 3,839.8U.S. Cereal 2,434.1 8% 2,255.4U.S. Snacks 2,091.9 2% 2,060.9U.S. Yogurt and other 919.0 1% 906.7Canada (a) 897.0 4% 862.4
Total $ 10,750.5 8% $ 9,925.2
(a) On a constant currency basis, Canada operating unit net sales increased 5 percent in fiscal 2020. See the“Non-GAAP Measures” section below for our use of this measure not defined by GAAP.
Segment operating profit increased 15 percent to $2,627 million in fiscal 2020, compared to $2,277 million infiscal 2019, primarily driven by higher contributions from volume growth and the impact of the 53rd week in
26

fiscal 2020. Segment operating profit increased 15 percent on a constant-currency basis in fiscal 2020 comparedto fiscal 2019 (see the “Non-GAAP Measures” section below for our use of this measure not defined by GAAP).
EUROPE & AUSTRALIA SEGMENT
Our Europe & Australia operating segment reflects retail and foodservice businesses in the greater Europe andAustralia regions. Our product categories include refrigerated yogurt, meal kits, snack bars, super-premium icecream, refrigerated and frozen dough products, shelf stable vegetables, and dessert and baking mixes. Revenuesfrom franchise fees are reported in the region or country where the franchisee is located.
Europe & Australia net sales were as follows:
Fiscal2020
Fiscal2020 vs. 2019
Percentage ChangeFiscal2019
Net sales (in millions) $ 1,838.9 (3)% $ 1,886.7
Contributions from volume growth (a) FlatNet price realization and mix 1 ptForeign currency exchange (3)pts
Note: Table may not foot due to rounding.(a) Measured in tons based on the stated weight of our product shipments.
The 3 percent decrease in Europe & Australia net sales in fiscal 2020 was driven by unfavorable foreign currencyexchange, partially offset by favorable net price realization and mix. Fiscal 2020 net sales includes growth fromthe impact of the COVID-19 pandemic.
The components of Europe & Australia organic net sales growth are shown in the following table:
Fiscal2020 vs. 2019
Percentage Change
Contributions from organic volume growth (a) (2)ptsOrganic net price realization and mix 1 pt
Organic net sales growth (1)ptForeign currency exchange (3)pts53rd week 2 pts
Net sales growth (3)pts
Note: Table may not foot due to rounding(a) Measured in tons based on the stated weight of our product shipments.
The 1 percent decrease in Europe & Australia organic net sales growth in fiscal 2020 was driven by a decrease incontributions from organic volume growth, partially offset by favorable organic net price realization and mix.Fiscal 2020 organic net sales includes growth from the impact of the COVID-19 pandemic.
Segment operating profit decreased 8 percent to $114 million in fiscal 2020 compared to fiscal 2019, primarily drivenby higher input costs and lower contributions from volume growth, partially offset by favorable net price realizationand mix. Segment operating profit decreased 3 percent on a constant-currency basis in fiscal 2020 compared to fiscal2019 (see the “Non-GAAP Measures” section below for our use of this measure not defined by GAAP).
CONVENIENCE STORES & FOODSERVICE SEGMENT
Our major product categories in our Convenience Stores & Foodservice operating segment are ready-to-eatcereals, snacks, refrigerated yogurt, frozen meals, unbaked and fully baked frozen dough products, baking mixes,
27

and bakery flour. Many products we sell are branded to the consumer and nearly all are branded to ourcustomers. We sell to distributors and operators in many customer channels including foodservice, conveniencestores, vending, and supermarket bakeries in the United States.
Convenience Stores & Foodservice net sales were as follows:
Fiscal2020
Fiscal2020 vs. 2019
Percentage ChangeFiscal2019
Net sales (in millions) $ 1,816.4 (8) % $ 1,969.1
Contributions from volume growth (a) (6)ptsNet price realization and mix (2)pts
Note: Table may not foot due to rounding.(a) Measured in tons based on the stated weight of our product shipments.
Convenience Stores & Foodservice net sales decreased 8 percent in fiscal 2020 primarily driven by the impact ofthe COVID-19 pandemic on away-from-home channels. The decrease in net sales includes a decrease incontributions from volume growth and unfavorable net price realization and mix.
The components of Convenience Stores & Foodservice organic net sales growth are shown in the followingtable:
Fiscal2020 vs. 2019
Percentage Change
Contributions from organic volume growth (a) (7) ptsOrganic net price realization and mix (2) pts
Organic net sales growth (9) pts53rd week 1 pt
Net sales growth (8) pts
Note: Table may not foot due to rounding.(a) Measured in tons based on the stated weight of our product shipments.
The 9 percent decrease in Convenience Stores & Foodservice organic net sales growth in fiscal 2020 wasprimarily driven by the impact of the COVID-19 pandemic. The decrease in organic net sales growth includes adecrease in contributions from organic volume growth and unfavorable organic net price realization and mix.
Segment operating profit decreased 20 percent to $337 million in fiscal 2020, compared to $420 million in fiscal2019, primarily driven by lower contributions from volume growth and unfavorable net price realization andmix.
PET SEGMENT
Our Pet operating segment includes pet food products sold primarily in the United States in national petsuperstore chains, e-commerce retailers, grocery stores, regional pet store chains, mass merchandisers, andveterinary clinics and hospitals. Our product categories include dog and cat food (dry foods, wet foods, andtreats) made with whole meats, fruits, and vegetables and other high-quality natural ingredients. Our tailored petproduct offerings address specific dietary, lifestyle, and life-stage needs and span different product types, diettypes, breed sizes for dogs, lifestages, flavors, product functions and textures, and cuts for wet foods.
Fiscal 2020 includes 13 months of Pet operating segment results as we changed the Pet operating segment’sreporting period from an April fiscal year end to a May fiscal year end to match our fiscal calendar. Fiscal 2019included 12 months of results.
28

Pet net sales were as follows:
Fiscal2020
Fiscal2020 vs. 2019
Percentage ChangeFiscal2019
Net sales (in millions) $ 1,694.6 18 % $ 1,430.9
Contributions from volume growth (a) 17 ptsNet price realization and mix 2 pts
Note: Table may not foot due to rounding.(a) Measured in tons based on the stated weight of our product shipments.
Pet net sales increased 18 percent in fiscal 2020 compared to fiscal 2019, driven by an increase in contributionsfrom volume growth, including the impact of an extra month in the period, and favorable net price realization andmix. Fiscal 2020 net sales includes growth from the impact of the COVID-19 pandemic.
The components of Pet organic net sales growth are shown in the following table:
Fiscal2020 vs. 2019
Percentage Change
Contributions from organic volume growth (a) 17 ptsOrganic net price realization and mix 2 pts
Organic net sales growth 18 pts
Net sales growth 18 pts
Note: Table may not foot due to rounding.(a) Measured in tons based on the stated weight of our product shipments.
The 18 percent increase in Pet organic net sales growth in fiscal 2020 was driven by an increase in contributionsfrom organic volume growth, including the impact of an extra month in the period, and favorable organic netprice realization and mix. Fiscal 2020 organic net sales includes growth from the impact of the COVID-19pandemic.
Pet operating profit increased 46 percent to $391 million in fiscal 2020, compared to $268 million in fiscal 2019,primarily driven by a $53 million purchase accounting adjustment related to inventory acquired in fiscal 2019, anincrease in contributions from volume growth, favorable net price realization and mix, and the impact of an extramonth in the period, partially offset by higher SG&A expenses.
ASIA & LATIN AMERICA SEGMENT
Our Asia & Latin America operating segment consists of retail and foodservice businesses in the greater Asiaand South America regions. Our product categories include super-premium ice cream and frozen desserts, mealkits, dessert and baking mixes, snack bars, salty snacks, refrigerated and frozen dough products, and wellnessbeverages. We also sell super-premium ice cream and frozen desserts directly to consumers through owned retailshops. Our Asia & Latin America segment also includes products manufactured in the United States for export,mainly to Caribbean and Latin American markets, as well as products we manufacture for sale to ourinternational joint ventures. Revenues from export activities and franchise fees are reported in the region orcountry where the end customer or franchisee is located.
29

Asia & Latin America net sales were as follows:
Fiscal2020
Fiscal2020 vs. 2019
Percentage ChangeFiscal2019
Net sales (in millions) $ 1,526.2 (8) % $ 1,653.3
Contributions from volume growth (a) (2)ptsNet price realization and mix (1)ptForeign currency exchange (4)pts
Note: Table may not foot due to rounding.(a) Measured in tons based on the stated weight of our product shipments.
Asia & Latin America net sales decreased 8 percent in fiscal 2020 compared to fiscal 2019, primarily driven bythe impact of the COVID-19 pandemic. The decrease in net sales includes unfavorable foreign currencyexchange, a decrease in contributions from volume growth, and unfavorable net price realization and mix.
The components of Asia & Latin America organic net sales growth are shown in the following table:
Fiscal2020 vs. 2019
Percentage Change
Contributions from organic volume growth (a) (1)ptOrganic net price realization and mix (1)pt
Organic net sales growth (2)ptsForeign currency exchange (4)ptsDivestitures (b) (3)pts53rd week 2 pts
Net sales growth (8)pts
Note: Table may not foot due to rounding.(a) Measured in tons based on the stated weight of our product shipments.(b) Impact of the divestiture of our La Salteña business in Argentina and our Yoplait business in China.
The 2 percent decrease in Asia & Latin America organic net sales in fiscal 2020 was primarily driven by theimpact of the COVID-19 pandemic. The decrease in organic net sales growth includes unfavorable organic netprice realization and mix and a decrease in contributions from organic volume growth.
Segment operating profit decreased 74 percent to $19 million in fiscal 2020, compared to $72 million in fiscal2019, primarily driven by an increase in input costs and lower contributions from volume growth. Segmentoperating profit decreased 73 percent on a constant-currency basis in fiscal 2020 compared to fiscal 2019 (see the“Non-GAAP Measures” section below for our use of this measure not defined by GAAP).
UNALLOCATED CORPORATE ITEMS
Unallocated corporate items include corporate overhead expenses, variances to planned domestic employeebenefits and incentives, contributions to the General Mills Foundation, asset and liability remeasurement impactof hyperinflationary economies, restructuring initiative project-related costs, and other items that are not part ofour measurement of segment operating performance. This includes gains and losses from the mark-to-marketvaluation of certain commodity positions until passed back to our operating segments in accordance with ourpolicy as discussed in Note 8 to the Consolidated Financial Statements in Item 8 of this report.
In fiscal 2020, unallocated corporate expense increased $169 million to $509 million compared to $340 millionlast year, primarily driven by compensation and benefits expenses. In fiscal 2020, we recorded a $25 million net
30

increase in expense related to mark-to-market valuation of certain commodity positions and grain inventoriescompared to a $36 million net increase in expense in the prior year. In addition, we recorded $26 million ofrestructuring charges, and $2 million of restructuring initiative project-related costs in cost of sales in fiscal 2020,compared to $10 million of restructuring charges and $1 million of restructuring initiative project-related costs incost of sales in fiscal 2019. We also recorded a $19 million charge related to a product recall in our internationalGreen Giant business in fiscal 2020. In fiscal 2020, we recorded $8 million of net losses related to certaininvestment valuation adjustments and the loss on sale of certain corporate investments, compared to $23 millionof gains in fiscal 2019. In fiscal 2019, we recorded a $16 million gain from a legal recovery related to ourYoplait SAS subsidiary and $26 million of integration costs related to our acquisition of Blue Buffalo. Inaddition, we recorded a $3 million loss related to the impact of hyperinflationary accounting for our Argentinasubsidiary in fiscal 2019.
IMPACT OF INFLATION
We experienced input cost inflation of 4 percent in fiscal 2020 and 4 percent in fiscal 2019, primarily oncommodity inputs. We expect input cost inflation of approximately 3 percent in fiscal 2021. We attempt tominimize the effects of inflation through HMM, planning, and operating practices. Our risk managementpractices are discussed in Item 7A of this report.
LIQUIDITY
The primary source of our liquidity is cash flow from operations. Over the most recent two-year period, ouroperations have generated $6.5 billion in cash. A substantial portion of this operating cash flow has been returnedto shareholders through dividends. We also use cash from operations to fund our capital expenditures andacquisitions. We typically use a combination of cash, notes payable, and long-term debt, and occasionally issueshares of common stock, to finance significant acquisitions. Our sources of liquidity were not materiallyimpacted from the COVID-19 pandemic.
As of May 31, 2020, we had $566 million of cash and cash equivalents held in foreign jurisdictions. As a resultof the Tax Cuts and Jobs Act (TCJA), the historic undistributed earnings of our foreign subsidiaries were taxed inthe U.S. via the one-time repatriation tax in fiscal 2018. We have re-evaluated our assertion and have concludedthat although earnings prior to fiscal 2018 will remain permanently reinvested, we will no longer make apermanent reinvestment assertion beginning with our fiscal 2018 earnings. As part of the accounting for theTCJA, we recorded local country withholding taxes related to certain entities from which we began repatriatingundistributed earnings and will continue to record local country withholding taxes on all future earnings. As aresult of the transition tax, we may repatriate our cash and cash equivalents held by our foreign subsidiarieswithout such funds being subject to further U.S. income tax liability.
31

Cash Flows from Operations
Fiscal Year
In Millions 2020 2019
Net earnings, including earnings attributable to redeemable andnoncontrolling interests $ 2,210.8 $ 1,786.2
Depreciation and amortization 594.7 620.1After-tax earnings from joint ventures (91.1) (72.0)Distributions of earnings from joint ventures 76.5 86.7Stock-based compensation 94.9 84.9Deferred income taxes (29.6) 93.5Pension and other postretirement benefit plan contributions (31.1) (28.8)Pension and other postretirement benefit plan costs (32.3) 6.1Divestitures loss - 30.0Restructuring, impairment, and other exit costs 43.6 235.7Changes in current assets and liabilities, excluding the effects of
acquisitions and divestitures 793.9 (7.5)Other, net 45.9 (27.9)
Net cash provided by operating activities $ 3,676.2 $ 2,807.0
During fiscal 2020, cash provided by operations was $3,676 million compared to $2,807 million in the sameperiod last year. The $869 million increase was primarily driven by an $801 million change in current assets andliabilities and a $425 million increase in net earnings, partially offset by a $192 million change in non-cashrestructuring, impairment, and other exit costs and a $123 million change in deferred income taxes. The$801 million change in current assets and liabilities was primarily driven by a $233 million change in othercurrent liabilities, primarily driven by changes in income taxes payable, trade and advertising accruals, andincentive accruals, a $230 million change in accounts payable as a result of increased spending on raw materialsand packaging as well as the continued extension of payment terms, and a $208 million change in prepaid andother current assets, primarily driven by the timing of certain tax payments and receipts.
We strive to grow core working capital at or below the rate of growth in our net sales. For fiscal 2020, coreworking capital decreased $591 million, compared to a net sales increase of 5 percent, primarily driven by theincrease in accounts payable and lower inventory balances. In fiscal 2019, core working capital decreased$195 million, compared to a net sales increase of 7 percent.
Cash Flows from Investing Activities
Fiscal Year
In Millions 2020 2019
Purchases of land, buildings, and equipment $ (460.8) $ (537.6)Investments in affiliates, net (48.0) 0.1Proceeds from disposal of land, buildings, and equipment 1.7 14.3Proceeds from divestitures - 26.4Other, net 20.9 (59.7)
Net cash used by investing activities $ (486.2) $ (556.5)
In fiscal 2020, we used $486 million of cash through investing activities compared to $556 million in fiscal 2019.We invested $461 million in land, buildings, and equipment in fiscal 2020, $77 million less than fiscal 2019.
We expect capital expenditures to be approximately 3.5 percent of reported net sales in fiscal 2021. Theseexpenditures will fund initiatives that are expected to fuel growth, support innovative products, and continueHMM initiatives throughout the supply chain.
32

Cash Flows from Financing Activities
Fiscal Year
In Millions 2020 2019
Change in notes payable $ (1,158.6) $ (66.3)Issuance of long-term debt 1,638.1 339.1Payment of long-term debt (1,396.7) (1,493.8)Proceeds from common stock issued on exercised options 263.4 241.4Purchases of common stock for treasury (3.4) (1.1)Dividends paid (1,195.8) (1,181.7)Investments in redeemable interest - 55.7Distributions to redeemable and noncontrolling interest holders (72.5) (38.5)Other, net (16.0) (31.2)
Net cash used by financing activities $ (1,941.5) $ (2,176.4)
Financing activities used $1.9 billion of cash in fiscal 2020 compared to $2.2 billion in fiscal 2019. We had$917 million of net debt repayments in fiscal 2020 compared to $1.2 billion of net debt repayments in fiscal2019. For more information on our debt issuances and payments, please refer to Note 9 to the ConsolidatedFinancial Statements in Item 8 of this report.
During fiscal 2020, we received $263 million of net proceeds from common stock issued on exercised optionscompared to $241 million in fiscal 2019.
Share repurchases in fiscal 2020 and 2019 were insignificant.
Dividends paid in fiscal 2020 totaled $1,196 million, or $1.96 per share, consistent with fiscal 2019.
Selected Cash Flows from Joint Ventures
Selected cash flows from our joint ventures are set forth in the following table:
Fiscal Year
Inflow (Outflow), in Millions 2020 2019
Investments in affiliates, net $ (48.0) $ (0.1)Dividends received 76.5 86.7
CAPITAL RESOURCES
Total capital consisted of the following:
In MillionsMay 31,
2020May 26,
2019
Notes payable $ 279.0 $ 1,468.7Current portion of long-term debt 2,331.5 1,396.5Long-term debt 10,929.0 11,624.8
Total debt 13,539.5 14,490.0Redeemable interest 544.6 551.7Noncontrolling interests 291.0 313.2Stockholders’ equity 8,058.5 7,054.5
Total capital $ 22,433.6 $ 22,409.4
33

The following table details the fee-paid committed and uncommitted credit lines we had available as of May 31,2020:
In BillionsFacilityAmount
BorrowedAmount
Credit facility expiring:May 2022 $ 2.7 $ -September 2022 0.2 -
Total committed credit facilities 2.9 -Uncommitted credit facilities 0.6 0.2
Total committed and uncommittedcredit facilities $ 3.5 $ 0.2
To ensure availability of funds, we maintain bank credit lines and have commercial paper programs available tous in the United States and Europe. In response to uncertainty surrounding the availability and cost ofcommercial paper borrowings as a result of the COVID-19 pandemic, we issued $750 million of fixed-rate notesin April 2020 and reduced our borrowings under commercial paper programs. As the COVID-19 pandemicevolves, we will continue to evaluate its impact to our sources of liquidity. We also have uncommitted and asset-backed credit lines that support our foreign operations.
Certain of our long-term debt agreements, our credit facilities, and our noncontrolling interests contain restrictivecovenants. As of May 31, 2020, we were in compliance with all of these covenants.
We have $2,332 million of long-term debt maturing in the next 12 months that is classified as current, including$100 million of 6.61 percent medium-term notes due for remarketing in October 2020, €500 million of2.1 percent notes due November 2020, €200 million of 0.0 percent notes due November 2020, $4 million offloating-rate medium term notes due for remarketing in November 2020, $850 million of floating-rate notes dueApril 2021, and $600 million of 3.2 percent notes due April 2021. We believe that cash flows from operations,together with available short- and long-term debt financing, will be adequate to meet our liquidity and capitalneeds for at least the next 12 months.
As of May 31, 2020, our total debt, including the impact of derivative instruments designated as hedges, was87 percent in fixed-rate and 13 percent in floating-rate instruments, compared to 74 percent in fixed-rate and26 percent in floating-rate instruments on May 26, 2019.
Our net debt to operating cash flow ratio declined to 3.2 in fiscal 2020 from 5.0 in fiscal 2019, primarily drivenby an increase in cash provided by operations. Our net debt-to-adjusted EBITDA ratio declined to 3.2 in fiscal2020 from 3.9 in fiscal 2019, consistent with our plans to reduce our leverage following our acquisition of BlueBuffalo (see the “Non-GAAP Measures” section below for our use of this measure not defined by GAAP).
We have a 51 percent controlling interest in Yoplait SAS and a 50 percent interest in Yoplait Marques SNC andLiberté Marques Sàrl. Sodiaal International (Sodiaal) holds the remaining interests in each of these entities. Weconsolidate these entities into our consolidated financial statements. We record Sodiaal’s 50 percent interest inYoplait Marques SNC and Liberté Marques Sàrl as noncontrolling interests, and its 49 percent interest in YoplaitSAS as a redeemable interest on our Consolidated Balance Sheets. These euro- and Canadian dollar-denominatedinterests are reported in U.S. dollars on our Consolidated Balance Sheets. Sodiaal has the ability to put all or aportion of its redeemable interest to us at fair value once per year, up to three times before December 2024. As ofMay 31, 2020, the redemption value of the redeemable interest was $545 million which approximates its fairvalue.
34

During fiscal 2019, Sodiaal invested $56 million in Yoplait SAS.
The third-party holder of the General Mills Cereals, LLC (GMC) Class A Interests receives quarterly preferreddistributions from available net income based on the application of a floating preferred return rate to the holder’scapital account balance established in the most recent mark-to-market valuation (currently $252 million). OnJune 1, 2018, the floating preferred return rate on GMC’s Class A Interests was reset to the sum of three-monthLIBOR plus 142.5 basis points. The preferred return rate is adjusted every three years through a negotiatedagreement with the Class A Interest holder or through a remarketing auction.
We have an option to purchase the Class A Interests for consideration equal to the then current capital accountvalue, plus any unpaid preferred return and the prescribed make-whole amount. If we purchase these interests,any change in the third-party holder’s capital account from its original value will be charged directly to retainedearnings and will increase or decrease the net earnings used to calculate EPS in that period.
OFF-BALANCE SHEET ARRANGEMENTS AND CONTRACTUAL OBLIGATIONS
As of May 31, 2020, we have issued guarantees and comfort letters of $130 million for the debt and otherobligations of non-consolidated affiliates, mainly CPW. In addition, off-balance sheet arrangements were notmaterial as of May 31, 2020.
As of May 31, 2020, we invested in three variable interest entities (VIEs). None of our VIEs are material to ourresults of operations, financial condition, or liquidity as of and for the fiscal year ended May 31, 2020.
Our defined benefit plans in the United States are subject to the requirements of the Pension Protection Act(PPA). In the future, the PPA may require us to make additional contributions to our domestic plans. We do notexpect to be required to make any contributions in fiscal 2021.
35

The following table summarizes our future estimated cash payments under existing contractual obligations,including payments due by period:
Payments Due by Fiscal Year
In Millions Total 20212022 -2023
2024 -2025
2026 andThereafter
Long-term debt (a) $ 13,318.5 $ 2,331.3 $ 2,277.1 $ 2,550.0 $ 6,160.1Accrued interest 92.8 92.8 - - -Operating leases (b) 412.5 115.4 171.5 91.9 33.7Finance leases (b) 0.2 0.1 0.1 - -Purchase obligations (c) 2,548.8 2,271.7 191.7 57.3 28.1
Total contractual obligations 16,372.8 4,811.3 2,640.4 2,699.2 6,221.9Other long-term obligations (d) 1,167.1 - - - -
Total long-term obligations $ 17,539.9 $ 4,811.3 $ 2,640.4 $ 2,699.2 $ 6,221.9
(a) Amounts represent the expected cash payments of our long-term debt and do not include $0.2 million forfinance leases or $58.4 million for net unamortized debt issuance costs, premiums and discounts, and fairvalue adjustments.
(b) See Note 7 to the Consolidated Financial Statements in Item 8 of this report for more information on our leasearrangements.
(c) The majority of the purchase obligations represent commitments for raw material and packaging to be utilizedin the normal course of business and for consumer marketing spending commitments that support our brands.For purposes of this table, arrangements are considered purchase obligations if a contract specifies allsignificant terms, including fixed or minimum quantities to be purchased, a pricing structure, and approximatetiming of the transaction. Most arrangements are cancelable without a significant penalty and with shortnotice (usually 30 days). Any amounts reflected on the Consolidated Balance Sheets as accounts payable andaccrued liabilities are excluded from the table above.
(d) The fair value of our foreign exchange, equity, commodity, and grain derivative contracts with a payableposition to the counterparty was $43.1 million as of May 31, 2020, based on fair market values as of that date.Future changes in market values will impact the amount of cash ultimately paid or received to settle thoseinstruments in the future. Other long-term obligations mainly consist of liabilities for accrued compensationand benefits, including the underfunded status of certain of our defined benefit pension, other postretirementbenefit, and postemployment benefit plans, and miscellaneous liabilities. We expect to pay approximately$24 million of benefits from our unfunded postemployment benefit plans and approximately $21 million ofdeferred compensation in fiscal 2021. We are unable to reliably estimate the amount of these paymentsbeyond fiscal 2021. As of May 31, 2020, our total liability for uncertain tax positions and accrued interest andpenalties was $175.8 million.
SIGNIFICANT ACCOUNTING ESTIMATES
For a complete description of our significant accounting policies, please see Note 2 to the Consolidated FinancialStatements in Item 8 of this report. Our significant accounting estimates are those that have a meaningful impacton the reporting of our financial condition and results of operations. These estimates include our accounting forrevenue recognition, valuation of long-lived assets, intangible assets, redeemable interest, stock-basedcompensation, income taxes, and defined benefit pension, other postretirement benefit, and postemploymentbenefit plans.
Considerations related to the COVID-19 pandemic
The impact that the recent COVID-19 pandemic will have on our consolidated results of operations is uncertain.We saw increased orders from retail customers across all geographies in response to increased consumer demandfor food at home. We also experienced a COVID-19-related decrease in consumer traffic in away-from-homefood outlets during the third and fourth quarters of fiscal 2020. Near-term elevated retail customer orders may
36

unwind in the coming months, and we are unable to predict the nature and timing of when that impact may occur,if at all. We have considered the potential impacts of the COVID-19 pandemic in our significant accountingestimates as of May 31, 2020, and will continue to evaluate the nature and extent of the impact to our businessand consolidated results of operations.
Revenue Recognition
Our revenues are reported net of variable consideration and consideration payable to our customers, includingtrade promotion, consumer coupon redemption and other reductions to the transaction price, including estimatedallowances for returns, unsalable product, and prompt pay discounts. Trade promotions are recorded usingsignificant judgment of estimated participation and performance levels for offered programs at the time of sale.Differences between the estimated and actual reduction to the transaction price is recognized as a change inestimate in a subsequent period. Our accrued trade and coupon promotion liabilities were $471 million as ofMay 31, 2020, and $410 million as of May 26, 2019. Because these amounts are significant, if our estimates areinaccurate we would have to make adjustments in subsequent periods that could have a significant effect on ourresults of operations.
Valuation of Long-Lived Assets
We estimate the useful lives of long-lived assets and make estimates concerning undiscounted cash flows toreview for impairment whenever events or changes in circumstances indicate that the carrying amount of an asset(or asset group) may not be recoverable. Fair value is measured using discounted cash flows or independentappraisals, as appropriate.
Intangible Assets
Goodwill and other indefinite-lived intangible assets are not subject to amortization and are tested for impairmentannually and whenever events or changes in circumstances indicate that impairment may have occurred. Ourestimates of fair value for goodwill impairment testing are determined based on a discounted cash flow model.We use inputs from our long-range planning process to determine growth rates for sales and profits. We alsomake estimates of discount rates, perpetuity growth assumptions, market comparables, and other factors.
We evaluate the useful lives of our other intangible assets, mainly brands, to determine if they are finite orindefinite-lived. Reaching a determination on useful life requires significant judgments and assumptionsregarding the future effects of obsolescence, demand, competition, other economic factors (such as the stabilityof the industry, known technological advances, legislative action that results in an uncertain or changingregulatory environment, and expected changes in distribution channels), the level of required maintenanceexpenditures, and the expected lives of other related groups of assets. Intangible assets that are deemed to havefinite lives are amortized on a straight-line basis over their useful lives, generally ranging from 4 to 30 years. Ourestimate of the fair value of our brand assets is based on a discounted cash flow model using inputs whichinclude projected revenues from our long-range plan, assumed royalty rates that could be payable if we did notown the brands, and a discount rate.
As of May 31, 2020, we had $20 billion of goodwill and indefinite-lived intangible assets. We assessed ourgoodwill and brand intangible assets for potential impairment indicators using quantitative and qualitativefactors, including the estimated impacts of the COVID-19 pandemic, as of May 31, 2020, and concluded that noimpairment indicators were present as of that date. While we currently believe that the fair value of eachintangible exceeds its carrying value and that those intangibles will contribute indefinitely to our cash flows,materially different assumptions regarding future performance of our businesses or a different weighted-averagecost of capital could result in material impairment losses and amortization expense. We performed our fiscal2020 assessment of our intangible assets as of the first day of the second quarter of fiscal 2020, and wedetermined there was no impairment of our intangible assets as their related fair values were substantially inexcess of the carrying values, except for the Europe & Australia reporting unit and the Progresso brandintangible asset.
37

The excess fair value as of the fiscal 2020 test date of the Europe & Australia reporting unit and the Progressobrand intangible asset were as follows:
In Millions
Carrying Valueof Intangible
Asset
Excess Fair Valueas of Fiscal 2020
Test Date
Europe & Australia $672.6 14%Progresso $330.0 5%
In addition, while having significant coverage as of our fiscal 2020 assessment date, the Pillsbury brand intangibleasset had risk of decreasing coverage. We will continue to monitor our businesses for potential impairment.
Redeemable Interest
The significant assumptions used to estimate the redemption value of the redeemable interest include projectedrevenue growth and profitability from our long-range plan, capital spending, depreciation and taxes, foreigncurrency exchange rates, and a discount rate. As of May 31, 2020, the redemption value of the redeemableinterest was $545 million.
Stock-based Compensation
The valuation of stock options is a significant accounting estimate that requires us to use judgments andassumptions that are likely to have a material impact on our financial statements. Annually, we make predictiveassumptions regarding future stock price volatility, employee exercise behavior, dividend yield, and the forfeiturerate. For more information on these assumptions, please see Note 12 to the Consolidated Financial Statements inItem 8 of this report.
The estimated fair values of stock options granted and the assumptions used for the Black-Scholes option-pricingmodel were as follows:
Fiscal Year
2020 2019 2018
Estimated fair values of stock options granted $ 7.10 $ 5.35 $ 6.18Assumptions:
Risk-free interest rate 2.0 % 2.9 % 2.2 %Expected term 8.5 years 8.5 years 8.2 yearsExpected volatility 17.4 % 16.3 % 15.8 %Dividend yield 3.6 % 4.3 % 3.6 %
The risk-free interest rate for periods during the expected term of the options is based on the U.S. Treasuryzero-coupon yield curve in effect at the time of grant. An increase in the expected term by 1 year, leaving allother assumptions constant, would increase the grant date fair value by 1 percent. If all other assumptions areheld constant, a one percentage point increase in our fiscal 2020 volatility assumption would increase the grantdate fair value of our fiscal 2020 option awards by 7 percent.
To the extent that actual outcomes differ from our assumptions, we are not required to true up grant-date fairvalue-based expense to final intrinsic values. Historical data has a significant bearing on our forward-lookingassumptions. Significant variances between actual and predicted experience could lead to prospective revisions inour assumptions, which could then significantly impact the year-over-year comparability of stock-basedcompensation expense.
Any corporate income tax benefit realized upon exercise or vesting of an award in excess of that previouslyrecognized in earnings (referred to as a windfall tax benefit) is presented in the Consolidated Statements of Cash
38

Flows as an operating cash flow. The actual impact on future years’ cash flows will depend, in part, on thevolume of employee stock option exercises during a particular year and the relationship between the exercise-date market value of the underlying stock and the original grant-date fair value previously determined forfinancial reporting purposes.
Realized windfall tax benefits and shortfall tax deficiencies related to the exercise or vesting of stock-basedawards are recognized in the Consolidated Statement of Earnings. Because employee stock option exercisebehavior is not within our control, it is possible that significantly different reported results could occur ifdifferent assumptions or conditions were to prevail.
Income Taxes
We apply a more-likely-than-not threshold to the recognition and derecognition of uncertain tax positions.Accordingly, we recognize the amount of tax benefit that has a greater than 50 percent likelihood of beingultimately realized upon settlement. Future changes in judgment related to the expected ultimate resolution ofuncertain tax positions will affect earnings in the quarter of such change. For more information on income taxes,please see Note 15 to the Consolidated Financial Statements in Item 8 of this report.
Defined Benefit Pension, Other Postretirement Benefit, and Postemployment Benefit Plans
We have defined benefit pension plans covering many employees in the United States, Canada, Switzerland,France, and the United Kingdom. We also sponsor plans that provide health care benefits to many of our retireesin the United States, Canada, and Brazil. Under certain circumstances, we also provide accruable benefits,primarily severance, to former and inactive employees in the United States, Canada, and Mexico. Please see Note14 to the Consolidated Financial Statements in Item 8 of this report for a description of our defined benefitpension, other postretirement benefit, and postemployment benefit plans.
We recognize benefits provided during retirement or following employment over the plan participants’ activeworking lives. Accordingly, we make various assumptions to predict and measure costs and obligations manyyears prior to the settlement of our obligations. Assumptions that require significant management judgment andhave a material impact on the measurement of our net periodic benefit expense or income and accumulatedbenefit obligations include the long-term rates of return on plan assets, the interest rates used to discount theobligations for our benefit plans, and health care cost trend rates.
Expected Rate of Return on Plan Assets
Our expected rate of return on plan assets is determined by our asset allocation, our historical long-terminvestment performance, our estimate of future long-term returns by asset class (using input from our actuaries,investment services, and investment managers), and long-term inflation assumptions. We review this assumptionannually for each plan; however, our annual investment performance for one particular year does not, by itself,significantly influence our evaluation.
Our historical investment returns (compound annual growth rates) for our United States defined benefit pensionand other postretirement benefit plan assets were 15.4 percent, 8.5 percent, 10.1 percent, 8.2 percent, and7.9 percent for the 1, 5, 10, 15, and 20 year periods ended May 31, 2020.
On a weighted-average basis, the expected rate of return for all defined benefit plans was 6.95 percent for fiscal2020, 7.25 percent for fiscal 2019, and 7.88 percent for fiscal 2018. For fiscal 2021, we lowered our weighted-average expected rate of return on plan assets for our principal defined benefit pension and other postretirementplans in the United States to 5.67 percent due to asset allocation changes and expected asset returns.
Lowering the expected long-term rate of return on assets by 100 basis points would increase our net pension andpostretirement expense by $79 million for fiscal 2021. A market-related valuation basis is used to reduce
39

year-to-year expense volatility. The market-related valuation recognizes certain investment gains or losses over afive-year period from the year in which they occur. Investment gains or losses for this purpose are the differencebetween the expected return calculated using the market-related value of assets and the actual return based on themarket-related value of assets. Our outside actuaries perform these calculations as part of our determination ofannual expense or income.
Discount Rates
We estimate the service and interest cost components of the net periodic benefit expense for our United Statesand most of our international defined benefit pension, other postretirement benefit, and postemployment benefitplans utilizing a full yield curve approach by applying the specific spot rates along the yield curve used todetermine the benefit obligation to the relevant projected cash flows. Our discount rate assumptions aredetermined annually as of May 31 for our defined benefit pension, other postretirement benefit, andpostemployment benefit plan obligations. We work with our outside actuaries to determine the timing andamount of expected future cash outflows to plan participants and, using the Aa Above Median corporate bondyield, to develop a forward interest rate curve, including a margin to that index based on our credit risk. Thisforward interest rate curve is applied to our expected future cash outflows to determine our discount rateassumptions.
Our weighted-average discount rates were as follows:
Defined BenefitPension Plans
OtherPostretirementBenefit Plans
PostemploymentBenefit Plans
Effective rate for fiscal 2021 service costs 3.59% 3.44% 2.54%Effective rate for fiscal 2021 interest costs 2.54% 2.32% 1.41%Obligations as of May 31, 2020 3.20% 3.02% 1.85%Effective rate for fiscal 2020 service costs 4.19% 4.04% 3.51%Effective rate for fiscal 2020 interest costs 3.47% 3.28% 2.84%Obligations as of May 31, 2019 3.91% 3.79% 3.10%Effective rate for fiscal 2019 service costs 4.34% 4.27% 3.99%Effective rate for fiscal 2019 interest costs 3.92% 3.80% 3.37%
Lowering the discount rates by 100 basis points would increase our net defined benefit pension, otherpostretirement benefit, and postemployment benefit plan expense for fiscal 2021 by approximately $54 million.All obligation-related experience gains and losses are amortized using a straight-line method over the averageremaining service period of active plan participants or over the average remaining lifetime of the remaining planparticipants if the plan is viewed as “all or almost all” inactive participants.
Health Care Cost Trend Rates
We review our health care cost trend rates annually. Our review is based on data we collect about our health careclaims experience and information provided by our actuaries. This information includes recent plan experience,plan design, overall industry experience and projections, and assumptions used by other similar organizations.Our initial health care cost trend rate is adjusted as necessary to remain consistent with this review, recentexperiences, and short-term expectations. Our initial health care cost trend rate assumption is 6.5 percent forretirees age 65 and over and 6.2 percent for retirees under age 65 at the end of fiscal 2020. Rates are graded downannually until the ultimate trend rate of 4.5 percent is reached in 2029 for all retirees. The trend rates areapplicable for calculations only if the retirees’ benefits increase as a result of health care inflation. The ultimatetrend rate is adjusted annually, as necessary, to approximate the current economic view on the rate of long-terminflation plus an appropriate health care cost premium. Assumed trend rates for health care costs have animportant effect on the amounts reported for the other postretirement benefit plans.
40

Any arising health care claims cost-related experience gain or loss is recognized in the calculation of expectedfuture claims. Once recognized, experience gains and losses are amortized using a straight-line method over theaverage remaining service period of active plan participants or over the average remaining lifetime of theremaining plan participants if the plan is viewed as “all or almost all” inactive participants.
Financial Statement Impact
In fiscal 2020, we recorded net defined benefit pension, other postretirement benefit, and postemploymentbenefit plan income of $2 million compared to $24 million of expense in fiscal 2019 and $23 million of expensein fiscal 2018. As of May 31, 2020, we had cumulative unrecognized actuarial net losses of $2 billion on ourdefined benefit pension plans and cumulative unrecognized actuarial net gains of $114 million on ourpostretirement and postemployment benefit plans, mainly as the result of liability increases from lower interestrates, partially offset by recent increases in the values of plan assets. These unrecognized actuarial net losses willresult in increases in our future pension and postretirement benefit expenses because they currently exceed thecorridors defined by GAAP.
Actual future net defined benefit pension, other postretirement benefit, and postemployment benefit plan incomeor expense will depend on investment performance, changes in future discount rates, changes in health care costtrend rates, and other factors related to the populations participating in these plans.
RECENTLY ISSUED ACCOUNTING PRONOUNCEMENTS
In March 2020, the Financial Accounting Standards Board (FASB) issued optional accounting guidance for alimited period of time to ease the potential burden in accounting for reference rate reform. The new standardprovides expedients and exceptions to existing accounting requirements for contract modifications and hedgeaccounting related to transitioning from discontinued reference rates, such as LIBOR, to alternative referencerates, if certain criteria are met. The new accounting requirements can be applied as of the beginning of theinterim period including March 12, 2020, or any date thereafter, through December 31, 2022. We are in theprocess of reviewing our contracts and arrangements that will be affected by a discontinued reference rate andanalyzing the impact of this guidance on our results of operations and financial position.
In December 2019, the FASB issued new accounting requirements related to income taxes. The new standardsimplifies the accounting for income taxes by removing certain exceptions related to the approach for intraperiodtax allocation, the recognition of deferred tax liabilities for outside basis differences, and the methodology forcalculating income taxes in interim periods. The new standard also simplifies aspects of accounting for franchisetaxes and enacted changes in tax laws or rates and clarifies accounting for transactions that result in a step-up inthe tax basis of goodwill. The requirements of the new standard are effective for annual reporting periodsbeginning after December 15, 2020, and interim periods within those annual periods, which for us is the firstquarter of fiscal 2022. Early adoption is permitted. We do not expect this guidance to have a material impact onour results of operations or financial position.
In June 2016, the FASB issued new accounting requirements related to the measurement of credit losses onfinancial instruments, including trade receivables. The new accounting requirements replace the incurred lossimpairment model with a forward-looking expected credit loss model, which will generally result in earlierrecognition of credit losses. The requirements of the new standard and subsequent amendments are effective forannual reporting periods beginning after December 15, 2019, and interim periods within those annual periods,which for us is the first quarter of fiscal 2021. We will adopt this guidance in the first quarter of fiscal 2021 usinga modified retrospective transition approach. We expect to record an immaterial cumulative effect adjustment toretained earnings as of the effective date to align our calculation of credit losses to the new model withconsideration of the economic implications of the COVID-19 pandemic. We do not expect this guidance to havea material impact on our results of operations or financial position.
41

NON-GAAP MEASURES
We have included in this report measures of financial performance that are not defined by GAAP. We believethat these measures provide useful information to investors, and include these measures in other communicationsto investors.
For each of these non-GAAP financial measures, we are providing below a reconciliation of the differencesbetween the non-GAAP measure and the most directly comparable GAAP measure, an explanation of why webelieve the non-GAAP measure provides useful information to investors, and any additional material purposesfor which our management or Board of Directors uses the non-GAAP measure. These non-GAAP measuresshould be viewed in addition to, and not in lieu of, the comparable GAAP measure.
Several measures below are presented on an adjusted basis. The adjustments are either items resulting frominfrequently occurring events or items that, in management’s judgment, significantly affect the year-to-yearassessment of operating results.
Organic Net Sales Growth Rates
We provide organic net sales growth rates for our consolidated net sales and segment net sales. This measure isused in reporting to our Board of Directors and executive management and as a component of the measurementof our performance for incentive compensation purposes. We believe that organic net sales growth rates provideuseful information to investors because they provide transparency to underlying performance in our net sales byexcluding the effect that foreign currency exchange rate fluctuations, as well as acquisitions, divestitures, and a53rd week, when applicable, have on year-to-year comparability. A reconciliation of these measures to reportednet sales growth rates, the relevant GAAP measures, are included in our Consolidated Results of Operations andResults of Segment Operations discussions in the MD&A above.
Adjusted Diluted EPS and Related Constant-currency Growth Rate
This measure is used in reporting to our Board of Directors and executive management and as a component of themeasurement of our performance for incentive compensation purposes. We believe that this measure providesuseful information to investors because it is the profitability measure we use to evaluate earnings performance ona comparable year-to-year basis.
42

The reconciliation of our GAAP measure, diluted EPS, to adjusted diluted EPS and the related constant-currencygrowth rate follows:
Fiscal Year
Per Share Data 2020 20192020 vs. 2019
Change 2018 2017 2016
Diluted earnings per share, as reported $ 3.56 $ 2.90 23% $ 3.64 $ 2.77 $ 2.77Tax items (a) (0.09) (0.12) 0.07 - -Restructuring charges (b) 0.06 0.10 0.11 0.26 0.26Project-related costs (b) - - 0.01 0.05 0.06Mark-to-market effects (c) 0.03 0.05 (0.04) (0.01) (0.07)Product recall (d) 0.03 - - - -CPW restructuring charges (e) 0.01 0.02 - - -Investment activity, net (f) - (0.03) - - -Net tax benefit (g) - (0.01) (0.89) - -Divestitures loss (gain) (h) - 0.03 - 0.01 (0.10)Acquisition transaction and
integration costs (i) - 0.03 0.10 - -Asset impairments (j) - 0.26 0.11 - -Legal recovery (k) - (0.01) - - -
Adjusted diluted earnings per share $ 3.61 $ 3.22 12% $ 3.11 $ 3.08 $ 2.92
Foreign currency exchange impact Flat
Adjusted diluted earnings per share growth, on aconstant-currency basis 12%
Note: Table may not foot due to rounding.(a) Discrete tax benefit related to the reorganization of certain wholly owned subsidiaries in fiscal 2020 and a discrete
tax benefit related to a capital loss carryback recorded in fiscal 2019. Please see Note 15 to the ConsolidatedFinancial Statements in Item 8 of this report. Fiscal 2018 represents a prior year income tax expense adjustment.
(b) Restructuring and project-related charges for previously announced restructuring actions. Please see Note 4 to theConsolidated Financial Statements in Item 8 of this report.
(c) Net mark-to-market valuation of certain commodity positions recognized in unallocated corporate items. Please seeNote 8 to the Consolidated Financial Statements in Item 8 of this report.
(d) Product recall costs related to our international Green Giant business.(e) CPW restructuring charges related to initiatives designed to improve profitability and growth that were approved in
fiscal 2018 and 2019.(f) Valuation gains on certain corporate investments.(g) Net tax benefit resulting from TCJA accounting. Please see Note 15 to the Consolidated Financial Statements in
Item 8 of this report.(h) Loss on the sale of our La Salteña refrigerated dough business in Argentina and gain on the sale of our yogurt
business in China in fiscal 2019. Please see Note 3 to the Consolidated Financial Statements in Item 8 of this report.Loss on the sale of our Martel, Ohio manufacturing facility in fiscal 2017. Fiscal 2016 represents the gain on thesale of our North American Green Giant product lines, the loss on the sale of our General Mills de Venezuela CAsubsidiary, and the loss on the sale of our General Mills Argentina S.A. foodservice business.
(i) Costs related to the acquisition of Blue Buffalo. Fiscal 2019 represented acquisition integration costs, while fiscal2018 represented acquisition transaction and integration costs and interest, net related to the debt issued to financethe acquisition.
(j) Impairment charges related to our Progresso, Food Should Taste Good, and Mountain High brand intangible assetsand certain manufacturing assets in our North America Retail and Asia & Latin America segments in fiscal 2019.Impairment charges related to our Yoki, Mountain High, and Immaculate Baking brand intangible assets in fiscal2018. Please see Note 6 to the Consolidated Financial Statements in Item 8 of this report.
(k) Represents a legal recovery related to our Yoplait SAS subsidiary.
See our reconciliation below of the effective income tax rate as reported to the adjusted effective income tax ratefor the tax impact of each item affecting comparability.
43

Free Cash Flow Conversion Rate
We believe this measure provides useful information to investors because it is important for assessing our efficiencyin converting earnings to cash and returning cash to shareholders. The calculation of free cash flow conversion rateand net cash provided by operating activities conversion rate, its equivalent GAAP measure, follows:
In Millions Fiscal 2020
Net earnings, including earnings attributable to redeemable and noncontrolling interests,as reported $2,210.8
Tax item (a) $ (53.1)Restructuring charges, net of tax (b) 39.0Project-related costs, net of tax (b) 1.2Mark-to-market effects, net of tax (c) 19.0Product recall, net of tax (d) 17.1CPW restructuring costs, net of tax (e) 5.0Investment activity, net, net of tax (f) 3.0
Adjusted net earnings, including earnings attributable to redeemable and noncontrolling interests $2,241.8
Net cash provided by operating activities 3,676.2Purchases of land, buildings, and equipment (460.8)
Free cash flow $3,215.4
Net cash provided by operating activities conversion rate 166%
Free cash flow conversion rate 143%
Note: Table may not foot due rounding.(a) Discrete tax benefit related to the reorganization of certain wholly owned subsidiaries. Please see Note 15 to
the Consolidated Financial Statements in Item 8 of this report.(b) Restructuring and project-related charges for previously announced restructuring actions. Please see Note 4 to
the Consolidated Financial Statements in Item 8 of this report.(c) Net mark-to-market valuation of certain commodity positions recognized in unallocated corporate items.
Please see Note 8 to the Consolidated Financial Statements in Item 8 of this report.(d) Product recall costs related to our international Green Giant business.(e) CPW restructuring charges related to initiatives designed to improve profitability and growth that were
approved in fiscal 2018 and 2019.(f) Valuation adjustments and the loss on sale of certain corporate investments.
See our reconciliation below of the effective income tax rate as reported to the adjusted effective income tax ratefor the tax impact of each item affecting comparability.
Constant-currency After-Tax Earnings from Joint Ventures Growth Rate
We believe that this measure provides useful information to investors because it provides transparency tounderlying performance of our joint ventures by excluding the effect that foreign currency exchange ratefluctuations have on year-to-year comparability given volatility in foreign currency exchange markets.
After-tax earnings from joint ventures growth rates on a constant-currency basis are calculated as follows:
Fiscal 2020
Percentage change in after-tax earnings from joint ventures as reported 27 %Impact of foreign currency exchange (4) pts
Percentage change in after-tax earnings from joint ventures on a constant-currency basis 31 %
Note: Table may not foot due to rounding.
44

Net Sales Growth Rate for Canada Operating Unit on a Constant-currency Basis
We believe this measure of our Canada operating unit net sales provides useful information to investors becauseit provides transparency to the underlying performance for the Canada operating unit within our North AmericaRetail segment by excluding the effect that foreign currency exchange rate fluctuations have on year-to-yearcomparability given volatility in foreign currency exchange markets.
Net sales growth rate for our Canada operating unit on a constant-currency basis is calculated as follows:
Fiscal 2020
Percentage change in net sales as reported 4 %Impact of foreign currency exchange (1) pt
Percentage change in net sales on a constant-currency basis 5 %
Note: Table may not foot due to rounding.
Constant-currency Segment Operating Profit Growth Rates
We believe that this measure provides useful information to investors because it provides transparency tounderlying performance of our segments by excluding the effect that foreign currency exchange rate fluctuationshave on year-to-year comparability given volatility in foreign currency exchange markets.
Our segments’ operating profit growth rates on a constant-currency basis are calculated as follows:
Fiscal 2020
Percentage Change inOperating Profit
as ReportedImpact of Foreign
Currency Exchange
Percentage Change inOperating Profit onConstant-Currency
Basis
North America Retail 15 % Flat 15 %Europe & Australia (8) (5) pts (3)Asia & Latin America (74) % (1) pt (73) %
Note: Table may not foot due to rounding.
Adjusted Effective Income Tax Rates
We believe this measure provides useful information to investors because it presents the adjusted effectiveincome tax rate on a comparable year-to-year basis.
45

Adjusted effective income tax rates are calculated as follows:
Fiscal Year Ended
May 31, 2020 May 26, 2019 May 27, 2018 May 28, 2017 May 29, 2016
In Millions
PretaxEarnings
(a)IncomeTaxes
PretaxEarnings
(a)IncomeTaxes
PretaxEarnings
(a)IncomeTaxes
PretaxEarnings
(a)IncomeTaxes
PretaxEarnings
(a)IncomeTaxes
As reported $2,600.2 $480.5 $2,082.0 $367.8 $2,135.6 $ 57.3 $2,271.3 $655.2 $2,403.6 $755.2Tax items (b) - 53.1 - 72.9 - (40.9) - - - -Restructuring charges (c) 50.2 11.2 77.6 14.6 82.7 21.4 224.1 70.2 229.8 69.0Project-related costs (c) 1.5 0.3 1.3 0.2 11.3 3.3 43.9 15.7 57.5 20.7Mark-to-market effects (d) 24.7 5.7 36.0 8.3 (32.1) (10.0) (13.9) (5.1) (62.8) (23.2)Product recall (e) 19.3 2.2 - - - - - - - -Investment activity, net (f) 8.4 5.4 (22.8) (5.2) - - - - - -Net tax benefit (g) - - - 7.2 - 523.5 - - - -Divestitures loss (gain) (h) - - 30.0 13.6 - - 13.5 4.3 (148.2) (82.2)Acquisition transaction and
integration costs (i) - - 25.6 5.9 83.9 25.4 - - - -Asset impairments (j) - - 207.4 47.7 96.9 32.0 - - - -Legal recovery (k) - - (16.2) (5.4) - - - - - -Hyperinflationary accounting (l) - - 3.2 - - - - - - -
As adjusted $2,704.3 $558.5 $2,424.1 $527.6 $2,378.3 $612.0 $2,538.9 $740.3 $2,479.9 $739.5
Effective tax rate:As reported 18.5% 17.7% 2.7% 28.8% 31.4%As adjusted 20.7% 21.8% 25.7% 29.2% 29.8%
Sum of adjustments toincome taxes $ 78.0 $159.8 $554.7 $ 85.1 $ (15.7)
Average number of commonshares - diluted EPS 613.3 605.4 585.7 598.0 611.9
Impact of income tax adjustmentson adjusted diluted EPS $(0.13) $(0.26) $(0.95) $(0.14) $ 0.03
Note: Table may not foot due to rounding.(a) Earnings before income taxes and after-tax earnings from joint ventures.(b) Discrete tax benefit related to the reorganization of certain wholly owned subsidiaries in fiscal 2020 and a discrete tax benefit related to a
capital carryback recorded in fiscal 2019. Please see Note 15 to the Consolidated Financial Statements in Item 8 of this report. Fiscal 2018represents a prior year income tax expense adjustment.
(c) Restructuring and project-related charges for previously announced restructuring actions. Please see Note 4 to the Consolidated FinancialStatements in Item 8 of this report.
(d) Net mark-to-market valuation of certain commodity positions recognized in unallocated corporate items. Please see Note 8 to theConsolidated Financial Statements in Item 8 of this report
(e) Product recall costs related to our international Green Giant business.(f) Valuation losses and the loss on sale of certain corporate investments in fiscal 2020. Valuation gains on certain corporate investments in
fiscal 2019.(g) Net tax benefit resulting from TCJA accounting. Please see Note 15 to the Consolidated Financial Statements in Item 8 of this report.(h) Loss on the sale of our La Salteña refrigerated dough business in Argentina and gain on the sale of our yogurt business in China in fiscal
2019. Please see Note 3 to the Consolidated Financial Statements in Item 8 of this report. Loss on the sale of our Martel, Ohiomanufacturing facility in fiscal 2017. Fiscal 2016 represents the gain on the sale of our North American Green Giant product lines, theloss on the sale of our General Mills de Venezuela CA subsidiary, and the loss on the sale of our General Mills Argentina S.A.foodservice business.
(i) Costs related to the acquisition of Blue Buffalo. Fiscal 2019 represented acquisition integration costs, while fiscal 2018 representedacquisition transaction and integration costs and interest, net related to the debt issued to finance the transaction.
(j) Impairment charges related to our Progresso, Food Should Taste Good, and Mountain High brand intangible assets and certainmanufacturing assets in our North America Retail and Asia & Latin America segments in fiscal 2019. Impairment charges related to ourYoki, Mountain High, and Immaculate Baking brand intangible assets in fiscal 2018. Please see Note 6 to the Consolidated FinancialStatements in Item 8 of this report.
(k) Represents a legal recovery related to our Yoplait SAS subsidiary.(l) Represents the impact of hyperinflationary accounting for our Argentina subsidiary, which was sold in fiscal 2019.
46

Adjusted Operating Profit as a Percent of Net Sales (Adjusted Operating Profit Margin)
We believe this measure provides useful information to investors because it is important for assessing ouroperating profit margin on a comparable year-to-year basis.
Our adjusted operating profit margins are calculated as follows:
Fiscal Year
Percent of Net Sales 2020 2019 2018 2017 2016
Operating profit as reported $2,953.9 16.8 % $2,515.9 14.9 % $2,419.9 15.4 % $2,492.1 16.0 % $2,719.1 16.4 %Restructuring charges (a) 50.2 0.3 % 77.6 0.5 % 82.7 0.5 % 221.9 1.4 % 209.3 1.3 %Project-related costs (a) 1.5 - % 1.3 - % 11.3 0.1 % 43.9 0.3 % 57.5 0.4 %Mark-to-market effects (b) 24.7 0.1 % 36.0 0.2 % (32.1) (0.2)% (13.9) (0.1)% (62.8) (0.4)%Product recall (c) 19.3 0.1 % - - % - - % - - % - - %Investment activity, net (d) 8.4 - % (22.8) (0.1)% - - % - - % - - %Divestitures loss (gain) (e) - - % 30.0 0.2 % - - % 6.5 - % (148.2) (0.9)%Acquisition transaction and
integration costs (f) - - % 25.6 0.1 % 34.0 0.2 % - - % - - %Asset impairments (g) - - % 207.4 1.2 % 96.9 0.6 % - - % - - %Legal recovery (h) - - % (16.2) (0.1)% - - % - - % - - %Hyperinflationary accounting (i) - - % 3.2 - % - - % - - % - - %
Adjusted operating profit $3,058.0 17.3 % $2,858.0 16.9 % $2,612.7 16.6 % $2,750.5 17.6 % $2,774.9 16.8 %
Note: Table may not foot due to rounding.(a) Restructuring and project-related charges for previously announced restructuring actions. Please see Note 4 to the Consolidated Financial
Statements in Item 8 of this report.(b) Net mark-to-market valuation of certain commodity positions recognized in unallocated corporate items. Please see Note 8 to the
Consolidated Financial Statements in Item 8 of this report.(c) Product recall costs related to our international Green Giant business.(d) Valuation losses and the loss on sale of certain corporate investments in fiscal 2020. Valuation gains on certain corporate investments in
fiscal 2019.(e) Loss on the sale of our La Salteña refrigerated dough business in Argentina and gain on the sale of our yogurt business in China in fiscal
2019. Please see Note 3 to the Consolidated Financial Statements in Item 8 of this report. Loss on the sale of our Martel, Ohiomanufacturing facility in fiscal 2017. Fiscal 2016 represents the gain on the sale of our North American Green Giant product lines, theloss on the sale of our General Mills de Venezuela CA subsidiary, and the loss on the sale of our General Mills Argentina S.A.foodservice business.
(f) Costs related to the acquisition of Blue Buffalo. Fiscal 2019 represented acquisition integration costs, while fiscal 2018 representedacquisition transaction and integration costs.
(g) Impairment charges related to our Progresso, Food Should Taste Good, and Mountain High brand intangible assets and certainmanufacturing assets in our North America Retail and Asia & Latin America segments in fiscal 2019. Impairment charges related to ourYoki, Mountain High, and Immaculate Baking brand intangible assets in fiscal 2018. Please see Note 6 to the Consolidated FinancialStatements in Item 8 of this report.
(h) Represents a legal recovery related to our Yoplait SAS subsidiary.(i) Represents the impact of hyperinflationary accounting for our Argentina subsidiary, which was sold in fiscal 2019.
Adjusted Operating Profit Growth on a Constant-currency Basis
We believe that this measure provides useful information to investors because it is the operating profit measurewe use to evaluate operating profit performance on a comparable year-to-year basis. Additionally, the measure isevaluated on a constant-currency basis by excluding the effect that foreign currency exchange rate fluctuationshave on year-to-year comparability given the volatility in foreign currency exchange rates.
47
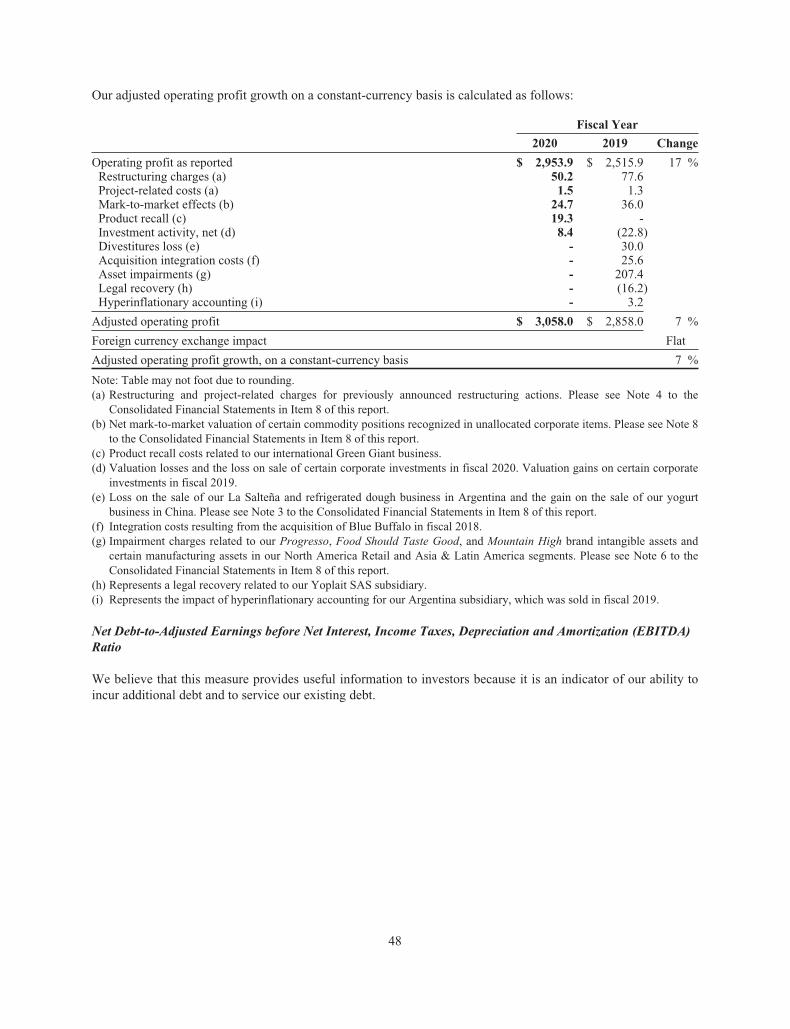
Our adjusted operating profit growth on a constant-currency basis is calculated as follows:
Fiscal Year
2020 2019 Change
Operating profit as reported $ 2,953.9 $ 2,515.9 17 %Restructuring charges (a) 50.2 77.6Project-related costs (a) 1.5 1.3Mark-to-market effects (b) 24.7 36.0Product recall (c) 19.3 -Investment activity, net (d) 8.4 (22.8)Divestitures loss (e) - 30.0Acquisition integration costs (f) - 25.6Asset impairments (g) - 207.4Legal recovery (h) - (16.2)Hyperinflationary accounting (i) - 3.2
Adjusted operating profit $ 3,058.0 $ 2,858.0 7 %
Foreign currency exchange impact Flat
Adjusted operating profit growth, on a constant-currency basis 7 %
Note: Table may not foot due to rounding.(a) Restructuring and project-related charges for previously announced restructuring actions. Please see Note 4 to the
Consolidated Financial Statements in Item 8 of this report.(b) Net mark-to-market valuation of certain commodity positions recognized in unallocated corporate items. Please see Note 8
to the Consolidated Financial Statements in Item 8 of this report.(c) Product recall costs related to our international Green Giant business.(d) Valuation losses and the loss on sale of certain corporate investments in fiscal 2020. Valuation gains on certain corporate
investments in fiscal 2019.(e) Loss on the sale of our La Salteña and refrigerated dough business in Argentina and the gain on the sale of our yogurt
business in China. Please see Note 3 to the Consolidated Financial Statements in Item 8 of this report.(f) Integration costs resulting from the acquisition of Blue Buffalo in fiscal 2018.(g) Impairment charges related to our Progresso, Food Should Taste Good, and Mountain High brand intangible assets and
certain manufacturing assets in our North America Retail and Asia & Latin America segments. Please see Note 6 to theConsolidated Financial Statements in Item 8 of this report.
(h) Represents a legal recovery related to our Yoplait SAS subsidiary.(i) Represents the impact of hyperinflationary accounting for our Argentina subsidiary, which was sold in fiscal 2019.
Net Debt-to-Adjusted Earnings before Net Interest, Income Taxes, Depreciation and Amortization (EBITDA)Ratio
We believe that this measure provides useful information to investors because it is an indicator of our ability toincur additional debt and to service our existing debt.
48
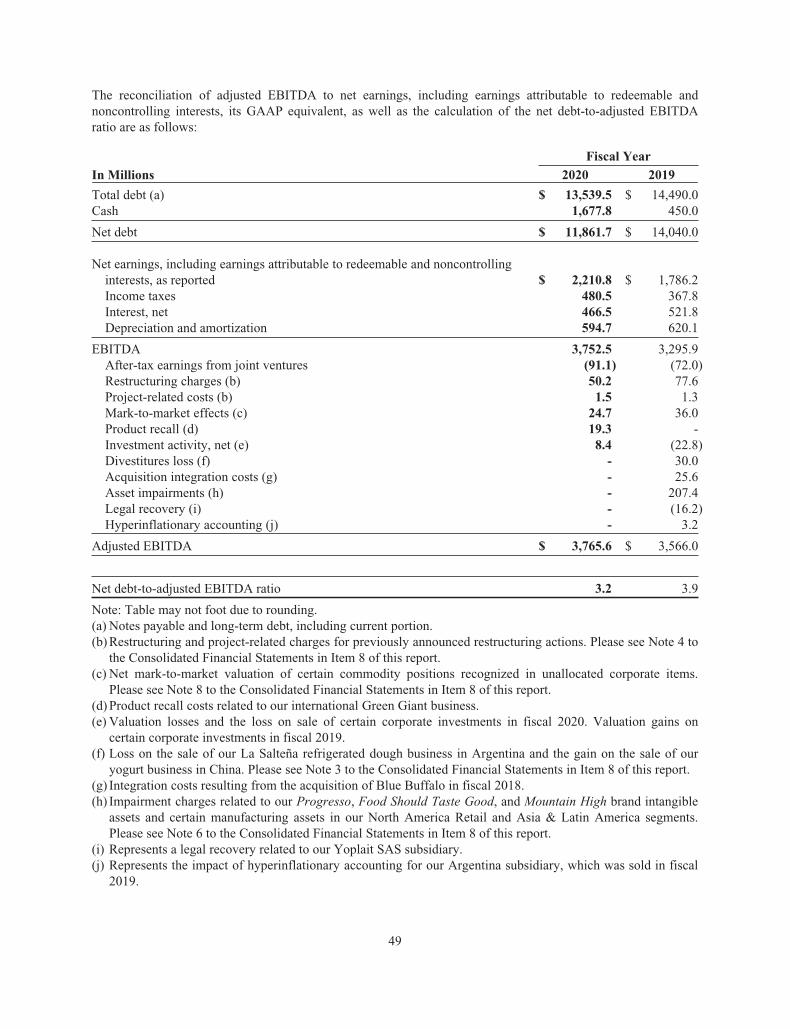
The reconciliation of adjusted EBITDA to net earnings, including earnings attributable to redeemable andnoncontrolling interests, its GAAP equivalent, as well as the calculation of the net debt-to-adjusted EBITDAratio are as follows:
Fiscal Year
In Millions 2020 2019
Total debt (a) $ 13,539.5 $ 14,490.0Cash 1,677.8 450.0
Net debt $ 11,861.7 $ 14,040.0
Net earnings, including earnings attributable to redeemable and noncontrollinginterests, as reported $ 2,210.8 $ 1,786.2Income taxes 480.5 367.8Interest, net 466.5 521.8Depreciation and amortization 594.7 620.1
EBITDA 3,752.5 3,295.9After-tax earnings from joint ventures (91.1) (72.0)Restructuring charges (b) 50.2 77.6Project-related costs (b) 1.5 1.3Mark-to-market effects (c) 24.7 36.0Product recall (d) 19.3 -Investment activity, net (e) 8.4 (22.8)Divestitures loss (f) - 30.0Acquisition integration costs (g) - 25.6Asset impairments (h) - 207.4Legal recovery (i) - (16.2)Hyperinflationary accounting (j) - 3.2
Adjusted EBITDA $ 3,765.6 $ 3,566.0
Net debt-to-adjusted EBITDA ratio 3.2 3.9
Note: Table may not foot due to rounding.(a) Notes payable and long-term debt, including current portion.(b) Restructuring and project-related charges for previously announced restructuring actions. Please see Note 4 to
the Consolidated Financial Statements in Item 8 of this report.(c) Net mark-to-market valuation of certain commodity positions recognized in unallocated corporate items.
Please see Note 8 to the Consolidated Financial Statements in Item 8 of this report.(d) Product recall costs related to our international Green Giant business.(e) Valuation losses and the loss on sale of certain corporate investments in fiscal 2020. Valuation gains on
certain corporate investments in fiscal 2019.(f) Loss on the sale of our La Salteña refrigerated dough business in Argentina and the gain on the sale of our
yogurt business in China. Please see Note 3 to the Consolidated Financial Statements in Item 8 of this report.(g) Integration costs resulting from the acquisition of Blue Buffalo in fiscal 2018.(h) Impairment charges related to our Progresso, Food Should Taste Good, and Mountain High brand intangible
assets and certain manufacturing assets in our North America Retail and Asia & Latin America segments.Please see Note 6 to the Consolidated Financial Statements in Item 8 of this report.
(i) Represents a legal recovery related to our Yoplait SAS subsidiary.(j) Represents the impact of hyperinflationary accounting for our Argentina subsidiary, which was sold in fiscal
2019.
49

CAUTIONARY STATEMENT RELEVANT TO FORWARD-LOOKING INFORMATION FOR THEPURPOSE OF “SAFE HARBOR” PROVISIONS OF THE PRIVATE SECURITIES LITIGATIONREFORM ACT OF 1995
This report contains or incorporates by reference forward-looking statements within the meaning of the PrivateSecurities Litigation Reform Act of 1995 that are based on our current expectations and assumptions. We alsomay make written or oral forward-looking statements, including statements contained in our filings with the SECand in our reports to shareholders.
The words or phrases “will likely result,” “are expected to,” “will continue,” “is anticipated,” “estimate,” “plan,”“project,” or similar expressions identify “forward-looking statements” within the meaning of the PrivateSecurities Litigation Reform Act of 1995. Such statements are subject to certain risks and uncertainties that couldcause actual results to differ materially from historical results and those currently anticipated or projected. Wewish to caution you not to place undue reliance on any such forward-looking statements.
In connection with the “safe harbor” provisions of the Private Securities Litigation Reform Act of 1995, we areidentifying important factors that could affect our financial performance and could cause our actual results infuture periods to differ materially from any current opinions or statements.
Our future results could be affected by a variety of factors, such as: the impact of the COVID-19 pandemic onour business, suppliers, consumers, customers, and employees; disruptions or inefficiencies in the supply chain,including any impact of the COVID-19 pandemic; competitive dynamics in the consumer foods industry and themarkets for our products, including new product introductions, advertising activities, pricing actions, andpromotional activities of our competitors; economic conditions, including changes in inflation rates, interestrates, tax rates, or the availability of capital; product development and innovation; consumer acceptance of newproducts and product improvements; consumer reaction to pricing actions and changes in promotion levels;acquisitions or dispositions of businesses or assets, changes in capital structure; changes in the legal andregulatory environment, including tax legislation, labeling and advertising regulations, and litigation;impairments in the carrying value of goodwill, other intangible assets, or other long-lived assets, or changes inthe useful lives of other intangible assets; changes in accounting standards and the impact of significantaccounting estimates; product quality and safety issues, including recalls and product liability; changes inconsumer demand for our products; effectiveness of advertising, marketing, and promotional programs; changesin consumer behavior, trends, and preferences, including weight loss trends; consumer perception of health-related issues, including obesity; consolidation in the retail environment; changes in purchasing and inventorylevels of significant customers; fluctuations in the cost and availability of supply chain resources, including rawmaterials, packaging, and energy; effectiveness of restructuring and cost saving initiatives; volatility in themarket value of derivatives used to manage price risk for certain commodities; benefit plan expenses due tochanges in plan asset values and discount rates used to determine plan liabilities; failure or breach of ourinformation technology systems; foreign economic conditions, including currency rate fluctuations; and politicalunrest in foreign markets and economic uncertainty due to terrorism or war.
You should also consider the risk factors that we identify in Item 1A of this report, which could also affect ourfuture results.
We undertake no obligation to publicly revise any forward-looking statements to reflect events or circumstancesafter the date of those statements or to reflect the occurrence of anticipated or unanticipated events.
50

ITEM 7A - Quantitative and Qualitative Disclosures About Market Risk
We are exposed to market risk stemming from changes in interest and foreign exchange rates and commodity andequity prices. Changes in these factors could cause fluctuations in our earnings and cash flows. In the normalcourse of business, we actively manage our exposure to these market risks by entering into various hedgingtransactions, authorized under established policies that place clear controls on these activities. The counterpartiesin these transactions are generally highly rated institutions. We establish credit limits for each counterparty. Ourhedging transactions include but are not limited to a variety of derivative financial instruments. For informationon interest rate, foreign exchange, commodity price, and equity instrument risk, please see Note 8 to theConsolidated Financial Statements in Item 8 of this report.
VALUE AT RISK
The estimates in the table below are intended to measure the maximum potential fair value we could lose in oneday from adverse changes in market interest rates, foreign exchange rates, commodity prices, and equity pricesunder normal market conditions. A Monte Carlo value-at-risk (VAR) methodology was used to quantify themarket risk for our exposures. The models assumed normal market conditions and used a 95 percent confidencelevel.
The VAR calculation used historical interest and foreign exchange rates, and commodity and equity prices fromthe past year to estimate the potential volatility and correlation of these rates in the future. The market data weredrawn from the RiskMetrics™ data set. The calculations are not intended to represent actual losses in fair valuethat we expect to incur. Further, since the hedging instrument (the derivative) inversely correlates with theunderlying exposure, we would expect that any loss or gain in the fair value of our derivatives would begenerally offset by an increase or decrease in the fair value of the underlying exposure. The positions included inthe calculations were: debt; investments; interest rate swaps; foreign exchange forwards; commodity swaps,futures, and options; and equity instruments. The calculations do not include the underlying foreign exchange andcommodities or equity-related positions that are offset by these market-risk-sensitive instruments.
The table below presents the estimated maximum potential VAR arising from a one-day loss in fair value for ourinterest rate, foreign currency, commodity, and equity market-risk-sensitive instruments outstanding as ofMay 31, 2020 and May 26, 2019, and the average fair value impact during the year ended May 31, 2020.
Fair Value Impact
In MillionsMay 31,
2020
Averageduring
fiscal 2020May 26,
2019
Interest rate instruments $ 78.8 $ 80.3 $ 74.4Foreign currency instruments 19.3 15.3 16.8Commodity instruments 2.6 3.0 4.1Equity instruments 5.0 2.9 2.3
51

ITEM 8 - Financial Statements and Supplementary Data
REPORT OF MANAGEMENT RESPONSIBILITIES
The management of General Mills, Inc. is responsible for the fairness and accuracy of the consolidated financialstatements. The statements have been prepared in accordance with accounting principles that are generallyaccepted in the United States, using management’s best estimates and judgments where appropriate. Thefinancial information throughout this Annual Report on Form 10-K is consistent with our consolidated financialstatements.
Management has established a system of internal controls that provides reasonable assurance that assets areadequately safeguarded and transactions are recorded accurately in all material respects, in accordance withmanagement’s authorization. We maintain a strong audit program that independently evaluates the adequacy andeffectiveness of internal controls. Our internal controls provide for appropriate separation of duties andresponsibilities, and there are documented policies regarding use of our assets and proper financial reporting.These formally stated and regularly communicated policies demand highly ethical conduct from all employees.
The Audit Committee of the Board of Directors meets regularly with management, internal auditors, and ourindependent registered public accounting firm to review internal control, auditing, and financial reportingmatters. The independent registered public accounting firm, internal auditors, and employees have full and freeaccess to the Audit Committee at any time.
The Audit Committee reviewed and approved the Company’s annual financial statements. The Audit Committeerecommended, and the Board of Directors approved, that the consolidated financial statements be included in theAnnual Report. The Audit Committee also appointed KPMG LLP to serve as the Company’s independentregistered public accounting firm for fiscal 2021.
/s/ J. L. Harmening /s/ K. A. Bruce
J. L. Harmening K. A. BruceChief Executive Officer Chief Financial Officer
July 2, 2020
52
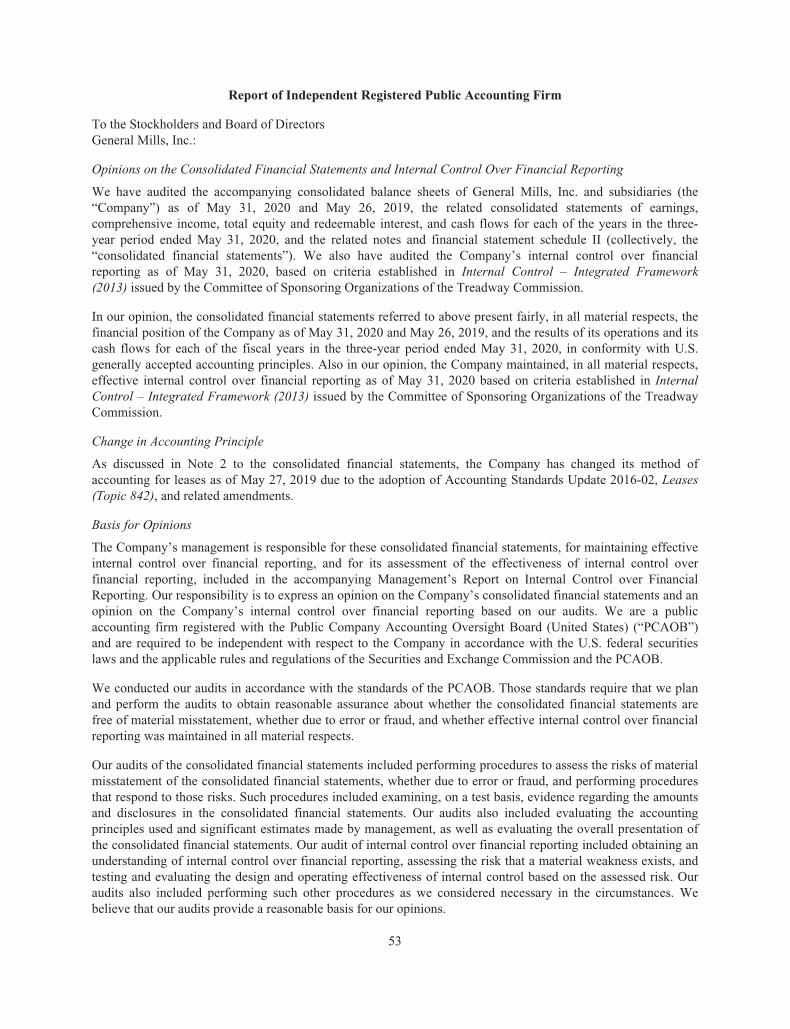
Report of Independent Registered Public Accounting Firm
To the Stockholders and Board of DirectorsGeneral Mills, Inc.:
Opinions on the Consolidated Financial Statements and Internal Control Over Financial Reporting
We have audited the accompanying consolidated balance sheets of General Mills, Inc. and subsidiaries (the“Company”) as of May 31, 2020 and May 26, 2019, the related consolidated statements of earnings,comprehensive income, total equity and redeemable interest, and cash flows for each of the years in the three-year period ended May 31, 2020, and the related notes and financial statement schedule II (collectively, the“consolidated financial statements”). We also have audited the Company’s internal control over financialreporting as of May 31, 2020, based on criteria established in Internal Control – Integrated Framework(2013) issued by the Committee of Sponsoring Organizations of the Treadway Commission.
In our opinion, the consolidated financial statements referred to above present fairly, in all material respects, thefinancial position of the Company as of May 31, 2020 and May 26, 2019, and the results of its operations and itscash flows for each of the fiscal years in the three-year period ended May 31, 2020, in conformity with U.S.generally accepted accounting principles. Also in our opinion, the Company maintained, in all material respects,effective internal control over financial reporting as of May 31, 2020 based on criteria established in InternalControl – Integrated Framework (2013) issued by the Committee of Sponsoring Organizations of the TreadwayCommission.
Change in Accounting Principle
As discussed in Note 2 to the consolidated financial statements, the Company has changed its method ofaccounting for leases as of May 27, 2019 due to the adoption of Accounting Standards Update 2016-02, Leases(Topic 842), and related amendments.
Basis for Opinions
The Company’s management is responsible for these consolidated financial statements, for maintaining effectiveinternal control over financial reporting, and for its assessment of the effectiveness of internal control overfinancial reporting, included in the accompanying Management’s Report on Internal Control over FinancialReporting. Our responsibility is to express an opinion on the Company’s consolidated financial statements and anopinion on the Company’s internal control over financial reporting based on our audits. We are a publicaccounting firm registered with the Public Company Accounting Oversight Board (United States) (“PCAOB”)and are required to be independent with respect to the Company in accordance with the U.S. federal securitieslaws and the applicable rules and regulations of the Securities and Exchange Commission and the PCAOB.
We conducted our audits in accordance with the standards of the PCAOB. Those standards require that we planand perform the audits to obtain reasonable assurance about whether the consolidated financial statements arefree of material misstatement, whether due to error or fraud, and whether effective internal control over financialreporting was maintained in all material respects.
Our audits of the consolidated financial statements included performing procedures to assess the risks of materialmisstatement of the consolidated financial statements, whether due to error or fraud, and performing proceduresthat respond to those risks. Such procedures included examining, on a test basis, evidence regarding the amountsand disclosures in the consolidated financial statements. Our audits also included evaluating the accountingprinciples used and significant estimates made by management, as well as evaluating the overall presentation ofthe consolidated financial statements. Our audit of internal control over financial reporting included obtaining anunderstanding of internal control over financial reporting, assessing the risk that a material weakness exists, andtesting and evaluating the design and operating effectiveness of internal control based on the assessed risk. Ouraudits also included performing such other procedures as we considered necessary in the circumstances. Webelieve that our audits provide a reasonable basis for our opinions.
53

Definition and Limitations of Internal Control Over Financial Reporting
A company’s internal control over financial reporting is a process designed to provide reasonable assuranceregarding the reliability of financial reporting and the preparation of financial statements for external purposes inaccordance with generally accepted accounting principles. A company’s internal control over financial reportingincludes those policies and procedures that (1) pertain to the maintenance of records that, in reasonable detail,accurately and fairly reflect the transactions and dispositions of the assets of the company; (2) provide reasonableassurance that transactions are recorded as necessary to permit preparation of financial statements in accordancewith generally accepted accounting principles, and that receipts and expenditures of the company are being madeonly in accordance with authorizations of management and directors of the company; and (3) provide reasonableassurance regarding prevention or timely detection of unauthorized acquisition, use, or disposition of thecompany’s assets that could have a material effect on the financial statements.
Because of its inherent limitations, internal control over financial reporting may not prevent or detectmisstatements. Also, projections of any evaluation of effectiveness to future periods are subject to the risk thatcontrols may become inadequate because of changes in conditions, or that the degree of compliance with thepolicies or procedures may deteriorate.
Critical Audit Matter
The critical audit matter communicated below is a matter arising from the current period audit of theconsolidated financial statements that was communicated or required to be communicated to the audit committeeand that: (1) relates to accounts or disclosures that are material to the consolidated financial statements and(2) involved our especially challenging, subjective, or complex judgments. The communication of a critical auditmatter does not alter in any way our opinion on the consolidated financial statements, taken as a whole, and weare not, by communicating the critical audit matter below, providing a separate opinion on the critical auditmatter or on the accounts or disclosures to which it relates.
Evaluation of valuation of goodwill and brands and other indefinite-lived intangible assets
As discussed in Note 6 to the consolidated financial statements, the goodwill and brand and other indefinite-lived intangibles balances as of May 31, 2020 were $13,923.2 million and $6,561.4 million, respectively.The impairment tests for these assets, which are performed annually and whenever events or changes incircumstances indicate that impairment may have occurred, require the Company to estimate the fair valueof the reporting units to which goodwill is assigned as well as the brand and other indefinite-lived intangibleassets. The fair value estimates are derived from discounted cash flow analyses that require the Company tomake judgments about highly subjective matters, including future operating results, including revenuegrowth rates and operating margins, and an estimate of the discount rates and royalty rates.
We identified the evaluation of valuation of goodwill and brands and other indefinite-lived intangible assetsas a critical audit matter. There was a significant degree of judgment required in evaluating audit evidence,which consists primarily of forward looking assumptions about future operating results, specifically therevenue growth rates, operating margins, royalty rates and subjective inputs used to estimate the discountrates.
The primary procedures we performed to address this critical audit matter included the following. Weevaluated the design and tested the operating effectiveness of internal controls related to the critical auditmatter. This included controls related to the assumptions about future operating results and the discount androyalty rates used to measure the reporting unit and brand and other intangible fair values. We performedsensitivity analyses over the revenue growth rates, operating margins, brand royalty rates and discount ratesto assess the impact of other points within a range of potential assumptions. We evaluated the revenuegrowth rates and operating margin assumptions by comparing them to recent financial performance andexternal market and industry data. We evaluated whether these assumptions were consistent with evidenceobtained in other areas of the audit. Professionals with specialized skill and knowledge were used to assist in
54

the evaluation of the Company’s discount rates and royalty rates by comparing them against rate ranges thatwere independently developed using publicly available market data for comparable entities.
/s/ KPMG LLP
We have served as the Company’s auditor since 1928.
Minneapolis, MinnesotaJuly 2, 2020
55

Consolidated Statements of EarningsGENERAL MILLS, INC. AND SUBSIDIARIES
(In Millions, Except per Share Data)
Fiscal Year
2020 2019 2018
Net sales $ 17,626.6 $ 16,865.2 $ 15,740.4
Cost of sales 11,496.7 11,108.4 10,304.8
Selling, general, and administrative expenses 3,151.6 2,935.8 2,850.1
Divestitures loss - 30.0 -
Restructuring, impairment, and other exit costs 24.4 275.1 165.6
Operating profit 2,953.9 2,515.9 2,419.9
Benefit plan non-service income (112.8) (87.9) (89.4)
Interest, net 466.5 521.8 373.7
Earnings before income taxes and after-taxearnings from joint ventures 2,600.2 2,082.0 2,135.6
Income taxes 480.5 367.8 57.3
After-tax earnings from joint ventures 91.1 72.0 84.7
Net earnings, including earnings attributable toredeemable and noncontrolling interests 2,210.8 1,786.2 2,163.0
Net earnings attributable to redeemable andnoncontrolling interests 29.6 33.5 32.0
Net earnings attributable to General Mills $ 2,181.2 $ 1,752.7 $ 2,131.0
Earnings per share - basic $ 3.59 $ 2.92 $ 3.69
Earnings per share - diluted $ 3.56 $ 2.90 $ 3.64
Dividends per share $ 1.96 $ 1.96 $ 1.96
See accompanying notes to consolidated financial statements.
56

Consolidated Statements of Comprehensive IncomeGENERAL MILLS, INC. AND SUBSIDIARIES
(In Millions)
Fiscal Year
2020 2019 2018
Net earnings, including earnings attributable toredeemable and noncontrolling interests $ 2,210.8 $ 1,786.2 $ 2,163.0
Other comprehensive income (loss), net of tax:
Foreign currency translation (169.1) (82.8) (37.0)
Net actuarial (loss) income (224.6) (253.4) 140.1
Other fair value changes:
Securities - - 1.2
Hedge derivatives 3.2 12.1 (50.8)
Reclassification to earnings:
Securities - (2.0) (5.1)
Hedge derivatives 4.1 0.9 17.4
Amortization of losses and prior service costs 77.9 84.6 117.6
Other comprehensive (loss) income, net of tax (308.5) (240.6) 183.4
Total comprehensive income 1,902.3 1,545.6 2,346.4
Comprehensive income (loss) attributable toredeemable and noncontrolling interests 10.1 (10.7) 70.5
Comprehensive income attributable to GeneralMills $ 1,892.2 $ 1,556.3 $ 2,275.9
See accompanying notes to consolidated financial statements.
57
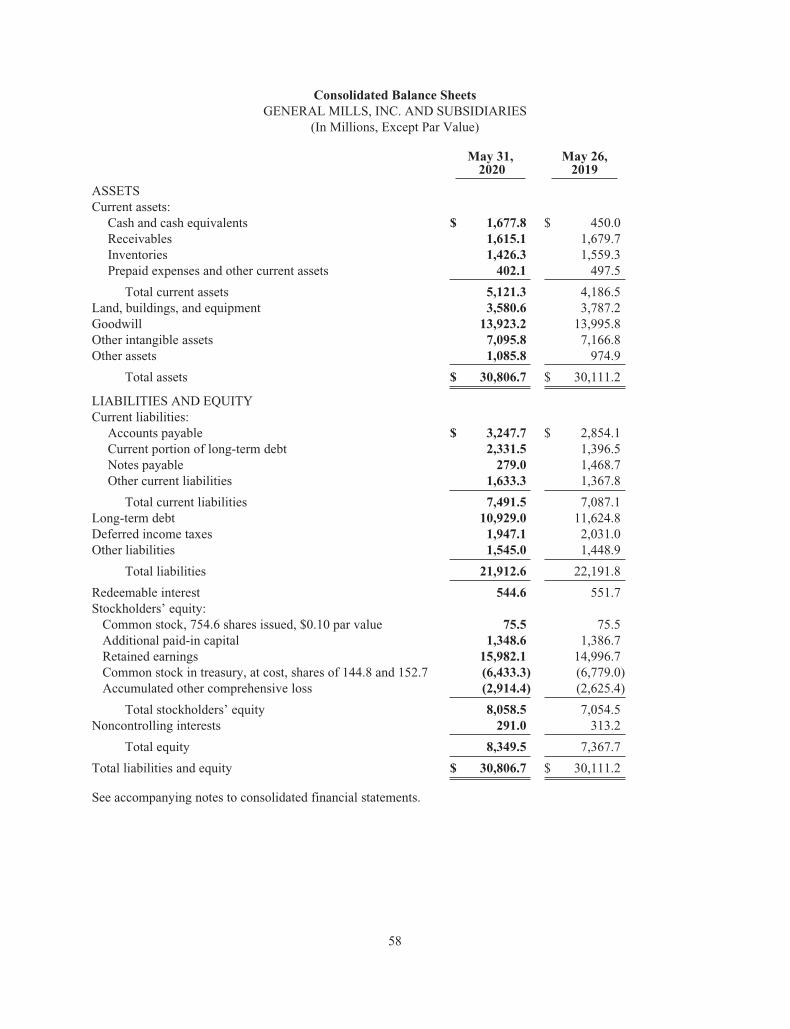
Consolidated Balance SheetsGENERAL MILLS, INC. AND SUBSIDIARIES
(In Millions, Except Par Value)
May 31,2020
May 26,2019
ASSETSCurrent assets:
Cash and cash equivalents $ 1,677.8 $ 450.0Receivables 1,615.1 1,679.7Inventories 1,426.3 1,559.3Prepaid expenses and other current assets 402.1 497.5
Total current assets 5,121.3 4,186.5Land, buildings, and equipment 3,580.6 3,787.2Goodwill 13,923.2 13,995.8Other intangible assets 7,095.8 7,166.8Other assets 1,085.8 974.9
Total assets $ 30,806.7 $ 30,111.2
LIABILITIES AND EQUITYCurrent liabilities:
Accounts payable $ 3,247.7 $ 2,854.1Current portion of long-term debt 2,331.5 1,396.5Notes payable 279.0 1,468.7Other current liabilities 1,633.3 1,367.8
Total current liabilities 7,491.5 7,087.1Long-term debt 10,929.0 11,624.8Deferred income taxes 1,947.1 2,031.0Other liabilities 1,545.0 1,448.9
Total liabilities 21,912.6 22,191.8
Redeemable interest 544.6 551.7Stockholders’ equity:
Common stock, 754.6 shares issued, $0.10 par value 75.5 75.5Additional paid-in capital 1,348.6 1,386.7Retained earnings 15,982.1 14,996.7Common stock in treasury, at cost, shares of 144.8 and 152.7 (6,433.3) (6,779.0)Accumulated other comprehensive loss (2,914.4) (2,625.4)
Total stockholders’ equity 8,058.5 7,054.5Noncontrolling interests 291.0 313.2
Total equity 8,349.5 7,367.7
Total liabilities and equity $ 30,806.7 $ 30,111.2
See accompanying notes to consolidated financial statements.
58

Consolidated Statements of Total Equity and Redeemable InterestGENERAL MILLS, INC. AND SUBSIDIARIES
(In Millions, Except per Share Data)
Fiscal Year
2020 2019 2018
Shares Amount Shares Amount Shares Amount
Total equity, beginning balance $ 7,367.7 $ 6,492.4 $ 4,685.5
Common stock 754.6 75.5 754.6 75.5 754.6 75.5
Additional paid-in capital:Beginning balance 1,386.7 1,202.5 1,120.9
Shares issued - - (39.1)Stock compensation plans (12.1) (96.4) (57.9)Unearned compensation related to stock
unit awards (85.7) (71.3) (58.1)Earned compensation 92.8 82.8 77.0(Increase) decrease in redemption value of
redeemable interest (33.1) 269.1 159.7
Ending balance 1,348.6 1,386.7 1,202.5
Retained earnings:Beginning balance 14,996.7 14,459.6 13,138.9
Comprehensive income 2,181.2 1,752.7 2,131.0Cash dividends declared ($1.96, $1.96,
and $1.96 per share) (1,195.8) (1,181.7) (1,139.7)Reclassification of certain income
tax effects - - 329.4Adoption of revenue recognition
accounting requirements - (33.9) -
Ending balance 15,982.1 14,996.7 14,459.6
Common stock in treasury:Beginning balance (152.7) (6,779.0) (161.5) (7,167.5) (177.7) (7,762.9)
Shares purchased (0.1) (3.4) - (1.1) (10.9) (601.6)Shares issued - - - - 22.7 1,009.0Stock compensation plans 8.0 349.1 8.8 389.6 4.4 188.0
Ending balance (144.8) (6,433.3) (152.7) (6,779.0) (161.5) (7,167.5)
Accumulated other comprehensive loss:Beginning balance (2,625.4) (2,429.0) (2,244.5)
Comprehensive (loss) income (289.0) (196.4) 144.9Reclassification of certain income
tax effects - - (329.4)
Ending balance (2,914.4) (2,625.4) (2,429.0)
Noncontrolling interests:Beginning balance 313.2 351.3 357.6
Comprehensive income 10.3 0.4 26.9Distributions to redeemable and
noncontrolling interest holders (32.5) (38.5) (33.2)
Ending balance 291.0 313.2 351.3
Total equity, ending balance $ 8,349.5 $ 7,367.7 $ 6,492.4
Redeemable interest:Beginning balance 551.7 776.2 910.9
Comprehensive (loss) income (0.2) (11.1) 43.6Increase in investment in
redeemable interest - 55.7 -Increase (decrease) in redemption value of
redeemable interest 33.1 (269.1) (159.7)Distributions to redeemable and
noncontrolling interest holders (40.0) - (18.6)
Ending balance $ 544.6 $ 551.7 $ 776.2
See accompanying notes to consolidated financial statements.
59

Consolidated Statements of Cash FlowsGENERAL MILLS, INC. AND SUBSIDIARIES
(In Millions)
Fiscal Year
2020 2019 2018Cash Flows - Operating Activities
Net earnings, including earnings attributable to redeemable and noncontrollinginterests $ 2,210.8 $ 1,786.2 $ 2,163.0
Adjustments to reconcile net earnings to net cash provided by operatingactivities:
Depreciation and amortization 594.7 620.1 618.8After-tax earnings from joint ventures (91.1) (72.0) (84.7)Distributions of earnings from joint ventures 76.5 86.7 113.2Stock-based compensation 94.9 84.9 77.0Deferred income taxes (29.6) 93.5 (504.3)Pension and other postretirement benefit plan contributions (31.1) (28.8) (31.8)Pension and other postretirement benefit plan costs (32.3) 6.1 4.6Divestitures loss - 30.0 -Restructuring, impairment, and other exit costs 43.6 235.7 126.0Changes in current assets and liabilities, excluding the effects of
acquisitions and divestitures 793.9 (7.5) 542.1Other, net 45.9 (27.9) (182.9)
Net cash provided by operating activities 3,676.2 2,807.0 2,841.0
Cash Flows - Investing ActivitiesPurchases of land, buildings, and equipment (460.8) (537.6) (622.7)Acquisition, net of cash acquired - - (8,035.8)Investments in affiliates, net (48.0) 0.1 (17.3)Proceeds from disposal of land, buildings, and equipment 1.7 14.3 1.4Proceeds from divestitures - 26.4 -Other, net 20.9 (59.7) (11.0)
Net cash used by investing activities (486.2) (556.5) (8,685.4)
Cash Flows - Financing ActivitiesChange in notes payable (1,158.6) (66.3) 327.5Issuance of long-term debt 1,638.1 339.1 6,550.0Payment of long-term debt (1,396.7) (1,493.8) (600.1)Proceeds from common stock issued on exercised options 263.4 241.4 99.3Proceeds from common stock issued - - 969.9Purchases of common stock for treasury (3.4) (1.1) (601.6)Dividends paid (1,195.8) (1,181.7) (1,139.7)Investments in redeemable interest - 55.7 -Distributions to noncontrolling and redeemable interest holders (72.5) (38.5) (51.8)Other, net (16.0) (31.2) (108.0)
Net cash (used) provided by financing activities (1,941.5) (2,176.4) 5,445.5
Effect of exchange rate changes on cash and cash equivalents (20.7) (23.1) 31.8
Increase (decrease) in cash and cash equivalents 1,227.8 51.0 (367.1)Cash and cash equivalents - beginning of year 450.0 399.0 766.1
Cash and cash equivalents - end of year $ 1,677.8 $ 450.0 $ 399.0
Cash flow from changes in current assets and liabilities, excluding the effects ofacquisitions and divestitures:
Receivables $ 37.9 $ (42.7) $ (122.7)Inventories 103.1 53.7 15.6Prepaid expenses and other current assets 94.2 (114.3) (10.7)Accounts payable 392.5 162.4 575.3Other current liabilities 166.2 (66.6) 84.6
Changes in current assets and liabilities $ 793.9 $ (7.5) $ 542.1
See accompanying notes to consolidated financial statements.
60

Notes to Consolidated Financial StatementsGENERAL MILLS, INC. AND SUBSIDIARIES
NOTE 1. BASIS OF PRESENTATION AND RECLASSIFICATIONS
Basis of Presentation
Our Consolidated Financial Statements include the accounts of General Mills, Inc. and all subsidiaries in whichwe have a controlling financial interest. Intercompany transactions and accounts, including any noncontrollingand redeemable interests’ share of those transactions, are eliminated in consolidation.
Our fiscal year ends on the last Sunday in May. Fiscal year 2020 consisted of 53 weeks, while fiscal years 2019and 2018 consisted of 52 weeks.
Certain reclassifications to our previously reported financial information have been made to conform to thecurrent period presentation. See Note 2 for additional information.
Change in Reporting Period
As part of a long-term plan to conform the fiscal year ends of all our operations, in fiscal 2020 we changed thereporting period of our Pet segment from an April fiscal year-end to a May fiscal year-end to match our fiscalcalendar. Accordingly, our fiscal 2020 results include 13 months of Pet segment results compared to 12 months infiscal 2019. The impact of this change was not material to our consolidated results of operations and, therefore, wedid not restate prior period financial statements for comparability. Our India business is on an April fiscal year end.
NOTE 2. SUMMARY OF SIGNIFICANT ACCOUNTING POLICIES
Cash and Cash Equivalents
We consider all investments purchased with an original maturity of three months or less to be cash equivalents.
Inventories
All inventories in the United States other than grain are valued at the lower of cost, using the last-in, first-out(LIFO) method, or market. Grain inventories are valued at net realizable value, and all related cash contracts andderivatives are valued at fair value, with all net changes in value recorded in earnings currently.
Inventories outside of the United States are generally valued at the lower of cost, using the first-in,first-out (FIFO) method, or net realizable value.
Shipping costs associated with the distribution of finished product to our customers are recorded as cost of sales,and are recognized when the related finished product is shipped to and accepted by the customer.
Land, Buildings, Equipment, and Depreciation
Land is recorded at historical cost. Buildings and equipment, including capitalized interest and internalengineering costs, are recorded at cost and depreciated over estimated useful lives, primarily using the straight-line method. Ordinary maintenance and repairs are charged to cost of sales. Buildings are usually depreciatedover 40 years, and equipment, furniture, and software are usually depreciated over 3 to 10 years. Fullydepreciated assets are retained in buildings and equipment until disposal. When an item is sold or retired, theaccounts are relieved of its cost and related accumulated depreciation and the resulting gains and losses, if any,are recognized in earnings. As of May 31, 2020, assets held for sale were insignificant.
Long-lived assets are reviewed for impairment whenever events or changes in circumstances indicate that thecarrying amount of an asset (or asset group) may not be recoverable. An impairment loss would be recognizedwhen estimated undiscounted future cash flows from the operation and disposition of the asset group are lessthan the carrying amount of the asset group. Asset groups have identifiable cash flows and are largely
61
independent of other asset groups. Measurement of an impairment loss would be based on the excess of thecarrying amount of the asset group over its fair value. Fair value is measured using a discounted cash flow modelor independent appraisals, as appropriate.
Goodwill and Other Intangible Assets
Goodwill is not subject to amortization and is tested for impairment annually and whenever events or changes incircumstances indicate that impairment may have occurred. We perform our annual goodwill and indefinite-livedintangible assets impairment test as of the first day of the second quarter of the fiscal year. Impairment testing isperformed for each of our reporting units. We compare the carrying value of a reporting unit, including goodwill,to the fair value of the unit. Carrying value is based on the assets and liabilities associated with the operations ofthat reporting unit, which often requires allocation of shared or corporate items among reporting units. If thecarrying amount of a reporting unit exceeds its fair value, impairment has occurred. We recognize an impairmentcharge for the amount by which the carrying amount of the reporting unit exceeds its fair value up to the totalamount of goodwill allocated to the reporting unit. Our estimates of fair value are determined based on adiscounted cash flow model. Growth rates for sales and profits are determined using inputs from our long-rangeplanning process. We also make estimates of discount rates, perpetuity growth assumptions, market comparables,and other factors.
We evaluate the useful lives of our other intangible assets, mainly brands, to determine if they are finite orindefinite-lived. Reaching a determination on useful life requires significant judgments and assumptionsregarding the future effects of obsolescence, demand, competition, other economic factors (such as the stabilityof the industry, known technological advances, legislative action that results in an uncertain or changingregulatory environment, and expected changes in distribution channels), the level of required maintenanceexpenditures, and the expected lives of other related groups of assets. Intangible assets that are deemed to havefinite lives are amortized on a straight-line basis, over their useful lives, generally ranging from 4 to 30 years.
Our indefinite-lived intangible assets, mainly intangible assets primarily associated with the Blue Buffalo,Pillsbury, Totino’s, Yoplait, Old El Paso, Progresso, Annie’s, Häagen-Dazs, and Yoki brands, are also tested forimpairment annually and whenever events or changes in circumstances indicate that their carrying value may notbe recoverable. Our estimate of the fair value of the brands is based on a discounted cash flow model using inputswhich included projected revenues from our long-range plan, assumed royalty rates that could be payable if wedid not own the brands, and a discount rate.
Our finite-lived intangible assets, primarily acquired franchise agreements and customer relationships, arereviewed for impairment whenever events or changes in circumstances indicate that the carrying amount of anasset may not be recoverable. An impairment loss would be recognized when estimated undiscounted future cashflows from the operation and disposition of the asset are less than the carrying amount of the asset. Assetsgenerally have identifiable cash flows and are largely independent of other assets. Measurement of animpairment loss would be based on the excess of the carrying amount of the asset over its fair value. Fair value ismeasured using a discounted cash flow model or other similar valuation model, as appropriate.
Leases
We determine whether an arrangement is a lease at inception. When our lease arrangements include lease andnon-lease components, we account for lease and non-lease components (e.g. common area maintenance)separately based on their relative standalone prices.
Any lease arrangements with an initial term of 12 months or less are not recorded on our Consolidated BalanceSheet, and we recognize lease costs for these lease arrangements on a straight-line basis over the lease term.Many of our lease arrangements provide us with options to exercise one or more renewal terms or to terminatethe lease arrangement. We include these options when we are reasonably certain to exercise them in the leaseterm used to establish our right of use assets and lease liabilities. Generally, our lease agreements do not includean option to purchase the leased asset, residual value guarantees, or material restrictive covenants.
62

We have certain lease arrangements with variable rental payments. Our lease arrangements for our Häagen-Dazsretail shops often include rental payments that are based on a percentage of retail sales. We have other leasearrangements that are adjusted periodically based on an inflation index or rate. The future variability of thesepayments and adjustments are unknown, and therefore they are not included as minimum lease payments used todetermine our right of use assets and lease liabilities. Variable rental payments are recognized in the period inwhich the obligation is incurred.
As most of our lease arrangements do not provide an implicit interest rate, we apply an incremental borrowingrate based on the information available at the commencement date of the lease arrangement to determine thepresent value of lease payments.
Investments in Unconsolidated Joint Ventures
Our investments in companies over which we have the ability to exercise significant influence are stated at costplus our share of undistributed earnings or losses. We receive royalty income from certain joint ventures, incurvarious expenses (primarily research and development), and record the tax impact of certain joint ventureoperations that are structured as partnerships. In addition, we make advances to our joint ventures in the form ofloans or capital investments. We also sell certain raw materials, semi-finished goods, and finished goods to thejoint ventures, generally at market prices.
In addition, we assess our investments in our joint ventures if we have reason to believe an impairment may haveoccurred including, but not limited to, as a result of ongoing operating losses, projected decreases in earnings,increases in the weighted-average cost of capital, or significant business disruptions. The significant assumptionsused to estimate fair value include revenue growth and profitability, royalty rates, capital spending, depreciationand taxes, foreign currency exchange rates, and a discount rate. By their nature, these projections andassumptions are uncertain. If we were to determine the current fair value of our investment was less than thecarrying value of the investment, then we would assess if the shortfall was of a temporary or permanent natureand write down the investment to its fair value if we concluded the impairment is other than temporary.
Redeemable Interest
We have a 51 percent controlling interest in Yoplait SAS, a consolidated entity. Sodiaal International (Sodiaal)holds the remaining 49 percent interest in Yoplait SAS. Sodiaal has the ability to put all or a portion of itsredeemable interest to us at fair value once per year, up to three times before December 2024. This put optionrequires us to classify Sodiaal’s interest as a redeemable interest outside of equity on our Consolidated BalanceSheets for as long as the put is exercisable by Sodiaal. When the put is no longer exercisable, the redeemableinterest will be reclassified to noncontrolling interests on our Consolidated Balance Sheets. We adjust the valueof the redeemable interest through additional paid-in capital on our Consolidated Balance Sheets quarterly to theredeemable interest’s redemption value, which approximates its fair value. The significant assumptions used toestimate the redemption value include projected revenue growth and profitability from our long-range plan,capital spending, depreciation, taxes, foreign currency exchange rates, and a discount rate.
Revenue Recognition
Our revenues primarily result from contracts with customers, which are generally short-term and have a singleperformance obligation – the delivery of product. We recognize revenue for the sale of packaged foods at thepoint in time when our performance obligation has been satisfied and control of the product has transferred to ourcustomer, which generally occurs when the shipment is accepted by our customer. Sales include shipping andhandling charges billed to the customer and are reported net of variable consideration and consideration payableto our customers, including trade promotion, consumer coupon redemption and other reductions to thetransaction price, including estimated allowances for returns, unsalable product, and prompt pay discounts. Sales,use, value-added, and other excise taxes are not included in revenue. Trade promotions are recorded usingsignificant judgment of estimated participation and performance levels for offered programs at the time of sale.Differences between estimated and actual reductions to the transaction price are recognized as a change inestimate in a subsequent period. We generally do not allow a right of return. However, on a limited case-by-case
63

basis with prior approval, we may allow customers to return product. In limited circumstances, product returnedin saleable condition is resold to other customers or outlets. Receivables from customers generally do not bearinterest. Payment terms and collection patterns vary around the world and by channel, and are short-term, and assuch, we do not have any significant financing components. Our allowance for doubtful accounts represents ourestimate of probable non-payments and credit losses in our existing receivables, as determined based on a reviewof past due balances and other specific account data. Account balances are written off against the allowancewhen we deem the amount is uncollectible. Please see Note 17 for a disaggregation of our revenue into categoriesthat depict how the nature, amount, timing, and uncertainty of revenue and cash flows are affected by economicfactors. We do not have material contract assets or liabilities arising from our contracts with customers.
Environmental Costs
Environmental costs relating to existing conditions caused by past operations that do not contribute to current orfuture revenues are expensed. Liabilities for anticipated remediation costs are recorded on an undiscounted basiswhen they are probable and reasonably estimable, generally no later than the completion of feasibility studies orour commitment to a plan of action.
Advertising Production Costs
We expense the production costs of advertising the first time that the advertising takes place.
Research and Development
All expenditures for research and development (R&D) are charged against earnings in the period incurred. R&Dincludes expenditures for new product and manufacturing process innovation, and the annual expenditures arecomprised primarily of internal salaries, wages, consulting, and supplies attributable to R&D activities. Othercosts include depreciation and maintenance of research facilities, including assets at facilities that are engaged inpilot plant activities.
Foreign Currency Translation
For all significant foreign operations, the functional currency is the local currency. Assets and liabilities of theseoperations are translated at the period-end exchange rates. Income statement accounts are translated using theaverage exchange rates prevailing during the period. Translation adjustments are reflected within accumulatedother comprehensive loss (AOCI) in stockholders’ equity. Gains and losses from foreign currency transactionsare included in net earnings for the period, except for gains and losses on investments in subsidiaries for whichsettlement is not planned for the foreseeable future and foreign exchange gains and losses on instrumentsdesignated as net investment hedges. These gains and losses are recorded in AOCI.
Derivative Instruments
All derivatives are recognized on our Consolidated Balance Sheets at fair value based on quoted market prices orour estimate of their fair value, and are recorded in either current or noncurrent assets or liabilities based on theirmaturity. Changes in the fair values of derivatives are recorded in net earnings or other comprehensive income,based on whether the instrument is designated and effective as a hedge transaction and, if so, the type of hedgetransaction. Gains or losses on derivative instruments reported in AOCI are reclassified to earnings in the periodthe hedged item affects earnings. If the underlying hedged transaction ceases to exist, any associated amountsreported in AOCI are reclassified to earnings at that time.
Stock-based Compensation
We generally measure compensation expense for grants of restricted stock units and performance share units usingthe value of a share of our stock on the date of grant. We estimate the value of stock option grants using a Black-Scholes valuation model. Generally, stock-based compensation is recognized straight line over the vesting period.Our stock-based compensation expense is recorded in selling, general and administrative (SG&A) expenses and costof sales in our Consolidated Statements of Earnings and allocated to each reportable segment in our segment results.
64

Certain equity-based compensation plans contain provisions that accelerate vesting of awards upon retirement,termination, or death of eligible employees and directors. We consider a stock-based award to be vested when theemployee’s or director’s retention of the award is no longer contingent on providing subsequent service. Accordingly,the related compensation cost is generally recognized immediately for awards granted to retirement-eligible individualsor over the period from the grant date to the date retirement eligibility is achieved, if less than the stated vesting period.
We report the benefits of tax deductions in excess of recognized compensation cost as an operating cash flow.
Defined Benefit Pension, Other Postretirement Benefit, and Postemployment Benefit Plans
We sponsor several domestic and foreign defined benefit plans to provide pension, health care, and other welfarebenefits to retired employees. Under certain circumstances, we also provide accruable benefits, primarilyseverance, to former or inactive employees in the United States, Canada, and Mexico. We recognize anobligation for any of these benefits that vest or accumulate with service. Postemployment benefits that do notvest or accumulate with service (such as severance based solely on annual pay rather than years of service) arecharged to expense when incurred. Our postemployment benefit plans are unfunded.
We recognize the underfunded or overfunded status of a defined benefit pension plan as an asset or liability andrecognize changes in the funded status in the year in which the changes occur through AOCI.
Use of Estimates
Preparing our Consolidated Financial Statements in conformity with accounting principles generally accepted inthe United States requires us to make estimates and assumptions that affect reported amounts of assets andliabilities, disclosures of contingent assets and liabilities at the date of the financial statements, and the reportedamounts of revenues and expenses during the reporting period. These estimates include our accounting forrevenue recognition, valuation of long-lived assets, intangible assets, redeemable interest, stock-basedcompensation, income taxes, and defined benefit pension, other postretirement benefit and postemploymentbenefit plans. Actual results could differ from our estimates.
New Accounting Standards
In the fourth quarter of fiscal 2020, we adopted new accounting requirements related to the annual disclosurerequirements for defined benefit pension and other postretirement benefit plans. The new standard modifiesspecific disclosures to improve usefulness to financial statement users. We adopted the requirements of the newstandard using a retrospective approach. The adoption of this guidance did not impact our results of operations orfinancial position.
In the first quarter of fiscal 2020, we adopted new accounting requirements for hedge accounting. The new standardamends the hedge accounting recognition and presentation requirements to better align an entity’s risk managementactivities and financial reporting. The new standard also simplifies the application of hedge accounting guidance.The adoption did not have a material impact on our results of operations or financial position.
In the first quarter of fiscal 2020, we adopted new requirements for the accounting, presentation, andclassification of leases. This results in certain leases being capitalized as a right of use asset with a relatedliability on our Consolidated Balance Sheet. We performed a review of our lease portfolio, implemented leaseaccounting software, and developed a centralized business process with corresponding controls. We adopted thisguidance utilizing the cumulative effect adjustment approach, which required application of the guidance at theadoption date, and elected certain practical expedients permitted under the transition guidance, including notreassessing whether existing contracts contain leases and carrying forward the historical classification of thoseleases. In addition, we elected not to recognize leases with an initial term of 12 months or less on ourConsolidated Balance Sheet and to continue our historical treatment of land easements, under permittedelections. This guidance did not have a material impact on retained earnings, our Consolidated Statements ofEarnings, or our Consolidated Statements of Cash Flows. See Note 7 to the Consolidated Financial Statementsfor additional information on the impact to our Consolidated Balance Sheet.
65

In the first quarter of fiscal 2019, we adopted new accounting requirements related to the presentation of netperiodic defined benefit pension expense, net periodic postretirement benefit expense, and net periodicpostemployment benefit expense (collectively “net periodic benefit expense”). The new standard requires theservice cost component of net periodic benefit expense to be recorded in the same line items as other employeecompensation costs within our Consolidated Statements of Earnings. Other components of net periodic benefitexpense must be presented separately outside of operating profit in our Consolidated Statements of Earnings. Inaddition, the new standard requires that only the service cost component of net periodic benefit expense is eligiblefor capitalization. The new standard requires retrospective adoption of the presentation of net periodic benefitexpense and prospective application of the capitalization of the service cost component. The impact of the adoptionof this standard on our results of operations was a decrease to our operating profit of $87.9 million and$89.4 million and a corresponding increase to benefit plan non-service income of $87.9 million and $89.4 millionfor fiscal 2019 and fiscal 2018, respectively. There were no changes to our reported segment operating profit.
In the first quarter of fiscal 2019, we adopted new accounting requirements for the recognition of revenue fromcontracts with customers. Under the new standard, we apply a principles-based five step model to recognize revenueupon the transfer of control of promised goods to customers and in an amount that reflects the consideration forwhich we expect to be entitled to in exchange for those goods. We did not identify any material differences resultingfrom applying the new requirements to our revenue contracts. Additionally, we did not identify any significantchanges to our business processes, systems, and controls to support recognition and disclosure requirements underthe new guidance. We adopted the requirements of the new standard and subsequent amendments to all contracts inthe first quarter of fiscal 2019 using the cumulative effect approach. We recorded a $33.9 million cumulative effectadjustment net of income tax effects to the opening balance of fiscal 2019 retained earnings, a decrease to deferredincome taxes of $11.4 million, and an increase to other current liabilities of $45.3 million related to the timing ofrecognition of certain promotional expenditures.
In the third quarter of fiscal 2018, we adopted new accounting requirements that codify Securities and ExchangeCommission (SEC) Staff Accounting Bulletin No. 118, as it relates to allowing for recognition of provisionalamounts related to the U.S. Tax Cuts and Jobs Act (TCJA) in the event that the accounting is not complete and areasonable estimate can be made. Where necessary information is not available, prepared, or analyzed todetermine a reasonable estimate, no provisional amount should be recorded. The guidance allows for ameasurement period of up to one year from the enactment date to finalize the accounting related to the TCJA. Infiscal 2019, we completed our accounting for the tax effects of the TCJA.
In the third quarter of fiscal 2018, we adopted new accounting requirements that provide the option to reclassifystranded income tax effects resulting from the TCJA from AOCI to retained earnings. We elected to reclassifythe stranded income tax effects of the TCJA of $329.4 million from AOCI to retained earnings. Thisreclassification consisted of deferred taxes originally recorded in AOCI that exceeded the newly enacted federalcorporate tax rate. The new accounting requirements allowed for adjustments to reclassification amounts insubsequent periods as a result of changes to the provisional amounts recorded.
In the first quarter of fiscal 2018, we adopted new requirements for the accounting and presentation of stock-based payments. The adoption of this guidance resulted in the prospective recognition of realized windfall andshortfall tax benefits related to the exercise or vesting of stock-based awards in our Consolidated Statements ofEarnings instead of additional paid-in capital within our Consolidated Balance Sheets. We retrospectivelyadopted the guidance related to reclassification of realized windfall tax benefits, which resulted inreclassifications of cash provided by financing activities to operating activities in our Consolidated Statements ofCash Flows. Additionally, we retrospectively adopted the guidance related to reclassification of employee taxwithholdings, which resulted in reclassifications of cash used by operating activities to financing activities in ourConsolidated Statements of Cash Flows. Stock-based compensation expense continues to reflect estimatedforfeitures.
In the first quarter of fiscal 2018, we adopted new accounting requirements that permit reporting entities tomeasure a goodwill impairment loss by the amount by which a reporting unit’s carrying value exceeds the
66

reporting unit’s fair value. Previously, goodwill impairment losses were required to be measured by determiningthe implied fair value of goodwill. The adoption of this guidance did not impact our results of operations orfinancial position.
NOTE 3. DIVESTITURES
During the third quarter of fiscal 2019, we sold our La Salteña fresh pasta and refrigerated dough business inArgentina, and recorded a pre-tax loss of $35.4 million. During the fourth quarter of fiscal 2019, we sold our yogurtbusiness in China and simultaneously entered into a new Yoplait license agreement with the purchaser for their useof the Yoplait brand. We recorded a pre-tax gain of $5.4 million.
NOTE 4. RESTRUCTURING, IMPAIRMENT, AND OTHER EXIT COSTS
ASSET IMPAIRMENTS
In fiscal 2019, we recorded a $192.6 million charge related to the impairment of our Progresso, Food ShouldTaste Good, and Mountain High brand intangible assets in restructuring, impairment, and other exit costs.
In fiscal 2019, we recorded a $14.8 million charge in restructuring, impairment, and other exit costs related to theimpairment of certain manufacturing assets in our North America Retail and Asia & Latin America segments.
In fiscal 2018, we recorded a $96.9 million charge related to the impairment of our Yoki, Mountain High, andImmaculate Baking brand intangible assets in restructuring, impairment, and other exit costs.
RESTRUCTURING INITIATIVES
We view our restructuring activities as actions that help us meet our long-term growth targets. Activities weundertake must meet internal rate of return and net present value targets. Each restructuring action normally takesone to two years to complete. At completion (or as each major stage is completed in the case of multi-yearprograms), the project begins to deliver cash savings and/or reduced depreciation. These activities result invarious restructuring costs, including asset write-offs, exit charges including severance, contract termination fees,and decommissioning and other costs. Accelerated depreciation associated with restructured assets, as used in thecontext of our disclosures regarding restructuring activity, refers to the increase in depreciation expense causedby shortening the useful life or updating the salvage value of depreciable fixed assets to coincide with the end ofproduction under an approved restructuring plan. Any impairment of the asset is recognized immediately in theperiod the plan is approved.
In fiscal 2020, we did not undertake any new restructuring actions and recorded $50.2 million of restructuringcharges for previously announced restructuring actions.
In fiscal 2019, we recorded $77.6 million of restructuring charges primarily related to approved restructuringactions to drive efficiencies in targeted areas of our global supply chain. In fiscal 2020, we increased the estimateof expected severance charges by $3 million and decreased the estimate of other exit costs related to these actionsby $4 million. We now expect to spend a total of approximately $24 million of cash related to these actions.Certain actions are subject to union negotiations and works counsel consultations, where required. We expectthese actions to be completed by the end of fiscal 2022. The remaining expense to be incurred is approximately$8 million of other exit costs.
We paid net $6.6 million of cash related to restructuring actions previously announced in fiscal 2020, comparedto $49.3 million in fiscal 2019.
67

Charges recorded in fiscal 2019 were as follows:
Expense, in Millions
Targeted actions in global supply chain $80.2Charges associated with restructuring actions previously announced (2.6)
Total $77.6
Charges recorded in fiscal 2018 were as follows:
Expense, in Millions
Global cost savings initiatives $49.3Charges associated with restructuring actions previously announced 33.4
Total $82.7
Restructuring and impairment charges and project-related costs are classified in our Consolidated Statements ofEarnings as follows:
Fiscal YearIn Millions 2020 2019 2018
Cost of sales $ 25.8 $ 9.9 $ 14.0Restructuring, impairment, and other exit costs 24.4 275.1 165.6
Total restructuring and impairment charges 50.2 285.0 179.6
Project-related costs classified in cost of sales $ 1.5 $ 1.3 $ 11.3
The roll forward of our restructuring and other exit cost reserves, included in other current liabilities, is asfollows:
In Millions SeveranceContract
TerminationOther
Exit Costs Total
Reserve balance as of May 28, 2017 $ 81.8 $ 0.7 $ 2.5 $ 85.0Fiscal 2018 charges, including
foreign currency translation 40.8 0.2 (0.7) 40.3Utilized in fiscal 2018 (56.6) (0.8) (1.1) (58.5)
Reserve balance as of May 27, 2018 66.0 0.1 0.7 66.8Fiscal 2019 charges, including
foreign currency translation 7.7 2.5 1.4 11.6Utilized in fiscal 2019 (37.2) (2.6) (2.1) (41.9)
Reserve balance as of May 26, 2019 36.5 - - 36.5Fiscal 2020 charges, including
foreign currency translation (5.0) 0.8 1.7 (2.5)Utilized in fiscal 2020 (13.7) (0.8) (1.7) (16.2)
Reserve balance as of May 31, 2020 $ 17.8 $ - $ - $ 17.8
The charges recognized in the roll forward of our reserves for restructuring and other exit costs do not includeitems charged directly to expense (e.g., asset impairment charges, the gain or loss on the sale of restructuredassets, and the write-off of spare parts) and other periodic exit costs recognized as incurred, as those items are notreflected in our restructuring and other exit cost reserves on our Consolidated Balance Sheets.
68

NOTE 5. INVESTMENTS IN UNCONSOLIDATED JOINT VENTURES
We have a 50 percent interest in Cereal Partners Worldwide (CPW), which manufactures and marketsready-to-eat cereal products in more than 130 countries outside the United States and Canada. CPW also marketscereal bars in several European countries and manufactures private label cereals for customers in the UnitedKingdom. We have guaranteed a portion of CPW’s debt and its pension obligation in the United Kingdom.
We also have a 50 percent interest in Häagen-Dazs Japan, Inc. (HDJ). This joint venture manufactures andmarkets Häagen-Dazs ice cream products and frozen novelties.
Results from our CPW and HDJ joint ventures are reported for the 12 months ended March 31.
Joint venture related balance sheet activity is as follows:
In MillionsMay 31,
2020May 26,
2019
Cumulative investments $ 481.4 $ 452.9Goodwill and other intangibles 460.5 472.1Aggregate advances included in cumulative investments 279.5 249.0
Joint venture earnings and cash flow activity is as follows:
Fiscal YearIn Millions 2020 2019 2018
Sales to joint ventures $ 5.9 $ 4.2 $ 7.4Net advances (repayments) 48.0 (0.1) 17.3Dividends received 76.5 86.7 113.2
Summary combined financial information for the joint ventures on a 100 percent basis is as follows:
Fiscal YearIn Millions 2020 2019 2018
Net sales:CPW $ 1,654.3 $ 1,647.7 $ 1,734.0HDJ 391.3 396.2 430.4
Total net sales 2,045.6 2,043.9 2,164.4
Gross margin 785.3 744.4 853.6Earnings before income taxes 214.0 155.4 216.2Earnings after income taxes 176.5 111.9 176.7
In MillionsMay 31,
2020May 26,
2019
Current assets $ 870.0 $ 895.6Noncurrent assets 781.4 839.2Current liabilities 1,365.6 1,517.3Noncurrent liabilities 104.2 77.1
69

NOTE 6. GOODWILL AND OTHER INTANGIBLE ASSETS
The components of goodwill and other intangible assets are as follows:
In MillionsMay 31,
2020May 26,
2019
Goodwill $ 13,923.2 $ 13,995.8
Other intangible assets:Intangible assets not subject to amortization:
Brands and other indefinite-lived intangibles 6,561.4 6,590.8Intangible assets subject to amortization:
Franchise agreements, customer relationships,and other finite-lived intangibles 777.8 786.1
Less accumulated amortization (243.4) (210.1)
Intangible assets subject to amortization 534.4 576.0
Other intangible assets 7,095.8 7,166.8
Total $ 21,019.0 $ 21,162.6
Based on the carrying value of finite-lived intangible assets as of May 31, 2020, amortization expense for each ofthe next five fiscal years is estimated to be approximately $40 million.
The changes in the carrying amount of goodwill for fiscal 2018, 2019, and 2020 are as follows:
In Millions
NorthAmerica
Retail Pet
ConvenienceStores &
FoodserviceEurope &Australia
Asia &Latin
AmericaJoint
Ventures Total
Balance as of May 28, 2017 $ 6,406.5 $ - $ 918.8 $ 700.8 $ 312.4 $ 408.7 $ 8,747.2Acquisition - 5,294.9 - - - - 5,294.9Other activity, primarily
foreign currency translation 4.1 - - 29.1 (27.4) 17.1 22.9
Balance as of May 27, 2018 6,410.6 5,294.9 918.8 729.9 285.0 425.8 14,065.0Divestitures - - - - (0.5) - (0.5)Purchase accounting
adjustment - 5.6 - - - - 5.6
Other activity, primarilyforeign currency translation (4.1) - - (29.5) (24.3) (16.4) (74.3)
Balance as of May 26, 2019 6,406.5 5,300.5 918.8 700.4 260.2 409.4 13,995.8Other activity, primarily
foreign currency translation (2.8) - - (9.7) (56.4) (3.7) (72.6)
Balance as of May 31, 2020 $ 6,403.7 $ 5,300.5 $ 918.8 $ 690.7 $ 203.8 $ 405.7 $ 13,923.2
70

The changes in the carrying amount of other intangible assets for fiscal 2018, 2019, and 2020 are as follows:
In Millions Total
Balance as of May 28, 2017 $ 4,530.4Acquisition 3,015.0Impairment charge (96.9)Other activity, primarily amortization
and foreign currency translation (3.4)
Balance as of May 27, 2018 $ 7,445.1Impairment charge (192.6)Other activity, primarily amortization
and foreign currency translation (85.7)
Balance as of May 26, 2019 $ 7,166.8Other activity, primarily amortization
and foreign currency translation (71.0)
Balance as of May 31, 2020 $ 7,095.8
Our annual goodwill and indefinite-lived intangible assets impairment test was performed on the first day of thesecond quarter of fiscal 2020, and we determined there was no impairment of our intangible assets as theirrelated fair values were substantially in excess of the carrying values, except for the Europe & Australia reportingunit and the Progresso brand intangible asset.
The excess fair values as of the fiscal 2020 test date of the Europe & Australia reporting unit andthe Progresso brand intangible asset were as follows:
In Millions
Carrying Valueof Intangible
Asset
Excess Fair Value asof Fiscal 2020 Test
Date
Europe & Australia $ 672.6 14%Progresso $ 330.0 5%
In addition, while having significant coverage as of our fiscal 2020 assessment date, the Pillsbury brandintangible asset had risk of decreasing coverage. We will continue to monitor these businesses for potentialimpairment.
We did not identify any indicators of impairment, including impacts of the recent COVID-19 pandemic, for anygoodwill or indefinite-lived intangible assets as of May 31, 2020.
In fiscal 2019, as a result of lower sales projections in our long-range plans for the businesses supporting theProgresso, Food Should Taste Good, and Mountain High brand intangible assets, we recorded a $192.6 millionimpairment charge in restructuring, impairment, and other exit costs. In fiscal 2018, we recorded a $96.9 millioncharge related to the impairment of our Yoki, Mountain High, and Immaculate Baking brand intangible assets inrestructuring, impairment, and other exit costs. Significant assumptions used in these assessments included ourlong-range cash flow projections for the businesses, royalty rates, weighted-average cost of capital rates, and taxrates.
NOTE 7. LEASES
Our lease portfolio primarily consists of operating lease arrangements for certain warehouse and distributionspace, office space, retail shops, production facilities, rail cars, production and distribution equipment,automobiles, and office equipment. Our lease costs associated with finance leases and sale-leaseback transactionsand our lease income associated with lessor and sublease arrangements are not material to our ConsolidatedFinancial Statements.
71

Components of our lease cost are as follows:
Fiscal Year
In Millions 2020
Operating lease cost $ 133.5Variable lease cost 14.4Short-term lease cost 23.3
Rent expense under all operating leases from continuing operations was $184.9 million in fiscal 2019 and$189.4 million in fiscal 2018.
Maturities of our operating and finance lease obligations by fiscal year are as follows:
In Millions Operating Leases Finance Leases
Fiscal 2021 $ 115.4 $ 0.1Fiscal 2022 97.6 0.1Fiscal 2023 73.9 -Fiscal 2024 56.8 -Fiscal 2025 35.1 -After fiscal 2025 33.7 -
Total noncancelable future leaseobligations $ 412.5 $ 0.2
Less: Interest (33.5) -
Present value of lease obligations $ 379.0 $ 0.2
The lease payments presented in the table above exclude $46.2 million of minimum lease payments for operatingleases we have committed to but have not yet commenced as of May 31, 2020.
Noncancelable future operating lease commitments as of May 26, 2019, were as follows:
In Millions
Fiscal 2020 $ 120.0Fiscal 2021 101.7Fiscal 2022 85.0Fiscal 2023 63.8Fiscal 2024 49.1After fiscal 2024 63.0
Total noncancelable future lease commitments $ 482.6
The weighted-average remaining lease term and weighted-average discount rate for our operating leases are asfollows:
May 31, 2020
Weighted-average remaining lease term 4.6 yearsWeighted-average discount rate 4.1 %
72

Supplemental operating cash flow information and non-cash activity related to our operating leases are asfollows:
Fiscal Year
In Millions 2020
Cash paid for amounts included in the measurement of leaseliabilities $ 131.0
Right of use assets obtained in exchange for new leaseliabilities $ 46.3
NOTE 8. FINANCIAL INSTRUMENTS, RISK MANAGEMENT ACTIVITIES, AND FAIR VALUES
FINANCIAL INSTRUMENTS
The carrying values of cash and cash equivalents, receivables, accounts payable, other current liabilities, andnotes payable approximate fair value. Marketable securities are carried at fair value. As of May 31, 2020, andMay 26, 2019, a comparison of cost and market values of our marketable debt and equity securities is as follows:
Cost Fair Value Gross Gains Gross Losses
Fiscal Year Fiscal Year Fiscal Year Fiscal Year
In Millions 2020 2019 2020 2019 2020 2019 2020 2019
Available for sale debt securities $ 56.7 $ 34.3 $ 56.7 $ 34.3 $ - $ - $ - $ -Equity securities 0.3 0.6 4.9 18.5 4.6 17.9 - -
Total $ 57.0 $ 34.9 $ 61.6 $ 52.8 $ 4.6 $ 17.9 $ - $ -
During fiscal 2020, we received $16.0 million of proceeds and recorded $4.0 million of realized losses from thesale of marketable securities. There were no realized gains or losses from sales of marketable securities in fiscal2019. Gains and losses are determined by specific identification. Classification of marketable securities ascurrent or noncurrent is dependent upon our intended holding period and the security’s maturity date. Theaggregate unrealized gains and losses on available-for-sale debt securities, net of tax effects, are classified inAOCI within stockholders’ equity.
Scheduled maturities of our marketable securities are as follows:
Marketable SecuritiesIn Millions Cost Fair ValueUnder 1 year (current) $ 56.7 $ 56.7Equity securities 0.3 4.9
Total $ 57.0 $ 61.6
As of May 31, 2020, we had $2.3 million of marketable debt securities and $15.9 million of cash and cashequivalents pledged as collateral for derivative contracts. As of May 31, 2020, $43.5 million of certain accountsreceivable were pledged as collateral against a foreign uncommitted line of credit.
The fair value and carrying amounts of long-term debt, including the current portion, were $14,538.4 million and$13,260.5 million, respectively, as of May 31, 2020. The fair value of long-term debt was estimated using marketquotations and discounted cash flows based on our current incremental borrowing rates for similar types ofinstruments. Long-term debt is a Level 2 liability in the fair value hierarchy.
73

RISK MANAGEMENT ACTIVITIES
As a part of our ongoing operations, we are exposed to market risks such as changes in interest and foreigncurrency exchange rates and commodity and equity prices. To manage these risks, we may enter into variousderivative transactions (e.g., futures, options, and swaps) pursuant to our established policies.
COMMODITY PRICE RISK
Many commodities we use in the production and distribution of our products are exposed to market price risks.We utilize derivatives to manage price risk for our principal ingredients and energy costs, including grains (oats,wheat, and corn), oils (principally soybean), dairy products, natural gas, and diesel fuel. Our primary objectivewhen entering into these derivative contracts is to achieve certainty with regard to the future price ofcommodities purchased for use in our supply chain. We manage our exposures through a combination ofpurchase orders, long-term contracts with suppliers, exchange-traded futures and options, and over-the-counteroptions and swaps. We offset our exposures based on current and projected market conditions and generally seekto acquire the inputs at as close to our planned cost as possible.
We use derivatives to manage our exposure to changes in commodity prices. We do not perform the assessmentsrequired to achieve hedge accounting for commodity derivative positions. Accordingly, the changes in the valuesof these derivatives are recorded currently in cost of sales in our Consolidated Statements of Earnings.
Although we do not meet the criteria for cash flow hedge accounting, we believe that these instruments areeffective in achieving our objective of providing certainty in the future price of commodities purchased for use inour supply chain. Accordingly, for purposes of measuring segment operating performance these gains and lossesare reported in unallocated corporate items outside of segment operating results until such time that the exposurewe are managing affects earnings. At that time we reclassify the gain or loss from unallocated corporate items tosegment operating profit, allowing our operating segments to realize the economic effects of the derivativewithout experiencing any resulting mark-to-market volatility, which remains in unallocated corporate items.
Unallocated corporate items for fiscal 2020, 2019, and 2018 included:
Fiscal YearIn Millions 2020 2019 2018
Net (loss) gain on mark-to-market valuation ofcommodity positions $ (63.0) $ (39.0) $ 14.3
Net loss on commodity positions reclassified fromunallocated corporate items to segment operating profit 35.6 10.0 11.3
Net mark-to-market revaluation of certain grain inventories 2.7 (7.0) 6.5
Net mark-to-market valuation of certain commoditypositions recognized in unallocated corporate items $ (24.7) $ (36.0) $ 32.1
As of May 31, 2020, the net notional value of commodity derivatives was $234.5 million, of which$159.4 million related to agricultural inputs and $75.1 million related to energy inputs. These contracts relate toinputs that generally will be utilized within the next 12 months.
INTEREST RATE RISK
We are exposed to interest rate volatility with regard to future issuances of fixed-rate debt, and existing andfuture issuances of floating-rate debt. Primary exposures include U.S. Treasury rates, LIBOR, Euribor, andcommercial paper rates in the United States and Europe. We use interest rate swaps, forward-starting interest rateswaps, and treasury locks to hedge our exposure to interest rate changes, to reduce the volatility of our financingcosts, and to achieve a desired proportion of fixed rate versus floating-rate debt, based on current and projectedmarket conditions. Generally under these swaps, we agree with a counterparty to exchange the differencebetween fixed-rate and floating-rate interest amounts based on an agreed upon notional principal amount.
74

Floating Interest Rate Exposures — Floating-to-fixed interest rate swaps are accounted for as cash flow hedges,as are all hedges of forecasted issuances of debt. Effectiveness is assessed based on either the perfectly effectivehypothetical derivative method or changes in the present value of interest payments on the underlying debt.Effective gains and losses deferred to AOCI are reclassified into earnings over the life of the associated debt.
Fixed Interest Rate Exposures — Fixed-to-floating interest rate swaps are accounted for as fair value hedges witheffectiveness assessed based on changes in the fair value of the underlying debt and derivatives, usingincremental borrowing rates currently available on loans with similar terms and maturities.
In advance of planned debt financing, we entered into $750.0 million notional amount of treasury locks dueApril 2, 2020 with an average fixed rate of 0.67 percent. All of these treasury locks were cash settled for$1.4 million during the fourth quarter of fiscal 2020, concurrent with the issuance of our $750.0 million 10-yearfixed rate notes.
In advance of planned debt financing, in the fourth quarter of fiscal 2020, we entered into $300.0 million notionalamount of treasury locks due January 13, 2022 with an average fixed rate of 0.85 percent.
During the third quarter of fiscal 2020, we entered into a €600.0 million notional amount interest rate swap toconvert our €600.0 million fixed rate notes due January 15, 2026, to a floating rate.
During the second quarter of fiscal 2020, we entered into a $500.0 million notional amount interest rate swap toconvert a portion of our $850.0 million floating-rate notes due April 16, 2021, to a fixed rate.
As of May 31, 2020, the pre-tax amount of cash-settled interest rate hedge gain or loss remaining in AOCI,which will be reclassified to earnings over the remaining term of the related underlying debt, follows:
In Millions Gain/(Loss)
3.15% notes due December 15, 2021 $ (15.2)2.6% notes due October 12, 2022 1.71.0% notes due April 27, 2023 (0.7)3.7% notes due October 17, 2023 (1.1)3.65% notes due February 15, 2024 6.64.0% notes due April 17, 2025 (2.8)3.2% notes due February 10, 2027 11.41.5% notes due April 27, 2027 (2.3)4.2% notes due April 17, 2028 (8.0)4.55% notes due April 17, 2038 (9.8)5.4% notes due June 15, 2040 (11.2)4.15% notes due February 15, 2043 8.94.7% notes due April 17, 2048 (13.2)
Net pre-tax hedge loss in AOCI $ (35.7)
75

The following table summarizes the notional amounts and weighted-average interest rates of our interest ratederivatives. Average floating rates are based on rates as of the end of the reporting period.
In MillionsMay 31,
2020May 26,
2019
Pay-floating swaps - notional amount $ 666.1 $ 500.0Average receive rate 0.4% 2.2%Average pay rate 0.3% 3.1%
Pay-fixed swaps - notional amount $ 500.0 $ -Average receive rate 1.7% -%Average pay rate 2.1% -%
The floating rate swap contracts outstanding as of May 31, 2020, mature in fiscal 2021. The fixed rate swapcontracts outstanding as of May 31, 2020, mature in fiscal 2026.
FOREIGN EXCHANGE RISK
Foreign currency fluctuations affect our net investments in foreign subsidiaries and foreign currency cash flows relatedto third party purchases, intercompany loans, product shipments, and foreign-denominated debt. We are also exposedto the translation of foreign currency earnings to the U.S. dollar. Our principal exposures are to the Australian dollar,Brazilian real, British pound sterling, Canadian dollar, Chinese renminbi, euro, Japanese yen, Mexican peso, and Swissfranc. We primarily use foreign currency forward contracts to selectively hedge our foreign currency cash flowexposures. We also generally swap our foreign-denominated commercial paper borrowings and nonfunctional currencyintercompany loans back to U.S. dollars or the functional currency of the entity with foreign exchange exposure. Thegains or losses on these derivatives offset the foreign currency revaluation gains or losses recorded in earnings on theassociated borrowings. We generally do not hedge more than 18 months in advance.
As of May 31, 2020, the net notional value of foreign exchange derivatives was $967.2 million.
We also have net investments in foreign subsidiaries that are denominated in euros. We previously hedged aportion of these net investments by issuing euro-denominated commercial paper and foreign exchange forwardcontracts. As of May 31, 2020, we hedged a portion of these net investments with €2,200.0 million of eurodenominated bonds. As of May 31, 2020, we had deferred net foreign currency transaction losses of$29.9 million in AOCI associated with net investment hedging activity.
EQUITY INSTRUMENTS
Equity price movements affect our compensation expense as certain investments made by our employees in ourdeferred compensation plan are revalued. We use equity swaps to manage this risk. As of May 31, 2020, the netnotional amount of our equity swaps was $146.9 million. These swap contracts mature in fiscal 2021.
76
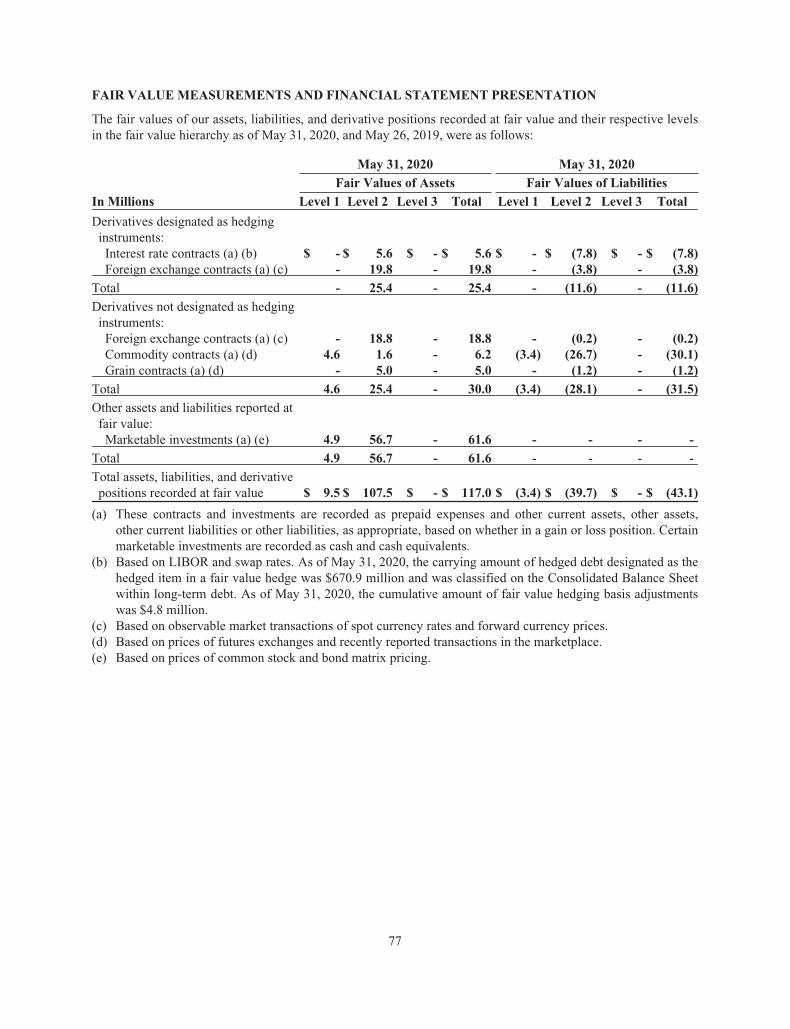
FAIR VALUE MEASUREMENTS AND FINANCIAL STATEMENT PRESENTATION
The fair values of our assets, liabilities, and derivative positions recorded at fair value and their respective levelsin the fair value hierarchy as of May 31, 2020, and May 26, 2019, were as follows:
May 31, 2020 May 31, 2020
Fair Values of Assets Fair Values of Liabilities
In Millions Level 1 Level 2 Level 3 Total Level 1 Level 2 Level 3 Total
Derivatives designated as hedginginstruments:Interest rate contracts (a) (b) $ - $ 5.6 $ - $ 5.6 $ - $ (7.8) $ - $ (7.8)Foreign exchange contracts (a) (c) - 19.8 - 19.8 - (3.8) - (3.8)
Total - 25.4 - 25.4 - (11.6) - (11.6)
Derivatives not designated as hedginginstruments:Foreign exchange contracts (a) (c) - 18.8 - 18.8 - (0.2) - (0.2)Commodity contracts (a) (d) 4.6 1.6 - 6.2 (3.4) (26.7) - (30.1)Grain contracts (a) (d) - 5.0 - 5.0 - (1.2) - (1.2)
Total 4.6 25.4 - 30.0 (3.4) (28.1) - (31.5)
Other assets and liabilities reported atfair value:Marketable investments (a) (e) 4.9 56.7 - 61.6 - - - -
Total 4.9 56.7 - 61.6 - - - -
Total assets, liabilities, and derivativepositions recorded at fair value $ 9.5 $ 107.5 $ - $ 117.0 $ (3.4) $ (39.7) $ - $ (43.1)
(a) These contracts and investments are recorded as prepaid expenses and other current assets, other assets,other current liabilities or other liabilities, as appropriate, based on whether in a gain or loss position. Certainmarketable investments are recorded as cash and cash equivalents.
(b) Based on LIBOR and swap rates. As of May 31, 2020, the carrying amount of hedged debt designated as thehedged item in a fair value hedge was $670.9 million and was classified on the Consolidated Balance Sheetwithin long-term debt. As of May 31, 2020, the cumulative amount of fair value hedging basis adjustmentswas $4.8 million.
(c) Based on observable market transactions of spot currency rates and forward currency prices.(d) Based on prices of futures exchanges and recently reported transactions in the marketplace.(e) Based on prices of common stock and bond matrix pricing.
77

May 26, 2019 May 26, 2019
Fair Values of Assets Fair Values of Liabilities
In Millions Level 1 Level 2 Level 3 Total Level 1 Level 2 Level 3 Total
Derivatives designated as hedginginstruments:Interest rate contracts (a) (b) $ - $ - $ - $ - $ - $ (1.9) $ - $ (1.9)Foreign exchange contracts (a) (c) - 12.9 - 12.9 - (3.3) - (3.3)
Total - 12.9 - 12.9 - (5.2) - (5.2)
Derivatives not designated as hedginginstruments:Foreign exchange contracts (a) (c) - 2.4 - 2.4 - (1.9) - (1.9)Commodity contracts (a) (d) 1.4 5.2 - 6.6 (4.4) (3.5) - (7.9)Grain contracts (a) (d) - 6.7 - 6.7 - (2.3) - (2.3)
Total 1.4 14.3 - 15.7 (4.4) (7.7) - (12.1)
Other assets and liabilities reported atfair value:Marketable investments (a) (e) 18.5 34.3 - 52.8 - - - -Long-lived assets (f) - 19.0 - 19.0 - - - -Indefinite-lived intangible assets (g) - - 330.0 330.0 - - - -
Total 18.5 53.3 330.0 401.8 - - - -
Total assets, liabilities, and derivativepositions recorded at fair value $ 19.9 $ 80.5 $ 330.0 $ 430.4 $ (4.4) $ (12.9) $ - $ (17.3)
(a) These contracts and investments are recorded as prepaid expenses and other current assets, other assets,other current liabilities or other liabilities, as appropriate, based on whether in a gain or loss position. Certainmarketable investments are recorded as cash and cash equivalents.
(b) Based on LIBOR and swap rates. As of May 26, 2019, the carrying amount of hedged debt designated as thehedged item in a fair value hedge was $493.3 million and was classified on the Consolidated Balance Sheetwithin the current portion of long-term debt. As of May 26, 2019, the cumulative amount of fair valuehedging basis adjustments was $6.7 million.
(c) Based on observable market transactions of spot currency rates and forward currency prices.(d) Based on prices of futures exchanges and recently reported transactions in the marketplace.(e) Based on prices of common stock and bond matrix pricing.(f) We recorded $61.2 million in non-cash impairment charges in fiscal 2019 to write down certain long-lived
assets to their fair value. Fair value was based on recently reported transactions for similar assets in themarketplace. These assets had a carrying value of $80.2 million and were associated with the restructuringactions described in Note 4.
(g) See Note 6.
We did not significantly change our valuation techniques from prior periods.
78

Information related to our cash flow hedges, fair value hedges, and other derivatives not designated as hedginginstruments for the fiscal years ended May 31, 2020, and May 26, 2019, follows:
Interest RateContracts
Foreign ExchangeContracts
EquityContracts
CommodityContracts Total
Fiscal Year Fiscal Year Fiscal Year Fiscal Year Fiscal Year
In Millions 2020 2019 2020 2019 2020 2019 2020 2019 2020 2019
Derivatives in Cash Flow HedgingRelationships:Amount of gain (loss) recognized in
other comprehensive income (OCI) $ (6.9) $ - $ 11.3 $ 15.7 $ - $ - $ - $ - $ 4.4 $ 15.7Amount of net gain (loss) reclassified
from AOCI into earnings (a) (9.5) (9.0) 4.6 8.4 - - - - (4.9) (0.6)Amount of net gain recognized
in earnings (b) - - - 0.5 - - - - - 0.5Derivatives in Fair Value Hedging
Relationships:Amount of net gain (loss) recognized
in earnings (c) (4.9) 2.4 - - - - - - (4.9) 2.4Derivatives Not Designated as Hedging
Instruments:Amount of net gain (loss) recognized
in earnings (b) (1.4) - 15.7 7.5 8.6 0.7 (55.6) (33.6) (32.7) (25.4)
(a) Gain (loss) reclassified from AOCI into earnings is reported in interest, net for interest rate swaps and in costof sales and SG&A expenses for foreign exchange contracts. For the fiscal year ended May 31, 2020, theamount of gain reclassified from AOCI into cost of sales was $5.1 million and the amount of lossreclassified from AOCI into SG&A was $0.5 million. For the fiscal year ended May 26, 2019, the amount ofgain reclassified from AOCI into cost of sales was $10.5 million and the amount of loss reclassified fromAOCI into SG&A was $2.1 million.
(b) Gain recognized in earnings is related to the ineffective portion of the hedging relationship, reported inSG&A expenses for foreign exchange contracts and interest, net for interest rate contracts. No amounts werereported as a result of being excluded from the assessment of hedge effectiveness.
(c) Gain (loss) recognized in earnings is reported in interest, net for interest rate contracts, in cost of sales forcommodity contracts, and in SG&A expenses for equity contracts and foreign exchange contracts.
79

The following tables reconcile the net fair values of assets and liabilities subject to offsetting arrangements that arerecorded in our Consolidated Balance Sheets to the net fair values that could be reported in our Consolidated BalanceSheets:
May 31, 2020
Assets Liabilities
Gross Amounts NotOffset in the
Balance Sheet (e)
Gross Amounts NotOffset in the
Balance Sheet (e)
In Millions
GrossAmounts
ofRecognized
Assets
GrossLiabilitiesOffset in
theBalanceSheet (a)
NetAmounts
ofAssets
(b)Financial
Instruments
CashCollateralReceived
NetAmount
(c)
GrossAmounts
ofRecognizedLiabilities
GrossAssetsOffsetin the
BalanceSheet (a)
NetAmounts
ofLiabilities
(b)Financial
Instruments
CashCollateralPledged
NetAmount
(d)
Commoditycontracts $ 6.2 $- $ 6.2 $(4.2) $- $ 2.0 $(30.1) $- $(30.1) $4.2 $15.9 $(10.0)
Interest ratecontracts 6.0 - 6.0 (0.8) - 5.2 (8.0) - (8.0) 0.8 - (7.2)
Foreignexchangecontracts 38.6 - 38.6 (3.7) - 34.9 (4.0) - (4.0) 3.7 - (0.3)
Equitycontracts 8.6 - 8.6 - - 8.6 - - - - - -
Total $59.4 $- $59.4 $(8.7) $- $50.7 $(42.1) $- $(42.1) $8.7 $15.9 $(17.5)
May 26, 2019
Assets Liabilities
Gross Amounts NotOffset in the
Balance Sheet (e)
Gross Amounts NotOffset in the
Balance Sheet (e)
In Millions
GrossAmounts
ofRecognized
Assets
GrossLiabilitiesOffset in
theBalanceSheet (a)
NetAmountsof Assets
(b)Financial
Instruments
CashCollateralReceived
NetAmount
(c)
GrossAmounts
ofRecognizedLiabilities
GrossAssetsOffsetin the
BalanceSheet (a)
NetAmounts
ofLiabilities
(b)Financial
Instruments
CashCollateralPledged
NetAmount
(d)
Commoditycontracts $ 6.6 $- $ 6.6 $ (4.9) $- $ 1.7 $ (7.9) $- $ (7.9) $ 4.9 $- $ (3.0)
Interest ratecontracts - - - - - - (2.2) - (2.2) - - (2.2)
Foreignexchangecontracts 15.3 - 15.3 (5.1) - 10.2 (5.2) - (5.2) 5.1 - (0.1)
Equitycontracts 0.7 - 0.7 (0.7) - - (5.8) - (5.8) 0.7 - (5.1)
Total $22.6 $- $22.6 $(10.7) $- $11.9 $(21.1) $- $(21.1) $10.7 $- $(10.4)
(a) Includes related collateral offset in our Consolidated Balance Sheets.(b) Net fair value as recorded in our Consolidated Balance Sheets.(c) Fair value of assets that could be reported net in our Consolidated Balance Sheets.(d) Fair value of liabilities that could be reported net in our Consolidated Balance Sheets.(e) Fair value of assets and liabilities reported on a gross basis in our Consolidated Balance Sheets.
80

AMOUNTS RECORDED IN ACCUMULATED OTHER COMPREHENSIVE LOSS
As of May 31, 2020, the after-tax amounts of unrealized gains and losses in AOCI related to hedge derivativesfollows:
In Millions After-Tax Gain/(Loss)
Unrealized losses from interest rate cash flow hedges $ (30.8)Unrealized gains from foreign currency cash flow hedges 18.2
After-tax loss in AOCI related to hedge derivatives $ (12.6)
The net amount of pre-tax gains and losses in AOCI as of May 31, 2020, that we expect to be reclassified into netearnings within the next 12 months is a $12.9 million net gain.
CREDIT-RISK-RELATED CONTINGENT FEATURES
Certain of our derivative instruments contain provisions that require us to maintain an investment grade creditrating on our debt from each of the major credit rating agencies. If our debt were to fall below investment grade,the counterparties to the derivative instruments could request full collateralization on derivative instruments innet liability positions. The aggregate fair value of all derivative instruments with credit-risk-related contingentfeatures that were in a liability position on May 31, 2020, was $31.4 million. We have posted no collateral underthese contracts. If the credit-risk-related contingent features underlying these agreements had been triggered onMay 31, 2020, we would have been required to post $31.4 million of collateral to counterparties.
CONCENTRATIONS OF CREDIT AND COUNTERPARTY CREDIT RISK
During fiscal 2020, customer concentration was as follows:
Percent of total Consolidated
NorthAmerica
Retail
ConvenienceStores &
FoodserviceEurope &Australia
Asia &Latin
America Pet
Walmart (a):Net sales 21% 30% 8% 1% 5% 12%Accounts receivable 22% 6% 1% 7% 9%
Five largest customers:Net sales 54% 45% 24% 12% 64%
(a) Includes Walmart Inc. and its affiliates.
No customer other than Walmart accounted for 10 percent or more of our consolidated net sales.
We enter into interest rate, foreign exchange, and certain commodity and equity derivatives, primarily with adiversified group of highly rated counterparties. We continually monitor our positions and the credit ratings ofthe counterparties involved and, by policy, limit the amount of credit exposure to any one party. Thesetransactions may expose us to potential losses due to the risk of nonperformance by these counterparties;however, we have not incurred a material loss. We also enter into commodity futures transactions throughvarious regulated exchanges.
The amount of loss due to the credit risk of the counterparties, should the counterparties fail to perform accordingto the terms of the contracts, is $14.2 million, against which we do not hold collateral. Under the terms of ourswap agreements, some of our transactions require collateral or other security to support financial instrumentssubject to threshold levels of exposure and counterparty credit risk. Collateral assets are either cash or U.S.Treasury instruments and are held in a trust account that we may access if the counterparty defaults.
81

We offer certain suppliers access to third party services that allow them to view our scheduled payments online.The third party services also allow suppliers to finance advances on our scheduled payments at the sole discretionof the supplier and the third party. We have no economic interest in these financing arrangements and no directrelationship with the suppliers, the third parties, or any financial institutions concerning this service. All of ouraccounts payable remain as obligations to our suppliers as stated in our supplier agreements. As of May 31, 2020,$1,328.9 million of our accounts payable is payable to suppliers who utilize these third party services.
NOTE 9. DEBT
NOTES PAYABLE
The components of notes payable and their respective weighted-average interest rates at the end of the periodswere as follows:
May 31, 2020 May 26, 2019
In MillionsNotes
Payable
Weighted-Average
Interest RateNotes
Payable
Weighted-Average
Interest Rate
U.S. commercial paper $ 99.9 3.6% $ 1,298.5 2.7%Financial institutions 179.1 5.1 170.2 9.0
Total $ 279.0 4.6% $ 1,468.7 3.4%
To ensure availability of funds, we maintain bank credit lines and have commercial paper programs available tous in the United States and Europe. We also have uncommitted and asset-backed credit lines that support ourforeign operations.
The following table details the fee-paid committed and uncommitted credit lines we had available as of May 31,2020:
In BillionsFacilityAmount
BorrowedAmount
Credit facility expiring:May 2022 $ 2.7 $ -September 2022 0.2 -
Total committed credit facilities 2.9 -Uncommitted credit facilities 0.6 0.2
Total committed and uncommitted credit facilities $ 3.5 $ 0.2
The credit facilities contain covenants, including a requirement to maintain a fixed charge coverage ratio of atleast 2.5 times. We were in compliance with all credit facility covenants as of May 31, 2020.
LONG-TERM DEBT
In April 2020, we issued $750.0 million of 2.875 percent fixed-rate notes due April 15, 2030. We used the netproceeds to repay a portion of our outstanding commercial paper and for general corporate purposes.
In January 2020, we issued €600.0 million of 0.45 percent fixed-rate notes due January 15, 2026 and€200.0 million of 0.0 percent fixed-rate notes due November 16, 2020. We used the net proceeds, together withcash on hand, to repay €500.0 million of floating rate notes and €300.0 million of 0.0 percent fixed-rate notes.
In October 2019, we repaid $500.0 million of 2.20 percent fixed-rate notes with proceeds from commercialpaper.
82
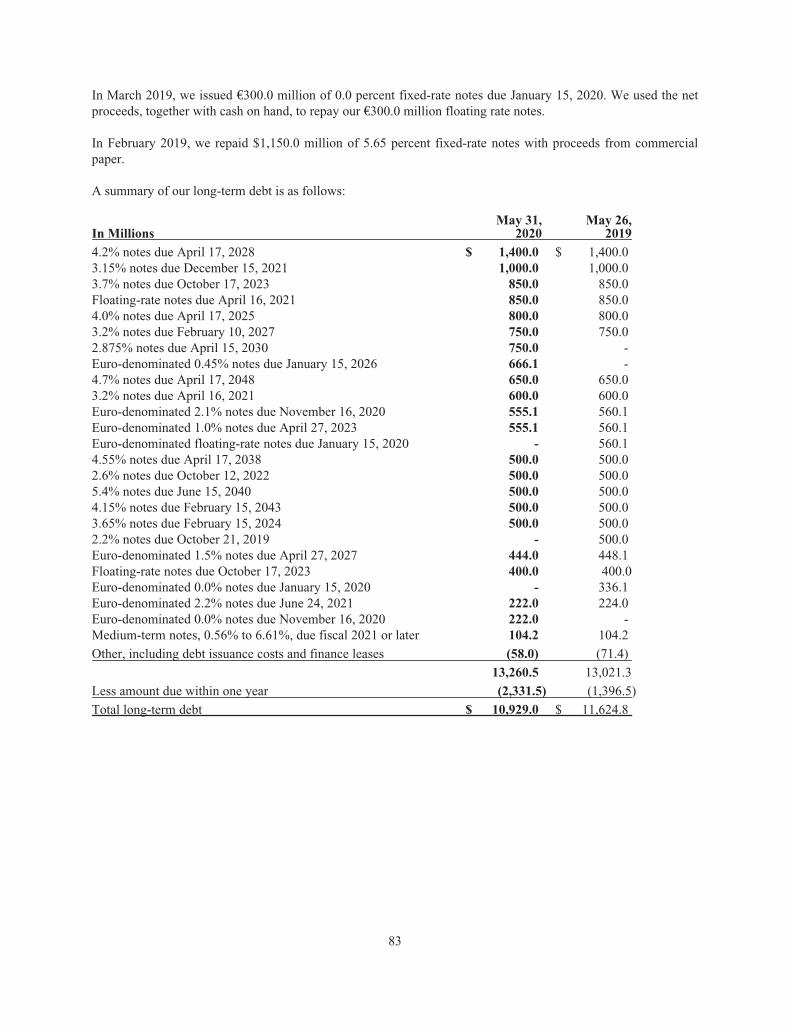
In March 2019, we issued €300.0 million of 0.0 percent fixed-rate notes due January 15, 2020. We used the netproceeds, together with cash on hand, to repay our €300.0 million floating rate notes.
In February 2019, we repaid $1,150.0 million of 5.65 percent fixed-rate notes with proceeds from commercialpaper.
A summary of our long-term debt is as follows:
In MillionsMay 31,
2020May 26,
2019
4.2% notes due April 17, 2028 $ 1,400.0 $ 1,400.03.15% notes due December 15, 2021 1,000.0 1,000.03.7% notes due October 17, 2023 850.0 850.0Floating-rate notes due April 16, 2021 850.0 850.04.0% notes due April 17, 2025 800.0 800.03.2% notes due February 10, 2027 750.0 750.02.875% notes due April 15, 2030 750.0 -Euro-denominated 0.45% notes due January 15, 2026 666.1 -4.7% notes due April 17, 2048 650.0 650.03.2% notes due April 16, 2021 600.0 600.0Euro-denominated 2.1% notes due November 16, 2020 555.1 560.1Euro-denominated 1.0% notes due April 27, 2023 555.1 560.1Euro-denominated floating-rate notes due January 15, 2020 - 560.14.55% notes due April 17, 2038 500.0 500.02.6% notes due October 12, 2022 500.0 500.05.4% notes due June 15, 2040 500.0 500.04.15% notes due February 15, 2043 500.0 500.03.65% notes due February 15, 2024 500.0 500.02.2% notes due October 21, 2019 - 500.0Euro-denominated 1.5% notes due April 27, 2027 444.0 448.1Floating-rate notes due October 17, 2023 400.0 400.0Euro-denominated 0.0% notes due January 15, 2020 - 336.1Euro-denominated 2.2% notes due June 24, 2021 222.0 224.0Euro-denominated 0.0% notes due November 16, 2020 222.0 -Medium-term notes, 0.56% to 6.61%, due fiscal 2021 or later 104.2 104.2
Other, including debt issuance costs and finance leases (58.0) (71.4)
13,260.5 13,021.3
Less amount due within one year (2,331.5) (1,396.5)
Total long-term debt $ 10,929.0 $ 11,624.8
83

Principal payments due on long-term debt and finance leases in the next five fiscal years based on statedcontractual maturities, our intent to redeem, or put rights of certain note holders are as follows:
In Millions
Fiscal 2021 $ 2,331.5Fiscal 2022 1,222.1Fiscal 2023 1,055.1Fiscal 2024 1,750.0Fiscal 2025 800.0
Certain of our long-term debt agreements contain restrictive covenants. As of May 31, 2020, we were incompliance with all of these covenants.
As of May 31, 2020, the $35.7 million pre-tax loss recorded in AOCI associated with our previously designatedinterest rate swaps will be reclassified to net interest over the remaining lives of the hedged transactions. Theamount expected to be reclassified from AOCI to net interest in fiscal 2021 is a $9.4 million pre-tax loss.
NOTE 10. REDEEMABLE AND NONCONTROLLING INTERESTS
Our principal redeemable and noncontrolling interests relate to our Yoplait SAS, Yoplait Marques SNC, LibertéMarques Sàrl, and General Mills Cereals, LLC (GMC) subsidiaries. In addition, we have 4 foreign subsidiariesthat have noncontrolling interests totaling $4.7 million as of May 31, 2020.
We have a 51 percent controlling interest in Yoplait SAS and a 50 percent interest in Yoplait Marques SNC andLiberté Marques Sàrl. Sodiaal holds the remaining interests in each of the entities. On the acquisition date, werecorded the $904.4 million fair value of Sodiaal’s 49 percent euro-denominated interest in Yoplait SAS as aredeemable interest on our Consolidated Balance Sheets. Sodiaal has the ability to put all or a portion of itsredeemable interest to us at fair value once per year, up to three times before December 2024. We adjust thevalue of the redeemable interest through additional paid-in capital on our Consolidated Balance Sheets quarterlyto the redeemable interest’s redemption value, which approximates its fair value. Yoplait SAS pays dividendsannually if it meets certain financial metrics set forth in its shareholders’ agreement. As of May 31, 2020, theredemption value of the euro-denominated redeemable interest was $544.6 million.
On the acquisition dates, we recorded the $281.4 million fair value of Sodiaal’s 50 percent euro-denominatedinterest in Yoplait Marques SNC and 50 percent Canadian dollar-denominated interest in Liberté Marques Sàrl asnoncontrolling interests on our Consolidated Balance Sheets. Yoplait Marques SNC earns a royalty streamthrough a licensing agreement with Yoplait SAS for the rights to Yoplait and related trademarks. LibertéMarques Sàrl earns a royalty stream through licensing agreements with certain Yoplait group companies for therights to Liberté and related trademarks. These entities pay dividends annually based on their available cash as oftheir fiscal year end.
We paid dividends of $56.9 million in fiscal 2020 and $22.0 million in fiscal 2019 to Sodiaal under the terms ofthe Yoplait SAS, Yoplait Marques SNC, and Liberté Marques Sàrl shareholder agreements.
A subsidiary of Yoplait SAS has entered into an exclusive milk supply agreement for its European operationswith Sodiaal at market-determined prices through July 1, 2021. Net purchases totaled $201.8 million for fiscal2020 and $210.8 million for fiscal 2019.
During fiscal 2019, Sodiaal invested $55.7 million in Yoplait SAS.
The holder of the GMC Class A Interests receives quarterly preferred distributions from available net incomebased on the application of a floating preferred return rate to the holder’s capital account balance established inthe most recent mark-to-market valuation (currently $251.5 million). On June 1, 2018, the floating preferred
84

return rate on GMC’s Class A interests was reset to the sum of three-month LIBOR plus 142.5 basis points. Thepreferred return rate is adjusted every three years through a negotiated agreement with the Class A Interest holderor through a remarketing auction.
For financial reporting purposes, the assets, liabilities, results of operations, and cash flows of our non-whollyowned consolidated subsidiaries are included in our Consolidated Financial Statements. The third-partyinvestor’s share of the net earnings of these subsidiaries is reflected in net earnings attributable to redeemableand noncontrolling interests in our Consolidated Statements of Earnings.
Our noncontrolling interests contain restrictive covenants. As of May 31, 2020, we were in compliance with allof these covenants.
NOTE 11. STOCKHOLDERS’ EQUITY
Cumulative preference stock of 5.0 million shares, without par value, is authorized but unissued.
On May 6, 2014, our Board of Directors authorized the repurchase of up to 100 million shares of our commonstock. Purchases under the authorization can be made in the open market or in privately negotiated transactions,including the use of call options and other derivative instruments, Rule 10b5-1 trading plans, and acceleratedrepurchase programs. The authorization has no specified termination date.
On March 27, 2018, we issued 22.7 million shares of the Company’s common stock, par value $0.10 per share, ata public offering price of $44.00 per share for total proceeds of $1.0 billion. We paid $30.1 million in issuancecosts that were recorded in additional paid-in capital. The net proceeds of $969.9 million were used to finance aportion of the acquisition of Blue Buffalo Pet Products, Inc. (“Blue Buffalo”).
Share repurchases were as follows:
Fiscal Year
In Millions 2020 2019 2018
Shares of common stock 0.1 - 10.9Aggregate purchase price $3.4 $1.1 $601.6
The following table provides details of total comprehensive income:
Fiscal 2020
General MillsNoncontrolling
InterestsRedeemable
Interest
In Millions Pretax Tax Net Net Net
Net earnings, including earningsattributable to redeemable andnoncontrolling interests $ 2,181.2 $ 12.9 $ 16.7
Other comprehensive income (loss):Foreign currency translation $ (149.1) $ - (149.1) (2.6) (17.4)Net actuarial loss (290.2) 65.6 (224.6) - -Other fair value changes:
Hedge derivatives 4.4 (1.2) 3.2 - -Reclassification to earnings:
Hedge derivatives (a) 4.3 (0.7) 3.6 - 0.5Amortization of losses and prior
service costs (b) 101.3 (23.4) 77.9 - -
Other comprehensive loss (329.3) 40.3 (289.0) (2.6) (16.9)
Total comprehensive income (loss) $ 1,892.2 $ 10.3 $ (0.2)
(a) Loss reclassified from AOCI into earnings is reported in interest, net for interest rate swaps and in cost of sales and SG&A expenses forforeign exchange contracts.
(b) Loss reclassified from AOCI into earnings is reported in benefit plan non-service income. Please refer to Note 2.
85

Fiscal 2019
General MillsNoncontrolling
InterestsRedeemable
Interest
In Millions Pretax Tax Net Net Net
Net earnings, including earningsattributable to redeemable andnoncontrolling interests $ 1,752.7 $ 13.9 $ 19.6
Other comprehensive income (loss):Foreign currency translation $ (38.3) $ - (38.3) (13.5) (31.0)Net actuarial loss (325.6) 72.2 (253.4) - -Other fair value changes:
Hedge derivatives 15.9 (3.7) 12.2 - (0.1)Reclassification to earnings:
Securities (a) (2.6) 0.6 (2.0) - -Hedge derivatives (b) 0.1 0.4 0.5 - 0.4Amortization of losses and prior
service costs (c) 107.5 (22.9) 84.6 - -
Other comprehensive loss (243.0) 46.6 (196.4) (13.5) (30.7)
Total comprehensive income (loss) $ 1,556.3 $ 0.4 $ (11.1)
(a) Gain reclassified from AOCI into earnings is reported in interest, net for securities.(b) Loss reclassified from AOCI into earnings is reported in interest, net for interest rate swaps and in cost of
sales and SG&A expenses for foreign exchange contracts.(c) Loss reclassified from AOCI into earnings is reported in benefit plan non-service income. Please refer to
Note 2.
Fiscal 2018
General MillsNoncontrolling
InterestsRedeemable
Interest
In Millions Pretax Tax Net Net Net
Net earnings, including earningsattributable to redeemable andnoncontrolling interests $ 2,131.0 $ 13.4 $ 18.6
Other comprehensive income (loss):Foreign currency translation $ (76.9) $ - (76.9) 13.5 26.4Net actuarial income 185.5 (45.4) 140.1 - -Other fair value changes: -
Securities 1.8 (0.6) 1.2 - -Hedge derivatives (64.7) 14.2 (50.5) - (0.3)
Reclassification to earnings:Securities (a) (6.6) 1.5 (5.1) - -Hedge derivatives (b) 24.9 (6.4) 18.5 - (1.1)Amortization of losses and prior
service costs (c) 176.8 (59.2) 117.6 - -
Other comprehensive income 240.8 (95.9) 144.9 13.5 25.0
Total comprehensive income $ 2,275.9 $ 26.9 $ 43.6
(a) Gain reclassified from AOCI into earnings is reported in interest, net for securities.(b) Loss (gain) reclassified from AOCI into earnings is reported in interest, net for interest rate swaps and in
cost of sales and SG&A expenses for foreign exchange contracts.(c) Loss reclassified from AOCI into earnings is reported in benefit plan non-service income. Please refer to
Note 2.
86

In fiscal 2020, 2019, and 2018, except for reclassifications to earnings, changes in other comprehensive income(loss) were primarily non-cash items.
Accumulated other comprehensive loss balances, net of tax effects, were as follows:
In MillionsMay 31,
2020May 26,
2019
Foreign currency translation adjustments $ (889.0) $ (739.9)Unrealized loss from:
Hedge derivatives (12.6) (19.4)Pension, other postretirement, and
postemployment benefits:Net actuarial loss (2,022.5) (1,880.5)Prior service credits 9.7 14.4
Accumulated other comprehensive loss $ (2,914.4) $ (2,625.4)
In fiscal 2018, we adopted new accounting requirements that provide the option to reclassify stranded income taxeffects resulting from the TCJA from AOCI to retained earnings. We elected to reclassify the stranded incometax effects of the TCJA of $329.4 million from AOCI to retained earnings. Please see Note 15 for additionalinformation.
NOTE 12. STOCK PLANS
We use broad-based stock plans to help ensure that management’s interests are aligned with those of ourshareholders. As of May 31, 2020, a total of 26.4 million shares were available for grant in the form of stockoptions, restricted stock, restricted stock units, and shares of unrestricted stock under the 2017 StockCompensation Plan (2017 Plan). The 2017 Plan also provides for the issuance of cash-settled share-based units,stock appreciation rights, and performance-based stock awards. Stock-based awards now outstanding includesome granted under the 2009 and 2011 stock plans and the 2006 and 2011 compensation plans for non-employeedirectors, under which no further awards may be granted. The stock plans provide for potential acceleratedvesting of awards upon retirement, termination, or death of eligible employees and directors.
Stock OptionsThe estimated fair values of stock options granted and the assumptions used for the Black-Scholes option-pricingmodel were as follows:
Fiscal Year
2020 2019 2018
Estimated fair values of stock options granted $ 7.10 $ 5.35 $ 6.18Assumptions:Risk-free interest rate 2.0 % 2.9 % 2.2 %Expected term 8.5 years 8.5 years 8.2 yearsExpected volatility 17.4 % 16.3 % 15.8 %Dividend yield 3.6 % 4.3 % 3.6 %
We estimate the fair value of each option on the grant date using a Black-Scholes option-pricing model, whichrequires us to make predictive assumptions regarding future stock price volatility, employee exercise behavior,dividend yield, and the forfeiture rate. We estimate our future stock price volatility using the historical volatilityover the expected term of the option, excluding time periods of volatility we believe a marketplace participantwould exclude in estimating our stock price volatility. We also have considered, but did not use, impliedvolatility in our estimate, because trading activity in options on our stock, especially those with tenors of greaterthan 6 months, is insufficient to provide a reliable measure of expected volatility.
87

Our expected term represents the period of time that options granted are expected to be outstanding based onhistorical data to estimate option exercises and employee terminations within the valuation model. Separategroups of employees have similar historical exercise behavior and therefore were aggregated into a single poolfor valuation purposes. The weighted-average expected term for all employee groups is presented in the tableabove. The risk-free interest rate for periods during the expected term of the options is based on the U.S.Treasury zero-coupon yield curve in effect at the time of grant.
Any corporate income tax benefit realized upon exercise or vesting of an award in excess of that previouslyrecognized in earnings (referred to as a windfall tax benefit) is presented in our Consolidated Statements of CashFlows as an operating cash flow. Realized windfall tax benefits and shortfall tax deficiencies related to theexercise or vesting of stock-based awards are recognized in the Consolidated Statement of Earnings. Werecognized windfall tax benefits from stock-based payments in income tax expense in our ConsolidatedStatements of Earnings of $27.3 million in fiscal 2020, $24.5 million in fiscal 2019, and $25.5 million in fiscal2018.
Options may be priced at 100 percent or more of the fair market value on the date of grant, and generally vestfour years after the date of grant. Options generally expire within 10 years and one month after the date of grant.
Information on stock option activity follows:
OptionsOutstanding(Thousands)
Weighted-AverageExercise
Price PerShare
Weighted-Average
RemainingContractual
Term (Years)
AggregateIntrinsic
Value(Millions)
Balance as of May 26, 2019 23,653.0 $ 47.12 4.82 $ 180.00Granted 2,065.0 53.70Exercised (7,066.0) 37.98Forfeited or expired (487.4) 55.91
Outstanding as of May 31, 2020 18,164.6 $ 51.21 5.53 $ 222.6
Exercisable as of May 31, 2020 8,706.4 $ 47.28 3.25 $ 137.3
Stock-based compensation expense related to stock option awards was $13.4 million in fiscal 2020, $14.7 millionin fiscal 2019, and $15.5 million in fiscal 2018. Compensation expense related to stock-based paymentsrecognized in our Consolidated Statements of Earnings includes amounts recognized in restructuring,impairment, and other exit costs for fiscal 2018.
Net cash proceeds from the exercise of stock options less shares used for minimum withholding taxes and theintrinsic value of options exercised were as follows:
Fiscal Year
In Millions 2020 2019 2018
Net cash proceeds $ 263.4 $ 241.4 $ 99.3Intrinsic value of options exercised $ 132.9 $ 126.7 $ 83.6
Restricted Stock, Restricted Stock Units, and Performance Share UnitsStock and units settled in stock subject to a restricted period and a purchase price, if any (as determined by theCompensation Committee of the Board of Directors), may be granted to key employees under the 2017 Plan.Restricted stock and restricted stock units generally vest and become unrestricted four years after the date ofgrant. Performance share units are earned primarily based on our future achievement of three-year goals for
88

average organic net sales growth and cumulative free cash flow. Performance share units are settled in commonstock and are generally subject to a three year performance and vesting period. The sale or transfer of theseawards is restricted during the vesting period. Participants holding restricted stock, but not restricted stock unitsor performance share units, are entitled to vote on matters submitted to holders of common stock for a vote.These awards accumulate dividends from the date of grant, but participants only receive payment if the awardsvest.
Information on restricted stock unit and performance share unit activity follows:
Equity Classified Liability Classified
Share-Settled
Units(Thousands)
Weighted-Average
Grant-Date Fair
Value
Share-Settled
Units(Thousands)
Weighted-Average
Grant-Date Fair
Value
Non-vested as of May 26, 2019 4,272.3 $ 53.87 108.1 $ 55.45Granted 1,913.4 53.27 34.2 53.64Vested (1,039.7) 55.81 (29.5) 56.38Forfeited or expired (220.5) 53.00 (9.5) 53.73
Non-vested as of May 31, 2020 4,925.5 $ 53.26 103.3 $ 54.75
Fiscal Year
2020 2019 2018
Number of units granted (thousands) 1,947.6 1,848.2 1,551.3Weighted-average price per unit $ 53.28 $ 46.14 $ 55.12
The total grant-date fair value of restricted stock unit awards that vested was $59.7 million in fiscal 2020 and$47.1 million in fiscal 2019.
As of May 31, 2020, unrecognized compensation expense related to non-vested stock options, restricted stockunits, and performance share units was $104.0 million. This expense will be recognized over 20 months, onaverage.
Stock-based compensation expense related to restricted stock units and performance share units was$81.5 million for fiscal 2020, $70.2 million for fiscal 2019, and $62.4 million for fiscal 2018. Compensationexpense related to stock-based payments recognized in our Consolidated Statements of Earnings includesamounts recognized in restructuring, impairment, and other exit costs for fiscal 2019 and 2018.
89

NOTE 13. EARNINGS PER SHARE
Basic and diluted EPS were calculated using the following:
Fiscal Year
In Millions, Except per Share Data 2020 2019 2018
Net earnings attributable to General Mills $ 2,181.2 $ 1,752.7 $ 2,131.0
Average number of common shares—basic EPS 608.1 600.4 576.8Incremental share effect from: (a)
Stock options 2.7 3.1 6.9Restricted stock units, performance share units,
and other 2.5 1.9 2.0
Average number of common shares—diluted EPS 613.3 605.4 585.7
Earnings per share—basic $ 3.59 $ 2.92 $ 3.69Earnings per share—diluted $ 3.56 $ 2.90 $ 3.64
(a) Incremental shares from stock options, restricted stock units, and performance share units are computed bythe treasury stock method. Stock options, restricted stock units, and performance share units excluded fromour computation of diluted EPS because they were not dilutive were as follows:
Fiscal Year
In Millions 2020 2019 2018
Anti-dilutive stock options, restrictedstock units, and performanceshare units 8.4 14.1 8.9
NOTE 14. RETIREMENT BENEFITS AND POSTEMPLOYMENT BENEFITS
Defined Benefit Pension Plans
We have defined benefit pension plans covering many employees in the United States, Canada, Switzerland,France, and the United Kingdom. Benefits for salaried employees are based on length of service and finalaverage compensation. Benefits for hourly employees include various monthly amounts for each year of creditedservice. Our funding policy is consistent with the requirements of applicable laws. We made no voluntarycontributions to our principal U.S. plans in fiscal 2020 or fiscal 2019. We do not expect to be required to makeany contributions in fiscal 2021. Our principal domestic retirement plan covering salaried employees has aprovision that any excess pension assets would be allocated to active participants if the plan is terminated withinfive years of a change in control. All salaried employees hired on or after June 1, 2013, are eligible for aretirement program that does not include a defined benefit pension plan.
In fiscal 2018, we approved an amendment to reorganize the U.S. qualified defined benefit pension plans and thesupplemental pension plans that resulted in the spinoff of a portion of the General Mills Pension Plan (the Plan)and the 2005 Supplemental Retirement Plan and the Supplemental Retirement Plan (Grandfathered) (together,the Supplemental Plans) into new plans effective May 31, 2018. The benefits offered to the plans’ participantswere unchanged. The result of the reorganization was the creation of the General Mills Pension Plan I (Plan I)and the 2005 Supplemental Retirement Plan I and the Supplemental Retirement Plan I (Grandfathered) (together,the Supplemental Plans I). The reorganization was made to facilitate a targeted investment strategy over time andto provide additional flexibility in evaluating opportunities to reduce risk and volatility. Actuarial gains andlosses associated with the Plan and the Supplemental Plans are amortized over the average remaining service lifeof the active participants. Actuarial gains and losses associated with the Plan I and the Supplemental Plans I areamortized over the average remaining life of the participants.
90

Other Postretirement Benefit Plans
We also sponsor plans that provide health care benefits to many of our retirees in the United States, Canada, andBrazil. The United States salaried health care benefit plan is contributory, with retiree contributions based onyears of service. We make decisions to fund related trusts for certain employees and retirees on an annual basis.We made no voluntary contributions to these plans in fiscal 2020 or fiscal 2019. We do not expect to be requiredto make any contributions in fiscal 2021.
Health Care Cost Trend Rates
Assumed health care cost trends are as follows:
Fiscal Year
2020 2019
Health care cost trend rate for next year 6.2% and 6.5% 6.4% and 6.7%Rate to which the cost trend rate is assumed to decline (ultimate rate) 4.5% 4.5%Year that the rate reaches the ultimate trend rate 2029 2029
We review our health care cost trend rates annually. Our review is based on data we collect about our health careclaims experience and information provided by our actuaries. This information includes recent plan experience,plan design, overall industry experience and projections, and assumptions used by other similar organizations.Our initial health care cost trend rate is adjusted as necessary to remain consistent with this review, recentexperiences, and short-term expectations. Our initial health care cost trend rate assumption is 6.5 percent forretirees age 65 and over and 6.2 percent for retirees under age 65 at the end of fiscal 2020. Rates are graded downannually until the ultimate trend rate of 4.5 percent is reached in 2029 for all retirees. The trend rates areapplicable for calculations only if the retirees’ benefits increase as a result of health care inflation. The ultimatetrend rate is adjusted annually, as necessary, to approximate the current economic view on the rate of long-terminflation plus an appropriate health care cost premium. Assumed trend rates for health care costs have animportant effect on the amounts reported for the other postretirement benefit plans.
Postemployment Benefit Plans
Under certain circumstances, we also provide accruable benefits, primarily severance, to former or inactiveemployees in the United States, Canada, and Mexico. We recognize an obligation for any of these benefits thatvest or accumulate with service. Postemployment benefits that do not vest or accumulate with service (such asseverance based solely on annual pay rather than years of service) are charged to expense when incurred. Ourpostemployment benefit plans are unfunded.
91

Summarized financial information about defined benefit pension, other postretirement benefit, andpostemployment benefit plans is presented below:
Defined BenefitPension Plans
OtherPostretirementBenefit Plans
PostemploymentBenefit Plans
Fiscal Year Fiscal Year Fiscal Year
In Millions 2020 2019 2020 2019 2020 2019
Change in Plan Assets:Fair value at beginning of year $ 6,291.6 $ 6,177.4 $ 753.8 $ 726.1Actual return on assets 983.7 391.9 65.0 41.3Employer contributions 32.9 30.4 0.1 0.1Plan participant contributions 6.7 3.9 13.8 15.0Benefits payments (317.2) (305.2) (39.2) (28.7)Foreign currency (4.5) (6.8) - -
Fair value at end of year (a) $ 6,993.2 $ 6,291.6 $ 793.5 $ 753.8
Change in Projected Benefit Obligation:Benefit obligation at beginning of year $ 6,750.7 $ 6,416.0 $ 824.1 $ 871.8 $ 128.0 $ 126.7Service cost 92.7 94.6 9.4 9.9 8.3 7.6Interest cost 230.5 248.0 27.1 33.1 2.6 3.0Plan amendment 1.2 - - - - 1.7Curtailment/other (1.2) (0.7) - - - -Plan participant contributions 6.7 3.9 13.8 15.0 - -Medicare Part D reimbursements - - 2.7 2.5 - -Actuarial loss (gain) 881.8 301.8 (38.3) (45.4) 17.7 2.6Benefits payments (317.7) (305.8) (63.5) (62.2) (6.2) (13.2)Foreign currency (4.5) (7.1) (1.6) (0.6) (0.1) (0.4)
Projected benefit obligation at endof year (a) $ 7,640.2 $ 6,750.7 $ 773.7 $ 824.1 $ 150.3 $ 128.0
Plan assets less than benefit obligation asof fiscal year end $ (647.0) $ (459.1) $ 19.8 $ (70.3) $ (150.3) $ (128.0)
(a) Plan assets and obligations are measured as of May 31, 2020 and May 31, 2019.
During fiscal 2020, the increase in defined benefit pension benefit obligations was primarily driven by actuariallosses due to a decrease in the discount rate and an update in mortality rates. The decrease in other postretirementobligations was primarily driven by a decrease in expected future claims, partially offset by losses due to adecrease in the discount rate.
During fiscal 2019, the increase in defined benefit pension benefit obligations was primarily driven by actuariallosses due to a decrease in the discount rate. The decrease in other postretirement obligations was primarilydriven by a decrease in expected future claims, partially offset by losses due to a decrease in the discount rate.
As of May 31, 2020, other postretirement benefit plans had benefit obligations of $479.4 million that exceededplan assets of $248.0 million. As of May 26, 2019, other postretirement benefit plans had benefit obligations of$498.4 million that exceeded plan assets of $233.7 million. Postemployment benefit plans are not funded and hadbenefit obligations of $150.3 million and $128.0 million as of May 31, 2020 and May 26, 2019, respectively.
The accumulated benefit obligation for all defined benefit pension plans was $7,285.2 million as of May 31,2020, and $6,436.9 million as of May 26, 2019.
92

Amounts recognized in AOCI as of May 31, 2020 and May 26, 2019, are as follows:
Defined BenefitPension Plans
OtherPostretirementBenefit Plans
PostemploymentBenefit Plans Total
Fiscal Year Fiscal Year Fiscal Year Fiscal Year
In Millions 2020 2019 2020 2019 2020 2019 2020 2019
Net actuarial (loss) gain $(2,136.6) $(1,961.6) $129.5 $ 81.0 $(15.4) $ 0.1 $(2,022.5) $(1,880.5)Prior service (costs) credits (6.0) (5.9) 21.0 26.3 (5.3) (6.0) 9.7 14.4
Amounts recorded inaccumulated othercomprehensive loss $(2,142.6) $(1,967.5) $150.5 $107.3 $(20.7) $(5.9) $(2,012.8) $(1,866.1)
Plans with accumulated benefit obligations in excess of plan assets as of May 31, 2020 and May 26, 2019 are asfollows:
Defined BenefitPension Plans
Fiscal Year
In Millions 2020 2019
Projected benefit obligation $ 3,512.9 $ 589.7Accumulated benefit obligation 3,200.1 552.2Plan assets at fair value 2,569.9 14.4
Components of net periodic benefit expense are as follows:
Defined Benefit PensionPlans
Other PostretirementBenefit Plans
PostemploymentBenefit Plans
Fiscal Year Fiscal Year Fiscal Year
In Millions 2020 2019 2018 2020 2019 2018 2020 2019 2018
Service cost $ 92.7 $ 94.6 $ 102.9 $ 9.4 $ 9.9 $ 11.6 $ 8.3 $ 7.6 $ 8.6Interest cost 230.5 248.0 217.9 27.1 33.1 30.1 2.6 3.0 2.3Expected return on plan assets (449.9) (445.8) (480.2) (42.1) (40.4) (52.2) - - -Amortization of losses (gains) 106.0 109.8 177.0 (2.1) 0.6 0.8 0.4 0.1 0.8Amortization of prior service
costs (credits) 1.6 1.5 1.9 (5.5) (5.5) (5.4) 0.9 0.7 0.6Other adjustments - - - - - - 17.7 6.7 6.7Settlement or curtailment losses - 0.3 - - - - - - -
Net (income) expense $ (19.1) $ 8.4 $ 19.5 $(13.2) $ (2.3) $(15.1) $29.9 $18.1 $19.0
AssumptionsWeighted-average assumptions used to determine fiscal year-end benefit obligations are as follows:
DefinedBenefitPensionPlans
OtherPostretirementBenefit Plans
PostemploymentBenefit Plans
Fiscal Year Fiscal Year Fiscal Year
2020 2019 2020 2019 2020 2019
Discount rate 3.20% 3.91% 3.02% 3.79% 1.85% 3.10%Rate of salary increases 4.44 4.17 - - 4.51 4.47
93

Weighted-average assumptions used to determine fiscal year net periodic benefit expense are as follows:
Defined BenefitPension Plans
OtherPostretirementBenefit Plans
PostemploymentBenefit Plans
Fiscal Year Fiscal Year Fiscal Year
2020 2019 2018 2020 2019 2018 2020 2019 2018
Discount rate 3.91% 4.20% 4.08% 3.79% 4.17% 3.92% 3.10% 3.60% 2.87%Service cost effective rate 4.19 4.34 4.37 4.04 4.27 4.27 3.51 3.99 3.54Interest cost effective rate 3.47 3.92 3.45 3.28 3.80 3.24 2.84 3.37 2.67Rate of salary increases 4.17 4.27 4.25 - - - 4.47 4.44 4.46Expected long-term rate of return on
plan assets 6.95 7.25 7.88 5.67 5.67 7.59 - - -
Discount RatesWe estimate the service and interest cost components of the net periodic benefit expense for our United Statesand most of our international defined benefit pension, other postretirement benefit, and postemployment benefitplans utilizing a full yield curve approach by applying the specific spot rates along the yield curve used todetermine the benefit obligation to the relevant projected cash flows. Our discount rate assumptions aredetermined annually as of May 31 for our defined benefit pension, other postretirement benefit, andpostemployment benefit plan obligations. We also use discount rates as of May 31 to determine defined benefitpension, other postretirement benefit, and postemployment benefit plan income and expense for the followingfiscal year. We work with our outside actuaries to determine the timing and amount of expected future cashoutflows to plan participants and, using the Aa Above Median corporate bond yield, to develop a forward interestrate curve, including a margin to that index based on our credit risk. This forward interest rate curve is applied toour expected future cash outflows to determine our discount rate assumptions.
94

Fair Value of Plan Assets
The fair values of our pension and postretirement benefit plans’ assets and their respective levels in the fair valuehierarchy by asset category were as follows:
Fiscal Year 2020 Fiscal Year 2019
In Millions Level 1 Level 2 Level 3TotalAssets Level 1 Level 2 Level 3
TotalAssets
Fair value measurement of pensionplan assets:Equity (a) $ 1,039.6 $ 777.7 $ - $ 1,817.3 $ 1,226.2 $ 664.6 $ - $ 1,890.8Fixed income (b) 1,833.3 1,667.4 - 3,500.7 1,635.5 1,144.9 - 2,780.4Real asset investments (c) 223.4 0.1 - 223.5 179.4 59.9 - 239.3Other investments (d) - - 0.2 0.2 - - 0.3 0.3Cash and accruals 180.3 - - 180.3 186.5 - - 186.5
Fair value measurement of pensionplan assets $ 3,276.6 $ 2,445.2 $ 0.2 $ 5,722.0 $ 3,227.6 $ 1,869.4 $ 0.3 $ 5,097.3
Assets measured at net asset value (e) 1,271.2 1,194.3
Total pension plan assets (f) $ 6,993.2 $ 6,291.6
Fair value measurement ofpostretirement benefit plan assets:Equity (a) $ - $ 46.9 $ - $ 46.9 $ - $ 66.8 $ - $ 66.8Fixed income (b) 157.5 268.4 - 425.9 139.7 241.4 - 381.1Real asset investments (c) 0.1 - - 0.1 0.3 - - 0.3Cash and accruals 16.7 - - 16.7 11.1 - - 11.1
Fair value measurement ofpostretirement benefit plan assets $ 174.3 $ 315.3 $ - $ 489.6 $ 151.1 $ 308.2 $ - $ 459.3
Assets measured at net asset value (e) 303.9 294.5
Total postretirement benefitplan assets (f) $ 793.5 $ 753.8
(a) Primarily publicly traded common stock for purposes of total return and to maintain equity exposure consistent withpolicy allocations. Investments include: United States and international equity securities, mutual funds, and equityfutures valued at closing prices from national exchanges, and commingled funds valued at unit values provided by theinvestment managers, which are based on the fair value of the underlying investments.
(b) Primarily government and corporate debt securities and futures for purposes of total return, managing fixed incomeexposure to policy allocations, and duration targets. Investments include: fixed income securities and bond futuresgenerally valued at closing prices from national exchanges, fixed income pricing models, and independent financialanalysts; and fixed income commingled funds valued at unit values provided by the investment managers, which arebased on the fair value of the underlying investments.
(c) Publicly traded common stocks in energy, real estate, and infrastructure for the purpose of total return. Investmentsinclude: energy, real estate, and infrastructure securities generally valued at closing prices from national exchanges, andcommingled funds valued at unit values provided by the investment managers, which are based on the fair value of theunderlying investments.
(d) Insurance and annuity contracts to provide a stable stream of income for pension retirees. Fair values are based on thefair value of the underlying investments and contract fair values established by the providers.
(e) Primarily private investments and common collective trusts that are measured at fair value using the net asset value pershare (or its equivalent) practical expedient and have not been classified in the fair value hierarchy.
(f) Plan assets and obligations are measured as of May 31, 2020 and May 31, 2019.
There were no material changes in our level 3 investments in fiscal 2020 and fiscal 2019.
95

Expected Rate of Return on Plan Assets
Our expected rate of return on plan assets is determined by our asset allocation, our historical long-terminvestment performance, our estimate of future long-term returns by asset class (using input from our actuaries,investment services, and investment managers), and long-term inflation assumptions. We review this assumptionannually for each plan; however, our annual investment performance for one particular year does not, by itself,significantly influence our evaluation.
Weighted-average asset allocations for our defined benefit pension and other postretirement benefit plans are asfollows:
Defined BenefitPension Plans
Other PostretirementBenefit Plans
Fiscal Year Fiscal Year
2020 2019 2020 2019
Asset category:United States equities 19.7 % 20.3 % 18.1 % 19.1 %International equities 11.0 12.5 9.8 11.2Private equities 6.2 8.1 4.4 4.9Fixed income 52.8 46.7 64.8 61.3Real assets 10.3 12.4 2.9 3.5
Total 100.0 % 100.0 % 100.0 % 100.0 %
The investment objective for our defined benefit pension and other postretirement benefit plans is to secure thebenefit obligations to participants at a reasonable cost to us. Our goal is to optimize the long-term return on planassets at a moderate level of risk. The defined benefit pension plan and other postretirement benefit plan portfoliosare broadly diversified across asset classes. Within asset classes, the portfolios are further diversified acrossinvestment styles and investment organizations. For the U.S. defined benefit pension plans, the long-terminvestment policy allocation is: 17 percent to equities in the United States; 11 percent to international equities;9 percent to private equities; 50 percent to fixed income; and 13 percent to real assets (real estate, energy, andinfrastructure). For other U.S. postretirement benefit plans, the long-term investment policy allocations are:18 percent to equities in the United States; 10 percent to international equities; 4 percent to private equities;65 percent to fixed income; and 3 percent to real assets (real estate, energy, and timber). The actual allocations tothese asset classes may vary tactically around the long-term policy allocations based on relative market valuations.
Contributions and Future Benefit Payments
We do not expect to be required to make contributions to our defined benefit pension, other postretirementbenefit, and postemployment benefit plans in fiscal 2021. Actual fiscal 2021 contributions could exceed ourcurrent projections, as influenced by our decision to undertake discretionary funding of our benefit trusts andfuture changes in regulatory requirements. Estimated benefit payments, which reflect expected future service, asappropriate, are expected to be paid from fiscal 2021 to fiscal 2030 as follows:
In Millions
DefinedBenefit
PensionPlans
OtherPostretirement
Benefit PlansGross Payments
MedicareSubsidyReceipts
PostemploymentBenefit Plans
Fiscal 2021 $ 325.4 $ 43.5 $ 3.4 $ 24.5Fiscal 2022 331.8 44.5 3.7 19.6Fiscal 2023 338.6 45.6 3.5 18.1Fiscal 2024 345.9 46.7 2.8 16.8Fiscal 2025 354.5 48.0 2.9 15.6Fiscal 2026-2030 1,899.7 247.0 14.4 63.6
96

Defined Contribution PlansThe General Mills Savings Plan is a defined contribution plan that covers domestic salaried, hourly, nonunion,and certain union employees. This plan is a 401(k) savings plan that includes a number of investment funds,including a Company stock fund and an Employee Stock Ownership Plan (ESOP). We sponsor another moneypurchase plan for certain domestic hourly employees with net assets of $20.6 million as of May 31, 2020, and$22.3 million as of May 26, 2019. We also sponsor defined contribution plans in many of our foreign locations.Our total recognized expense related to defined contribution plans was $90.1 million in fiscal 2020, $52.7 millionin fiscal 2019, and $49.2 million in fiscal 2018.
We match a percentage of employee contributions to the General Mills Savings Plan. The Company match isdirected to investment options of the participant’s choosing. The number of shares of our common stockallocated to participants in the ESOP was 4.6 million as of May 31, 2020, and 5.1 million as of May 26, 2019.The ESOP’s only assets are our common stock and temporary cash balances.
The Company stock fund and the ESOP collectively held $464.8 million and $410.1 million of Companycommon stock as of May 31, 2020, and May 26, 2019, respectively.
NOTE 15. INCOME TAXES
The components of earnings before income taxes and after-tax earnings from joint ventures and thecorresponding income taxes thereon are as follows:
Fiscal Year
In Millions 2020 2019 2018
Earnings before income taxes andafter-tax earnings from joint ventures:
United States $ 2,402.1 $ 1,788.2 $ 1,884.0Foreign 198.1 293.8 251.6
Total earnings before income taxes andafter-tax earnings from joint ventures $ 2,600.2 $ 2,082.0 $ 2,135.6
Income taxes:Currently payable:
Federal $ 381.0 $ 151.9 $ 441.2State and local 55.3 35.3 35.2Foreign 73.8 84.6 85.2
Total current 510.1 271.8 561.6
Deferred:Federal 67.8 86.7 (478.5)State and local (56.6) 21.6 15.7Foreign (40.8) (12.3) (41.5)
Total deferred (29.6) 96.0 (504.3)
Total income taxes $ 480.5 $ 367.8 $ 57.3
97

The following table reconciles the United States statutory income tax rate with our effective income tax rate:
Fiscal Year
2020 2019 2018
United States statutory rate 21.0% 21.0% 29.4%State and local income taxes, net of federal tax benefits 2.0 2.5 1.7Foreign rate differences (0.8) - (2.0)Provisional net tax benefit - (0.4) (24.5)Stock based compensation (1.1) (1.2) (1.2)Subsidiary reorganization (a) (2.0) - -Capital loss (b) - (3.7) -Prior period tax adjustment - - 1.9Domestic manufacturing deduction - - (1.9)
Other, net (0.6) (0.5) (0.7)
Effective income tax rate 18.5% 17.7% 2.7%
(a) During fiscal 2020, we recorded a $53.1 million decrease to our deferred income tax liabilities associatedwith the reorganization of certain wholly owned subsidiaries.
(b) During fiscal 2019, we recorded a discrete benefit related to a capital loss carryback of $72.9 million.
The tax effects of temporary differences that give rise to deferred tax assets and liabilities are as follows:
In MillionsMay 31,
2020May 26,
2019
Accrued liabilities $ 61.8 $ 50.9Compensation and employee benefits 171.4 196.6Pension 148.2 103.2Tax credit carryforwards 12.5 7.3Stock, partnership, and miscellaneous investments 80.2 104.2Capital losses 65.9 73.1Net operating losses 146.6 141.7Other 87.0 71.3
Gross deferred tax assets 773.6 748.3Valuation allowance 214.2 213.7
Net deferred tax assets 559.4 534.6
Brands 1,415.0 1,472.6Fixed assets 378.3 377.8Intangible assets 246.8 259.7Tax lease transactions 21.5 23.9Inventories 33.0 39.0Stock, partnership, and miscellaneous investments 338.1 330.0Unrealized hedges 22.4 27.9Other 51.4 34.7
Gross deferred tax liabilities 2,506.5 2,565.6Net deferred tax liability $ 1,947.1 $ 2,031.0
We have established a valuation allowance against certain of the categories of deferred tax assets describedabove as current evidence does not suggest we will realize sufficient taxable income of the appropriate character(e.g., ordinary income versus capital gain income) within the carryforward period to allow us to realize thesedeferred tax benefits.
98

Information about our valuation allowance follows:
In MillionsMay 31,
2020
Pillsbury acquisition losses $ 108.3State and foreign loss carryforwards 28.2Capital loss carryforwards 65.8Other 11.9
Total $ 214.2
As of May 31, 2020, we believe it is more-likely-than-not that the remainder of our deferred tax assets arerealizable.
Information about our tax loss carryforwards follows:
In MillionsMay 31,
2020
Foreign loss carryforwards $ 143.5State operating loss carryforwards 12.1
Total tax loss carryforwards $ 155.6
Our foreign loss carryforwards expire as follows:
In MillionsMay 31,
2020
Expire in fiscal 2021 and 2022 $ 3.7Expire in fiscal 2023 and beyond 20.8Do not expire 119.0
Total foreign loss carryforwards $143.5
On March 27, 2020, the Coronavirus Aid, Relief, and Economic Security Act (CARES Act) was signed into law.The CARES Act and related notices include several significant provisions, including delaying certain payroll taxpayments and estimated income tax payments that we expect to defer to future periods. We expect the deferral ofcertain payroll tax payments to continue into fiscal 2021. We do not currently expect the CARES Act to have amaterial impact on our financial results, including on our annual estimated effective tax rate or on our liquidity.We will continue to monitor and assess the impact the CARES Act and similar legislation in other countries mayhave on our business and financial results.
On December 22, 2017, the TCJA was signed into law. The TCJA resulted in significant revisions to the U.S.corporate income tax system, including a reduction in the U.S. corporate income tax rate, implementation of aterritorial system, and a one-time deemed repatriation tax on untaxed foreign earnings. As a result of the TCJA,we recorded a provisional benefit of $523.5 million during fiscal 2018. During fiscal 2019, we completed ouraccounting for the tax effects of the TCJA and recorded a benefit of $7.2 million which included adjustments tothe transition tax and the measurement of our net U.S. deferred tax liability. While our accounting for therecorded impact of the TCJA is deemed to be complete, these amounts were based on prevailing regulations andcurrently available information, and any additional guidance issued by the Internal Revenue Service (IRS) couldimpact the aforementioned amounts in future periods.
The legislation also included provisions that affected our fiscal 2019 and forward results, including but notlimited to: a reduction in the U.S. corporate tax rate on domestic operations; the creation of a new minimum tax
99

called the base erosion anti-abuse tax; a new provision that taxes U.S. allocated expenses as well as currentlytaxes certain income from foreign operations (Global Intangible Low Tax Income or GILTI); a new limitation ondeductible interest expense; the repeal of the domestic manufacturing deduction; and limitations on thedeductibility of certain executive compensation.
As of May 31, 2020, we have not recognized a deferred tax liability for unremitted earnings of approximately$2.3 billion from our foreign operations because we currently believe our subsidiaries have invested theundistributed earnings indefinitely or the earnings will be remitted in a tax-neutral transaction. It is notpracticable for us to determine the amount of unrecognized tax expense on these reinvested earnings. Deferredtaxes are recorded for earnings of our foreign operations when we determine that such earnings are no longerindefinitely reinvested. As a result of the TCJA, we re-evaluated our assertion and have concluded that althoughearnings prior to fiscal 2018 will remain permanently reinvested, we will no longer make a permanentreinvestment assertion beginning with our fiscal 2018 earnings. As part of the accounting for the TCJA, werecorded local country withholding taxes related to certain entities from which we began repatriatingundistributed earnings and will continue to record local country withholding taxes on all future earnings.
We are subject to federal income taxes in the United States as well as various state, local, and foreignjurisdictions. A number of years may elapse before an uncertain tax position is audited and finally resolved.While it is often difficult to predict the final outcome or the timing of resolution of any particular uncertain taxposition, we believe that our liabilities for income taxes reflect the most likely outcome. We adjust theseliabilities, as well as the related interest, in light of changing facts and circumstances. Settlement of anyparticular position would usually require the use of cash.
The number of years with open tax audits varies depending on the tax jurisdiction. Our major taxing jurisdictionis the United States (federal and state). Various tax examinations by United States state taxing authorities couldbe conducted for any open tax year, which vary by jurisdiction, but are generally from 3 to 5 years.
Several state and foreign examinations are currently in progress. We do not expect these examinations to result ina material impact on our results of operations or financial position. We have effectively settled all issues with theIRS for fiscal years 2015 and prior.
During fiscal 2017, the Brazilian tax authority, Secretaria da Receita Federal do Brasil (RFB), concluded auditsof our 2012 and 2013 tax return years. These audits included a review of our determinations of amortization ofcertain goodwill arising from the acquisition of Yoki Alimentos S.A. The RFB has proposed adjustments thateffectively eliminate the goodwill amortization benefits related to this transaction. During fiscal 2020, wereceived proposed adjustments related to the goodwill amortization benefits for our 2014 and 2015 tax returnyears. We believe we have meritorious defenses and intend to contest the disallowance.
We apply a more-likely-than-not threshold to the recognition and derecognition of uncertain tax positions.Accordingly, we recognize the amount of tax benefit that has a greater than 50 percent likelihood of beingultimately realized upon settlement. Future changes in judgment related to the expected ultimate resolution ofuncertain tax positions will affect earnings in the period of such change.
100

The following table sets forth changes in our total gross unrecognized tax benefit liabilities, excluding accruedinterest, for fiscal 2020 and fiscal 2019. Approximately $79.3 million of this total in fiscal 2020 represents theamount that, if recognized, would affect our effective income tax rate in future periods. This amount differs fromthe gross unrecognized tax benefits presented in the table because certain of the liabilities below would impactdeferred taxes if recognized. We also would record a decrease in U.S. federal income taxes upon recognition ofthe state tax benefits included therein.
Fiscal YearIn Millions 2020 2019
Balance, beginning of year $ 139.1 $ 196.3Tax positions related to current year:
Additions 18.7 19.5Reductions - (0.1)
Tax positions related to prior years:Additions 2.3 3.8Reductions (6.0) (13.2)Settlements (2.9) (41.0)
Lapses in statutes of limitations (3.3) (26.2)
Balance, end of year $ 147.9 $ 139.1
As of May 31, 2020, we expect to pay approximately $0.1 million of unrecognized tax benefit liabilities andaccrued interest within the next 12 months. We are not able to reasonably estimate the timing of future cashflows beyond 12 months due to uncertainties in the timing of tax audit outcomes. The remaining amount of ourunrecognized tax liability was classified in other liabilities.
We report accrued interest and penalties related to unrecognized tax benefit liabilities in income tax expense. Forfiscal 2020, we recognized $3.2 million of tax-related net interest and penalties, and had $27.9 million of accruedinterest and penalties as of May 31, 2020. For fiscal 2019, we recognized $0.5 million of tax-related net interestand penalties, and had $26.0 million of accrued interest and penalties as of May 26, 2019.
NOTE 16. COMMITMENTS AND CONTINGENCIES
As of May 31, 2020, we have issued guarantees and comfort letters of $129.8 million for the debt and otherobligations of non-consolidated affiliates, mainly CPW. Off-balance sheet arrangements were not material as ofMay 31, 2020.
During the second quarter of fiscal 2020, we received notice from the tax authorities of the State of São Paulo,Brazil regarding our compliance with its state sales tax requirements. As a result, we have been assessedadditional state sales taxes, interest, and penalties. We believe that we have meritorious defenses against thisclaim and will vigorously defend our position. As of May 31, 2020, we are unable to estimate any possible lossand have not recorded a loss contingency for this matter.
NOTE 17. BUSINESS SEGMENT AND GEOGRAPHIC INFORMATION
We operate in the packaged foods industry. Our operating segments are as follows: North America Retail;Convenience Stores & Foodservice; Europe & Australia; Asia & Latin America; and Pet.
Our North America Retail operating segment reflects business with a wide variety of grocery stores, massmerchandisers, membership stores, natural food chains, drug, dollar and discount chains, and e-commercegrocery providers. Our product categories in this business segment are ready-to-eat cereals, refrigerated yogurt,soup, meal kits, refrigerated and frozen dough products, dessert and baking mixes, frozen pizza and pizza snacks,snack bars, fruit snacks, savory snacks, and a wide variety of organic products including ready-to-eat cereal,frozen and shelf-stable vegetables, meal kits, fruit snacks, snack bars, and refrigerated yogurt.
101

Our Europe & Australia operating segment reflects retail and foodservice businesses in the greater Europe andAustralia regions. Our product categories include refrigerated yogurt, meal kits, snack bars, super-premium icecream, refrigerated and frozen dough products, shelf stable vegetables, and dessert and baking mixes. Revenuesfrom franchise fees are reported in the region or country where the franchisee is located.
Our major product categories in our Convenience Stores & Foodservice operating segment are ready-to-eatcereals, snacks, refrigerated yogurt, frozen meals, unbaked and fully baked frozen dough products, baking mixes,and bakery flour. Many products we sell are branded to the consumer and nearly all are branded to ourcustomers. We sell to distributors and operators in many customer channels including foodservice, conveniencestores, vending, and supermarket bakeries in the United States.
Our Pet operating segment includes pet food products sold primarily in the United States in national petsuperstore chains, e-commerce retailers, grocery stores, regional pet store chains, mass merchandisers, andveterinary clinics and hospitals. Our product categories include dog and cat food (dry foods, wet foods, andtreats) made with whole meats, fruits, and vegetables and other high-quality natural ingredients. Our tailored petproduct offerings address specific dietary, lifestyle, and life-stage needs and span different product types, diettypes, breed sizes for dogs, lifestages, flavors, product functions and textures, and cuts for wet foods.
Fiscal 2020 includes 13 months of Pet operating segment results as we changed the Pet operating segment’sreporting period from an April fiscal year end to a May fiscal year end to match our fiscal calendar. Fiscal 2019included 12 months of results.
Our Asia & Latin America operating segment consists of retail and foodservice businesses in the greater Asiaand South America regions. Our product categories include super-premium ice cream and frozen desserts, mealkits, dessert and baking mixes, snack bars, salty snacks, refrigerated and frozen dough products, and wellnessbeverages. We also sell super-premium ice cream and frozen desserts directly to consumers through owned retailshops. Our Asia & Latin America segment also includes products manufactured in the United States for export,mainly to Caribbean and Latin American markets, as well as products we manufacture for sale to ourinternational joint ventures. Revenues from export activities and franchise fees are reported in the region orcountry where the end customer or franchisee is located.
Operating profit for these segments excludes unallocated corporate items, gain or loss on divestitures, andrestructuring, impairment, and other exit costs. Unallocated corporate items include corporate overhead expenses,variances to planned North American employee benefits and incentives, contributions to the General MillsFoundation, asset and liability remeasurement impact of hyperinflationary economies, restructuring initiativeproject-related costs, and other items that are not part of our measurement of segment operating performance.These include gains and losses arising from the revaluation of certain grain inventories and gains and losses frommark-to-market valuation of certain commodity positions until passed back to our operating segments. Theseitems affecting operating profit are centrally managed at the corporate level and are excluded from the measureof segment profitability reviewed by executive management. Under our supply chain organization, ourmanufacturing, warehouse, and distribution activities are substantially integrated across our operations in order tomaximize efficiency and productivity. As a result, fixed assets and depreciation and amortization expenses areneither maintained nor available by operating segment.
102

Our operating segment results were as follows:
Fiscal Year
In Millions 2020 2019 2018
Net sales:North America Retail $ 10,750.5 $ 9,925.2 $ 10,115.4Europe & Australia 1,838.9 1,886.7 1,984.6Convenience Stores & Foodservice 1,816.4 1,969.1 1,930.2Pet 1,694.6 1,430.9 -Asia & Latin America 1,526.2 1,653.3 1,710.2
Total $ 17,626.6 $ 16,865.2 $ 15,740.4
Operating profit:North America Retail $ 2,627.0 $ 2,277.2 $ 2,217.4Europe & Australia 113.8 123.3 142.1Convenience Stores & Foodservice 337.2 419.5 392.6Pet 390.7 268.4 -Asia & Latin America 18.7 72.4 39.6
Total segment operating profit $ 3,487.4 $ 3,160.8 $ 2,791.7
Unallocated corporate items 509.1 339.8 206.2Divestitures loss - 30.0 -Restructuring, impairment, and other exit costs 24.4 275.1 165.6
Operating profit $ 2,953.9 $ 2,515.9 $ 2,419.9
Net sales for our North America Retail operating units were as follows:
Fiscal Year
In Millions 2020 2019 2018
U.S. Meals & Baking $ 4,408.5 $3,839.8 $ 3,865.7U.S. Cereal 2,434.1 2,255.4 2,251.8U.S. Snacks 2,091.9 2,060.9 2,140.5U.S. Yogurt and other 919.0 906.7 927.4Canada 897.0 862.4 930.0
Total $10,750.5 $9,925.2 $10,115.4
Net sales by class of similar products were as follows:
Fiscal Year
In Millions 2020 2019 2018Snacks $ 3,529.7 $ 3,487.4 $ 3,549.3Cereal 2,874.1 2,672.8 2,679.8Convenient meals 2,814.3 2,538.6 2,572.7Yogurt 2,056.6 2,113.1 2,235.0Dough 1,801.1 1,661.9 1,653.4Pet 1,694.6 1,430.9 -Baking mixes and ingredients 1,674.2 1,663.7 1,709.7Super-premium ice cream 718.1 812.7 803.2Vegetables and other 463.9 484.1 537.3
Total $17,626.6 $16,865.2 $15,740.4
103

During the first quarter of fiscal 2020, we made certain changes in the classification of products and updatedfiscal 2019 and fiscal 2018 net sales figures to match the current-year presentation.
The following tables provide financial information by geographic area:
Fiscal Year
In Millions 2020 2019 2018
Net sales:United States $ 13,364.5 $ 12,462.8 $ 11,115.6Non-United States 4,262.1 4,402.4 4,624.8
Total $ 17,626.6 $ 16,865.2 $ 15,740.4
In MillionsMay 31,
2020May 26,
2019
Cash and cash equivalents:United States $1,112.0 $ 51.0Non-United States 565.8 399.0
Total $1,677.8 $450.0
In MillionsMay 31,
2020May 26,
2019
Land, buildings, and equipment:United States $2,761.6 $2,872.8Non-United States 819.0 914.4
Total $3,580.6 $3,787.2
NOTE 18. SUPPLEMENTAL INFORMATION
The components of certain Consolidated Balance Sheet accounts are as follows:
In MillionsMay 31,
2020May 26,
2019Receivables:
Customers $ 1,648.3 $ 1,708.5Less allowance for doubtful accounts (33.2) (28.8)
Total $ 1,615.1 $ 1,679.7
In MillionsMay 31,
2020May 26,
2019
Inventories:Finished goods $ 1,142.6 $ 1,245.9Raw materials and packaging 392.2 434.9Grain 93.6 92.0Excess of FIFO over LIFO cost (a) (202.1) (213.5)
Total $ 1,426.3 $ 1,559.3
(a) Inventories of $892.6 million as of May 31, 2020, and $974.8 million as ofMay 26, 2019, were valued at LIFO. The difference between replacement costand the stated LIFO inventory value is not materially different from the reservefor the LIFO valuation method.
104

In MillionsMay 31,
2020May 26,
2019
Prepaid expenses and other current assets:Prepaid expenses $ 194.5 $ 189.0Other receivables 85.2 250.2Derivative receivables 70.6 42.2Grain contracts 5.0 6.7Miscellaneous 46.8 9.4
Total $ 402.1 $ 497.5
In MillionsMay 31,
2020May 26,
2019
Land, buildings, and equipment:Equipment $ 6,428.0 $ 6,548.3Buildings 2,412.6 2,477.2Capitalized software 668.5 631.6Construction in progress 373.5 343.8Land 66.1 73.6Equipment under finance lease 5.8 5.7Buildings under finance lease 0.3 0.3
Total land, buildings, and equipment 9,954.8 10,080.5Less accumulated depreciation (6,374.2) (6,293.3)
Total $ 3,580.6 $ 3,787.2
In MillionsMay 31,
2020May 26,
2019
Other assets:Investments in and advances to joint ventures $ 566.7 $ 452.9Right of use operating lease assets 365.2 -Pension assets 21.2 323.5Life insurance 19.5 22.7Miscellaneous 113.2 175.8
Total $ 1,085.8 $ 974.9
In MillionsMay 31,
2020May 26,
2019
Other current liabilities:Accrued trade and consumer promotions $ 550.4 $ 484.4Accrued payroll 430.4 345.5Current portion of operating lease liabilities 102.0 -Accrued interest, including interest rate swaps 92.8 92.6Accrued taxes 80.3 37.5Derivative payable, primarily commodity-related 39.2 13.2Dividends payable 20.7 19.2Restructuring and other exit costs reserve 17.8 36.5Grain contracts 1.2 2.3Miscellaneous 298.5 336.6
Total $ 1,633.3 $ 1,367.8
105

In MillionsMay 31,
2020May 26,
2019
Other noncurrent liabilities:Accrued compensation and benefits, including
obligations for underfunded other postretirementbenefit and postemployment benefit plans $ 958.7 $ 1,153.3
Noncurrent portion of operating lease liabilities 277.0 -Accrued taxes 238.6 227.1Miscellaneous 70.7 68.5
Total $ 1,545.0 $ 1,448.9
Certain Consolidated Statements of Earnings amounts are as follows:
Fiscal YearIn Millions 2020 2019 2018
Depreciation and amortization $ 594.7 $ 620.1 $ 618.8Research and development expense 224.4 221.9 219.1Advertising and media expense (including production and
communication costs) 691.8 601.6 575.9
The components of interest, net are as follows:
Fiscal YearExpense (Income), in Millions 2020 2019 2018
Interest expense $ 475.1 $ 530.2 $ 389.5Capitalized interest (2.6) (2.8) (4.1)Interest income (6.0) (5.6) (11.7)
Interest, net $ 466.5 $ 521.8 $ 373.7
Certain Consolidated Statements of Cash Flows amounts are as follows:
Fiscal YearIn Millions 2020 2019 2018
Cash interest payments $ 418.5 $ 500.1 $ 269.5Cash paid for income taxes 403.3 440.8 489.4
106

NOTE 19. QUARTERLY DATA (UNAUDITED)
Summarized quarterly data for fiscal 2020 and fiscal 2019 follows:
First Quarter Second Quarter Third Quarter Fourth Quarter
In Millions, Except PerShare Amounts
Fiscal Year Fiscal Year Fiscal Year Fiscal Year
2020 2019 2020 2019 2020 2019 2020 2019
Net sales $ 4,002.5 $ 4,094.0 $ 4,420.8 $ 4,411.2 $ 4,180.3 $ 4,198.3 $ 5,023.0 $ 4,161.7Gross margin 1,389.5 1,342.8 1,569.1 1,509.7 1,403.2 1,443.0 1,768.1 1,461.3Net earnings attributable
to General Mills 520.6 392.3 580.8 343.4 454.1 446.8 625.7 570.2EPS:
Basic $ 0.86 $ 0.66 $ 0.96 $ 0.57 $ 0.75 $ 0.74 $ 1.03 $ 0.95Diluted $ 0.85 $ 0.65 $ 0.95 $ 0.57 $ 0.74 $ 0.74 $ 1.02 $ 0.94
During the fourth quarter of fiscal 2020, we changed the reporting period of our Pet segment from an April fiscalyear end to a May fiscal year end to match our fiscal calendar. Accordingly, our fiscal 2020 fourth quarter resultsinclude 4 months of Pet segment results compared to 3 months in the fourth quarter of fiscal 2019. The fourthquarter of fiscal 2020 also included an additional week of results across all other segments. In the fourth quarterof fiscal 2020, we recorded $19.3 million of expense due to a product recall related to our international GreenGiant business and $11.5 million of restructuring charges.
During the fourth quarter of fiscal 2019, we sold our yogurt business in China and simultaneously entered into anew Yoplait license agreement with the purchaser for their use of the Yoplait brand. We recorded a gain of$5.4 million. In the fourth quarter of fiscal 2019, we recorded restructuring and impairment charges of$7.4 million. We recorded $4.3 million of integration costs related to the acquisition of Blue Buffalo and$9.8 million of gains related to an investment valuation adjustment in the fourth quarter of fiscal 2019. We alsorecorded a tax benefit of $72.9 million in the fourth quarter of fiscal 2019. Please see Note 15 for moreinformation.
107

Glossary
Accelerated depreciation associated with restructured assets. The increase in depreciation expense caused byupdating the salvage value and shortening the useful life of depreciable fixed assets to coincide with the end ofproduction under an approved restructuring plan, but only if impairment is not present.
AOCI. Accumulated other comprehensive income (loss).
Adjusted diluted EPS. Diluted EPS adjusted for certain items affecting year-to-year comparability.
Adjusted EBITDA. The calculation of earnings before income taxes and after-tax earnings from joint ventures,net interest, and depreciation and amortization adjusted for certain items affecting year-to-year comparability.
Adjusted operating profit. Operating profit adjusted for certain items affecting year-to-year comparability.
Adjusted operating profit margin. Operating profit adjusted for certain items affecting year-to-yearcomparability, divided by net sales.
Constant currency. Financial results translated to United States dollars using constant foreign currencyexchange rates based on the rates in effect for the comparable prior-year period. To present this information,current period results for entities reporting in currencies other than United States dollars are translated intoUnited States dollars at the average exchange rates in effect during the corresponding period of the prior fiscalyear, rather than the actual average exchange rates in effect during the current fiscal year. Therefore, the foreigncurrency impact is equal to current year results in local currencies multiplied by the change in the average foreigncurrency exchange rate between the current fiscal period and the corresponding period of the prior fiscal year.
Core working capital. Accounts receivable plus inventories less accounts payable, all as of the last day of ourfiscal year.
COVID-19. Coronavirus disease (COVID-19) is an infectious disease caused by a newly discovered coronavirus.In March 2020, the World Health Organization declared COVID-19 a global pandemic.
Derivatives. Financial instruments such as futures, swaps, options, and forward contracts that we use to manageour risk arising from changes in commodity prices, interest rates, foreign exchange rates, and equity prices.
Earnings before interest, taxes, depreciation and amortization (EBITDA). The calculation of earnings beforeincome taxes and after-tax earnings from joint ventures, net interest, depreciation and amortization.
Euribor. European Interbank Offered Rate.
Fair value hierarchy. For purposes of fair value measurement, we categorize assets and liabilities into one ofthree levels based on the assumptions (inputs) used in valuing the asset or liability. Level 1 provides the mostreliable measure of fair value, while Level 3 generally requires significant management judgment. The threelevels are defined as follows:
Level 1: Unadjusted quoted prices in active markets for identical assets or liabilities.
Level 2: Observable inputs other than quoted prices included in Level 1, such as quoted prices for similarassets or liabilities in active markets or quoted prices for identical assets or liabilities in inactivemarkets.
Level 3: Unobservable inputs reflecting management’s assumptions about the inputs used in pricing the assetor liability.
108

Focus 6 platforms. The Focus 6 platforms for the Convenience Stores & Foodservice segment consist of cereal,yogurt, snacks, frozen meals, frozen biscuits, and frozen baked goods.
Free cash flow. Net cash provided by operating activities less purchases of land, buildings, and equipment.
Free cash flow conversion rate. Free cash flow divided by our net earnings, including earnings attributable toredeemable and noncontrolling interests adjusted for certain items affecting year-to-year comparability.
GDP. Gross domestic product.
Generally accepted accounting principles (GAAP). Guidelines, procedures, and practices that we are requiredto use in recording and reporting accounting information in our financial statements.
Goodwill. The difference between the purchase price of acquired companies plus the fair value of anyredeemable and noncontrolling interests and the related fair values of net assets acquired.
Gross margin. Net sales less cost of sales.
Hedge accounting. Accounting for qualifying hedges that allows changes in a hedging instrument’s fair value tooffset corresponding changes in the hedged item in the same reporting period. Hedge accounting is permitted forcertain hedging instruments and hedged items only if the hedging relationship is highly effective, and onlyprospectively from the date a hedging relationship is formally documented.
Holistic Margin Management (HMM). Company-wide initiative to use productivity savings, mix management,and price realization to offset input cost inflation, protect margins, and generate funds to reinvest in sales-generating activities.
Interest bearing instruments. Notes payable, long-term debt, including current portion, cash and cashequivalents, and certain interest bearing investments classified within prepaid expenses and other current assetsand other assets.
LIBOR. London Interbank Offered Rate.
Mark-to-market. The act of determining a value for financial instruments, commodity contracts, and relatedassets or liabilities based on the current market price for that item.
Net debt. Long-term debt, current portion of long-term debt, and notes payable, less cash and cash equivalents.
Net debt-to-adjusted EBITDA ratio. Net debt divided by Adjusted EBITDA.
Net mark-to-market valuation of certain commodity positions. Realized and unrealized gains and losses onderivative contracts that will be allocated to segment operating profit when the exposure we are hedging affectsearnings.
Net price realization. The impact of list and promoted price changes, net of trade and other price promotioncosts.
Net realizable value. The estimated selling price in the ordinary course of business, less reasonably predictablecosts of completion, disposal, and transportation.
Noncontrolling interests. Interests of consolidated subsidiaries held by third parties.
109

Notional principal amount. The principal amount on which fixed-rate or floating-rate interest payments arecalculated.
OCI. Other comprehensive income (loss).
Operating cash flow conversion rate. Net cash provided by operating activities, divided by net earnings,including earnings attributable to redeemable and noncontrolling interests.
Operating cash flow to net debt ratio. Net debt divided by cash provided by operating activities.
Organic net sales growth. Net sales growth adjusted for foreign currency translation, as well as acquisitions,divestitures, and a 53rd week impact, when applicable.
Project-related costs. Costs incurred related to our restructuring initiatives not included in restructuring charges.
Redeemable interest. Interest of consolidated subsidiaries held by a third party that can be redeemed outside ofour control and therefore cannot be classified as a noncontrolling interest in equity.
Reporting unit. An operating segment or a business one level below an operating segment.
Strategic Revenue Management (SRM). A company-wide capability focused on generating sustainablebenefits from net price realization and mix by identifying and executing against specific opportunities to applytools including pricing, sizing, mix management, and promotion optimization across each of our businesses.
Supply chain input costs. Costs incurred to produce and deliver product, including costs for ingredients andconversion, inventory management, logistics, and warehousing.
TCJA. U.S. Tax Cuts and Jobs Act which was signed into law on December 22, 2017.
Total debt. Notes payable and long-term debt, including current portion.
Translation adjustments. The impact of the conversion of our foreign affiliates’ financial statements to UnitedStates dollars for the purpose of consolidating our financial statements.
Variable interest entities (VIEs). A legal structure that is used for business purposes that either (1) does nothave equity investors that have voting rights and share in all the entity’s profits and losses or (2) has equityinvestors that do not provide sufficient financial resources to support the entity’s activities.
Working capital. Current assets and current liabilities, all as of the last day of our fiscal year.
ITEM 9 - Changes in and Disagreements With Accountants on Accounting and Financial Disclosure
None.
ITEM 9A Controls and Procedures
We, under the supervision and with the participation of our management, including our Chief Executive Officerand Chief Financial Officer, have evaluated the effectiveness of the design and operation of our disclosurecontrols and procedures (as defined in Rule 13a-15(e) under the 1934 Act). Based on that evaluation, our ChiefExecutive Officer and Chief Financial Officer have concluded that, as of May 31, 2020, our disclosure controlsand procedures were effective to ensure that information required to be disclosed by us in reports that we file orsubmit under the 1934 Act is (1) recorded, processed, summarized, and reported within the time periods specified
110

in applicable rules and forms, and (2) accumulated and communicated to our management, including our ChiefExecutive Officer and Chief Financial Officer, in a manner that allows timely decisions regarding requireddisclosure.
There were no changes in our internal control over financial reporting (as defined in Rule 13a-15(f) under the1934 Act) during our fiscal quarter ended May 31, 2020, that have materially affected, or are reasonably likely tomaterially affect, our internal control over financial reporting.
MANAGEMENT’S REPORT ON INTERNAL CONTROL OVER FINANCIAL REPORTING
The management of General Mills, Inc. is responsible for establishing and maintaining adequate internal controlover financial reporting, as such term is defined in Rule 13a-15(f) under the 1934 Act. The Company’s internalcontrol system was designed to provide reasonable assurance to our management and the Board of Directorsregarding the preparation and fair presentation of published financial statements. Under the supervision and withthe participation of management, including our Chief Executive Officer and Chief Financial Officer, weconducted an assessment of the effectiveness of our internal control over financial reporting as of May 31, 2020.In making this assessment, management used the criteria set forth by the Committee of Sponsoring Organizationsof the Treadway Commission (COSO) in Internal Control – Integrated Framework (2013).
Based on our assessment using the criteria set forth by COSO in Internal Control – Integrated Framework(2013), management concluded that our internal control over financial reporting was effective as of May 31,2020.
KPMG LLP, our independent registered public accounting firm, has issued a report on the effectiveness of theCompany’s internal control over financial reporting.
/s/ J. L. Harmening /s/ K. A. Bruce
J. L. Harmening K. A. BruceChief Executive Officer Chief Financial Officer
July 2, 2020
Our independent registered public accounting firm’s attestation report on our internal control over financialreporting is included in the “Report of Independent Registered Public Accounting Firm” in Item 8 of this report.
ITEM 9B - Other Information
None.
PART III
ITEM 10 - Directors, Executive Officers and Corporate Governance
The information contained in the sections entitled “Proposal Number 1—Election of Directors,” “ShareholderDirector Nominations,” and “Delinquent Section 16(a) Reports” contained in our definitive Proxy Statement forour 2020 Annual Meeting of Shareholders is incorporated herein by reference.
Information regarding our executive officers is set forth in Item 1 of this report.
The information regarding our Audit Committee, including the members of the Audit Committee and auditcommittee financial experts, set forth in the section entitled “Board Committees and Their Functions” containedin our definitive Proxy Statement for our 2020 Annual Meeting of Shareholders is incorporated herein byreference.
111

We have adopted a Code of Conduct applicable to all employees, including our principal executive officer,principal financial officer, and principal accounting officer. A copy of the Code of Conduct is available on ourwebsite at www.GeneralMills.com. We intend to post on our website any amendments to our Code of Conductand any waivers from our Code of Conduct for principal officers.
ITEM 11 - Executive Compensation
The information contained in the sections entitled “Executive Compensation,” “Director Compensation,” and“Overseeing Risk Management” in our definitive Proxy Statement for our 2020 Annual Meeting of Shareholdersis incorporated herein by reference.
ITEM 12 - Security Ownership of Certain Beneficial Owners and Management and Related StockholderMatters
The information contained in the section entitled “Ownership of General Mills Common Stock by Directors,Officers and Certain Beneficial Owners” in our definitive Proxy Statement for our 2020 Annual Meeting ofShareholders is incorporated herein by reference.
Equity Compensation Plan Information
The following table provides certain information as of May 31, 2020, with respect to our equity compensationplans:
Plan Category
Number of Securities tobe Issued upon Exercise of
Outstanding Options,Warrants and Right
(1)
Weighted-AverageExercise Price of
Outstanding Options,Warrants and Rights
(2) (a)
Number of Securities RemainingAvailable for Future Issuance Under
Equity Compensation Plans (ExcludingSecurities Reflected in Column (1))
(3)
Equity compensationplans approved bysecurity holders 25,632,281(b) $51.21 26,444,888(d)
Equity compensationplans not approvedby security holders 115,477(c) - -
Total 25,747,758 $51.21 26,444,888
(a) Only includes the weighted-average exercise price of outstanding options, whose weighted-average term is5.53 years.
(b) Includes 18,164,592 stock options, 3,914,054 restricted stock units, 1,114,783 performance share units(assuming pay out for target performance), and 2,438,852 restricted stock units that have vested and beendeferred.
(c) Includes 115,477 restricted stock units that have vested and been deferred. These awards were made in lieu ofsalary increases and certain other compensation and benefits. We granted these awards under our 1998Employee Stock Plan, which provided for the issuance of stock options, restricted stock, and restricted stockunits to attract and retain employees and to align their interests with those of shareholders. We discontinuedthe 1998 Employee Stock Plan in September 2003, and no future awards may be granted under that plan.
(d) Includes stock options, restricted stock, restricted stock units, shares of unrestricted stock, stock appreciationrights, and performance awards that we may award under our 2017 Stock Compensation Plan, which had26,444,888 shares available for grant at May 31, 2020.
112

ITEM 13 - Certain Relationships and Related Transactions, and Director Independence
The information set forth in the section entitled “Board Independence and Related Person Transactions”contained in our definitive Proxy Statement for our 2020 Annual Meeting of Shareholders is incorporated hereinby reference.
ITEM 14 - Principal Accounting Fees and Services
The information contained in the section entitled “Independent Registered Public Accounting Firm Fees” in ourdefinitive Proxy Statement for our 2020 Annual Meeting of Shareholders is incorporated herein by reference.
PART IV
ITEM 15 - Exhibits and Financial Statement Schedules
1. Financial Statements:
The following financial statements are included in Item 8 of this report:
Consolidated Statements of Earnings for the fiscal years ended May 31, 2020, May 26, 2019, and May 27,2018.
Consolidated Statements of Comprehensive Income for the fiscal years ended May 31, 2020, May 26, 2019,and May 27, 2018.
Consolidated Balance Sheets as of May 31, 2020 and May 26, 2019.
Consolidated Statements of Cash Flows for the fiscal years ended May 31, 2020, May 26, 2019, and May27, 2018.
Consolidated Statements of Total Equity and Redeemable Interest for the fiscal years ended May 31, 2020,May 26, 2019, and May 27, 2018.
Notes to Consolidated Financial Statements.
Report of Management Responsibilities.
Report of Independent Registered Public Accounting Firm.
2. Financial Statement Schedule:
For the fiscal years ended May 31, 2020, May 26, 2019, and May 27, 2018:
II – Valuation and Qualifying Accounts
3. Exhibits:
Exhibit No. Description
3.1 Restated Certificate of Incorporation of the Company (incorporated herein byreference to Exhibit 3.1 to the Company’s Annual Report on Form 10-K for thefiscal year ended May 31, 2009).
3.2 By-laws of the Company (incorporated herein by reference to Exhibit 3.2 to theCompany’s Current Report on Form 8-K filed March 8, 2016).
113
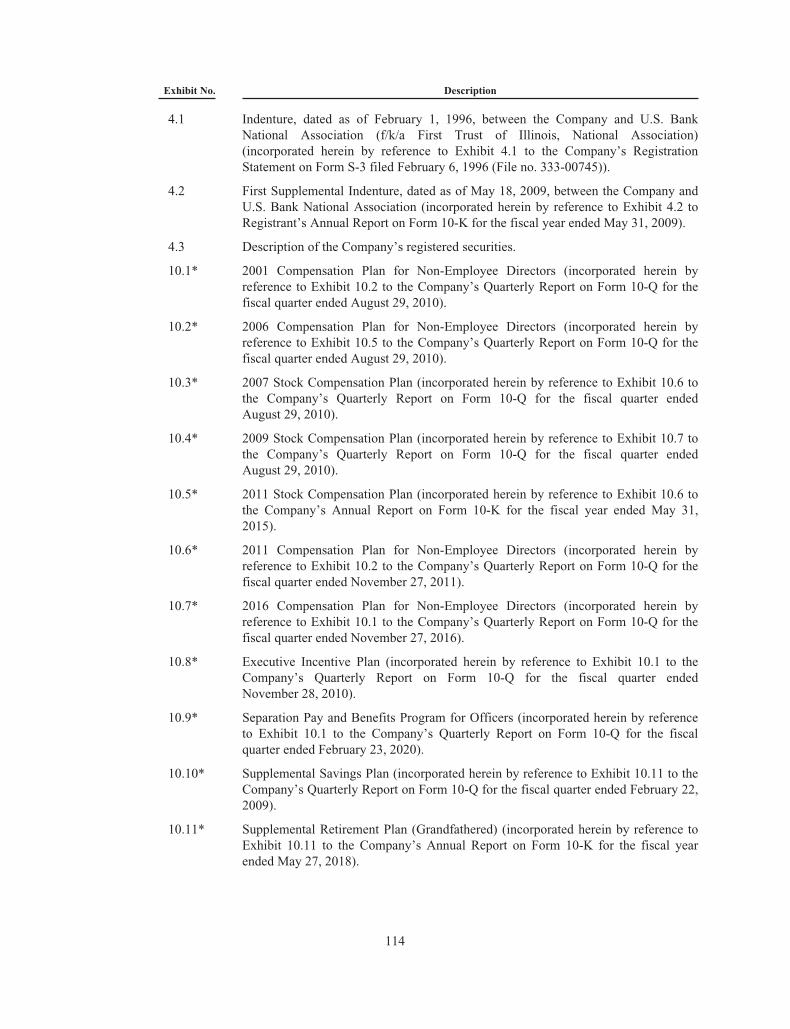
Exhibit No. Description
4.1 Indenture, dated as of February 1, 1996, between the Company and U.S. BankNational Association (f/k/a First Trust of Illinois, National Association)(incorporated herein by reference to Exhibit 4.1 to the Company’s RegistrationStatement on Form S-3 filed February 6, 1996 (File no. 333-00745)).
4.2 First Supplemental Indenture, dated as of May 18, 2009, between the Company andU.S. Bank National Association (incorporated herein by reference to Exhibit 4.2 toRegistrant’s Annual Report on Form 10-K for the fiscal year ended May 31, 2009).
4.3 Description of the Company’s registered securities.
10.1* 2001 Compensation Plan for Non-Employee Directors (incorporated herein byreference to Exhibit 10.2 to the Company’s Quarterly Report on Form 10-Q for thefiscal quarter ended August 29, 2010).
10.2* 2006 Compensation Plan for Non-Employee Directors (incorporated herein byreference to Exhibit 10.5 to the Company’s Quarterly Report on Form 10-Q for thefiscal quarter ended August 29, 2010).
10.3* 2007 Stock Compensation Plan (incorporated herein by reference to Exhibit 10.6 tothe Company’s Quarterly Report on Form 10-Q for the fiscal quarter endedAugust 29, 2010).
10.4* 2009 Stock Compensation Plan (incorporated herein by reference to Exhibit 10.7 tothe Company’s Quarterly Report on Form 10-Q for the fiscal quarter endedAugust 29, 2010).
10.5* 2011 Stock Compensation Plan (incorporated herein by reference to Exhibit 10.6 tothe Company’s Annual Report on Form 10-K for the fiscal year ended May 31,2015).
10.6* 2011 Compensation Plan for Non-Employee Directors (incorporated herein byreference to Exhibit 10.2 to the Company’s Quarterly Report on Form 10-Q for thefiscal quarter ended November 27, 2011).
10.7* 2016 Compensation Plan for Non-Employee Directors (incorporated herein byreference to Exhibit 10.1 to the Company’s Quarterly Report on Form 10-Q for thefiscal quarter ended November 27, 2016).
10.8* Executive Incentive Plan (incorporated herein by reference to Exhibit 10.1 to theCompany’s Quarterly Report on Form 10-Q for the fiscal quarter endedNovember 28, 2010).
10.9* Separation Pay and Benefits Program for Officers (incorporated herein by referenceto Exhibit 10.1 to the Company’s Quarterly Report on Form 10-Q for the fiscalquarter ended February 23, 2020).
10.10* Supplemental Savings Plan (incorporated herein by reference to Exhibit 10.11 to theCompany’s Quarterly Report on Form 10-Q for the fiscal quarter ended February 22,2009).
10.11* Supplemental Retirement Plan (Grandfathered) (incorporated herein by reference toExhibit 10.11 to the Company’s Annual Report on Form 10-K for the fiscal yearended May 27, 2018).
114

Exhibit No. Description
10.12* 2005 Supplemental Retirement Plan (incorporated herein by reference to Exhibit10.12 to the Company’s Annual Report on Form 10-K for the fiscal year endedMay 27, 2018).
10.13* Deferred Compensation Plan (Grandfathered) (incorporated herein by reference toExhibit 10.14 to the Company’s Quarterly Report on Form 10-Q for the fiscal quarterended February 22, 2009).
10.14* 2005 Deferred Compensation Plan (incorporated herein by reference to Exhibit 10.15to the Company’s Quarterly Report on Form 10-Q for the fiscal quarter endedFebruary 22, 2009).
10.15* Executive Survivor Income Plan (incorporated herein by reference to Exhibit 10.6 tothe Company’s Annual Report on Form 10-K for the fiscal year ended May 29,2005).
10.16* Supplemental Benefits Trust Agreement, amended and restated as of September 26,1988, between the Company and Norwest Bank Minnesota, N.A. (incorporatedherein by reference to Exhibit 10.3 to the Company’s Quarterly Report on Form10-Q for the fiscal quarter ended November 27, 2011).
10.17* Supplemental Benefits Trust Agreement, dated September 26, 1988, between theCompany and Norwest Bank Minnesota, N.A. (incorporated herein by reference toExhibit 10.4 to the Company’s Quarterly Report on Form 10-Q for the fiscal quarterended November 27, 2011).
10.18* Form of Performance Share Unit Award Agreement (incorporated herein byreference to Exhibit 10.18 to the Company’s Annual Report on Form 10-K for thefiscal year ended May 27, 2018).
10.19* Form of Stock Option Agreement (incorporated herein by reference to Exhibit 10.19to the Company’s Annual Report on Form 10-K for the fiscal year ended May 27,2018).
10.20* Form of Restricted Stock Unit Agreement (incorporated herein by reference toExhibit 10.20 to the Company’s Annual Report on Form 10-K for the fiscal yearended May 27, 2018).
10.21* Deferred Compensation Plan for Non-Employee Directors (incorporated herein byreference to Exhibit 10.1 to the Company’s Quarterly Report on Form 10-Q for thefiscal quarter ended November 26, 2017).
10.22* 2017 Stock Compensation Plan (incorporated herein by reference to Exhibit 10.2 tothe Company’s Quarterly Report on Form 10-Q for the fiscal quarter endedNovember 26, 2017).
10.23* Supplemental Retirement Plan I (Grandfathered) (incorporated herein by reference toExhibit 10.23 to the Company’s Annual Report on Form 10-K for the fiscal yearended May 27, 2018).
10.24* Supplemental Retirement Plan I (incorporated herein by reference to Exhibit 10.24 tothe Company’s Annual Report on Form 10-K for the fiscal year ended May 27,2018).
10.25 Agreements, dated November 29, 1989, by and between the Company and NestleS.A. (incorporated herein by reference to Exhibit 10.15 to the Company’s AnnualReport on Form 10-K for the fiscal year ended May 28, 2000).
115

Exhibit No. Description
10.26 Protocol of Cereal Partners Worldwide, dated November 21, 1989, and AddendumNo. 1 to Protocol, dated February 9, 1990, between the Company and Nestle S.A.(incorporated herein by reference to Exhibit 10.16 to the Company’s Annual Reporton Form 10-K for the fiscal year ended May 27, 2001).
10.27 Addendum No. 2 to the Protocol of Cereal Partners Worldwide, dated March 16,1993, between the Company and Nestle S.A. (incorporated herein by reference toExhibit 10.18 to the Company’s Annual Report on Form 10-K for the fiscal yearended May 30, 2004).
10.28 Addendum No. 3 to the Protocol of Cereal Partners Worldwide, effective as ofMarch 15, 1993, between the Company and Nestle S.A. (incorporated herein byreference to Exhibit 10.2 to the Company’s Annual Report on Form 10-K for thefiscal year ended May 28, 2000).
10.29+ Addendum No. 4, effective as August 1, 1998, and Addendum No. 5, effective asApril 1, 2000, to the Protocol of Cereal Partners Worldwide between the Companyand Nestle S.A. (incorporated herein by reference to Exhibit 10.26 to the Company’sAnnual Report on Form 10-K for the fiscal year ended May 31, 2009).
10.30 Addendum No. 10 to the Protocol of Cereal Partners Worldwide, effective January 1,2010, among the Company, Nestle S.A., and CPW S.A. (incorporated herein byreference to Exhibit 10.1 to the Company’s Quarterly Report on Form 10-Q for thefiscal quarter ended February 28, 2010).
10.31+ Addendum No. 11 to the Protocol of Cereal Partners Worldwide, effective July 17,2012, among the Company, Nestle S.A., and CPW S.A. (incorporated herein byreference to Exhibit 10.1 to the Company’s Quarterly Report on Form 10-Q for thefiscal quarter ended August 26, 2012).
10.32 Five-Year Credit Agreement, dated as of May 18, 2016, among the Company, theseveral financial institutions from time to time party to the agreement, and Bank ofAmerica, N.A., as Administrative Agent (incorporated herein by reference to Exhibit10.1 to the Company’s Current Report on Form 8-K filed May 18, 2016).
10.33 Extension Agreement, dated April 26, 2017, among the Company, the severalfinancial institutions from time to time party to the agreement, and Bank of America,N.A., as Administrative Agent (incorporated herein by reference to Exhibit 10.1 theCompany’s Current Report on Form 8-K filed May 1, 2017).
10.34 Amendment No. 1 to Credit Agreement, dated as of May 31, 2018, among theCompany, the several financial institutions from time to time party to the agreement,and Bank of America, N.A., as Administrative Agent (incorporated herein byreference to Exhibit 10.34 to the Company’s Annual Report on Form 10-K for thefiscal year ended May 27, 2018).
21.1 Subsidiaries of the Company.
23.1 Consent of Independent Registered Public Accounting Firm.
31.1 Certification of Chief Executive Officer pursuant to Section 302 of the Sarbanes-Oxley Act of 2002.
31.2 Certification of Chief Financial Officer pursuant to Section 302 of the Sarbanes-Oxley Act of 2002.
116

Exhibit No. Description
32.1 Certification of Chief Executive Officer pursuant to Section 906 of the Sarbanes-Oxley Act of 2002.
32.2 Certification of Chief Financial Officer pursuant to Section 906 of the Sarbanes-Oxley Act of 2002.
101 The following materials from the Company’s Annual Report on Form 10-K for thefiscal year ended May 31, 2020 formatted in Inline Extensible Business ReportingLanguage: (i) the Consolidated Balance Sheets; (ii) the Consolidated Statements ofEarnings; (iii) the Consolidated Statements of Comprehensive Income; (iv) theConsolidated Statements of Total Equity and Redeemable Interest; (v) theConsolidated Statements of Cash Flows; (vi) the Notes to Consolidated FinancialStatements; and (vii) Schedule II – Valuation of Qualifying Accounts.
104 Cover Page, formatted in Inline Extensible Business Reporting Language andcontained in Exhibit 101.
* Management contract or compensatory plan or arrangement required to be filed as an exhibit pursuant to Item15 of Form 10-K.
+ Confidential information has been omitted from the exhibit and filed separately with the SEC pursuant to Rule24b-2 of the Securities Exchange Act of 1934.
Pursuant to Item 601(b)(4)(iii) of Regulation S-K, copies of certain instruments defining the rights ofholders of our long-term debt are not filed and, in lieu thereof, we agree to furnish copies to the SEC uponrequest.
ITEM 16 - Form 10-K Summary
Not Applicable.
117

Signatures
Pursuant to the requirements of Section 13 or 15(d) of the Securities Exchange Act of 1934, the registrant hasduly caused this report to be signed on its behalf by the undersigned, thereunto duly authorized.
GENERAL MILLS, INC.
Date: July 2, 2020 By /s/ Mark A. PallotName: Mark A. PallotTitle: Vice President, Chief Accounting Officer
Pursuant to the requirements of the Securities Exchange Act of 1934, this report has been signed below by thefollowing persons on behalf of the registrant and in the capacities and on the dates indicated.
Signature Title Date
/s/ Jeffrey L HarmeningJeffrey L. Harmening
Chairman of the Board, Chief ExecutiveOfficer, and Director
(Principal Executive Officer)
July 2, 2020
/s/ Kofi A. BruceKofi A. Bruce
Chief Financial Officer(Principal Financial Officer)
July 2, 2020
/s/ Mark A. PallotMark A. Pallot
Vice President, Chief Accounting Officer(Principal Accounting Officer)
July 2, 2020
/s/ R. Kerry ClarkR. Kerry Clark
Director July 2, 2020
/s/ David M. CordaniDavid M. Cordani
Director July 2, 2020
/s/ Roger W. Ferguson Jr.Roger W. Ferguson Jr.
Director July 2, 2020
/s/ Maria G. HenryMaria G. Henry
Director July 2, 2020
/s/ Jo Ann JenkinsJo Ann Jenkins
Director July 2, 2020
/s/ Elizabeth C. LempresElizabeth C. Lempres
Director July 2, 2020
/s/ Diane L. NealDiane L. Neal
Director July 2, 2020
/s/ Steve OdlandSteve Odland
Director July 2, 2020
/s/ Maria A. SastreMaria A. Sastre
Director July 2, 2020
/s/ Eric D. SprunkEric D. Sprunk
Director July 2, 2020
/s/ Jorge A. UribeJorge A. Uribe
Director July 2, 2020
118

General Mills, Inc. and SubsidiariesSchedule II - Valuation of Qualifying Accounts
Fiscal Year
In Millions 2020 2019 2018
Allowance for doubtful accounts:Balance at beginning of year $ 28.8 $ 28.4 $ 24.3Additions charged to expense 25.9 23.9 26.7Bad debt write-offs (22.9) (22.7) (26.9)Other adjustments and reclassifications 1.4 (0.8) 4.3
Balance at end of year $ 33.2 $ 28.8 $ 28.4
Valuation allowance for deferred tax assets:Balance at beginning of year $ 213.7 $ 176.0 $ 231.8Additions charged to expense 4.2 (5.2) 2.4Adjustments due to acquisitions, translation of amounts, and other (3.7) 42.9 (58.2)
Balance at end of year $ 214.2 $ 213.7 $ 176.0
Reserve for restructuring and other exit charges:Balance at beginning of year $ 36.5 $ 66.8 $ 85.0Additions charged to expense, including translation amounts (2.5) 11.6 40.3Net amounts utilized for restructuring activities (16.2) (41.9) (58.5)
Balance at end of year $ 17.8 $ 36.5 $ 66.8
Reserve for LIFO valuation:Balance at beginning of year $ 213.5 $ 213.2 $ 209.1(Decrease) increase (11.4) 0.3 4.1
Balance at end of year $ 202.1 $ 213.5 $ 213.2
119

[THIS PAGE INTENTIONALLY LEFT BLANK]

[THIS PAGE INTENTIONALLY LEFT BLANK]

[THIS PAGE INTENTIONALLY LEFT BLANK]

Shareholder Information
Markets
New York Stock ExchangeTrading Symbol: GIS
Independent Auditor
KPMG LLP:(612) 305-5000
Investor Inquiries
General Investor Information:(800) 245-5703
Jeff SiemonVice President, Investor Relations
Transfer Agent
Our transfer agent can assist you with a variety of services,including change of address or questions about dividendchecks:
Equiniti Trust Company(800) 670-4763www.shareowneronline.com
Holiday Gift Boxes
To order a General Mills holiday gift box, please visitGMIHolidayGiftBox.com, call us toll free at (888) 496-7809or write to us including your name, address and phonenumber:
2020 General Mills Holiday Gift BoxDepartment 12280P.O. Box 5018Stacy, MN 55078-5018
Electronic Access to Proxy Statement and AnnualReport
Shareholders are encouraged to enroll in the electronicdelivery program. Please see the Investors section ofGeneralMills.com, or go directly to the website,ICSDelivery.com/GIS and follow the instructions to enroll.If your General Mills shares are not registered in your name,contact your bank or broker to enroll in this program.
Notice of Annual Meeting
The annual meeting of shareholders will be held online atwww.virtualshareholdermeeting.com/GIS2020 at 8:30 a.m.,Central Daylight Time, Tuesday, September 22, 2020.Please refer to the Proxy Statement for informationconcerning the meeting.
General Mills Direct Stock Purchase Plan
This plan provides a convenient and economical way toinvest in General Mills stock without paying brokeragecommissions and other fees on your purchases andreinvestments. For more information and a copy of a planprospectus, go to the Investors section of GeneralMills.com.
Total Return to Shareholders
Return on $100 invested on May 31, 2015; stock priceappreciation plus reinvested dividends.
General MillsBoard of DirectorsAs of August 10, 2020
R. Kerry Clark
Retired Chairman and Chief ExecutiveOfficer, Cardinal Health, Inc.(healthcare products and services)
David M. Cordani
President and Chief Executive Officer,Cigna Corporation(health insurance and services)
Roger W. Ferguson Jr.
President and Chief Executive Officer,TIAA (financial services)
Jeffrey L. Harmening
Chairman and Chief Executive Officer,General Mills, Inc.
Maria G. Henry
Senior Vice President and ChiefFinancial Officer, Kimberly-ClarkCorporation (consumer products)
Jo Ann Jenkins
Chief Executive Officer, AARP, Inc.(nonprofit services)
Elizabeth C. Lempres
Retired Senior Partner, McKinsey &Company(management consulting)
Diane L. Neal
Retired Chief Executive Officer, Sur laTable, Inc.(consumer-facing retail company)
Steve Odland
President and Chief Executive Officer,The Conference Board and FormerChairman and Chief Executive Officer,Office Depot, Inc. (office productsretailer)
Maria A. Sastre
Retired President and Chief OperatingOfficer, Signature Flight SupportCorporation (aviation)
Eric D. Sprunk
Retired Chief Operating Officer, NIKE,Inc.(athletic footwear and apparel)
Jorge A. Uribe
Retired Global Productivity andOrganization Transformation Officer,The Procter & Gamble Company,(consumer products)