Embed Size (px)
Citation preview

Six Flags Enter tainment Corporation
924 Avenue J East
Grand Prair ie, Texas 75050
972-595-5000
www.sixflags .com
2 0 1 9 A N N U A L R E P O R T
Dear Six Flags Stockholders:
Even as the world grapples with the implications of the coronavirus (COVID-19) pandemic, I am enthusiastic
to lead the Company toward a new phase of long-term growth. The Company has a great history, an enduring brand,
and a dedicated and talented team of employees. We are committed to providing unique and thrilling experiences that
create lifelong memories for our guests.
Recently, the Company has encountered challenges. Core revenue growth has slowed while labor costs have
accelerated, and our international licensing projects have not delivered as expected. We will ensure we have the best
leadership team with the right skills, critical experiences, and differentiated organizational capability aimed at
delivering superior results. We will hold ourselves accountable for following through on our commitments.
We see an opportunity to reaccelerate profitable growth in our core park business, but this will require
investments in infrastructure and technology to improve the parks’ appearance, culinary, productivity, and supply
chain. Our business transformation will require us to invest in the end-to-end guest experience. Due to the
coronavirus (COVID-19) pandemic we temporarily closed our parks beginning in mid-March. This has caused us to
delay these investments and scale back spending of expenses and capital until business operations begin to normalize.
Rest assured, however, that we are positioning ourselves so that we are ready to aggressively resume our business
transformation plans as soon as prudently possible.
On behalf of the directors, officers, and employees of Six Flags Entertainment Corporation, I would like to
express our appreciation for your continued investment and support. Six Flags’ future is bright, and together we will
create a meaningful new chapter in its history.
Mike Spanos
President and Chief
Executive Officer
UNITED STATESSECURITIES AND EXCHANGE COMMISSION
Washington, D.C. 20549
FORM 10-K
☒ Annual Report Pursuant to Section 13 or 15(d) of the Securities Exchange Act of 1934
for the fiscal year ended December 31, 2019
□ Transition Report Pursuant to Section 13 or 15(d) of the Securities Exchange Act of 1934
For the transition period from to
Commission File Number: 1-13703
SIX FLAGS ENTERTAINMENT CORPORATION(Exact name of registrant as specified in its charter)
Delaware(State or other jurisdiction ofincorporation or organization)
13-3995059(I.R.S. Employer
Identification No.)
924 Avenue J EastGrand Prairie, Texas
(Address of principal executive offices)75050
(Zip Code)
Registrant’s telephone number, including area code: (972) 595-5000
Securities registered pursuant to Section 12(b) of the Act:
Title of each class Trading Symbol(s) Name of each exchange on which registered
Common stock, $0.025 par value per share SIX New York Stock Exchange
Securities registered pursuant to Section 12(g) of the Act: None
Indicate by check mark if the registrant is a well-known seasoned issuer, as defined in Rule 405 of the Securities Act of 1993. Yes ☒ No □
Indicate by check mark if the registrant is not required to file reports pursuant to Section 13 or Section 15(d) of the Securities Exchange Act of1934. Yes □ No ☒
Indicate by check mark whether the registrant (1) has filed all reports required to be filed by Section 13 or 15(d) of the Securities Exchange Actof 1934 during the preceding 12 months (or for such shorter period that the Registrant was required to file such reports), and (2) has beensubject to such filing requirements for the past 90 days. Yes ☒ No □
Indicate by check mark whether the registrant has submitted electronically every Interactive Data File required to be submitted pursuant toRule 405 of Regulation S-T (§232.405 of this chapter) during the preceding 12 months (or for such shorter period that the registrant was requiredto submit such files). Yes ☒ No □
Indicate by check mark whether the registrant is a large accelerated filer, an accelerated filer, a non-accelerated filer, a smaller reportingcompany, or emerging growth company. See definition of ‘‘large accelerated filer,’’ ‘‘accelerated filer,’’ ‘‘smaller reporting company’’ and‘‘emerging growth company’’ in Rule 12b-2 of the Exchange Act.
Large accelerated filer ☒ Accelerated filer □ Non-accelerated filer □ Smaller reporting company □ Emerging growth company □
If an emerging growth company, indicate by check mark if the registrant has elected not to use the extended transition period for complying withany new or revised financial accounting standards provided pursuant to Section 13(a) of the Exchange Act. □
Indicate by check mark whether the registrant is a shell company (as defined in Rule 12b-2 of the Act). Yes □ No ☒
On the last business day of the registrant’s most recently completed second fiscal quarter, the aggregate market value of the common stock of theregistrant held by non-affiliates was approximately $4,189.7 million based on the closing price $49.68 of the common stock on The New YorkStock Exchange on such date. Shares of common stock beneficially held by each executive officer and director have been excluded from thiscomputation because these persons may be deemed to be affiliates. This determination of affiliate status is not necessarily a conclusivedetermination for any other purposes.
On February 18, 2020, there were 84,656,792 shares of common stock, par value $0.025, of the registrant issued and outstanding.
DOCUMENTS INCORPORATED BY REFERENCE
Portions of the information required in Part III by Items 10, 11, 12, 13 and 14 are incorporated by reference to the registrant’s proxy statement forthe 2020 annual meeting of stockholders, which will be filed by the registrant within 120 days after the close of its 2019 fiscal year.
TABLE OF CONTENTS
Page No.
Part I
Item 1 Business . . . . . . . . . . . . . . . . . . . . . . . . . . . . . . . . . . . . . . . . . . . . . . . . . . . . . . . . . . . . . . . . . 1
Item 1A Risk Factors . . . . . . . . . . . . . . . . . . . . . . . . . . . . . . . . . . . . . . . . . . . . . . . . . . . . . . . . . . . . . . 14
Item 1B Unresolved Staff Comments . . . . . . . . . . . . . . . . . . . . . . . . . . . . . . . . . . . . . . . . . . . . . . . . . 25
Item 2 Properties . . . . . . . . . . . . . . . . . . . . . . . . . . . . . . . . . . . . . . . . . . . . . . . . . . . . . . . . . . . . . . . . 26
Item 3 Legal Proceedings . . . . . . . . . . . . . . . . . . . . . . . . . . . . . . . . . . . . . . . . . . . . . . . . . . . . . . . . . 27
Item 4 Mine Safety Disclosures . . . . . . . . . . . . . . . . . . . . . . . . . . . . . . . . . . . . . . . . . . . . . . . . . . . . 28
Part II
Item 5 Market for the Registrant’s Common Equity, Related Stockholder Matters and Issuer
Purchases of Equity Securities . . . . . . . . . . . . . . . . . . . . . . . . . . . . . . . . . . . . . . . . . . . . . 29
Item 6 Selected Financial Data. . . . . . . . . . . . . . . . . . . . . . . . . . . . . . . . . . . . . . . . . . . . . . . . . . . . . 31
Item 7 Management’s Discussion and Analysis of Financial Condition and Results of
Operations . . . . . . . . . . . . . . . . . . . . . . . . . . . . . . . . . . . . . . . . . . . . . . . . . . . . . . . . . . . . . 33
Item 7A Quantitative and Qualitative Disclosures about Market Risk . . . . . . . . . . . . . . . . . . . . . . . 43
Item 8 Financial Statements and Supplementary Data . . . . . . . . . . . . . . . . . . . . . . . . . . . . . . . . . . 45
Item 9 Changes in and Disagreements with Accountants on Accounting and Financial
Disclosure . . . . . . . . . . . . . . . . . . . . . . . . . . . . . . . . . . . . . . . . . . . . . . . . . . . . . . . . . . . . . 92
Item 9A Controls and Procedures . . . . . . . . . . . . . . . . . . . . . . . . . . . . . . . . . . . . . . . . . . . . . . . . . . . . 92
Item 9B Other Information . . . . . . . . . . . . . . . . . . . . . . . . . . . . . . . . . . . . . . . . . . . . . . . . . . . . . . . . . 92
Part III
Item 10 Directors, Executive Officers and Corporate Governance. . . . . . . . . . . . . . . . . . . . . . . . . . 94
Item 11 Executive Compensation . . . . . . . . . . . . . . . . . . . . . . . . . . . . . . . . . . . . . . . . . . . . . . . . . . . . 94
Item 12 Security Ownership of Certain Beneficial Owners and Management and Related
Stockholder Matters. . . . . . . . . . . . . . . . . . . . . . . . . . . . . . . . . . . . . . . . . . . . . . . . . . . . . . 94
Item 13 Certain Relationships and Related Transactions and Director Independence . . . . . . . . . . . 95
Item 14 Principal Accounting Fees and Services. . . . . . . . . . . . . . . . . . . . . . . . . . . . . . . . . . . . . . . . 95
Part IV
Item 15 Exhibits and Financial Statement Schedules . . . . . . . . . . . . . . . . . . . . . . . . . . . . . . . . . . . . 96
Signatures. . . . . . . . . . . . . . . . . . . . . . . . . . . . . . . . . . . . . . . . . . . . . . . . . . . . . . . . . . . . . . . . 103
i
CAUTIONARY NOTE REGARDING FORWARD-LOOKING STATEMENTS
This Annual Report on Form 10-K (the ‘‘Annual Report’’) and the documents incorporated herein by
reference contain forward-looking statements within the meaning of Section 27A of the Securities Act of 1933, as
amended, and Section 21E of the Securities Exchange Act of 1934, as amended. Forward-looking statements
include all statements that are not historical facts and can be identified by words such as ‘‘anticipates,’’
‘‘intends,’’ ‘‘plans,’’ ‘‘seeks,’’ ‘‘believes,’’ ‘‘estimates,’’ ‘‘expects,’’ ‘‘may,’’ ‘‘should,’’ ‘‘could’’ and variations of
such words or similar expressions. Forward-looking statements are based on our current beliefs, expectations and
assumptions regarding our business, the economy and other future conditions. Because forward-looking
statements relate to the future, they are, by their nature, subject to inherent uncertainties, risks and changes in
circumstances that are difficult to predict. Our actual results may differ materially from those contemplated by
the forward-looking statements. Therefore, we caution you that you should not rely on any of these
forward-looking statements as statements of historical fact or as guarantees or assurances of future performance.
These statements may involve risks and uncertainties that could cause actual results to differ materially from
those described in such statements. These risks and uncertainties include, but are not limited to, statements we
make regarding: (i) the adequacy of cash flows from operations, available cash and available amounts under our
credit facilities to meet our future liquidity needs, (ii) our plans and ability to roll out our capital enhancements
and planned initiatives in a timely and cost effective manner, (iii) our ability to improve operating results by
adopting and implementing a new strategic plan, including strategic cost reductions and organizational and
personnel changes, without adversely affecting our business, (iv) our dividend policy and ability and plans to pay
dividends on our common stock and to repurchase common stock, including short- and long-term effects of our
dividend policy, (v) our planned capital expenditures for 2020 and beyond, (vi) our marketing strategy, (vii) our
ongoing compliance with laws and regulations and the effect of and cost and timing of compliance with newly
enacted laws, regulations and accounting policies, (viii) our ability to use cash flow from operations to satisfy
our obligations with respect to the Partnership Parks, (ix) our ability to realize profitable future growth and to
execute and deliver on our strategic initiatives, (x) our expectations regarding uncertain tax positions, (xi) our
expectations regarding our ability to recognize any revenue or profit relating to the development of Six
Flags-branded parks in China, (xii) our expectations regarding our deferred revenue growth, and (xiii) our
operations and results of operations and expected future operational and financial performance and ability to
achieve stated performance targets and metrics. Additional important factors that could cause actual results to
differ materially from those in the forward-looking statements include regional, national or global political,
economic, business, competitive, market and regulatory conditions and include, but are not limited to, the
following:
• factors impacting attendance, such as local conditions, natural disasters, contagious diseases, events,
disturbances and terrorist activities;
• recall of food, toys and other retail products sold at our parks;
• accidents occurring at our parks or other parks in the industry and adverse publicity concerning our
parks or other parks in the industry;
• availability of commercially reasonable insurance policies at reasonable rates;
• inability to achieve desired improvements and our aspirational financial performance goals;
• adverse weather conditions such as excess heat or cold, rain and storms;
• general financial and credit market conditions;
• economic conditions (including customer spending patterns);
• changes in public and consumer tastes;
• construction delays in capital improvements and ride downtime;
• competition with other theme parks and waterparks and entertainment alternatives;
• dependence on a seasonal workforce;
• unionization activities and labor disputes;
ii
• laws and regulations affecting labor and employee benefit costs, including increases in state and
federally mandated minimum wages, and healthcare reform;
• environmental laws and regulations;
• laws and regulations affecting corporate taxation;
• pending, threatened or future legal proceedings and the significant expenses associated with litigation;
• cybersecurity risks; and
• other factors described in ‘‘Item 1A. Risk Factors’’ included elsewhere in this Annual Report.
A more complete discussion of these factors and other risks applicable to our business is contained in
‘‘Part I, Item 1A. Risk Factors’’ included elsewhere in this Annual Report. All forward-looking statements in this
report, or that are made on our behalf by our directors, officers or employees related to the information contained
herein, apply only as of the date of this report or as of the date they were made. While we believe that the
expectations reflected in such forward-looking statements are reasonable, we can give no assurance that such
expectations will be realized and actual results could vary materially. Factors or events that could cause our
actual results to differ may emerge from time to time, and it is not possible for us to predict all of them. We
undertake no obligation, except as required by applicable law, to publicly update any forward-looking statement,
whether as a result of new information, future developments or otherwise.
* * * * *
As used in this Annual Report, unless the context requires otherwise, the terms ‘‘we,’’ ‘‘our,’’ ‘‘Six Flags,’’
‘‘the Company’’ and ‘‘SFEC’’ refer collectively to Six Flags Entertainment Corporation and its consolidated
subsidiaries, and ‘‘Holdings’’ refers only to Six Flags Entertainment Corporation, without regard to its
consolidated subsidiaries.
Looney Tunes characters, names and all related indicia are trademarks of Warner Bros., a division of
WarnerMedia owned by AT&T Inc. Batman, Superman and Wonder Woman and all related characters, names and
indicia are copyrights and trademarks of DC Comics. Six Flags and all related indicia are registered trademarks
of Six Flags Theme Parks Inc.
iii
PART I
ITEM 1. BUSINESS
Introduction
We are the largest regional theme park operator in the world and the largest operator of waterparks in
North America based on the number of parks we operate. Of our 26 regional theme parks and waterparks, 23 are
located in the United States, two are located in Mexico and one is located in Montreal, Canada. Our U.S. parks
serve each of the top 10 designated market areas, as determined by a survey of television households within
designated market areas published by A.C. Nielsen Media Research in September 2019. Our diversified portfolio
of North American parks serves an aggregate population of approximately 140 million people and 250 million
people within a radius of 50 miles and 100 miles, respectively, with some of the highest per capita gross
domestic product in the U.S.
Our parks occupy approximately 6,000 acres of land, and we own approximately 800 additional acres of
land with development potential. Our parks are located in geographically diverse markets across North America.
Our parks generally offer a broad selection of state-of-the-art and traditional thrill rides, water attractions, themed
areas, concerts and shows, restaurants, game venues and retail outlets, and thereby provide a complete
family-oriented entertainment experience. In the aggregate, during 2019, our parks offered approximately
940 rides, including over 150 roller coasters, making us the leading provider of ‘‘thrill rides’’ in the industry.
In 1998, we acquired the former Six Flags Entertainment Corporation (‘‘Former SFEC’’, a corporation that
has been merged out of existence and that had always been a separate corporation from Holdings), which had
operated regional theme parks and waterparks under the Six Flags name for nearly forty years and established an
internationally recognized brand name. We own the ‘‘Six Flags’’ brand name in the U.S. and foreign countries
throughout the world. To capitalize on this name recognition, 22 of our parks are branded as ‘‘Six Flags’’ or
‘‘Hurricane Harbor’’ parks and, in 2014, we also began the development, with third-party partners, of
Six Flags-branded parks outside of North America.
We hold exclusive long-term licenses for theme park usage of certain Warner Bros. and DC Comics
characters throughout the U.S. (except the Las Vegas metropolitan area), Canada, Mexico and other countries.
These characters include Bugs Bunny, Daffy Duck, Tweety Bird, Yosemite Sam, Batman, Superman, The Joker,
Wonder Woman, The Flash, Green Lantern, Harley Quinn, Aquaman, and others. We use these characters to
provide an enhanced family entertainment experience. Our licenses include the right to sell merchandise featuring
the characters at the parks, and to use the characters in our advertising, as walk-around characters and in theming
for rides, attractions and retail outlets.
We believe our parks benefit from limited direct theme park competition. A limited supply of real estate
appropriate for theme park development, substantial initial capital investment requirements, long development
lead-time, and zoning restrictions provide each of our parks with a significant degree of protection from
competitive new theme park openings. Based on our knowledge of the development of our own and other
regional theme parks, we estimate it would cost $500 million to $700 million and would take a minimum of
four years to construct a new regional theme park comparable to one of our major Six Flags-branded
theme parks.
1
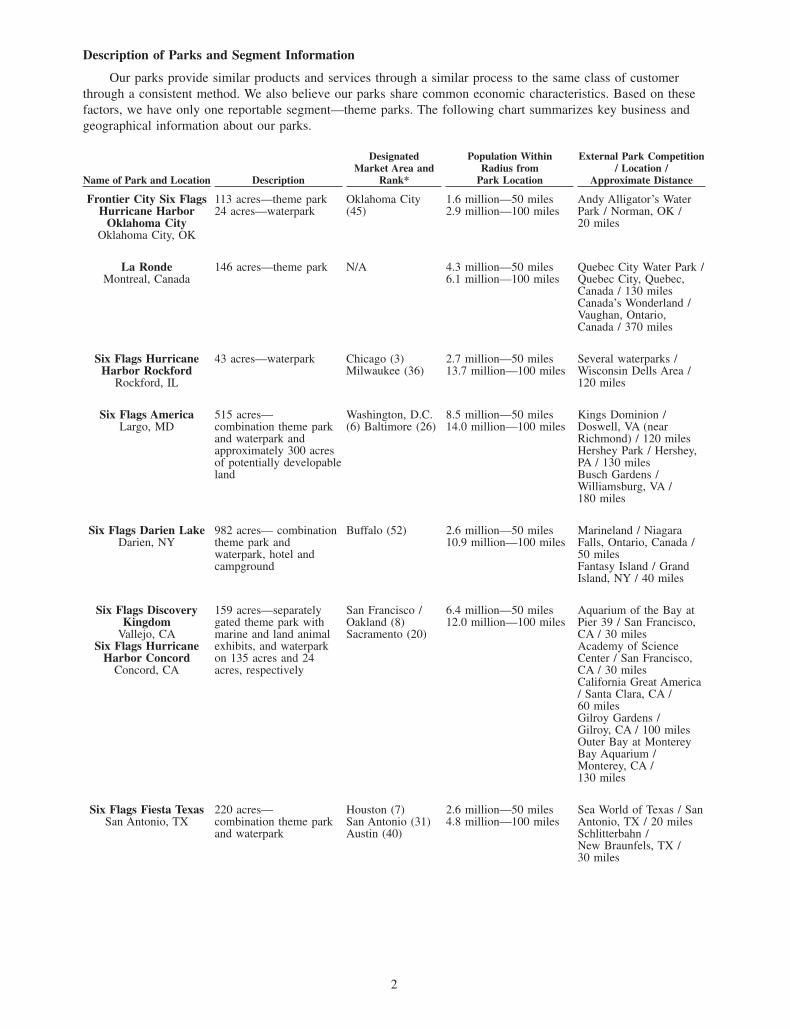
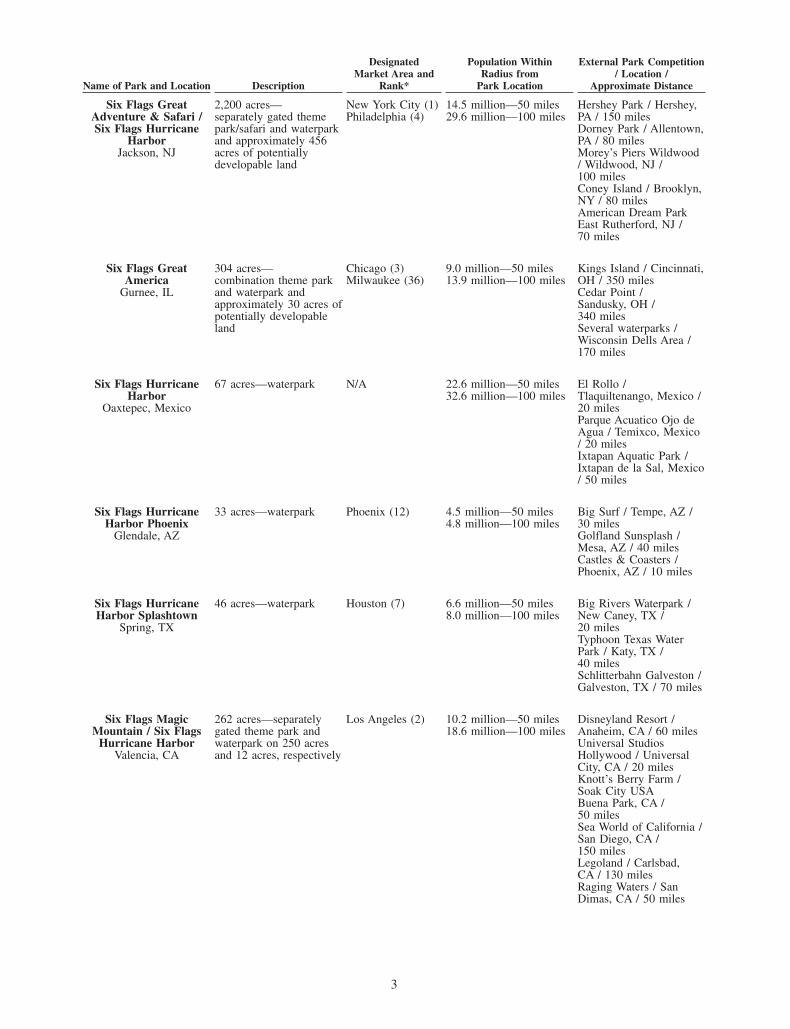
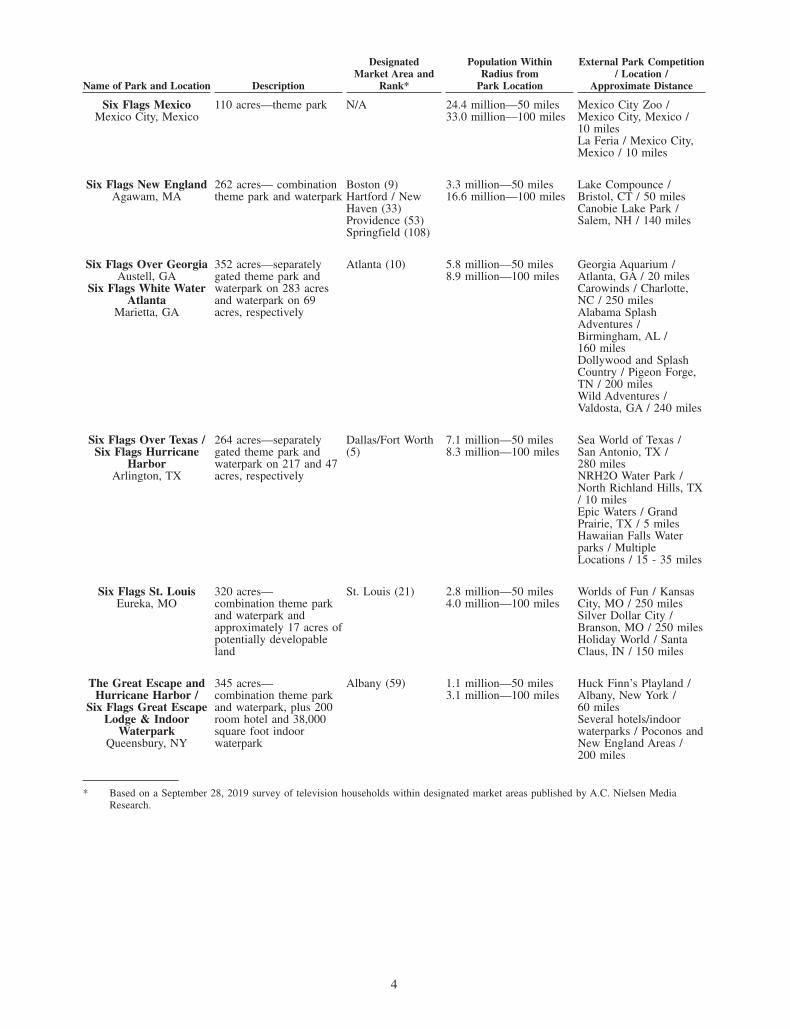
Description of Parks and Segment Information
Our parks provide similar products and services through a similar process to the same class of customer
through a consistent method. We also believe our parks share common economic characteristics. Based on these
factors, we have only one reportable segment—theme parks. The following chart summarizes key business and
geographical information about our parks.
Name of Park and Location Description
DesignatedMarket Area and
Rank*
Population WithinRadius from
Park Location
External Park Competition/ Location /
Approximate Distance
Frontier City Six FlagsHurricane Harbor
Oklahoma CityOklahoma City, OK
113 acres—theme park24 acres—waterpark
Oklahoma City(45)
1.6 million—50 miles2.9 million—100 miles
Andy Alligator’s WaterPark / Norman, OK /20 miles
La RondeMontreal, Canada
146 acres—theme park N/A 4.3 million—50 miles6.1 million—100 miles
Quebec City Water Park /Quebec City, Quebec,Canada / 130 milesCanada’s Wonderland /Vaughan, Ontario,Canada / 370 miles
Six Flags HurricaneHarbor Rockford
Rockford, IL
43 acres—waterpark Chicago (3)Milwaukee (36)
2.7 million—50 miles13.7 million—100 miles
Several waterparks /Wisconsin Dells Area /120 miles
Six Flags AmericaLargo, MD
515 acres—combination theme parkand waterpark andapproximately 300 acresof potentially developableland
Washington, D.C.(6) Baltimore (26)
8.5 million—50 miles14.0 million—100 miles
Kings Dominion /Doswell, VA (nearRichmond) / 120 milesHershey Park / Hershey,PA / 130 milesBusch Gardens /Williamsburg, VA /180 miles
Six Flags Darien LakeDarien, NY
982 acres— combinationtheme park andwaterpark, hotel andcampground
Buffalo (52) 2.6 million—50 miles10.9 million—100 miles
Marineland / NiagaraFalls, Ontario, Canada /50 milesFantasy Island / GrandIsland, NY / 40 miles
Six Flags DiscoveryKingdom
Vallejo, CASix Flags Hurricane
Harbor ConcordConcord, CA
159 acres—separatelygated theme park withmarine and land animalexhibits, and waterparkon 135 acres and 24acres, respectively
San Francisco /Oakland (8)Sacramento (20)
6.4 million—50 miles12.0 million—100 miles
Aquarium of the Bay atPier 39 / San Francisco,CA / 30 milesAcademy of ScienceCenter / San Francisco,CA / 30 milesCalifornia Great America/ Santa Clara, CA /60 milesGilroy Gardens /Gilroy, CA / 100 milesOuter Bay at MontereyBay Aquarium /Monterey, CA /130 miles
Six Flags Fiesta TexasSan Antonio, TX
220 acres—combination theme parkand waterpark
Houston (7)San Antonio (31)Austin (40)
2.6 million—50 miles4.8 million—100 miles
Sea World of Texas / SanAntonio, TX / 20 milesSchlitterbahn /New Braunfels, TX /30 miles
2
Name of Park and Location Description
DesignatedMarket Area and
Rank*
Population WithinRadius from
Park Location
External Park Competition/ Location /
Approximate Distance
Six Flags GreatAdventure & Safari /Six Flags Hurricane
HarborJackson, NJ
2,200 acres—separately gated themepark/safari and waterparkand approximately 456acres of potentiallydevelopable land
New York City (1)Philadelphia (4)
14.5 million—50 miles29.6 million—100 miles
Hershey Park / Hershey,PA / 150 milesDorney Park / Allentown,PA / 80 milesMorey’s Piers Wildwood/ Wildwood, NJ /100 milesConey Island / Brooklyn,NY / 80 milesAmerican Dream ParkEast Rutherford, NJ /70 miles
Six Flags GreatAmerica
Gurnee, IL
304 acres—combination theme parkand waterpark andapproximately 30 acres ofpotentially developableland
Chicago (3)Milwaukee (36)
9.0 million—50 miles13.9 million—100 miles
Kings Island / Cincinnati,OH / 350 milesCedar Point /Sandusky, OH /340 milesSeveral waterparks /Wisconsin Dells Area /170 miles
Six Flags HurricaneHarbor
Oaxtepec, Mexico
67 acres—waterpark N/A 22.6 million—50 miles32.6 million—100 miles
El Rollo /Tlaquiltenango, Mexico /20 milesParque Acuatico Ojo deAgua / Temixco, Mexico/ 20 milesIxtapan Aquatic Park /Ixtapan de la Sal, Mexico/ 50 miles
Six Flags HurricaneHarbor Phoenix
Glendale, AZ
33 acres—waterpark Phoenix (12) 4.5 million—50 miles4.8 million—100 miles
Big Surf / Tempe, AZ /30 milesGolfland Sunsplash /Mesa, AZ / 40 milesCastles & Coasters /Phoenix, AZ / 10 miles
Six Flags HurricaneHarbor Splashtown
Spring, TX
46 acres—waterpark Houston (7) 6.6 million—50 miles8.0 million—100 miles
Big Rivers Waterpark /New Caney, TX /20 milesTyphoon Texas WaterPark / Katy, TX /40 milesSchlitterbahn Galveston /Galveston, TX / 70 miles
Six Flags MagicMountain / Six Flags
Hurricane HarborValencia, CA
262 acres—separatelygated theme park andwaterpark on 250 acresand 12 acres, respectively
Los Angeles (2) 10.2 million—50 miles18.6 million—100 miles
Disneyland Resort /Anaheim, CA / 60 milesUniversal StudiosHollywood / UniversalCity, CA / 20 milesKnott’s Berry Farm /Soak City USABuena Park, CA /50 milesSea World of California /San Diego, CA /150 milesLegoland / Carlsbad,CA / 130 milesRaging Waters / SanDimas, CA / 50 miles
3
Name of Park and Location Description
DesignatedMarket Area and
Rank*
Population WithinRadius from
Park Location
External Park Competition/ Location /
Approximate Distance
Six Flags MexicoMexico City, Mexico
110 acres—theme park N/A 24.4 million—50 miles33.0 million—100 miles
Mexico City Zoo /Mexico City, Mexico /10 milesLa Feria / Mexico City,Mexico / 10 miles
Six Flags New EnglandAgawam, MA
262 acres— combinationtheme park and waterpark
Boston (9)Hartford / NewHaven (33)Providence (53)Springfield (108)
3.3 million—50 miles16.6 million—100 miles
Lake Compounce /Bristol, CT / 50 milesCanobie Lake Park /Salem, NH / 140 miles
Six Flags Over GeorgiaAustell, GA
Six Flags White WaterAtlanta
Marietta, GA
352 acres—separatelygated theme park andwaterpark on 283 acresand waterpark on 69acres, respectively
Atlanta (10) 5.8 million—50 miles8.9 million—100 miles
Georgia Aquarium /Atlanta, GA / 20 milesCarowinds / Charlotte,NC / 250 milesAlabama SplashAdventures /Birmingham, AL /160 milesDollywood and SplashCountry / Pigeon Forge,TN / 200 milesWild Adventures /Valdosta, GA / 240 miles
Six Flags Over Texas /Six Flags Hurricane
HarborArlington, TX
264 acres—separatelygated theme park andwaterpark on 217 and 47acres, respectively
Dallas/Fort Worth(5)
7.1 million—50 miles8.3 million—100 miles
Sea World of Texas /San Antonio, TX /280 milesNRH2O Water Park /North Richland Hills, TX/ 10 milesEpic Waters / GrandPrairie, TX / 5 milesHawaiian Falls Waterparks / MultipleLocations / 15 - 35 miles
Six Flags St. LouisEureka, MO
320 acres—combination theme parkand waterpark andapproximately 17 acres ofpotentially developableland
St. Louis (21) 2.8 million—50 miles4.0 million—100 miles
Worlds of Fun / KansasCity, MO / 250 milesSilver Dollar City /Branson, MO / 250 milesHoliday World / SantaClaus, IN / 150 miles
The Great Escape andHurricane Harbor /
Six Flags Great EscapeLodge & Indoor
WaterparkQueensbury, NY
345 acres—combination theme parkand waterpark, plus 200room hotel and 38,000square foot indoorwaterpark
Albany (59) 1.1 million—50 miles3.1 million—100 miles
Huck Finn’s Playland /Albany, New York /60 milesSeveral hotels/indoorwaterparks / Poconos andNew England Areas /200 miles
* Based on a September 28, 2019 survey of television households within designated market areas published by A.C. Nielsen MediaResearch.
4
Partnership Park Arrangements
In connection with our 1998 acquisition of Former SFEC, we guaranteed certain obligations relating to
Six Flags Over Texas (‘‘SFOT’’) and Six Flags Over Georgia, including Six Flags White Water Atlanta
(‘‘SFOG’’, and together with SFOT, the ‘‘Partnership Parks’’). These obligations continue until 2027, in the case
of SFOG, and 2028, in the case of SFOT. Such obligations include (i) minimum annual distributions (including
rent) of approximately $74.2 million in 2020 (subject to cost of living adjustments in subsequent years) to the
limited partners in the Partnerships Parks (based on our ownership of units as of December 31, 2019, our share
of the distribution will be approximately $32.5 million) and (ii) minimum capital expenditures at each park
during rolling five-year periods based generally on 6% of Partnership Park revenues. Cash flow from operations
at the Partnership Parks is used to satisfy these requirements before any funds are required from us. We also
guaranteed the obligation of our subsidiaries to annually purchase all outstanding limited partnership units to the
extent tendered by the unit holders (the ‘‘Partnership Park Put’’).
After payment of the minimum distribution, we are entitled to a management fee equal to 3% of prior year
gross revenues and, thereafter, any additional cash will be distributed first to management fee in arrears, then
repayment of any interest and principal on intercompany loans, with any additional cash being distributed 95% to
us, in the case of SFOG, and 92.5% to us, in the case of SFOT.
The agreed price for units tendered in the Partnership Park Put is based on a valuation of each of the
respective Partnership Parks (the ‘‘Specified Price’’) that is the greater of (i) a valuation for each of the
respective Partnership Parks derived by multiplying such park’s weighted average four year EBITDA (as defined
in the agreements that govern the partnerships) by a specified multiple (8.0 in the case of SFOG and 8.5 in the
case of SFOT) and (ii) a valuation derived from the highest prices previously paid for the units of the
Partnership Parks by certain entities. Pursuant to the valuation methodologies described in the preceding
sentence, the Specified Price for the Partnership Parks, if determined as of December 31, 2019, is $409.7 million
in the case of SFOG and $527.3 million in the case of SFOT. As of December 31, 2019, we owned
approximately 31.0% and 53.2% of the Georgia limited partner interests and Texas limited partner interests,
respectively. The remaining redeemable units of approximately 69.0% and 46.8% of the Georgia limited partner
and Texas limited partner, respectively, represent a current redemption value for the limited partnership units of
approximately $529.3 million.
Pursuant to the 2019 annual offer, we did not purchase any units from the Georgia partnership and we
purchased 0.100 units from the Texas partnership for approximately $0.2 million in May 2019. The $350 million
accordion feature on the Second Amended and Restated Term Loan B under the Second Amended and Restated
Credit Facility (as defined in Note 8 to the consolidated financial statements included elsewhere in this Annual
Report) is available for borrowing for future ‘‘put’’ obligations if necessary.
In connection with our acquisition of the Former SFEC, we entered into the Subordinated Indemnity
Agreement with certain of the Company’s entities, Time Warner, and an affiliate of Time Warner (an indirect
subsidiary of AT&T Inc. as a result of a merger in 2018), pursuant to which, among other things, we transferred
to Time Warner (which has guaranteed all of our obligations under the Partnership Park arrangements) record
title to the corporations that own the entities that have purchased and will purchase limited partnership units of
the Partnership Parks, and we received an assignment from Time Warner of all cash flow received on such
limited partnership units, and we otherwise control such entities. In addition, we issued preferred stock of the
managing partner of the partnerships to Time Warner. In the event of a default by us under the Subordinated
Indemnity Agreement or of our obligations to our partners in the Partnership Parks, these arrangements would
permit Time Warner to take full control of both the entities that own limited partnership units and the managing
partner. If we satisfy all such obligations, Time Warner is required to transfer to us the entire equity interests of
these entities. The 2018 merger of Time Warner and AT&T Inc. did not affect the Time Warner guarantee of our
obligations under the Subordinated Indemnity Agreement.
We incurred $21.8 million of capital expenditures at these parks during the 2019 season, and intend to incur
an amount in excess of the minimum required expenditure in 2020. Cash flows from operations at the
Partnership Parks will be used to satisfy the annual distribution and capital expenditure requirements before any
funds are required from us. The two partnerships generated approximately $79.3 million of cash in 2019 from
operating activities after deduction of capital expenditures and excluding the impact of short-term intercompany
advances from or payments to Holdings, as the case may be. As of December 31, 2019 and 2018, we had total
loans receivable outstanding of $239.3 million from the partnerships that own the Partnership Parks.
5
The proceeds from these loans were primarily used to fund the acquisition of Six Flags White Water Atlanta and
to make capital improvements and distributions to the limited partners in prior years.
Marketing and Promotion
We attract visitors through multi-media marketing and promotional programs for each of our parks.
The programs are designed to attract guests and enhance the Six Flags brand name and are tailored to address
the different characteristics of our various markets and to maximize the impact of specific park attractions and
product introductions. All marketing and promotional programs are updated or completely changed each year to
address new developments. These initiatives are supervised by our Senior Vice President, Marketing and Sales,
with the assistance of our senior management and advertising and promotion agencies.
We also develop alliance, sponsorship and co-marketing relationships with well-known national, regional
and local consumer goods companies and retailers to supplement our advertising efforts and to provide
attendance incentives in the form of discounts.
In 2018, we enhanced our monthly membership program by offering four premium priced tiers with
enhanced benefits and launched a membership loyalty program, which entitles certain members to earn points
that may be redeemed for park-related rewards. Membership and season pass sales establish an attendance base
in advance of the season, reducing exposure to inclement weather and providing other benefits. In general, a
season pass holder or member contributes higher aggregate revenue and profitability to the Company over the
course of a year compared to a single day ticket guest because a season pass holder or member pays a higher
ticket price and contributes to in-park guest spending over multiple visits. Additionally, guests enrolled in our
membership program and season pass holders often bring paying guests and generate ‘‘word-of-mouth’’
advertising for the parks. Season pass and membership attendance constituted approximately 63% of the total
attendance at our parks in each of 2019, 2018 and 2017.
Our Group Sales team offers discounted tickets and catered meals for specific dates and tickets to large
groups such as businesses, schools, and religious, fraternal and similar organizations.
We also implement promotional programs as a means of targeting specific market segments and locations
not generally reached through group or retail sales efforts. The promotional programs utilize coupons,
sweepstakes, reward incentives and rebates to attract additional visitors. These programs are implemented through
online promotions, direct mail, telemarketing, direct-response media, sponsorship marketing and targeted
multi-media programs. The special promotional offers are usually available for a limited time and offer a reduced
admission price or provide some additional incentive to purchase a ticket.
Licenses
We have the exclusive right on a long-term basis to theme park usage of the Warner Bros. and DC Comics
animated characters throughout the U.S. (except for the Las Vegas metropolitan area), Canada, Mexico and
certain other countries. In particular, our license agreements entitle us to use, subject to customary approval
rights of Warner Bros. and, in limited circumstances, approval rights of certain third parties, all animated, cartoon
and comic book characters that Warner Bros. and DC Comics have the right to license, including Batman,
The Joker, Superman, Wonder Woman, The Flash, Green Lantern, Harley Quinn, Aquaman, Bugs Bunny,
Daffy Duck, Tweety Bird and Yosemite Sam. They also include the right to sell merchandise using the characters.
In addition to annual license fees, we are required to pay a royalty fee on any merchandise manufactured by or
for us and sold that use the licensed characters. Warner Bros. has the right to terminate the license agreements
under certain circumstances, including if any persons involved in the movie or television industries obtain control
of us or, in the case of Warner Bros., upon a default under the Subordinated Indemnity Agreement.
Park Operations
We currently operate in geographically diverse markets in North America. The parks are managed by a park
president who reports to a senior vice president of the Company. The park presidents are responsible for all
operations and management of the individual parks. Local advertising, ticket sales, community relations and
hiring and training of personnel are the responsibility of individual park management in coordination with
corporate support teams.
6
Each park president directs a full-time, on-site management team. Each management team includes senior
personnel responsible for operations and maintenance; in-park food, beverage, merchandising and games;
marketing and promotion; sponsorships; human resources and finance. Finance directors at our parks report to a
senior vice president of the Company, and, with their support staff, provide financial services to their respective
parks and park management teams. Park management compensation structures are designed to provide financial
incentives for individual park managers to execute our strategy and to maximize revenue and free cash flow.
Our parks are generally open daily from Memorial Day through Labor Day. In addition, most of our parks
are open weekends prior to and following their daily seasons, often in conjunction with themed events such as
Fright Fest® and Holiday in the Park®. Due to their location, certain parks have longer operating seasons.
Typically, the parks charge a basic daily admission price that allows unlimited use of all rides and attractions,
although in certain cases special rides and attractions require the payment of an additional fee. Our Six Flags
Magic Mountain park operates 365 days a year and our parks in Mexico and Six Flags Fiesta Texas operate
weekends year-round outside of their traditional operating season. In January 2020, Six Flags Over Texas began
operating weekends year-round outside of its traditional operating season.
See Note 17 to the consolidated financial statements included elsewhere in this Annual Report for
information concerning revenues and long-lived assets by domestic and international categories.
Capital Improvements and Other Initiatives
We regularly make capital investments for new rides and attractions in our parks. We purchase both new
and used rides and attractions. On occasion, we also relocate rides among parks to provide fresh attractions.
In addition, each year we make capital investments in the food, retail, games and other in-park areas to increase
guest spending per capita. We also make annual enhancements to theming and landscaping of our parks in order
to provide a more complete family-oriented entertainment experience, and invest in our information technology
infrastructure to attain operational efficiencies.
We believe the selective introduction of new rides and attractions, including family entertainment attractions,
together with making general investments in the appearance and infrastructure of our parks, are important factors
in promoting each of the parks to draw higher attendance and encourage longer visits, which can lead to higher
in-park sales.
During 2019, we added (i) the world’s first quadruple launch racing coaster at Six Flags Magic Mountain
(Valencia, CA); (ii) one of the world’s largest pendulum rides at Six Flags Great Adventure (Jackson, NJ);
(iii) the fastest accelerating launch coaster in North America at Six Flags Great America (Gurnee, IL); (iv) a 4D
Free Fly Coaster at Six Flags Discovery Kingdom (Vallejo, CA); (v) one of the world’s largest spinning
pendulum rides at Six Flags Fiesta Texas (San Antonio, TX); (vi) a new family area with six brand new
attractions at Six Flags Mexico (Mexico City, Mexico) and a new racing slide at Six Flags Hurricane Harbor
Oaxtepec (Oaxtepec, Mexico); (vii) the world’s largest loop coaster at Six Flags Over Texas (Arlington, TX);
(viii) a new dark ride attraction at Six Flags New England (Agawam, MA); (ix) a new kids area at Frontier City
(Oklahoma City, OK); (x) the tallest swinging pendulum ride in the Southeast at Six Flags Over Georgia
(Austell, GA); (xi) a loop coaster at La Ronde (Montreal, Canada); (xii) a new whirling wheel attraction at
Six Flags St. Louis (Eureka, MO); (xiii) two new family attractions and rebranding the waterpark to Hurricane
Harbor at The Great Escape (Queensbury, NY); (xiv) new trains and theming for the Firebird coaster at Six Flags
America (Largo, MD); (xv) a swing ride, the tallest thrill ride in New York, at Six Flags Darien Lake
(Buffalo, NY); (xvi) a new six-story wave wall slide at Hurricane Harbor Splashtown (Houston, TX);
(xvii) rebranding Wet ‘n’ Wild Phoenix, Wet ‘n’ Wild Splashtown and Darien Lake to Six Flags Hurricane
Harbor Phoenix, Six Flags Hurricane Harbor Splashtown and Six Flags Darien Lake, respectively; and
(xviii) our twenty-sixth park with the acquisition of Magic Waters Waterpark (Rockford, IL).
Planned initiatives for 2020 include (i) the tallest, fastest and longest single rail coaster at Six Flags Great
Adventure (Jackson, NJ); (ii) a record breaking water coaster at Six Flags Hurricane Harbor Gurnee
(Gurnee, IL), which will become a separately-gated waterpark; (iii) one of the world’s tallest pendulum rides at
Six Flags Mexico (Mexico City, Mexico); (iv) a first-of-its-kind in North America water coaster at Six Flags
Over Texas (Arlington, TX); (v) the first-ever free-fly coaster in Canada at La Ronde (Montreal, Canada);
(vi) a pendulum ride at Six Flags America (Largo, MD); (vii) two new spinning rides at Six Flags Over Georgia
(Austell, GA); (viii) a new twisting water slide at Six Flags Darien Lake (Buffalo, NY); (ix) a new sixteen-story
swing ride at The Great Escape (Queensbury, NY); (x) a new seven-story spinning ride at Six Flags New
7
England (Agawam, MA); (xi) the first tailspin waterslide in the Midwest at Six Flags Hurricane Harbor Rockford
(Rockford, IL); (xii) a new 12,000 square-foot activity pool at Six Flags Hurricane Harbor Phoenix (Glendale,
AZ); (xiii) three new waterslides at Six Flags Hurricane Harbor Arlington (Arlington, TX); (xiv) a five-story
waterslide at Six Flags White Water Atlanta (Marietta, GA); (xv) the tallest ride-of-its kind aerial flying machine
ride at Six Flags Fiesta Texas, San Antonio, TX); (xvi) a twelfth roller coaster at Six Flags Discovery Kingdom
(Vallejo, CA); (xvii) a sixteen-story aerial spinning ride at Six Flags St. Louis (Eureka, MO); and
(xviii) rebranding Magic Waters, White Water Bay, and Darien Lake’s Splashtown to Six Flags Hurricane Harbor
Rockford, Six Flags Hurricane Harbor Oklahoma City, and Six Flags Hurricane Harbor Darien Lake,
respectively.
In addition to making annual marketable capital expenditures, we perform maintenance capital expenditures
on an annual basis with most expenditures made during the off-season. Repairs and maintenance costs for
materials and services associated with maintaining assets, such as painting and inspecting existing rides, are
expensed as incurred and are not included in capital expenditures.
Also during 2020, we plan to continue (i) our targeted marketing strategies to attract guests, including
focusing on our breadth of product and value offerings; (ii) improving and expanding upon our branded product
offerings and guest-focused initiatives to continue driving guest spending growth, including membership and our
associated loyalty reward programs, and the all season dining pass program, which enables season pass holders
and members to eat meals and snacks any day they visit the park for one upfront payment; and (iii) growing
sponsorship and international agreements revenue opportunities.
International Agreements
We have signed agreements to assist third parties in the development and management of Six Flags-branded
parks outside of our core markets. As compensation for exclusivity, brand licensing rights, and design,
development and management services, we receive fees during the design and development period as well as
ongoing remuneration after the parks open to the public. The agreements do not require us to make any capital
investments in the parks.
We currently have agreements to develop a Six Flags-branded park in Saudi Arabia. As previously reported,
our partner in China has had well publicized liquidity challenges and defaulted on its payment obligations to us.
Our partner was not able to cure these defaults, and as a result we terminated our agreements with them on
February 14, 2020. It is therefore unlikely that we will recognize any revenue or profit in 2020 related to the
development of parks in China. Also, during 2019, we reached an agreement with our partner in Dubai to
discontinue the development of a Six Flags-branded theme park in Dubai.
Maintenance and Inspection
Rides are inspected at various levels and frequencies in accordance with manufacturer specifications.
Our rides are inspected daily during the operating season by our maintenance personnel. These inspections
include safety checks, as well as regular maintenance, and are made through both visual inspection and test
operations of the rides. Our senior management and the individual park personnel evaluate the risk aspects of
each park’s operations, potential risks to employees and staff as well as to the public. In addition, contingency
response plans for potential emergency situations have been developed for each facility. During the off-season,
maintenance personnel examine the rides and repair, refurbish and rebuild them when necessary. This process
includes x-raying and magnafluxing (a further examination for minute cracks and defects) steel portions of
certain rides at high-stress points. A large portion of our full-time workforce devotes substantially all of its time
to maintaining the parks and our rides and attractions. We use a computerized maintenance-management system
across all of our domestic parks to assist us in executing our maintenance programs.
In addition to the performance of our internal maintenance and inspection procedures, third-party consultants
are retained by us or our insurance carriers to perform an annual inspection of each park and all attractions.
The results of these inspections are reported in written evaluation and inspection reports and include suggestions
on various aspects of park operations. In certain states, state inspectors conduct additional annual ride inspections
before the beginning of each season. Other portions of each park are subject to inspections by local fire marshals
and health and building department officials. Furthermore, we use Ellis & Associates as water safety consultants
at all of our waterparks to train lifeguards and audit safety procedures.
8
Insurance
We maintain insurance of the types and in amounts we believe are commercially reasonable and are
available to businesses in our industry. We maintain multi-layered general liability policies that provide for
excess liability coverage of up to $100.0 million per occurrence. For incidents arising on or after December 31,
2008, our self-insured retention is $2.0 million, followed by a $0.5 million deductible per occurrence applicable
to all claims in the policy year for our domestic parks and our park in Canada and a nominal amount per
occurrence for our parks in Mexico. Defense costs are in addition to these retentions. Our general liability
policies cover the cost of punitive damages only in certain jurisdictions. Based upon reported claims and an
estimate for incurred, but not reported claims, we accrue a liability for our retention contingencies. For workers’
compensation claims arising after November 15, 2003, our deductible is $0.75 million. We also maintain fire and
extended coverage, business interruption, terrorism and other forms of insurance typical to businesses in this
industry. The all peril property coverage policies insure our real and personal properties (other than land) against
physical damage resulting from a variety of hazards. Additionally, we maintain information security and privacy
liability insurance in the amount of $10.0 million with a $0.25 million retention per event.
We generally renegotiate our insurance policies on an annual basis. The majority of our current insurance
policies expire on December 31, 2020. We cannot predict the level of the premiums that we may be required to
pay for subsequent insurance coverage, the level of any retention applicable thereto, the level of aggregate
coverage available or the availability of coverage for specific risks.
Competition
Our parks compete directly with other theme parks, waterparks and amusement parks and indirectly with
other types of recreational facilities and forms of entertainment within their market areas, including movies,
sporting events, home entertainment options, restaurants and vacation travel. Principal direct competitors of our
parks include SeaWorld Entertainment, Inc. and Cedar Fair, L.P. In addition, our business is subject to various
factors affecting the recreation and leisure time industries generally, such as general economic conditions and
changes in discretionary consumer spending habits. See ‘‘Item 1A. Risk Factors.’’ Within each park’s regional
market area, the principal factors affecting direct theme park competition include location, price, the uniqueness
and perceived safety and quality of the rides and attractions in the park, the atmosphere and cleanliness of the
park, the quality of park food and entertainment, and ease of travel to the park. We believe that our parks offer a
sufficient quality and variety of rides and attractions, culinary offerings, retail locations, and interactive and
family experiences to make them highly competitive with other parks and forms of entertainment.
Seasonality
Our operations are highly seasonal, with approximately 75% of park attendance and revenues occurring in
the second and third calendar quarters of each year, with the most significant period falling between Memorial
Day and Labor Day.
Environmental and Other Regulations
Our operations are subject to federal, state and local environmental laws and regulations including laws and
regulations governing water and sewer discharges, air emissions, soil and groundwater contamination, the
maintenance of underground and aboveground storage tanks and the disposal of waste and hazardous materials.
In addition, our operations are subject to other local, state and federal governmental regulations including,
without limitation, labor, health, safety, zoning and land use and minimum wage regulations applicable to theme
park and waterpark operations, and local and state regulations applicable to restaurant operations at each park.
Finally, certain of our facilities are subject to laws and regulations relating to the care of animals. We believe
that we are in compliance with applicable environmental and other laws and regulations and, although no
assurance can be given, we do not foresee the need for any significant expenditures in this area in the near
future.
Portions of the undeveloped areas at certain of our parks are classified as wetlands. Accordingly, we may
need to obtain governmental permits and other approvals prior to conducting development activities that affect
these areas and future development may be prohibited in some or all of these areas. Additionally, the presence of
wetlands in portions of our undeveloped land could adversely affect our ability to dispose of such land and/or the
price we receive in any such disposition.
9
Philanthropy and Community Relations
We believe it is important to support the communities in which our parks are located. We partner with
charitable organizations throughout North America whose missions align with our goal of bringing joy and thrills
to families and children. Through our Read to Succeed program, we support academic achievement and seek to
improve literacy by encouraging students to engage in recreational reading, and award free admission to eligible
participants in the program. Most of our full-time employees spend at least an entire day each year volunteering
on projects in their local communities to help others, including distributing food to those in need, improving
community centers and building or repairing homes. In addition, we sponsor toy drives, book drives, food drives
and blood donation drives at our parks. We are also committed to honoring the service of the U.S. military
personnel and their families by offering complimentary and/or discounted admission to our parks and maintain a
program in which we make a concerted effort to interview and hire U.S. military veterans. We host special
events to support various philanthropies whose missions focus on improving health or supporting those affected
by natural disasters. We are also the first-ever family of parks to earn the Certified Autism Center™ designation
from the International Board of Credentialing and Continuing Education at all 26 of our parks.
Employees
As of December 31, 2019, we employed approximately 2,450 full-time employees, and over the course of
the 2019 operating season we employed approximately 48,000 seasonal employees. In this regard, we compete
with other local employers for qualified students and other candidates on a season-by-season basis. As part of the
seasonal employment program, we employ a significant number of teenagers, which subjects us to child labor
laws.
Approximately 16% of our full-time and approximately 11% of our seasonal employees are subject to labor
agreements with local chapters of national unions. These labor agreements expire in December 2020 (Six Flags
Magic Mountain), January 2021 (Six Flags Over Texas), December 2021 (Six Flags Great Adventure), December
2024 (Six Flags Over Georgia) and January 2025 (Six Flags St. Louis). The labor agreements for La Ronde
expire in various years ranging from December 2020 through December 2024. We consider our employee
relations to be good.
Information about our Executive Officers and Certain Significant Employees
The following table sets forth the name of the members of the Company’s senior leadership team and
executive officers, the position held by such person and the age of such person as of the date of this report.
The officers of the Company are generally elected each year at a meeting of Holdings’ Board of Directors at the
time of Holdings’ annual meeting of stockholders, and at other Board of Directors meetings, as appropriate.
Name Age Title
Michael Spanos* 55 President and Chief Executive Officer
Lance C. Balk*(a) 62 Executive Vice President and General Counsel
Marshall Barber*(b) 56 Executive Vice President and Chief Financial Officer
Kathy Aslin* 44 Senior Vice President, Human Resources
David Austin 58 Senior Vice President and Chief Information Officer
Taylor Brooks* 33 Vice President and Chief Accounting Officer
Tom Iven 61 Senior Vice President, U.S. Park Operations
Brett Petit* 56 Senior Vice President, Marketing and Sales
Stephen R. Purtell 53 Senior Vice President, Investor Relations and Treasurer
Leonard A. Russ 46 Senior Vice President, Strategic Planning and Analysis
Bonnie Sherman Weber 55 Senior Vice President, In-Park Services
* Executive Officers
(a) Retiring effective March 2, 2020
(b) Retiring effective August 31, 2020
Michael Spanos was named President and Chief Executive Officer of Six Flags in November 2019. Prior to
joining Six Flags, he served as Chief Executive Officer Asia, Middle East and North Africa, of PepsiCo, Inc.,
10
a leading global food and beverage company with a complementary portfolio of brands, from January 2018 to
November 2019. Mr. Spanos previously served as interim head of PepsiCo, Inc.’s Asia, Middle East and North
Africa division from October 2017 to January 2018 and as President and Chief Executive Officer, PepsiCo
Greater China Region, from September 2014 to January 2018. Prior to that, Mr. Spanos served as Senior Vice
President and Chief Customer Officer, PepsiCo North America Beverages from October 2011 to September 2014.
Mr. Spanos previously held management roles of increasing responsibility at PepsiCo, Inc. since 1993 in North
America, Asia and the Middle East. Before joining PepsiCo, Inc. Mr. Spanos served in the United States Marines
Corps from 1987 to 1993. Mr. Spanos holds a B.S. degree from the U.S. Naval Academy, and he received a
Master’s degree in Organizational Behavior from the University of Pennsylvania.
Lance C. Balk was named General Counsel of Six Flags in September 2010. Mr. Balk previously served as
Senior Vice President and General Counsel of Siemens Healthcare Diagnostics from November 2007 to
January 2010. Prior to Dade Behring’s acquisition by Siemens AG, he served in the same capacity at Dade
Behring from May 2006 to November 2007. In these roles Mr. Balk was responsible for global legal matters.
Before joining Dade Behring, Mr. Balk was a partner at the law firm Kirkland & Ellis LLP, where he co-founded
the firm’s New York corporate and securities practices. Mr. Balk holds a J.D. and an M.B.A. from the University
of Chicago, and a B.A. degree in Philosophy from Northwestern University.
Marshall Barber was named Chief Financial Officer of Six Flags in February 2016 and is responsible for the
finance and information technology functions at Six Flags. Mr. Barber previously served as Vice President of
Business Planning for Six Flags from July 2006 to February 2016. He also held various other park-level and
corporate-level financial positions since joining Six Flags in October 1996. Prior to joining Six Flags, Mr. Barber
held financial positions at FoxMeyer Drug and G. D. Searle from 1994 to 1996 and with Electrocom Automation
from 1989 to 1994. Mr. Barber holds a B.B.A. degree in Finance from the University of Texas at Arlington and
an M.B.A. from Texas Christian University.
Kathy Aslin was named Senior Vice President, Human Resources of Six Flags in January 2017 and is
responsible for developing and implementing strategies to support Six Flags’ overall human resources vision
including organizational design, leadership development, employee training and education, compensation and
benefits, talent acquisition, and employee relations. Ms. Aslin began her career at Six Flags in 1998 as a seasonal
summer intern and over the years has held a number of management positions in Admissions, Guest Relations,
Finance, In-Park Services, Corporate Marketing and Human Resources. Ms. Aslin holds a B.B.A degree from
St. Gregory’s University and an M.B.A. from the University of Texas at Dallas.
David Austin was named Senior Vice President, Information Systems and Chief Information Officer of Six
Flags in December 2017. Mr. Austin had previously served as Chief Technology Officer at Berkshire Hathaway
Automotive from December 2014 to December 2017, where he had operational responsibility for all technology
across 100 business units, technology development, and leadership of the IT team. Prior to that, from May 2007
to December 2014, he served as the Vice President of Information Technology at Larry H. Miller Group, a
company with many businesses that included The Utah Jazz and associated arena businesses, large mega-plex
cinemas, a 500-acre racetrack complex, and a large automotive business, where he led the IT team. Mr. Austin
majored in Speech Communication at Fresno State University.
Taylor Brooks was named the Vice President and Chief Accounting Officer of Six Flags effective June 2018.
Mr. Brooks is responsible for overseeing the Company’s accounting function. Mr. Brooks joined the Company in
2013 as the Financial Reporting Manager and in 2015 was named Director of Accounting and Assistant Controller.
Prior to joining the Company, Mr. Brooks was the Financial Reporting and Technical Research Senior Accountant at
DynCorp International, LLC, and prior to DynCorp he worked for Ernst & Young LLP. Mr. Brooks holds a Bachelor’s
degree and a Master’s degree in Accounting from Abilene Christian University and is a Certified Public Accountant.
Tom Iven was named Senior Vice President, U.S. Park Operations of Six Flags in April 2014 and is
responsible for the management of all of Six Flags’ parks in the U.S. Mr. Iven began his career at Six Flags in
1976 as a seasonal employee and became a full-time employee in 1981. He held a number of management
positions within several parks including Six Flags Magic Mountain and Six Flags Over Texas before being
named General Manager of Six Flags St. Louis in 1998. In 2001, Mr. Iven was promoted to Executive
Vice President, Western Region, comprised of 17 parks, a post he held until 2006 when he was named Senior
11
Vice President. From 2010 until 2014, Mr. Iven was the Senior Vice President, Park Operations and was
responsible for the management of Six Flags’ parks in the Western region as well as the oversight of engineering,
maintenance and operating efficiency programs for all Six Flags parks. Mr. Iven holds a B.S. degree from
Missouri State University.
Brett Petit was named Senior Vice President, Marketing and Sales of Six Flags in June 2010 and is
responsible for all aspects of Six Flags’ marketing strategy, advertising, promotions, group sales, online
marketing, corporate sponsorships, media networks and licensed promotions. Over the course of his more than
35 years of experience in the theme and waterpark industry, Mr. Petit has managed marketing strategy for more
than 75 different theme parks, waterparks and family entertainment centers across the country. Prior to joining
Six Flags, Mr. Petit served from March 2007 to June 2010 as Senior Vice President of Marketing & Sales for
Palace Entertainment, an operator of theme parks and attractions with 38 locations hosting 14 million visitors.
Before that, he worked 12 years as Senior Vice President of Marketing for Paramount Parks with over 12 million
visitors and spent 13 years with Busch Entertainment Theme Parks as Marketing Vice President and Director of
Sales. Mr. Petit holds a B.A. degree in Marketing from University of South Florida.
Stephen R. Purtell was named Senior Vice President, Investor Relations and Treasurer of Six Flags in
October 2016 and is responsible for investor relations and treasury. Mr. Purtell previously served as Vice
President, Business Development and Treasurer for Six Flags from July 2012 to October 2016. Prior to joining
Six Flags, Mr. Purtell served as VP, Sales Operations and Market Research for Siemens Healthcare Diagnostics
after it acquired Dade Behring in 2007. Mr. Purtell joined Dade Behring in 2003 and held financial positions
including Assistant Treasurer, VP Corporate Planning & Analysis, and Treasurer. Prior to joining Dade Behring,
Mr. Purtell held financial and engineering positions at IMC Global and GATX Terminals Corporation, and was
an officer in the U.S. Army. Mr. Purtell has a B.S. in Civil Engineering from the U.S. Military Academy at West
Point and an M.B.A. from the Wharton School of the University of Pennsylvania.
Leonard A. Russ was named Senior Vice President, Strategic Planning and Analysis of Six Flags in
February 2016. From October 2010 until February 2016, Mr. Russ was Vice President and Chief Accounting
Officer of Six Flags where he was responsible for overseeing Six Flags’ accounting function and the finance
functions of the western region parks. Mr. Russ began his career at Six Flags in 1989 as a seasonal employee
and became a full-time employee in 1995. He held a number of management positions within Six Flags before
being named Director of Internal Audit in 2004. In 2005, Mr. Russ was promoted to Controller, a position he
held until being promoted to Chief Accounting Officer. Mr. Russ holds a B.B.A. degree in Accounting from the
University of Texas at Arlington.
Bonnie Sherman Weber was named Senior Vice President, In-Park Services, of Six Flags in January 2018
and is responsible for culinary, retail, games, rentals, parking and other services offered throughout Six Flags’
26 parks. Ms. Weber had previously served as Park President of Six Flags Magic Mountain and Hurricane
Harbor since August 2010. Ms. Weber began her career at Six Flags Magic Mountain in 1985 as a food service
employee. Throughout her years at Six Flags, she has assumed the role of Park Publicist, Manager of Advertising
and Promotions, and Director of Marketing. She previously worked at The Walt Disney Company and was also
the Director of Worldwide Marketing at Warner Bros. for four years. A Southern California native, Ms. Weber
holds a B.S. in Marketing from California State University Northridge.
12
Available Information
Copies of our annual reports on Form 10-K, quarterly reports on Form 10-Q, current reports on Form 8-K,
and amendments to those reports, are available free of charge through our website at investors.sixflags.com.
References to our website in this Annual Report are provided as a convenience and do not constitute an
incorporation by reference of the information contained on, or accessible through, the website. Therefore, such
information should not be considered part of this Annual Report. These reports, and any amendments to these
reports, are made available on our website as soon as reasonably practicable after we electronically file such
reports with, or furnish them to, the United States Securities and Exchange Commission (the ‘‘SEC’’). Copies are
also available, without charge, by sending a written request to Six Flags Entertainment Corporation,
924 Avenue J East, Grand Prairie, TX 75050, Attn: Investor Relations.
Our website, investors.sixflags.com, also includes items related to corporate governance matters, including
the charters of our Audit Committee, Nominating and Corporate Governance Committee and Compensation
Committee, our Corporate Governance Guidelines, our Code of Business Conduct and Ethics and our Code of
Ethics for Senior Management. Copies of these materials are also available, without charge, by sending a written
request to Six Flags Entertainment Corporation, 924 Avenue J East, Grand Prairie, TX 75050, Attn: Investor
Relations.
13
ITEM 1A. RISK FACTORS
Set forth below are the principal risks that we believe are most significant to our business and should be
considered by our security holders. We operate in a continually changing business environment and, therefore,
new risks emerge from time to time. This section contains forward-looking statements. For an explanation of the
qualifications and limitations on forward-looking statements, see ‘‘Cautionary Note Regarding Forward-Looking
Statements.’’
Risks Relating to Our Business
General economic conditions throughout the world may have an adverse impact on our business, financialcondition or results of operations.
Our success depends to a large extent on discretionary consumer spending, which is heavily influenced by
general economic conditions and the availability of discretionary income. Difficult economic conditions and
recessionary periods may have an adverse impact on our business and our financial condition. Negative economic
conditions, coupled with high volatility and uncertainty as to the future global economic landscape, have at times
had a negative effect on consumers’ discretionary income and consumer confidence, and similar impacts can be
expected should such conditions recur. A decrease in discretionary spending due to decreases in consumer
confidence in the economy or us, or a continued economic slowdown or deterioration in the economy, could
adversely affect the frequency with which guests choose to visit our parks and the amount that our guests spend
when they visit. The actual or perceived weakness in the economy could also lead to decreased spending by our
guests. Both attendance and guest spending at our parks are key drivers of our revenue and profitability, and
reductions in either could materially adversely affect our business, financial condition and results of operations.
Additionally, difficult economic conditions throughout the world could impact our ability to obtain supplies,
services and credit as well as the ability of third parties to meet their obligations to us, including, for example,
payment of claims by our insurance carriers, the funding of our lines of credit, or payment by our international
agreement partners. Changes in exchange rates for foreign currencies could reduce international demand for our
products, increase our labor and supply costs in non-U.S. markets or reduce the U.S. dollar value of revenue we
earn in other markets.
Our growth strategy and strategic plan may not achieve the anticipated results.
Our future success will depend on our ability to grow our business, including through capital investments to
improve existing parks, rides, attractions and other entertainment offerings, as well as through our culinary and
retail offerings. Our business strategy for growth may also include selective expansion, both domestically and
internationally, through acquisitions of assets or other strategic initiatives, such as international agreements, joint
ventures and partnerships that allow us to profitably expand our business and leverage our brand. Our growth
and innovation strategies require significant commitments of management resources and capital investments and
may not increase our revenues at the rate we expect or at all. Our business strategy for growth also requires that
the other parties to our international agreements, joint ventures and partnerships perform their obligations.
In addition, the success of any acquisitions depends on the effective integration of acquired businesses and assets
into our operations, which is subject to risks and uncertainties, including realization of anticipated synergies and
cost savings, the ability to retain and attract personnel, the diversion of management’s attention from other
business concerns, and undisclosed or potential legal liabilities of acquired businesses or assets. As a result,
we may not be able to recover the costs incurred in developing our new projects and initiatives or to realize their
intended or projected benefits, which could materially adversely affect our business, financial condition or results
of operations. For example, we had previously established, but did not achieve, our long-term aspirational goal to
achieve Modified EBITDA of $600 million by 2017 and we believe that on-time or late achievement of our
2020 Performance Award (Project 750) is not reasonably attainable.
Our strategy to grow our business by attracting guests through innovation and enhancement to the guest
experience may not be successful. If we are unable to achieve our strategic objectives and grow our business,
our financial condition and results of operations may be adversely affected.
Bad or extreme weather conditions and forecasts of bad or mixed weather conditions can adversely impactattendance at our parks.
Because most of the attractions at our parks are outdoors, attendance at our parks is adversely affected by
bad or extreme weather conditions and forecasts of bad or mixed weather conditions, which negatively affects
14
our revenues. The effects of bad weather on attendance can be more pronounced at our waterparks. We believe
our operating results in certain years were adversely affected by abnormally hot, cold and/or wet weather in a
number of our major U.S. markets. In addition, since a number of our parks are geographically concentrated in
the eastern portion of the United States, a weather pattern that affects that area could adversely affect a number
of our parks and disproportionately impact our results of operations. In addition, our parks in California and
Texas are more likely to be impacted by extreme heat, wildfires, mudslides and floods than our parks in other
locations. Bad weather and forecasts of bad weather on weekends, holidays or other peak periods will typically
have a greater negative impact on our revenues and could disproportionately impact our results of operations.
Natural disasters, public heath crises, terrorist activities or other events outside our control could damage ourproperties and could adversely impact attendance at our parks and result in decreased revenues.
An earthquake, hurricane, forest fire, flood, landslide or other natural disaster, or a power shortage or outage
or other comparable events could disrupt our operations, impair critical systems, damage our properties or reduce
the number of guests who visit our parks in affected areas. Damage to our properties could take a long time to
repair and there is no guarantee that we would have adequate insurance to cover the costs of repair or the
expense of the interruption to our business. Furthermore, such a disaster may interrupt or impede access to our
affected properties or require evacuations and may cause visits to our affected properties to decrease for an
indefinite period. For example, our waterpark in Oaxtepec, Mexico was closed for several months during the fall
of 2017 following the earthquakes in central Mexico. The occurrence of such natural disasters could have a
material adverse effect on our business, financial condition and results of operations.
Lower attendance at our parks may be caused by events outside our control such as terrorist alerts and
threats of future terrorist activities, contagious disease outbreaks, or local activities that we may not be able to
adequately anticipate or respond to. For example, in December 2019, an outbreak of respiratory illness caused by
coronavirus was first identified in Wuhan, China, and additional cases have been identified in other locations
including the United States. The extent to which the coronavirus may impact our results is uncertain at this time.
In addition, since some of our parks are near major urban areas and appeal to teenagers and young adults, there
may be disturbances at one or more parks that could negatively affect our image. This may result in a decrease
in attendance at the affected parks and could adversely impact our results of operations. We cannot predict the
frequency or severity of these activities and the effect that they may have on our business, financial condition or
results of operations.
Our operations are seasonal.
Our operations are seasonal. Approximately 75% of our annual park attendance and revenue occurs during
the second and third calendar quarters of each year. As a result, when conditions or events described in the above
risk factors occur during the operating season, particularly during the peak months of July and August, there is
only a limited period of time during which the impact of those conditions or events can be mitigated.
Accordingly, such conditions or events may have a disproportionately adverse effect on our revenues and cash
flow. In addition, most of our expenses for maintenance and costs of adding new attractions are incurred when
the parks are closed in the mid-to-late autumn and winter months. For this reason, a sequential quarter-to-quarter
comparison is not a good indication of our performance or of how we will perform in the future.
Failures in, material damage to, or interruptions in our information technology systems, software or websitesand difficulties in updating our systems or software or implementing new systems or software could adverselyaffect our business or operations.
We rely extensively on our information technology systems in the conduct of our business. We own and
license or otherwise contract for sophisticated technology and systems for the operation of our business. Such
systems are subject to damage or interruption from power outages, computer and telecommunications failures,
computer viruses, malicious attacks, security breaches and natural and man-made disasters. We require continued
and unimpeded access to these systems. Damage or interruption to our information technology systems may
require a significant investment to update, remediate or replace with alternate systems, and we may suffer
interruptions in our operations as a result. In addition, costs and potential problems and interruptions associated
with the implementation of new or upgraded systems and technology or with maintenance or adequate support of
existing systems could also disrupt or reduce the efficiency of our operations. Any material interruptions or
15
failures in our systems, including those that may result from our failure to adequately develop, implement and
maintain a robust disaster recovery plan and backup systems could severely affect our ability to conduct normal
business operations and, as a result, could adversely affect our business operations and financial performance.
We rely on third parties for the performance of a significant portion of our information technology
functions. In particular, our ticket, season pass and membership sales system relies on data communications
networks and technology systems and software operated by unaffiliated third parties. The success of our business
depends in part on maintaining our relationships with these third parties and their continuing ability to perform
these functions and services in a timely and satisfactory manner. If we experience a loss or disruption in the
provision of any of these functions or services, or they are not performed in a satisfactory manner, we may have
difficulty in finding alternate providers on terms favorable to us, in a timely manner or at all, and our business
could be adversely affected.
Cyber-attacks could have a disruptive effect on our business.
From time to time, we and our third-party service providers experience cyber-attacks, attempted and actual
breaches of our or their information technology systems and networks or similar events, which could result in a
loss of sensitive business or customer information, systems interruption or the disruption of our operations.
The techniques that are used to obtain unauthorized access, disable or degrade service or sabotage systems
change frequently and are difficult to detect for long periods of time, and we are accordingly unable to anticipate
and prevent all data security incidents.
Even if we are fully compliant with legal standards and contractual or other requirements, we still may not
be able to prevent security breaches involving sensitive data. The sophistication of efforts by hackers to gain
unauthorized access to information technology systems has continued to increase in recent years. Breaches,
thefts, losses or fraudulent uses of guest, employee or company data could cause consumers to lose confidence in
the security of our websites, mobile applications, point of sale systems and other information technology systems
and choose not to purchase from us. Such security breaches also could expose us to risks of data loss, business
disruption, litigation and other costs or liabilities, any of which could adversely affect our business.
If our efforts to protect the security of information about our guests and employees and our internal data areunsuccessful, we may face costly litigation and our revenue and reputation could suffer.
An important component of our business involves the receipt and storage of information about our guests as
well as maintaining our internal business data. We are subject to various risks and costs associated with the
collection, handling, storage and transmission of our guests’ personal information. We have, and require certain
of our vendors to have, programs in place to detect, contain and respond to data security incidents. However,
because the techniques used to obtain unauthorized access, disable or degrade service, or sabotage systems
change frequently and may be difficult to detect for long periods of time, we may be unable to anticipate these
techniques or implement adequate preventive measures. In addition, hardware, software, or applications we
develop or procure from third parties may contain defects in design or manufacture or other problems that could
unexpectedly compromise information security. Unauthorized parties may also attempt to gain access to our
systems or facilities, or those of third parties with whom we do business, through fraud, trickery, or other forms
of deceiving our employees, contractors, and vendors. Like many other companies, from time to time, both we
and our vendors have experienced data security incidents; however, to date, these incidents have not been
material to our business, financial condition or results of operations. If we or our vendors experience significant
data security breaches or fail to detect and appropriately respond to significant data security breaches, we could
be exposed to litigation, fines or other costs, our operations could be disrupted, and our guests could lose
confidence in our ability to protect their information, which could cause them to stop purchasing tickets,
memberships or season passes from us or visiting our parks altogether.
Failure to keep pace with developments in technology could adversely affect our operations or competitiveposition.
The theme park and waterpark industry demands the use of sophisticated technology and systems for
operation of our parks, ticket, membership and season pass sales and management, and labor and inventory
management. These technologies may require refinements and upgrades. The development and maintenance of
these technologies may require significant investment by us. As various systems and technologies become
16
outdated or new technology is required, we may not be able to replace or introduce them as quickly as needed or
in a cost-effective and timely manner. We may not achieve the benefits we may have been anticipating from any
new technology or system.
There is a risk of accidents occurring at our parks or competing parks which may reduce attendance andnegatively impact our operations.
Our brand and our reputation are among our most important assets. Our ability to attract and retain
customers depends, in part, upon the external perceptions of the Company, the quality and safety of our parks,
services and rides, and our corporate and management integrity. While we carefully maintain the safety of our
rides, there are inherent risks involved with these attractions. An accident or an injury (including water-borne
illnesses at waterparks) at any of our parks or at parks operated by competitors, particularly an accident or injury
involving the safety of guests and employees, that receives media attention, could negatively impact our brand or
reputation, cause loss of consumer confidence in the Company, reduce attendance at our parks, and negatively
impact our results of operations. For example, in September 2019, a coaster accident at La Feria, a competing
park in Mexico, resulted in two fatalities. We believe that the publicity surrounding this accident had a
significant negative impact on attendance at our park in Mexico during that period. The considerable expansion
in the use of social media over recent years has compounded the impact of negative publicity. If any such
incident occurs during a time of high seasonal demand, the effect could disproportionately impact our results of
operations for the year.
We depend on a seasonal workforce, many of whom are paid at minimum wage.
Our park operations are dependent in part on a seasonal workforce, many of whom are paid at minimum
wage. We seek to manage seasonal wages and the timing of the hiring process to ensure the appropriate
workforce is in place for peak and low seasons, however, we may be unable to recruit and hire sufficient
personnel to meet our business needs. In addition, we cannot guarantee that material increases in the cost of
securing our seasonal workforce will not occur in the future. Increased state or federal minimum wage
requirements, seasonal wages or an inadequate workforce could have an adverse impact on our results of
operations. We anticipate that the recent increases to the minimum wage rates will increase our salary, wage and
benefit expenses in 2020 and future years and further legislative changes could continue to increase these
expenses in the future.
The theme park and waterpark industry competes with numerous entertainment alternatives and suchcompetition may have an adverse impact on our business, financial condition or results of operations.
Our parks compete with other theme parks, waterparks and amusement parks and with other types of
recreational facilities and forms of entertainment, including movies, home entertainment options, sporting events,
restaurants and vacation travel. Our business is also subject to factors that affect the recreation and leisure time
industries generally, such as general economic conditions, including relative fuel prices, and changes in consumer
spending habits. The principal competitive factors of a park include location, price, the uniqueness and perceived
quality of the rides and attractions, the atmosphere and cleanliness of the park and the quality of its food and
entertainment. If we are unable to compete effectively against entertainment alternatives or on the basis of
principal competitive factors of the park, our business, financial condition or results of operations may be
adversely affected.
We could be adversely affected by changes in consumer tastes and preferences for entertainment andconsumer products.
The success of our parks depends substantially on consumer tastes and preferences that can change in often
unpredictable ways and on our ability to ensure that our parks meet the changing preferences of the broad
consumer market. We conduct research and analysis before acquiring new parks or opening new rides or
attractions and often invest substantial amounts before we learn the extent to which these new parks and new
rides or attractions will earn consumer acceptance. If visitor volumes at our parks were to decline significantly or
if new rides and entertainment offerings at our parks do not achieve sufficient consumer acceptance, revenues
and margins may decline. Our results of operations may also be adversely affected if we fail to retain long-term
customer loyalty or provide satisfactory customer service.
17
Our insurance coverage may not be adequate to cover all possible losses that we could suffer, and ourinsurance costs may increase.
Although we maintain various safety and loss prevention programs and carry property and casualty
insurance to cover certain risks, our insurance policies do not cover all types of losses and liabilities.
Additionally, there can be no assurance our insurance will be sufficient to cover the full extent of all losses or
liabilities for which we are insured. The majority of our current insurance policies have annual terms and expire
on December 31, 2020, and we cannot guarantee we will be able to renew our current insurance policies on
favorable terms, or at all. In addition, if we or other theme or waterpark operators sustain significant losses or
make significant insurance claims, then our ability to obtain future insurance coverage at commercially
reasonable rates could be materially adversely affected. If our insurance coverage is not adequate, or we become
subject to damages that cannot by law be insured against, such as punitive damages or certain intentional
misconduct by our employees, this could adversely affect our financial condition or results of operations.
If we are not able to fund capital expenditures and invest in future attractions and projects in our parks, ourrevenues could be negatively impacted.
Because a principal competitive factor for a theme park or a waterpark is the uniqueness and perceived
quality of its rides and attractions, we need to make continued capital investments through maintenance and the
regular addition of new rides and attractions. A key element for our revenue growth is strategic capital spending
on such investments. Our ability to fund capital expenditures will depend on our ability to generate sufficient
cash flow from operations and to raise capital from third parties. We cannot provide assurance our operations
will be able to generate sufficient cash flow to fund such costs, or that we will be able to obtain sufficient
financing on adequate terms, or at all, which could cause us to delay or abandon certain projects or plans.
In addition, any construction delays or ride downtime can adversely affect our attendance and our ability to
realize revenue growth.
Incidents involving food contamination, product recalls, product liability claims and associated costs couldadversely affect our reputation and our financial condition.
The sale of food, toys and other retail products involves legal and other risks. While we dedicate substantial
resources to food safety matters to enable customers to enjoy safe, quality food products, food safety events,
including instances of food-borne illness (such as salmonella or E. Coli) could occur in our parks. Instances or
reports, whether true or not, of food-safety issues could negatively affect our sales and reputation and could
possibly lead to product liability claims, litigation (including class actions), or other damages. We may need to
recall food products if they become contaminated, and we may need to recall toys, games or other retail
merchandise if there is a design or product defect. Even though we are resellers of food, toys and other retail
products, we may be liable if the consumption or purchase of any of the products we sell causes illness or injury.
A recall could result in losses due to the cost of the recall, the destruction of product and lost sales due to the
unavailability of product for a period of time. A significant food or retail product recall could also result in
adverse publicity, damage to our reputation and loss of consumer confidence in our parks, which could have a
material adverse effect on our business, financial condition or results of operations.
We may be unable to purchase or contract with third parties to manufacture theme park or waterpark ridesand attractions.
We may be unable to purchase or contract with third parties to build high quality rides and attractions and
to continue to service and maintain those rides and attractions at competitive or beneficial prices, or to provide
the replacement parts needed to maintain the operation of such rides. In addition, if our third-party suppliers’
financial condition deteriorates or they go out of business, we may not be able to obtain the full benefit of
manufacturer warranties or indemnities typically contained in our contracts or may need to incur greater costs for
the maintenance, repair, replacement or insurance of these assets.
Adverse litigation judgments or settlements resulting from legal proceedings in which we may be involved inthe normal course of our business could adversely affect our financial condition or results of operations.
We are subject to allegations, claims and legal actions arising in the ordinary course of our business, which
may include claims by third parties, including guests who visit our parks, our employees or regulators.
The outcome of these proceedings cannot be predicted. If any of these proceedings is determined adversely to us,
18
or if we receive a judgment, a fine or a settlement involving a payment of a material sum of money, or
injunctive relief is issued against us, our business, financial condition and results of operations could be
materially adversely affected. Litigation can also be expensive, lengthy and disruptive to normal business
operations, including to our management due to the increased time and resources required to respond to and
address the litigation.
Additionally, from time to time, animal activist and other third-party groups may make negative public
statements about us or bring claims before government agencies or lawsuits against us. Such claims and lawsuits
sometimes are based on allegations that we do not properly care for some of our featured animals. On other
occasions, such claims and/or lawsuits are specifically designed to change existing law or enact new law in order
to impede our ability to retain, exhibit, acquire or breed animals. While we seek to comply with all applicable
federal and state laws and vigorously defend ourselves in any lawsuits, there are no assurances as to the outcome
of future claims and lawsuits that could be brought against us. An unfavorable outcome in any legal proceeding
could have a material adverse effect on our business, financial condition and results of operations. In addition,
associated negative publicity could adversely affect our reputation, financial condition and results of operations.
We may not be able to realize the benefits of our international agreements.
Various external factors, including difficult economic and political conditions throughout the world, could
negatively affect the progress of our initiatives to develop new Six Flags-branded parks outside of North
America. These initiatives could be delayed, and the ultimate success of such parks may be uncertain. For
example, we cancelled our project in Dubai and, on February 14, 2020, we terminated our agreements with our
partner in China parks as a result of its uncured payment defaults.
Some factors that will be important to the success of our international agreement initiatives are different
than those affecting our existing parks. Tastes naturally vary by region, and consumers in new international
markets into which we expand our brand may not embrace the parks’ offerings to the same extent as consumers
in our existing markets. International agreements are also subject to additional risks, including the performance
of our partners and their ability to obtain financing and government approvals; the impact of economic
fluctuations in economies outside of the U.S.; difficulties and costs of staffing and managing foreign operations
due to distance, language and cultural differences; changes or uncertainties in economic, legal, regulatory, social
and political conditions; the enforceability of intellectual property and contract rights; and foreign currency
exchange rate fluctuations, currency controls, and potentially adverse tax consequences of overseas operations.
If we do not realize the benefits of such transactions, it could have an adverse effect on our financial
performance.
Our leases contain default provisions that, if enforced or exercised by the landlord, could significantly impactour operations at those parks.
Of our 26 theme parks and waterparks, 12 are located on property that we lease and do not own. Certain of
our leases permit the landlord to terminate the lease if there is a default under the lease, including, for example,
our failure to pay rent, utilities and applicable taxes in a timely fashion or to maintain certain insurance. If a
landlord were to terminate a lease, it would halt our operations at that park and, depending on the size of the
park, could have a negative impact on our financial condition and results of operations. In addition, any disputes
that may result from such a termination may be expensive to pursue and may divert money and management’s
attention from our other operations and adversely affect our business, financial condition or results of operations.
Our intellectual property rights are valuable, and any inability or material increase in the cost to protect themcould adversely affect our business.
Our intellectual property, including our trademarks and domain names and other proprietary rights,
constitutes a significant part of our value. To protect our intellectual property rights, we rely upon a combination
of trademark, trade secret and unfair competition laws of the United States and other countries, as well as
contract provisions and third-party policies and procedures governing internet/domain name registrations.
However, there can be no assurance these measures will be successful in any given case, particularly in those
countries where the laws do not protect our proprietary rights as fully as in the United States. We may be unable
to prevent the misappropriation, infringement or violation of our intellectual property rights, breach of any
contractual obligations to us, or independent development of intellectual property that is similar to ours, any of
19
which could reduce or eliminate any competitive advantage we have developed, adversely affect our revenues or
otherwise harm our business. In addition, pursuant to our license agreements, we have exclusive theme park
usage rights in the U.S. (except for the Las Vegas metropolitan area), Canada and Mexico to certain
Warner Bros. and DC Comics animated characters. The license fee is subject to periodic scheduled adjustments
and CPI increases, and Warner Bros. has the right to terminate the agreements under certain circumstances, such
as a default under the Subordinated Indemnity Agreement. The termination of these licenses, or a material
increase in the cost to retain these licenses, could have a material adverse effect on our business or financial
condition.
We may be subject to claims for infringing the intellectual property rights of others, which could be costly andresult in the loss of intellectual property rights.
We cannot be certain that we do not and will not infringe the intellectual property rights of others. We have
been in the past, and may be in the future, subject to litigation and other claims in the ordinary course of our
business based on allegations of infringement or other violations of the intellectual property rights of others.
Regardless of their merits, intellectual property claims can divert the efforts of our personnel and are often
time-consuming and expensive to litigate or settle. In addition, to the extent claims against us are successful,
we may have to pay substantial monetary damages or discontinue, modify, or rename certain products or services
that are found to be in violation of another party’s rights. We may have to seek a license (if available on
acceptable terms, or at all) to continue offering products and services, which may increase our operating
expenses.
Increased labor costs and employee health and welfare benefits may reduce our results of operations.
Labor is a primary component in the cost of operating our business. We devote significant resources to
recruiting and training our managers and employees. Increased labor costs due to competition, increased
minimum wage or employee benefit costs or otherwise, would adversely impact our operating expenses.
The Patient Protection and Affordable Care Act of 2010 and the amendments thereto contain provisions which
will impact our future healthcare costs. We do not anticipate these changes will result in a material increase in
our operating costs. Our results of operations are also substantially affected by costs of retirement, including as a
result of macro-economic factors beyond our control, such as declines in investment returns on pension plan
assets and changes in discount rates used to calculate pension and related liabilities.
Additionally, we contribute to multiple defined benefit multiemployer pension plans on behalf of our
collectively bargained employees of Six Flags Great Adventure LLC. If we were to cease contributing to or
otherwise incur a withdrawal from any such plans, we could be obligated to pay withdrawal liability assessments
based on the underfunded status (if any) of such plans at the time of the withdrawal. The amount of any
multiemployer pension plan underfunding can fluctuate from year to year, and thus there is a possibility that the
amount of withdrawal liability that we could incur in the future could be material, which could materially
adversely affect our financial condition.
Unionization activities or labor disputes may disrupt our operations and affect our profitability.
As of December 31, 2019, approximately 16% of our full-time and approximately 11% of our seasonal
employees were subject to labor agreements with local chapters of national unions. We have collective bargaining
agreements in place for certain employees at Six Flags Over Georgia, Six Flags Magic Mountain, Six Flags
Great Adventure, Six Flags Over Texas, Six Flags St. Louis, and La Ronde. New unionization activity or a labor
dispute involving our employees could disrupt our operations and reduce our revenues, and resolution of
unionization activities or labor disputes could increase our costs. Litigation relating to employment and/or wage
and hour disputes could also increase our operating expenses. Such disrupted operations, reduced revenues or
increased costs could have a material adverse effect on our financial condition and results of operations.
Regulation in the areas of privacy and protection of user data could harm our business.
We are subject to laws that regulate the collection, use, retention, security, and transfer of our guests’
personally identifiable information. These laws apply not only to third-party transactions but also to transfers of
information between or among the Company and other parties with which we have commercial relationships.
These laws continue to evolve in ways we cannot predict, both through regulatory and legislative action and
judicial decisions, and that may harm our business.
20
For example, California has adopted the California Consumer Privacy Act of 2018 (‘‘CCPA’’), effective as
of January 1, 2020, which provides a new private right of action for data breaches and requires companies that
process information on California residents to make new disclosures to consumers about their data collection, use
and sharing practices and allow consumers to opt out of certain data sharing with third parties. In addition to the
CCPA, several other states are considering adopting laws and regulations that will impose obligations with
respect to how companies handle personal data. Compliance with the CCPA, and other current and future
applicable privacy and related laws can be costly and time-consuming and violations of privacy-related laws can
result in significant damages and penalties.
Our privacy policies and practices concerning the collection, use and disclosure of user data are available on
our website. Any failure, or perceived failure, by us to comply with our posted privacy policies or with any
regulatory requirements or orders or other privacy or consumer protection-related laws and regulations, including
the CCPA, could result in proceedings or actions against us by governmental entities or others (e.g., class action
privacy litigation), subject us to significant penalties and negative publicity, require us to change our business
practices, increase our costs and adversely affect our business. Data collection, privacy and security have become
the subject of increasing public concern. If Internet and mobile users were to reduce their use of our websites,
mobile platforms, products, and services as a result of these concerns, our business could be harmed.
Our operations and our ownership of property subject us to environmental, health and safety and otherregulations, which create uncertainty regarding future expenditures and liabilities.
Our operations involve wastewater and stormwater discharges and air emissions, and as a result are subject
to environmental, health and safety laws, regulations and permitting requirements. These requirements are
administered by the U.S. Environmental Protection Agency and the states and localities where our parks are
located (and can also often be enforced through citizen suit provisions) and include the requirements of the Clean
Water Act and the Clean Air Act. Our operations also involve maintaining underground and aboveground storage
tanks, and managing and disposing of hazardous substances, chemicals and materials and are subject to federal,
state and local laws and regulations regarding the use, generation, manufacture, storage, handling and disposal of
these substances, chemicals and materials, including the Resource Conservation and Recovery Act and the
Comprehensive Environmental Response, Compensation and Liability Act (‘‘CERCLA’’). A portion of our capital
expenditures budget is intended to ensure continued compliance with environmental, health and safety laws,
regulations and permitting requirements. In the event of contamination or injury as a result of a release of or
exposure to regulated materials, we could be held liable for any resulting damages. For example, pursuant to
CERCLA, past and current owners and operators of facilities and persons arranging for disposal of hazardous
substances may be held strictly, jointly and severally liable for costs to remediate releases and threatened releases
of hazardous substances. The costs of investigation, remediation or removal of regulated materials may be
substantial, and the presence of those substances, or the failure to remediate property properly, may impair our
ability to use, transfer or obtain financing regarding our property. Our activities may be affected by new
legislation or changes in existing environmental, health and safety laws. For example, the state or federal
government having jurisdiction over a given area may enact legislation and the U.S. Environmental Protection
Agency or applicable state entity may propose new regulations or change existing regulations that could require
our parks to reduce certain emissions or discharges. Such action could require our parks to install costly
equipment or increase operating expenses. We may be required to incur costs to remediate potential
environmental hazards, mitigate environmental risks in the future, or comply with other environmental
requirements.
We also are subject to federal and state laws, which prohibit discrimination and other laws regulating the
design and operation of facilities, such as the Americans With Disabilities Act. Compliance with these laws and
regulations can be costly and increase our exposure to litigation and governmental proceedings, and a failure or
perceived failure to comply with these laws could result in negative publicity that could harm our reputation,
which could adversely affect our business.
We may not be able to attract and retain key management and other key employees.
Our employees, particularly our key management, are vital to our success and difficult to replace. We may
be unable to retain them or to attract other highly qualified employees, particularly if we do not offer
employment terms competitive with the rest of the market. Failure to attract and retain highly qualified
employees, or failure to develop and implement a viable succession plan, could result in inadequate depth of
institutional knowledge or skill sets, adversely affecting our business.
21
Risk related to tariffs and other duties
We source merchandise for resale and other products used in our business from entities located outside of
North America. Additionally, some of our ride manufacturers may be located in foreign countries or may utilize
components or materials manufactured or sourced from foreign countries. Our business exposes us to risks
associated with global commerce, including changes to tariffs, quotas and other restrictions on imports. While
existing tariffs and duties have not had a material impact on our business, the U.S. government may impose
additional tariffs on thousands of products sourced from foreign countries and has expressed a willingness to
impose additional or increased tariffs on goods imported from China, including many items that we purchase for
our business. While the impact has been immaterial to date, tariffs or duties could lower our gross margin on
impacted products. Additionally, even if the products that we import are not affected directly by tariffs or other
duties, the imposition of such additional tariffs on goods imported into the United States could cause increased
pricing of other consumer goods, which could lower the discretionary income of our potential guests and
decrease attendance or in-park spending.
Risks Related to Our Indebtedness and Common Stock
A portion of our cash flow is required to be used to fund our substantial monetary obligations.
We must satisfy the following obligations with respect to the Partnership Parks:
• We must make annual distributions to our partners in the Partnership Parks, which will amount to
approximately $74.2 million in 2020 (based on our ownership of units as of December 31, 2019, our
share of the distribution will be approximately $32.5 million), with similar amounts (adjusted for
changes in cost of living) payable in future years.
• We must spend a minimum of approximately 6% of each of the Partnership Parks’ annual revenues
over specified periods for capital expenditures.
• Each year we must offer to purchase all outstanding limited partnership units from our partners in the
Partnership Parks. The remaining redeemable units of the Georgia limited partner and Texas limited
partner, respectively, represent a current redemption value for the limited partnership units of
approximately $529.3 million as of December 31, 2019. As we purchase additional units, we are
entitled to a proportionate increase in our share of the minimum annual distributions. In future years,
we may need to incur indebtedness under the Second Amended and Restated Credit Facility to satisfy
such unit purchase obligations.
We expect to use cash flow from the operations at the Partnership Parks to satisfy all or part of our annual
distribution and capital expenditure obligations with respect to these parks before we use any of our other funds.
The two partnerships generated approximately $79.3 million of cash in 2019 from operating activities after
deduction of capital expenditures and excluding the impact of short-term intercompany advances from or
repayments to us. As of December 31, 2019, we had loans outstanding of $239.3 million to the partnerships that
own the Partnership Parks, primarily to fund the acquisition of Six Flags White Water Atlanta, and to make
capital improvements and distributions to the limited partners in prior years. The obligations relating to SFOG
continue until 2027 and those relating to SFOT continue until 2028. In the event of a default by us under the
Subordinated Indemnity Agreement or of our obligations to our partners in the Partnership Parks, these
arrangements would permit Time Warner to take full control of both the entities that own limited partnership
units and the managing partner, and we would lose control of the Partnership Parks. In addition, such a default
could trigger an event of default under the Second Amended and Restated Credit Facility. For more information
regarding the Subordinated Indemnity Agreement, see ‘‘Business—Partnership Park Arrangements.’’
We spent $140.2 million on capital expenditures, net of property insurance recoveries, during the
2019 calendar year. We plan to strategically reinvest in our properties to improve the guest experience. Our
business plan includes targeted annual capital spending, however, depending on various factors including
strategic initiatives, unanticipated delays, weather conditions, and availability and cost of ride components, we
may spend more or less than our planned target amount.
22
Our indebtedness under the Second Amended and Restated Credit Facility and our other obligations could
have material negative consequences to us and investors in our securities. The following could materially
adversely affect our business, financial condition or results of operations:
• We may not be able to satisfy all of our obligations, including, but not limited to, our obligations under
the instruments governing our outstanding debt, which may cause a cross-default or cross-acceleration
on other debt we may have incurred.
• We could have difficulties obtaining necessary financing in the future for working capital, capital
expenditures, debt service requirements, refinancing or other purposes.
• We could have difficulties obtaining additional financing to fund our annual Partnership Park
obligations if the amount of the Second Amended and Restated Credit Facility is insufficient.
• We would have to use a significant portion of our cash flow to make payments on our debt and to
satisfy the other obligations set forth above, which may reduce the capital available for operations and
expansion.
• Adverse economic or industry conditions may have a more negative impact on us.
We cannot be sure that cash generated from our parks will be as high as we expect or that our expenses will
not be higher than we expect. Because a portion of our expenses are fixed in any given year, our operating cash
flows are highly dependent on revenues, which are largely driven by attendance levels, in-park sales,
accommodations and sponsorship and international agreement activity. A lower amount of cash generated from
our parks or higher expenses than expected, when coupled with our debt obligations, could adversely affect our
ability to fund our operations.
Various factors could affect Holdings’ ability to sustain its dividend.
Holdings’ ability to pay a dividend on its common stock or sustain it at current levels is subject to our
ability to generate sufficient cash flow to pay dividends. In addition, our debt agreements contain certain
limitations on the amount of cash we are permitted to distribute to our stockholders by way of dividend or stock
repurchase. In addition, Holdings’ Board of Directors may suspend the payment of dividends, or increase or
decrease the dividend amount, at any time if it deems such action to be in the best interests of the Company and
its stockholders. If we do not pay dividends, the price of our common stock must appreciate for investors to
realize a gain on their investment in the Company. This appreciation may not occur or our stock may depreciate
in value.
We may be unable to service our indebtedness.
Our ability to make scheduled payments on and to refinance our debt, including the Second Amended and
Restated Credit Facility and the 2024 Notes, the 2024 Notes Add-on and the 2027 Notes, depends on and is
subject to our financial and operating performance, which in turn is affected by general and regional economic,
financial, competitive, business and other factors beyond our control, including the availability of financing in the
banking and capital markets. We cannot provide assurance our business will generate sufficient cash flow from
operations or future borrowings will be available to us in an amount sufficient to enable us to service our debt,
to refinance our debt or to fund our other liquidity needs. If we are unable to meet our debt obligations or to
fund our other liquidity needs, we may be forced to reduce or delay scheduled expansion and capital
expenditures, sell material assets or operations, obtain additional capital or restructure our debt, which could
cause us to default on our debt obligations and impair our liquidity. Any refinancing of our indebtedness could
be at higher interest rates and may require us to comply with more onerous covenants, which could further
restrict our business operations. If we are required to dispose of material assets or operations or restructure our
debt to meet our debt service and other obligations, we cannot provide assurance the terms of any such
transaction will be satisfactory to us or if, or how soon, any such transaction could be completed.
The Second Amended and Restated Term Loan B has interest payments calculated on a London Inter-Bank
Offered Rate (‘‘LIBOR’’) plus an additional percentage based on credit risk. LIBOR is the subject of recent
proposals for reform. On July 27, 2017, the United Kingdom’s Financial Conduct Authority announced that it
intends to stop persuading and compelling banks to submit LIBOR rates after 2021. These reforms may cause
LIBOR to cease to exist, new methods of calculating LIBOR to be established or the establishment of an
23
alternative reference rate. The consequences cannot be entirely predicted and could have an adverse impact on
our current interest payments. Changes in market interest rates may influence our future financing costs and
could reduce our earnings and cash flows.
The market price of Holdings’ common stock may be volatile, which could cause the value of an investment in
Holdings’ common stock to decline.
We can give no assurances about future liquidity in the trading market for Holdings’ common stock. If there
is limited liquidity in the trading market for Holdings’ common stock, a sale of a large number of shares of
Holdings’ common stock could be adversely disruptive to the market price of Holdings’ common stock.
Numerous factors, including many over which we have no control, may have a significant impact on the
market price of Holdings’ common stock. These risks include those described or referred to in this ‘‘Risk
Factors’’ section and in other documents incorporated herein by reference as well as, among other things:
• Our operating and financial performance and prospects;
• Our ability to repay our debt;
• Our access to financial and capital markets to refinance our debt or replace the existing credit facilities;
• Investor perceptions of us and the industry and markets in which we operate;
• Our dividend policy;
• Our stock repurchase program;
• Future sales of equity or equity-related securities;
• Changes in earnings estimates or buy/sell recommendations by analysts; and
• General financial, domestic, economic and other market conditions.
The instruments governing our indebtedness include financial and other covenants that will imposerestrictions on our financial and business operations.
The instruments governing our indebtedness restrict our ability to, among other things, incur additional
indebtedness, incur liens, make investments, sell assets, pay dividends, repurchase stock or engage in transactions
with affiliates. In addition, the Second Amended and Restated Credit Facility contains financial covenants that
will require us to maintain a maximum senior secured leverage ratio. These covenants may have a material
impact on our operations. If we fail to comply with the covenants in the Second Amended and Restated Credit
Facility or the indenture governing Holdings’ $300.0 million of 4.875% senior unsecured notes due 2024
(the ‘‘2024 Notes’’), $700.0 million of 4.875% senior unsecured notes due 2024 (the ‘‘2024 Notes Add-on’’), and
$500.0 million of 5.50% senior unsecured notes due 2027 (the ‘‘2027 Notes’’) and are unable to obtain a waiver
or amendment, an event of default would result under the applicable debt instrument.
Events beyond our control, such as weather and economic, financial and industry conditions, may affect our
ability to continue meeting our financial covenant ratios under the Second Amended and Restated Credit Facility.
The need to comply with these financial covenants and restrictions could limit our ability to execute our strategy
and expand our business or prevent us from borrowing more money when necessary.
The Second Amended and Restated Credit Facility and the indentures governing the 2024 Notes, the
2024 Notes Add-on and the 2027 Notes also contain other events of default customary for financings of these
types, including cross defaults to certain other indebtedness, cross acceleration to other indebtedness and certain
change of control events. If an event of default were to occur, the lenders under the Second Amended and
Restated Credit Facility could declare outstanding borrowings under the Second Amended and Restated Credit
Facility immediately due and payable and the holders of the 2024 Notes, the 2024 Notes Add-on and the
2027 Notes could elect to declare the 2024 Notes, the 2024 Notes Add-on and the 2027 Notes to be due and
payable, together with accrued and unpaid interest. We cannot provide assurance we would have sufficient
liquidity to repay or refinance such indebtedness if it was accelerated upon an event of default. In addition, an
event of default or declaration of acceleration under the Second Amended and Restated Credit Facility could also
result in an event of default under other indebtedness.
24
We can make no assurances we will be able to comply with these restrictions in the future or that our
compliance would not cause us to forego opportunities that might otherwise be beneficial to us.
Changes in our credit ratings could adversely affect the price of Holdings’ common stock.
We receive debt ratings from the major credit rating agencies in the United States. Factors that may impact
our credit ratings include the sizable attendance and revenue generated from our portfolio of geographically
diversified regional theme parks and waterparks, vulnerability to cyclical discretionary consumer spending, and
seasonality of our operations. In March 2017, in connection with the issuance of the 2027 Notes, Moody’s
assigned a B2 rating to the 2027 Notes, upgraded the 2024 Notes from B3 to B2, and reaffirmed our Ba1 rating
on the credit facility and our B1 corporate family rating. In March 2017, Standard & Poor’s assigned a
BB- rating to the 2027 Notes and reaffirmed our BB- rating on the 2024 Notes and our BB corporate credit
rating. Moody’s has placed our ratings on ‘‘stable outlook.’’ In January 2020, Standard and Poor’s affirmed all
our ratings but revised our rating outlook to negative from stable. We cannot provide assurance our ratings will
remain the same. A negative change in our ratings or the perception such a change might occur could adversely
affect the market price of Holdings’ common stock.
Holdings is a holding company and is dependent on dividends and other distributions from its subsidiaries.
Holdings is a holding company and substantially all of its operations are conducted through direct and
indirect subsidiaries. As a holding company, it has no significant assets other than its equity interests in its
subsidiaries. Accordingly, Holdings is dependent on dividends and other distributions from its subsidiaries to
meet its obligations, including the obligations under the Second Amended and Restated Credit Facility, the
2024 Notes, the 2024 Notes Add-on, and the 2027 Notes, and to pay the dividend on Holdings’ common stock.
If these dividends and other distributions are not sufficient for Holdings to meets its financial obligations, or not
available to Holdings due to restrictions in the instruments governing our indebtedness, it could cause Holdings
to default on our debt obligations, which would impair our liquidity and adversely affect our financial condition
and our business. We had $174.2 million of cash and cash equivalents on a consolidated basis at December 31,
2019, of which $14.8 million was held at Holdings.
Provisions in Holdings’ corporate documents and the law of the State of Delaware as well as change ofcontrol provisions in certain of our debt and other agreements could delay or prevent a change of control,even if that change would be beneficial to stockholders or could have a materially negative impact on ourbusiness.
Certain provisions in Holdings’ Restated Certificate of Incorporation, the Second Amended and Restated
Credit Facility and the indentures governing the 2024 Notes, the 2024 Notes Add-on and the 2027 Notes may
have the effect of deterring transactions involving a change in control of us, including transactions in which
stockholders might receive a premium for their shares.
Holdings’ Certificate of Incorporation provides for the issuance of up to 5,000,000 shares of preferred stock
with such designations, rights and preferences as may be determined from time to time by Holdings’ Board of
Directors. The authorization of preferred shares empowers Holdings’ Board of Directors, without further
stockholder approval, to issue preferred shares with dividend, liquidation, conversion, voting or other rights that
could adversely affect the voting power or other rights of the holders of the common stock. If issued, the
preferred stock could also dilute the holders of Holdings’ common stock and could be used to discourage, delay
or prevent a change of control of us.
Holdings is also subject to the anti-takeover provisions of the Delaware General Corporation Law, which
could have the effect of delaying or preventing a change of control in some circumstances. All of the foregoing
factors could materially and adversely affect the price of Holdings’ common stock.
The Second Amended and Restated Credit Facility contains provisions pursuant to which it is an event of
default if any ‘‘person’’ becomes the beneficial owner of more than 35% of the common stock. This could deter
certain parties from seeking to acquire us and if any ‘‘person’’ were to become the beneficial owner of more than
35% of the common stock, we may not be able to repay such indebtedness.
ITEM 1B. UNRESOLVED STAFF COMMENTS
We have received no written comments regarding our periodic or current reports from the staff of the SEC
that were issued 180 days or more preceding the end of our 2019 fiscal year and that remain unresolved.
25
ITEM 2. PROPERTIES
Set forth below is a brief description of our material real estate as of December 31, 2019. See also
‘‘Business—Description of Parks.’’
• Six Flags America, Largo, Maryland—515 acres (owned)
• Six Flags Discovery Kingdom, Vallejo, California—135 acres (owned)
• Six Flags Fiesta Texas, San Antonio, Texas—220 acres (owned)
• Six Flags Great Adventure & Safari and Hurricane Harbor, Jackson, New Jersey—2,200 acres (owned)
• Six Flags Great America, Gurnee, Illinois—304 acres (owned)
• Six Flags Hurricane Harbor, Arlington, Texas—47 acres (owned)
• Six Flags Hurricane Harbor, Valencia, California—12 acres (owned)
• Six Flags Hurricane Harbor, Oaxtepec, Mexico—67 acres (leasehold interest)(1)
• Six Flags Magic Mountain, Valencia, California—250 acres (owned)
• Six Flags Mexico, Mexico City, Mexico—110 acres (occupied pursuant to a permit agreement)(2)
• Six Flags New England, Agawam, Massachusetts—262 acres (substantially all owned)
• Six Flags Over Georgia, Austell, Georgia—283 acres (leasehold interest)(3)
• Six Flags Over Texas, Arlington, Texas—217 acres (leasehold interest)(3)
• Six Flags St. Louis, Eureka, Missouri—320 acres (owned)
• Six Flags White Water Atlanta, Marietta, Georgia—69 acres (owned)(4)
• La Ronde, Montreal, Canada—146 acres (leasehold interest)(5)
• The Great Escape and Lodge, Queensbury, New York—345 acres (owned)
• Six Flags Hurricane Harbor Concord, Concord, California—24 acres (leasehold)(6)
• Six Flags Darien Lake, Buffalo, New York—982 acres (leasehold)(7)
• Frontier City, Oklahoma City, Oklahoma—113 acres (leasehold)(7)
• Six Flags Hurricane Harbor Oklahoma City, Oklahoma City, Oklahoma—24 acres (leasehold)(7)
• Six Flags Hurricane Harbor Phoenix, Glendale, Arizona—33 acres (leasehold)(8)
• Six Flags Hurricane Harbor Splashtown, Spring, Texas—46 acres (leasehold)(7)
• Six Flags Hurricane Harbor Rockford, Rockford, IL—43 acres (leasehold)(9)
(1) The site is leased from the Mexican Social Security Institute. The lease expires in 2036. The waterpark opened to the public in 2017.
(2) The permit agreement is with the Federal District of Mexico City. The agreement expires in 2024.
(3) Lessor is the limited partner of the partnership that owns the park. The SFOG and SFOT leases expire in 2027 and 2028, respectively,
at which time we have the option to acquire all of the interests in the respective lessor that we have not previously acquired.
(4) Owned by the Georgia partnership.
(5) The site is leased from the City of Montreal. The lease expires in 2065.
(6) The site is leased from EPR Parks, LLC pursuant to a sublease that expires in 2035 or the earlier expiration of the ground lease.
We began operating the waterpark in 2017.
(7) These sites are leased from EPR Parks, LLC pursuant to a lease that expires in 2037. We began operating these parks in 2018.
(8) This site is leased from EPR Parks, LLC pursuant to a lease that expires in 2033. We began operating the waterpark in 2018.
(9) This site is leased from the Rockford Park District. The lease expires in 2029. We began operating the waterpark in 2019.
In addition to the foregoing, we also lease office space and a limited number of rides and attractions at our
parks. See Note 16 to the consolidated financial statements included elsewhere in this Annual Report for a
26
discussion of lease commitments. We consider our properties to be well maintained, in good condition and
adequate for their present uses and business requirements. We have granted to our lenders under the Second
Amended and Restated Credit Facility agreement, a mortgage on substantially all of our owned United States
properties.
ITEM 3. LEGAL PROCEEDINGS
The nature of the industry in which we operate tends to expose us to claims by guests, generally for
injuries. Accordingly, we are party to various legal actions arising in the normal course of business, including the
proceedings discussed below.
On January 7, 2016, a potential class action complaint was filed against Six Flags Entertainment
Corporation in the Circuit Court of Lake County, Illinois. On April 22, 2016, Great America, LLC was added as
a defendant. The complaint asserts that we violated the Illinois Biometric Information Privacy Act (‘‘BIPA’’) in
connection with the admission of season pass holders and members through the finger scan program that
commenced in the 2014 operating season at Six Flags Great America in Gurnee, Illinois, and seeks statutory
damages, attorneys’ fees and an injunction. An aggrieved party under BIPA may recover (i) $1,000 if a company
is found to have negligently violated BIPA or (ii) $5,000 if found to have intentionally or recklessly violated
BIPA, plus reasonable attorneys’ fees in each case. The complaint does not allege that any information was
misused or disseminated. On April 7, 2017, the trial court certified two questions for consideration by the Illinois
Appellate Court of the Second District. On June 7, 2017, the Illinois Appellate Court granted our motion to
appeal. Accordingly, two questions regarding the interpretation of BIPA were certified for consideration by the
Illinois Appellate Court. On December 21, 2017, the Illinois Appellate Court found in our favor, holding that the
plaintiff had to allege more than a technical violation of BIPA and had to be injured in some way in order to
have a right of action. On March 1, 2018, the plaintiff filed a petition for leave to appeal to the Illinois
Supreme Court. On May 30, 2018, the Illinois Supreme Court granted the plaintiff’s leave to appeal and oral
arguments were heard on November 20, 2018. On January 25, 2019, the Illinois Supreme Court found in favor of
the plaintiff, holding that the plaintiff does not need to allege an actual injury beyond the violation of his rights
under BIPA in order to proceed with a complaint. We intend to continue to vigorously defend ourselves against
this litigation. Since this litigation is in an early stage, the outcome is currently not determinable, and a
reasonable estimate of loss or range of loss in excess of the immaterial amount that we have recorded for this
litigation cannot be made.
During 2017, four potential class action complaints were filed against Six Flags Entertainment Corporation
or one of its subsidiaries. Complaints were filed on August 11, 2017, in the Circuit Court of Lake County,
Illinois, on September 1, 2017, in the United States District Court for the Northern District of Georgia, on
September 11, 2017, in the Superior Court of Los Angeles County, California, and on November 30, 2017, in the
Superior Court of Ocean County, New Jersey. The complaints allege that we, in violation of federal law, printed
more than the last five digits of a credit or debit card number on customers’ receipts, and/or the expiration dates
of those cards. A willful violation may subject a company to liability for actual damages or statutory damages
between $100 and $1,000 per person, punitive damages in an amount determined by a court, and reasonable
attorneys’ fees, all of which are sought by the plaintiffs. The complaints do not allege that any information was
misused. The Circuit Court in Illinois granted our motion to dismiss on November 2, 2018, but the matter was
reversed on appeal on January 22, 2020. We intend to seek further review with the Illinois Supreme Court.
The District Court for the Northern District of Georgia denied our motion to dismiss on May 6, 2019, but on
December 31, 2019, the matter was stayed and administratively closed on our motion based on the Eleventh
Circuit’s review of an order denying dismissal in a case involving substantially similar factual allegations and
statutory violations. Either side may move to reopen the Georgia case within 30 days of the issuance of the
Eleventh Circuit’s opinion in the other matter. Our demurrer in the California matter was overruled on
February 26, 2019, but the order contained certain favorable rulings that enabled us to file a motion for summary
judgment on December 12, 2019. The Superior Court in the New Jersey matter granted our motion to dismiss on
January 18, 2019, which ruling the plaintiff has appealed. We intend to vigorously defend ourselves against these
lawsuits. The outcome of these lawsuits is currently not determinable, and a reasonable estimate of loss or range
of loss in excess of the immaterial amount that we have recorded for this litigation cannot be made.
On March 8, 2016, certain plaintiffs filed a complaint against one of our subsidiaries in the Superior Court
of Massachusetts, Suffolk County, on behalf of a purported class of current and former employees of Six Flags
New England. The complaint alleges violations of Massachusetts law governing employee overtime and rest
27
breaks, and seeks damages in the form of unpaid wages for overtime and meal breaks and related penalties.
On July 2, 2018, the plaintiffs filed a motion for class certification of two classes, an overtime class and a meal
break class. On November 8, 2018, the court granted class certification for the overtime class and denied class
certification for the meal break class. On June 20, 2019, in response to competing motions for summary
judgment on the application of an overtime wage exemption applicable to amusement parks that operate no more
than 150 days per year, the court agreed that the defendant park did not operate more than 150 days in 2013,
2014, and 2016, but found that it did operate more than 150 days in 2015, 2017 and 2018, for which the
defendant park would owe overtime wages. On September 26, 2019, we filed a motion for reconsideration with
respect to 2017 and 2018, because the defendant park relied on a separate overtime wage law exemption
applicable to a separate and distinct operation of the business in those years. On December 6, 2019, the court
denied our motion for reconsideration. We continue to vigorously defend ourselves against this litigation.
However, there can be no assurance regarding the ultimate outcome of this litigation and we have accrued our
best estimate of exposure, the amount of which is not material to our consolidated financial statements.
We are party to various other legal actions, including intellectual property disputes and employment and/or
wage and hour litigation, arising in the normal course of business. We do not expect to incur any material
liability by reason of such actions.
ITEM 4. MINE SAFETY DISCLOSURES
Not applicable.
28
PART II
ITEM 5. MARKET FOR THE REGISTRANT’S COMMON EQUITY, RELATED STOCKHOLDERMATTERS AND ISSUER PURCHASES OF EQUITY SECURITIES
Market Information and Record Holders
Holdings’ common stock is listed on the New York Stock Exchange under the ticker symbol ‘‘SIX.’’ As of
February 18, 2020, there were approximately 159 stockholders of record of Holdings’ common stock. This does
not reflect holders who beneficially own common stock held in nominee or street name accounts through brokers
or banks.
Dividends
Holdings has paid a consecutive quarterly cash dividend since 2010. On November 18, 2019, Holdings’
Board of Directors declared a quarterly cash dividend of $0.83 payable December 9, 2019 to stockholders of
record as of November 29, 2019. The declaration and payment of future dividends are at the sole discretion of
Holdings’ Board of Directors. Holdings’ Board of Directors currently anticipates continuing to pay cash
dividends on Holdings’ common stock on a quarterly basis. However, the declaration and amount of any future
dividends depend on various factors including the Company’s earnings, cash flows, and financial condition.
Furthermore, the Second Amended and Restated Credit Facility and the indentures governing the 2024 Notes, the
2024 Notes Add-on and the 2027 Notes include certain limitations on Holdings’ ability to pay dividends. For
more information, see ‘‘Management’s Discussion and Analysis of Financial Condition and Results of
Operations - Liquidity and Capital Resources’’ in Item 7 of this Annual Report and Note 8 to the consolidated
financial statements in Item 8 of this Annual Report.
Issuer Purchases of Equity Securities
On June 7, 2016, Holdings announced that its Board of Directors approved a new stock repurchase program
that permitted Holdings to repurchase an incremental $500.0 million in shares of Holdings’ common stock
(the ‘‘June 2016 Stock Repurchase Plan’’). Holdings fully utilized the availability under the June 2016 Stock
Repurchase Plan by May 2017. Throughout the program, Holdings repurchased 8,392,000 shares at a cumulative
cost of approximately $500.0 million and an average price per share of $59.58.
On March 30, 2017, Holdings announced that its Board of Directors approved a new stock repurchase plan
that permits Holdings to repurchase an incremental $500 million in shares of Holdings’ common stock
(the ‘‘March 2017 Stock Repurchase Plan’’). As of February 18, 2020, Holdings had repurchased
4,604,000 shares at a cumulative cost of approximately $268.3 million and an average price per share of $58.27
under the March 2017 Stock Repurchase Plan, leaving approximately $231.7 million available for permitted
repurchases.
The following table sets forth information regarding purchases of Holdings’ common stock under the
March 2017 Stock Repurchase Plan during the three months ended December 31, 2019:
Period
Totalnumber of
sharespurchased
Averageprice
paid pershare
Total number ofshares purchased
as part of publiclyannounced plans
or programs
Approximate dollarvalue of shares that
may yet be purchasedunder the plans
or programs
Month 1 . . . . . . . . . . . . October 1 - October 31 — $— — $231,727,000
Month 2 . . . . . . . . . . . . November 1 - November 30 — $— — $231,727,000
Month 3 . . . . . . . . . . . . December 1 - December 31 — $— — $231,727,000
— $— — $231,727,000
29
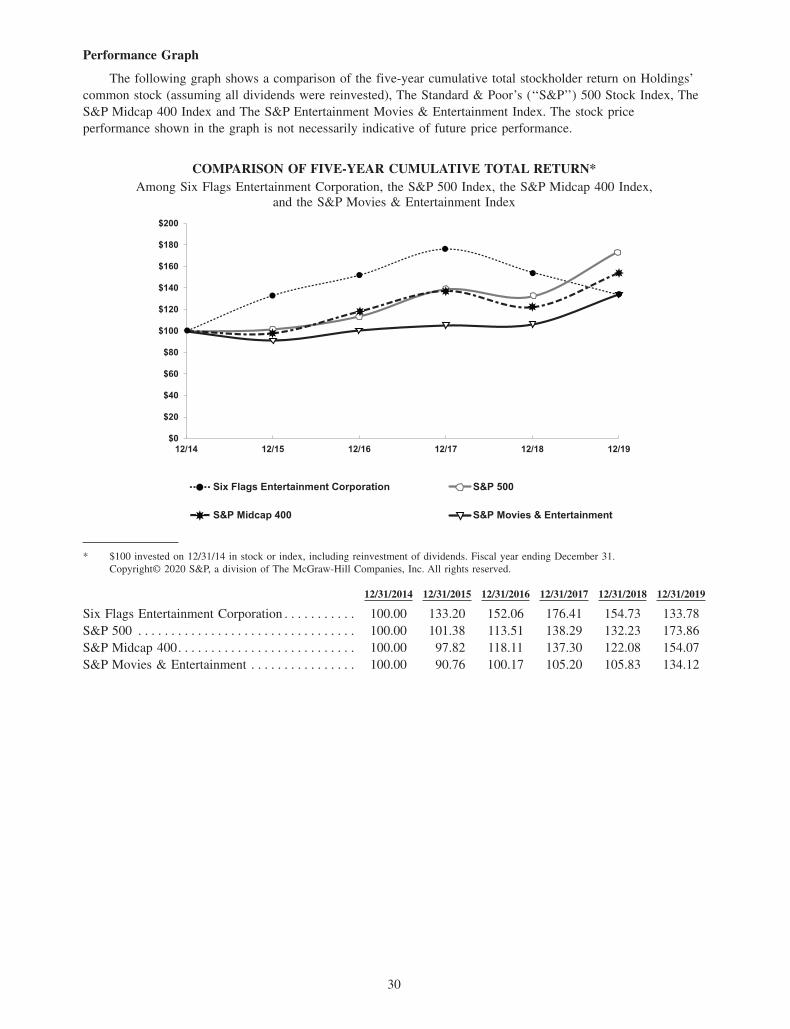
Performance Graph
The following graph shows a comparison of the five-year cumulative total stockholder return on Holdings’
common stock (assuming all dividends were reinvested), The Standard & Poor’s (‘‘S&P’’) 500 Stock Index, The
S&P Midcap 400 Index and The S&P Entertainment Movies & Entertainment Index. The stock price
performance shown in the graph is not necessarily indicative of future price performance.
COMPARISON OF FIVE-YEAR CUMULATIVE TOTAL RETURN*
Among Six Flags Entertainment Corporation, the S&P 500 Index, the S&P Midcap 400 Index,and the S&P Movies & Entertainment Index
* $100 invested on 12/31/14 in stock or index, including reinvestment of dividends. Fiscal year ending December 31.
Copyright© 2020 S&P, a division of The McGraw-Hill Companies, Inc. All rights reserved.
12/31/2014 12/31/2015 12/31/2016 12/31/2017 12/31/2018 12/31/2019
Six Flags Entertainment Corporation . . . . . . . . . . . 100.00 133.20 152.06 176.41 154.73 133.78
S&P 500 . . . . . . . . . . . . . . . . . . . . . . . . . . . . . . . . . 100.00 101.38 113.51 138.29 132.23 173.86
S&P Midcap 400. . . . . . . . . . . . . . . . . . . . . . . . . . . 100.00 97.82 118.11 137.30 122.08 154.07
S&P Movies & Entertainment . . . . . . . . . . . . . . . . 100.00 90.76 100.17 105.20 105.83 134.12
30
$0
$20
$40
$60
$80
$100
$120
$140
$160
$180
$200
12/14 12/15 12/16 12/17 12/18 12/19
Six Flags Entertainment Corporation
S&P Midcap 400
S&P 500
S&P Movies & Entertainment
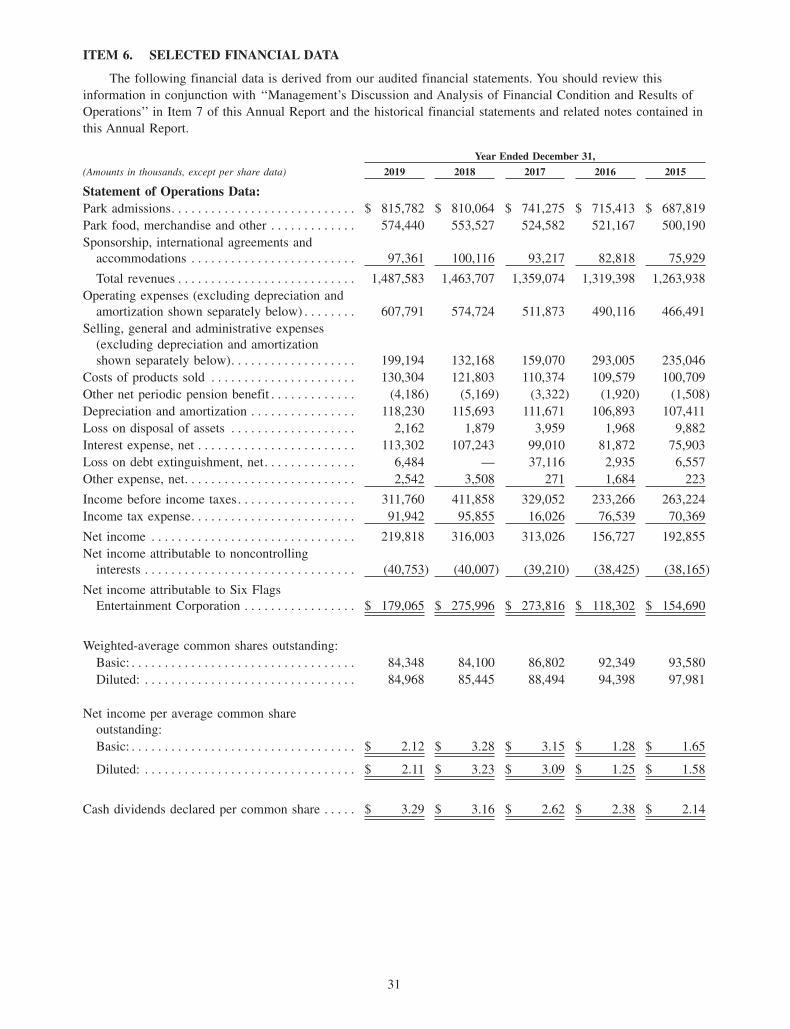
ITEM 6. SELECTED FINANCIAL DATA
The following financial data is derived from our audited financial statements. You should review this
information in conjunction with ‘‘Management’s Discussion and Analysis of Financial Condition and Results of
Operations’’ in Item 7 of this Annual Report and the historical financial statements and related notes contained in
this Annual Report.
Year Ended December 31,
(Amounts in thousands, except per share data) 2019 2018 2017 2016 2015
Statement of Operations Data:
Park admissions. . . . . . . . . . . . . . . . . . . . . . . . . . . . $ 815,782 $ 810,064 $ 741,275 $ 715,413 $ 687,819
Park food, merchandise and other . . . . . . . . . . . . . 574,440 553,527 524,582 521,167 500,190
Sponsorship, international agreements and
accommodations . . . . . . . . . . . . . . . . . . . . . . . . . 97,361 100,116 93,217 82,818 75,929
Total revenues . . . . . . . . . . . . . . . . . . . . . . . . . . . 1,487,583 1,463,707 1,359,074 1,319,398 1,263,938
Operating expenses (excluding depreciation and
amortization shown separately below) . . . . . . . . 607,791 574,724 511,873 490,116 466,491
Selling, general and administrative expenses
(excluding depreciation and amortization
shown separately below). . . . . . . . . . . . . . . . . . . 199,194 132,168 159,070 293,005 235,046
Costs of products sold . . . . . . . . . . . . . . . . . . . . . . 130,304 121,803 110,374 109,579 100,709
Other net periodic pension benefit . . . . . . . . . . . . . (4,186) (5,169) (3,322) (1,920) (1,508)
Depreciation and amortization . . . . . . . . . . . . . . . . 118,230 115,693 111,671 106,893 107,411
Loss on disposal of assets . . . . . . . . . . . . . . . . . . . 2,162 1,879 3,959 1,968 9,882
Interest expense, net . . . . . . . . . . . . . . . . . . . . . . . . 113,302 107,243 99,010 81,872 75,903
Loss on debt extinguishment, net. . . . . . . . . . . . . . 6,484 — 37,116 2,935 6,557
Other expense, net. . . . . . . . . . . . . . . . . . . . . . . . . . 2,542 3,508 271 1,684 223
Income before income taxes. . . . . . . . . . . . . . . . . . 311,760 411,858 329,052 233,266 263,224
Income tax expense. . . . . . . . . . . . . . . . . . . . . . . . . 91,942 95,855 16,026 76,539 70,369
Net income . . . . . . . . . . . . . . . . . . . . . . . . . . . . . . . 219,818 316,003 313,026 156,727 192,855
Net income attributable to noncontrolling
interests . . . . . . . . . . . . . . . . . . . . . . . . . . . . . . . . (40,753) (40,007) (39,210) (38,425) (38,165)
Net income attributable to Six Flags
Entertainment Corporation . . . . . . . . . . . . . . . . . $ 179,065 $ 275,996 $ 273,816 $ 118,302 $ 154,690
Weighted-average common shares outstanding:
Basic: . . . . . . . . . . . . . . . . . . . . . . . . . . . . . . . . . . 84,348 84,100 86,802 92,349 93,580
Diluted: . . . . . . . . . . . . . . . . . . . . . . . . . . . . . . . . 84,968 85,445 88,494 94,398 97,981
Net income per average common share
outstanding:
Basic: . . . . . . . . . . . . . . . . . . . . . . . . . . . . . . . . . . $ 2.12 $ 3.28 $ 3.15 $ 1.28 $ 1.65
Diluted: . . . . . . . . . . . . . . . . . . . . . . . . . . . . . . . . $ 2.11 $ 3.23 $ 3.09 $ 1.25 $ 1.58
Cash dividends declared per common share . . . . . $ 3.29 $ 3.16 $ 2.62 $ 2.38 $ 2.14
31
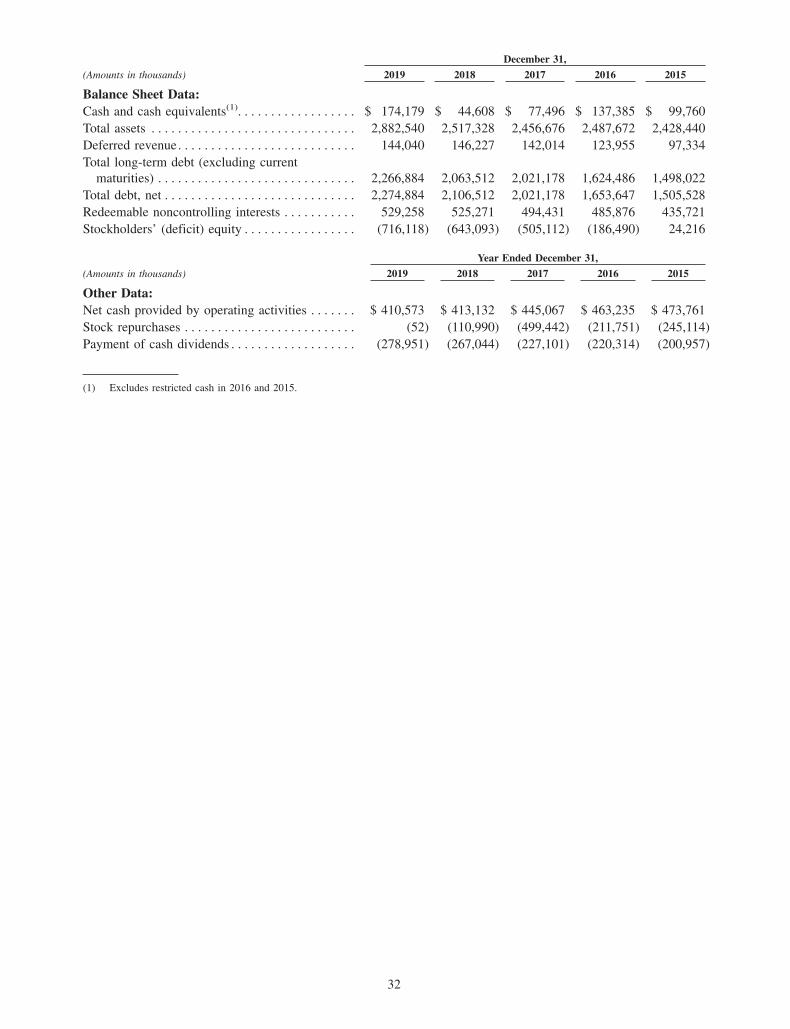
December 31,
(Amounts in thousands) 2019 2018 2017 2016 2015
Balance Sheet Data:
Cash and cash equivalents(1). . . . . . . . . . . . . . . . . . $ 174,179 $ 44,608 $ 77,496 $ 137,385 $ 99,760
Total assets . . . . . . . . . . . . . . . . . . . . . . . . . . . . . . . 2,882,540 2,517,328 2,456,676 2,487,672 2,428,440
Deferred revenue. . . . . . . . . . . . . . . . . . . . . . . . . . . 144,040 146,227 142,014 123,955 97,334
Total long-term debt (excluding current
maturities) . . . . . . . . . . . . . . . . . . . . . . . . . . . . . . 2,266,884 2,063,512 2,021,178 1,624,486 1,498,022
Total debt, net . . . . . . . . . . . . . . . . . . . . . . . . . . . . . 2,274,884 2,106,512 2,021,178 1,653,647 1,505,528
Redeemable noncontrolling interests . . . . . . . . . . . 529,258 525,271 494,431 485,876 435,721
Stockholders’ (deficit) equity . . . . . . . . . . . . . . . . . (716,118) (643,093) (505,112) (186,490) 24,216
Year Ended December 31,
(Amounts in thousands) 2019 2018 2017 2016 2015
Other Data:
Net cash provided by operating activities . . . . . . . $ 410,573 $ 413,132 $ 445,067 $ 463,235 $ 473,761
Stock repurchases . . . . . . . . . . . . . . . . . . . . . . . . . . (52) (110,990) (499,442) (211,751) (245,114)
Payment of cash dividends . . . . . . . . . . . . . . . . . . . (278,951) (267,044) (227,101) (220,314) (200,957)
(1) Excludes restricted cash in 2016 and 2015.
32
ITEM 7. MANAGEMENT’S DISCUSSION AND ANALYSIS OF FINANCIAL CONDITION ANDRESULTS OF OPERATIONS
Significant components of the Management’s Discussion and Analysis of Financial Condition and Results of
Operations section include:
• Overview. The overview section provides a summary of Six Flags and the principal factors affecting
our results of operations.
• Critical Accounting Policies. The critical accounting policies section provides detail with respect to
accounting policies that are considered by management to require significant judgment and use of
estimates and that could have a significant impact on our financial statements.
• Recent Events. The recent events section provides a brief description of recent events occurring in our
business.
• Results of Operations. The results of operations section provides an analysis of our results for the years
ended December 31, 2019 and 2018 and a discussion of items affecting the comparability of our
financial statements for those years. Please refer to the results of operations section described in
‘‘Item 7. Management’s Discussion and Analysis of Financial Condition and Results of Operations’’ set
forth in our Annual Report on Form 10-K for the year ended December 31, 2018, for our discussion
and analysis of our results for the years ended December 31, 2018 and 2017 and a discussion of items
affecting the comparability of our financial statements for those years.
• Liquidity, Capital Commitments and Resources. The liquidity, capital commitments and resources
section provides a discussion of our cash flows for the year ended December 31, 2019, and our
outstanding debt and commitments existing as of December 31, 2019.
• Market Risks and Security Analyses. We are principally exposed to market risk related to interest rates
and foreign currency exchange rates, which are described in the market risks and security analyses
section.
• Recently Issued Accounting Pronouncements. This section provides a discussion of recently issued
accounting pronouncements applicable to Six Flags, including a discussion of the impact or potential
impact of such standards on our financial statements when applicable.
The following discussion and analysis contains forward-looking statements relating to future events or our
future financial performance, which involve risks and uncertainties. Our actual results could differ materially
from those anticipated in these forward-looking statements. Please see the discussion regarding forward-looking
statements included under the caption ‘‘Cautionary Note Regarding Forward-Looking Statements’’ and
‘‘Item 1A. Risk Factors’’ for a discussion of some of the uncertainties, risks and assumptions associated with
these statements.
The following discussion and analysis presents information that we believe is relevant to an assessment and
understanding of our consolidated balance sheets and results of operations. This information should be read in
conjunction with the consolidated financial statements and the notes thereto included elsewhere in this Annual
Report.
Overview
We are the largest regional theme park operator in the world and the largest operator of waterparks in North
America based on the number of parks we operate. Of our 26 regional theme and waterparks, 23 are located in
the United States, two parks are located in Mexico and one is located in Montreal, Canada. Our parks are located
in geographically diverse markets across North America and generally offer a broad selection of state-of-the-art
and traditional thrill rides, water attractions, themed areas, concerts and shows, restaurants, game venues and
retail outlets, thereby providing a complete family-oriented entertainment experience. We work continuously to
improve our parks and our guests’ experiences and to meet our guests’ evolving needs and preferences.
Our revenue is derived from (i) the sale of tickets for entrance to our parks (which accounted for
approximately 55% of total revenue during the years ended December 31, 2019, 2018 and 2017), (ii) the sale of
food and beverages, merchandise, games and attractions, parking and other services inside our parks, and
(iii) sponsorship, international agreements and accommodations. Revenues from ticket sales and in-park sales are
33
primarily impacted by park attendance. Revenues from sponsorship, international agreements and
accommodations can be impacted by the term, timing and extent of services and fees under these arrangements,
which can result in fluctuations from year to year. During 2019, our earnings from park operations excluding the
impact of interest, taxes, depreciation, amortization and any other non-cash income or expenditures
(‘‘Park EBITDA’’) decreased primarily as a result of increased cash operating costs resulting from (i) expenses
related to the full year operation of the five new parks we began operating in June 2018 and our new waterpark
in Rockford, IL that we began operating in April 2019, (ii) increased labor costs driven by competitive labor
markets and statutory minimum wage increases, (iii) charges for litigation matters recorded in the fourth quarter
of 2019, and (iv) the write-off of costs related to the default of our partner in China. These expense increases
were partially offset by an increase in revenue primarily driven by the full year operation of the five new parks
we began operating in June 2018 and our new waterpark in Rockford, IL that we began operating in April 2019.
Our principal costs of operations include salaries and wages, employee benefits, advertising, third party
services, repairs and maintenance, utilities, rent and insurance. A large portion of our expenses is relatively fixed
as our costs for full-time employees, maintenance, utilities, rent, advertising and insurance do not vary
significantly with attendance.
Critical Accounting Policies
The preparation of financial statements in conformity with accounting principles generally accepted in the
United States (‘‘U.S. GAAP’’) requires management to make estimates and assumptions that affect the reported
amounts of assets and liabilities and the disclosure of contingent liabilities as of the date of the financial
statements and the reported amounts of revenues and expenses earned and incurred during the reporting period.
Critical accounting estimates are fundamental to the portrayal of both our financial condition and results of
operations and often require difficult, subjective and complex estimates and judgments. We evaluate our
estimates and assumptions on an ongoing basis using historical experience and other factors, including the
current economic environment, which we believe to be reasonable under the circumstances. We adjust such
estimates and assumptions when facts and circumstances dictate. As future events and their effects cannot be
determined with precision, actual results could differ significantly from these estimates. Changes in these
estimates resulting from the continuing changes in the economic environment will be reflected in the financial
statements in future periods. The following discussion addresses the items we have identified as our critical
accounting estimates and discusses our review of applicable accounting pronouncements that have been issued by
the Financial Accounting Standards Board (‘‘FASB’’). See Note 2 to the consolidated financial statements
included elsewhere in this Annual Report for further discussion of these and other accounting policies.
Valuation of Long-Lived Assets
Goodwill and intangible assets with indefinite useful lives are tested for impairment annually, or more
frequently if events or circumstances indicate that the assets may be impaired. We identify our reporting unit and
determine the carrying value of the reporting unit by assigning the assets and liabilities, including the existing
goodwill and intangible assets, to the reporting unit. We then determine the fair value of the reporting unit and
compare it to the carrying amount of the reporting unit. All of our parks are operated in a similar manner and
have comparable characteristics in that they produce and distribute similar services and products using similar
processes, have similar types of customers, are subject to similar regulations and exhibit similar economic
characteristics. As such, we are a single reporting unit. For each year, the fair value of the single reporting unit
exceeded our carrying amount (provided that we have one reporting unit at the same level for which Holdings’
common stock is traded, we believe our market capitalization is the best indicator of our reporting unit’s fair
value). In September 2012, the FASB amended Accounting Standards Update (‘‘ASU’’) Topic 350, Intangibles -
Goodwill and Other, which permits entities to perform a qualitative analysis on indefinite-lived intangible assets
to determine if it is more likely than not that the fair value of the intangible asset was less than its carrying
amount as a basis for determining whether it was necessary to perform a quantitative impairment test.
We adopted this amendment in September 2012 and have performed a qualitative analysis on our indefinite-lived
intangible assets during the fourth quarter of each year.
The fair value of indefinite-lived intangible assets is generally determined based on a discounted cash flow
analysis. An impairment loss occurs to the extent that the carrying value exceeds the fair value. For goodwill, if
the fair value of the reporting unit were to be less than the carrying amount, an impairment loss would be
recognized to the extent that the carrying amount of the reporting unit exceeds its fair value.
34
We review long-lived assets, including finite-lived intangible assets subject to amortization, for impairment
upon the occurrence of events or changes in circumstances that would indicate that the carrying value of an asset
or groups of assets may not be recoverable. Recoverability of assets to be held and used is measured by a
comparison of the carrying amount of an asset or group of assets to the future net cash flows expected to be
generated by the asset or group of assets. If such assets are not considered to be fully recoverable, any
impairment to be recognized is measured by the amount by which the carrying amount of the asset or group of
assets exceeds its respective fair value. Assets to be disposed of are reported at the lower of the carrying amount
or fair value less costs to sell.
Accounting for Income Taxes
As part of the process of preparing consolidated financial statements, we are required to estimate our
income taxes in each of the jurisdictions in which we operate. This process involves us estimating our actual
current tax exposure together with assessing temporary differences resulting from differing treatment of items,
such as depreciation periods for our property and equipment and recognition of our deferred revenue, for tax and
financial accounting purposes. These differences result in deferred tax assets and liabilities, which are included in
our consolidated balance sheets. We must then assess the likelihood that our deferred tax assets (primarily net
operating loss carryforwards) will be recovered by way of offset against taxable income. To the extent we believe
that recovery is not likely, we must establish a valuation allowance. To the extent we establish a valuation
allowance or increase or decrease this allowance in a period, we must reflect such amount as income tax expense
or benefit in the consolidated statements of operations.
A high degree of management judgment is required in determining our provision or benefit for income
taxes, our deferred tax assets and liabilities and any valuation allowance recorded against our net deferred tax
assets. Variables that will impact whether our deferred tax assets will be utilized prior to their expiration include,
among other things, attendance, spending per capita and other revenues, foreign taxable income, capital
expenditures, levels of debt, interest rates, operating expenses, sales of assets, and changes in state or federal tax
laws. In determining the valuation allowance, we do not consider, and under generally accepted accounting
principles cannot consider, the possible changes in state or federal tax laws until the laws change. To the extent
we reduce capital expenditures, our future accelerated tax deductions for our rides and equipment will be
reduced, and our interest expense deductions could correspondingly decrease as cash flows that previously would
have been utilized for capital expenditures could be utilized to lower our outstanding debt balances. Increases in
capital expenditures without corresponding increases in net revenues would reduce short-term taxable income and
increase the likelihood of additional valuation allowances being required as net operating loss carryforwards
could expire prior to their utilization. Conversely, increases in revenues in excess of operating expenses would
reduce the likelihood of additional valuation allowances being required as the short-term taxable income would
increase the utilization of net operating loss carryforwards prior to their expiration. We utilize deferred tax assets
related to foreign tax credit attributes through foreign-sourced income as well as the recapture of overall
domestic loss amounts re-characterized as domestic-source income. See Note 2 and Note 11 to the consolidated
financial statements included elsewhere in this Annual Report for further discussion.
Revenue Recognition
FASB Accounting Standards Codification (‘‘ASC’’) 606, Revenue from Contracts with Customers (together
with the series of Accounting Standards Updates described in the second paragraph under ‘‘Recently Adopted
Accounting Pronouncements’’ in Note 2 to the consolidated financial statements included elsewhere in this
Annual Report, ‘‘Topic 606’’) is based on the principle that revenue is recognized to depict the transfer of goods
or services to customers in an amount that reflects the consideration to which the entity expects to be entitled in
exchange for those goods or services. We recognize revenue upon admission into our parks, provision of our
services, or when products are delivered to our guests. Revenue is presented in the accompanying consolidated
statements of operations net of sales taxes collected from our guests that are remitted or payable to government
taxing authorities. For season passes, memberships in the initial twelve-month term and other multi-use
admissions, we estimate a redemption rate based on historical experience and other factors and assumptions we
believe to be customary and reasonable and recognize a pro-rata portion of the revenue as the guest attends our
parks. In contrast to our season pass and other multi-use offerings (such as our all season dining pass program,
which enables season pass holders and members to eat meals and snacks any day they visit the park for one
upfront payment) that expire at the end of each operating season, the membership program continues on a
35
month-to-month basis after the initial twelve-month membership term and can be canceled any time after the
initial term pursuant to the terms of the membership program. Guests enrolled in the membership program can
visit our parks an unlimited number of times anytime the parks are open as long as the guest remains enrolled in
the membership program. We review the estimated redemption rate regularly and on an ongoing basis and revise
it as necessary throughout the year. Amounts owed or received for multi-use admissions in excess of redemptions
are recognized in deferred revenue. For active memberships after the initial twelve-month term, we recognize
revenue monthly as payments are received.
We have entered into international agreements to assist third parties in the planning, design, development
and operation of Six Flags-branded parks outside of North America. These agreements typically consist of a
brand licensing agreement, project services agreement, and management services agreement. Under Topic 606,
we treat these agreements as one contract because they were negotiated with a single commercial objective.
We have identified three distinct promises within the agreement with each third-party partner as brand licensing,
project services and management services. Each of these promises is its own performance obligation and distinct
as the third party could benefit from each service on its own with other readily available resources and each
service is separately identifiable from other services in the context of the contract. We recognize revenue under
our international agreements over the relevant service period of each performance obligation based on its relative
stand-alone selling price, as determined by our best estimate of selling price. We review the service period of
each performance obligation on an ongoing basis and revise it as necessary throughout the year. Revisions to the
relevant service periods of the performance obligations may result in revisions to revenue in future periods and
are recognized in the period in which the change is identified. On January 1, 2018, we adopted Topic 606 using
the modified retrospective method applied to those contracts which were not completed as of January 1, 2018.
Results for reporting periods beginning after January 1, 2018 are presented under Topic 606, while prior period
amounts are not adjusted and continue to be reported in accordance with our historic accounting under
FASB ASC 605, Revenue Recognition (‘‘Topic 605’’). See Note 3 to the consolidated financial statements
included elsewhere in this Annual Report for additional information.
Recent Events
On April 17, 2019, we amended and restated the 2015 Credit Facility (as defined in Note 8 to the
consolidated financial statements included elsewhere in this Annual Report). The refinancing increased the
2015 Term Loan B (as defined in Note 8 to the consolidated financial statements included elsewhere in this
Annual Report) to $800.0 million and extended its term through April 17, 2026, and increased the
2015 Revolving Loan to $350.0 million and extended its term through April 17, 2024. See Note 8 to the
consolidated financial statements included elsewhere in this Annual Report for more information.
On June 30, 2019, we reached an agreement with our partner in Dubai to discontinue the previously
announced project to develop a Six Flags-branded theme park. In July, we received $7.5 million in connection
with the agreement and a settlement of all claims.
On October 18, 2019, we entered into an amendment to the Second Amended and Restated Credit Facility,
which reduced the overall borrowing rate on the Second Amended and Restated Term Loan B by 25 basis points
by reducing the applicable margin from LIBOR plus 2.00% to LIBOR plus 1.75%. Excluding the cost to execute
the transaction, the lower borrowing rate reduces interest expense by approximately $2.0 million annually.
On November 13, 2019, Lance Balk informed us of his intention to retire as Executive Vice President and
General Counsel on or after February 28, 2020. On November 15, 2019, Mr. Balk and the Company entered into
a Transition and Retirement Agreement to facilitate a smooth transition.
On November 18, 2019, James Reid-Anderson, the Company’s Chairman, President and Chief Executive
Officer, retired. Michael Spanos was appointed as President and Chief Executive Officer effective November 18,
2019, and was appointed as a member of Holdings’ Board of Directors effective October 24, 2019. Also effective
November 18, 2019, Richard Roedel became the Non-Executive Chairman of the Board of Directors of Holdings.
On January 10, 2020, we announced that our development of Six Flags-branded parks in China encountered
continued challenges. The Company’s partner in China, Riverside Investment Group (‘‘Riverside’’) faces severe
challenges due to the macroeconomic environment and the declining real estate market in China. This led
Riverside to default on its payment obligations to the Company, and the Company delivered formal notices of
default under its agreements with Riverside. Since that time, Riverside has been unable to cure these payment
36
defaults. As a result, on February 14, 2020, we terminated our agreements with them. It is therefore unlikely that
we will recognize any revenue or profit in 2020 related to the development of parks in China.
On January 31, 2020, we announced our entry into a Cooperation Agreement with H Partners Management,
LLC and certain of its affiliates regarding the membership and composition of Holdings’ Board of Directors and
related matters. Pursuant to the Cooperation Agreement, Holdings appointed Arik Ruchim to the Board of
Directors, and Mr. Ruchim was appointed to the Nominating and Corporate Governance Committee and the
Compensation Committee of Holdings’ Board of Directors effective January 30, 2020.
On January 31, 2020, we also announced that Usman Nabi resigned as a member of Holdings’ Board of
Directors effective January 30, 2020.
On February 20, 2020, we announced that Marshall Barber intends to retire as Executive Vice President and
Chief Financial Officer effective August 31, 2020. Mr. Barber will continue to serve as Executive Vice President
and Chief Financial Officer through February 24, 2020, and will remain with the Company until August 31,
2020, assisting with the transition of a new chief financial officer. Leonard Russ, Senior Vice President of
Strategic Planning and Analysis, will assume the role of interim chief financial officer effective February 24,
2020.
Results of Operations
The following table sets forth summary financial information for the years ended December 31, 2019 and
2018:
Year Ended Percentage
(Amounts in thousands, except per capita data) December 31, 2019 December 31, 2018 Change (%)
Total revenue . . . . . . . . . . . . . . . . . . . . . . . . . . . . . . . . . . . . . . . . . . . . $1,487,583 $1,463,707 2%
Operating expenses . . . . . . . . . . . . . . . . . . . . . . . . . . . . . . . . . . . . . . . 607,791 574,724 6%
Selling, general and administrative expenses . . . . . . . . . . . . . . . . . . . 199,194 132,168 51%
Costs of products sold . . . . . . . . . . . . . . . . . . . . . . . . . . . . . . . . . . . . . 130,304 121,803 7%
Other net periodic pension benefit . . . . . . . . . . . . . . . . . . . . . . . . . . . (4,186) (5,169) (19)%
Depreciation and amortization. . . . . . . . . . . . . . . . . . . . . . . . . . . . . . . 118,230 115,693 2%
Loss on disposal of assets . . . . . . . . . . . . . . . . . . . . . . . . . . . . . . . . . . 2,162 1,879 15%
Interest expense, net . . . . . . . . . . . . . . . . . . . . . . . . . . . . . . . . . . . . . . 113,302 107,243 6%
Loss on debt extinguishment. . . . . . . . . . . . . . . . . . . . . . . . . . . . . . . . 6,484 — N/M
Other expense, net . . . . . . . . . . . . . . . . . . . . . . . . . . . . . . . . . . . . . . . . 2,542 3,508 (28)%
Income before income taxes . . . . . . . . . . . . . . . . . . . . . . . . . . . . . . . . 311,760 411,858 (24)%
Income tax expense . . . . . . . . . . . . . . . . . . . . . . . . . . . . . . . . . . . . . . . 91,942 95,855 (4)%
Net income . . . . . . . . . . . . . . . . . . . . . . . . . . . . . . . . . . . . . . . . . . . . . . 219,818 316,003 (30)%
Less: Net income attributable to noncontrolling interests . . . . . . . . . (40,753) (40,007) 2%
Net income attributable to Six Flags Entertainment Corporation . . . $ 179,065 $ 275,996 (35)%
Other Data:
Attendance . . . . . . . . . . . . . . . . . . . . . . . . . . . . . . . . . . . . . . . . . . . . 32,811 32,024 2%
Total revenue per capita . . . . . . . . . . . . . . . . . . . . . . . . . . . . . . . . . $ 45.34 $ 45.71 (1)%
Year Ended December 31, 2019 vs. Year Ended December 31, 2018
Revenue
Revenue for the year ended December 31, 2019, totaled $1,487.6 million, a 2% increase compared to
$1,463.7 million for the year ended December 31, 2018. The increase in revenue was driven by a 2% increase in
attendance, primarily attributable to the full year of operation of our five new parks acquired in June 2018 and
Magic Waters waterpark in Rockford, Illinois, which we began operating in April 2019. The growth in revenue
attributable to the increase in attendance was partially offset by a 3% decrease in sponsorship, international
agreements and accommodations revenue and a decrease of $0.21, or less than 1%, in guest spending per capita.
37
Admissions revenue per capita decreased $0.44, or 2%, during the year ended December 31, 2019,
compared to the year ended December 31, 2018. The decrease in admissions revenue per capita was primarily
driven by (i) the majority of our attendance growth being driven by our new parks, which have significantly
lower admissions revenue per capita compared to our legacy parks, and (ii) targeted promotions to drive
membership penetration. Non-admissions revenue per capita increased $0.23, or 1%, during the year ended
December 31, 2019, compared to the year ended December 31, 2018, primarily as a result of the continued
success in selling our all season dining and flash pass products partially offset by the lower in-park spending at
our new parks.
Operating expenses
Operating expenses for the year ended December 31, 2019, increased $33.1 million, or 6%, compared to the
year ended December 31, 2018, primarily as a result of (i) incremental operating costs in the first five months of
2019, including lease expense, to operate and rebrand our five new domestic parks we began operating in
June 2018; (ii) increased costs from statutory minimum wage rate increases and competitive market rate
increases at many of our parks; (iii) incremental costs to lease and operate Magic Waters, a waterpark in
Rockford, Illinois that we began operating in April 2019; and (iv) an increase in expenses related to charges for
litigation matters recorded in the fourth quarter of 2019.
Selling, general and administrative expenses
Selling, general and administrative expenses for the year ended December 31, 2019, increased $67.0 million,
or 51%, compared to the year ended December 31, 2018, primarily as a result of the reversal of all stock-based
compensation related to the 2017 Performance Award (as defined in Note 8 to the consolidated financial
statements included elsewhere in this Annual Report) during the year ended December 31, 2018, as late
achievement of the 2017 Performance Award did not occur, and charges related to the default of our partner in
China in 2019.
Cost of products sold
Cost of products sold for the year ended December 31, 2019, increased $8.5 million, or 7%, compared to
the year ended December 31, 2018, primarily as a result of increased food and merchandise sales driven by the
continued growth of our all season dining pass program and operations at our new properties. Cost of products
sold as a percentage of non-admissions revenue for the year ended December 31, 2019, increased slightly as
compared to the year ended December 31, 2018, primarily due to the significant portion of our revenue growth
being driven by our new parks that currently have lower gross margins.
Depreciation and amortization expense
Depreciation and amortization expense for the year ended December 31, 2019, increased $2.5 million, or
2%, compared to the year ended December 31, 2018. The increase in depreciation and amortization expense is
primarily the result of new asset additions related to our ongoing capital investments, partially offset by asset
retirements.
Loss on disposal of assets
Loss on disposal of assets increased by $0.3 million, or 15%, for the year ended December 31, 2019,
compared to the year ended December 31, 2018, primarily as a result of increased asset disposals in conjunction
with the execution of our ongoing capital program during the current year relative to the prior year.
Interest expense, net
Interest expense, net increased $6.1 million, or 6%, for the year ended December 31, 2019, compared to the
year ended December 31, 2018, primarily as a result of incremental borrowings under the Second Amended and
Restated Credit Facility, partially offset by lower interest rates.
Loss on debt extinguishment
In conjunction with the amendments to the Second Amended and Restated Credit Facility entered into in
April 2019 and October 2019, we recognized a loss on debt extinguishment of $6.2 million and $0.3 million,
respectively. See Note 8 to the consolidated financial statements included elsewhere in this Annual Report for
further discussion.
38
Income tax expense
Income tax expense was $91.9 million for the year ended December 31, 2019, compared to $95.9 million
for the year ended December 31, 2018. Income taxes decreased primarily due to lower earnings before taxes for
the year ended in December 31, 2019 compared to the year ended December 31, 2018 partially offset by the
recognition of a valuation allowance against foreign tax credit carryforwards that we estimate will expire
unutilized due to changes in estimated future foreign source income related to the termination of our agreements
with our partner in China.
See Note 11 to the consolidated financial statements included elsewhere in this Annual Report for further
discussion.
Liquidity, Capital Commitments and Resources
General
Our principal sources of liquidity are cash generated from operations, funds from borrowings and existing
cash on hand. Our principal uses of cash include the funding of working capital obligations, debt service,
investments in parks (including capital projects), common stock dividends, payments to our partners in the
Partnership Parks and common stock repurchases.
During the years ended December 31, 2019, 2018 and 2017, Holdings paid $279.0 million, $267.0 million
and $227.1 million, respectively, in cash dividends on its common stock. One of our fundamental business goals
is to generate superior total stockholder returns over the long term. As part of our strategy to achieve this goal,
we have declared and paid quarterly cash dividends each quarter beginning with the fourth quarter of 2010.
On November 18, 2019, Holdings’ Board of Directors declared a quarterly cash dividend of $0.83 payable
December 9, 2019 to stockholders of record as of November 29, 2019. The amount and timing of any future
dividends payable on Holdings’ common stock are within the sole discretion of Holdings’ Board of Directors.
Based on (i) our current number of shares outstanding and (ii) estimates of share repurchases, restricted stock
vesting and option exercises, we currently anticipate paying approximately $85 million in total cash dividends on
Holdings’ common stock during the 2020 calendar year.
On March 30, 2017, Holdings announced that its Board of Directors approved a new stock repurchase plan
that permits Holdings to repurchase an incremental $500 million in shares of Holdings’ common stock
(the ‘‘March 2017 Stock Repurchase Plan’’). As of February 18, 2020, Holdings had repurchased
4,604,000 shares at a cumulative cost of approximately $268.3 million and an average price per share of $58.27
under the March 2017 Stock Repurchase Plan, leaving approximately $231.7 million available for permitted
repurchases.
The repurchase of common stock and the payment of cash dividends are reflected in our consolidated
financial statements as a reduction of stockholders’ equity.
On June 16, 2016, Holdings issued the 2024 Notes. We used $150.0 million of the proceeds from the
issuance of the 2024 Notes to reduce our borrowings under the 2015 Term Loan B. The remaining net proceeds
were used for general corporate and working capital purposes, which primarily included repurchases of our
common stock.
On April 13, 2017, we issued the 2024 Notes Add-on and the 2027 Notes. A portion of the net proceeds
from the issuance of these notes was used to redeem all of the outstanding 2021 Notes (as defined in Note 8 to
the consolidated financial statements included elsewhere in this Annual Report) and to satisfy and discharge the
indenture governing the 2021 Notes, including to pay accrued and unpaid interest to the redemption date and the
related redemption premium on the 2021 Notes, and to pay related fees and expenses.
On March 26, 2018, we entered into an amendment to the 2015 Credit Facility that reduced the overall
borrowing rate on the 2015 Term Loan B by 25 basis points through a reduction in the applicable margin from
LIBOR plus 2.00% to LIBOR plus 1.75%. We capitalized $0.5 million of debt issuance costs directly associated
with the issuance of this amendment.
On April 18, 2018, we entered into an amendment to the 2015 Credit Facility that increased our 2015 Term
Loan B borrowings by $39.0 million. We capitalized $0.3 million of debt issuance costs directly associated with
the issuance of this amendment. The proceeds of the additional borrowings were used for general corporate
purposes, including repurchases of our common stock.
39
On April 17, 2019, we amended and restated the 2015 Credit Facility (as previously amended). The Second
Amended and Restated Credit Facility is comprised of a $350.0 million revolving credit loan facility and an
$800.0 million Tranche B term loan facility. In connection with entering into the Second Amended and Restated
Credit Facility, we repaid the amounts outstanding on the 2015 Revolving Loan and the outstanding 2015 Term
Loan B and we recognized a loss on debt extinguishment of $6.2 million. The remaining proceeds from the
Second Amended and Restated Credit Facility will be used for general corporate purposes, including payment of
refinancing fees. We capitalized $8.9 million of debt issuance costs directly associated with the issuance of the
Second Amended and Restated Credit Facility.
On October 18, 2019, we entered into an amendment to the Second Amended and Restated Credit Facility,
which reduced the overall borrowing rate on the Second Amended and Restated Term Loan B by 25 basis points
by reducing the applicable margin from LIBOR plus 2.00% to LIBOR plus 1.75%. Excluding the cost to execute
the transaction, the lower borrowing rate reduces interest expense by approximately $2.0 million annually.
Based on historical and anticipated operating results, we believe cash flows from operations, available cash
and amounts available under the Second Amended and Restated Credit Facility will be adequate to meet our
liquidity needs, including any anticipated requirements for working capital, capital expenditures, common stock
dividends, scheduled debt service, obligations under arrangements relating to the Partnership Parks and
discretionary common stock repurchases. Additionally, we expect to be able to use our current federal net
operating loss carryforwards to reduce our federal income tax liability until 2024. For the years 2019 through
2024, we have significant federal net operating loss carryforwards subject to an annual limitation that we expect
will offset approximately $32.5 million of taxable income per year.
Our current and future liquidity is greatly dependent upon our operating results, which are driven largely by
overall economic conditions as well as the price and perceived quality of the entertainment experience at our
parks. Our liquidity could also be adversely affected by a disruption in the availability of credit as well as
unfavorable weather; natural disasters; contagious diseases, such as Ebola, Zika, swine flu or coronavirus;
accidents or the occurrence of an event or condition at our parks, including terrorist acts or threats inside or
outside of our parks; negative publicity; or significant local competitive events, which could significantly reduce
paid attendance and revenue related to that attendance at any of our parks. While we work with local police
authorities on security-related precautions to prevent certain types of disturbances, we can make no assurance
that these precautions will be able to prevent these types of occurrences. However, we believe our ownership of
many parks in different geographic locations reduces the effects of adverse weather and these other types of
occurrences on our consolidated results. If such an adverse event were to occur, we may be unable to borrow
under the Second Amended and Restated Revolving Loan or may be required to repay amounts outstanding
under the Second Amended and Restated Credit Facility and/or may need to seek additional financing.
In addition, we expect we may be required to refinance all or a significant portion of our existing debt on or
prior to maturity, requiring us to potentially seek additional financing. The degree to which we are leveraged
could adversely affect our ability to obtain any additional financing. See ‘‘Cautionary Note Regarding
Forward-Looking Statements’’ and ‘‘Item 1A. Risk Factors’’ included elsewhere in this Annual Report.
As of December 31, 2019, our total indebtedness, net of discount and deferred financing costs, was
$2,274.9 million which included $498.1 million of the 2024 Notes, $990.6 million of the 2027 Notes, and
$786.2 million outstanding under the Second Amended and Restated Credit Facility. Based on (i) non-revolving
credit debt outstanding on that date, (ii) anticipated levels of working capital revolving borrowings during
2020 and 2021, (iii) estimated interest rates for floating-rate debt and (iv) the 2024 Notes and the 2027 Notes,
we anticipate annual cash interest payments of approximately $105 million during both 2020 and 2021. Under
the Second Amended and Restated Credit Facility, all remaining outstanding principal of the Second Amended
and Restated Term Loan B is due and payable on April 17, 2026.
As of December 31, 2019, we had approximately $174.2 million unrestricted cash and $329.2 million
available for borrowing under the Second Amended and Restated Revolving Loan. Our ability to borrow under
the Second Amended and Restated Revolving Loan is dependent upon compliance with certain conditions,
including a maximum senior secured net leverage maintenance covenant and the absence of any material adverse
change in our business or financial condition. If we were to become unable to borrow under the Second
Amended and Restated Revolving Loan, and we failed to meet our projected results from operations
significantly, we might be unable to pay in full our off-season obligations. A default under the Second Amended
and Restated Revolving Loan could permit the lenders under the Second Amended and Restated Credit Facility
40
to accelerate the obligations thereunder. The Second Amended and Restated Revolving Loan expires on April 17,
2024. The terms and availability of the Second Amended and Restated Credit Facility and other indebtedness are
not affected by changes in the ratings issued by rating agencies in respect of our indebtedness. For a more
detailed description of our indebtedness, see Note 8 to the consolidated financial statements included elsewhere
in this Annual Report.
We plan to strategically reinvest in our properties to improve the guest experience. For more information
about our planned capital expenditures, please see ‘‘Capital Improvements and Other Initiatives’’ under
Item 1. Business.
During the year ended December 31, 2019, net cash provided by operating activities decreased by
$2.5 million to $410.6 million from $413.1 million in 2018. The decrease is attributable to a decrease in working
capital. Net cash used in investing activities during the year ended December 31, 2019 decreased $13.0 million
to $139.1 million from $152.1 million, consisting primarily of capital expenditures, net of insurance proceeds,
and partially offset by proceeds received from the disposal of assets. Net cash used in financing activities during
the year ended December 31, 2019 decreased $150.5 million to $143.0 million from $293.5 million, primarily
attributable to the payment of cash dividends, distributions to our noncontrolling interests and the payment of
debt issuance costs in connection with the repayment of the 2015 Credit Facility and our entry into the Second
Amended and Restated Credit Facility on April 17, 2019. These uses of cash were partially offset by proceeds
from the exercise of stock options and borrowings under the Second Amended and Restated Term Loan B.
Since our business is both seasonal in nature and involves significant levels of cash transactions, our net
operating cash flows are largely driven by attendance and spending per capita levels because most of our
cash-based expenses are relatively fixed and do not vary significantly with either attendance or spending per
capita. These cash-based operating expenses include salaries and wages, employee benefits, advertising, third
party services, repairs and maintenance, utilities and insurance.
Partnership Park Obligations
We guarantee certain obligations relating to the Partnership Parks. These obligations include (i) minimum
annual distributions (including rent) of approximately $74.2 million in 2020 (subject to cost of living adjustments
in subsequent years) to the limited partners in the Partnerships Parks (based on our ownership of units as of
December 31, 2019, our share of the distribution will be approximately $32.5 million), (ii) minimum capital
expenditures at each of the Partnership Parks during rolling five-year periods, based generally on 6% of the
Partnership Park’s revenues, (iii) an annual offer to purchase all outstanding limited partnership units at the
Specified Price to the extent tendered by the unit holders, which annual offer must remain open from March 31
through late April of each year, and any limited partnership interest tendered during such time period must be
fully paid for no later than May 15th of that year, (iv) making annual ground lease payments, and (v) either
(a) purchasing all of the outstanding limited partnership interests in the Partnership Parks through the exercise of
a call option upon the earlier of the occurrence of certain specified events and the end of the term of the
partnerships that hold the Partnership Parks in 2027 (in the case of Georgia) and 2028 (in the case of Texas), or
(b) causing each of the partnerships that hold the Partnership Parks to have no indebtedness and to meet certain
other financial tests as of the end of the term of such partnership. See Note 15 to the consolidated financial
statements included elsewhere in this Annual Report for additional information.
After payment of the minimum distribution, we are entitled to a management fee equal to 3% of prior year
gross revenues and, thereafter, any additional cash will be distributed first to management fee in arrears and then
towards the repayment of any interest and principal on intercompany loans. Any additional cash, to the extent
available, is distributed 95% to us, in the case of SFOG, and 92.5% to us, in the case of SFOT.
Off-Balance Sheet Arrangements
We had no off-balance sheet arrangements as of December 31, 2019.
41
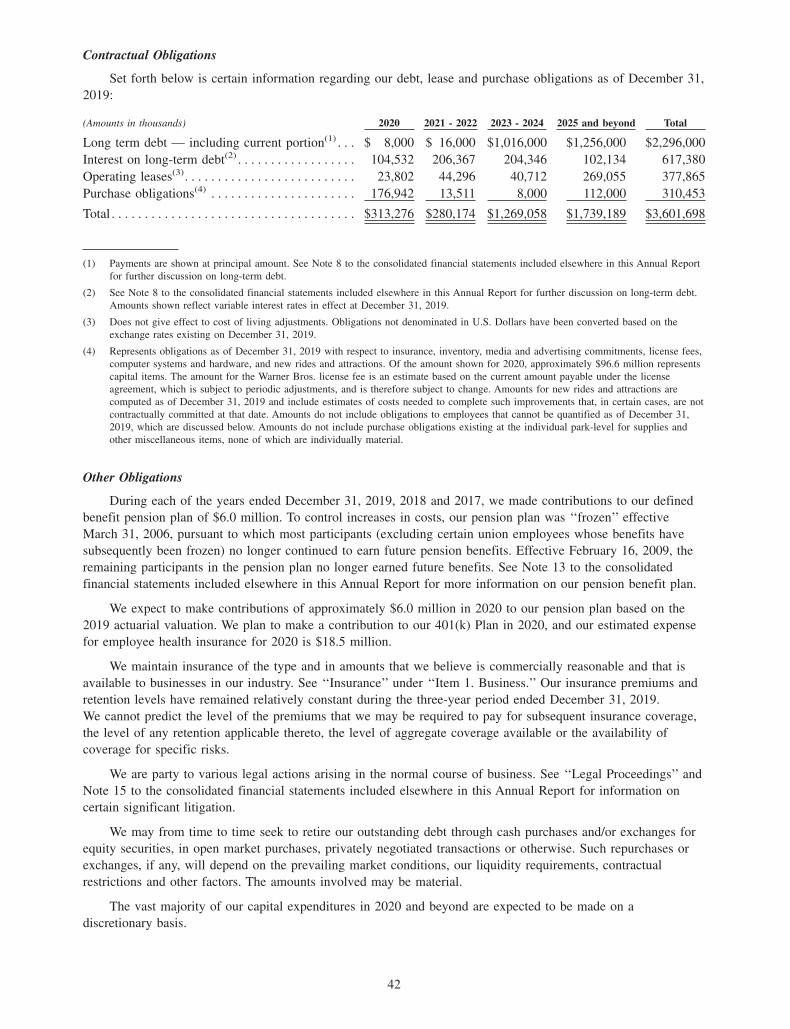
Contractual Obligations
Set forth below is certain information regarding our debt, lease and purchase obligations as of December 31,
2019:
(Amounts in thousands) 2020 2021 - 2022 2023 - 2024 2025 and beyond Total
Long term debt — including current portion(1) . . . $ 8,000 $ 16,000 $1,016,000 $1,256,000 $2,296,000
Interest on long-term debt(2) . . . . . . . . . . . . . . . . . . 104,532 206,367 204,346 102,134 617,380
Operating leases(3). . . . . . . . . . . . . . . . . . . . . . . . . . 23,802 44,296 40,712 269,055 377,865
Purchase obligations(4) . . . . . . . . . . . . . . . . . . . . . . 176,942 13,511 8,000 112,000 310,453
Total . . . . . . . . . . . . . . . . . . . . . . . . . . . . . . . . . . . . . $313,276 $280,174 $1,269,058 $1,739,189 $3,601,698
(1) Payments are shown at principal amount. See Note 8 to the consolidated financial statements included elsewhere in this Annual Report
for further discussion on long-term debt.
(2) See Note 8 to the consolidated financial statements included elsewhere in this Annual Report for further discussion on long-term debt.
Amounts shown reflect variable interest rates in effect at December 31, 2019.
(3) Does not give effect to cost of living adjustments. Obligations not denominated in U.S. Dollars have been converted based on the
exchange rates existing on December 31, 2019.
(4) Represents obligations as of December 31, 2019 with respect to insurance, inventory, media and advertising commitments, license fees,
computer systems and hardware, and new rides and attractions. Of the amount shown for 2020, approximately $96.6 million represents
capital items. The amount for the Warner Bros. license fee is an estimate based on the current amount payable under the license
agreement, which is subject to periodic adjustments, and is therefore subject to change. Amounts for new rides and attractions are
computed as of December 31, 2019 and include estimates of costs needed to complete such improvements that, in certain cases, are not
contractually committed at that date. Amounts do not include obligations to employees that cannot be quantified as of December 31,
2019, which are discussed below. Amounts do not include purchase obligations existing at the individual park-level for supplies and
other miscellaneous items, none of which are individually material.
Other Obligations
During each of the years ended December 31, 2019, 2018 and 2017, we made contributions to our defined
benefit pension plan of $6.0 million. To control increases in costs, our pension plan was ‘‘frozen’’ effective
March 31, 2006, pursuant to which most participants (excluding certain union employees whose benefits have
subsequently been frozen) no longer continued to earn future pension benefits. Effective February 16, 2009, the
remaining participants in the pension plan no longer earned future benefits. See Note 13 to the consolidated
financial statements included elsewhere in this Annual Report for more information on our pension benefit plan.
We expect to make contributions of approximately $6.0 million in 2020 to our pension plan based on the
2019 actuarial valuation. We plan to make a contribution to our 401(k) Plan in 2020, and our estimated expense
for employee health insurance for 2020 is $18.5 million.
We maintain insurance of the type and in amounts that we believe is commercially reasonable and that is
available to businesses in our industry. See ‘‘Insurance’’ under ‘‘Item 1. Business.’’ Our insurance premiums and
retention levels have remained relatively constant during the three-year period ended December 31, 2019.
We cannot predict the level of the premiums that we may be required to pay for subsequent insurance coverage,
the level of any retention applicable thereto, the level of aggregate coverage available or the availability of
coverage for specific risks.
We are party to various legal actions arising in the normal course of business. See ‘‘Legal Proceedings’’ and
Note 15 to the consolidated financial statements included elsewhere in this Annual Report for information on
certain significant litigation.
We may from time to time seek to retire our outstanding debt through cash purchases and/or exchanges for
equity securities, in open market purchases, privately negotiated transactions or otherwise. Such repurchases or
exchanges, if any, will depend on the prevailing market conditions, our liquidity requirements, contractual
restrictions and other factors. The amounts involved may be material.
The vast majority of our capital expenditures in 2020 and beyond are expected to be made on a
discretionary basis.
42
Recently Issued Accounting Pronouncements
In June 2016, FASB issued Accounting Standards Update 2016-13, Measurement of Credit Losses on
Financial Instruments, (‘‘Topic 326’’). The standard requires the immediate recognition of estimated credit losses
expected to occur over the life of financial assets rather than the current incurred loss impairment model that
recognizes losses when a probably threshold is met. Topic 326 is effective for annual periods beginning after
December 15, 2019 and interim periods within those fiscal years. We do not expect the adoption of Topic 326 to
have a material impact on our consolidated balance sheets, statements of operations and financial disclosures.
In December 2019, FASB issued ASU 2019-12, Income Taxes (Topic 740): Simplifying the Accounting for
Income Taxes (‘‘Update 2019-12’’), which removes certain exceptions for investments, intraperiod allocations and
interim tax calculations and adds guidance to reduce complexity in accounting for income taxes. Update 2019-12
is effective for annual periods beginning after December 15, 2020, with early adoption permitted. The various
amendments in Update 2019-12 are applied on a retrospective basis, modified retrospective basis and prospective
basis, depending on the amendment. We are in the process of evaluating the impact of this amendment on our
consolidated financial statements.
In August 2018, FASB issued ASU 2018-14, Compensation – Retirement Benefits – Defined Benefit Plans –
General (Subtopic 715-20): Disclosure Framework – Changes to the Disclosure Requirements for Defined
Benefit Plans (‘‘Update 2018-14’’), which modifies the disclosure requirements for employers that sponsor
defined benefit pension or other post-retirement plans. Update 2018-14 is effective for annual periods beginning
after January 1, 2021, with early adoption permitted. Adoption is required to be applied on a retrospective basis
to all periods presented. We are in the process of evaluating the impact of this amendment on our consolidated
financial statements.
ITEM 7A. QUANTITATIVE AND QUALITATIVE DISCLOSURES ABOUT MARKET RISK
We are exposed to market risks relating to fluctuations in interest rates and currency exchange rates.
The objective of our financial risk management is to minimize the negative impact of interest rate and foreign
currency exchange rate fluctuations on our operations, cash flows and equity. We do not acquire market risk
sensitive instruments for trading purposes.
In June 2019, we entered into three separate interest rate swap agreements with a notional amount of
$300.0 million (the ‘‘June 2019 Swap Agreements’’). In August 2019, we entered into two separate interest rate
swap agreements with a notional amount of $400.0 million (the ‘‘August 2019 Swap Agreements’’). These swaps
were entered into to mitigate the risk of an increase in the LIBOR interest rate on the Second Amended and
Restated Term Loan B. The term of the June 2019 Swap Agreements begins in June 2019 and expires in
June 2023. The term of the August 2019 Swap Agreements begins in August 2019 and expires in August 2024.
Upon execution, we designated and documented both swap agreements as cash flow hedges. The swap
agreements serve as economic hedges and provide protection against rising interest rates.
The following is an analysis of the sensitivity of the market value, operations and cash flows of our market
risk financial instruments to hypothetical changes in interest rates as if these changes occurred as of
December 31, 2019. The range of potential change in the market chosen for this analysis reflects our view of
changes that are reasonably possible over a one-year period. Market values are the present values of projected
future cash flows based on the interest rate assumptions. These forward-looking disclosures are selective in
nature and only address the potential impacts from financial instruments. They do not include other potential
effects which could impact our business as a result of these changes in interest and foreign currency exchange
rates.
As of December 31, 2019, we had total debt excluding the impact of debt issuance costs and discounts of
$2,296.0 million, of which $2,200.0 million represents fixed-rate debt. The remaining $96.0 million balance
represents floating-rate debt. For fixed-rate debt, interest rate changes affect the fair market value but do not
impact book value, operations or cash flows. Conversely, for floating-rate debt, interest rate changes generally do
not affect the fair market value but do impact future operations and cash flows, assuming other factors remain
constant.
43

Assuming other variables remain constant (such as foreign exchange rates and debt levels), the pre-tax
operating and cash flow impact resulting from a one percentage point increase in interest rates would be
approximately $1.0 million. See Note 8 to the consolidated financial statements included elsewhere in this
Annual Report for information on interest rates under our debt agreements.
44
ITEM 8. FINANCIAL STATEMENTS AND SUPPLEMENTARY DATA
SIX FLAGS ENTERTAINMENT CORPORATIONIndex to Consolidated Financial Statements
Management’s Report on Internal Control Over Financial Reporting . . . . . . . . . . . . . . . . . . . . . . . . . . . . . . . . . 46
Report of Independent Registered Public Accounting Firm . . . . . . . . . . . . . . . . . . . . . . . . . . . . . . . . . . . . . . . . . 47
Consolidated Balance Sheets as of December 31, 2019 and 2018. . . . . . . . . . . . . . . . . . . . . . . . . . . . . . . . . . . . 49
Consolidated Statements of Operations for the Years Ended December 31, 2019, 2018 and 2017 . . . . . . . . . . 50
Consolidated Statements of Comprehensive Income for the Years Ended December 31, 2019, 2018
and 2017 . . . . . . . . . . . . . . . . . . . . . . . . . . . . . . . . . . . . . . . . . . . . . . . . . . . . . . . . . . . . . . . . . . . . . . . . . . . . . . . 51
Consolidated Statements of Equity (Deficit) for the Years Ended December 31, 2019, 2018 and 2017 . . . . . . 52
Consolidated Statements of Cash Flows for the Years Ended December 31, 2019, 2018 and 2017 . . . . . . . . . 53
Notes to Consolidated Financial Statements . . . . . . . . . . . . . . . . . . . . . . . . . . . . . . . . . . . . . . . . . . . . . . . . . . . . . 54
45
Management’s Report on Internal Control Over Financial Reporting
Our management is responsible for establishing and maintaining adequate internal control over financial
reporting, as such term is defined in Exchange Act Rule 13a-15(f). Under the supervision and with the
participation of our management, including our Chief Executive Officer and Chief Financial Officer, we
conducted an evaluation of the effectiveness of our internal control over financial reporting based on the
framework in Internal Control—Integrated Framework (2013) issued by the Committee of Sponsoring
Organizations of the Treadway Commission. Based on our evaluation under the framework in Internal
Control—Integrated Framework (2013), our management concluded that our internal control over financial
reporting was effective as of December 31, 2019.
The effectiveness of our internal control over financial reporting as of December 31, 2019 has been audited
by KPMG LLP, the independent registered public accounting firm that audited our financial statements included
herein, as stated in their report which is included herein.
/s/ MICHAEL SPANOS
Michael Spanos
President and Chief Executive Officer
/s/ MARSHALL BARBER
Marshall Barber
Executive Vice President and Chief Financial Officer
February 20, 2020
46
Report of Independent Registered Public Accounting Firm
To the Stockholders and Board of Directors
Six Flags Entertainment Corporation:
Opinions on the Consolidated Financial Statements and Internal Control Over Financial Reporting
We have audited the accompanying consolidated balance sheets of Six Flags Entertainment Corporation andsubsidiaries (the Company) as of December 31, 2019 and 2018, the related consolidated statements of operations,comprehensive income, equity (deficit), and cash flows for each of the years in the three-year period endedDecember 31, 2019, and the related notes (collectively, the consolidated financial statements). We also haveaudited the Company’s internal control over financial reporting as of December 31, 2019, based on criteriaestablished in Internal Control – Integrated Framework (2013) issued by the Committee of SponsoringOrganizations of the Treadway Commission.
In our opinion, the consolidated financial statements referred to above present fairly, in all material respects,the financial position of the Company as of December 31, 2019 and 2018, and the results of its operations andits cash flows for each of the years in the three-year period ended December 31, 2019, in conformity with U.S.generally accepted accounting principles. Also in our opinion, the Company maintained, in all material respects,effective internal control over financial reporting as of December 31, 2019, based on criteria established inInternal Control – Integrated Framework (2013) issued by the Committee of Sponsoring Organizations of theTreadway Commission.
Change in Accounting Principle
As discussed in Notes 2 and 16 to the consolidated financial statements, the Company changed its method ofaccounting for leases on January 1, 2019, due to the adoption of Financial Accounting Standards Board (FASB)Accounting Standards Codification (ASC) Topic 842, Leases. As discussed in Notes 2 and 3 to the consolidatedfinancial statements, the Company changed its method of accounting for revenue recognition on January 1, 2018,due to the adoption of FASB ASC Topic 606, Revenue from Contracts with Customers.
Basis for Opinions
The Company’s management is responsible for these consolidated financial statements, for maintaining effectiveinternal control over financial reporting, and for its assessment of the effectiveness of internal control overfinancial reporting, included in the accompanying Management’s Report on Internal Control Over FinancialReporting. Our responsibility is to express an opinion on the Company’s consolidated financial statements and anopinion on the Company’s internal control over financial reporting based on our audits. We are a publicaccounting firm registered with the Public Company Accounting Oversight Board (United States) (PCAOB) andare required to be independent with respect to the Company in accordance with the U.S. federal securities lawsand the applicable rules and regulations of the Securities and Exchange Commission and the PCAOB.
We conducted our audits in accordance with the standards of the PCAOB. Those standards require that we planand perform the audits to obtain reasonable assurance about whether the consolidated financial statements arefree of material misstatement, whether due to error or fraud, and whether effective internal control over financialreporting was maintained in all material respects.
Our audits of the consolidated financial statements included performing procedures to assess the risks of materialmisstatement of the consolidated financial statements, whether due to error or fraud, and performing proceduresthat respond to those risks. Such procedures included examining, on a test basis, evidence regarding the amountsand disclosures in the consolidated financial statements. Our audits also included evaluating the accountingprinciples used and significant estimates made by management, as well as evaluating the overall presentation ofthe consolidated financial statements. Our audit of internal control over financial reporting included obtaining anunderstanding of internal control over financial reporting, assessing the risk that a material weakness exists, andtesting and evaluating the design and operating effectiveness of internal control based on the assessed risk.Our audits also included performing such other procedures as we considered necessary in the circumstances.We believe that our audits provide a reasonable basis for our opinions.
Definition and Limitations of Internal Control Over Financial Reporting
A company’s internal control over financial reporting is a process designed to provide reasonable assuranceregarding the reliability of financial reporting and the preparation of financial statements for external purposes inaccordance with generally accepted accounting principles. A company’s internal control over financial reportingincludes those policies and procedures that (1) pertain to the maintenance of records that, in reasonable detail,
47
accurately and fairly reflect the transactions and dispositions of the assets of the company; (2) provide reasonableassurance that transactions are recorded as necessary to permit preparation of financial statements in accordancewith generally accepted accounting principles, and that receipts and expenditures of the company are being madeonly in accordance with authorizations of management and directors of the company; and (3) provide reasonableassurance regarding prevention or timely detection of unauthorized acquisition, use, or disposition of thecompany’s assets that could have a material effect on the financial statements.
Because of its inherent limitations, internal control over financial reporting may not prevent or detectmisstatements. Also, projections of any evaluation of effectiveness to future periods are subject to the risk thatcontrols may become inadequate because of changes in conditions, or that the degree of compliance with thepolicies or procedures may deteriorate.
Critical Audit Matters
The critical audit matter communicated below is a matter arising from the current period audit of theconsolidated financial statements that was communicated or required to be communicated to the audit committeeand that: (1) relates to accounts or disclosures that are material to the consolidated financial statements and(2) involved our especially challenging, subjective, or complex judgment. The communication of a critical auditmatter does not alter in any way our opinion on the consolidated financial statements, taken as a whole, and weare not, by communicating the critical audit matter below, providing a separate opinion on the critical auditmatter or on the accounts or disclosures to which it relates.
Evaluation of the realizability of the deferred tax asset associated with foreign tax credits
As discussed in note 11 to the consolidated financial statements, the Company has foreign tax credits which canbe used to offset future U.S. tax liabilities, subject to certain annual limitations and a ten-year carryforwardperiod. As of December 31, 2019, the Company had $20.5 million of foreign tax credits, which are recorded as adeferred tax asset. The use of these foreign tax credits is dependent upon the Company’s ability to generatesufficient taxable foreign sourced income in the future, primarily in its international agreements. To the extentthat there is a more than a 50 percent likelihood that some or all the foreign tax credit carryforwards cannot beused before they expire, a valuation allowance is recorded to reduce the deferred tax asset to the amount whichis expected to be realized. The Company evaluates the realizability of the foreign tax credit carryforwards byforecasting taxable foreign sourced income for each year in the carryforward period. Foreign tax credits of$20.5 million will expire between 2020 and 2027. The Company determined that there is a more than a50 percent likelihood that some of these foreign tax credits will not be used before they expire, and accordinglya valuation allowance of $17.1 million has been recorded related to these credits.
We identified the evaluation of the realizability of the deferred tax asset associated with the Company’s foreigntax credit as a critical audit matter. Evaluating the Company’s determination that there was a more than a50 percent likelihood that the foreign tax credits will be used prior to their expiration required a high degree ofsubjective audit judgement given the near term expiration of a considerable number of foreign tax credits and thesensitivity to certain changes in forecasted international license income. In addition, there was a high degree ofcomplexity in the application of the relevant tax regulations to the Company’s forecasted taxable foreign sourcedincome.
The primary procedures we performed to address this critical audit matter included the following. We testedcertain internal controls over the Company’s deferred tax asset valuation allowance process, including controlsrelated to developing the forecasted international license income and applying the relevant tax regulations indetermining the forecasted taxable foreign sourced income. We analyzed certain forecasted international licenseincome by performing sensitivity analyses to assess the impact on the Company’s determination that there was amore than a 50 percent likelihood that some of the foreign tax credits will not be used before they expire.To assess the Company’s ability to forecast, we compared the Company’s previous international license incomeforecasts to actual results. In addition, we involved income tax professionals with specialized skills andknowledge who assisted in assessing the Company’s application of the relevant tax regulations to the forecastedtaxable foreign sourced income.
KPMG LLP
We have served as the Company’s auditor since 1993.
Dallas, Texas
February 20, 2020
48
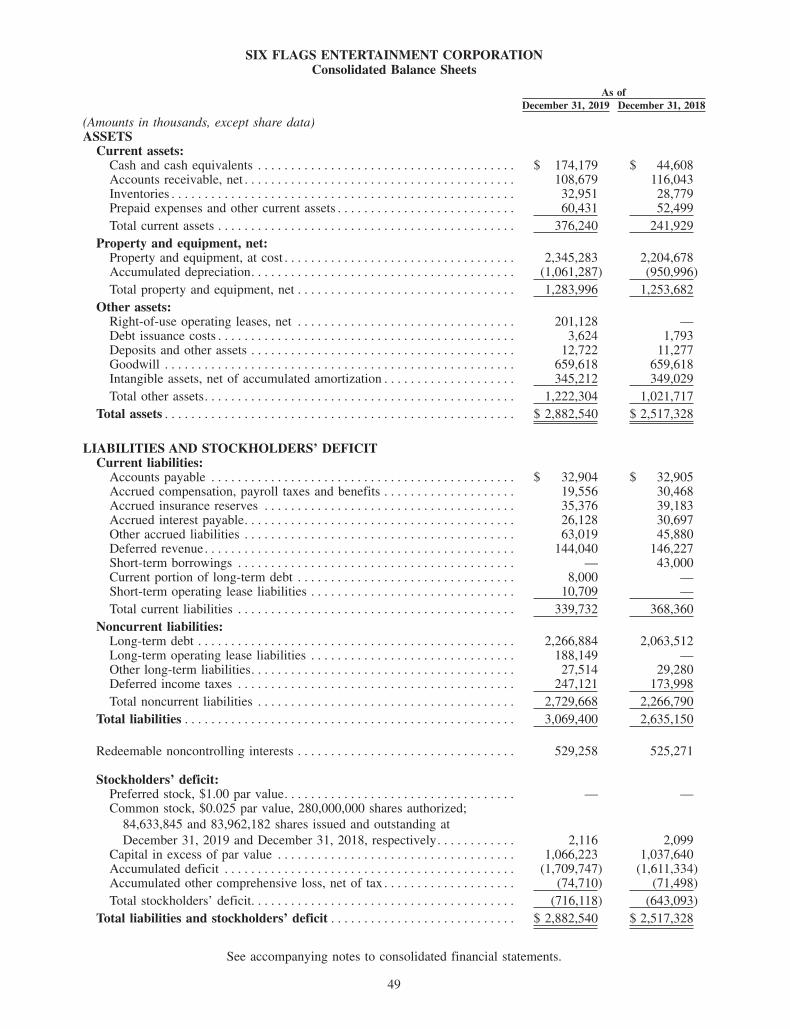
SIX FLAGS ENTERTAINMENT CORPORATIONConsolidated Balance Sheets
As of
December 31, 2019 December 31, 2018
(Amounts in thousands, except share data)ASSETS
Current assets:Cash and cash equivalents . . . . . . . . . . . . . . . . . . . . . . . . . . . . . . . . . . . . . . . $ 174,179 $ 44,608Accounts receivable, net . . . . . . . . . . . . . . . . . . . . . . . . . . . . . . . . . . . . . . . . . 108,679 116,043Inventories . . . . . . . . . . . . . . . . . . . . . . . . . . . . . . . . . . . . . . . . . . . . . . . . . . . . 32,951 28,779Prepaid expenses and other current assets . . . . . . . . . . . . . . . . . . . . . . . . . . . 60,431 52,499
Total current assets . . . . . . . . . . . . . . . . . . . . . . . . . . . . . . . . . . . . . . . . . . . . . 376,240 241,929
Property and equipment, net:Property and equipment, at cost . . . . . . . . . . . . . . . . . . . . . . . . . . . . . . . . . . . 2,345,283 2,204,678Accumulated depreciation. . . . . . . . . . . . . . . . . . . . . . . . . . . . . . . . . . . . . . . . (1,061,287) (950,996)
Total property and equipment, net . . . . . . . . . . . . . . . . . . . . . . . . . . . . . . . . . 1,283,996 1,253,682
Other assets:Right-of-use operating leases, net . . . . . . . . . . . . . . . . . . . . . . . . . . . . . . . . . 201,128 —Debt issuance costs . . . . . . . . . . . . . . . . . . . . . . . . . . . . . . . . . . . . . . . . . . . . . 3,624 1,793Deposits and other assets . . . . . . . . . . . . . . . . . . . . . . . . . . . . . . . . . . . . . . . . 12,722 11,277Goodwill . . . . . . . . . . . . . . . . . . . . . . . . . . . . . . . . . . . . . . . . . . . . . . . . . . . . . 659,618 659,618Intangible assets, net of accumulated amortization . . . . . . . . . . . . . . . . . . . . 345,212 349,029
Total other assets. . . . . . . . . . . . . . . . . . . . . . . . . . . . . . . . . . . . . . . . . . . . . . . 1,222,304 1,021,717
Total assets . . . . . . . . . . . . . . . . . . . . . . . . . . . . . . . . . . . . . . . . . . . . . . . . . . . . . $ 2,882,540 $ 2,517,328
LIABILITIES AND STOCKHOLDERS’ DEFICITCurrent liabilities:
Accounts payable . . . . . . . . . . . . . . . . . . . . . . . . . . . . . . . . . . . . . . . . . . . . . . $ 32,904 $ 32,905Accrued compensation, payroll taxes and benefits . . . . . . . . . . . . . . . . . . . . 19,556 30,468Accrued insurance reserves . . . . . . . . . . . . . . . . . . . . . . . . . . . . . . . . . . . . . . 35,376 39,183Accrued interest payable. . . . . . . . . . . . . . . . . . . . . . . . . . . . . . . . . . . . . . . . . 26,128 30,697Other accrued liabilities . . . . . . . . . . . . . . . . . . . . . . . . . . . . . . . . . . . . . . . . . 63,019 45,880Deferred revenue. . . . . . . . . . . . . . . . . . . . . . . . . . . . . . . . . . . . . . . . . . . . . . . 144,040 146,227Short-term borrowings . . . . . . . . . . . . . . . . . . . . . . . . . . . . . . . . . . . . . . . . . . — 43,000Current portion of long-term debt . . . . . . . . . . . . . . . . . . . . . . . . . . . . . . . . . 8,000 —Short-term operating lease liabilities . . . . . . . . . . . . . . . . . . . . . . . . . . . . . . . 10,709 —
Total current liabilities . . . . . . . . . . . . . . . . . . . . . . . . . . . . . . . . . . . . . . . . . . 339,732 368,360
Noncurrent liabilities:Long-term debt . . . . . . . . . . . . . . . . . . . . . . . . . . . . . . . . . . . . . . . . . . . . . . . . 2,266,884 2,063,512Long-term operating lease liabilities . . . . . . . . . . . . . . . . . . . . . . . . . . . . . . . 188,149 —Other long-term liabilities. . . . . . . . . . . . . . . . . . . . . . . . . . . . . . . . . . . . . . . . 27,514 29,280Deferred income taxes . . . . . . . . . . . . . . . . . . . . . . . . . . . . . . . . . . . . . . . . . . 247,121 173,998
Total noncurrent liabilities . . . . . . . . . . . . . . . . . . . . . . . . . . . . . . . . . . . . . . . 2,729,668 2,266,790
Total liabilities . . . . . . . . . . . . . . . . . . . . . . . . . . . . . . . . . . . . . . . . . . . . . . . . . . 3,069,400 2,635,150
Redeemable noncontrolling interests . . . . . . . . . . . . . . . . . . . . . . . . . . . . . . . . . 529,258 525,271
Stockholders’ deficit:Preferred stock, $1.00 par value. . . . . . . . . . . . . . . . . . . . . . . . . . . . . . . . . . . — —Common stock, $0.025 par value, 280,000,000 shares authorized;
84,633,845 and 83,962,182 shares issued and outstanding at
December 31, 2019 and December 31, 2018, respectively. . . . . . . . . . . . 2,116 2,099Capital in excess of par value . . . . . . . . . . . . . . . . . . . . . . . . . . . . . . . . . . . . 1,066,223 1,037,640Accumulated deficit . . . . . . . . . . . . . . . . . . . . . . . . . . . . . . . . . . . . . . . . . . . . (1,709,747) (1,611,334)Accumulated other comprehensive loss, net of tax . . . . . . . . . . . . . . . . . . . . (74,710) (71,498)
Total stockholders’ deficit. . . . . . . . . . . . . . . . . . . . . . . . . . . . . . . . . . . . . . . . (716,118) (643,093)
Total liabilities and stockholders’ deficit . . . . . . . . . . . . . . . . . . . . . . . . . . . . $ 2,882,540 $ 2,517,328
49
See accompanying notes to consolidated financial statements.
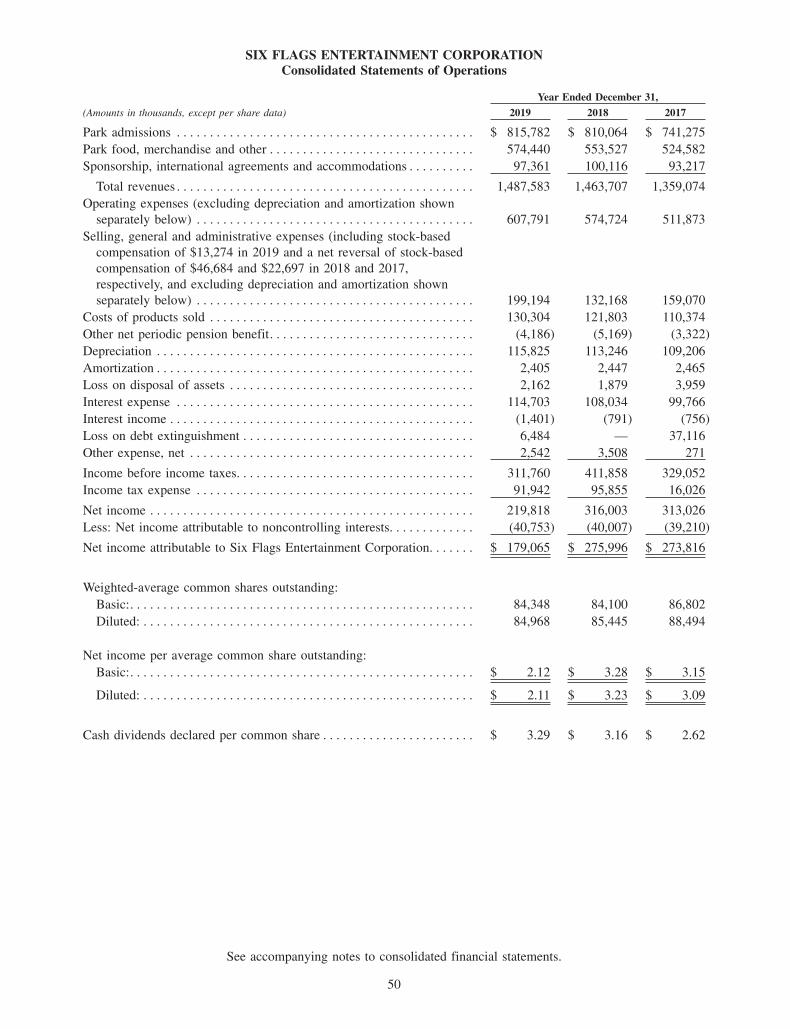
SIX FLAGS ENTERTAINMENT CORPORATIONConsolidated Statements of Operations
Year Ended December 31,
(Amounts in thousands, except per share data) 2019 2018 2017
Park admissions . . . . . . . . . . . . . . . . . . . . . . . . . . . . . . . . . . . . . . . . . . . . . $ 815,782 $ 810,064 $ 741,275
Park food, merchandise and other . . . . . . . . . . . . . . . . . . . . . . . . . . . . . . . 574,440 553,527 524,582
Sponsorship, international agreements and accommodations . . . . . . . . . . 97,361 100,116 93,217
Total revenues . . . . . . . . . . . . . . . . . . . . . . . . . . . . . . . . . . . . . . . . . . . . . 1,487,583 1,463,707 1,359,074
Operating expenses (excluding depreciation and amortization shown
separately below) . . . . . . . . . . . . . . . . . . . . . . . . . . . . . . . . . . . . . . . . . . 607,791 574,724 511,873
Selling, general and administrative expenses (including stock-based
compensation of $13,274 in 2019 and a net reversal of stock-based
compensation of $46,684 and $22,697 in 2018 and 2017,
respectively, and excluding depreciation and amortization shown
separately below) . . . . . . . . . . . . . . . . . . . . . . . . . . . . . . . . . . . . . . . . . . 199,194 132,168 159,070
Costs of products sold . . . . . . . . . . . . . . . . . . . . . . . . . . . . . . . . . . . . . . . . 130,304 121,803 110,374
Other net periodic pension benefit. . . . . . . . . . . . . . . . . . . . . . . . . . . . . . . (4,186) (5,169) (3,322)
Depreciation . . . . . . . . . . . . . . . . . . . . . . . . . . . . . . . . . . . . . . . . . . . . . . . . 115,825 113,246 109,206
Amortization . . . . . . . . . . . . . . . . . . . . . . . . . . . . . . . . . . . . . . . . . . . . . . . . 2,405 2,447 2,465
Loss on disposal of assets . . . . . . . . . . . . . . . . . . . . . . . . . . . . . . . . . . . . . 2,162 1,879 3,959
Interest expense . . . . . . . . . . . . . . . . . . . . . . . . . . . . . . . . . . . . . . . . . . . . . 114,703 108,034 99,766
Interest income . . . . . . . . . . . . . . . . . . . . . . . . . . . . . . . . . . . . . . . . . . . . . . (1,401) (791) (756)
Loss on debt extinguishment . . . . . . . . . . . . . . . . . . . . . . . . . . . . . . . . . . . 6,484 — 37,116
Other expense, net . . . . . . . . . . . . . . . . . . . . . . . . . . . . . . . . . . . . . . . . . . . 2,542 3,508 271
Income before income taxes. . . . . . . . . . . . . . . . . . . . . . . . . . . . . . . . . . . . 311,760 411,858 329,052
Income tax expense . . . . . . . . . . . . . . . . . . . . . . . . . . . . . . . . . . . . . . . . . . 91,942 95,855 16,026
Net income . . . . . . . . . . . . . . . . . . . . . . . . . . . . . . . . . . . . . . . . . . . . . . . . . 219,818 316,003 313,026
Less: Net income attributable to noncontrolling interests. . . . . . . . . . . . . (40,753) (40,007) (39,210)
Net income attributable to Six Flags Entertainment Corporation. . . . . . . $ 179,065 $ 275,996 $ 273,816
Weighted-average common shares outstanding:
Basic:. . . . . . . . . . . . . . . . . . . . . . . . . . . . . . . . . . . . . . . . . . . . . . . . . . . . 84,348 84,100 86,802
Diluted: . . . . . . . . . . . . . . . . . . . . . . . . . . . . . . . . . . . . . . . . . . . . . . . . . . 84,968 85,445 88,494
Net income per average common share outstanding:
Basic:. . . . . . . . . . . . . . . . . . . . . . . . . . . . . . . . . . . . . . . . . . . . . . . . . . . . $ 2.12 $ 3.28 $ 3.15
Diluted: . . . . . . . . . . . . . . . . . . . . . . . . . . . . . . . . . . . . . . . . . . . . . . . . . . $ 2.11 $ 3.23 $ 3.09
Cash dividends declared per common share . . . . . . . . . . . . . . . . . . . . . . . $ 3.29 $ 3.16 $ 2.62
50
See accompanying notes to consolidated financial statements.
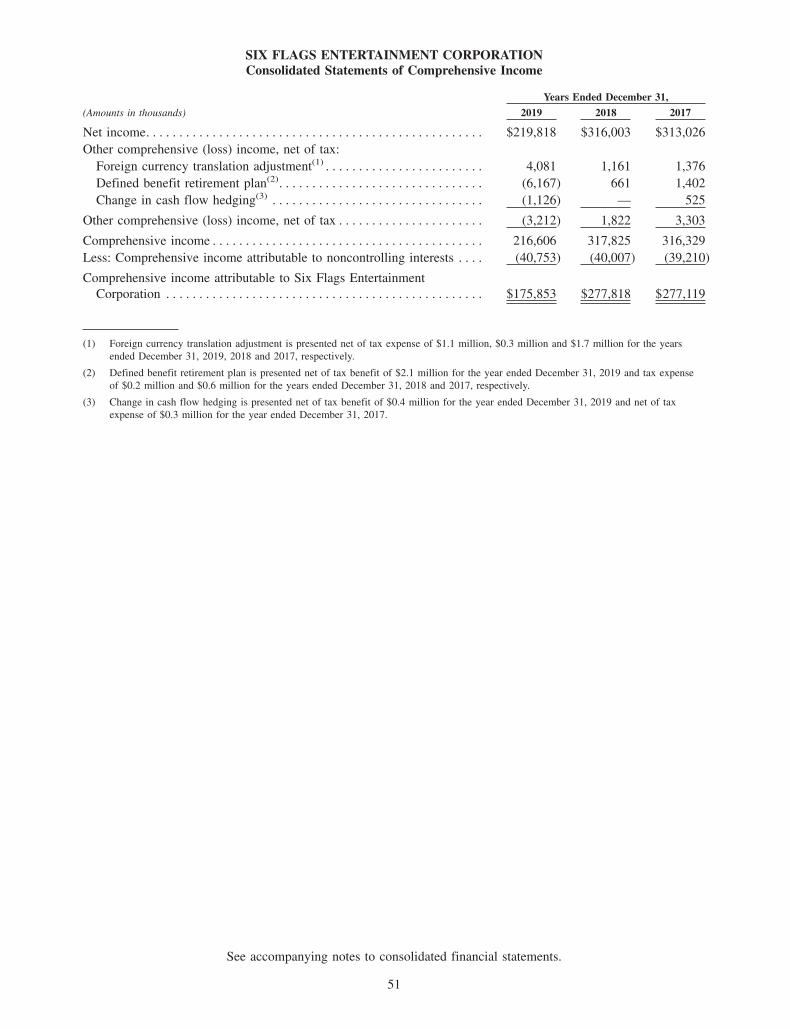
SIX FLAGS ENTERTAINMENT CORPORATIONConsolidated Statements of Comprehensive Income
Years Ended December 31,
(Amounts in thousands) 2019 2018 2017
Net income. . . . . . . . . . . . . . . . . . . . . . . . . . . . . . . . . . . . . . . . . . . . . . . . . . . $219,818 $316,003 $313,026
Other comprehensive (loss) income, net of tax:
Foreign currency translation adjustment(1) . . . . . . . . . . . . . . . . . . . . . . . . 4,081 1,161 1,376
Defined benefit retirement plan(2). . . . . . . . . . . . . . . . . . . . . . . . . . . . . . . (6,167) 661 1,402
Change in cash flow hedging(3) . . . . . . . . . . . . . . . . . . . . . . . . . . . . . . . . (1,126) — 525
Other comprehensive (loss) income, net of tax . . . . . . . . . . . . . . . . . . . . . . (3,212) 1,822 3,303
Comprehensive income . . . . . . . . . . . . . . . . . . . . . . . . . . . . . . . . . . . . . . . . . 216,606 317,825 316,329
Less: Comprehensive income attributable to noncontrolling interests . . . . (40,753) (40,007) (39,210)
Comprehensive income attributable to Six Flags Entertainment
Corporation . . . . . . . . . . . . . . . . . . . . . . . . . . . . . . . . . . . . . . . . . . . . . . . . $175,853 $277,818 $277,119
(1) Foreign currency translation adjustment is presented net of tax expense of $1.1 million, $0.3 million and $1.7 million for the years
ended December 31, 2019, 2018 and 2017, respectively.
(2) Defined benefit retirement plan is presented net of tax benefit of $2.1 million for the year ended December 31, 2019 and tax expense
of $0.2 million and $0.6 million for the years ended December 31, 2018 and 2017, respectively.
(3) Change in cash flow hedging is presented net of tax benefit of $0.4 million for the year ended December 31, 2019 and net of tax
expense of $0.3 million for the year ended December 31, 2017.
51
See accompanying notes to consolidated financial statements.
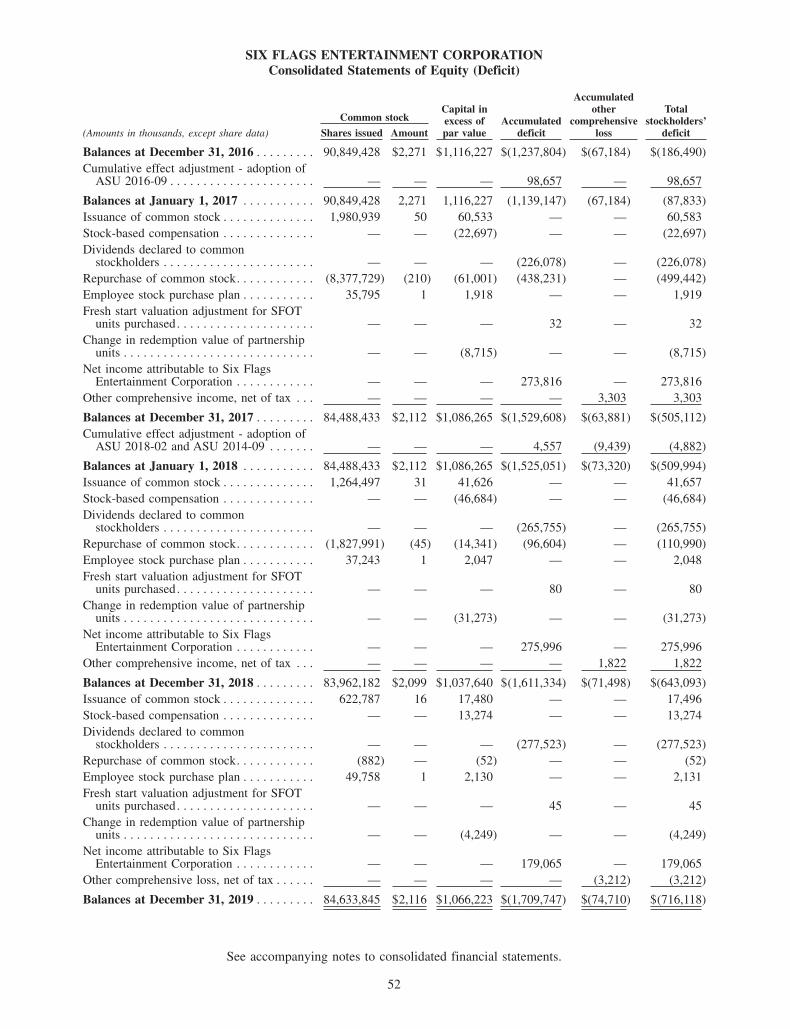
SIX FLAGS ENTERTAINMENT CORPORATIONConsolidated Statements of Equity (Deficit)
Common stockCapital inexcess ofpar value
Accumulateddeficit
Accumulatedother
comprehensiveloss
Totalstockholders’
deficit(Amounts in thousands, except share data) Shares issued Amount
Balances at December 31, 2016 . . . . . . . . . 90,849,428 $2,271 $1,116,227 $(1,237,804) $(67,184) $(186,490)
Cumulative effect adjustment - adoption ofASU 2016-09 . . . . . . . . . . . . . . . . . . . . . . — — — 98,657 — 98,657
Balances at January 1, 2017 . . . . . . . . . . . 90,849,428 2,271 1,116,227 (1,139,147) (67,184) (87,833)
Issuance of common stock . . . . . . . . . . . . . . 1,980,939 50 60,533 — — 60,583
Stock-based compensation . . . . . . . . . . . . . . — — (22,697) — — (22,697)
Dividends declared to commonstockholders . . . . . . . . . . . . . . . . . . . . . . . — — — (226,078) — (226,078)
Repurchase of common stock. . . . . . . . . . . . (8,377,729) (210) (61,001) (438,231) — (499,442)
Employee stock purchase plan . . . . . . . . . . . 35,795 1 1,918 — — 1,919
Fresh start valuation adjustment for SFOTunits purchased. . . . . . . . . . . . . . . . . . . . . — — — 32 — 32
Change in redemption value of partnershipunits . . . . . . . . . . . . . . . . . . . . . . . . . . . . . — — (8,715) — — (8,715)
Net income attributable to Six FlagsEntertainment Corporation . . . . . . . . . . . . — — — 273,816 — 273,816
Other comprehensive income, net of tax . . . — — — — 3,303 3,303
Balances at December 31, 2017 . . . . . . . . . 84,488,433 $2,112 $1,086,265 $(1,529,608) $(63,881) $(505,112)
Cumulative effect adjustment - adoption ofASU 2018-02 and ASU 2014-09 . . . . . . . — — — 4,557 (9,439) (4,882)
Balances at January 1, 2018 . . . . . . . . . . . 84,488,433 $2,112 $1,086,265 $(1,525,051) $(73,320) $(509,994)
Issuance of common stock . . . . . . . . . . . . . . 1,264,497 31 41,626 — — 41,657
Stock-based compensation . . . . . . . . . . . . . . — — (46,684) — — (46,684)
Dividends declared to commonstockholders . . . . . . . . . . . . . . . . . . . . . . . — — — (265,755) — (265,755)
Repurchase of common stock. . . . . . . . . . . . (1,827,991) (45) (14,341) (96,604) — (110,990)
Employee stock purchase plan . . . . . . . . . . . 37,243 1 2,047 — — 2,048
Fresh start valuation adjustment for SFOTunits purchased. . . . . . . . . . . . . . . . . . . . . — — — 80 — 80
Change in redemption value of partnershipunits . . . . . . . . . . . . . . . . . . . . . . . . . . . . . — — (31,273) — — (31,273)
Net income attributable to Six FlagsEntertainment Corporation . . . . . . . . . . . . — — — 275,996 — 275,996
Other comprehensive income, net of tax . . . — — — — 1,822 1,822
Balances at December 31, 2018 . . . . . . . . . 83,962,182 $2,099 $1,037,640 $(1,611,334) $(71,498) $(643,093)
Issuance of common stock . . . . . . . . . . . . . . 622,787 16 17,480 — — 17,496
Stock-based compensation . . . . . . . . . . . . . . — — 13,274 — — 13,274
Dividends declared to commonstockholders . . . . . . . . . . . . . . . . . . . . . . . — — — (277,523) — (277,523)
Repurchase of common stock. . . . . . . . . . . . (882) — (52) — — (52)
Employee stock purchase plan . . . . . . . . . . . 49,758 1 2,130 — — 2,131
Fresh start valuation adjustment for SFOTunits purchased. . . . . . . . . . . . . . . . . . . . . — — — 45 — 45
Change in redemption value of partnershipunits . . . . . . . . . . . . . . . . . . . . . . . . . . . . . — — (4,249) — — (4,249)
Net income attributable to Six FlagsEntertainment Corporation . . . . . . . . . . . . — — — 179,065 — 179,065
Other comprehensive loss, net of tax . . . . . . — — — — (3,212) (3,212)
Balances at December 31, 2019 . . . . . . . . . 84,633,845 $2,116 $1,066,223 $(1,709,747) $(74,710) $(716,118)
52
See accompanying notes to consolidated financial statements.
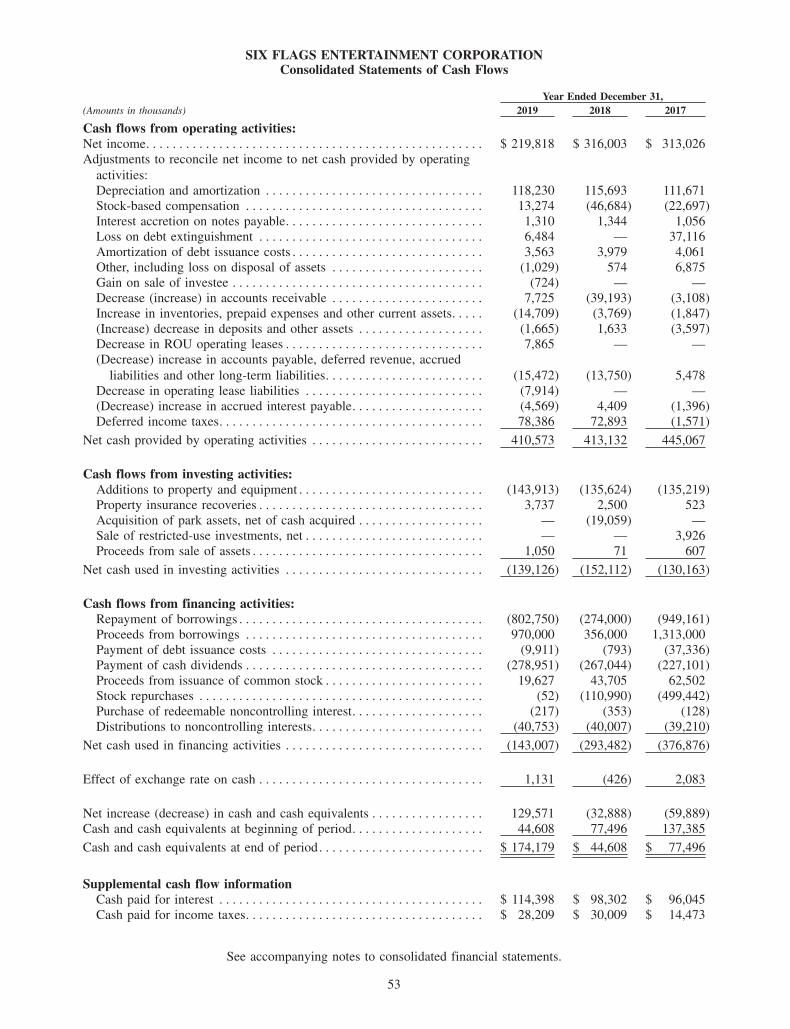
SIX FLAGS ENTERTAINMENT CORPORATIONConsolidated Statements of Cash Flows
Year Ended December 31,
(Amounts in thousands) 2019 2018 2017
Cash flows from operating activities:Net income. . . . . . . . . . . . . . . . . . . . . . . . . . . . . . . . . . . . . . . . . . . . . . . . . . . $ 219,818 $ 316,003 $ 313,026Adjustments to reconcile net income to net cash provided by operating
activities:Depreciation and amortization . . . . . . . . . . . . . . . . . . . . . . . . . . . . . . . . . 118,230 115,693 111,671Stock-based compensation . . . . . . . . . . . . . . . . . . . . . . . . . . . . . . . . . . . . 13,274 (46,684) (22,697)Interest accretion on notes payable. . . . . . . . . . . . . . . . . . . . . . . . . . . . . . 1,310 1,344 1,056Loss on debt extinguishment . . . . . . . . . . . . . . . . . . . . . . . . . . . . . . . . . . 6,484 — 37,116Amortization of debt issuance costs . . . . . . . . . . . . . . . . . . . . . . . . . . . . . 3,563 3,979 4,061Other, including loss on disposal of assets . . . . . . . . . . . . . . . . . . . . . . . (1,029) 574 6,875Gain on sale of investee . . . . . . . . . . . . . . . . . . . . . . . . . . . . . . . . . . . . . . (724) — —Decrease (increase) in accounts receivable . . . . . . . . . . . . . . . . . . . . . . . 7,725 (39,193) (3,108)Increase in inventories, prepaid expenses and other current assets. . . . . (14,709) (3,769) (1,847)(Increase) decrease in deposits and other assets . . . . . . . . . . . . . . . . . . . (1,665) 1,633 (3,597)Decrease in ROU operating leases . . . . . . . . . . . . . . . . . . . . . . . . . . . . . . 7,865 — —(Decrease) increase in accounts payable, deferred revenue, accrued
liabilities and other long-term liabilities. . . . . . . . . . . . . . . . . . . . . . . . (15,472) (13,750) 5,478Decrease in operating lease liabilities . . . . . . . . . . . . . . . . . . . . . . . . . . . (7,914) — —(Decrease) increase in accrued interest payable. . . . . . . . . . . . . . . . . . . . (4,569) 4,409 (1,396)Deferred income taxes. . . . . . . . . . . . . . . . . . . . . . . . . . . . . . . . . . . . . . . . 78,386 72,893 (1,571)
Net cash provided by operating activities . . . . . . . . . . . . . . . . . . . . . . . . . . 410,573 413,132 445,067
Cash flows from investing activities:Additions to property and equipment . . . . . . . . . . . . . . . . . . . . . . . . . . . . (143,913) (135,624) (135,219)Property insurance recoveries . . . . . . . . . . . . . . . . . . . . . . . . . . . . . . . . . . 3,737 2,500 523Acquisition of park assets, net of cash acquired . . . . . . . . . . . . . . . . . . . — (19,059) —Sale of restricted-use investments, net . . . . . . . . . . . . . . . . . . . . . . . . . . . — — 3,926Proceeds from sale of assets . . . . . . . . . . . . . . . . . . . . . . . . . . . . . . . . . . . 1,050 71 607
Net cash used in investing activities . . . . . . . . . . . . . . . . . . . . . . . . . . . . . . (139,126) (152,112) (130,163)
Cash flows from financing activities:Repayment of borrowings . . . . . . . . . . . . . . . . . . . . . . . . . . . . . . . . . . . . . (802,750) (274,000) (949,161)Proceeds from borrowings . . . . . . . . . . . . . . . . . . . . . . . . . . . . . . . . . . . . 970,000 356,000 1,313,000Payment of debt issuance costs . . . . . . . . . . . . . . . . . . . . . . . . . . . . . . . . (9,911) (793) (37,336)Payment of cash dividends . . . . . . . . . . . . . . . . . . . . . . . . . . . . . . . . . . . . (278,951) (267,044) (227,101)Proceeds from issuance of common stock . . . . . . . . . . . . . . . . . . . . . . . . 19,627 43,705 62,502Stock repurchases . . . . . . . . . . . . . . . . . . . . . . . . . . . . . . . . . . . . . . . . . . . (52) (110,990) (499,442)Purchase of redeemable noncontrolling interest. . . . . . . . . . . . . . . . . . . . (217) (353) (128)Distributions to noncontrolling interests. . . . . . . . . . . . . . . . . . . . . . . . . . (40,753) (40,007) (39,210)
Net cash used in financing activities . . . . . . . . . . . . . . . . . . . . . . . . . . . . . . (143,007) (293,482) (376,876)
Effect of exchange rate on cash . . . . . . . . . . . . . . . . . . . . . . . . . . . . . . . . . . 1,131 (426) 2,083
Net increase (decrease) in cash and cash equivalents . . . . . . . . . . . . . . . . . 129,571 (32,888) (59,889)Cash and cash equivalents at beginning of period. . . . . . . . . . . . . . . . . . . . 44,608 77,496 137,385
Cash and cash equivalents at end of period. . . . . . . . . . . . . . . . . . . . . . . . . $ 174,179 $ 44,608 $ 77,496
Supplemental cash flow informationCash paid for interest . . . . . . . . . . . . . . . . . . . . . . . . . . . . . . . . . . . . . . . . $ 114,398 $ 98,302 $ 96,045Cash paid for income taxes. . . . . . . . . . . . . . . . . . . . . . . . . . . . . . . . . . . . $ 28,209 $ 30,009 $ 14,473
53
See accompanying notes to consolidated financial statements.
SIX FLAGS ENTERTAINMENT CORPORATIONNotes to Consolidated Financial Statements
1. Description of Business
We own and operate regional theme parks and waterparks. We are the largest regional theme park operator
in the world and the largest operator of waterparks in North America. Of the 26 parks we currently own or
operate, 23 parks are located in the United States, two parks are located in Mexico and one park is located in
Montreal, Canada.
On April 1, 1998, we acquired the former Six Flags Entertainment Corporation (‘‘Former SFEC’’, a
corporation that has been merged out of existence and that has always been a separate corporation from the
current Six Flags Entertainment Corporation (‘‘Holdings’’)), which had operated regional theme parks and
waterparks under the Six Flags name for nearly 40 years, and established an internationally recognized brand
name. We own the ‘‘Six Flags’’ brand name in the United States and foreign countries throughout the world.
To capitalize on this name recognition, 22 of our current parks are branded as ‘‘Six Flags’’ parks and beginning
in 2014 we also began the development, with third-party partners, of Six Flags-branded parks outside of North
America.
2. Summary of Significant Accounting Policies
a. Basis of Presentation
The consolidated financial statements include our accounts and the accounts of our wholly owned
subsidiaries. We also consolidate the partnerships that own Six Flags Over Texas (‘‘SFOT’’) and Six Flags Over
Georgia (including Six Flags White Water Atlanta) (‘‘SFOG’’, and together with SFOT, the ‘‘Partnership Parks’’)
as subsidiaries in our consolidated financial statements as we have determined that we have the power to direct
the activities of those entities that most significantly impact the entities’ economic performance and we have the
obligation to absorb losses and receive benefits from the entities that can be potentially significant to these
entities. The equity interests owned by non-affiliated parties in the Partnership Parks are reflected in the
accompanying consolidated balance sheets as redeemable noncontrolling interests. The portion of earnings or loss
attributable to non-affiliated parties in the Partnership Parks is reflected as net income attributable to
noncontrolling interests in the accompanying consolidated statements of operations. See Note 6 for further
discussion.
Intercompany transactions and balances have been eliminated in consolidation.
b. Use of Estimates
The preparation of financial statements in conformity with accounting principles generally accepted in the
United States requires management to make estimates and assumptions that affect the reported amounts of assets,
liabilities, revenues and expenses and the disclosure of contingent assets and liabilities in our consolidated
financial statements and accompanying notes. Actual results could differ from those estimates. We evaluate our
estimates and assumptions on an ongoing basis using historical experience and other factors, including the
current economic environment, which we believe to be reasonable under the circumstances. We adjust such
estimates and assumptions when facts and circumstances dictate. As future events and their effects cannot be
determined with precision, actual results could differ significantly from these estimates. Changes in these
estimates resulting from continuing changes in the economic environment will be reflected in the financial
statements in future periods.
54
SIX FLAGS ENTERTAINMENT CORPORATIONNotes to Consolidated Financial Statements
c. Fair Value Measurement
Financial Accounting Standards Board (‘‘FASB’’) Accounting Standards Codification (‘‘ASC’’) Topic 820,
Fair Value Measurement, defines fair value as the exchange prices that would be received for an asset or paid to
transfer a liability (an exit price) in the principal or most advantageous market for the asset or liability in an
orderly transaction between market participants on the measurement date. The guidance also specifies a hierarchy
of valuation techniques based on whether the inputs to those valuation techniques are observable or
unobservable. Observable inputs reflect market data obtained from independent sources, while unobservable
inputs reflect our market assumptions. In accordance with FASB ASC Topic 820, Fair Value Measurement, these
two types of inputs have created the following fair value hierarchy:
• Level 1: quoted prices in active markets for identical assets;
• Level 2: inputs to the valuation methodology include quoted prices for similar assets and liabilities in
active markets, and inputs that are observable for the asset or liability, either directly or indirectly, for
substantially the full term of the instrument; and
• Level 3: inputs to the valuation methodology are unobservable for the asset or liability.
The fair value of a financial instrument is the amount at which the instrument could be exchanged in a
current transaction between willing parties. We use a market approach for our recurring fair value measurements,
and we endeavor to use the best information available. Accordingly, valuation techniques that maximize the use
of observable impacts are favored. We present the estimated fair values and classifications of our financial
instruments in accordance with FASB Accounting Standards Consideration (‘‘ASC’’) Topic 820, Fair Value
Measurement.
The following methods and assumptions were used to estimate the fair value of each class of financial
instruments:
• The carrying values of cash and cash equivalents, accounts receivable, notes receivable, accounts
payable and accrued liabilities approximate fair value because of the short maturity of these
instruments.
• The measurement of the fair value of long-term debt is based on market prices that generally are
observable for similar liabilities at commonly quoted intervals and is considered a Level 2 fair value
measurement. Refer to Note 8 for additional information.
• The measurement of the fair value of derivative assets and liabilities is based on market prices that
generally are observable for similar assets and liabilities at commonly quoted intervals and is
considered a Level 2 fair value measurement. Derivative assets and liabilities that have maturity dates
equal to or less than twelve months from the balance sheet date are included in prepaid expenses and
other current assets and other accrued liabilities, respectively. Derivative assets and liabilities that have
maturity dates greater than twelve months from the balance sheet date are included in deposits and
other assets and other long-term liabilities, respectively. See Note 7 for additional information on our
derivative instruments.
d. Cash Equivalents
Cash equivalents consists of short-term highly liquid investments with a remaining maturity as of the date of
purchase of three months or less. For purposes of the consolidated statements of cash flows, we consider all
highly liquid debt instruments with remaining maturities as of their date of purchase of three months or less to
be cash equivalents. Cash equivalents were not significant as of December 31, 2019 and 2018.
e. Inventories
Inventories are stated at lower of weighted average cost or net realizable value and primarily consist of
products purchased for resale, including merchandise, food and miscellaneous supplies. Products are removed
from inventory at weighted average cost. We have recorded a $0.4 million allowance for slow moving inventory
as of December 31, 2019 and a nominal valuation allowance as of December 31, 2018.
55
SIX FLAGS ENTERTAINMENT CORPORATIONNotes to Consolidated Financial Statements
f. Prepaid Expenses and Other Current Assets
Prepaid expenses and other current assets include $22.9 million of spare parts inventory for existing rides
and attractions as of both December 31, 2019 and 2018. These items are expensed as the repair or maintenance
of rides and attractions occur.
g. Advertising Costs
Production costs of commercials and programming are charged to operations in the year first aired.
The costs of other advertising, promotion, and marketing programs are charged to operations when incurred with
the exception of direct-response advertising which is charged to the period it will benefit. As of December 31,
2019 and 2018, we had $1.8 million and $1.6 million in prepaid advertising, respectively. The amounts
capitalized are included in prepaid expenses.
Advertising and promotions expense was $69.5 million, $68.4 million and $63.7 million for the years ended
December 31, 2019, 2018 and 2017, respectively.
h. Debt Issuance Costs
We capitalize costs related to the issuance of debt. Debt issuance costs directly related to the Second
Amended and Restated Revolving Loan are presented within other assets as debt issuance costs in our
consolidated balance sheets. Debt issuance costs directly related to the Second Amended and Restated Term
Loam B and our senior unsecured notes are presented within noncurrent liabilities as a reduction of long-term
debt in our consolidated balance sheets. The amortization of such costs is recognized as interest expense using
the interest method over the term of the respective debt issue. Amortization related to debt issuance costs was
$3.6 million, $4.0 million and $4.1 million for the years ended December 31, 2019, 2018 and 2017, respectively.
See Note 8 for further discussion.
i. Property and Equipment
Property and equipment additions are recorded at cost and the carrying value is depreciated using the
straight-line method over the estimated useful lives of the assets. Maintenance and repair costs that do not
improve service potential or extend economic life are charged directly to expense as incurred, while betterments
and renewals are generally capitalized as property and equipment. When an item is retired or otherwise disposed
of, the cost and applicable accumulated depreciation are removed and the resulting gain or loss is recognized.
See Note 4 for further detail of the components of our property and equipment.
The estimated useful lives of the assets are as follows:
Rides and attractions . . . . . . . . . . . . . . . . . . . . . . . . . . . . . . . . . . . . . . . . . . . . . . . . . . 5 - 25 years
Land improvements . . . . . . . . . . . . . . . . . . . . . . . . . . . . . . . . . . . . . . . . . . . . . . . . . . . 10 - 15 years
Buildings and improvements . . . . . . . . . . . . . . . . . . . . . . . . . . . . . . . . . . . . . . . . . . . . Approximately 30 years
Furniture and equipment . . . . . . . . . . . . . . . . . . . . . . . . . . . . . . . . . . . . . . . . . . . . . . . 5 - 10 years
j. Goodwill and Indefinite-Lived Intangible Assets
Goodwill and intangible assets with indefinite useful lives are tested for impairment annually, or more
frequently if events or circumstances indicate that the assets might be impaired. We identify our reporting unit
and determine the carrying value of the reporting unit by assigning the assets and liabilities, including the
existing goodwill and intangible assets, to the reporting unit. We then determine the fair value of the reporting
unit and compare it to the carrying amount of the reporting unit. All of our parks are operated in a similar
manner and have comparable characteristics in that they produce and distribute similar services and products
using similar processes, have similar types of customers, are subject to similar regulations and exhibit similar
economic characteristics. As such, we are a single reporting unit. For each year, the fair value of the single
reporting unit exceeded our carrying amount (provided that, we have one reporting unit at the same level for
which Holdings common stock is traded, we believe our market capitalization is the best indicator of our
56
SIX FLAGS ENTERTAINMENT CORPORATIONNotes to Consolidated Financial Statements
reporting unit’s fair value). We perform a qualitative analysis on indefinite-lived intangible assets to determine if
it is more likely than not that the fair value of the intangible asset was less than its carrying amount as a basis
for determining whether it was necessary to perform a quantitative impairment test.
The fair value of indefinite-lived intangible assets is generally determined based on a discounted cash flow
analysis. An impairment loss occurs to the extent that the carrying value exceeds the fair value. For goodwill, if
the fair value of the reporting unit were to be less than the carrying amount, an impairment loss would be
recognized to the extent that the carrying amount of the reporting unit exceeds its fair value.
k. Valuation of Long-Lived Assets
We review long-lived assets, including finite-lived intangible assets subject to amortization, for impairment
upon the occurrence of events or changes in circumstances that would indicate that the carrying value of the
asset or group of assets may not be recoverable. Recoverability of assets to be held and used is measured by a
comparison of the carrying amount of an asset or group of assets to the future net cash flows expected to be
generated by the asset or group of assets. If such assets are not considered to be fully recoverable, any
impairment to be recognized is measured by the amount by which the carrying amount of the asset or group of
assets exceeds its respective fair value. Assets to be disposed of are reported at the lower of the carrying amount
or fair value less costs to sell.
l. Revenue Recognition
FASB ASC 606, Revenue from Contracts with Customers (together with the series of Accounting Standards
Updates described in the second paragraph under ‘‘Recently Adopted Accounting Pronouncements’’ below,
‘‘Topic 606’’) is based on the principle that revenue is recognized to depict the transfer of goods or services to
customers in an amount that reflects consideration to which the entity expects to be entitled in exchange for
those goods or services. We recognize revenue upon admission into our parks, provision of our services or when
products are delivered to our guests. Revenues are presented in the accompanying consolidated statements of
operations net of sales taxes collected from our guests and remitted or payable to government taxing authorities.
In contrast to our season pass and other multi-use offerings (such as our all season dining pass program, which
enables season pass holders and members to eat meals and snacks any day they visit the park for one upfront
payment) that expire at the end of each operating season, the membership program continues on a
month-to-month basis after the initial twelve-month membership term and can be canceled any time after the
initial term pursuant to the terms of the membership program. Guests enrolled in the membership program can
visit our parks an unlimited number of times anytime they are open as long as the guest remains enrolled in the
membership program. For season passes, memberships in the initial twelve-month term and other multi-use
admissions, we estimate a redemption rate based on historical experience and other factors and assumptions we
believe to be customary and reasonable and recognize a pro-rata portion of the revenue as the guest attends our
parks. We review the estimated redemption rate regularly and on an ongoing basis and revise it as necessary
throughout the year. Amounts received for multi-use admissions in excess of redemptions are recognized in
deferred revenue. For active memberships after the initial twelve-month term, we recognize revenue monthly as
payments are received. As of December 31, 2019, deferred revenue was primarily comprised of (i) advance sales
of season passes, all season dining passes and other admissions for the 2020 operating season, and
(ii) unredeemed portions of the membership program that will be recognized in 2020.
We have entered into international agreements to assist third parties in the planning, design, development
and operation of Six Flags-branded parks outside of North America. These agreements typically consist of a
brand licensing agreement, project services agreement, and management services agreement. Under Topic 606,
we treat these agreements as one contract because each was negotiated with a single commercial objective.
We have identified three distinct promises within the agreement with each third party partner as brand licensing,
project services, and management services. Each of these promises is its own performance obligation and distinct
as the third party could benefit from each service on its own with other readily available resources and each
service is separately identifiable from other services in the context of the contract. We recognize revenue under
our international agreements over the relevant service period of each performance obligation based on its relative
stand-alone selling price, as determined by our best estimate of selling price. We review the service period of
57
SIX FLAGS ENTERTAINMENT CORPORATIONNotes to Consolidated Financial Statements
each performance obligation on an ongoing basis and revise it as necessary throughout the year. Revisions to the
relevant service periods of the performance obligations may result in revisions to revenue in future periods and
are recognized in the period in which the change is identified.
On January 1, 2018, we adopted Topic 606 using the modified retrospective method applied to those
contracts which were not completed as of January 1, 2018. Results for reporting periods beginning after
January 1, 2018 are presented under Topic 606, while prior period amounts are not adjusted and continue to be
reported in accordance with our historic accounting under FASB ASC 605, Revenue Recognition (‘‘Topic 605’’).
See Note 3 for additional information.
m. Accounts Receivable, Net
Accounts receivable are reported at net realizable value and consist primarily of amounts due from guests
for the sale of group outings and multi-use admission products, including season passes and the membership
program. We are not exposed to a significant concentration of credit risk, however, based on the age of the
receivables, our historical experience and other factors and assumptions we believe to be customary and
reasonable, we do record an allowance for doubtful accounts. As of December 31, 2019 and 2018, we have
recorded an allowance for doubtful accounts of $8.3 million and $7.4 million, respectively. The allowance for
doubtful accounts is primarily comprised of estimated defaults under our membership plans.
n. Derivative Instruments and Hedging Activities
We recognize all derivatives as either assets or liabilities in the consolidated balance sheet and measure
those instruments at fair value. If certain conditions are met, a derivative may be specifically designated as a
hedge for accounting purposes. The accounting for changes in the fair value of a derivative (e.g., gains and
losses) depends on the intended use of the derivative and the resulting designation.
We formally document all relationships between hedging instruments and hedged items, as well as our
risk-management objective and our strategy for undertaking various hedge transactions. This process includes
linking all derivatives that are designated as cash flow hedges to forecasted transactions. We also assess, both at
the hedge’s inception and on an ongoing basis, whether the derivatives that are used in hedging transactions are
highly effective in offsetting changes in cash flows of hedged items.
Change in the fair value of a derivative that is effective and that is designated and qualifies as a cash-flow
hedge are recorded in other comprehensive (loss) income until operations are affected by the variability in cash
flows of the designated hedged item, at which point they are reclassified to interest expense. Change in fair value
of a derivative that is not designated as a hedge are recorded in other expense, net in the consolidated statements
of operations on a current basis.
In June 2019, we entered into three separate interest rate swap agreements with a notional amount of
$300.0 million (collectively, the ‘‘June 2019 Swap Agreements’’) to mitigate the risk of an increase in the
LIBOR interest rate in effect on the Second Amended and Restated Term Loan B. In August 2019, we entered
into two additional separate interest rate swap agreements with a notional amount of $400.0 million (collectively,
the ‘‘August 2019 Swap Agreements’’) to mitigate the risk of an increase in the LIBOR interest rate in effect on
the Second Amended and Restated Term Loan B. See Note 7 for a further discussion.
o. Commitments and Contingencies
We are involved in various lawsuits and claims that arise in the normal course of business. Amounts
associated with lawsuits or claims are reserved for matters in which it is believed that losses are probable and
can be reasonably estimated. In addition to matters in which it is believed that losses are probable, disclosure is
also provided for matters in which the likelihood of an unfavorable outcome is at least reasonably possible but
for which a reasonable estimate of loss or range of loss is not possible. Legal fees are expensed as incurred.
See Note 15 for further discussion.
p. Income Taxes
Income taxes are accounted for under the asset and liability method. Deferred tax assets and liabilities are
recognized for the future tax consequences attributable to differences between the financial statement carrying amounts
58
SIX FLAGS ENTERTAINMENT CORPORATIONNotes to Consolidated Financial Statements
of existing assets and liabilities and their respective tax bases, including net operating loss and other tax carryforwards.
Deferred tax assets and liabilities are measured using enacted tax rates expected to apply to taxable income in the
years in which those differences are expected to be recovered or settled. The effect on deferred tax assets and liabilities
of a change in tax rates is recognized in operations in the period that includes the enactment date. We have a valuation
allowance of $130.6 million and $115.2 million as of December 31, 2019 and 2018, respectively, due to uncertainties
related to our ability to utilize some of our deferred tax assets, primarily consisting of certain state net operating loss,
foreign tax credits and other tax carryforwards, before they expire. The valuation allowance was based on our
estimates of taxable income by jurisdiction in which we operate and the period over which our deferred tax assets
were recoverable. For the foreseeable future, we project taxable income that will allow for the utilization of all of our
federal net operating loss carryforwards before they expire.
Our liability for income taxes is finalized as auditable tax years pass their respective statutes of limitations
in the various jurisdictions in which we are subject to tax. However, these jurisdictions may audit prior years for
which the statute of limitations is closed for the purpose of making an adjustment to our taxable income in a
year for which the statute of limitations has not closed. Accordingly, taxing authorities of these jurisdictions may
audit prior years of the group and its predecessors for the purpose of adjusting net operating loss carryforwards
to years for which the statute of limitations has not closed.
We classify interest and penalties attributable to income taxes as part of income tax expense. As of
December 31, 2019 and 2018, we had no accrued interest and penalties liability.
Because we do not permanently reinvest foreign earnings, United States deferred income taxes have been
provided on unremitted foreign earnings to the extent that such foreign earnings are expected to be taxable upon
repatriation.
For global intangible low taxed income (‘‘GILTI’’) under the Tax Cuts and Jobs Act, the Company has
elected to account for GILTI as a component of tax expense in the period in which the Company is subject to the
rules (the ‘‘period cost method’’).
See Note 11 for further discussion.
q. Earnings Per Common Share
Basic earnings per common share is computed by dividing net income attributable to Holdings’ common
stockholders by the weighted average number of common shares outstanding for the period. Diluted earnings per
common share is computed by dividing net income attributable to Holdings’ common stockholders by the
weighted average number of common shares outstanding during the period including the effect of all dilutive
common stock equivalents using the treasury stock method. In periods for which there is a net loss, diluted loss
per common share is equal to basic loss per common share, since the effect of including any common stock
equivalents would be antidilutive.
r. Stock-Based Compensation
Pursuant to the Six Flags Entertainment Corporation Long-Term Incentive Plan (the ‘‘Long-Term Incentive
Plan’’), Holdings may grant stock options, stock appreciation rights, restricted stock, restricted stock units,
unrestricted stock, deferred stock units, performance and cash-settled awards and dividend equivalents to select
employees, officers, directors and consultants of Holdings and its affiliates. We recognize the fair value of each
grant as compensation expense on a straight-line basis over the vesting period using the graded vesting terms of
the respective grant. The fair value of stock option grants is estimated on the date of grant using the
Black-Scholes option pricing valuation model. The fair value of stock, restricted stock units and restricted stock
awards is the quoted market price of Holdings’ stock on the date of grant. See Note 10 for further discussion of
stock-based compensation and related disclosures.
s. Comprehensive Income
Comprehensive income consists of net income, changes in the foreign currency translation adjustment,
changes in the fair value of derivatives that are designated as hedges and changes in the net actuarial gains
(losses) and amortization of prior service costs on our defined benefit retirement plan.
59
SIX FLAGS ENTERTAINMENT CORPORATIONNotes to Consolidated Financial Statements
t. Redeemable Noncontrolling Interest
We record the carrying amount of our redeemable noncontrolling interests at their fair value at the date of
issuance. We recognize the changes in their redemption value immediately as they occur and adjust the carrying
value of these redeemable noncontrolling interests to equal the redemption value at the end of each reporting
period, if greater than the redeemable noncontrolling interest carrying value.
This method would view the end of the reporting period as if it were also the redemption date for the
redeemable noncontrolling interests. We conduct an annual review to determine if the fair value of the
redeemable units is less than the redemption amount. If the fair value of the redeemable units is less than the
redemption amount, there would be a charge to earnings per share allocable to common stockholders.
The redemption amount at the end of each reporting period did not exceed the fair value of the redeemable units.
u. Leases
We or certain of our subsidiaries are a lessee in various noncancelable operating leases, primarily for
operating rights to amusement parks, land, office space, warehouses, office equipment and machinery.
We account for leases in accordance with FASB ASC 842, Leases (‘‘Topic 842’’). See below for additional
information on recently adopted accounting pronouncements and Note 16 for additional information. We
determine if an arrangement is or contains a lease at contract inception and recognize a right-of-use (‘‘ROU’’)
asset and lease liability at the lease commencement date.
For our operating leases, the lease liability is initially and subsequently measured at the present value of the
unpaid lease payments at the lease commencement date. Key estimates and judgments include how we determine
(i) the discount rate used to discount the unpaid lease payments to present value, (ii) the lease term and (iii) the
lease payments. Topic 842 requires a lessee to discount its unpaid lease payments using the interest rate implicit
in the lease or, if that rate cannot be readily determined, its incremental borrowing rate (‘‘IBR’’). Generally, we
cannot determine the interest rate implicit in the lease and therefore we use the IBR as a discount rate for our
leases. The IBR reflects the rate of interest we would pay on a collateralized basis to borrow an amount equal to
the lease payments under similar terms. Key assumptions used in determining IBR are our credit rating and
unsecured borrowing yield curves, adjusted to get secured borrowing curves using notching and recovery rate
methods. The lease term for all of our leases includes the noncancelable period of the lease plus any additional
periods covered by an option to extend the lease that we are reasonably certain to exercise. Lease payments
included in the measurement of the lease liability comprise fixed payments owed over the lease term, variable
lease payments that depend on an index or rate, and the exercise price of an option to purchase the underlying
asset if it is reasonably certain that we will exercise the option.
The ROU asset is initially measured at cost, which comprises the initial amount of lease liability adjusted
for lease payments made at or before the lease commencement date, plus any initial direct costs incurred, less
any lease incentives received. For our operating leases, the ROU asset is subsequently measured throughout the
lease term at the carrying amount of the lease liability, plus initial direct costs, and adjusted for any prepaid or
accrued lease payments, less the unamortized balance of lease incentives received. Lease expense for lease
payments is recognized on a straight-line basis over the term of the operating lease.
Variable lease payments associated with our leases are recognized upon the occurrence of the event, activity,
or circumstance in the lease agreement on which those payments are assessed. Variable lease payments for
operating leases are presented as operating expense in our consolidated statements of operations in the same line
item as expense arising from fixed lease payments. Property taxes and insurance paid on behalf of our lessors is
included within variable lease payments.
Operating lease ROU assets net of accumulated amortization are presented as ‘‘Right-of-use operating
leases, net’’ on the consolidated balance sheets. The current portion of operating lease liabilities is presented as
‘‘Short-term operating lease liabilities’’ and the long-term portion is presented separately as ‘‘Long-term operating
lease liabilities’’ on the consolidated balance sheets.
60
SIX FLAGS ENTERTAINMENT CORPORATIONNotes to Consolidated Financial Statements
We have elected not to recognize ROU assets and lease liabilities for short-term leases that have a lease
term of 12 months or less. We recognize the lease payments associated with short-term leases as an expense on a
straight-line basis over the lease term. Variable lease payments associated with short-term leases are recognized
and presented in the same manner as for all other leases.
The ROU assets for operating leases may be periodically reduced by impairment losses. We use the
long-lived assets impairment guidance in ASC Subtopic 360-10, Property, Plant and Equipment - Overall, to
determine whether an ROU asset is impaired and if so, the amount of the impairment loss to recognize.
We monitor for events or changes in circumstances that require a reassessment of one of our leases. When a
reassessment results in the remeasurement of a lease liability, an adjustment is made to the carrying amount of
the corresponding ROU asset unless doing so would reduce the carrying amount of the ROU asset to an amount
less than zero. In that case, the amount of the adjustment that would result in a negative ROU asset balance is
recorded in our consolidated statements of operations.
v. Acquisition of Park Assets
On May 22, 2018, we entered into an asset purchase agreement with Premier Parks, LLC and its affiliates to
acquire the lease rights to operate five parks owned by EPR Properties, LLC (the ‘‘five new parks’’).
We completed the transaction on June 1, 2018. In connection with the purchase agreement, we entered into
operating leases with EPR Properties, LLC, under which we are the tenant. The five new parks were previously
operated by Premier Parks, LLC of Oklahoma City and its affiliates. These acquisitions expanded our portfolio of
parks in North America to twenty-five at the time of acquisition. The financial results of the five new parks since
the acquisition date are included in our consolidated statements of operations. Assets acquired and liabilities
assumed, consisting primarily of working capital, are reflected in our consolidated financial statements. We paid
$19.1 million in cash to Premier Parks, LLC for the five new parks, which reflects the $23.0 million purchase
price, less net working capital and other adjustments. We recorded $29.4 million of goodwill in connection with
the acquisition, which is attributable to the excess of the purchase price over the net working capital liabilities
we assumed.
w. Recently Adopted Accounting Pronouncements
In February 2016, FASB released Accounting Standards Update (‘‘ASU’’) No. 2016-02, Leases
(‘‘Topic 842’’) (‘‘ASU 2016-02’’). The main amendments in ASU 2016-02 require recognition on the
balance sheet of lease ROU assets and lease liabilities by lessees for those leases classified as operating
leases in order to give more transparency on commitments and future cash flow. The new guidance is
effective for annual periods beginning after December 15, 2018, including interim periods within the fiscal
year. The new standard supersedes the previous lease accounting standard under FASB ASC 840, Leases
(‘‘Topic 840’’). On January 1, 2019, we adopted Topic 842 using the modified retrospective transition
method applied to leases with terms extending past January 1, 2019. Results for reporting periods beginning
after January 1, 2019 are presented under Topic 842, while prior period amounts are not adjusted and
continue to be reported in accordance with our historic accounting under Topic 840. Refer to Note 16 for
additional information.
In May 2014, the FASB issued ASU No. 2014-09, Revenue from Contracts with Customers (‘‘ASU 2014-09’’).
The amendments to ASU 2014-09 provide for a single, principles-based model for revenue recognition that replaces
the existing revenue recognition guidance. In August 2015, the FASB issued ASU 2015-14, Revenue from Contracts
with Customers – Deferral of the Effective Date (‘‘ASU 2015-14’’), to defer the effective date of ASU 2014-09 for one
year. The new guidance became effective for annual and interim periods beginning after December 15, 2017 and
replaced most existing revenue recognition guidance under U.S. GAAP. In March and April 2016, the FASB issued
ASU No. 2016-08 and No. 2016-10, Revenue from Contracts with Customers (Topic 606): Principal versus Agent
Considerations and Revenue from Contracts with Customers (Topic 606): Identifying Performance Obligations and
Licensing, respectively (together, ‘‘ASU 2016-08/10’’). The amendments in ASU 2016-08/10 state that an entity should
recognize revenue to depict the transfer of promised goods or services to customers in an amount that reflects the
consideration to which the entity expects to be entitled to in exchange for those goods or services. The effective date
and transition requirements for the amendments in ASU 2016 08/10 are the same as the effective date and transition
61
SIX FLAGS ENTERTAINMENT CORPORATIONNotes to Consolidated Financial Statements
requirements in ASU 2015-14. ASU 2016-08/10 permits the use of either a retrospective or cumulative effect transition
method, and early adoption is permitted only as of annual reporting periods beginning after December 15, 2016,
including interim reporting periods within that reporting period. On January 1, 2018, we adopted Topic 606 using the
modified retrospective transition method applied to those contracts with customers which were not completed as of
January 1, 2018. Results for reporting periods beginning after January 1, 2018 are presented under Topic 606, while
prior period amounts are not adjusted and continue to be reported in accordance with our historic accounting under
FASB ASC 605, Revenue Recognition (‘‘Topic 605’’). Refer to Note 3 for additional information.
x. Recent Accounting Pronouncements Not Yet Adopted
In June 2016, FASB issued ASU 2016-13, Measurement of Credit Losses on Financial Instruments,
(‘‘Topic 326’’). The standard requires the immediate recognition of estimated credit losses expected to occur over
the life of financial assets rather than the current incurred loss impairment model that recognizes losses when a
probable threshold is met. Topic 326 is effective for annual periods beginning after December 15, 2019 and
interim periods within those fiscal years. We do not expect the adoption of Topic 326 to have a material impact
on our consolidated balance sheets, statements of operations and financial disclosures.
In December 2019, FASB issued ASU 2019-12, Income Taxes (Topic 740): Simplifying the Accounting for
Income Taxes (‘‘Update 2019-12’’), which removes certain exceptions for investments, intraperiod allocations and
interim tax calculations and adds guidance to reduce complexity in accounting for income taxes. Update 2019-12
is effective for annual periods beginning after December 15, 2020, with early adoption permitted. The various
amendments in Update 2019-12 are applied on a retrospective basis, modified retrospective basis and prospective
basis, depending on the amendment. We are in the process of evaluating the impact of this amendment on our
consolidated financial statements.
In August 2018, FASB issued ASU 2018-14, Compensation – Retirement Benefits – Defined Benefit Plans –
General (Subtopic 715-20): Disclosure Framework – Changes to the Disclosure Requirements for Defined
Benefit Plans (‘‘Update 2018-14’’), which modifies the disclosure requirements for employers that sponsor
defined benefit pension or other post-retirement plans. Update 2018-14 is effective for annual periods beginning
after January 1, 2021, with early adoption permitted. Adoption is required to be applied on a retrospective basis
to all periods presented. We are in the process of evaluating the impact of this amendment on our consolidated
financial statements.
3. Revenue
On January 1, 2018, we adopted Topic 606 using the modified retrospective method applied to those
contracts which were not completed as of January 1, 2018. Results for reporting periods beginning after
January 1, 2018 are presented under Topic 606, while prior period amounts are not adjusted and continue to be
reported in accordance with our historic accounting under Topic 605.
The impact of adoption of Topic 606 on our consolidated statements of operations for the year ended
December 31, 2019 and 2018 was as follows:
Year Ended December 31, 2019
(Amounts in thousands) As ReportedBalances Without
AdoptionEffect of ChangeHigher/(Lower)
Statement of Operations
Revenues
Sponsorship, international agreements and accommodations . . . . $ 97,361 $ 97,224 $137
Costs and expenses
Income tax expense. . . . . . . . . . . . . . . . . . . . . . . . . . . . . . . . . . . . . 91,942 91,913 29
Net income . . . . . . . . . . . . . . . . . . . . . . . . . . . . . . . . . . . . . . . . . . . 179,065 178,957 108
62
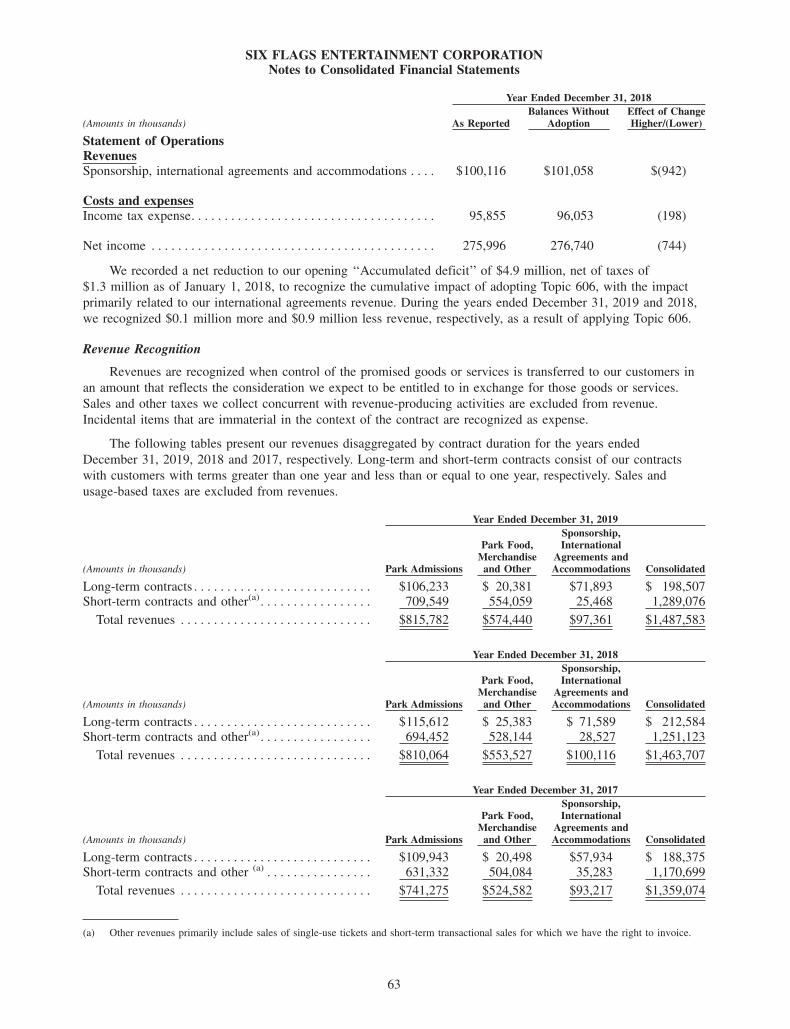
SIX FLAGS ENTERTAINMENT CORPORATIONNotes to Consolidated Financial Statements
Year Ended December 31, 2018
(Amounts in thousands) As ReportedBalances Without
AdoptionEffect of ChangeHigher/(Lower)
Statement of OperationsRevenuesSponsorship, international agreements and accommodations . . . . $100,116 $101,058 $(942)
Costs and expensesIncome tax expense. . . . . . . . . . . . . . . . . . . . . . . . . . . . . . . . . . . . . 95,855 96,053 (198)
Net income . . . . . . . . . . . . . . . . . . . . . . . . . . . . . . . . . . . . . . . . . . . 275,996 276,740 (744)
We recorded a net reduction to our opening ‘‘Accumulated deficit’’ of $4.9 million, net of taxes of
$1.3 million as of January 1, 2018, to recognize the cumulative impact of adopting Topic 606, with the impact
primarily related to our international agreements revenue. During the years ended December 31, 2019 and 2018,
we recognized $0.1 million more and $0.9 million less revenue, respectively, as a result of applying Topic 606.
Revenue Recognition
Revenues are recognized when control of the promised goods or services is transferred to our customers in
an amount that reflects the consideration we expect to be entitled to in exchange for those goods or services.
Sales and other taxes we collect concurrent with revenue-producing activities are excluded from revenue.
Incidental items that are immaterial in the context of the contract are recognized as expense.
The following tables present our revenues disaggregated by contract duration for the years ended
December 31, 2019, 2018 and 2017, respectively. Long-term and short-term contracts consist of our contracts
with customers with terms greater than one year and less than or equal to one year, respectively. Sales and
usage-based taxes are excluded from revenues.
Year Ended December 31, 2019
(Amounts in thousands) Park Admissions
Park Food,Merchandise
and Other
Sponsorship,International
Agreements andAccommodations Consolidated
Long-term contracts . . . . . . . . . . . . . . . . . . . . . . . . . . . $106,233 $ 20,381 $71,893 $ 198,507Short-term contracts and other(a) . . . . . . . . . . . . . . . . . 709,549 554,059 25,468 1,289,076
Total revenues . . . . . . . . . . . . . . . . . . . . . . . . . . . . . $815,782 $574,440 $97,361 $1,487,583
Year Ended December 31, 2018
(Amounts in thousands) Park Admissions
Park Food,Merchandise
and Other
Sponsorship,International
Agreements andAccommodations Consolidated
Long-term contracts . . . . . . . . . . . . . . . . . . . . . . . . . . . $115,612 $ 25,383 $ 71,589 $ 212,584Short-term contracts and other(a) . . . . . . . . . . . . . . . . . 694,452 528,144 28,527 1,251,123
Total revenues . . . . . . . . . . . . . . . . . . . . . . . . . . . . . $810,064 $553,527 $100,116 $1,463,707
Year Ended December 31, 2017
(Amounts in thousands) Park Admissions
Park Food,Merchandise
and Other
Sponsorship,International
Agreements andAccommodations Consolidated
Long-term contracts . . . . . . . . . . . . . . . . . . . . . . . . . . . $109,943 $ 20,498 $57,934 $ 188,375Short-term contracts and other (a) . . . . . . . . . . . . . . . . 631,332 504,084 35,283 1,170,699
Total revenues . . . . . . . . . . . . . . . . . . . . . . . . . . . . . $741,275 $524,582 $93,217 $1,359,074
(a) Other revenues primarily include sales of single-use tickets and short-term transactional sales for which we have the right to invoice.
63
SIX FLAGS ENTERTAINMENT CORPORATIONNotes to Consolidated Financial Statements
Long-term Contracts
Our long-term contracts consist of season passes with customers, sponsorship contracts and international
agreements with third parties. We earn season pass revenue when our customers purchase a season pass for a
fixed fee which entitles the customer to visit our parks, including certain waterparks, throughout the duration of
the parks’ operating season. Current year season passes classified as long-term contracts are sold in the year
preceding the operating season to which they relate. We earn sponsorship revenue from separately-priced
contracts with third parties pursuant to which we sell and advertise the third party’s products within the parks in
exchange for consideration. Advertisements may include, but are not limited to, banners, signs, radio ads,
association with certain events, sponsorship of rides within our parks, and retail promotions. We earn
international agreements revenue pursuant to arrangements in which we assist in the development and
management of Six Flags-branded parks outside of North America. Within our international agreements, we have
identified three distinct performance obligations as brand licensing, project services and management services.
We do not consider revenue recognized for the performance obligations related to our long-form agreements to
be significant, neither individually nor in the aggregate, to any period presented. Refer to Note 2 for additional
information on our accounting for performance obligations in these contracts.
The transaction price for our long-term contracts is explicitly stated within the contracts. Our sponsorship
contracts and international agreements may include estimated variable consideration such as penalties for delay in
performance of contract terms, and certain volume-based discounts and rebates. There were not significant
changes to our estimates of variable consideration. Our brand licensing and management services performance
obligations include royalty payments and management fees, respectively, based on gross sales from Six
Flags-branded parks. We have elected to apply the sales-based royalty exemption to the brand licensing
performance obligation, and accordingly do not estimate revenue attributable to the gross sales-based royalty.
We have also elected to apply the direct allocation exemption to the management services performance obligation
and accordingly do not estimate revenue attributable to the gross sales based management fee.
We recognize season pass revenue in ‘‘Park admissions’’ over the estimated redemption rate as we believe
this appropriately depicts the transfer of service to our customers. We estimate the redemption rate based on
historical experience and other factors and assumptions that we believe to be customary and reasonable.
We review the estimated redemption rate regularly, on an ongoing basis, and revise it as necessary throughout the
year. Amounts received for multi-use admissions in excess of redemptions are recognized in ‘‘Deferred revenue.’’
We recognize sponsorship and international agreements revenue over the term of the agreements, using the
passage of time as a measure of complete satisfaction of the performance obligations in ‘‘Sponsorship,
international agreements and accommodations.’’ Amounts received for unsatisfied sponsorship and international
agreements performance obligations are recognized in ‘‘Deferred revenue.’’ As a result of the adoption of
Topic 606, we recognized an increase to ‘‘Sponsorship, international agreements and accommodations’’ revenue
previously recognized in prior periods of $0.1 million and a decrease of $0.9 million during the years ended
December 31, 2019 and 2018, respectively.
At January 1, 2018, $111.6 million of unearned revenue associated with outstanding long-term contracts was
reported in ‘‘Deferred revenue,’’ and $109.7 million was recognized as revenue for long-term contracts during the
year ended December 31, 2018. As of December 31, 2018, the total unearned amount of revenue for remaining
long-term contract performance obligations was $100.8 million. At January 1, 2019, $100.8 million of unearned
revenue associated with outstanding long-term contracts was reported in ‘‘Deferred revenue,’’ and $161.0 million
was recognized as revenue for long-term contracts during the year ended December 31, 2019. As of
December 31, 2019, the total unearned amount of revenue for remaining long-term contract performance
obligations was $85.1 million. As of December 31, 2019, we expect to recognize estimated revenue for partially
or wholly unsatisfied performance obligations on long-term contracts of approximately $107.0 million in 2020,
$24.1 million in 2021, $23.2 million in 2022 and $5.0 million in 2023 and thereafter.
Short-term Contracts and Other
Our short-term contracts consist primarily of season passes and memberships with customers, certain
sponsorship contracts and international agreements with third parties. We earn revenue from a customer’s
purchase of our season pass and membership products, which entitles the customer to visit our parks, including
64
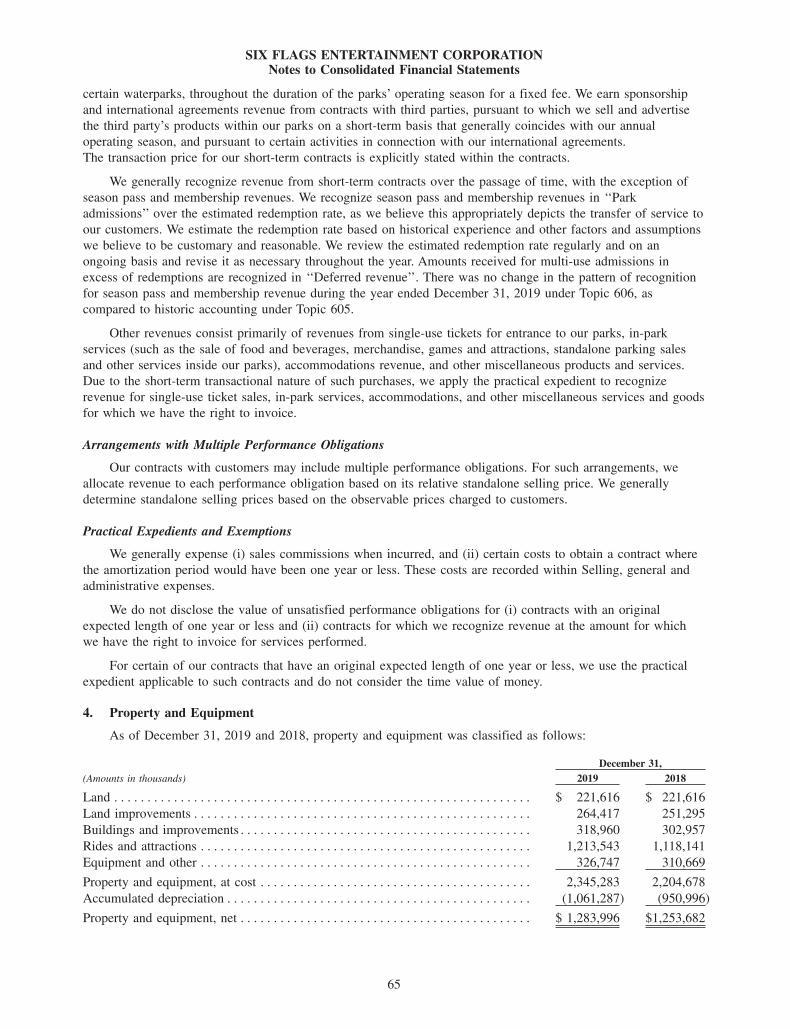
SIX FLAGS ENTERTAINMENT CORPORATIONNotes to Consolidated Financial Statements
certain waterparks, throughout the duration of the parks’ operating season for a fixed fee. We earn sponsorship
and international agreements revenue from contracts with third parties, pursuant to which we sell and advertise
the third party’s products within our parks on a short-term basis that generally coincides with our annual
operating season, and pursuant to certain activities in connection with our international agreements.
The transaction price for our short-term contracts is explicitly stated within the contracts.
We generally recognize revenue from short-term contracts over the passage of time, with the exception of
season pass and membership revenues. We recognize season pass and membership revenues in ‘‘Park
admissions’’ over the estimated redemption rate, as we believe this appropriately depicts the transfer of service to
our customers. We estimate the redemption rate based on historical experience and other factors and assumptions
we believe to be customary and reasonable. We review the estimated redemption rate regularly and on an
ongoing basis and revise it as necessary throughout the year. Amounts received for multi-use admissions in
excess of redemptions are recognized in ‘‘Deferred revenue’’. There was no change in the pattern of recognition
for season pass and membership revenue during the year ended December 31, 2019 under Topic 606, as
compared to historic accounting under Topic 605.
Other revenues consist primarily of revenues from single-use tickets for entrance to our parks, in-park
services (such as the sale of food and beverages, merchandise, games and attractions, standalone parking sales
and other services inside our parks), accommodations revenue, and other miscellaneous products and services.
Due to the short-term transactional nature of such purchases, we apply the practical expedient to recognize
revenue for single-use ticket sales, in-park services, accommodations, and other miscellaneous services and goods
for which we have the right to invoice.
Arrangements with Multiple Performance Obligations
Our contracts with customers may include multiple performance obligations. For such arrangements, we
allocate revenue to each performance obligation based on its relative standalone selling price. We generally
determine standalone selling prices based on the observable prices charged to customers.
Practical Expedients and Exemptions
We generally expense (i) sales commissions when incurred, and (ii) certain costs to obtain a contract where
the amortization period would have been one year or less. These costs are recorded within Selling, general and
administrative expenses.
We do not disclose the value of unsatisfied performance obligations for (i) contracts with an original
expected length of one year or less and (ii) contracts for which we recognize revenue at the amount for which
we have the right to invoice for services performed.
For certain of our contracts that have an original expected length of one year or less, we use the practical
expedient applicable to such contracts and do not consider the time value of money.
4. Property and Equipment
As of December 31, 2019 and 2018, property and equipment was classified as follows:
December 31,
(Amounts in thousands) 2019 2018
Land . . . . . . . . . . . . . . . . . . . . . . . . . . . . . . . . . . . . . . . . . . . . . . . . . . . . . . . . . . . . . . . $ 221,616 $ 221,616
Land improvements . . . . . . . . . . . . . . . . . . . . . . . . . . . . . . . . . . . . . . . . . . . . . . . . . . . 264,417 251,295
Buildings and improvements . . . . . . . . . . . . . . . . . . . . . . . . . . . . . . . . . . . . . . . . . . . . 318,960 302,957
Rides and attractions . . . . . . . . . . . . . . . . . . . . . . . . . . . . . . . . . . . . . . . . . . . . . . . . . . 1,213,543 1,118,141
Equipment and other . . . . . . . . . . . . . . . . . . . . . . . . . . . . . . . . . . . . . . . . . . . . . . . . . . 326,747 310,669
Property and equipment, at cost . . . . . . . . . . . . . . . . . . . . . . . . . . . . . . . . . . . . . . . . . 2,345,283 2,204,678
Accumulated depreciation . . . . . . . . . . . . . . . . . . . . . . . . . . . . . . . . . . . . . . . . . . . . . . (1,061,287) (950,996)
Property and equipment, net . . . . . . . . . . . . . . . . . . . . . . . . . . . . . . . . . . . . . . . . . . . . $ 1,283,996 $1,253,682
65
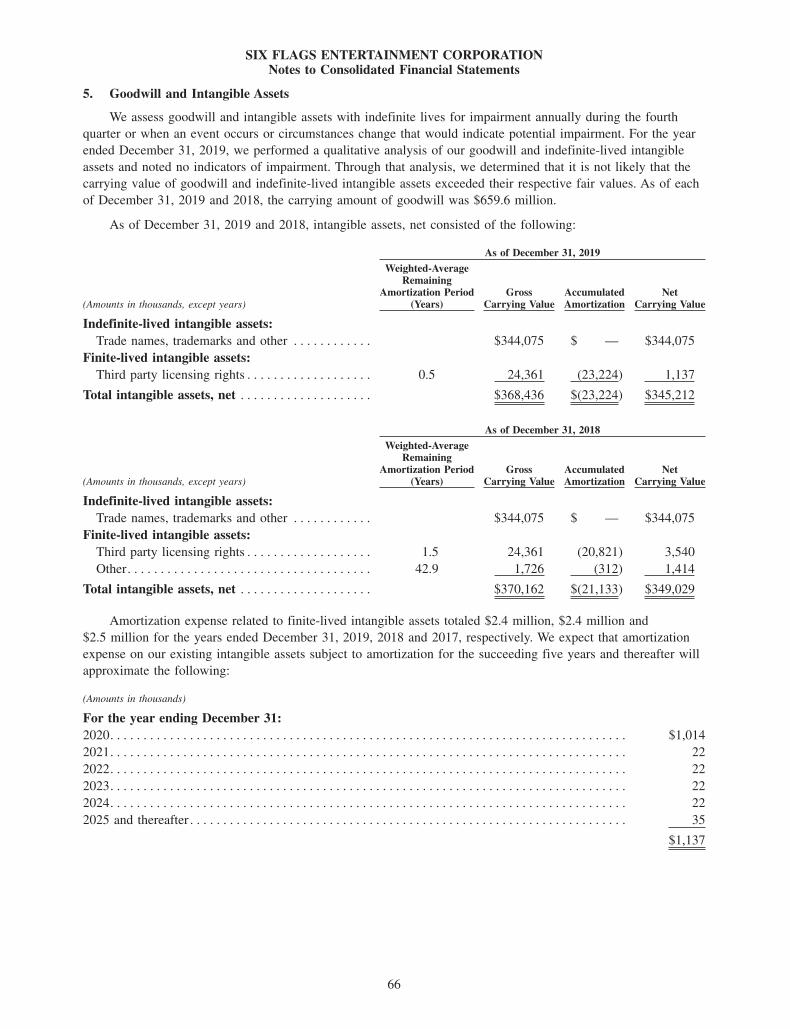
SIX FLAGS ENTERTAINMENT CORPORATIONNotes to Consolidated Financial Statements
5. Goodwill and Intangible Assets
We assess goodwill and intangible assets with indefinite lives for impairment annually during the fourth
quarter or when an event occurs or circumstances change that would indicate potential impairment. For the year
ended December 31, 2019, we performed a qualitative analysis of our goodwill and indefinite-lived intangible
assets and noted no indicators of impairment. Through that analysis, we determined that it is not likely that the
carrying value of goodwill and indefinite-lived intangible assets exceeded their respective fair values. As of each
of December 31, 2019 and 2018, the carrying amount of goodwill was $659.6 million.
As of December 31, 2019 and 2018, intangible assets, net consisted of the following:
As of December 31, 2019
(Amounts in thousands, except years)
Weighted-AverageRemaining
Amortization Period(Years)
GrossCarrying Value
AccumulatedAmortization
NetCarrying Value
Indefinite-lived intangible assets:
Trade names, trademarks and other . . . . . . . . . . . . $344,075 $ — $344,075
Finite-lived intangible assets:
Third party licensing rights . . . . . . . . . . . . . . . . . . . 0.5 24,361 (23,224) 1,137
Total intangible assets, net . . . . . . . . . . . . . . . . . . . . $368,436 $(23,224) $345,212
As of December 31, 2018
(Amounts in thousands, except years)
Weighted-AverageRemaining
Amortization Period(Years)
GrossCarrying Value
AccumulatedAmortization
NetCarrying Value
Indefinite-lived intangible assets:
Trade names, trademarks and other . . . . . . . . . . . . $344,075 $ — $344,075
Finite-lived intangible assets:
Third party licensing rights . . . . . . . . . . . . . . . . . . . 1.5 24,361 (20,821) 3,540
Other. . . . . . . . . . . . . . . . . . . . . . . . . . . . . . . . . . . . . 42.9 1,726 (312) 1,414
Total intangible assets, net . . . . . . . . . . . . . . . . . . . . $370,162 $(21,133) $349,029
Amortization expense related to finite-lived intangible assets totaled $2.4 million, $2.4 million and
$2.5 million for the years ended December 31, 2019, 2018 and 2017, respectively. We expect that amortization
expense on our existing intangible assets subject to amortization for the succeeding five years and thereafter will
approximate the following:
(Amounts in thousands)
For the year ending December 31:
2020. . . . . . . . . . . . . . . . . . . . . . . . . . . . . . . . . . . . . . . . . . . . . . . . . . . . . . . . . . . . . . . . . . . . . . . . . . . . . . $1,014
2021. . . . . . . . . . . . . . . . . . . . . . . . . . . . . . . . . . . . . . . . . . . . . . . . . . . . . . . . . . . . . . . . . . . . . . . . . . . . . . 22
2022. . . . . . . . . . . . . . . . . . . . . . . . . . . . . . . . . . . . . . . . . . . . . . . . . . . . . . . . . . . . . . . . . . . . . . . . . . . . . . 22
2023. . . . . . . . . . . . . . . . . . . . . . . . . . . . . . . . . . . . . . . . . . . . . . . . . . . . . . . . . . . . . . . . . . . . . . . . . . . . . . 22
2024. . . . . . . . . . . . . . . . . . . . . . . . . . . . . . . . . . . . . . . . . . . . . . . . . . . . . . . . . . . . . . . . . . . . . . . . . . . . . . 22
2025 and thereafter . . . . . . . . . . . . . . . . . . . . . . . . . . . . . . . . . . . . . . . . . . . . . . . . . . . . . . . . . . . . . . . . . . 35
$1,137
66
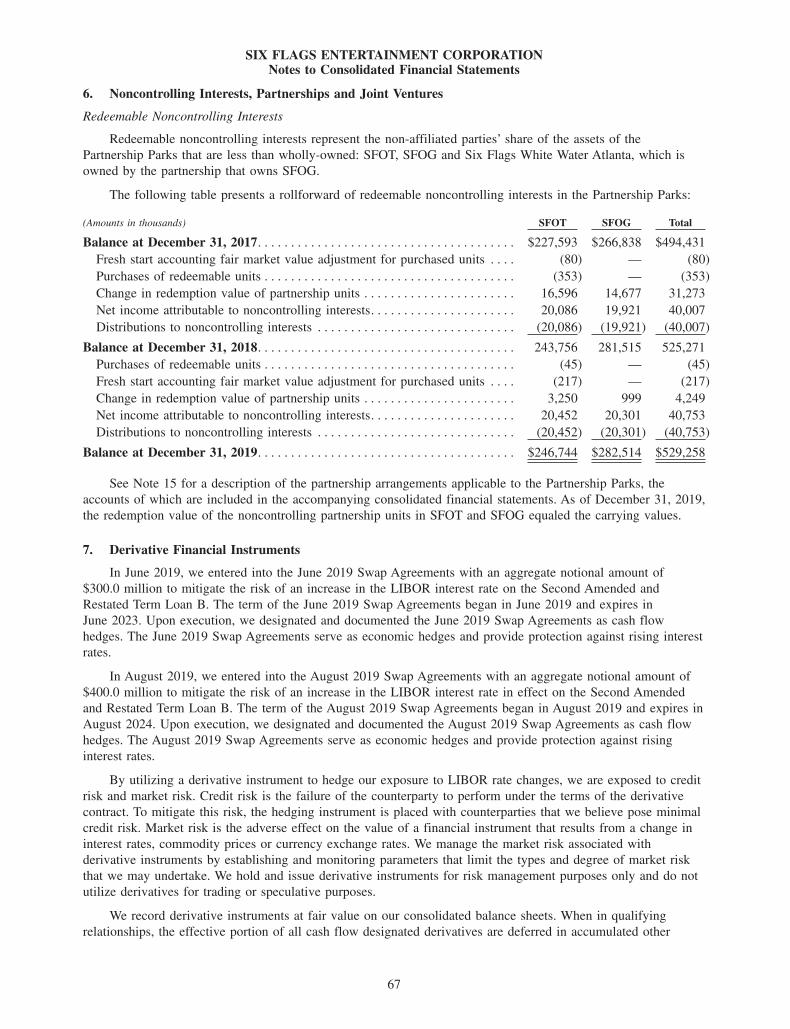
SIX FLAGS ENTERTAINMENT CORPORATIONNotes to Consolidated Financial Statements
6. Noncontrolling Interests, Partnerships and Joint Ventures
Redeemable Noncontrolling Interests
Redeemable noncontrolling interests represent the non-affiliated parties’ share of the assets of the
Partnership Parks that are less than wholly-owned: SFOT, SFOG and Six Flags White Water Atlanta, which is
owned by the partnership that owns SFOG.
The following table presents a rollforward of redeemable noncontrolling interests in the Partnership Parks:
(Amounts in thousands) SFOT SFOG Total
Balance at December 31, 2017. . . . . . . . . . . . . . . . . . . . . . . . . . . . . . . . . . . . . . . $227,593 $266,838 $494,431
Fresh start accounting fair market value adjustment for purchased units . . . . (80) — (80)
Purchases of redeemable units . . . . . . . . . . . . . . . . . . . . . . . . . . . . . . . . . . . . . . (353) — (353)
Change in redemption value of partnership units . . . . . . . . . . . . . . . . . . . . . . . 16,596 14,677 31,273
Net income attributable to noncontrolling interests. . . . . . . . . . . . . . . . . . . . . . 20,086 19,921 40,007
Distributions to noncontrolling interests . . . . . . . . . . . . . . . . . . . . . . . . . . . . . . (20,086) (19,921) (40,007)
Balance at December 31, 2018. . . . . . . . . . . . . . . . . . . . . . . . . . . . . . . . . . . . . . . 243,756 281,515 525,271
Purchases of redeemable units . . . . . . . . . . . . . . . . . . . . . . . . . . . . . . . . . . . . . . (45) — (45)
Fresh start accounting fair market value adjustment for purchased units . . . . (217) — (217)
Change in redemption value of partnership units . . . . . . . . . . . . . . . . . . . . . . . 3,250 999 4,249
Net income attributable to noncontrolling interests. . . . . . . . . . . . . . . . . . . . . . 20,452 20,301 40,753
Distributions to noncontrolling interests . . . . . . . . . . . . . . . . . . . . . . . . . . . . . . (20,452) (20,301) (40,753)
Balance at December 31, 2019. . . . . . . . . . . . . . . . . . . . . . . . . . . . . . . . . . . . . . . $246,744 $282,514 $529,258
See Note 15 for a description of the partnership arrangements applicable to the Partnership Parks, the
accounts of which are included in the accompanying consolidated financial statements. As of December 31, 2019,
the redemption value of the noncontrolling partnership units in SFOT and SFOG equaled the carrying values.
7. Derivative Financial Instruments
In June 2019, we entered into the June 2019 Swap Agreements with an aggregate notional amount of
$300.0 million to mitigate the risk of an increase in the LIBOR interest rate on the Second Amended and
Restated Term Loan B. The term of the June 2019 Swap Agreements began in June 2019 and expires in
June 2023. Upon execution, we designated and documented the June 2019 Swap Agreements as cash flow
hedges. The June 2019 Swap Agreements serve as economic hedges and provide protection against rising interest
rates.
In August 2019, we entered into the August 2019 Swap Agreements with an aggregate notional amount of
$400.0 million to mitigate the risk of an increase in the LIBOR interest rate in effect on the Second Amended
and Restated Term Loan B. The term of the August 2019 Swap Agreements began in August 2019 and expires in
August 2024. Upon execution, we designated and documented the August 2019 Swap Agreements as cash flow
hedges. The August 2019 Swap Agreements serve as economic hedges and provide protection against rising
interest rates.
By utilizing a derivative instrument to hedge our exposure to LIBOR rate changes, we are exposed to credit
risk and market risk. Credit risk is the failure of the counterparty to perform under the terms of the derivative
contract. To mitigate this risk, the hedging instrument is placed with counterparties that we believe pose minimal
credit risk. Market risk is the adverse effect on the value of a financial instrument that results from a change in
interest rates, commodity prices or currency exchange rates. We manage the market risk associated with
derivative instruments by establishing and monitoring parameters that limit the types and degree of market risk
that we may undertake. We hold and issue derivative instruments for risk management purposes only and do not
utilize derivatives for trading or speculative purposes.
We record derivative instruments at fair value on our consolidated balance sheets. When in qualifying
relationships, the effective portion of all cash flow designated derivatives are deferred in accumulated other
67
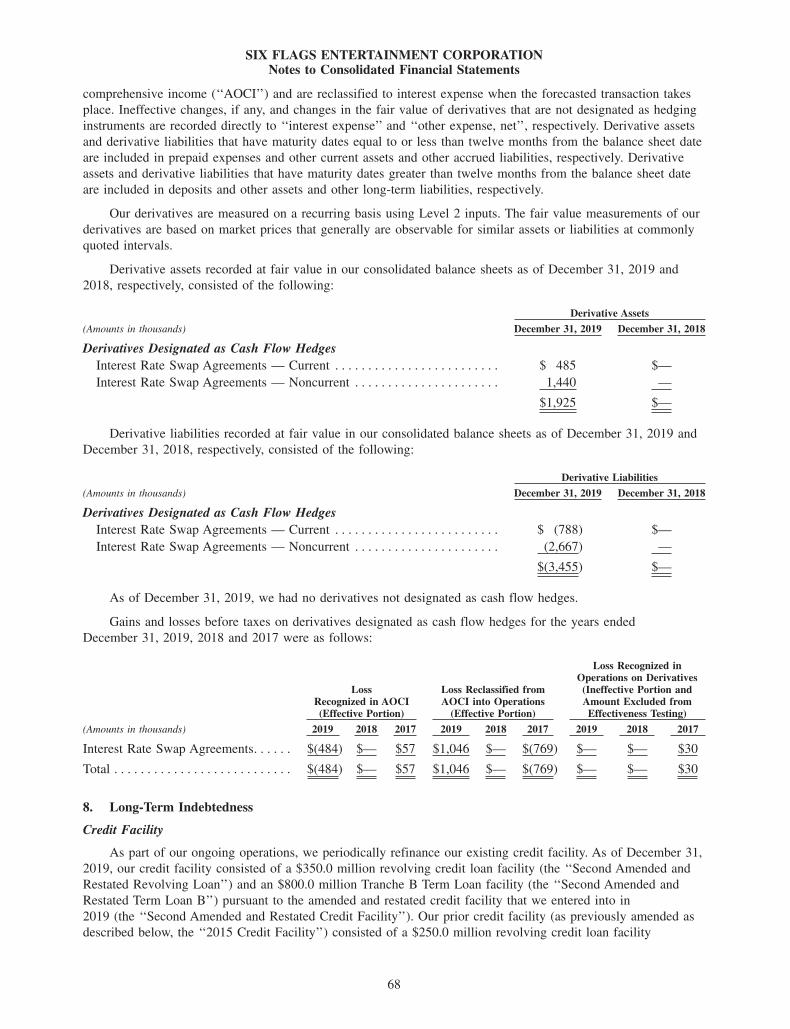
SIX FLAGS ENTERTAINMENT CORPORATIONNotes to Consolidated Financial Statements
comprehensive income (‘‘AOCI’’) and are reclassified to interest expense when the forecasted transaction takes
place. Ineffective changes, if any, and changes in the fair value of derivatives that are not designated as hedging
instruments are recorded directly to ‘‘interest expense’’ and ‘‘other expense, net’’, respectively. Derivative assets
and derivative liabilities that have maturity dates equal to or less than twelve months from the balance sheet date
are included in prepaid expenses and other current assets and other accrued liabilities, respectively. Derivative
assets and derivative liabilities that have maturity dates greater than twelve months from the balance sheet date
are included in deposits and other assets and other long-term liabilities, respectively.
Our derivatives are measured on a recurring basis using Level 2 inputs. The fair value measurements of our
derivatives are based on market prices that generally are observable for similar assets or liabilities at commonly
quoted intervals.
Derivative assets recorded at fair value in our consolidated balance sheets as of December 31, 2019 and
2018, respectively, consisted of the following:
Derivative Assets
(Amounts in thousands) December 31, 2019 December 31, 2018
Derivatives Designated as Cash Flow Hedges
Interest Rate Swap Agreements — Current . . . . . . . . . . . . . . . . . . . . . . . . . $ 485 $—
Interest Rate Swap Agreements — Noncurrent . . . . . . . . . . . . . . . . . . . . . . 1,440 —
$1,925 $—
Derivative liabilities recorded at fair value in our consolidated balance sheets as of December 31, 2019 and
December 31, 2018, respectively, consisted of the following:
Derivative Liabilities
(Amounts in thousands) December 31, 2019 December 31, 2018
Derivatives Designated as Cash Flow Hedges
Interest Rate Swap Agreements — Current . . . . . . . . . . . . . . . . . . . . . . . . . $ (788) $—
Interest Rate Swap Agreements — Noncurrent . . . . . . . . . . . . . . . . . . . . . . (2,667) —
$(3,455) $—
As of December 31, 2019, we had no derivatives not designated as cash flow hedges.
Gains and losses before taxes on derivatives designated as cash flow hedges for the years ended
December 31, 2019, 2018 and 2017 were as follows:
LossRecognized in AOCI(Effective Portion)
Loss Reclassified fromAOCI into Operations
(Effective Portion)
Loss Recognized inOperations on Derivatives
(Ineffective Portion andAmount Excluded fromEffectiveness Testing)
(Amounts in thousands) 2019 2018 2017 2019 2018 2017 2019 2018 2017
Interest Rate Swap Agreements. . . . . . $(484) $— $57 $1,046 $— $(769) $— $— $30
Total . . . . . . . . . . . . . . . . . . . . . . . . . . . $(484) $— $57 $1,046 $— $(769) $— $— $30
8. Long-Term Indebtedness
Credit Facility
As part of our ongoing operations, we periodically refinance our existing credit facility. As of December 31,
2019, our credit facility consisted of a $350.0 million revolving credit loan facility (the ‘‘Second Amended and
Restated Revolving Loan’’) and an $800.0 million Tranche B Term Loan facility (the ‘‘Second Amended and
Restated Term Loan B’’) pursuant to the amended and restated credit facility that we entered into in
2019 (the ‘‘Second Amended and Restated Credit Facility’’). Our prior credit facility (as previously amended as
described below, the ‘‘2015 Credit Facility’’) consisted of a $250.0 million revolving credit loan facility
68
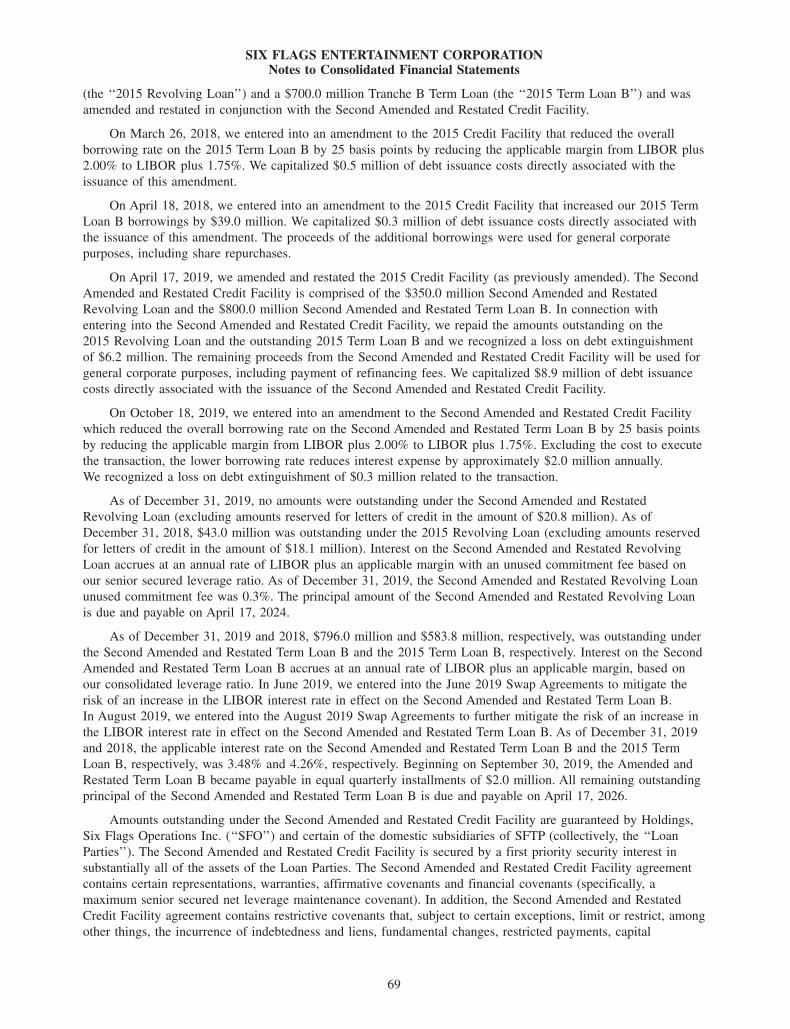
SIX FLAGS ENTERTAINMENT CORPORATIONNotes to Consolidated Financial Statements
(the ‘‘2015 Revolving Loan’’) and a $700.0 million Tranche B Term Loan (the ‘‘2015 Term Loan B’’) and was
amended and restated in conjunction with the Second Amended and Restated Credit Facility.
On March 26, 2018, we entered into an amendment to the 2015 Credit Facility that reduced the overall
borrowing rate on the 2015 Term Loan B by 25 basis points by reducing the applicable margin from LIBOR plus
2.00% to LIBOR plus 1.75%. We capitalized $0.5 million of debt issuance costs directly associated with the
issuance of this amendment.
On April 18, 2018, we entered into an amendment to the 2015 Credit Facility that increased our 2015 Term
Loan B borrowings by $39.0 million. We capitalized $0.3 million of debt issuance costs directly associated with
the issuance of this amendment. The proceeds of the additional borrowings were used for general corporate
purposes, including share repurchases.
On April 17, 2019, we amended and restated the 2015 Credit Facility (as previously amended). The Second
Amended and Restated Credit Facility is comprised of the $350.0 million Second Amended and Restated
Revolving Loan and the $800.0 million Second Amended and Restated Term Loan B. In connection with
entering into the Second Amended and Restated Credit Facility, we repaid the amounts outstanding on the
2015 Revolving Loan and the outstanding 2015 Term Loan B and we recognized a loss on debt extinguishment
of $6.2 million. The remaining proceeds from the Second Amended and Restated Credit Facility will be used for
general corporate purposes, including payment of refinancing fees. We capitalized $8.9 million of debt issuance
costs directly associated with the issuance of the Second Amended and Restated Credit Facility.
On October 18, 2019, we entered into an amendment to the Second Amended and Restated Credit Facility
which reduced the overall borrowing rate on the Second Amended and Restated Term Loan B by 25 basis points
by reducing the applicable margin from LIBOR plus 2.00% to LIBOR plus 1.75%. Excluding the cost to execute
the transaction, the lower borrowing rate reduces interest expense by approximately $2.0 million annually.
We recognized a loss on debt extinguishment of $0.3 million related to the transaction.
As of December 31, 2019, no amounts were outstanding under the Second Amended and Restated
Revolving Loan (excluding amounts reserved for letters of credit in the amount of $20.8 million). As of
December 31, 2018, $43.0 million was outstanding under the 2015 Revolving Loan (excluding amounts reserved
for letters of credit in the amount of $18.1 million). Interest on the Second Amended and Restated Revolving
Loan accrues at an annual rate of LIBOR plus an applicable margin with an unused commitment fee based on
our senior secured leverage ratio. As of December 31, 2019, the Second Amended and Restated Revolving Loan
unused commitment fee was 0.3%. The principal amount of the Second Amended and Restated Revolving Loan
is due and payable on April 17, 2024.
As of December 31, 2019 and 2018, $796.0 million and $583.8 million, respectively, was outstanding under
the Second Amended and Restated Term Loan B and the 2015 Term Loan B, respectively. Interest on the Second
Amended and Restated Term Loan B accrues at an annual rate of LIBOR plus an applicable margin, based on
our consolidated leverage ratio. In June 2019, we entered into the June 2019 Swap Agreements to mitigate the
risk of an increase in the LIBOR interest rate in effect on the Second Amended and Restated Term Loan B.
In August 2019, we entered into the August 2019 Swap Agreements to further mitigate the risk of an increase in
the LIBOR interest rate in effect on the Second Amended and Restated Term Loan B. As of December 31, 2019
and 2018, the applicable interest rate on the Second Amended and Restated Term Loan B and the 2015 Term
Loan B, respectively, was 3.48% and 4.26%, respectively. Beginning on September 30, 2019, the Amended and
Restated Term Loan B became payable in equal quarterly installments of $2.0 million. All remaining outstanding
principal of the Second Amended and Restated Term Loan B is due and payable on April 17, 2026.
Amounts outstanding under the Second Amended and Restated Credit Facility are guaranteed by Holdings,
Six Flags Operations Inc. (‘‘SFO’’) and certain of the domestic subsidiaries of SFTP (collectively, the ‘‘Loan
Parties’’). The Second Amended and Restated Credit Facility is secured by a first priority security interest in
substantially all of the assets of the Loan Parties. The Second Amended and Restated Credit Facility agreement
contains certain representations, warranties, affirmative covenants and financial covenants (specifically, a
maximum senior secured net leverage maintenance covenant). In addition, the Second Amended and Restated
Credit Facility agreement contains restrictive covenants that, subject to certain exceptions, limit or restrict, among
other things, the incurrence of indebtedness and liens, fundamental changes, restricted payments, capital
69
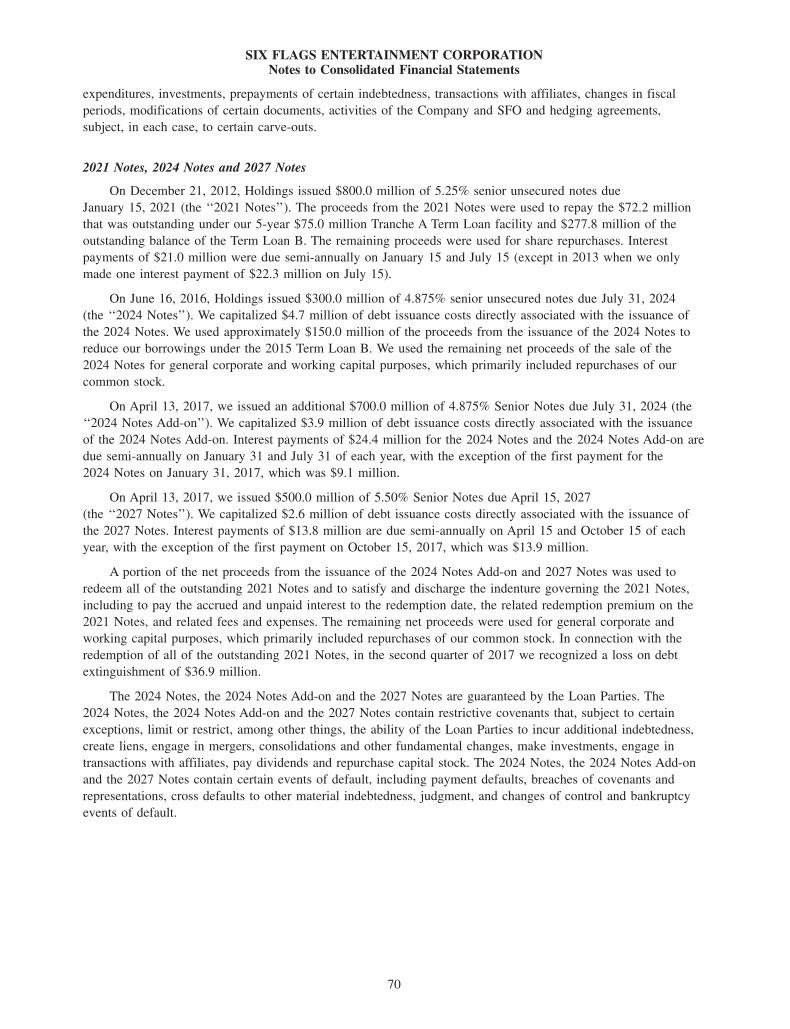
SIX FLAGS ENTERTAINMENT CORPORATIONNotes to Consolidated Financial Statements
expenditures, investments, prepayments of certain indebtedness, transactions with affiliates, changes in fiscal
periods, modifications of certain documents, activities of the Company and SFO and hedging agreements,
subject, in each case, to certain carve-outs.
2021 Notes, 2024 Notes and 2027 Notes
On December 21, 2012, Holdings issued $800.0 million of 5.25% senior unsecured notes due
January 15, 2021 (the ‘‘2021 Notes’’). The proceeds from the 2021 Notes were used to repay the $72.2 million
that was outstanding under our 5-year $75.0 million Tranche A Term Loan facility and $277.8 million of the
outstanding balance of the Term Loan B. The remaining proceeds were used for share repurchases. Interest
payments of $21.0 million were due semi-annually on January 15 and July 15 (except in 2013 when we only
made one interest payment of $22.3 million on July 15).
On June 16, 2016, Holdings issued $300.0 million of 4.875% senior unsecured notes due July 31, 2024
(the ‘‘2024 Notes’’). We capitalized $4.7 million of debt issuance costs directly associated with the issuance of
the 2024 Notes. We used approximately $150.0 million of the proceeds from the issuance of the 2024 Notes to
reduce our borrowings under the 2015 Term Loan B. We used the remaining net proceeds of the sale of the
2024 Notes for general corporate and working capital purposes, which primarily included repurchases of our
common stock.
On April 13, 2017, we issued an additional $700.0 million of 4.875% Senior Notes due July 31, 2024 (the
‘‘2024 Notes Add-on’’). We capitalized $3.9 million of debt issuance costs directly associated with the issuance
of the 2024 Notes Add-on. Interest payments of $24.4 million for the 2024 Notes and the 2024 Notes Add-on are
due semi-annually on January 31 and July 31 of each year, with the exception of the first payment for the
2024 Notes on January 31, 2017, which was $9.1 million.
On April 13, 2017, we issued $500.0 million of 5.50% Senior Notes due April 15, 2027
(the ‘‘2027 Notes’’). We capitalized $2.6 million of debt issuance costs directly associated with the issuance of
the 2027 Notes. Interest payments of $13.8 million are due semi-annually on April 15 and October 15 of each
year, with the exception of the first payment on October 15, 2017, which was $13.9 million.
A portion of the net proceeds from the issuance of the 2024 Notes Add-on and 2027 Notes was used to
redeem all of the outstanding 2021 Notes and to satisfy and discharge the indenture governing the 2021 Notes,
including to pay the accrued and unpaid interest to the redemption date, the related redemption premium on the
2021 Notes, and related fees and expenses. The remaining net proceeds were used for general corporate and
working capital purposes, which primarily included repurchases of our common stock. In connection with the
redemption of all of the outstanding 2021 Notes, in the second quarter of 2017 we recognized a loss on debt
extinguishment of $36.9 million.
The 2024 Notes, the 2024 Notes Add-on and the 2027 Notes are guaranteed by the Loan Parties. The
2024 Notes, the 2024 Notes Add-on and the 2027 Notes contain restrictive covenants that, subject to certain
exceptions, limit or restrict, among other things, the ability of the Loan Parties to incur additional indebtedness,
create liens, engage in mergers, consolidations and other fundamental changes, make investments, engage in
transactions with affiliates, pay dividends and repurchase capital stock. The 2024 Notes, the 2024 Notes Add-on
and the 2027 Notes contain certain events of default, including payment defaults, breaches of covenants and
representations, cross defaults to other material indebtedness, judgment, and changes of control and bankruptcy
events of default.
70
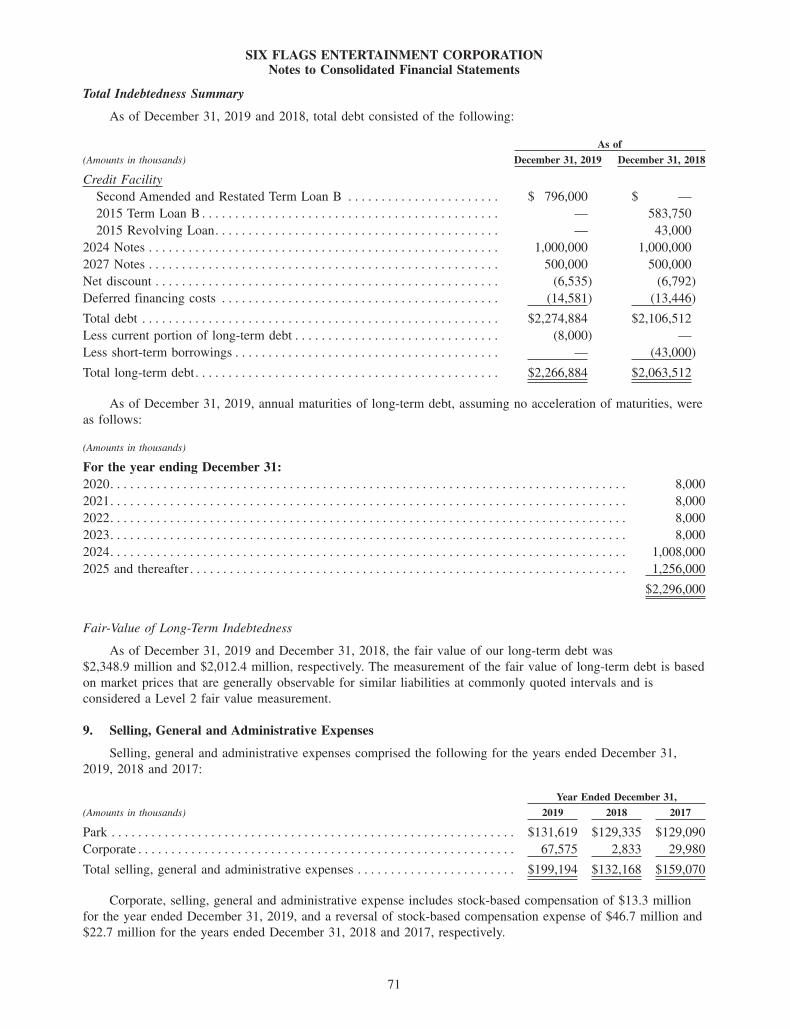
SIX FLAGS ENTERTAINMENT CORPORATIONNotes to Consolidated Financial Statements
Total Indebtedness Summary
As of December 31, 2019 and 2018, total debt consisted of the following:
As of
(Amounts in thousands) December 31, 2019 December 31, 2018
Credit Facility
Second Amended and Restated Term Loan B . . . . . . . . . . . . . . . . . . . . . . . $ 796,000 $ —
2015 Term Loan B . . . . . . . . . . . . . . . . . . . . . . . . . . . . . . . . . . . . . . . . . . . . . — 583,750
2015 Revolving Loan. . . . . . . . . . . . . . . . . . . . . . . . . . . . . . . . . . . . . . . . . . . — 43,000
2024 Notes . . . . . . . . . . . . . . . . . . . . . . . . . . . . . . . . . . . . . . . . . . . . . . . . . . . . . 1,000,000 1,000,000
2027 Notes . . . . . . . . . . . . . . . . . . . . . . . . . . . . . . . . . . . . . . . . . . . . . . . . . . . . . 500,000 500,000
Net discount . . . . . . . . . . . . . . . . . . . . . . . . . . . . . . . . . . . . . . . . . . . . . . . . . . . . (6,535) (6,792)
Deferred financing costs . . . . . . . . . . . . . . . . . . . . . . . . . . . . . . . . . . . . . . . . . . (14,581) (13,446)
Total debt . . . . . . . . . . . . . . . . . . . . . . . . . . . . . . . . . . . . . . . . . . . . . . . . . . . . . . $2,274,884 $2,106,512
Less current portion of long-term debt . . . . . . . . . . . . . . . . . . . . . . . . . . . . . . . (8,000) —
Less short-term borrowings . . . . . . . . . . . . . . . . . . . . . . . . . . . . . . . . . . . . . . . . — (43,000)
Total long-term debt. . . . . . . . . . . . . . . . . . . . . . . . . . . . . . . . . . . . . . . . . . . . . . $2,266,884 $2,063,512
As of December 31, 2019, annual maturities of long-term debt, assuming no acceleration of maturities, were
as follows:
(Amounts in thousands)
For the year ending December 31:
2020. . . . . . . . . . . . . . . . . . . . . . . . . . . . . . . . . . . . . . . . . . . . . . . . . . . . . . . . . . . . . . . . . . . . . . . . . . . . . . 8,000
2021. . . . . . . . . . . . . . . . . . . . . . . . . . . . . . . . . . . . . . . . . . . . . . . . . . . . . . . . . . . . . . . . . . . . . . . . . . . . . . 8,000
2022. . . . . . . . . . . . . . . . . . . . . . . . . . . . . . . . . . . . . . . . . . . . . . . . . . . . . . . . . . . . . . . . . . . . . . . . . . . . . . 8,000
2023. . . . . . . . . . . . . . . . . . . . . . . . . . . . . . . . . . . . . . . . . . . . . . . . . . . . . . . . . . . . . . . . . . . . . . . . . . . . . . 8,000
2024. . . . . . . . . . . . . . . . . . . . . . . . . . . . . . . . . . . . . . . . . . . . . . . . . . . . . . . . . . . . . . . . . . . . . . . . . . . . . . 1,008,000
2025 and thereafter . . . . . . . . . . . . . . . . . . . . . . . . . . . . . . . . . . . . . . . . . . . . . . . . . . . . . . . . . . . . . . . . . . 1,256,000
$2,296,000
Fair-Value of Long-Term Indebtedness
As of December 31, 2019 and December 31, 2018, the fair value of our long-term debt was
$2,348.9 million and $2,012.4 million, respectively. The measurement of the fair value of long-term debt is based
on market prices that are generally observable for similar liabilities at commonly quoted intervals and is
considered a Level 2 fair value measurement.
9. Selling, General and Administrative Expenses
Selling, general and administrative expenses comprised the following for the years ended December 31,
2019, 2018 and 2017:
Year Ended December 31,
(Amounts in thousands) 2019 2018 2017
Park . . . . . . . . . . . . . . . . . . . . . . . . . . . . . . . . . . . . . . . . . . . . . . . . . . . . . . . . . . . . . $131,619 $129,335 $129,090
Corporate . . . . . . . . . . . . . . . . . . . . . . . . . . . . . . . . . . . . . . . . . . . . . . . . . . . . . . . . . 67,575 2,833 29,980
Total selling, general and administrative expenses . . . . . . . . . . . . . . . . . . . . . . . . $199,194 $132,168 $159,070
Corporate, selling, general and administrative expense includes stock-based compensation of $13.3 million
for the year ended December 31, 2019, and a reversal of stock-based compensation expense of $46.7 million and
$22.7 million for the years ended December 31, 2018 and 2017, respectively.
71
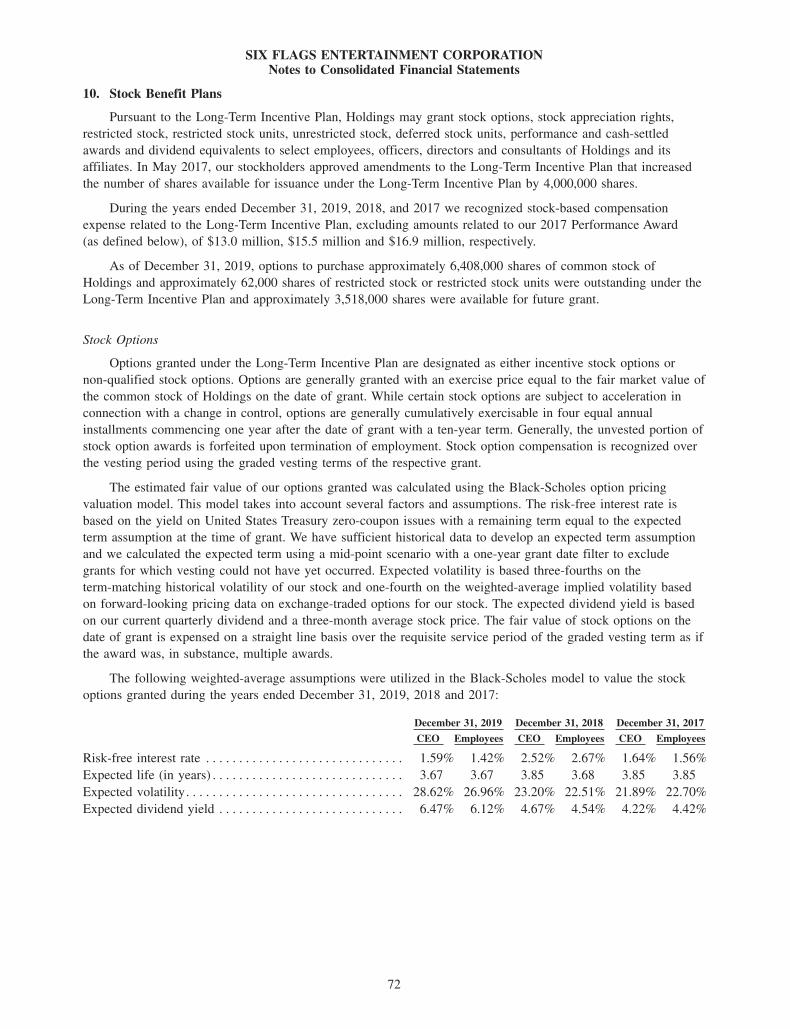
SIX FLAGS ENTERTAINMENT CORPORATIONNotes to Consolidated Financial Statements
10. Stock Benefit Plans
Pursuant to the Long-Term Incentive Plan, Holdings may grant stock options, stock appreciation rights,
restricted stock, restricted stock units, unrestricted stock, deferred stock units, performance and cash-settled
awards and dividend equivalents to select employees, officers, directors and consultants of Holdings and its
affiliates. In May 2017, our stockholders approved amendments to the Long-Term Incentive Plan that increased
the number of shares available for issuance under the Long-Term Incentive Plan by 4,000,000 shares.
During the years ended December 31, 2019, 2018, and 2017 we recognized stock-based compensation
expense related to the Long-Term Incentive Plan, excluding amounts related to our 2017 Performance Award
(as defined below), of $13.0 million, $15.5 million and $16.9 million, respectively.
As of December 31, 2019, options to purchase approximately 6,408,000 shares of common stock of
Holdings and approximately 62,000 shares of restricted stock or restricted stock units were outstanding under the
Long-Term Incentive Plan and approximately 3,518,000 shares were available for future grant.
Stock Options
Options granted under the Long-Term Incentive Plan are designated as either incentive stock options or
non-qualified stock options. Options are generally granted with an exercise price equal to the fair market value of
the common stock of Holdings on the date of grant. While certain stock options are subject to acceleration in
connection with a change in control, options are generally cumulatively exercisable in four equal annual
installments commencing one year after the date of grant with a ten-year term. Generally, the unvested portion of
stock option awards is forfeited upon termination of employment. Stock option compensation is recognized over
the vesting period using the graded vesting terms of the respective grant.
The estimated fair value of our options granted was calculated using the Black-Scholes option pricing
valuation model. This model takes into account several factors and assumptions. The risk-free interest rate is
based on the yield on United States Treasury zero-coupon issues with a remaining term equal to the expected
term assumption at the time of grant. We have sufficient historical data to develop an expected term assumption
and we calculated the expected term using a mid-point scenario with a one-year grant date filter to exclude
grants for which vesting could not have yet occurred. Expected volatility is based three-fourths on the
term-matching historical volatility of our stock and one-fourth on the weighted-average implied volatility based
on forward-looking pricing data on exchange-traded options for our stock. The expected dividend yield is based
on our current quarterly dividend and a three-month average stock price. The fair value of stock options on the
date of grant is expensed on a straight line basis over the requisite service period of the graded vesting term as if
the award was, in substance, multiple awards.
The following weighted-average assumptions were utilized in the Black-Scholes model to value the stock
options granted during the years ended December 31, 2019, 2018 and 2017:
December 31, 2019 December 31, 2018 December 31, 2017
CEO Employees CEO Employees CEO Employees
Risk-free interest rate . . . . . . . . . . . . . . . . . . . . . . . . . . . . . . 1.59% 1.42% 2.52% 2.67% 1.64% 1.56%
Expected life (in years) . . . . . . . . . . . . . . . . . . . . . . . . . . . . . 3.67 3.67 3.85 3.68 3.85 3.85
Expected volatility. . . . . . . . . . . . . . . . . . . . . . . . . . . . . . . . . 28.62% 26.96% 23.20% 22.51% 21.89% 22.70%
Expected dividend yield . . . . . . . . . . . . . . . . . . . . . . . . . . . . 6.47% 6.12% 4.67% 4.54% 4.22% 4.42%
72
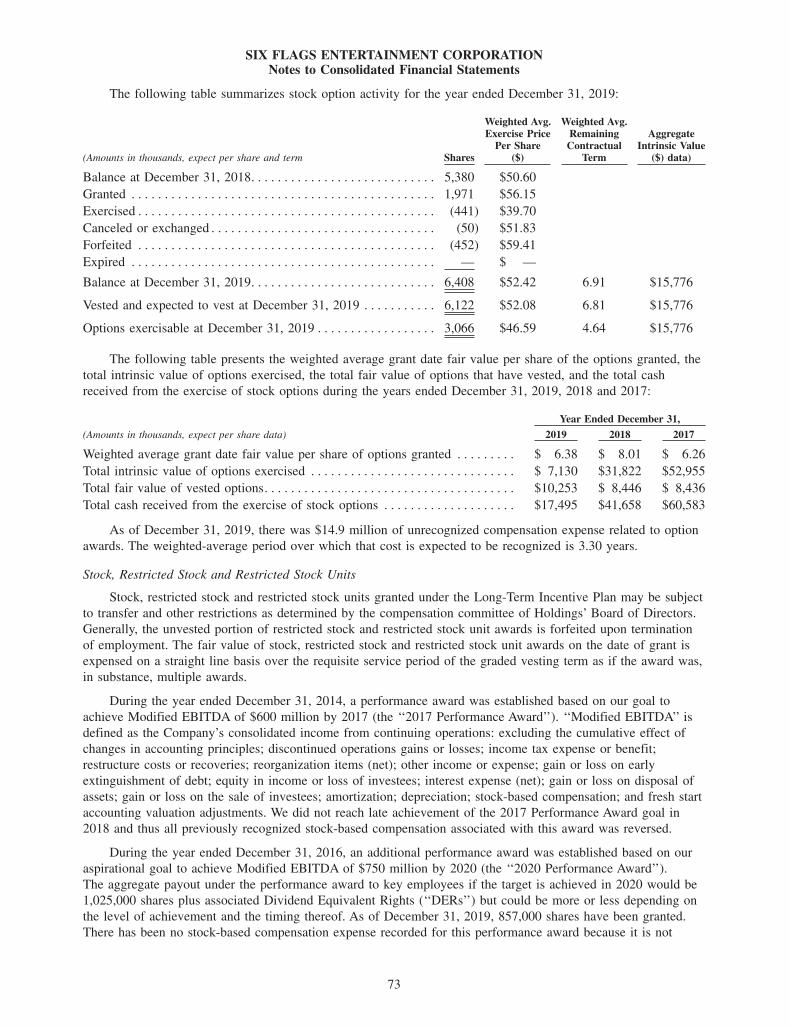
SIX FLAGS ENTERTAINMENT CORPORATIONNotes to Consolidated Financial Statements
The following table summarizes stock option activity for the year ended December 31, 2019:
(Amounts in thousands, expect per share and term Shares
Weighted Avg.Exercise Price
Per Share($)
Weighted Avg.RemainingContractual
Term
AggregateIntrinsic Value
($) data)
Balance at December 31, 2018. . . . . . . . . . . . . . . . . . . . . . . . . . . . 5,380 $50.60
Granted . . . . . . . . . . . . . . . . . . . . . . . . . . . . . . . . . . . . . . . . . . . . . . 1,971 $56.15
Exercised . . . . . . . . . . . . . . . . . . . . . . . . . . . . . . . . . . . . . . . . . . . . . (441) $39.70
Canceled or exchanged . . . . . . . . . . . . . . . . . . . . . . . . . . . . . . . . . . (50) $51.83
Forfeited . . . . . . . . . . . . . . . . . . . . . . . . . . . . . . . . . . . . . . . . . . . . . (452) $59.41
Expired . . . . . . . . . . . . . . . . . . . . . . . . . . . . . . . . . . . . . . . . . . . . . . — $ —
Balance at December 31, 2019. . . . . . . . . . . . . . . . . . . . . . . . . . . . 6,408 $52.42 6.91 $15,776
Vested and expected to vest at December 31, 2019 . . . . . . . . . . . 6,122 $52.08 6.81 $15,776
Options exercisable at December 31, 2019 . . . . . . . . . . . . . . . . . . 3,066 $46.59 4.64 $15,776
The following table presents the weighted average grant date fair value per share of the options granted, the
total intrinsic value of options exercised, the total fair value of options that have vested, and the total cash
received from the exercise of stock options during the years ended December 31, 2019, 2018 and 2017:
Year Ended December 31,
(Amounts in thousands, expect per share data) 2019 2018 2017
Weighted average grant date fair value per share of options granted . . . . . . . . . $ 6.38 $ 8.01 $ 6.26
Total intrinsic value of options exercised . . . . . . . . . . . . . . . . . . . . . . . . . . . . . . . $ 7,130 $31,822 $52,955
Total fair value of vested options. . . . . . . . . . . . . . . . . . . . . . . . . . . . . . . . . . . . . . $10,253 $ 8,446 $ 8,436
Total cash received from the exercise of stock options . . . . . . . . . . . . . . . . . . . . $17,495 $41,658 $60,583
As of December 31, 2019, there was $14.9 million of unrecognized compensation expense related to option
awards. The weighted-average period over which that cost is expected to be recognized is 3.30 years.
Stock, Restricted Stock and Restricted Stock Units
Stock, restricted stock and restricted stock units granted under the Long-Term Incentive Plan may be subject
to transfer and other restrictions as determined by the compensation committee of Holdings’ Board of Directors.
Generally, the unvested portion of restricted stock and restricted stock unit awards is forfeited upon termination
of employment. The fair value of stock, restricted stock and restricted stock unit awards on the date of grant is
expensed on a straight line basis over the requisite service period of the graded vesting term as if the award was,
in substance, multiple awards.
During the year ended December 31, 2014, a performance award was established based on our goal to
achieve Modified EBITDA of $600 million by 2017 (the ‘‘2017 Performance Award’’). ‘‘Modified EBITDA’’ is
defined as the Company’s consolidated income from continuing operations: excluding the cumulative effect of
changes in accounting principles; discontinued operations gains or losses; income tax expense or benefit;
restructure costs or recoveries; reorganization items (net); other income or expense; gain or loss on early
extinguishment of debt; equity in income or loss of investees; interest expense (net); gain or loss on disposal of
assets; gain or loss on the sale of investees; amortization; depreciation; stock-based compensation; and fresh start
accounting valuation adjustments. We did not reach late achievement of the 2017 Performance Award goal in
2018 and thus all previously recognized stock-based compensation associated with this award was reversed.
During the year ended December 31, 2016, an additional performance award was established based on our
aspirational goal to achieve Modified EBITDA of $750 million by 2020 (the ‘‘2020 Performance Award’’).
The aggregate payout under the performance award to key employees if the target is achieved in 2020 would be
1,025,000 shares plus associated Dividend Equivalent Rights (‘‘DERs’’) but could be more or less depending on
the level of achievement and the timing thereof. As of December 31, 2019, 857,000 shares have been granted.
There has been no stock-based compensation expense recorded for this performance award because it is not
73
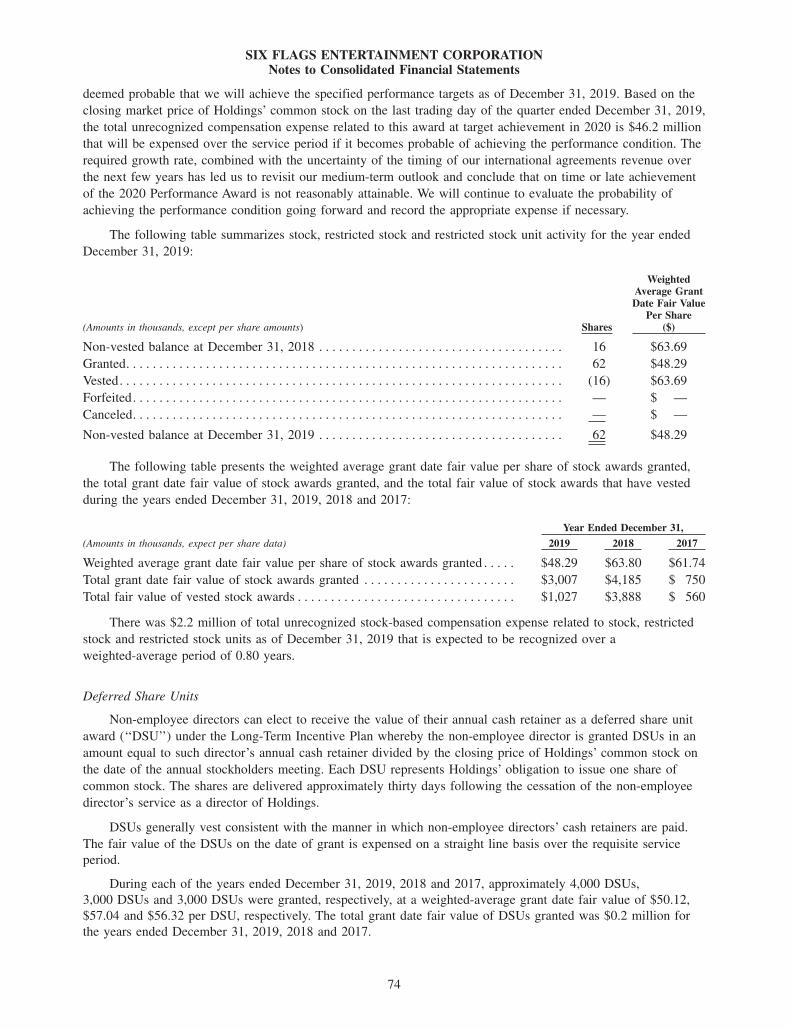
SIX FLAGS ENTERTAINMENT CORPORATIONNotes to Consolidated Financial Statements
deemed probable that we will achieve the specified performance targets as of December 31, 2019. Based on the
closing market price of Holdings’ common stock on the last trading day of the quarter ended December 31, 2019,
the total unrecognized compensation expense related to this award at target achievement in 2020 is $46.2 million
that will be expensed over the service period if it becomes probable of achieving the performance condition. The
required growth rate, combined with the uncertainty of the timing of our international agreements revenue over
the next few years has led us to revisit our medium-term outlook and conclude that on time or late achievement
of the 2020 Performance Award is not reasonably attainable. We will continue to evaluate the probability of
achieving the performance condition going forward and record the appropriate expense if necessary.
The following table summarizes stock, restricted stock and restricted stock unit activity for the year ended
December 31, 2019:
(Amounts in thousands, except per share amounts) Shares
WeightedAverage GrantDate Fair Value
Per Share($)
Non-vested balance at December 31, 2018 . . . . . . . . . . . . . . . . . . . . . . . . . . . . . . . . . . . . . 16 $63.69
Granted. . . . . . . . . . . . . . . . . . . . . . . . . . . . . . . . . . . . . . . . . . . . . . . . . . . . . . . . . . . . . . . . . . 62 $48.29
Vested. . . . . . . . . . . . . . . . . . . . . . . . . . . . . . . . . . . . . . . . . . . . . . . . . . . . . . . . . . . . . . . . . . . (16) $63.69
Forfeited. . . . . . . . . . . . . . . . . . . . . . . . . . . . . . . . . . . . . . . . . . . . . . . . . . . . . . . . . . . . . . . . . — $ —
Canceled. . . . . . . . . . . . . . . . . . . . . . . . . . . . . . . . . . . . . . . . . . . . . . . . . . . . . . . . . . . . . . . . . — $ —
Non-vested balance at December 31, 2019 . . . . . . . . . . . . . . . . . . . . . . . . . . . . . . . . . . . . . 62 $48.29
The following table presents the weighted average grant date fair value per share of stock awards granted,
the total grant date fair value of stock awards granted, and the total fair value of stock awards that have vested
during the years ended December 31, 2019, 2018 and 2017:
Year Ended December 31,
(Amounts in thousands, expect per share data) 2019 2018 2017
Weighted average grant date fair value per share of stock awards granted . . . . . $48.29 $63.80 $61.74
Total grant date fair value of stock awards granted . . . . . . . . . . . . . . . . . . . . . . . $3,007 $4,185 $ 750
Total fair value of vested stock awards . . . . . . . . . . . . . . . . . . . . . . . . . . . . . . . . . $1,027 $3,888 $ 560
There was $2.2 million of total unrecognized stock-based compensation expense related to stock, restricted
stock and restricted stock units as of December 31, 2019 that is expected to be recognized over a
weighted-average period of 0.80 years.
Deferred Share Units
Non-employee directors can elect to receive the value of their annual cash retainer as a deferred share unit
award (‘‘DSU’’) under the Long-Term Incentive Plan whereby the non-employee director is granted DSUs in an
amount equal to such director’s annual cash retainer divided by the closing price of Holdings’ common stock on
the date of the annual stockholders meeting. Each DSU represents Holdings’ obligation to issue one share of
common stock. The shares are delivered approximately thirty days following the cessation of the non-employee
director’s service as a director of Holdings.
DSUs generally vest consistent with the manner in which non-employee directors’ cash retainers are paid.
The fair value of the DSUs on the date of grant is expensed on a straight line basis over the requisite service
period.
During each of the years ended December 31, 2019, 2018 and 2017, approximately 4,000 DSUs,
3,000 DSUs and 3,000 DSUs were granted, respectively, at a weighted-average grant date fair value of $50.12,
$57.04 and $56.32 per DSU, respectively. The total grant date fair value of DSUs granted was $0.2 million for
the years ended December 31, 2019, 2018 and 2017.
74
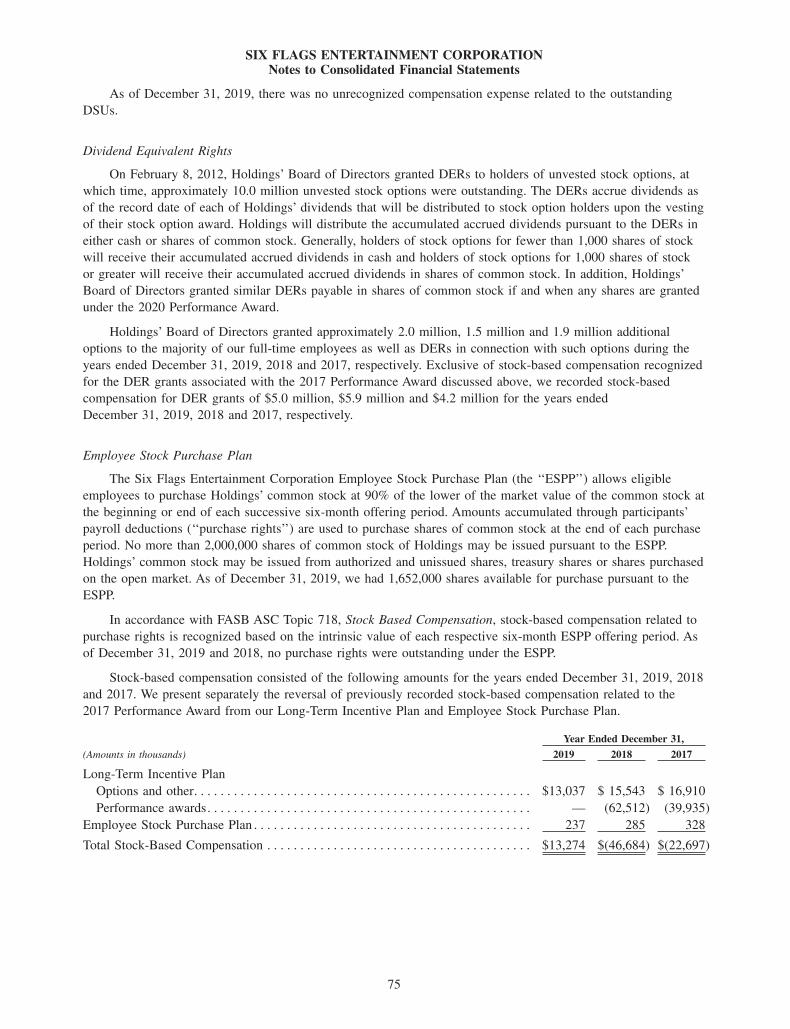
SIX FLAGS ENTERTAINMENT CORPORATIONNotes to Consolidated Financial Statements
As of December 31, 2019, there was no unrecognized compensation expense related to the outstanding
DSUs.
Dividend Equivalent Rights
On February 8, 2012, Holdings’ Board of Directors granted DERs to holders of unvested stock options, at
which time, approximately 10.0 million unvested stock options were outstanding. The DERs accrue dividends as
of the record date of each of Holdings’ dividends that will be distributed to stock option holders upon the vesting
of their stock option award. Holdings will distribute the accumulated accrued dividends pursuant to the DERs in
either cash or shares of common stock. Generally, holders of stock options for fewer than 1,000 shares of stock
will receive their accumulated accrued dividends in cash and holders of stock options for 1,000 shares of stock
or greater will receive their accumulated accrued dividends in shares of common stock. In addition, Holdings’
Board of Directors granted similar DERs payable in shares of common stock if and when any shares are granted
under the 2020 Performance Award.
Holdings’ Board of Directors granted approximately 2.0 million, 1.5 million and 1.9 million additional
options to the majority of our full-time employees as well as DERs in connection with such options during the
years ended December 31, 2019, 2018 and 2017, respectively. Exclusive of stock-based compensation recognized
for the DER grants associated with the 2017 Performance Award discussed above, we recorded stock-based
compensation for DER grants of $5.0 million, $5.9 million and $4.2 million for the years ended
December 31, 2019, 2018 and 2017, respectively.
Employee Stock Purchase Plan
The Six Flags Entertainment Corporation Employee Stock Purchase Plan (the ‘‘ESPP’’) allows eligible
employees to purchase Holdings’ common stock at 90% of the lower of the market value of the common stock at
the beginning or end of each successive six-month offering period. Amounts accumulated through participants’
payroll deductions (‘‘purchase rights’’) are used to purchase shares of common stock at the end of each purchase
period. No more than 2,000,000 shares of common stock of Holdings may be issued pursuant to the ESPP.
Holdings’ common stock may be issued from authorized and unissued shares, treasury shares or shares purchased
on the open market. As of December 31, 2019, we had 1,652,000 shares available for purchase pursuant to the
ESPP.
In accordance with FASB ASC Topic 718, Stock Based Compensation, stock-based compensation related to
purchase rights is recognized based on the intrinsic value of each respective six-month ESPP offering period. As
of December 31, 2019 and 2018, no purchase rights were outstanding under the ESPP.
Stock-based compensation consisted of the following amounts for the years ended December 31, 2019, 2018
and 2017. We present separately the reversal of previously recorded stock-based compensation related to the
2017 Performance Award from our Long-Term Incentive Plan and Employee Stock Purchase Plan.
Year Ended December 31,
(Amounts in thousands) 2019 2018 2017
Long-Term Incentive Plan
Options and other. . . . . . . . . . . . . . . . . . . . . . . . . . . . . . . . . . . . . . . . . . . . . . . . . . . $13,037 $ 15,543 $ 16,910
Performance awards. . . . . . . . . . . . . . . . . . . . . . . . . . . . . . . . . . . . . . . . . . . . . . . . . — (62,512) (39,935)
Employee Stock Purchase Plan . . . . . . . . . . . . . . . . . . . . . . . . . . . . . . . . . . . . . . . . . . 237 285 328
Total Stock-Based Compensation . . . . . . . . . . . . . . . . . . . . . . . . . . . . . . . . . . . . . . . . $13,274 $(46,684) $(22,697)
75
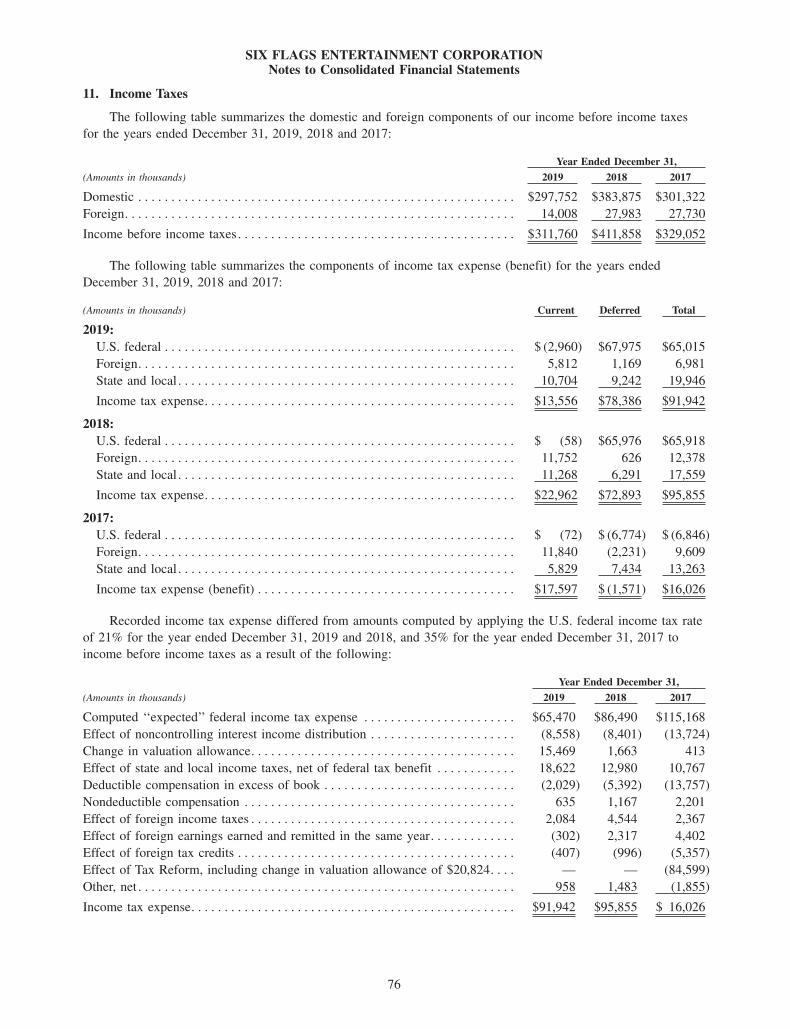
SIX FLAGS ENTERTAINMENT CORPORATIONNotes to Consolidated Financial Statements
11. Income Taxes
The following table summarizes the domestic and foreign components of our income before income taxes
for the years ended December 31, 2019, 2018 and 2017:
Year Ended December 31,
(Amounts in thousands) 2019 2018 2017
Domestic . . . . . . . . . . . . . . . . . . . . . . . . . . . . . . . . . . . . . . . . . . . . . . . . . . . . . . . . . $297,752 $383,875 $301,322
Foreign. . . . . . . . . . . . . . . . . . . . . . . . . . . . . . . . . . . . . . . . . . . . . . . . . . . . . . . . . . . 14,008 27,983 27,730
Income before income taxes. . . . . . . . . . . . . . . . . . . . . . . . . . . . . . . . . . . . . . . . . . $311,760 $411,858 $329,052
The following table summarizes the components of income tax expense (benefit) for the years ended
December 31, 2019, 2018 and 2017:
(Amounts in thousands) Current Deferred Total
2019:
U.S. federal . . . . . . . . . . . . . . . . . . . . . . . . . . . . . . . . . . . . . . . . . . . . . . . . . . . . . $ (2,960) $67,975 $65,015
Foreign. . . . . . . . . . . . . . . . . . . . . . . . . . . . . . . . . . . . . . . . . . . . . . . . . . . . . . . . . 5,812 1,169 6,981
State and local . . . . . . . . . . . . . . . . . . . . . . . . . . . . . . . . . . . . . . . . . . . . . . . . . . . 10,704 9,242 19,946
Income tax expense. . . . . . . . . . . . . . . . . . . . . . . . . . . . . . . . . . . . . . . . . . . . . . . $13,556 $78,386 $91,942
2018:
U.S. federal . . . . . . . . . . . . . . . . . . . . . . . . . . . . . . . . . . . . . . . . . . . . . . . . . . . . . $ (58) $65,976 $65,918
Foreign. . . . . . . . . . . . . . . . . . . . . . . . . . . . . . . . . . . . . . . . . . . . . . . . . . . . . . . . . 11,752 626 12,378
State and local . . . . . . . . . . . . . . . . . . . . . . . . . . . . . . . . . . . . . . . . . . . . . . . . . . . 11,268 6,291 17,559
Income tax expense. . . . . . . . . . . . . . . . . . . . . . . . . . . . . . . . . . . . . . . . . . . . . . . $22,962 $72,893 $95,855
2017:
U.S. federal . . . . . . . . . . . . . . . . . . . . . . . . . . . . . . . . . . . . . . . . . . . . . . . . . . . . . $ (72) $ (6,774) $ (6,846)
Foreign. . . . . . . . . . . . . . . . . . . . . . . . . . . . . . . . . . . . . . . . . . . . . . . . . . . . . . . . . 11,840 (2,231) 9,609
State and local . . . . . . . . . . . . . . . . . . . . . . . . . . . . . . . . . . . . . . . . . . . . . . . . . . . 5,829 7,434 13,263
Income tax expense (benefit) . . . . . . . . . . . . . . . . . . . . . . . . . . . . . . . . . . . . . . . $17,597 $ (1,571) $16,026
Recorded income tax expense differed from amounts computed by applying the U.S. federal income tax rate
of 21% for the year ended December 31, 2019 and 2018, and 35% for the year ended December 31, 2017 to
income before income taxes as a result of the following:
Year Ended December 31,
(Amounts in thousands) 2019 2018 2017
Computed ‘‘expected’’ federal income tax expense . . . . . . . . . . . . . . . . . . . . . . . $65,470 $86,490 $115,168
Effect of noncontrolling interest income distribution . . . . . . . . . . . . . . . . . . . . . . (8,558) (8,401) (13,724)
Change in valuation allowance. . . . . . . . . . . . . . . . . . . . . . . . . . . . . . . . . . . . . . . . 15,469 1,663 413
Effect of state and local income taxes, net of federal tax benefit . . . . . . . . . . . . 18,622 12,980 10,767
Deductible compensation in excess of book . . . . . . . . . . . . . . . . . . . . . . . . . . . . . (2,029) (5,392) (13,757)
Nondeductible compensation . . . . . . . . . . . . . . . . . . . . . . . . . . . . . . . . . . . . . . . . . 635 1,167 2,201
Effect of foreign income taxes . . . . . . . . . . . . . . . . . . . . . . . . . . . . . . . . . . . . . . . . 2,084 4,544 2,367
Effect of foreign earnings earned and remitted in the same year. . . . . . . . . . . . . (302) 2,317 4,402
Effect of foreign tax credits . . . . . . . . . . . . . . . . . . . . . . . . . . . . . . . . . . . . . . . . . . (407) (996) (5,357)
Effect of Tax Reform, including change in valuation allowance of $20,824. . . . — — (84,599)
Other, net . . . . . . . . . . . . . . . . . . . . . . . . . . . . . . . . . . . . . . . . . . . . . . . . . . . . . . . . . 958 1,483 (1,855)
Income tax expense. . . . . . . . . . . . . . . . . . . . . . . . . . . . . . . . . . . . . . . . . . . . . . . . . $91,942 $95,855 $ 16,026
76
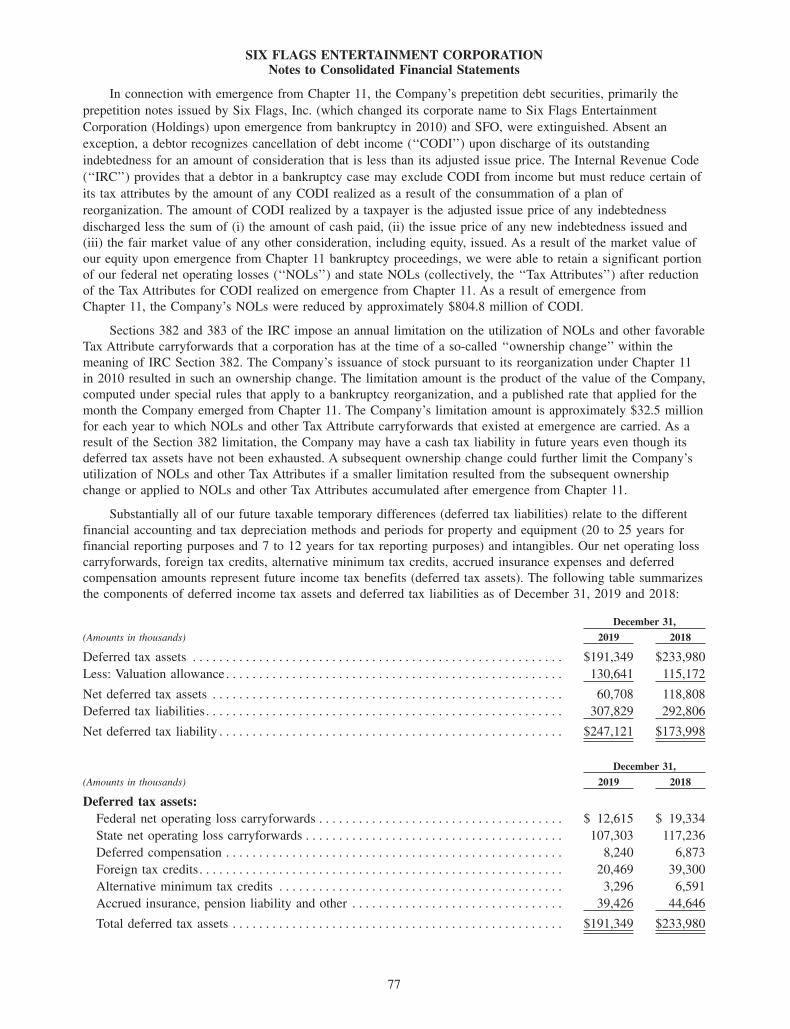
SIX FLAGS ENTERTAINMENT CORPORATIONNotes to Consolidated Financial Statements
In connection with emergence from Chapter 11, the Company’s prepetition debt securities, primarily the
prepetition notes issued by Six Flags, Inc. (which changed its corporate name to Six Flags Entertainment
Corporation (Holdings) upon emergence from bankruptcy in 2010) and SFO, were extinguished. Absent an
exception, a debtor recognizes cancellation of debt income (‘‘CODI’’) upon discharge of its outstanding
indebtedness for an amount of consideration that is less than its adjusted issue price. The Internal Revenue Code
(‘‘IRC’’) provides that a debtor in a bankruptcy case may exclude CODI from income but must reduce certain of
its tax attributes by the amount of any CODI realized as a result of the consummation of a plan of
reorganization. The amount of CODI realized by a taxpayer is the adjusted issue price of any indebtedness
discharged less the sum of (i) the amount of cash paid, (ii) the issue price of any new indebtedness issued and
(iii) the fair market value of any other consideration, including equity, issued. As a result of the market value of
our equity upon emergence from Chapter 11 bankruptcy proceedings, we were able to retain a significant portion
of our federal net operating losses (‘‘NOLs’’) and state NOLs (collectively, the ‘‘Tax Attributes’’) after reduction
of the Tax Attributes for CODI realized on emergence from Chapter 11. As a result of emergence from
Chapter 11, the Company’s NOLs were reduced by approximately $804.8 million of CODI.
Sections 382 and 383 of the IRC impose an annual limitation on the utilization of NOLs and other favorable
Tax Attribute carryforwards that a corporation has at the time of a so-called ‘‘ownership change’’ within the
meaning of IRC Section 382. The Company’s issuance of stock pursuant to its reorganization under Chapter 11
in 2010 resulted in such an ownership change. The limitation amount is the product of the value of the Company,
computed under special rules that apply to a bankruptcy reorganization, and a published rate that applied for the
month the Company emerged from Chapter 11. The Company’s limitation amount is approximately $32.5 million
for each year to which NOLs and other Tax Attribute carryforwards that existed at emergence are carried. As a
result of the Section 382 limitation, the Company may have a cash tax liability in future years even though its
deferred tax assets have not been exhausted. A subsequent ownership change could further limit the Company’s
utilization of NOLs and other Tax Attributes if a smaller limitation resulted from the subsequent ownership
change or applied to NOLs and other Tax Attributes accumulated after emergence from Chapter 11.
Substantially all of our future taxable temporary differences (deferred tax liabilities) relate to the different
financial accounting and tax depreciation methods and periods for property and equipment (20 to 25 years for
financial reporting purposes and 7 to 12 years for tax reporting purposes) and intangibles. Our net operating loss
carryforwards, foreign tax credits, alternative minimum tax credits, accrued insurance expenses and deferred
compensation amounts represent future income tax benefits (deferred tax assets). The following table summarizes
the components of deferred income tax assets and deferred tax liabilities as of December 31, 2019 and 2018:
December 31,
(Amounts in thousands) 2019 2018
Deferred tax assets . . . . . . . . . . . . . . . . . . . . . . . . . . . . . . . . . . . . . . . . . . . . . . . . . . . . . . . . $191,349 $233,980
Less: Valuation allowance. . . . . . . . . . . . . . . . . . . . . . . . . . . . . . . . . . . . . . . . . . . . . . . . . . . 130,641 115,172
Net deferred tax assets . . . . . . . . . . . . . . . . . . . . . . . . . . . . . . . . . . . . . . . . . . . . . . . . . . . . . 60,708 118,808
Deferred tax liabilities. . . . . . . . . . . . . . . . . . . . . . . . . . . . . . . . . . . . . . . . . . . . . . . . . . . . . . 307,829 292,806
Net deferred tax liability . . . . . . . . . . . . . . . . . . . . . . . . . . . . . . . . . . . . . . . . . . . . . . . . . . . . $247,121 $173,998
December 31,
(Amounts in thousands) 2019 2018
Deferred tax assets:
Federal net operating loss carryforwards . . . . . . . . . . . . . . . . . . . . . . . . . . . . . . . . . . . . . $ 12,615 $ 19,334
State net operating loss carryforwards . . . . . . . . . . . . . . . . . . . . . . . . . . . . . . . . . . . . . . . 107,303 117,236
Deferred compensation . . . . . . . . . . . . . . . . . . . . . . . . . . . . . . . . . . . . . . . . . . . . . . . . . . . 8,240 6,873
Foreign tax credits. . . . . . . . . . . . . . . . . . . . . . . . . . . . . . . . . . . . . . . . . . . . . . . . . . . . . . . 20,469 39,300
Alternative minimum tax credits . . . . . . . . . . . . . . . . . . . . . . . . . . . . . . . . . . . . . . . . . . . 3,296 6,591
Accrued insurance, pension liability and other . . . . . . . . . . . . . . . . . . . . . . . . . . . . . . . . 39,426 44,646
Total deferred tax assets . . . . . . . . . . . . . . . . . . . . . . . . . . . . . . . . . . . . . . . . . . . . . . . . . . $191,349 $233,980
77
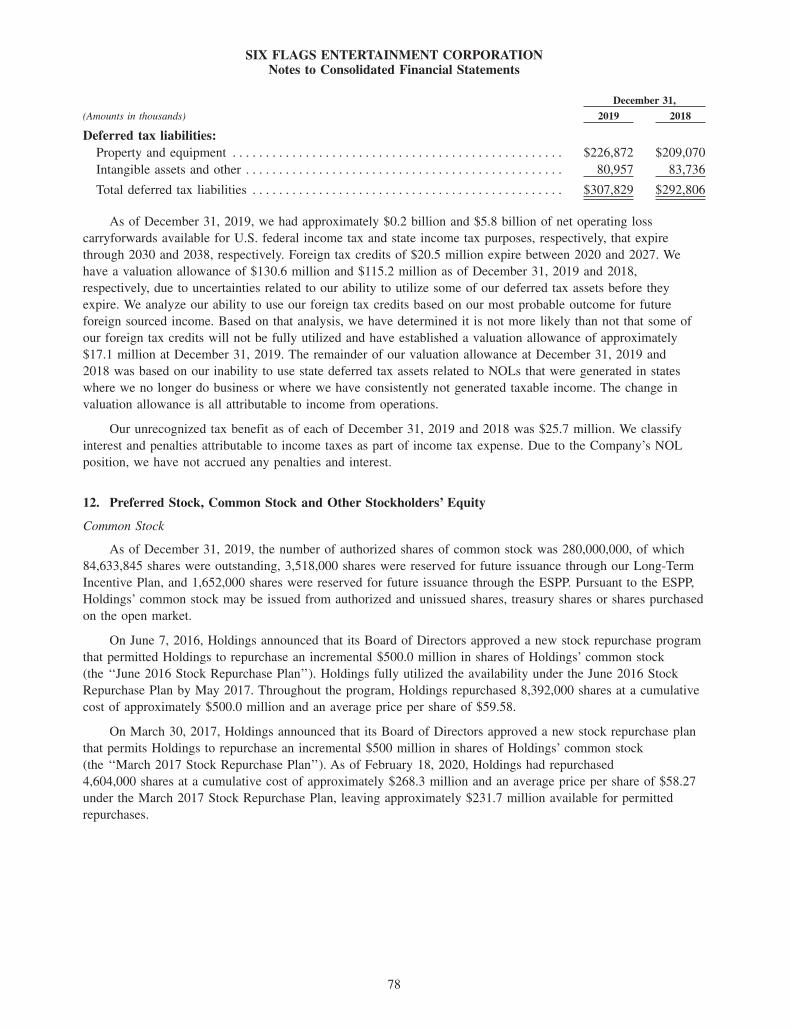
SIX FLAGS ENTERTAINMENT CORPORATIONNotes to Consolidated Financial Statements
December 31,
(Amounts in thousands) 2019 2018
Deferred tax liabilities:
Property and equipment . . . . . . . . . . . . . . . . . . . . . . . . . . . . . . . . . . . . . . . . . . . . . . . . . . $226,872 $209,070
Intangible assets and other . . . . . . . . . . . . . . . . . . . . . . . . . . . . . . . . . . . . . . . . . . . . . . . . 80,957 83,736
Total deferred tax liabilities . . . . . . . . . . . . . . . . . . . . . . . . . . . . . . . . . . . . . . . . . . . . . . . $307,829 $292,806
As of December 31, 2019, we had approximately $0.2 billion and $5.8 billion of net operating loss
carryforwards available for U.S. federal income tax and state income tax purposes, respectively, that expire
through 2030 and 2038, respectively. Foreign tax credits of $20.5 million expire between 2020 and 2027. We
have a valuation allowance of $130.6 million and $115.2 million as of December 31, 2019 and 2018,
respectively, due to uncertainties related to our ability to utilize some of our deferred tax assets before they
expire. We analyze our ability to use our foreign tax credits based on our most probable outcome for future
foreign sourced income. Based on that analysis, we have determined it is not more likely than not that some of
our foreign tax credits will not be fully utilized and have established a valuation allowance of approximately
$17.1 million at December 31, 2019. The remainder of our valuation allowance at December 31, 2019 and
2018 was based on our inability to use state deferred tax assets related to NOLs that were generated in states
where we no longer do business or where we have consistently not generated taxable income. The change in
valuation allowance is all attributable to income from operations.
Our unrecognized tax benefit as of each of December 31, 2019 and 2018 was $25.7 million. We classify
interest and penalties attributable to income taxes as part of income tax expense. Due to the Company’s NOL
position, we have not accrued any penalties and interest.
12. Preferred Stock, Common Stock and Other Stockholders’ Equity
Common Stock
As of December 31, 2019, the number of authorized shares of common stock was 280,000,000, of which
84,633,845 shares were outstanding, 3,518,000 shares were reserved for future issuance through our Long-Term
Incentive Plan, and 1,652,000 shares were reserved for future issuance through the ESPP. Pursuant to the ESPP,
Holdings’ common stock may be issued from authorized and unissued shares, treasury shares or shares purchased
on the open market.
On June 7, 2016, Holdings announced that its Board of Directors approved a new stock repurchase program
that permitted Holdings to repurchase an incremental $500.0 million in shares of Holdings’ common stock
(the ‘‘June 2016 Stock Repurchase Plan’’). Holdings fully utilized the availability under the June 2016 Stock
Repurchase Plan by May 2017. Throughout the program, Holdings repurchased 8,392,000 shares at a cumulative
cost of approximately $500.0 million and an average price per share of $59.58.
On March 30, 2017, Holdings announced that its Board of Directors approved a new stock repurchase plan
that permits Holdings to repurchase an incremental $500 million in shares of Holdings’ common stock
(the ‘‘March 2017 Stock Repurchase Plan’’). As of February 18, 2020, Holdings had repurchased
4,604,000 shares at a cumulative cost of approximately $268.3 million and an average price per share of $58.27
under the March 2017 Stock Repurchase Plan, leaving approximately $231.7 million available for permitted
repurchases.
78
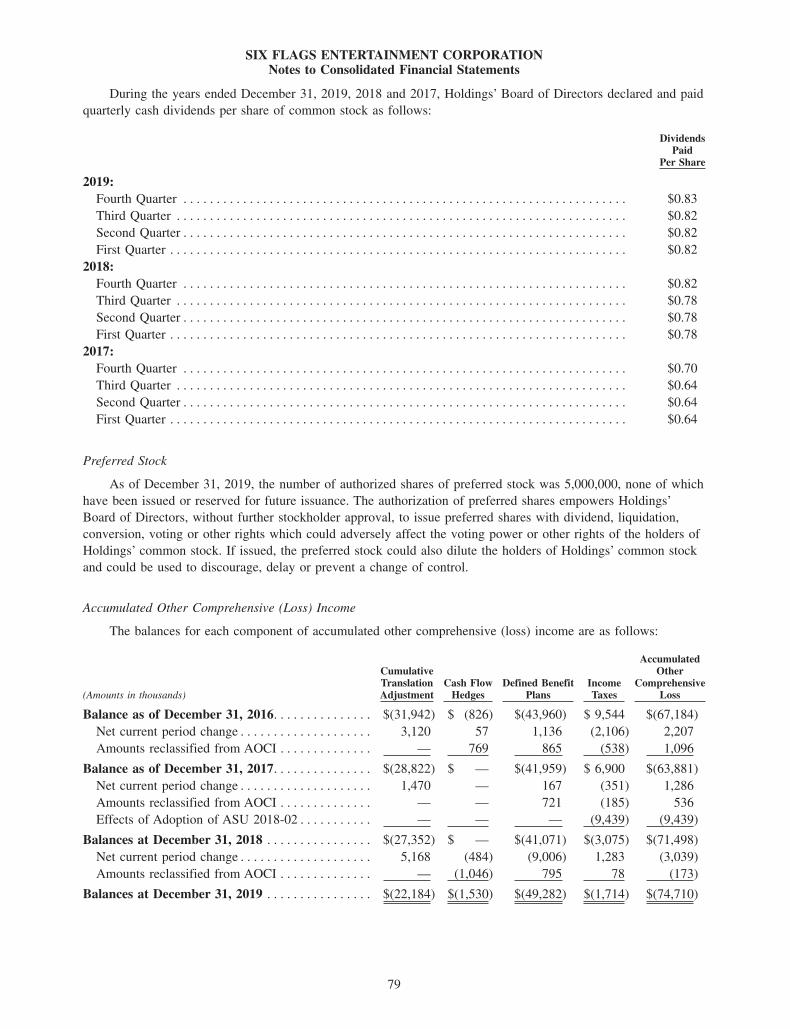
SIX FLAGS ENTERTAINMENT CORPORATIONNotes to Consolidated Financial Statements
During the years ended December 31, 2019, 2018 and 2017, Holdings’ Board of Directors declared and paid
quarterly cash dividends per share of common stock as follows:
DividendsPaid
Per Share
2019:
Fourth Quarter . . . . . . . . . . . . . . . . . . . . . . . . . . . . . . . . . . . . . . . . . . . . . . . . . . . . . . . . . . . . . . . . . . . $0.83
Third Quarter . . . . . . . . . . . . . . . . . . . . . . . . . . . . . . . . . . . . . . . . . . . . . . . . . . . . . . . . . . . . . . . . . . . . $0.82
Second Quarter . . . . . . . . . . . . . . . . . . . . . . . . . . . . . . . . . . . . . . . . . . . . . . . . . . . . . . . . . . . . . . . . . . . $0.82
First Quarter . . . . . . . . . . . . . . . . . . . . . . . . . . . . . . . . . . . . . . . . . . . . . . . . . . . . . . . . . . . . . . . . . . . . . $0.82
2018:
Fourth Quarter . . . . . . . . . . . . . . . . . . . . . . . . . . . . . . . . . . . . . . . . . . . . . . . . . . . . . . . . . . . . . . . . . . . $0.82
Third Quarter . . . . . . . . . . . . . . . . . . . . . . . . . . . . . . . . . . . . . . . . . . . . . . . . . . . . . . . . . . . . . . . . . . . . $0.78
Second Quarter . . . . . . . . . . . . . . . . . . . . . . . . . . . . . . . . . . . . . . . . . . . . . . . . . . . . . . . . . . . . . . . . . . . $0.78
First Quarter . . . . . . . . . . . . . . . . . . . . . . . . . . . . . . . . . . . . . . . . . . . . . . . . . . . . . . . . . . . . . . . . . . . . . $0.78
2017:
Fourth Quarter . . . . . . . . . . . . . . . . . . . . . . . . . . . . . . . . . . . . . . . . . . . . . . . . . . . . . . . . . . . . . . . . . . . $0.70
Third Quarter . . . . . . . . . . . . . . . . . . . . . . . . . . . . . . . . . . . . . . . . . . . . . . . . . . . . . . . . . . . . . . . . . . . . $0.64
Second Quarter . . . . . . . . . . . . . . . . . . . . . . . . . . . . . . . . . . . . . . . . . . . . . . . . . . . . . . . . . . . . . . . . . . . $0.64
First Quarter . . . . . . . . . . . . . . . . . . . . . . . . . . . . . . . . . . . . . . . . . . . . . . . . . . . . . . . . . . . . . . . . . . . . . $0.64
Preferred Stock
As of December 31, 2019, the number of authorized shares of preferred stock was 5,000,000, none of which
have been issued or reserved for future issuance. The authorization of preferred shares empowers Holdings’
Board of Directors, without further stockholder approval, to issue preferred shares with dividend, liquidation,
conversion, voting or other rights which could adversely affect the voting power or other rights of the holders of
Holdings’ common stock. If issued, the preferred stock could also dilute the holders of Holdings’ common stock
and could be used to discourage, delay or prevent a change of control.
Accumulated Other Comprehensive (Loss) Income
The balances for each component of accumulated other comprehensive (loss) income are as follows:
(Amounts in thousands)
CumulativeTranslationAdjustment
Cash FlowHedges
Defined BenefitPlans
IncomeTaxes
AccumulatedOther
ComprehensiveLoss
Balance as of December 31, 2016. . . . . . . . . . . . . . . $(31,942) $ (826) $(43,960) $ 9,544 $(67,184)
Net current period change . . . . . . . . . . . . . . . . . . . . 3,120 57 1,136 (2,106) 2,207
Amounts reclassified from AOCI . . . . . . . . . . . . . . — 769 865 (538) 1,096
Balance as of December 31, 2017. . . . . . . . . . . . . . . $(28,822) $ — $(41,959) $ 6,900 $(63,881)
Net current period change . . . . . . . . . . . . . . . . . . . . 1,470 — 167 (351) 1,286
Amounts reclassified from AOCI . . . . . . . . . . . . . . — — 721 (185) 536
Effects of Adoption of ASU 2018-02 . . . . . . . . . . . — — — (9,439) (9,439)
Balances at December 31, 2018 . . . . . . . . . . . . . . . . $(27,352) $ — $(41,071) $(3,075) $(71,498)
Net current period change . . . . . . . . . . . . . . . . . . . . 5,168 (484) (9,006) 1,283 (3,039)
Amounts reclassified from AOCI . . . . . . . . . . . . . . — (1,046) 795 78 (173)
Balances at December 31, 2019 . . . . . . . . . . . . . . . . $(22,184) $(1,530) $(49,282) $(1,714) $(74,710)
79
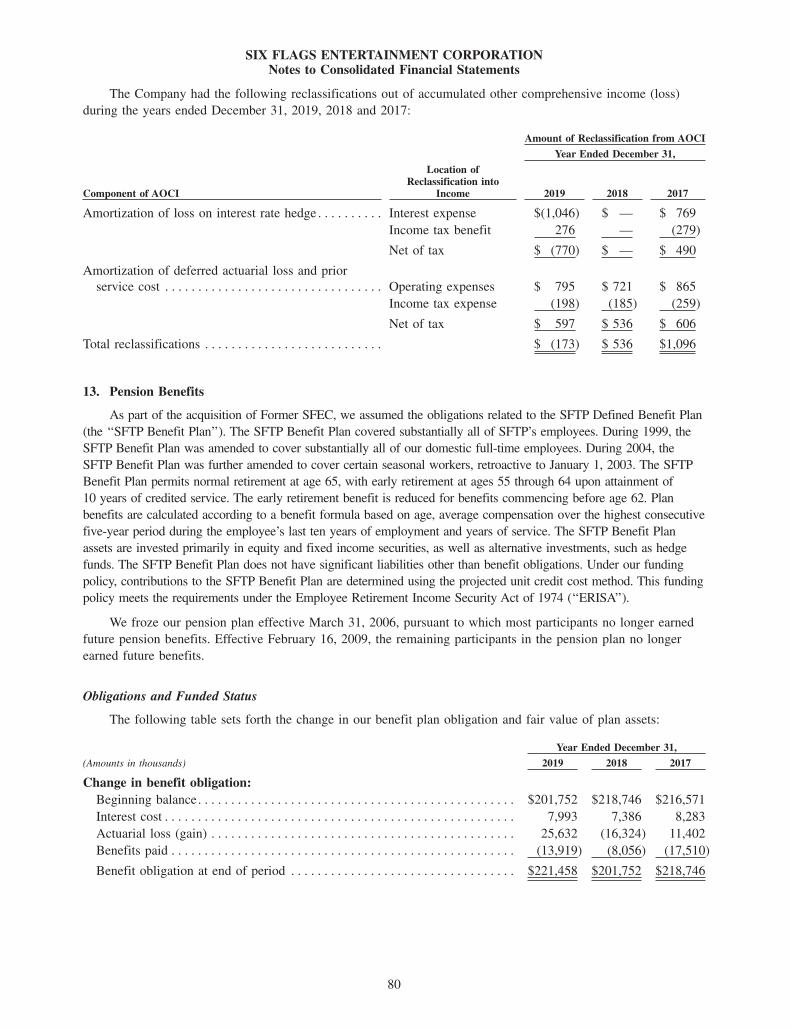
SIX FLAGS ENTERTAINMENT CORPORATIONNotes to Consolidated Financial Statements
The Company had the following reclassifications out of accumulated other comprehensive income (loss)
during the years ended December 31, 2019, 2018 and 2017:
Amount of Reclassification from AOCI
Year Ended December 31,
Component of AOCI
Location ofReclassification into
Income 2019 2018 2017
Amortization of loss on interest rate hedge . . . . . . . . . . Interest expense $(1,046) $ — $ 769
Income tax benefit 276 — (279)
Net of tax $ (770) $ — $ 490
Amortization of deferred actuarial loss and prior
service cost . . . . . . . . . . . . . . . . . . . . . . . . . . . . . . . . . Operating expenses $ 795 $ 721 $ 865
Income tax expense (198) (185) (259)
Net of tax $ 597 $ 536 $ 606
Total reclassifications . . . . . . . . . . . . . . . . . . . . . . . . . . . $ (173) $ 536 $1,096
13. Pension Benefits
As part of the acquisition of Former SFEC, we assumed the obligations related to the SFTP Defined Benefit Plan
(the ‘‘SFTP Benefit Plan’’). The SFTP Benefit Plan covered substantially all of SFTP’s employees. During 1999, the
SFTP Benefit Plan was amended to cover substantially all of our domestic full-time employees. During 2004, the
SFTP Benefit Plan was further amended to cover certain seasonal workers, retroactive to January 1, 2003. The SFTP
Benefit Plan permits normal retirement at age 65, with early retirement at ages 55 through 64 upon attainment of
10 years of credited service. The early retirement benefit is reduced for benefits commencing before age 62. Plan
benefits are calculated according to a benefit formula based on age, average compensation over the highest consecutive
five-year period during the employee’s last ten years of employment and years of service. The SFTP Benefit Plan
assets are invested primarily in equity and fixed income securities, as well as alternative investments, such as hedge
funds. The SFTP Benefit Plan does not have significant liabilities other than benefit obligations. Under our funding
policy, contributions to the SFTP Benefit Plan are determined using the projected unit credit cost method. This funding
policy meets the requirements under the Employee Retirement Income Security Act of 1974 (‘‘ERISA’’).
We froze our pension plan effective March 31, 2006, pursuant to which most participants no longer earned
future pension benefits. Effective February 16, 2009, the remaining participants in the pension plan no longer
earned future benefits.
Obligations and Funded Status
The following table sets forth the change in our benefit plan obligation and fair value of plan assets:
Year Ended December 31,
(Amounts in thousands) 2019 2018 2017
Change in benefit obligation:
Beginning balance. . . . . . . . . . . . . . . . . . . . . . . . . . . . . . . . . . . . . . . . . . . . . . . . $201,752 $218,746 $216,571
Interest cost . . . . . . . . . . . . . . . . . . . . . . . . . . . . . . . . . . . . . . . . . . . . . . . . . . . . . 7,993 7,386 8,283
Actuarial loss (gain) . . . . . . . . . . . . . . . . . . . . . . . . . . . . . . . . . . . . . . . . . . . . . . 25,632 (16,324) 11,402
Benefits paid . . . . . . . . . . . . . . . . . . . . . . . . . . . . . . . . . . . . . . . . . . . . . . . . . . . . (13,919) (8,056) (17,510)
Benefit obligation at end of period . . . . . . . . . . . . . . . . . . . . . . . . . . . . . . . . . . $221,458 $201,752 $218,746
80
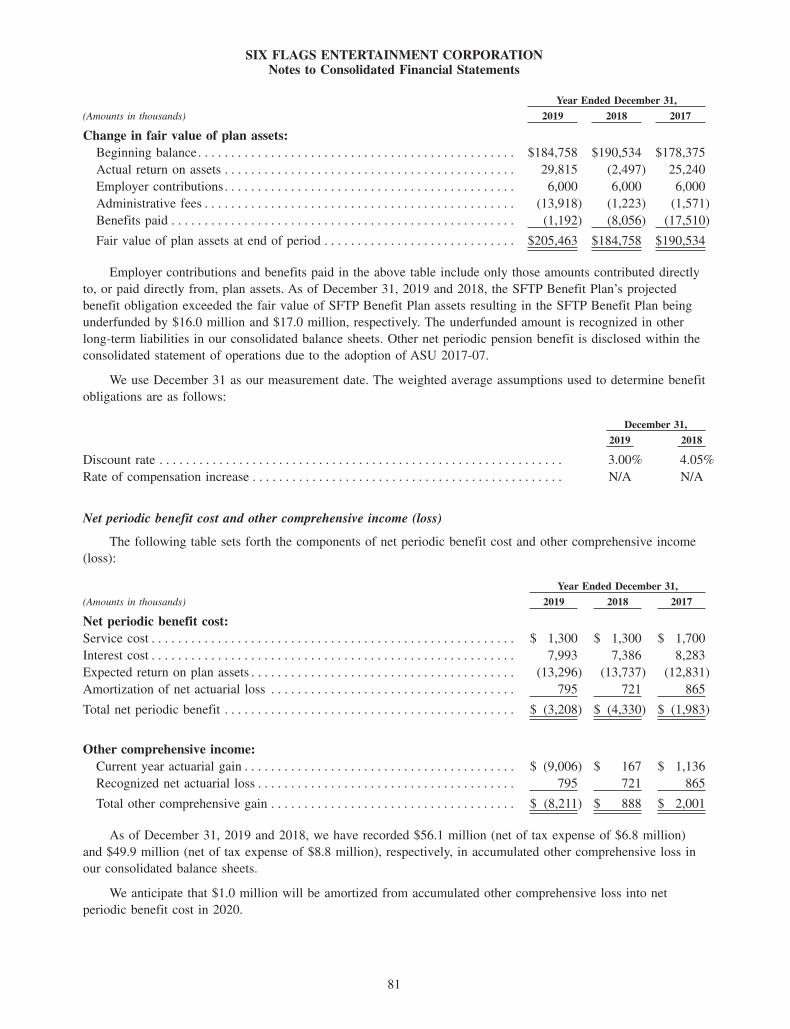
SIX FLAGS ENTERTAINMENT CORPORATIONNotes to Consolidated Financial Statements
Year Ended December 31,
(Amounts in thousands) 2019 2018 2017
Change in fair value of plan assets:
Beginning balance. . . . . . . . . . . . . . . . . . . . . . . . . . . . . . . . . . . . . . . . . . . . . . . . $184,758 $190,534 $178,375
Actual return on assets . . . . . . . . . . . . . . . . . . . . . . . . . . . . . . . . . . . . . . . . . . . . 29,815 (2,497) 25,240
Employer contributions. . . . . . . . . . . . . . . . . . . . . . . . . . . . . . . . . . . . . . . . . . . . 6,000 6,000 6,000
Administrative fees . . . . . . . . . . . . . . . . . . . . . . . . . . . . . . . . . . . . . . . . . . . . . . . (13,918) (1,223) (1,571)
Benefits paid . . . . . . . . . . . . . . . . . . . . . . . . . . . . . . . . . . . . . . . . . . . . . . . . . . . . (1,192) (8,056) (17,510)
Fair value of plan assets at end of period . . . . . . . . . . . . . . . . . . . . . . . . . . . . . $205,463 $184,758 $190,534
Employer contributions and benefits paid in the above table include only those amounts contributed directly
to, or paid directly from, plan assets. As of December 31, 2019 and 2018, the SFTP Benefit Plan’s projected
benefit obligation exceeded the fair value of SFTP Benefit Plan assets resulting in the SFTP Benefit Plan being
underfunded by $16.0 million and $17.0 million, respectively. The underfunded amount is recognized in other
long-term liabilities in our consolidated balance sheets. Other net periodic pension benefit is disclosed within the
consolidated statement of operations due to the adoption of ASU 2017-07.
We use December 31 as our measurement date. The weighted average assumptions used to determine benefit
obligations are as follows:
December 31,
2019 2018
Discount rate . . . . . . . . . . . . . . . . . . . . . . . . . . . . . . . . . . . . . . . . . . . . . . . . . . . . . . . . . . . . . 3.00% 4.05%
Rate of compensation increase . . . . . . . . . . . . . . . . . . . . . . . . . . . . . . . . . . . . . . . . . . . . . . . N/A N/A
Net periodic benefit cost and other comprehensive income (loss)
The following table sets forth the components of net periodic benefit cost and other comprehensive income
(loss):
Year Ended December 31,
(Amounts in thousands) 2019 2018 2017
Net periodic benefit cost:
Service cost . . . . . . . . . . . . . . . . . . . . . . . . . . . . . . . . . . . . . . . . . . . . . . . . . . . . . . . $ 1,300 $ 1,300 $ 1,700
Interest cost . . . . . . . . . . . . . . . . . . . . . . . . . . . . . . . . . . . . . . . . . . . . . . . . . . . . . . . 7,993 7,386 8,283
Expected return on plan assets . . . . . . . . . . . . . . . . . . . . . . . . . . . . . . . . . . . . . . . . (13,296) (13,737) (12,831)
Amortization of net actuarial loss . . . . . . . . . . . . . . . . . . . . . . . . . . . . . . . . . . . . . 795 721 865
Total net periodic benefit . . . . . . . . . . . . . . . . . . . . . . . . . . . . . . . . . . . . . . . . . . . . $ (3,208) $ (4,330) $ (1,983)
Other comprehensive income:
Current year actuarial gain . . . . . . . . . . . . . . . . . . . . . . . . . . . . . . . . . . . . . . . . . $ (9,006) $ 167 $ 1,136
Recognized net actuarial loss . . . . . . . . . . . . . . . . . . . . . . . . . . . . . . . . . . . . . . . 795 721 865
Total other comprehensive gain . . . . . . . . . . . . . . . . . . . . . . . . . . . . . . . . . . . . . $ (8,211) $ 888 $ 2,001
As of December 31, 2019 and 2018, we have recorded $56.1 million (net of tax expense of $6.8 million)
and $49.9 million (net of tax expense of $8.8 million), respectively, in accumulated other comprehensive loss in
our consolidated balance sheets.
We anticipate that $1.0 million will be amortized from accumulated other comprehensive loss into net
periodic benefit cost in 2020.
81
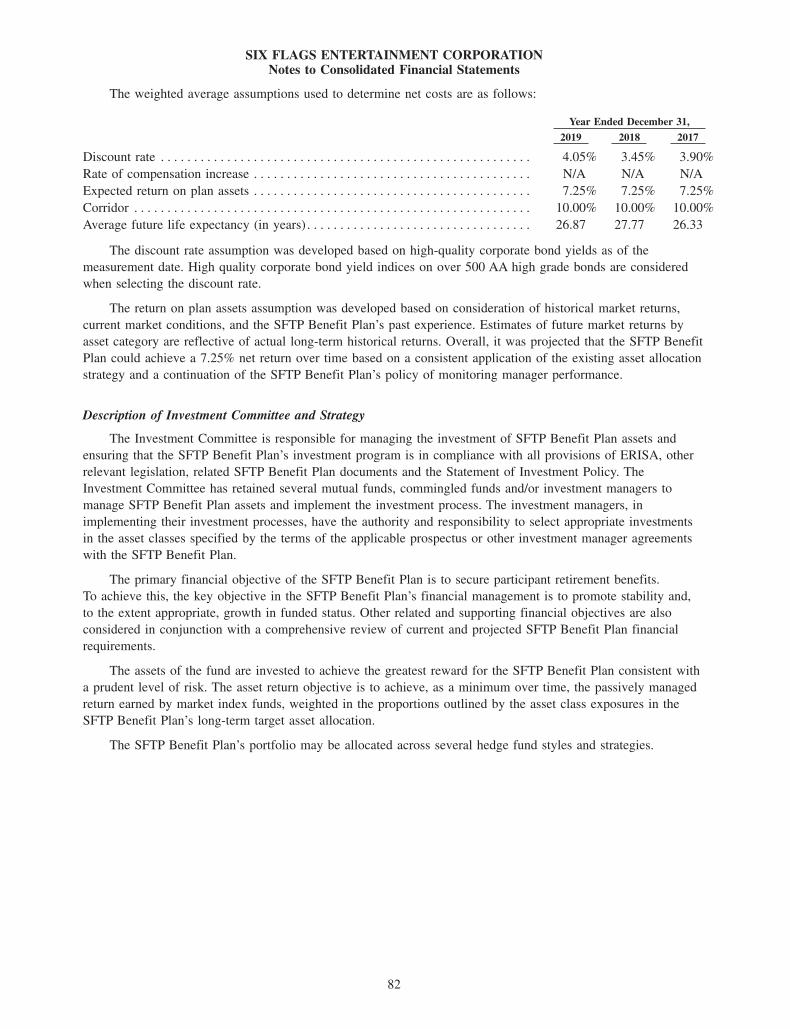
SIX FLAGS ENTERTAINMENT CORPORATIONNotes to Consolidated Financial Statements
The weighted average assumptions used to determine net costs are as follows:
Year Ended December 31,
2019 2018 2017
Discount rate . . . . . . . . . . . . . . . . . . . . . . . . . . . . . . . . . . . . . . . . . . . . . . . . . . . . . . . . 4.05% 3.45% 3.90%
Rate of compensation increase . . . . . . . . . . . . . . . . . . . . . . . . . . . . . . . . . . . . . . . . . . N/A N/A N/A
Expected return on plan assets . . . . . . . . . . . . . . . . . . . . . . . . . . . . . . . . . . . . . . . . . . 7.25% 7.25% 7.25%
Corridor . . . . . . . . . . . . . . . . . . . . . . . . . . . . . . . . . . . . . . . . . . . . . . . . . . . . . . . . . . . . 10.00% 10.00% 10.00%
Average future life expectancy (in years) . . . . . . . . . . . . . . . . . . . . . . . . . . . . . . . . . . 26.87 27.77 26.33
The discount rate assumption was developed based on high-quality corporate bond yields as of the
measurement date. High quality corporate bond yield indices on over 500 AA high grade bonds are considered
when selecting the discount rate.
The return on plan assets assumption was developed based on consideration of historical market returns,
current market conditions, and the SFTP Benefit Plan’s past experience. Estimates of future market returns by
asset category are reflective of actual long-term historical returns. Overall, it was projected that the SFTP Benefit
Plan could achieve a 7.25% net return over time based on a consistent application of the existing asset allocation
strategy and a continuation of the SFTP Benefit Plan’s policy of monitoring manager performance.
Description of Investment Committee and Strategy
The Investment Committee is responsible for managing the investment of SFTP Benefit Plan assets and
ensuring that the SFTP Benefit Plan’s investment program is in compliance with all provisions of ERISA, other
relevant legislation, related SFTP Benefit Plan documents and the Statement of Investment Policy. The
Investment Committee has retained several mutual funds, commingled funds and/or investment managers to
manage SFTP Benefit Plan assets and implement the investment process. The investment managers, in
implementing their investment processes, have the authority and responsibility to select appropriate investments
in the asset classes specified by the terms of the applicable prospectus or other investment manager agreements
with the SFTP Benefit Plan.
The primary financial objective of the SFTP Benefit Plan is to secure participant retirement benefits.
To achieve this, the key objective in the SFTP Benefit Plan’s financial management is to promote stability and,
to the extent appropriate, growth in funded status. Other related and supporting financial objectives are also
considered in conjunction with a comprehensive review of current and projected SFTP Benefit Plan financial
requirements.
The assets of the fund are invested to achieve the greatest reward for the SFTP Benefit Plan consistent with
a prudent level of risk. The asset return objective is to achieve, as a minimum over time, the passively managed
return earned by market index funds, weighted in the proportions outlined by the asset class exposures in the
SFTP Benefit Plan’s long-term target asset allocation.
The SFTP Benefit Plan’s portfolio may be allocated across several hedge fund styles and strategies.
82
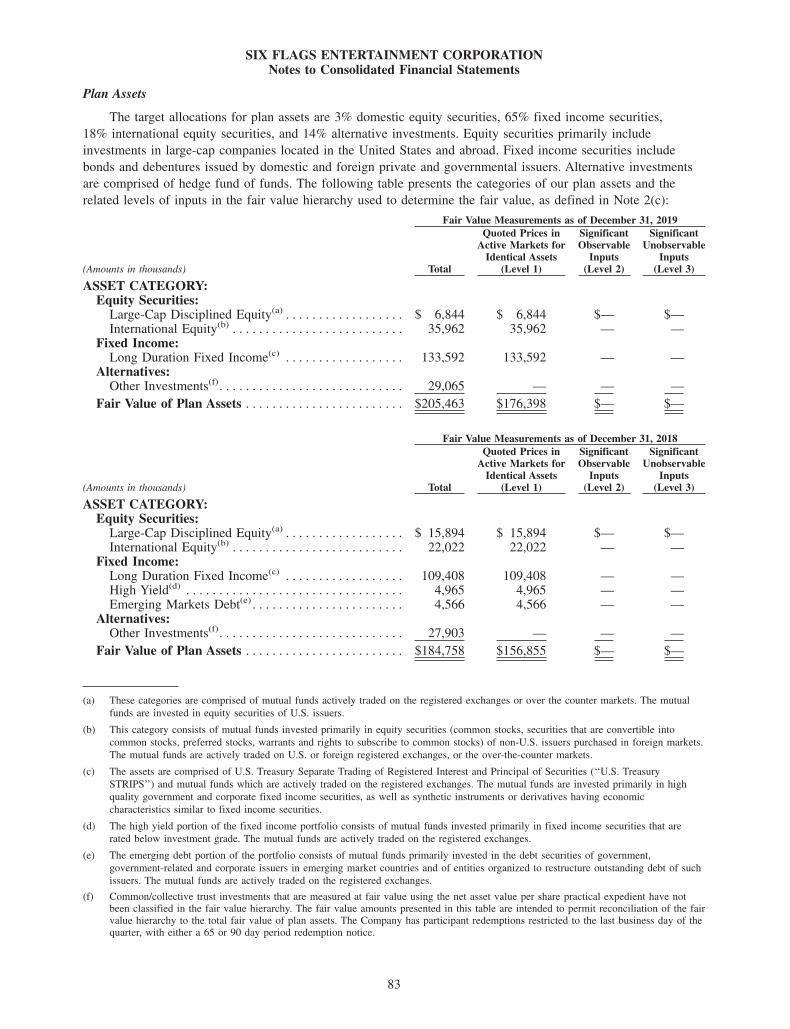
SIX FLAGS ENTERTAINMENT CORPORATIONNotes to Consolidated Financial Statements
Plan Assets
The target allocations for plan assets are 3% domestic equity securities, 65% fixed income securities,
18% international equity securities, and 14% alternative investments. Equity securities primarily include
investments in large-cap companies located in the United States and abroad. Fixed income securities include
bonds and debentures issued by domestic and foreign private and governmental issuers. Alternative investments
are comprised of hedge fund of funds. The following table presents the categories of our plan assets and the
related levels of inputs in the fair value hierarchy used to determine the fair value, as defined in Note 2(c):
Fair Value Measurements as of December 31, 2019
(Amounts in thousands) Total
Quoted Prices inActive Markets for
Identical Assets(Level 1)
SignificantObservable
Inputs(Level 2)
SignificantUnobservable
Inputs(Level 3)
ASSET CATEGORY:Equity Securities:
Large-Cap Disciplined Equity(a) . . . . . . . . . . . . . . . . . . $ 6,844 $ 6,844 $— $—International Equity(b) . . . . . . . . . . . . . . . . . . . . . . . . . . 35,962 35,962 — —
Fixed Income:Long Duration Fixed Income(c) . . . . . . . . . . . . . . . . . . 133,592 133,592 — —
Alternatives:Other Investments(f). . . . . . . . . . . . . . . . . . . . . . . . . . . . 29,065 — — —
Fair Value of Plan Assets . . . . . . . . . . . . . . . . . . . . . . . . $205,463 $176,398 $— $—
Fair Value Measurements as of December 31, 2018
(Amounts in thousands) Total
Quoted Prices inActive Markets for
Identical Assets(Level 1)
SignificantObservable
Inputs(Level 2)
SignificantUnobservable
Inputs(Level 3)
ASSET CATEGORY:Equity Securities:
Large-Cap Disciplined Equity(a) . . . . . . . . . . . . . . . . . . $ 15,894 $ 15,894 $— $—International Equity(b) . . . . . . . . . . . . . . . . . . . . . . . . . . 22,022 22,022 — —
Fixed Income:Long Duration Fixed Income(c) . . . . . . . . . . . . . . . . . . 109,408 109,408 — —High Yield(d) . . . . . . . . . . . . . . . . . . . . . . . . . . . . . . . . . 4,965 4,965 — —Emerging Markets Debt(e) . . . . . . . . . . . . . . . . . . . . . . . 4,566 4,566 — —
Alternatives:Other Investments(f). . . . . . . . . . . . . . . . . . . . . . . . . . . . 27,903 — — —
Fair Value of Plan Assets . . . . . . . . . . . . . . . . . . . . . . . . $184,758 $156,855 $— $—
(a) These categories are comprised of mutual funds actively traded on the registered exchanges or over the counter markets. The mutual
funds are invested in equity securities of U.S. issuers.
(b) This category consists of mutual funds invested primarily in equity securities (common stocks, securities that are convertible into
common stocks, preferred stocks, warrants and rights to subscribe to common stocks) of non-U.S. issuers purchased in foreign markets.
The mutual funds are actively traded on U.S. or foreign registered exchanges, or the over-the-counter markets.
(c) The assets are comprised of U.S. Treasury Separate Trading of Registered Interest and Principal of Securities (‘‘U.S. Treasury
STRIPS’’) and mutual funds which are actively traded on the registered exchanges. The mutual funds are invested primarily in high
quality government and corporate fixed income securities, as well as synthetic instruments or derivatives having economic
characteristics similar to fixed income securities.
(d) The high yield portion of the fixed income portfolio consists of mutual funds invested primarily in fixed income securities that are
rated below investment grade. The mutual funds are actively traded on the registered exchanges.
(e) The emerging debt portion of the portfolio consists of mutual funds primarily invested in the debt securities of government,
government-related and corporate issuers in emerging market countries and of entities organized to restructure outstanding debt of such
issuers. The mutual funds are actively traded on the registered exchanges.
(f) Common/collective trust investments that are measured at fair value using the net asset value per share practical expedient have notbeen classified in the fair value hierarchy. The fair value amounts presented in this table are intended to permit reconciliation of the fairvalue hierarchy to the total fair value of plan assets. The Company has participant redemptions restricted to the last business day of thequarter, with either a 65 or 90 day period redemption notice.
83
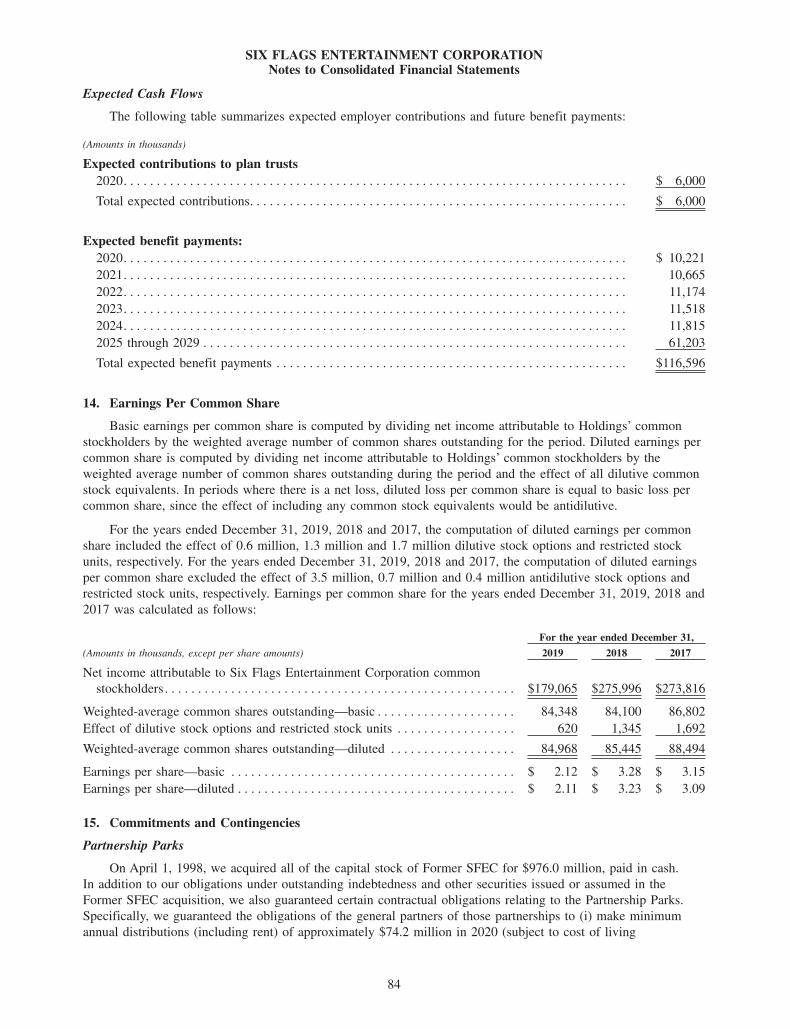
SIX FLAGS ENTERTAINMENT CORPORATIONNotes to Consolidated Financial Statements
Expected Cash Flows
The following table summarizes expected employer contributions and future benefit payments:
(Amounts in thousands)
Expected contributions to plan trusts
2020. . . . . . . . . . . . . . . . . . . . . . . . . . . . . . . . . . . . . . . . . . . . . . . . . . . . . . . . . . . . . . . . . . . . . . . . . . . . $ 6,000
Total expected contributions. . . . . . . . . . . . . . . . . . . . . . . . . . . . . . . . . . . . . . . . . . . . . . . . . . . . . . . . . $ 6,000
Expected benefit payments:
2020. . . . . . . . . . . . . . . . . . . . . . . . . . . . . . . . . . . . . . . . . . . . . . . . . . . . . . . . . . . . . . . . . . . . . . . . . . . . $ 10,221
2021. . . . . . . . . . . . . . . . . . . . . . . . . . . . . . . . . . . . . . . . . . . . . . . . . . . . . . . . . . . . . . . . . . . . . . . . . . . . 10,665
2022. . . . . . . . . . . . . . . . . . . . . . . . . . . . . . . . . . . . . . . . . . . . . . . . . . . . . . . . . . . . . . . . . . . . . . . . . . . . 11,174
2023. . . . . . . . . . . . . . . . . . . . . . . . . . . . . . . . . . . . . . . . . . . . . . . . . . . . . . . . . . . . . . . . . . . . . . . . . . . . 11,518
2024. . . . . . . . . . . . . . . . . . . . . . . . . . . . . . . . . . . . . . . . . . . . . . . . . . . . . . . . . . . . . . . . . . . . . . . . . . . . 11,815
2025 through 2029 . . . . . . . . . . . . . . . . . . . . . . . . . . . . . . . . . . . . . . . . . . . . . . . . . . . . . . . . . . . . . . . . 61,203
Total expected benefit payments . . . . . . . . . . . . . . . . . . . . . . . . . . . . . . . . . . . . . . . . . . . . . . . . . . . . . $116,596
14. Earnings Per Common Share
Basic earnings per common share is computed by dividing net income attributable to Holdings’ common
stockholders by the weighted average number of common shares outstanding for the period. Diluted earnings per
common share is computed by dividing net income attributable to Holdings’ common stockholders by the
weighted average number of common shares outstanding during the period and the effect of all dilutive common
stock equivalents. In periods where there is a net loss, diluted loss per common share is equal to basic loss per
common share, since the effect of including any common stock equivalents would be antidilutive.
For the years ended December 31, 2019, 2018 and 2017, the computation of diluted earnings per common
share included the effect of 0.6 million, 1.3 million and 1.7 million dilutive stock options and restricted stock
units, respectively. For the years ended December 31, 2019, 2018 and 2017, the computation of diluted earnings
per common share excluded the effect of 3.5 million, 0.7 million and 0.4 million antidilutive stock options and
restricted stock units, respectively. Earnings per common share for the years ended December 31, 2019, 2018 and
2017 was calculated as follows:
For the year ended December 31,
(Amounts in thousands, except per share amounts) 2019 2018 2017
Net income attributable to Six Flags Entertainment Corporation common
stockholders . . . . . . . . . . . . . . . . . . . . . . . . . . . . . . . . . . . . . . . . . . . . . . . . . . . . . $179,065 $275,996 $273,816
Weighted-average common shares outstanding—basic . . . . . . . . . . . . . . . . . . . . . 84,348 84,100 86,802
Effect of dilutive stock options and restricted stock units . . . . . . . . . . . . . . . . . . 620 1,345 1,692
Weighted-average common shares outstanding—diluted . . . . . . . . . . . . . . . . . . . 84,968 85,445 88,494
Earnings per share—basic . . . . . . . . . . . . . . . . . . . . . . . . . . . . . . . . . . . . . . . . . . . $ 2.12 $ 3.28 $ 3.15
Earnings per share—diluted . . . . . . . . . . . . . . . . . . . . . . . . . . . . . . . . . . . . . . . . . . $ 2.11 $ 3.23 $ 3.09
15. Commitments and Contingencies
Partnership Parks
On April 1, 1998, we acquired all of the capital stock of Former SFEC for $976.0 million, paid in cash.
In addition to our obligations under outstanding indebtedness and other securities issued or assumed in the
Former SFEC acquisition, we also guaranteed certain contractual obligations relating to the Partnership Parks.
Specifically, we guaranteed the obligations of the general partners of those partnerships to (i) make minimum
annual distributions (including rent) of approximately $74.2 million in 2020 (subject to cost of living
84
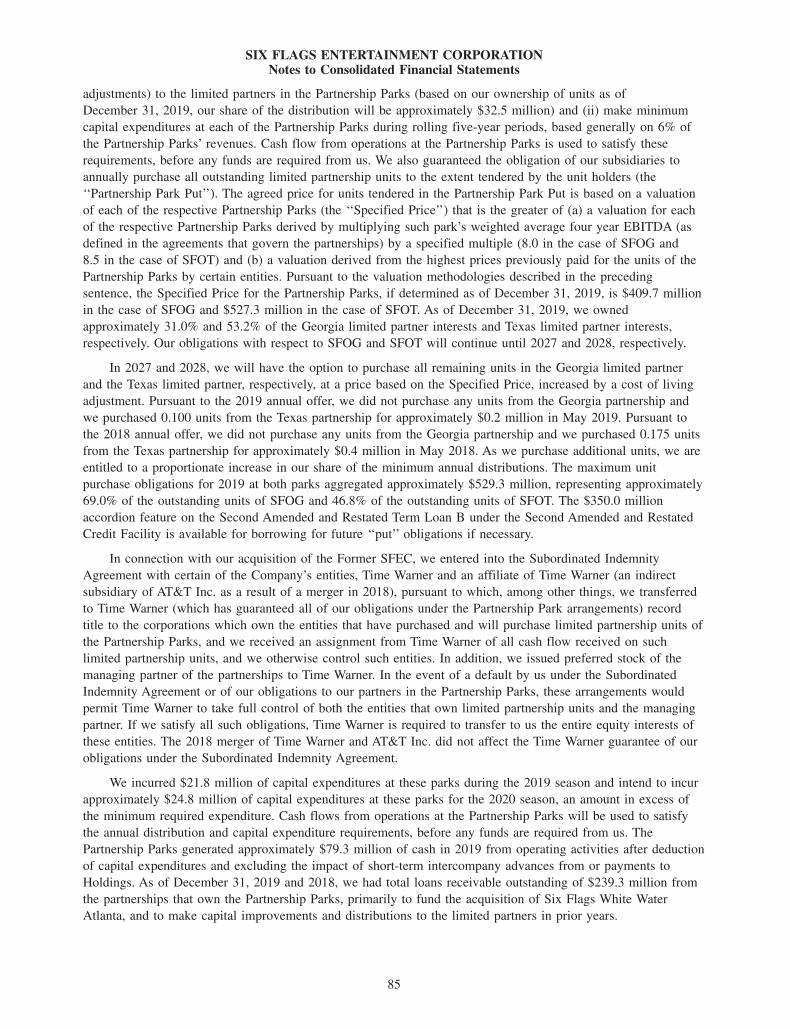
SIX FLAGS ENTERTAINMENT CORPORATIONNotes to Consolidated Financial Statements
adjustments) to the limited partners in the Partnership Parks (based on our ownership of units as of
December 31, 2019, our share of the distribution will be approximately $32.5 million) and (ii) make minimum
capital expenditures at each of the Partnership Parks during rolling five-year periods, based generally on 6% of
the Partnership Parks’ revenues. Cash flow from operations at the Partnership Parks is used to satisfy these
requirements, before any funds are required from us. We also guaranteed the obligation of our subsidiaries to
annually purchase all outstanding limited partnership units to the extent tendered by the unit holders (the
‘‘Partnership Park Put’’). The agreed price for units tendered in the Partnership Park Put is based on a valuation
of each of the respective Partnership Parks (the ‘‘Specified Price’’) that is the greater of (a) a valuation for each
of the respective Partnership Parks derived by multiplying such park’s weighted average four year EBITDA (as
defined in the agreements that govern the partnerships) by a specified multiple (8.0 in the case of SFOG and
8.5 in the case of SFOT) and (b) a valuation derived from the highest prices previously paid for the units of the
Partnership Parks by certain entities. Pursuant to the valuation methodologies described in the preceding
sentence, the Specified Price for the Partnership Parks, if determined as of December 31, 2019, is $409.7 million
in the case of SFOG and $527.3 million in the case of SFOT. As of December 31, 2019, we owned
approximately 31.0% and 53.2% of the Georgia limited partner interests and Texas limited partner interests,
respectively. Our obligations with respect to SFOG and SFOT will continue until 2027 and 2028, respectively.
In 2027 and 2028, we will have the option to purchase all remaining units in the Georgia limited partner
and the Texas limited partner, respectively, at a price based on the Specified Price, increased by a cost of living
adjustment. Pursuant to the 2019 annual offer, we did not purchase any units from the Georgia partnership and
we purchased 0.100 units from the Texas partnership for approximately $0.2 million in May 2019. Pursuant to
the 2018 annual offer, we did not purchase any units from the Georgia partnership and we purchased 0.175 units
from the Texas partnership for approximately $0.4 million in May 2018. As we purchase additional units, we are
entitled to a proportionate increase in our share of the minimum annual distributions. The maximum unit
purchase obligations for 2019 at both parks aggregated approximately $529.3 million, representing approximately
69.0% of the outstanding units of SFOG and 46.8% of the outstanding units of SFOT. The $350.0 million
accordion feature on the Second Amended and Restated Term Loan B under the Second Amended and Restated
Credit Facility is available for borrowing for future ‘‘put’’ obligations if necessary.
In connection with our acquisition of the Former SFEC, we entered into the Subordinated Indemnity
Agreement with certain of the Company’s entities, Time Warner and an affiliate of Time Warner (an indirect
subsidiary of AT&T Inc. as a result of a merger in 2018), pursuant to which, among other things, we transferred
to Time Warner (which has guaranteed all of our obligations under the Partnership Park arrangements) record
title to the corporations which own the entities that have purchased and will purchase limited partnership units of
the Partnership Parks, and we received an assignment from Time Warner of all cash flow received on such
limited partnership units, and we otherwise control such entities. In addition, we issued preferred stock of the
managing partner of the partnerships to Time Warner. In the event of a default by us under the Subordinated
Indemnity Agreement or of our obligations to our partners in the Partnership Parks, these arrangements would
permit Time Warner to take full control of both the entities that own limited partnership units and the managing
partner. If we satisfy all such obligations, Time Warner is required to transfer to us the entire equity interests of
these entities. The 2018 merger of Time Warner and AT&T Inc. did not affect the Time Warner guarantee of our
obligations under the Subordinated Indemnity Agreement.
We incurred $21.8 million of capital expenditures at these parks during the 2019 season and intend to incur
approximately $24.8 million of capital expenditures at these parks for the 2020 season, an amount in excess of
the minimum required expenditure. Cash flows from operations at the Partnership Parks will be used to satisfy
the annual distribution and capital expenditure requirements, before any funds are required from us. The
Partnership Parks generated approximately $79.3 million of cash in 2019 from operating activities after deduction
of capital expenditures and excluding the impact of short-term intercompany advances from or payments to
Holdings. As of December 31, 2019 and 2018, we had total loans receivable outstanding of $239.3 million from
the partnerships that own the Partnership Parks, primarily to fund the acquisition of Six Flags White Water
Atlanta, and to make capital improvements and distributions to the limited partners in prior years.
85
SIX FLAGS ENTERTAINMENT CORPORATIONNotes to Consolidated Financial Statements
License Agreements
We are party to a license agreement pursuant to which we have the exclusive right on a long-term basis to
theme park use in the United States and Canada (excluding the Las Vegas, Nevada metropolitan area) of all
animated, cartoon and comic book characters that Warner Bros. and DC Comics have the right to license for
such use. The term of the agreement expires in 2053. The license fee is subject to periodic scheduled
adjustments, including market resets in 2020 and 2035, and CPI increases, and is payable on a per-theme park
basis.
In November 1999, we entered into license agreements pursuant to which we have the exclusive right on a
long-term basis to parks use in Europe, Central and South America of all animated, cartoon and comic book
characters that Warner Bros. and DC Comics have the right to license for such use. Under such agreements, the
license fee is based on specified percentages of the gross revenues of the applicable parks.
Insurance
We maintain insurance of the types and in amounts that we believe are commercially reasonable and that are
available to businesses in our industry. We maintain multi-layered general liability policies that provide for
excess liability coverage of up to $100.0 million per occurrence. For incidents arising on or after December 31,
2008, our self-insured retention is $2.0 million, followed by a $0.5 million deductible per occurrence applicable
to all claims in the policy year for our domestic parks and our park in Canada and a nominal amount per
occurrence for our parks in Mexico. Defense costs are in addition to these retentions. Our general liability
policies cover the cost of punitive damages only in certain jurisdictions. Based upon reported claims and an
estimate for incurred, but not reported claims, we accrue a liability for our retention contingencies. For workers’
compensation claims arising after November 15, 2003, our deductible is $0.75 million. We also maintain fire and
extended coverage, business interruption, terrorism and other forms of insurance typical to businesses in this
industry. The all peril property coverage policies insure our real and personal properties (other than land) against
physical damage resulting from a variety of hazards. Additionally, we maintain information security and privacy
liability insurance in the amount of $10.0 million with a $0.25 million retention per event.
We generally renegotiate our insurance policies on an annual basis. The majority of our current insurance
policies expire on December 31, 2020. We cannot predict the level of the premiums that we may be required to
pay for subsequent insurance coverage, the level of any retention applicable thereto, the level of aggregate
coverage available or the availability of coverage for specific risks.
Capital Expenditures
We plan to strategically reinvest in our properties to improve the guest experience.
Litigation
We are party to various legal actions arising in the normal course of business, including the cases discussed
below. Matters that are probable of unfavorable outcome to us and which can be reasonably estimated are
accrued. Such accruals are based on information known about the matters, our estimate of the outcomes of such
matters and our experience in contesting, litigating and settling similar matters. None of the actions are believed
by management to involve amounts that would be material to our consolidated balance sheets, results of
operations or liquidity after consideration of recorded accruals.
On January 7, 2016, a potential class action complaint was filed against Six Flags Entertainment
Corporation in the Circuit Court of Lake County, Illinois. On April 22, 2016, Great America, LLC was added as
a defendant. The complaint asserts that we violated the Illinois Biometric Information Privacy Act (‘‘BIPA’’) in
connection with the admission of season pass holders and members through the finger scan program that
commenced in the 2014 operating season at Six Flags Great America in Gurnee, Illinois, and seeks statutory
damages, attorneys’ fees and an injunction. An aggrieved party under BIPA may recover (i) $1,000 if a company
is found to have negligently violated BIPA or (ii) $5,000 if found to have intentionally or recklessly violated
BIPA, plus reasonable attorneys’ fees in each case. The complaint does not allege that any information was
misused or disseminated. On April 7, 2017, the trial court certified two questions for consideration by the Illinois
86
SIX FLAGS ENTERTAINMENT CORPORATIONNotes to Consolidated Financial Statements
Appellate Court of the Second District. On June 7, 2017, the Illinois Appellate Court granted our motion to
appeal. Accordingly, two questions regarding the interpretation of BIPA were certified for consideration by the
Illinois Appellate Court. On December 21, 2017, the Illinois Appellate Court found in our favor, holding that the
plaintiff had to allege more than a technical violation of BIPA and had to be injured in some way in order to
have a right of action. On March 1, 2018, the plaintiff filed a petition for leave to appeal to the Illinois Supreme
Court. On May 30, 2018, the Illinois Supreme Court granted the plaintiff’s leave to appeal and oral arguments
were heard on November 20, 2018. On January 25, 2019, the Illinois Supreme Court found in favor of the
plaintiff, holding that the plaintiff does not need to allege an actual injury beyond the violation of his rights
under BIPA in order to proceed with a complaint. We intend to continue to vigorously defend ourselves against
this litigation. Since this litigation is in an early stage, the outcome is currently not determinable, and a
reasonable estimate of loss or range of loss in excess of the immaterial amount that we have recorded for this
litigation cannot be made.
During 2017, four potential class action complaints were filed against Six Flags Entertainment Corporation
or one of its subsidiaries. Complaints were filed on August 11, 2017, in the Circuit Court of Lake County,
Illinois, on September 1, 2017, in the United States District Court for the Northern District of Georgia, on
September 11, 2017, in the Superior Court of Los Angeles County, California, and on November 30, 2017, in the
Superior Court of Ocean County, New Jersey. The complaints allege that we, in violation of federal law, printed
more than the last five digits of a credit or debit card number on customers’ receipts, and/or the expiration dates
of those cards. A willful violation may subject a company to liability for actual damages or statutory damages
between $100 and $1,000 per person, punitive damages in an amount determined by a court, and reasonable
attorneys’ fees, all of which are sought by the plaintiffs. The complaints do not allege that any information was
misused. The Circuit Court in Illinois granted our motion to dismiss on November 2, 2018, but the matter was
reversed on appeal on January 22, 2020. We intend to seek further review with the Illinois Supreme Court.
The District Court for the Northern District of Georgia denied our motion to dismiss on May 6, 2019, but on
December 31, 2019, the matter was stayed and administratively closed on our motion based on the Eleventh
Circuit’s review of an order denying dismissal in a case involving substantially similar factual allegations and
statutory violations. Either side may move to reopen the Georgia case within 30 days of the issuance of the
Eleventh Circuit’s opinion in the other matter. Our demurrer in the California matter was overruled on
February 26, 2019, but the order contained certain favorable rulings that enabled us to file a motion for summary
judgment on December 12, 2019. The Superior Court in the New Jersey matter granted our motion to dismiss on
January 18, 2019, which ruling the has appealed. We intend to vigorously defend ourselves against these
lawsuits. The outcome of these lawsuits is currently not determinable, and a reasonable estimate of loss or range
of loss in excess of the immaterial amount that we have recorded for this litigation cannot be made.
On March 8, 2016, certain plaintiffs filed a complaint against one of our subsidiaries in the Superior Court
of Massachusetts, Suffolk County, on behalf of a purported class of current and former employees of Six Flags
New England. The complaint alleges violations of Massachusetts law governing employee overtime and rest
breaks, and seeks damages in the form of unpaid wages for overtime and meal breaks and related penalties.
On July 2, 2018, the plaintiffs filed a motion for class certification of two classes, an overtime class and a meal
break class. On November 8, 2018, the court granted class certification for the overtime class and denied class
certification for the meal break class. On June 20, 2019, in response to competing motions for summary
judgment on the application of an overtime wage exemption applicable to amusement parks that operate no more
than 150 days per year, the court agreed that the defendant park did not operate more than 150 days in 2013,
2014, and 2016, but found that it did operate more than 150 days in 2015, 2017 and 2018, for which the
defendant park would owe overtime wages. On September 26, 2019, we filed a motion for reconsideration with
respect to 2017 and 2018, because the defendant park relied on a separate overtime wage law exemption
applicable to a separate and distinct operation of the business in those years. On December 6, 2019, the court
denied our motion for reconsideration. We continue to vigorously defend ourselves against this litigation.
However, there can be no assurance regarding the ultimate outcome of this litigation and we have accrued our
best estimate of exposure, the amount of which is not material to our consolidated financial statements.
87
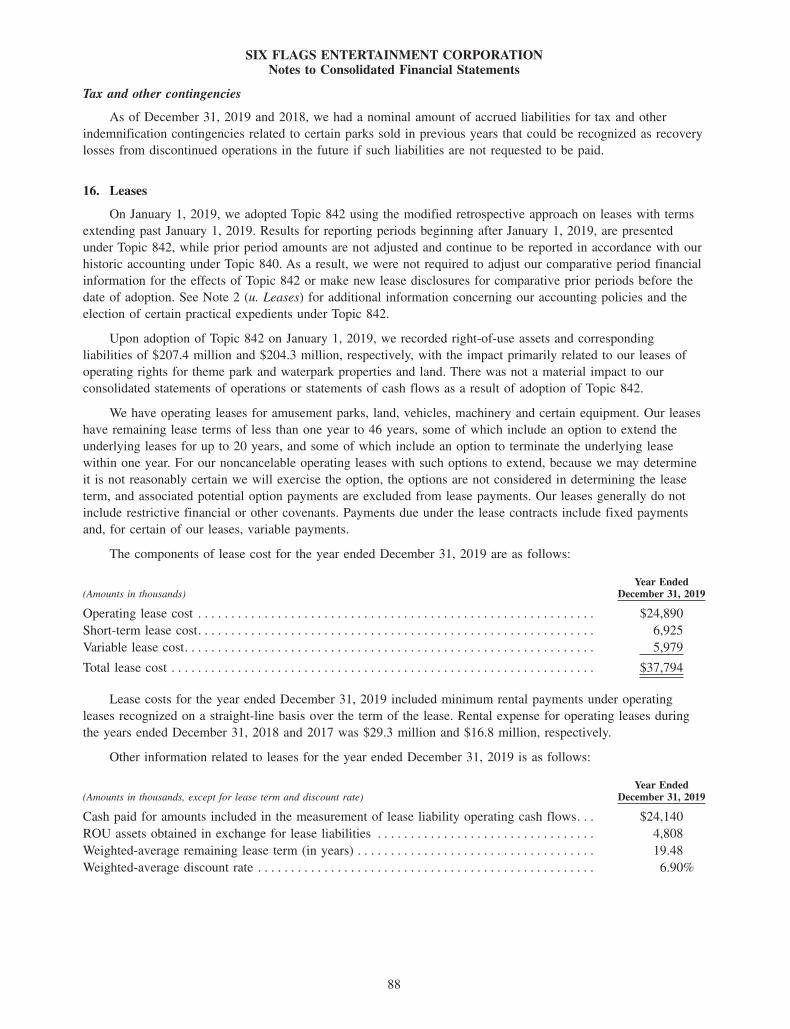
SIX FLAGS ENTERTAINMENT CORPORATIONNotes to Consolidated Financial Statements
Tax and other contingencies
As of December 31, 2019 and 2018, we had a nominal amount of accrued liabilities for tax and other
indemnification contingencies related to certain parks sold in previous years that could be recognized as recovery
losses from discontinued operations in the future if such liabilities are not requested to be paid.
16. Leases
On January 1, 2019, we adopted Topic 842 using the modified retrospective approach on leases with terms
extending past January 1, 2019. Results for reporting periods beginning after January 1, 2019, are presented
under Topic 842, while prior period amounts are not adjusted and continue to be reported in accordance with our
historic accounting under Topic 840. As a result, we were not required to adjust our comparative period financial
information for the effects of Topic 842 or make new lease disclosures for comparative prior periods before the
date of adoption. See Note 2 (u. Leases) for additional information concerning our accounting policies and the
election of certain practical expedients under Topic 842.
Upon adoption of Topic 842 on January 1, 2019, we recorded right-of-use assets and corresponding
liabilities of $207.4 million and $204.3 million, respectively, with the impact primarily related to our leases of
operating rights for theme park and waterpark properties and land. There was not a material impact to our
consolidated statements of operations or statements of cash flows as a result of adoption of Topic 842.
We have operating leases for amusement parks, land, vehicles, machinery and certain equipment. Our leases
have remaining lease terms of less than one year to 46 years, some of which include an option to extend the
underlying leases for up to 20 years, and some of which include an option to terminate the underlying lease
within one year. For our noncancelable operating leases with such options to extend, because we may determine
it is not reasonably certain we will exercise the option, the options are not considered in determining the lease
term, and associated potential option payments are excluded from lease payments. Our leases generally do not
include restrictive financial or other covenants. Payments due under the lease contracts include fixed payments
and, for certain of our leases, variable payments.
The components of lease cost for the year ended December 31, 2019 are as follows:
(Amounts in thousands)
Year EndedDecember 31, 2019
Operating lease cost . . . . . . . . . . . . . . . . . . . . . . . . . . . . . . . . . . . . . . . . . . . . . . . . . . . . . . . . . . . . $24,890
Short-term lease cost. . . . . . . . . . . . . . . . . . . . . . . . . . . . . . . . . . . . . . . . . . . . . . . . . . . . . . . . . . . . 6,925
Variable lease cost. . . . . . . . . . . . . . . . . . . . . . . . . . . . . . . . . . . . . . . . . . . . . . . . . . . . . . . . . . . . . . 5,979
Total lease cost . . . . . . . . . . . . . . . . . . . . . . . . . . . . . . . . . . . . . . . . . . . . . . . . . . . . . . . . . . . . . . . . $37,794
Lease costs for the year ended December 31, 2019 included minimum rental payments under operating
leases recognized on a straight-line basis over the term of the lease. Rental expense for operating leases during
the years ended December 31, 2018 and 2017 was $29.3 million and $16.8 million, respectively.
Other information related to leases for the year ended December 31, 2019 is as follows:
(Amounts in thousands, except for lease term and discount rate)
Year EndedDecember 31, 2019
Cash paid for amounts included in the measurement of lease liability operating cash flows. . . $24,140
ROU assets obtained in exchange for lease liabilities . . . . . . . . . . . . . . . . . . . . . . . . . . . . . . . . . 4,808
Weighted-average remaining lease term (in years) . . . . . . . . . . . . . . . . . . . . . . . . . . . . . . . . . . . . 19.48
Weighted-average discount rate . . . . . . . . . . . . . . . . . . . . . . . . . . . . . . . . . . . . . . . . . . . . . . . . . . . 6.90%
88
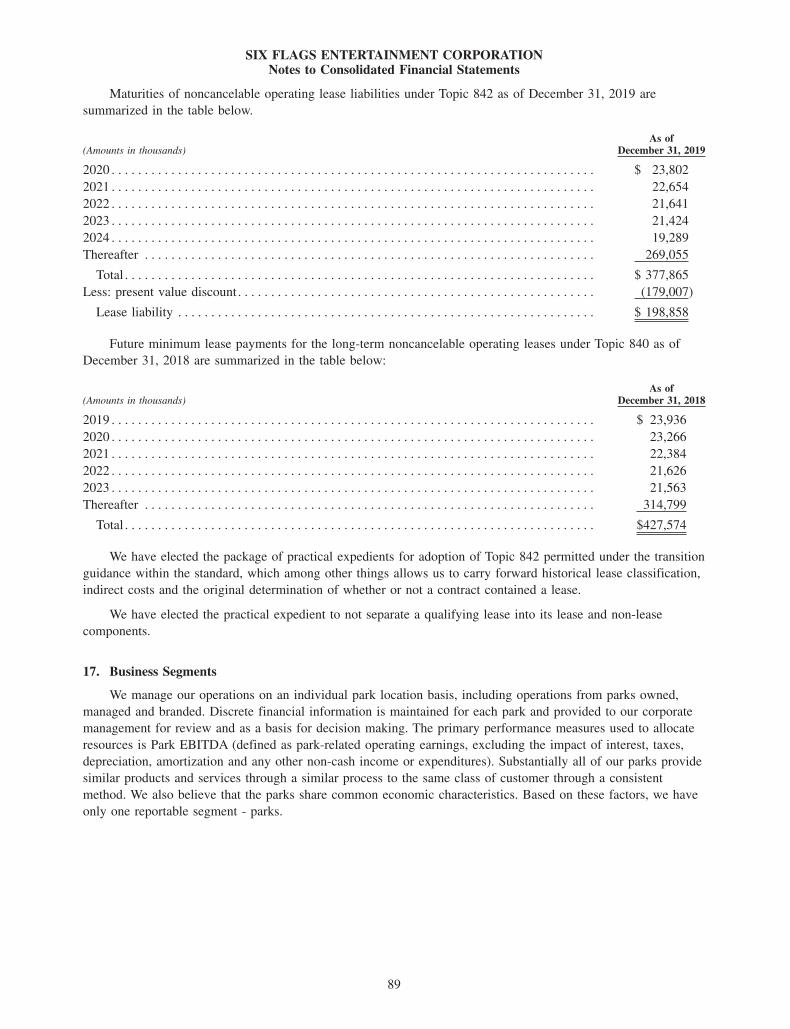
SIX FLAGS ENTERTAINMENT CORPORATIONNotes to Consolidated Financial Statements
Maturities of noncancelable operating lease liabilities under Topic 842 as of December 31, 2019 are
summarized in the table below.
(Amounts in thousands)
As ofDecember 31, 2019
2020 . . . . . . . . . . . . . . . . . . . . . . . . . . . . . . . . . . . . . . . . . . . . . . . . . . . . . . . . . . . . . . . . . . . . . . . . . $ 23,802
2021 . . . . . . . . . . . . . . . . . . . . . . . . . . . . . . . . . . . . . . . . . . . . . . . . . . . . . . . . . . . . . . . . . . . . . . . . . 22,654
2022 . . . . . . . . . . . . . . . . . . . . . . . . . . . . . . . . . . . . . . . . . . . . . . . . . . . . . . . . . . . . . . . . . . . . . . . . . 21,641
2023 . . . . . . . . . . . . . . . . . . . . . . . . . . . . . . . . . . . . . . . . . . . . . . . . . . . . . . . . . . . . . . . . . . . . . . . . . 21,424
2024 . . . . . . . . . . . . . . . . . . . . . . . . . . . . . . . . . . . . . . . . . . . . . . . . . . . . . . . . . . . . . . . . . . . . . . . . . 19,289
Thereafter . . . . . . . . . . . . . . . . . . . . . . . . . . . . . . . . . . . . . . . . . . . . . . . . . . . . . . . . . . . . . . . . . . . . 269,055
Total . . . . . . . . . . . . . . . . . . . . . . . . . . . . . . . . . . . . . . . . . . . . . . . . . . . . . . . . . . . . . . . . . . . . . . . $ 377,865
Less: present value discount . . . . . . . . . . . . . . . . . . . . . . . . . . . . . . . . . . . . . . . . . . . . . . . . . . . . . . (179,007)
Lease liability . . . . . . . . . . . . . . . . . . . . . . . . . . . . . . . . . . . . . . . . . . . . . . . . . . . . . . . . . . . . . . . $ 198,858
Future minimum lease payments for the long-term noncancelable operating leases under Topic 840 as of
December 31, 2018 are summarized in the table below:
(Amounts in thousands)
As ofDecember 31, 2018
2019 . . . . . . . . . . . . . . . . . . . . . . . . . . . . . . . . . . . . . . . . . . . . . . . . . . . . . . . . . . . . . . . . . . . . . . . . . $ 23,936
2020 . . . . . . . . . . . . . . . . . . . . . . . . . . . . . . . . . . . . . . . . . . . . . . . . . . . . . . . . . . . . . . . . . . . . . . . . . 23,266
2021 . . . . . . . . . . . . . . . . . . . . . . . . . . . . . . . . . . . . . . . . . . . . . . . . . . . . . . . . . . . . . . . . . . . . . . . . . 22,384
2022 . . . . . . . . . . . . . . . . . . . . . . . . . . . . . . . . . . . . . . . . . . . . . . . . . . . . . . . . . . . . . . . . . . . . . . . . . 21,626
2023 . . . . . . . . . . . . . . . . . . . . . . . . . . . . . . . . . . . . . . . . . . . . . . . . . . . . . . . . . . . . . . . . . . . . . . . . . 21,563
Thereafter . . . . . . . . . . . . . . . . . . . . . . . . . . . . . . . . . . . . . . . . . . . . . . . . . . . . . . . . . . . . . . . . . . . . 314,799
Total . . . . . . . . . . . . . . . . . . . . . . . . . . . . . . . . . . . . . . . . . . . . . . . . . . . . . . . . . . . . . . . . . . . . . . . $427,574
We have elected the package of practical expedients for adoption of Topic 842 permitted under the transition
guidance within the standard, which among other things allows us to carry forward historical lease classification,
indirect costs and the original determination of whether or not a contract contained a lease.
We have elected the practical expedient to not separate a qualifying lease into its lease and non-lease
components.
17. Business Segments
We manage our operations on an individual park location basis, including operations from parks owned,
managed and branded. Discrete financial information is maintained for each park and provided to our corporate
management for review and as a basis for decision making. The primary performance measures used to allocate
resources is Park EBITDA (defined as park-related operating earnings, excluding the impact of interest, taxes,
depreciation, amortization and any other non-cash income or expenditures). Substantially all of our parks provide
similar products and services through a similar process to the same class of customer through a consistent
method. We also believe that the parks share common economic characteristics. Based on these factors, we have
only one reportable segment - parks.
89
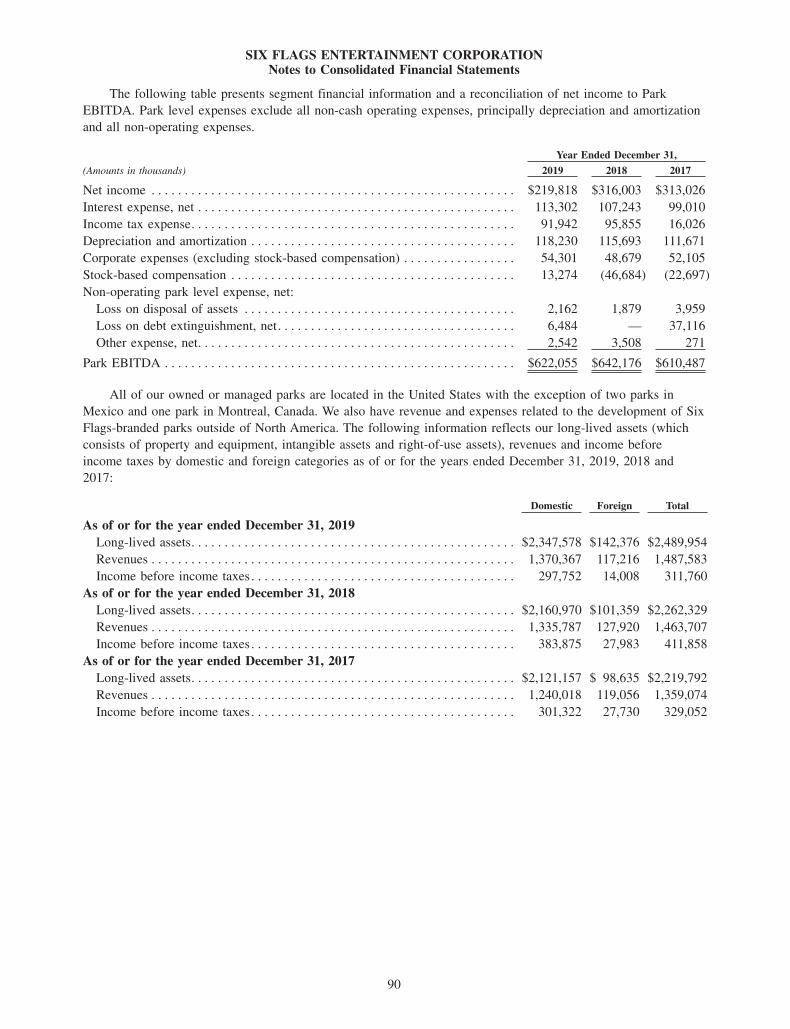
SIX FLAGS ENTERTAINMENT CORPORATIONNotes to Consolidated Financial Statements
The following table presents segment financial information and a reconciliation of net income to Park
EBITDA. Park level expenses exclude all non-cash operating expenses, principally depreciation and amortization
and all non-operating expenses.
Year Ended December 31,
(Amounts in thousands) 2019 2018 2017
Net income . . . . . . . . . . . . . . . . . . . . . . . . . . . . . . . . . . . . . . . . . . . . . . . . . . . . . . . $219,818 $316,003 $313,026
Interest expense, net . . . . . . . . . . . . . . . . . . . . . . . . . . . . . . . . . . . . . . . . . . . . . . . . 113,302 107,243 99,010
Income tax expense. . . . . . . . . . . . . . . . . . . . . . . . . . . . . . . . . . . . . . . . . . . . . . . . . 91,942 95,855 16,026
Depreciation and amortization . . . . . . . . . . . . . . . . . . . . . . . . . . . . . . . . . . . . . . . . 118,230 115,693 111,671
Corporate expenses (excluding stock-based compensation) . . . . . . . . . . . . . . . . . 54,301 48,679 52,105
Stock-based compensation . . . . . . . . . . . . . . . . . . . . . . . . . . . . . . . . . . . . . . . . . . . 13,274 (46,684) (22,697)
Non-operating park level expense, net:
Loss on disposal of assets . . . . . . . . . . . . . . . . . . . . . . . . . . . . . . . . . . . . . . . . . 2,162 1,879 3,959
Loss on debt extinguishment, net. . . . . . . . . . . . . . . . . . . . . . . . . . . . . . . . . . . . 6,484 — 37,116
Other expense, net. . . . . . . . . . . . . . . . . . . . . . . . . . . . . . . . . . . . . . . . . . . . . . . . 2,542 3,508 271
Park EBITDA . . . . . . . . . . . . . . . . . . . . . . . . . . . . . . . . . . . . . . . . . . . . . . . . . . . . . $622,055 $642,176 $610,487
All of our owned or managed parks are located in the United States with the exception of two parks in
Mexico and one park in Montreal, Canada. We also have revenue and expenses related to the development of Six
Flags-branded parks outside of North America. The following information reflects our long-lived assets (which
consists of property and equipment, intangible assets and right-of-use assets), revenues and income before
income taxes by domestic and foreign categories as of or for the years ended December 31, 2019, 2018 and
2017:
Domestic Foreign Total
As of or for the year ended December 31, 2019
Long-lived assets. . . . . . . . . . . . . . . . . . . . . . . . . . . . . . . . . . . . . . . . . . . . . . . . . $2,347,578 $142,376 $2,489,954
Revenues . . . . . . . . . . . . . . . . . . . . . . . . . . . . . . . . . . . . . . . . . . . . . . . . . . . . . . . 1,370,367 117,216 1,487,583
Income before income taxes. . . . . . . . . . . . . . . . . . . . . . . . . . . . . . . . . . . . . . . . 297,752 14,008 311,760
As of or for the year ended December 31, 2018
Long-lived assets. . . . . . . . . . . . . . . . . . . . . . . . . . . . . . . . . . . . . . . . . . . . . . . . . $2,160,970 $101,359 $2,262,329
Revenues . . . . . . . . . . . . . . . . . . . . . . . . . . . . . . . . . . . . . . . . . . . . . . . . . . . . . . . 1,335,787 127,920 1,463,707
Income before income taxes. . . . . . . . . . . . . . . . . . . . . . . . . . . . . . . . . . . . . . . . 383,875 27,983 411,858
As of or for the year ended December 31, 2017
Long-lived assets. . . . . . . . . . . . . . . . . . . . . . . . . . . . . . . . . . . . . . . . . . . . . . . . . $2,121,157 $ 98,635 $2,219,792
Revenues . . . . . . . . . . . . . . . . . . . . . . . . . . . . . . . . . . . . . . . . . . . . . . . . . . . . . . . 1,240,018 119,056 1,359,074
Income before income taxes. . . . . . . . . . . . . . . . . . . . . . . . . . . . . . . . . . . . . . . . 301,322 27,730 329,052
90
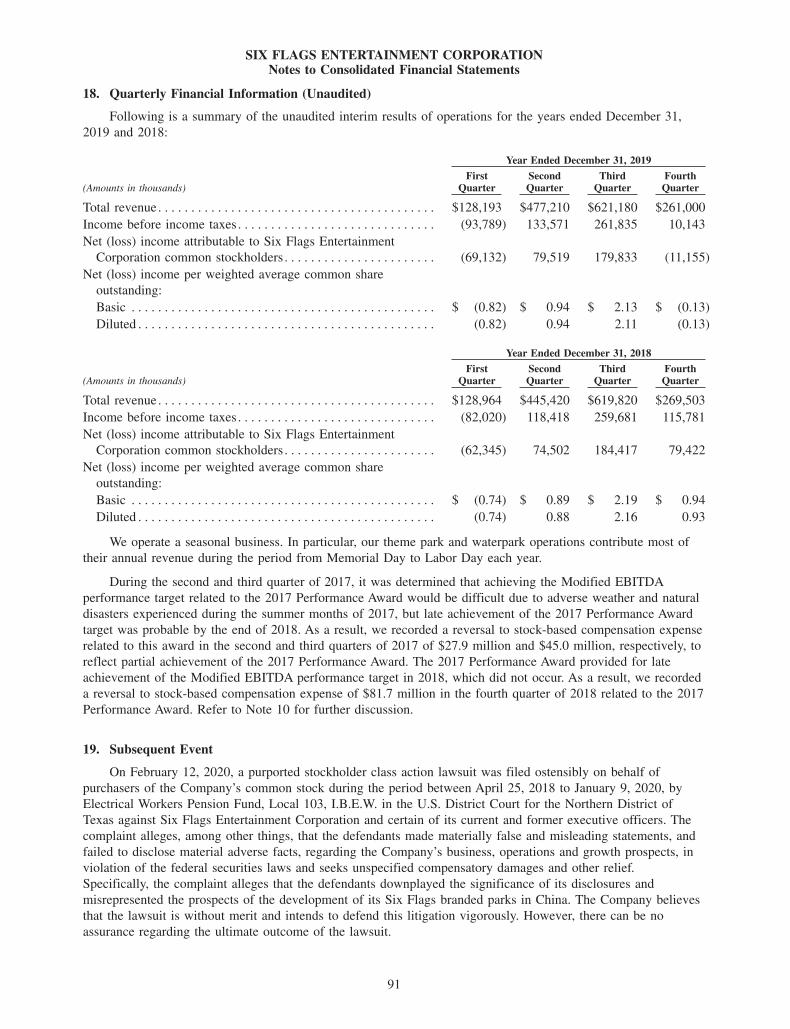
SIX FLAGS ENTERTAINMENT CORPORATIONNotes to Consolidated Financial Statements
18. Quarterly Financial Information (Unaudited)
Following is a summary of the unaudited interim results of operations for the years ended December 31,
2019 and 2018:
Year Ended December 31, 2019
(Amounts in thousands)
FirstQuarter
SecondQuarter
ThirdQuarter
FourthQuarter
Total revenue . . . . . . . . . . . . . . . . . . . . . . . . . . . . . . . . . . . . . . . . . . $128,193 $477,210 $621,180 $261,000
Income before income taxes. . . . . . . . . . . . . . . . . . . . . . . . . . . . . . (93,789) 133,571 261,835 10,143
Net (loss) income attributable to Six Flags Entertainment
Corporation common stockholders . . . . . . . . . . . . . . . . . . . . . . . (69,132) 79,519 179,833 (11,155)
Net (loss) income per weighted average common share
outstanding:
Basic . . . . . . . . . . . . . . . . . . . . . . . . . . . . . . . . . . . . . . . . . . . . . . $ (0.82) $ 0.94 $ 2.13 $ (0.13)
Diluted . . . . . . . . . . . . . . . . . . . . . . . . . . . . . . . . . . . . . . . . . . . . . (0.82) 0.94 2.11 (0.13)
Year Ended December 31, 2018
(Amounts in thousands)
FirstQuarter
SecondQuarter
ThirdQuarter
FourthQuarter
Total revenue . . . . . . . . . . . . . . . . . . . . . . . . . . . . . . . . . . . . . . . . . . $128,964 $445,420 $619,820 $269,503
Income before income taxes. . . . . . . . . . . . . . . . . . . . . . . . . . . . . . (82,020) 118,418 259,681 115,781
Net (loss) income attributable to Six Flags Entertainment
Corporation common stockholders . . . . . . . . . . . . . . . . . . . . . . . (62,345) 74,502 184,417 79,422
Net (loss) income per weighted average common share
outstanding:
Basic . . . . . . . . . . . . . . . . . . . . . . . . . . . . . . . . . . . . . . . . . . . . . . $ (0.74) $ 0.89 $ 2.19 $ 0.94
Diluted . . . . . . . . . . . . . . . . . . . . . . . . . . . . . . . . . . . . . . . . . . . . . (0.74) 0.88 2.16 0.93
We operate a seasonal business. In particular, our theme park and waterpark operations contribute most of
their annual revenue during the period from Memorial Day to Labor Day each year.
During the second and third quarter of 2017, it was determined that achieving the Modified EBITDA
performance target related to the 2017 Performance Award would be difficult due to adverse weather and natural
disasters experienced during the summer months of 2017, but late achievement of the 2017 Performance Award
target was probable by the end of 2018. As a result, we recorded a reversal to stock-based compensation expense
related to this award in the second and third quarters of 2017 of $27.9 million and $45.0 million, respectively, to
reflect partial achievement of the 2017 Performance Award. The 2017 Performance Award provided for late
achievement of the Modified EBITDA performance target in 2018, which did not occur. As a result, we recorded
a reversal to stock-based compensation expense of $81.7 million in the fourth quarter of 2018 related to the 2017
Performance Award. Refer to Note 10 for further discussion.
19. Subsequent Event
On February 12, 2020, a purported stockholder class action lawsuit was filed ostensibly on behalf of
purchasers of the Company’s common stock during the period between April 25, 2018 to January 9, 2020, by
Electrical Workers Pension Fund, Local 103, I.B.E.W. in the U.S. District Court for the Northern District of
Texas against Six Flags Entertainment Corporation and certain of its current and former executive officers. The
complaint alleges, among other things, that the defendants made materially false and misleading statements, and
failed to disclose material adverse facts, regarding the Company’s business, operations and growth prospects, in
violation of the federal securities laws and seeks unspecified compensatory damages and other relief.
Specifically, the complaint alleges that the defendants downplayed the significance of its disclosures and
misrepresented the prospects of the development of its Six Flags branded parks in China. The Company believes
that the lawsuit is without merit and intends to defend this litigation vigorously. However, there can be no
assurance regarding the ultimate outcome of the lawsuit.
91
SIX FLAGS ENTERTAINMENT CORPORATIONNotes to Consolidated Financial Statements
ITEM 9. CHANGES IN AND DISAGREEMENTS WITH ACCOUNTANTS ON ACCOUNTING ANDFINANCIAL DISCLOSURE
We have had no disagreements with our independent registered public accounting firm on any matter of
accounting principles or practices or financial statement disclosure.
ITEM 9A. CONTROLS AND PROCEDURES
Conclusion Regarding the Effectiveness of Disclosure Controls and Procedures
Under the supervision and with the participation of our management, including our Chief Executive Officer
and Chief Financial Officer, we conducted an evaluation, as of December 31, 2019, of the effectiveness of our
disclosure controls and procedures, as such term is defined under Rule 13a-15(e) or 15(d)-15(e) promulgated
under the Securities Exchange Act of 1934, as amended (the ‘‘Exchange Act’’). Based on this evaluation, our
Chief Executive Officer and our Chief Financial Officer concluded that, as of the end of such period, our
disclosure controls and procedures are effective to ensure that information required to be disclosed by us in the
reports that we file or submit under the Exchange Act is (i) recorded, processed, summarized and reported within
the time periods specified in the SEC’s rules and forms and (ii) accumulated and communicated to our
management, including our principal executive and principal financial officers, or persons performing similar
functions, as appropriate, to allow timely decisions regarding required disclosure.
Management’s Report on Internal Control Over Financial Reporting
Management’s Report on Internal Control Over Financial Reporting included in Item 8 of this Annual
Report is incorporated by reference herein.
Changes in Internal Control Over Financial Reporting During the Quarter Ended December 31, 2019
There were no changes in our internal control over financial reporting, as such term is defined under Rule
13a-15(f) or 15(d)-15(f) promulgated under the Securities Exchange Act of 1934, as amended, that occurred
during our fiscal quarter ended December 31, 2019 that have materially affected, or are reasonably likely to
materially affect, our internal control over financial reporting.
ITEM 9B. OTHER INFORMATION
On February 20, 2020, we announced that Marshall Barber will retire as Executive Vice President and Chief
Financial Officer of the Company. Mr. Barber will continue to serve as Executive Vice President and Chief
Financial Officer through February 24, 2020, and will remain with the Company as an Advisor until August 31,
2020, assisting with the transition of a new chief financial officer.
Leonard Russ, 46, who currently serves as the Company’s Senior Vice President of Strategic Planning and
Analysis, will assume the role of interim chief financial officer effective upon Mr. Barber stepping down from
that position on February 24, 2020. From October 2010 until February 2016, before being named Senior Vice
President of Strategic Planning and Analysis, Mr. Russ served as Vice President and Chief Accounting Officer of
the Company. In that role, he was responsible for overseeing the Company’s accounting function and the finance
functions of the Company’s western region parks. Mr. Russ began his career at the Company in 1989 as a
seasonal employee and became a full-time employee in 1995. He held a number of management positions within
the Company before being named Director of Internal Audit in 2004. In 2005, Mr. Russ was promoted to
Controller, a position he held until being promoted to Vice President and Chief Accounting Officer. Mr. Russ
holds a B.B.A. degree in Accounting from the University of Texas at Arlington.
On February 20, 2020, Mr. Barber and the Company entered into a Transition and Retirement Agreement
(the ‘‘Transition Agreement’’) to facilitate a smooth transition. The Transition Agreement provides that, on
February 24, 2020, Mr. Barber’s employment agreement with the Company will terminate and Mr. Barber will
continue employment as an Advisor under the Transition Agreement. The Transition Agreement provides that, as
an Advisor, Mr. Barber will be entitled to, among other things, a base salary at a rate of $10,913.46 per week
through August 31, 2020. Mr. Barber will continue to participate in or receive benefits under the employee
92
SIX FLAGS ENTERTAINMENT CORPORATIONNotes to Consolidated Financial Statements
benefit programs of the Company, including the Company’s life, health and disability programs, as well as to
receive reimbursement of certain expenses incurred during his employment, as provided in the Transition
Agreement. The Transition Agreement also contains customary non-competition, indemnification, confidentiality
and proprietary information provisions.
As disclosed on November 15, 2019, Lance Balk had informed the Company of his intention to retire as
Executive Vice President and General Counsel of the Company and had entered into a Transition and Retirement
Agreement with the Company to facilitate a smooth transition. Pursuant to such Transition and Retirement
Agreement, Mr. Balk and the Company have agreed that Mr. Balk will cease to be Executive Vice President and
General Counsel on March 2, 2020 and will provide transitional and advisory services pursuant to the Transition
and Retirement Agreement through March 2, 2022. The Transition and Retirement Agreement for Mr. Balk was
previously filed with the Company’s Current Report on Form 8-K filed on November 15, 2019.
93
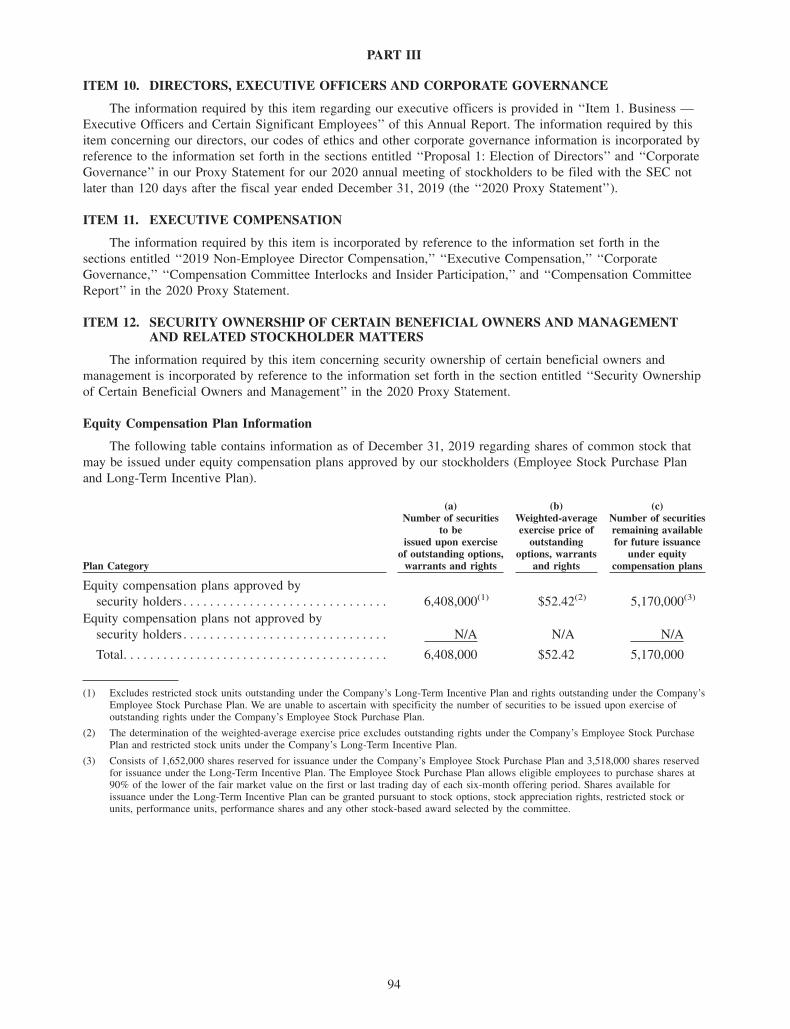
PART III
ITEM 10. DIRECTORS, EXECUTIVE OFFICERS AND CORPORATE GOVERNANCE
The information required by this item regarding our executive officers is provided in ‘‘Item 1. Business —
Executive Officers and Certain Significant Employees’’ of this Annual Report. The information required by this
item concerning our directors, our codes of ethics and other corporate governance information is incorporated by
reference to the information set forth in the sections entitled ‘‘Proposal 1: Election of Directors’’ and ‘‘Corporate
Governance’’ in our Proxy Statement for our 2020 annual meeting of stockholders to be filed with the SEC not
later than 120 days after the fiscal year ended December 31, 2019 (the ‘‘2020 Proxy Statement’’).
ITEM 11. EXECUTIVE COMPENSATION
The information required by this item is incorporated by reference to the information set forth in the
sections entitled ‘‘2019 Non-Employee Director Compensation,’’ ‘‘Executive Compensation,’’ ‘‘Corporate
Governance,’’ ‘‘Compensation Committee Interlocks and Insider Participation,’’ and ‘‘Compensation Committee
Report’’ in the 2020 Proxy Statement.
ITEM 12. SECURITY OWNERSHIP OF CERTAIN BENEFICIAL OWNERS AND MANAGEMENTAND RELATED STOCKHOLDER MATTERS
The information required by this item concerning security ownership of certain beneficial owners and
management is incorporated by reference to the information set forth in the section entitled ‘‘Security Ownership
of Certain Beneficial Owners and Management’’ in the 2020 Proxy Statement.
Equity Compensation Plan Information
The following table contains information as of December 31, 2019 regarding shares of common stock that
may be issued under equity compensation plans approved by our stockholders (Employee Stock Purchase Plan
and Long-Term Incentive Plan).
Plan Category
(a)Number of securities
to beissued upon exercise
of outstanding options,warrants and rights
(b)Weighted-averageexercise price of
outstandingoptions, warrants
and rights
(c)Number of securitiesremaining availablefor future issuance
under equitycompensation plans
Equity compensation plans approved by
security holders . . . . . . . . . . . . . . . . . . . . . . . . . . . . . . . 6,408,000(1) $52.42(2) 5,170,000(3)
Equity compensation plans not approved by
security holders . . . . . . . . . . . . . . . . . . . . . . . . . . . . . . . N/A N/A N/A
Total. . . . . . . . . . . . . . . . . . . . . . . . . . . . . . . . . . . . . . . . 6,408,000 $52.42 5,170,000
(1) Excludes restricted stock units outstanding under the Company’s Long-Term Incentive Plan and rights outstanding under the Company’sEmployee Stock Purchase Plan. We are unable to ascertain with specificity the number of securities to be issued upon exercise ofoutstanding rights under the Company’s Employee Stock Purchase Plan.
(2) The determination of the weighted-average exercise price excludes outstanding rights under the Company’s Employee Stock PurchasePlan and restricted stock units under the Company’s Long-Term Incentive Plan.
(3) Consists of 1,652,000 shares reserved for issuance under the Company’s Employee Stock Purchase Plan and 3,518,000 shares reservedfor issuance under the Long-Term Incentive Plan. The Employee Stock Purchase Plan allows eligible employees to purchase shares at90% of the lower of the fair market value on the first or last trading day of each six-month offering period. Shares available forissuance under the Long-Term Incentive Plan can be granted pursuant to stock options, stock appreciation rights, restricted stock orunits, performance units, performance shares and any other stock-based award selected by the committee.
94

ITEM 13. CERTAIN RELATIONSHIPS AND RELATED TRANSACTIONS AND DIRECTORINDEPENDENCE
The information required by this item is incorporated by reference to the information set forth in the
sections entitled ‘‘Transactions with Related Persons’’ and ‘‘Corporate Governance — Independence’’ in the
2020 Proxy Statement.
ITEM 14. PRINCIPAL ACCOUNTING FEES AND SERVICES
The information required by this item is incorporated by reference to the information set forth in the section
entitled ‘‘Audit, Audit-Related and Tax Fees’’ in the 2020 Proxy Statement.
95
PART IV
ITEM 15. EXHIBITS AND FINANCIAL STATEMENT SCHEDULES
(a)(1) and (2) Financial Statements and Financial Statement Schedules
The following consolidated financial statements of Six Flags Entertainment Corporation and its subsidiaries,
the notes thereto, the related report thereon of the independent registered public accounting firm, and financial
statement schedules are filed under Item 8 of this Annual Report:
Management’s Report on Internal Control Over Financial Reporting . . . . . . . . . . . . . . . . . . . . . . . . . . . . . . . 46
Report of Independent Registered Public Accounting Firm. . . . . . . . . . . . . . . . . . . . . . . . . . . . . . . . . . . . . . . 47
Consolidated Balance Sheets as of December 31, 2019 and 2018 . . . . . . . . . . . . . . . . . . . . . . . . . . . . . . . . . 49
Consolidated Statements of Operations for the Years Ended December 31, 2019, 2018 and 2017. . . . . . . . 50
Consolidated Statements of Comprehensive Income for the Years Ended December 31, 2019, 2018 and
2017 . . . . . . . . . . . . . . . . . . . . . . . . . . . . . . . . . . . . . . . . . . . . . . . . . . . . . . . . . . . . . . . . . . . . . . . . . . . . . . . . 51
Consolidated Statements of Equity (Deficit) for the Years Ended December 31, 2019, 2018 and 2017 . . . 52
Consolidated Statements of Cash Flows for the Years Ended December 31, 2019, 2018 and 2017 . . . . . . . 53
Notes to Consolidated Financial Statements . . . . . . . . . . . . . . . . . . . . . . . . . . . . . . . . . . . . . . . . . . . . . . . . . . . 54
Certain schedules for which provision is made in the applicable accounting regulations of the SEC have
been omitted because they either are not required under the related instructions, are inapplicable, or the required
information is shown in the financial statements or notes thereto.
(a)(3) Exhibits
ExhibitNumber Exhibit Description
3.1 Restated Certificate of Incorporation of Six Flags Entertainment Corporation, as
amended—incorporated by reference to Exhibit 3.1 to Registrant’s Quarterly Report on Form 10-Q
(File No. 001-13703) for the quarter ended June 30, 2011.
3.2 Certificate of Amendment to the Restated Certificate of Incorporation of Six Flags Entertainment
Corporation—incorporated by reference to Exhibit 3.1 to Registrant’s Quarterly Report on Form 10-Q
(File No. 001-13703) filed on July 25, 2018.
3.3 Amended and Restated Bylaws of Six Flags Entertainment Corporation—incorporated by reference to
Exhibit 3.1 to Registrant’s Current Report on Form 8-K (File No. 001-13703) filed on February 7,
2018.
4.1 Registration Rights Agreement, dated as of April 30, 2010, between Six Flags Entertainment
Corporation and certain holders of Common Stock—incorporated by reference to Exhibit 4.1 to
Registrant’s Current Report on Form 8-K (File No. 001-13703) filed on May 3, 2010.
4.2 Indenture, dated as of December 21, 2012, among Six Flags Entertainment Corporation, the guarantors
party thereto and U.S. Bank National Association, as trustee—incorporated by reference to Exhibit 4.1
to Registrant’s Current Report on Form 8-K (File No. 001-13703) filed on December 21, 2012.
4.3 Form of 5.25% Senior Note due 2021—incorporated by reference to Exhibit A to Exhibit 4.1 to
Registrant’s Current Report on Form 8-K (File No. 001-13703) filed on December 21, 2012.
4.4 Indenture, dated as of June 16, 2016, among Six Flags Entertainment Corporation, the guarantors party
thereto and U.S. Bank National Association, as trustee—incorporated by reference to Exhibit 4.1 to
Registrant’s Current Report on Form 8-K (File No. 001-13703) filed on June 17, 2016.
4.5 Form of 4.875% Senior Note due 2024 (included as Exhibit A to Exhibit 4.4)—incorporated by
reference to Exhibit A to Exhibit 4.1 to Registrant’s Current Report on Form 8-K (File No. 001-13703)
filed on June 17, 2016.
4.6 Indenture, dated as of April 13, 2017, by and among Six Flags Entertainment Corporation, each of the
guarantors party thereto and U.S. Bank National Association as trustee—incorporated by reference to
Exhibit A to Exhibit 4.3 to Registrant’s Current Report on Form 8-K (File No. 001-13703) filed on
April 13, 2017.
96
ExhibitNumber Exhibit Description
4.7 Form of 5.500% Senior Notes due 2027 (included as Exhibit A to Exhibit 4.6)-incorporated by
reference to Exhibit 4.3 to Registrant’s Current Report on Form 8-K (File No. 001-13703) filed on
April 13, 2017.
4.8* Description of Securities.
10.1 Subordinated Indemnity Agreement, dated February 9, 1998 among Registrant, the subsidiaries of
Registrant named therein, Time Warner Inc., the subsidiaries of Time Warner Inc. named therein,
Six Flags Entertainment Corporation and the subsidiaries of Six Flags Entertainment Corporation
named therein—incorporated by reference from Exhibit 2(b) to Registrant’s Registration Statement on
Form S-3 (No. 333-45859) declared effective on March 26, 1998.
10.2 Amendment No. 1 Subordinated Indemnity Agreement, dated November 5, 1999, among Registrant,
the subsidiaries of Registrant named therein, Time Warner Inc., the subsidiaries of Time Warner Inc.
named therein, Six Flags Entertainment Corporation, and the subsidiaries of Six Flags Entertainment
Corporation named therein—incorporated by reference from Exhibit 10 (bb) to Registrant’s Form 10-K
for the year ended December 31, 2003.
10.3 Amendment No. 2 Subordinated Indemnity Agreement, dated June 12, 2004, among Registrant, the
subsidiaries of Registrant named therein, Time Warner Inc., the subsidiaries of Time Warner Inc.
named therein, Six Flags Entertainment Corporation, and the subsidiaries of Six Flags Entertainment
Corporation named therein—incorporated by reference from Exhibit 10 (cc) to Registrant’s Form 10-K
for the year ended December 31, 2003.
10.4 Amendment No. 3 to Subordinated Indemnity Agreement, dated as of April 13, 2004, among Six Flags
Operations Inc., Six Flags Theme Parks Inc., SFOG II, Inc., SFT Holdings, Inc., Time Warner Inc.,
Time Warner Entertainment Company, L.P., TW-SPV Co., Six Flags, Inc. and GP Holdings
Inc.—incorporated by reference to Exhibit 10.4 to Registrant’s Form 10-Q (File No. 001-13703) for
the quarter ended June 30, 2009.
10.5 Amendment No. 4 to Subordinated Indemnity Agreement, dated as of December 8, 2006, among
Six Flags Operations Inc., Six Flags Theme Parks Inc., SFOG II, Inc., SFT Holdings, Inc.,
Time Warner Inc., Time Warner Entertainment Company, L.P., TW-SPV Co., Six Flags, Inc. and
GP Holdings Inc.—incorporated by reference to Exhibit 10.5 to Registrant’s Form 10-Q (File No.
001-13703) for the quarter ended June 30, 2009.
10.6 Amendment No. 5 to Subordinated Indemnity Agreement, dated as of April 2, 2007, among Six Flags
Operations Inc., Six Flags Theme Parks Inc., SFOG II, Inc., SFT Holdings, Inc., Time Warner Inc.,
Warner Bros. Entertainment Inc., TW-SPV Co., Six Flags, Inc. and GP Holdings Inc.—incorporated by
reference to Exhibit 10.6 to Registrant’s Form 10-Q (File No. 001-13703) for the quarter ended
June 30, 2009.
10.7 Amendment No. 6 to Subordinated Indemnity Agreement, dated as of May 15, 2009, among Six Flags
Operations Inc., Six Flags Theme Parks Inc., SFOG II, Inc., SFT Holdings, Inc., Historic TW Inc.,
Time Warner Entertainment Company, L.P., TW-SPV Co., Six Flags, Inc. and GP Holdings
Inc.—incorporated by reference to Exhibit 10.7 to Registrant’s Form 10-Q (File No. 001-13703) for
the quarter ended June 30, 2009.
10.8 Amendment No. 7 to Subordinated Indemnity Agreement, dated as of April 30, 2010, among Six Flags
Operations Inc., Six Flags Theme Parks Inc., SFOG II, Inc., SFT Holdings, Inc., Historic TW Inc.,
Warner Bros. Entertainment Inc., TW-SPV Co., Six Flags Entertainment Corporation, the other
subsidiaries of Six Flags Entertainment Corporation and GP Holdings Inc.—incorporated by reference
from Exhibit 10.7 to Registrant’s Form 10-Q (File No. 001-13703) for the quarter ended
March 31, 2010.
10.9† Form of Indemnity Agreement—incorporated by reference to Exhibit 10.8 to Registrant’s Form 10-Q
(File No. 001-13703) for the quarter ended March 31, 2010.
10.10† Form of Restricted Stock Unit Agreement Pursuant to the Six Flags Entertainment Corporation
Long-Term Incentive Plan—incorporated by reference to Exhibit 10.1 to Registrant’s Current Report
on Form 8-K (File No. 001-13703) filed on August 11, 2010.
97
ExhibitNumber Exhibit Description
10.11† Form of Nonqualified Stock Option Agreement and Dividend Equivalent Rights Agreement pursuant to
the Six Flags Entertainment Corporation Long-Term Incentive Plan—incorporated by reference to
Exhibit 10.30 to Registrant’s Annual Report on Form 10-K (File No. 001-13703) for the year ended
December 31, 2012.
10.12† Employment Agreement, dated August 12, 2010, by and between James Reid-Anderson and Six Flags
Entertainment Corporation—incorporated by reference to Exhibit 10.1 to Registrant’s Current Report
on Form 8-K (File No. 001-13703) filed on August 18, 2010.
10.13† Restricted Shares Agreement Pursuant to the Six Flags Entertainment Corporation Long-Term Incentive
Plan, between James Reid-Anderson and Six Flags Entertainment Corporation, dated August 12,
2010—incorporated by reference to Exhibit 10.2 to Registrant’s Current Report on Form 8-K
(File No. 001-13703) filed on August 18, 2010.
10.14† Nonqualified Stock Option Agreement Pursuant to the Six Flags Entertainment Corporation Long-Term
Plan, between James Reid-Anderson and Six Flags Entertainment Corporation, dated August 12,
2010—incorporated by reference to Exhibit 10.3 to Registrant’s Current Report on Form 8-K
(File No. 001-13703) filed on August 18, 2010.
10.15† Employment Agreement, dated September 7, 2010, by and between Lance C. Balk and Six Flags
Entertainment Corporation—incorporated by reference to Exhibit 10.3 to Registrant’s Current Report
on Form 8-K (File No. 001-13703) filed on September 13, 2010.
10.16† Six Flags Entertainment Corporation Employee Stock Purchase Plan—incorporated by reference to
Exhibit 99.1 to Registrant’s Registration Statement on Form S-8 (Reg. No. 333-170584) filed on
November 12, 2010.
10.17† Employment Agreement, dated November 29, 2010, by and between Brett Petit and Six Flags
Entertainment Corporation—incorporated by reference to Exhibit 10.2 to Registrant’s Current Report
on Form 8-K (File No. 001-13703) filed on December 7, 2010.
10.18† Amendment No. 1 to Employment Agreement, dated March 7, 2011, by and between James
Reid-Anderson and Six Flags Entertainment Corporation—incorporated by reference to
Exhibit (10)(jjjj) to Registrant’s Annual Report on Form 10-K (File No. 001-13703) for the year ended
December 31, 2010.
10.19† Form of Amendment by and between Six Flags Entertainment Corporation and Certain
Executives—James Reid-Anderson, Al Weber, Jr., John M. Duffey and Lance C. Balk—incorporated
by reference to Exhibit (10) (kkkk) to Registrant’s Annual Report on Form 10-K (File No. 001-13703)
for the year ended December 31, 2010.
10.20† Director Deferral Election—incorporated by reference to Exhibit 10.3 to Registrant’s Current Report on
Form 8-K (File No. 001-13703) filed on September 1, 2011.
10.21 $1,135,000,000 Credit Agreement, dated as of December 20, 2011, among Six Flags Entertainment
Corporation, Six Flags Operations Inc., Six Flags Theme Parks Inc., the several lenders from time to
time parties thereto, Wells Fargo Bank, N. A., as Administrative Agent, an Issuing Lender and a Swing
Line Lender, Wells Fargo Securities, LLC, as Lead Arranger, Bank of America, N.A., JPMorgan Chase
Bank, N.A. and Barclays Bank plc, as Co-Documentation Agents, Goldman Sachs Bank USA and
Deutsche Bank Securities Inc., as Co-Syndication Agents, and Wells Fargo Securities, LLC, Goldman
Sachs Bank USA, Deutsche Bank Securities Inc., Bank of America, N.A., JPMorgan Chase Bank, N.A.
and Barclays Capital, as Joint Bookrunners—incorporated by reference to Exhibit 10.1 to Registrant’s
Current Report on Form 8-K (File No. 001-13703) filed on December 20, 2011.
10.22 Guarantee and Collateral Agreement, dated as of December 20, 2011, by Six Flags Entertainment
Corporation, Six Flags Operations Inc., Six Flags Theme Parks Inc. and each of the other signatories
thereto, as Grantors, in favor of Wells Fargo Bank, N. A., as Administrative Agent, for the banks and
other financial institutions or entities from time to time parties to the $1,135,000,000 Credit Agreement
dated as of December 20, 2011—incorporated by reference to Exhibit 10.51 to Registrant’s Annual
Report on Form 10-K (File No. 001-13703) for the year ended December 31, 2011.
98
ExhibitNumber Exhibit Description
10.23† Form of Amendment to Employment Agreement by and between Six Flags Entertainment Corporation
and Certain Executives—Walter S. Hawrylak and Brett Petit—incorporated by reference to
Exhibit 10.5 to Registrant’s Quarterly Report on Form 10-Q (File No. 001-13703) for the quarter
ended March 31, 2012.
10.24† Supplemental 401(k) Plan—incorporated by reference to Exhibit 10.3 to Registrant’s Quarterly Report
on Form 10-Q (File No. 001-13703) for the quarter ended June 30, 2012.
10.25 Form of First Amendment to Credit Agreement by and among Six Flags Entertainment Corporation,
Six Flags Operations Inc., Six Flags Theme Parks Inc., the Subsidiary Guarantors listed on the
signature pages thereto, Wells Fargo Bank, National Association, as administrative agent, and several
lenders (without exhibits)—incorporated by reference to Exhibit 10.1 to Registrant’s Current Report on
Form 8-K (File No. 001-13703) filed on December 5, 2012.
10.26 Second Amendment to Credit Agreement, dated as of December 23, 2013, by and among Six Flags
Entertainment Corporation, Six Flags Operations Inc., Six Flags Theme Parks Inc., the Subsidiary
Guarantors listed on the signature pages thereto, Wells Fargo Bank, National Association, as
administrative agent, and several lenders (without exhibits)—incorporated by reference to Exhibit 10.60
to Registrant’s Annual Report on Form 10-K (File No. 001-13703) for the year ended
December 31, 2013.
10.27† Form of Director Deferred Share Unit Agreement pursuant to the Six Flags Entertainment Corporation
Long-Term Incentive Plan—incorporated by reference to Exhibit 10.61 to Registrant’s Annual Report
on Form 10-K (File No. 001-13703) for the year ended December 31, 2013.
10.28† Form of Director Restricted Stock Agreement Pursuant to the Six Flags Entertainment Corporation
Long-Term Incentive Plan—incorporated by reference to Exhibit 10.44 to Registrant’s Annual Report
on Form 10-K (File No. 001-13703) for the year ended December 31, 2014.
10.29 $950,000,000 Amended and Restated Credit Agreement, dated as of June 30, 2015, among Six Flags
Entertainment Corporation, Six Flags Operations Inc., Six Flags Theme Parks Inc. and several lenders,
Wells Fargo Bank, National Association, as administrative agent, an issuing lender and a swingline
lender, Wells Fargo Securities, LLC and Merrill Lynch, Pierce, Fenner & Smith Incorporated, as joint
lead arrangers, Barclays Bank PLC, JPMorgan Chase Bank, N.A., Compass and HSBC Bank USA,
National Association, as co-documentation agents, Bank of America, N.A. and Goldman Sachs Bank
USA, as co-syndication agents, and Wells Fargo Securities, LLC, Barclays Bank PLC, Goldman Sachs
Bank USA, JPMorgan Securities LLC and Merrill Lynch, Pierce, Fenner & Smith Incorporated, as
joint bookrunners—incorporated by reference to Exhibit 10.1 to Registrant’s Current Report on
Form 8-K (File No. 001-13703) filed on July 1, 2015.
10.30 Amended and Restated Guarantee and Collateral Agreement, dated as of June 30, 2015, among
Six Flags Entertainment Corporation, Six Flags Operations Inc., Six Flags Theme Parks Inc., the other
grantors party thereto, and Wells Fargo Bank, National Association, as administrative
agent—incorporated by reference to Exhibit 10.2 to Registrant’s Current Report on Form 8-K
(File No. 001-13703) filed on July 1, 2015.
10.31† Employment Agreement, dated as of February 18, 2016, by and between James Reid-Anderson and
Six Flags Entertainment Corporation—incorporated by reference to Exhibit 10.47 to Registrant’s
Annual Report on Form 10-K (File No. 001-13703) for the year ended December 31, 2015.
10.32† Employment Agreement, dated as of February 18, 2016, by and between Marshall Barber and
Six Flags Entertainment Corporation—incorporated by reference to Exhibit 10.49 to Registrant’s
Annual Report on Form 10-K (File No. 001-13703) for the year ended December 31, 2015.
10.33† List of Project 750 Awards—incorporated by reference to Exhibit 10.1 to Registrant’s Current Report
on Form 8-K (File No. 001-13703) filed on October 28, 2016.
10.34† Project 750 Program Overview—incorporated by reference to Exhibit 10.2 to Registrant’s Current
Report on Form 8-K (File No. 001-13703) filed on October 28, 2016.
10.35† Form of Project 750 Program Award Agreement—incorporated by reference to Exhibit 10.3 to
Registrant’s Current Report on Form 8-K (File No. 001-13703) filed on October 26, 2016.
99
ExhibitNumber Exhibit Description
10.36 First Amendment to Credit Agreement, dated as of June 16, 2016, by and among Six Flags
Entertainment Corporation, Six Flags Operations Inc., Six Flags Theme Parks Inc., the Subsidiary
Guarantors (as defined therein) from time to time party thereto, the Lenders (as defined therein) from
time to time party thereto, and Wells Fargo Bank, National Association, as administrative
agent—incorporated by reference to Exhibit 10.1 to Registrant’s Current Report on Form 8-K
(File No. 001-13703) filed on June 17, 2016.
10.37 Second Amendment to Amended and Restated Credit Agreement, dated as of December 20, 2016, by
and among Six Flags Entertainment Corporation, Six Flags Operations Inc., Six Flags Theme
Parks Inc., the Subsidiary Guarantors (as defined therein) from time to time party thereto, the Lenders
(as defined therein) from time to time party thereto, and Wells Fargo Bank, National Association, as
administrative agent—incorporated by reference to Exhibit 10.1 to Registrant’s Current Report on
Form 8-K (File No. 001-13703) filed on December 21, 2016.
10.38† Amendment No.1 to Employment Agreement, dated as of February 10, 2017, by and between James
Reid-Anderson and Six Flags Entertainment Corporation—incorporated by reference to Exhibit 10.1 to
Registrant’s Current Report on Form 8-K (File No. 001-13703) filed on February 13, 2017.
10.39† Six Flags Entertainment Corporation Long-Term Incentive Plan—incorporated by reference to
Appendix A to Registrant’s Definitive Proxy Statement (File No. 001-13703) filed on March 21, 2017.
10.40 Third Amendment and Limited Waiver to Amended and Restated Credit Agreement, dated as of
June 21, 2017, among Six Flags Entertainment Corporation, Six Flags Operations Inc., Six Flags
Theme Parks Inc., the Subsidiary Guarantors (as defined therein) from time to time party thereto, the
Lenders (as defined therein) from time to time party thereto and Wells Fargo Bank,
National Association, as administrative agent-incorporated by reference to Exhibit 10.1 to Registrant’s
Current Report on Form 8-K (File No. 001-13703) filed on June 21, 2017.
10.41† Employment Agreement, dated as of July 18, 2017, by and between James Reid-Anderson and
Six Flags Entertainment Corporation-incorporated by reference to Exhibit 10.1 to Registrant’s Current
Report on Form 8-K (File No. 001-13703) filed on July 21, 2017.
10.42† Employment Agreement, dated as of November 17, 2017, by and between Kathy Aslin and Six Flags
Entertainment Corporation—incorporated by reference to Exhibit 10.59 to Registrant’s Annual Report
on Form 10-K (File No. 001-13703) filed on February 20, 2018.
10.43 Fourth Amendment to Amended and Restated Credit Agreement, dated as of March 26, 2018, among
Six Flags Entertainment Corporation, Six Flags Operations Inc., Six Flags Theme Parks Inc., the
Subsidiary Guarantors (as defined therein) from time to time party thereto, the Lenders (as defined
therein) from time to time party thereto and Wells Fargo Bank, National Association, as administrative
agent—incorporated by reference to Exhibit 10.1 to Registrant’s Quarterly Report on Form 10-Q
(File No. 001-13703) filed on April 25, 2018.
10.44 First Incremental Amendment to Amended and Restated Credit Agreement, dated as of April 18, 2018,
by and among Six Flags Entertainment Corporation, Six Flags Operations Inc., Six Flags Theme Parks
Inc., the Subsidiary Guarantors (as defined therein) from time to time party thereto, the Lenders
(as defined therein) from time to time party thereto, the Incremental Term Lenders (as defined therein),
and Wells Fargo Bank, National Association, as administrative agent—incorporated by reference to
Exhibit 10.2 to Registrant’s Quarterly Report on Form 10-Q (File No. 001-13703) filed on
April 25, 2018.
10.45† Retirement Agreement, dated as of March 7, 2019, by and between James Reid-Anderson and
Six Flags Entertainment Corporation—incorporated by reference to Exhibit 10.1 to Registrant’s Current
Report on Form 8-K (File No. 001-13703) filed on March 7, 2019.
100
ExhibitNumber Exhibit Description
10.46 $1,150,000,000 Second Amended and Restated Credit Agreement , dated as of April 17, 2019, among
the Company, SFO and SFTP and several lenders, Wells Fargo Bank, National Association, as
administrative agent, an issuing lender and a swingline lender, Wells Fargo Securities, LLC and Merrill
Lynch, Pierce, Fenner & Smith Incorporated, as joint lead arrangers, Barclays Bank PLC, JPMorgan
Chase Bank, N.A., Compass Bank, HSBC Bank USA, National Association and PNC Bank,
National Association, as co-documentation agents, Bank of America, N.A. and Goldman Sachs Bank
USA, as co-syndication agents, and Wells Fargo Securities, LLC, Barclays Bank PLC, Goldman Sachs
Bank USA, JPMorgan Securities LLC, Merrill Lynch, Pierce, Fenner & Smith Incorporated and HSBC
Bank USA, National Association, as joint bookrunners—incorporated by reference to Exhibit 10.1 to
Registrant’s Current Report on Form 8-K (File No. 001-13703) filed on April 17, 2019.
10.47 Second Amended and Restated Guarantee and Collateral Agreement, dated as of April 17, 2019, among
the Company, SFO and SFTP, the other grantors party thereto, and Wells Fargo Bank, National
Association, as administrative agent—incorporated by reference to Exhibit 10.2 to Registrant’s Current
Report on Form 8-K (File No. 001-13703) filed on April 17, 2019.
10.48† Employment Agreement, dated as of October 24, 2019, by and between Michael Spanos and Six Flags
Entertainment Corporation—incorporated by reference to Exhibit 10.1 to Registrant’s Current Report
on Form 8-K (File No. 001-13703) filed on October 24, 2019.
10.49† Transition and Retirement Agreement, dated as of November 15, 2019, by and between Lance Balk
and Six Flags Entertainment Corporation—incorporated by reference to Exhibit 10.1 to Registrant’s
Current Report on Form 8-K (File No. 001-13703) filed on November 15, 2019.
10.50 Cooperation Agreement, dated as of January 30, 2020, by and among Six Flags Entertainment
Corporation and H Partners Management, LLC and certain of its affiliates—incorporated by reference
to Exhibit 10.1 to Registrant’s Current Report on Form 8-K (File No. 001-13703) filed on January 31,
2020.
10.51†* Amendment No.1 to Employment Agreement, dated as of February 18, 2020, by and between Michael
Spanos and Six Flags Entertainment Corporation.
10.52†* Transition and Retirement Agreement, dated as of February 19, 2020, by and between Marshall Barber
and Six Flags Entertainment Corporation.
21.1* Subsidiaries of the Registrant.
23.1* Consent of Independent Registered Public Accounting Firm.
31.1* Certification of Chief Executive Officer, pursuant to Section 302 of the Sarbanes-Oxley Act of 2002.
31.2* Certification of Chief Financial Officer, pursuant to Section 302 of the Sarbanes-Oxley Act of 2002.
32.1* Certification of Chief Executive Officer, pursuant to Section 906 of the Sarbanes-Oxley Act of 2002.
32.2* Certification of Chief Financial Officer, pursuant to Section 906 of the Sarbanes-Oxley Act of 2002.
101* The following financial statements and footnotes from the Company’s Annual Report on Form 10-K
for the year ended December 31, 2019 formatted in Inline XBRL: (i) the Audited Consolidated
Balance Sheets, (ii) the Audited Consolidated Statements of Operations, (iii) the Audited Consolidated
Statements of Comprehensive Income, (iv) the Consolidated Statements of Stockholders’ Deficit,
(v) the Audited Statements of Cash Flow, and (vi) related Notes to the Consolidated Financial
Statements
104* The cover page from the Company’s Annual Report on Form 10-K for the year ended December 31,
2019, formatted in Inline XBRL
* Filed herewith
† Management contract or compensatory plan
101

(b) Exhibits
See Item 15(a)(3) above.
Neither Six Flags Entertainment Corporation, nor any of its consolidated subsidiaries, has outstanding any
instrument with respect to its long-term debt, other than those filed as an exhibit to this Annual Report, under
which the total amount of securities authorized exceeds 10% of the total assets of Six Flags Entertainment
Corporation and its subsidiaries on a consolidated basis. Six Flags Entertainment Corporation hereby agrees to
furnish to the SEC, upon request, a copy of each instrument that defines the rights of holders of such long-term
debt that is not filed or incorporated by reference as an exhibit to this Annual Report.
Six Flags Entertainment Corporation will furnish any exhibit upon the payment of a reasonable fee, which
fee will be limited to Six Flags Entertainment Corporation’s reasonable expenses in furnishing such exhibit.
102
SIGNATURES
Pursuant to the requirements of Section 13 or 15(d) of the Securities Exchange Act of 1934, the Registrant
has duly caused this Form 10-K to be signed on its behalf by the undersigned, thereunto duly authorized.
Date: February 20, 2020
SIX FLAGS ENTERTAINMENT CORPORATION
By: /s/ MICHAEL SPANOS
Michael Spanos
President and Chief Executive Officer
Pursuant to the requirements of the Securities Exchange Act of 1934, this report has been signed by the
following persons on behalf of the Registrant and in the following capacities on the dates indicated.
Signature Title Date
/s/ MICHAEL SPANOS President and Chief Executive Officer
(Principal Executive Officer) February 20, 2020Michael Spanos
/s/ MARSHALL BARBER Executive Vice President and Chief Financial Officer
(Principal Financial Officer) February 20, 2020Marshall Barber
/s/ TAYLOR BROOKS Vice President and Chief Accounting Officer
(Principal Accounting Officer) February 20, 2020Taylor Brooks
/s/ RICHARD W. ROEDEL
Non-Executive Chairman February 20, 2020Richard W. Roedel
/s/ KURT CELLAR
Director February 20, 2020Kurt Cellar
/s/ NANCY A. KREJSA
Director February 20, 2020Nancy A. Krejsa
/s/ JON L. LUTHER
Director February 20, 2020Jon L. Luther
/s/ STEPHEN D. OWENS
Director February 20, 2020Stephen D. Owens
/s/ ARIK RUCHIM
Director February 20, 2020Arik Ruchim
103

Six Flags Enter tainment Corporation
924 Avenue J East
Grand Prair ie, Texas 75050
972-595-5000
www.sixflags .com
2 0 1 9 A N N U A L R E P O R T