Embed Size (px)
Citation preview
BUDGET 2020
Fiscal PlanA Plan for Jobs and the Economy2020 – 23
Alberta Treasury Board and Finance
Communications
9th floor, Edmonton Federal Building
9820 – 107 Street NW
Edmonton, Alberta, T5K 1E7
Telephone: 780 427-5364
Toll-free within Alberta: 310-0000 then 780 427-5364
For electronic copies of Budget 2020: Fiscal Plan visit our website at:
alberta.ca/budget-documents.aspx
ISBN 978-1-4601-4716-0 (Print) ISBN 978-1-4601-4717-7 (Online) ISSN 2369-0119 (Print)
ISSN 2369-0127 (Online)
Copyright © 2020 President of Treasury Board and Minister of Finance and its licensors. All rights reserved.
PRESENTED BY
TRAVIS TOEWSPRESIDENT OF TREASURY BOARD AND MINISTER OF FINANCE
in the Legislative Assembly of AlbertaFebruary 27, 2020
BUDGET 2020
GOVERNMENT OF ALBERTA | 2020 –23
Fiscal Plan2020 –23
2 Fiscal Plan 2020 – 23
Accountability Statement
The government’s Fiscal Plan for the three years commencing April 1, 2020 was prepared under my direction in accordance with the Fiscal Planning and Transparency Act and the government’s accounting policies. All of the government’s policy decisions as of February 14, 2020 with material economic or fiscal implications have been considered in preparing the three year Fiscal Plan.
Travis Toews President of Treasury Board and Minister of Finance February 14, 2020
Original signed by
3 Fiscal Plan 2020 – 23
Fiscal Plan 2020 – 23
Overview . . . . . . . . . . . . . . . . . . . . . . . . . . . . . . . . . . . . . . . . . . . . . . . . . . . . . . . . . . . . . . . . 5
A Blueprint for Jobs . . . . . . . . . . . . . . . . . . . . . . . . . . . . . . . . . . . . . . . . . . . . . . . . . . . . . . . . 23
Economic Outlook . . . . . . . . . . . . . . . . . . . . . . . . . . . . . . . . . . . . . . . . . . . . . . . . . . . . . . . . . 49
A Fair Deal for Alberta . . . . . . . . . . . . . . . . . . . . . . . . . . . . . . . . . . . . . . . . . . . . . . . . . . . . . . 83
Revenue . . . . . . . . . . . . . . . . . . . . . . . . . . . . . . . . . . . . . . . . . . . . . . . . . . . . . . . . . . . . . . . . . 99
Expense . . . . . . . . . . . . . . . . . . . . . . . . . . . . . . . . . . . . . . . . . . . . . . . . . . . . . . . . . . . . . . . . . 119
Capital Plan . . . . . . . . . . . . . . . . . . . . . . . . . . . . . . . . . . . . . . . . . . . . . . . . . . . . . . . . . . . . . . 147
Tax Plan . . . . . . . . . . . . . . . . . . . . . . . . . . . . . . . . . . . . . . . . . . . . . . . . . . . . . . . . . . . . . . . . . 167
Debt . . . . . . . . . . . . . . . . . . . . . . . . . . . . . . . . . . . . . . . . . . . . . . . . . . . . . . . . . . . . . . . . . . . . 189
Fiscal Plan Tables . . . . . . . . . . . . . . . . . . . . . . . . . . . . . . . . . . . . . . . . . . . . . . . . . . . . . . . . . . 205
Response to the Auditor General . . . . . . . . . . . . . . . . . . . . . . . . . . . . . . . . . . . . . . . . . . . . . . 223
Note: Amounts presented in tables may not add to totals due to rounding.

4
BLANK PAGE
5
BUDGET 2020
GOVERNMENT OF ALBERTA | 2020–23
Fiscal PlanOverview
6 Overview | Fiscal Plan 2020 – 23
Overview . . . . . . . . . . . . . . . . . . . . . . . . . . . . . . . . . . . . . . . . . . . . . . . . . . . . . . . . . . . . . . . . . . . . . . . . . . . . . 7
A Plan for Jobs and the Economy . . . . . . . . . . . . . . . . . . . . . . . . . . . . . . . . . . . . . . . . . . . . . . . . . . . . . . . . . . . 7
Open for Business . . . . . . . . . . . . . . . . . . . . . . . . . . . . . . . . . . . . . . . . . . . . . . . . . . . . . . . . . . . . . . . . . . . . . . 8
Standing Up for Alberta . . . . . . . . . . . . . . . . . . . . . . . . . . . . . . . . . . . . . . . . . . . . . . . . . . . . . . . . . . . . . . . . . . 10
Making Life Better for Albertans . . . . . . . . . . . . . . . . . . . . . . . . . . . . . . . . . . . . . . . . . . . . . . . . . . . . . . . . . . . 13
Investing in Infrastructure . . . . . . . . . . . . . . . . . . . . . . . . . . . . . . . . . . . . . . . . . . . . . . . . . . . . . . . . . . . . . . . . 15
Revenue . . . . . . . . . . . . . . . . . . . . . . . . . . . . . . . . . . . . . . . . . . . . . . . . . . . . . . . . . . . . . . . . . . . . . . . . . . . . . . 16
Expense . . . . . . . . . . . . . . . . . . . . . . . . . . . . . . . . . . . . . . . . . . . . . . . . . . . . . . . . . . . . . . . . . . . . . . . . . . . . . . 17
Energy and Economic Assumptions . . . . . . . . . . . . . . . . . . . . . . . . . . . . . . . . . . . . . . . . . . . . . . . . . . . . . . . . . 18
Risk Management . . . . . . . . . . . . . . . . . . . . . . . . . . . . . . . . . . . . . . . . . . . . . . . . . . . . . . . . . . . . . . . . . . . . . . 19
Deficit and Debt . . . . . . . . . . . . . . . . . . . . . . . . . . . . . . . . . . . . . . . . . . . . . . . . . . . . . . . . . . . . . . . . . . . . . . . 20
Fiscal Summary . . . . . . . . . . . . . . . . . . . . . . . . . . . . . . . . . . . . . . . . . . . . . . . . . . . . . . . . . . . . . . . . . . . . . . . . 22
Table of Contents
Note: Amounts presented in tables may not add to totals due to rounding.
7Overview | Fiscal Plan 2020 – 23
Overview
A Plan for Jobs and the EconomyBudget 2020 takes a measured approach to fiscal management focused on getting Albertans back to work, making life better for Albertans, and standing up for Alberta . This budget provides the means to effectively and sustainably deliver public services, and enable job creation by using all tools at the government's disposal to support private sector growth .
Alberta has been challenged by difficult economic times and a slow recovery since 2015 . This budget, like Budget 2019, reflects the choices we are making to ensure the world knows Alberta is open for business . Albertans and Alberta businesses will continue to pay less in overall tax than any other province . The corporate tax rate will continue to be reduced as promised, and we continue to fight for market access for our resources, and a fair return for Alberta’s financial contributions to Canada . With tax competitiveness, reductions to red tape and a renewed focus on investment attraction, this government is demonstrating its commitment to the long-term sustainable growth of Alberta’s economy .
This budget provides sustainable and appropriate funding for public services including health, education, and social services . The spending in these areas accounts for 76 per cent of the total expense as we maintain front-line public services for those who need them most . This commitment is coupled with a drive for the efficient use of taxpayer resources and bringing costs for government services in line with the national average over the next three years .
Budget 2020 reflects increases in operating expense over Budget 2019 for agencies, boards, and commissions, including post-secondary institutions . This increase in expense is fully off-set by revenue . This is in line with the MacKinnon Panel recommendation to expand revenues from sources other than provincial grants .
We continue to address Alberta’s financial debt responsibly by keeping expenses in line with expected revenues . Fiscal success will be a product of both financial discipline, and our success in attracting investment for economic growth and job creation .
8 Overview | Fiscal Plan 2020 – 23
Open for BusinessThe government’s economic reforms will continue to centre on improving our economic fundamentals and attracting investment . Our focus continues to be on transforming an over-regulated economy into one that is more efficient, flexible and open . The priority for this government is growth of the private sector, which is the engine of growth for creating jobs, increasing trade and generating tax revenue .
Supporting Investment and Jobs
Budget 2020 continues to lay the foundation for viable and sustainable economic growth . Actions in this fiscal plan include:
• Continuing to reduce the corporate income tax rate from 12 per cent to eight per cent in under three years so businesses can grow and create more jobs .
• Returning to a low-rate, broad-based tax approach that supports the whole economy and encourages sustainable economic diversification .
• Supporting pipeline projects and continuing to work with partners to improve egress to get our natural resources to global markets .
• Modernizing our regulatory environment to reduce the burden on job creators .
Alberta has abundant natural resources, a pristine environment,
enviable living standards and a well-educated and highly-skilled
workforce.
pdf named: B20_FP_OVW_kfm_tb.pdf Budget 2020Overview Section
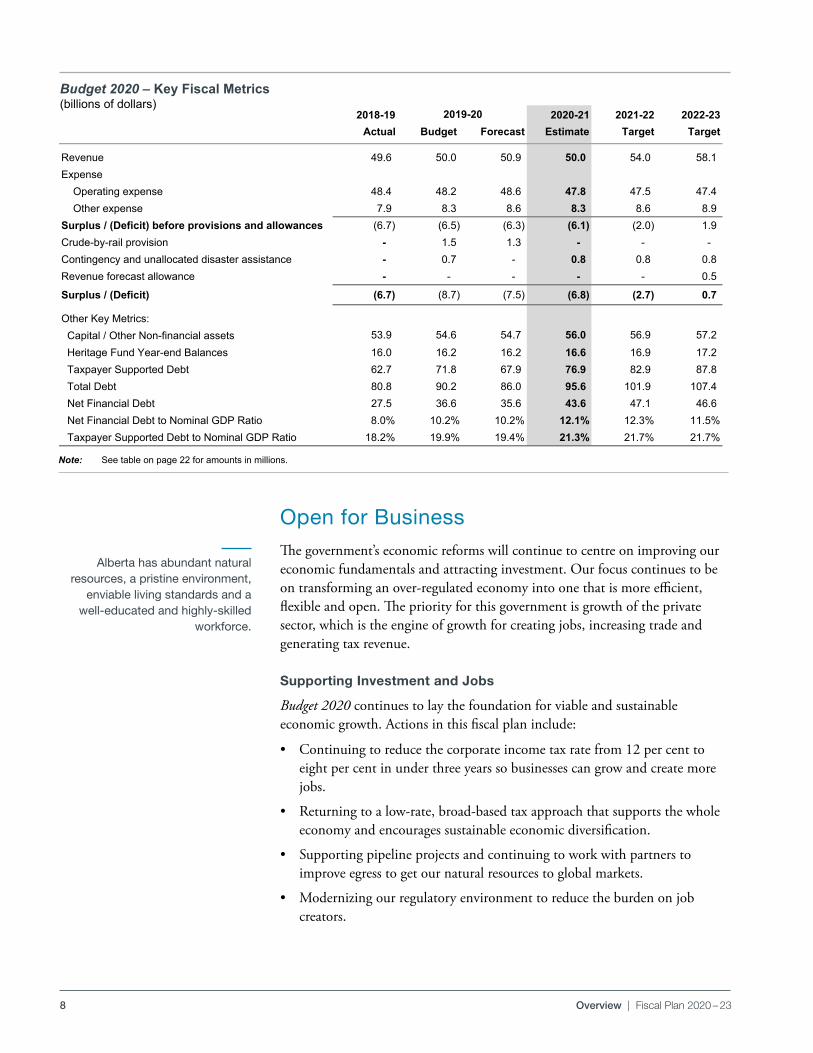
Budget 2020 ‐ Key Fiscal Metrics(billions of dollars)
2018-19 2020-21 2021-22 2022-23Actual Budget Forecast Estimate Target Target
Revenue 49.6 50.0 50.9 50.0 54.0 58.1 Expense Operating expense 48.4 48.2 48.6 47.8 47.5 47.4 Other expense 7.9 8.3 8.6 8.3 8.6 8.9 Surplus / (Deficit) before provisions and allowances (6.7) (6.5) (6.3) (6.1) (2.0) 1.9 Crude-by-rail provision - 1.5 1.3 - - - Contingency and unallocated disaster assistance - 0.7 - 0.8 0.8 0.8 Revenue forecast allowance - - - - - 0.5
Surplus / (Deficit) (6.7) (8.7) (7.5) (6.8) (2.7) 0.7
Other Key Metrics: Capital / Other Non-financial assets 53.9 54.6 54.7 56.0 56.9 57.2 Heritage Fund Year-end Balances 16.0 16.2 16.2 16.6 16.9 17.2 Taxpayer Supported Debt 62.7 71.8 67.9 76.9 82.9 87.8 Total Debt 80.8 90.2 86.0 95.6 101.9 107.4 Net Financial Debt 27.5 36.6 35.6 43.6 47.1 46.6 Net Financial Debt to Nominal GDP Ratio 8.0% 10.2% 10.2% 12.1% 12.3% 11.5% Taxpayer Supported Debt to Nominal GDP Ratio 18.2% 19.9% 19.4% 21.3% 21.7% 21.7%
pdf named: B20_FP_OVW_kfm_tb.pdf
2019-20
S:\TBF\MinShare\PublnsProd\CorpFin\OBM.PUBLNS‐2020‐21\B20_Fiscal‐Plan_vol\01_Overview_B20\Source docs\Bud20_FP_Overview_tables/ Key Fiscal Metrics Last update: 2/19/2020 /3:12 PM
Note: See table on page 22 for amounts in millions.
Budget 2020 – Key Fiscal Metrics(billions of dollars)

9Overview | Fiscal Plan 2020 – 23
New investment support services, based on advice and input from job creators themselves, will lead to more investment.
The intent is to limit the number of industries supported by ongoing government subsidies, and reduce corporate taxes overall to improve the cost competitiveness of all sectors .
The government is focussed on investments and exports, and promoting the province around the world to attract more business investment to Alberta . Specifically, the government:
• Confirmed its $1 .1 billion commitment to the Petrochemicals Diversification Program . This will attract large-scale projects by providing royalty credits to companies that build facilities to turn ethane, methane and propane feedstocks into products such as plastics, fabrics and fertilizers . Royalty credits are issued once projects become operational .
• Eliminated barriers to domestic free trade and supporting internal trade to support all industries .
• Will introduce an Investment and Growth Strategy that will focus on areas of comparative economic advantage in our resource-based industries of energy and agriculture, and in other sectors that fuel momentum and growth in the provincial economy . These include forestry, technology, data and telecom, tourism and financial services . This strategy includes$75 million over the next three years to boost Alberta’s attractiveness to global investors and support investment attraction .
• Tasked Alberta Innovates to support research, innovation and commercialization to develop and advance talent, to grow sectors, and to leverage funding from partners and the private sector with more than$184 million .
Making it easier to do business
Unnecessary red tape prevents job creators from creating jobs and businesses from growing, and generally makes life difficult for all of us . These regulatory burdens are costing Albertans money and time .
Our goal is simple: identify and cut the red tape that is preventing Albertans from obtaining the services they need and eliminate unnecessary red tape by at least one-third . The government successfully addressed hundreds of unnecessary regulatory requirements, including rewarding Alberta ranchers who go above and beyond environmental standards with extended 20-year leases . This gives ranchers long-term economic stability and clears the backlog of leases awaiting approval . We also reduced delays for forest-management agreements to support forestry jobs and ensure the best environmental and resource-management outcomes for Albertans . We will increase resources for the Surface Rights Board to address the backlog of applications made by landowners regarding surface access and compensation .
In Budget 2020, ministry business plans are required to identify reductions in the regulatory burden for Albertans and Alberta businesses .
Doing business is easier with greater market access certainty . Government will continue to stand up for Alberta by advocating for increased market access and protecting the value of our energy exports to grow our economy and create jobs .
Alberta boasts popular tourist destinations, stable and reliable government and institutions, highly sought-after education facilities, a world-leading service sector and highly competitive industries.
10 Overview | Fiscal Plan 2020 – 23
Standing Up for AlbertaAlberta is driving a national conversation with the federal government to collaborate on priorities and provide greater flexibility to provincial governments in the use of federal funding . This will allow the provinces to best meet the growing demands for services and infrastructure .
Our goal is to support job creation and promote a strong and dynamic private sector for long-term provincial sustainability . This has not recently been the case, as growth of the government sector in Canada has outpaced that of the private sector since 2015 . This is not sustainable, nor does it create long term prosperity for the province .
Current state of federal fiscal relations
Alberta contributes more, per person, to the national economy than any other province . With only 12 per cent of the Canadian population, Alberta attracts a quarter of all capital investment in Canada and is responsible for more than a fifth of all Canadian goods exported internationally . Simply put, the well-being of Alberta's economy is vital to the Canadian standard of living .
Albertans contribute disproportionately to federal coffers . Alberta's fiscal contribution to Canada - the difference between federal taxes raised in Alberta and federal spending in the province - has totalled over $210 billion in 2018 dollars over the last decade .
Under Canada’s federal system, provinces have primary responsibility for delivering education, health and social services, highways, the administration of justice, and local government . Provinces also play a significant role in their regional economic development . Yet provinces have limited access to efficient, stable revenue sources to fund their expenditures . This means Alberta is forced to rely on federal funding to deliver essential services . Over time, federal transfers to provinces have become complex and uncertain, and they do a poor job of encouraging regional development .
Federal fiscal arrangements must be reformed if provinces are going to be able to address long-term revenue and expenditure challenges and provide citizens with value for money in return for their taxes . A federal system that recognizes the role of provinces and provides appropriate incentives for economic development and expenditure restraint is fundamental .
In light of these challenges, it is time to review the system of fiscal federalism to ensure it delivers fair and stable revenue to Alberta and it positions the province to meet future challenges .
11Overview | Fiscal Plan 2020 – 23
A Fair Deal
The government is seeking advice and input from Albertans to enhance Alberta’s role within the Canadian federation, a role commensurate with the size of Alberta’s economic contribution to the rest of Canada . The Fair Deal Panel is listening to Albertans and their ideas for Alberta's future .
The panel is expected to deliver its report at the end of March 2020 . This report will inform the future advancement of Alberta’s interests and allow government to have focussed discussions with federal counterparts .
While the panel explores broad strategic initiatives, the Alberta government continues its advocacy with the federal government to improve our economy and create jobs . Immediate actions include:
• Obtaining firm guarantees on the construction and completion of the Trans Mountain pipeline .
• Lifting the arbitrary per capita cap on the Fiscal Stabilization Program back to 2015-16, resulting in a $2 .4 billion rebate .
• Seeking federal approval of flow-through shares or other tax instruments to further increase job creating investment in environmental technology . This would be an incentive to accelerate well reclamation and to continue Alberta’s work in reducing greenhouse gas (GHG) emissions . In turn, that will make our oil and gas industry more competitive for attracting capital and it will create jobs .
• Since July 2019, Alberta removed more than 80 per cent of its Canadian Free Trade Agreement exceptions . Alberta continues to call on other provinces and territories to follow Alberta’s lead and make Canada a true economic union . Doing so demonstrates globally that Canada is open for business and for investment .
• Alberta will champion a bold initiative to remove barriers to interprovincial labour mobility through recognition of Canadian professional and trade certification .
• Alberta continues to push other provinces to allow goods, services, capital and workers to flow freely and make it easier for businesses to grow across provincial boundaries and lower costs for taxpayers .
• Alberta remains the most open and vibrant liquor marketplace in Canada, the prime example that free trade in alcohol is possible in Canada . Alberta continues to push other governments to open their markets so consumers can easily buy fine liquor products from Alberta and the rest of Canada .
Improvements to trade will deliver net gains to the economy . So will tax competitiveness and the delivery of essential infrastructure services including energy, transport and communications . The Alberta government will continue to promote reductions of trade barriers, including through invitations to join the New West Partnership, and through development of energy and resource corridors .
Internal Trade
Internal barriers to trade and labour mobility within Canada are estimated to cost the Canadian economy between $50 billion and $130 billion every year . Every action that removes trade barriers stands to improve Alberta’s economy . Alberta is leading the way on reducing internal trade barriers across the country .
12 Overview | Fiscal Plan 2020 – 23
• Getting clear unequivocal support for future liquefied natural gas projects that will significantly reduce GHG emissions by accelerating coal-to-gas conversion in the developing world .
Government will continue to use all tools at its disposal to drive economic growth in Alberta . These actions, including improving market access for Canadian energy, will contribute to national prosperity . They deserve the support of Canada's national and other provincial governments .
With our abundance of natural resources, a highly skilled workforce, and more than 100 years of experience in the energy industry, Alberta is a leader for clean, secure, and ethically sourced energy .
Companies operating in Alberta meet the highest human rights and environmental standards in the world . The Government of Alberta strives to create an environment in which industry can thrive as it balances social, economic, and environmental impacts . Our first-class regulatory system and support for cutting-edge technology and innovation have facilitated an overall decrease of 19 per cent in oilsands emissions between 2011 and 2017 (Source: Alberta Oil Sands Greenhouse Gas Emission Intensities Analysis) . With additional technology, we expect a further decline of close to 20 per cent in greenhouse gas (GHG) emissions intensity by 2030 . New innovative technologies developed in Alberta are resulting in less water use and lower emissions . Imperial’s new cyclic solvent process could eliminate the use of steam and reduce emissions by up to 90 per cent . Several companies are also working towards net-zero emissions, including Canadian Natural and MEG Energy .
Natural gas and Liquefied Natural Gas (LNG) also help us breathe new life into our oil and gas sector while providing global energy security . Our government recognizes the importance of the full natural gas value chain, which is why we confirmed our $1 .1 billion commitment to the Petrochemical Diversification Program, providing royalty credits to privately funded large-scale petrochemical projects .
We also returned Alberta to an energy-only market to provide certainty in the competitive market for renewable energy . Since we announced this decision, more than $2 .7 billion in private investment has been announced for privately funded projects . Just one of these projects, BHE Canada’s Rattlesnake Ridge Wind Project, will supply electricity that’s equivalent to powering 79,000 homes . Another project, Suncor’s $1 .4 billion investment in replacing its coke-fired boilers with natural gas cogeneration technology, will generate 800 MW of power that will be added to Alberta’s grid – accounting for approximately eight per cent of the province’s current electricity demand .
In addition, Alberta’s natural gas has the potential to contribute to global carbon emission reduction by moving away from coal-generated power . LNG Canada estimates its new facility – which would export Alberta natural gas – could displace enough coal-fired electricity to reduce 60 to 90 million tonnes of CO₂ annually . At COP25, the UN’s Climate Change Conference, Alberta’s world leading methane policies and efforts were highlighted as a case study for the whole world .
We also want to ensure that all communities, particularly Indigenous communities, benefit from our economic strengths . The recent creation of the Alberta Indigenous Opportunities Corporation is just one example of how our government is doing just that – backstopping Indigenous equity investment and ownership of major energy infrastructure projects by up to $1 billion so Indigenous communities can share in our energy prosperity .
Alberta: Ready to meet the world's growing energy needs

13Overview | Fiscal Plan 2020 – 23
Supporting the Energy Sector
Improving market access for oil and for natural gas is a key focus of this government and is critical to the sustainability of Alberta's and Canada's economy . This includes fighting misinformation through the newly created Canadian Energy Centre, and supporting leaner and faster regulatory operations .
Government welcomes private sector, market-driven investments in technologies that add value to the province's oil and gas resources . Our government will continue to improve our approach to investment attraction to ensure we are well-known globally as a safe investment destination . In Budget 2019, government confirmed the adoption of the enhanced capital cost allowance (CCA) regime . The enhanced CCA rates will encourage Alberta businesses to invest, grow and modernize their operations .
Making Life Better for AlbertansBudget 2020 continues to implement the transparent plan set out by the government in its first budget . The government continues to make overdue reforms to deliver value for money . Most importantly, this budget continues to focus on helping those in our communities who are most in need .
We continue to strive to live within our provincial means . Government has to be vigilant to ensure we improve value for taxpayers and bring spending in line with other provinces . Otherwise, debt servicing costs (interest on what we have borrowed) will continue to limit our ability to fund public services like hospitals, continuing care centres and schools .
Funding is maintained for core social services for the most vulnerable:
• $27 billion per year or 56 per cent of total operating expense to provide health and social services, including programs that support Community and Social Services, Children's Services, and Seniors and Housing . This represents an increase of $55 million over 2019-20 .
• $8 .2 – $8 .3 billion per year for Education maintains current funding levels, and introduces a new funding and assurance framework that supports stability, parents' choice and system demands .
To keep funding stable, government intends to reform spending to address economic, social and fiscal challenges . These reforms will deliver better value for Albertans while:
• Ensuring government is agile and nimble in the face of disruption and technological change;
• Readying Alberta’s workforce and education system for the jobs of the future; and
• Supporting the province's most vulnerable citizens .
14 Overview | Fiscal Plan 2020 – 23
Honouring Commitments
Budget 2020 honours the commitments made in the platform and in Budget 2019 . Key examples include:
• Ongoing funding of $100 million for a mental health and addiction strategy, $40 million for an opioid response, and $20 million for palliative care .
• The government established the Alberta Indigenous Opportunities Corporation to facilitate up to $1 billion in Indigenous investment in natural resource projects and infrastructure .
• The Film and Television Tax Credit was introduced, supporting the industry with nearly $22 million in 2020-21, $31 million in 2021-22 and $45 million in 2022-23 .
• Fifty new prosecutors were funded .
• An agreement was put in place to enhance the fight against rural crime with more than 500 additional RCMP officer and civilian positions .
• The First Responders and Heroes Fund initiatives will provide $9 million over three years .
• The TIER program was implemented and will support $969 million for climate technologies and emissions reduction over the next three years .
• A Civil Society Empowerment Fund of $20 million was established to help community groups expand and thrive .
Efficient Public Services
As indicated in Budget 2019, government intends to bring the costs of public goods and services closer to national averages over the next three years . Many programs will be reformed and savings will be found to ensure more cost effective service delivery . This includes public-private partnerships that provide the same or better quality of service at lower cost . Government listened to Albertans about the need to deliver better services at better value .
Budget 2020 outlines reforms to education and post-secondary education funding models . The intent is to streamline administration and focus on classroom delivery to improve system performance, sustainability and labour market outcomes .
The new police funding model will distribute the costs of rural policing in an equitable, transparent and sustainable manner . Justice and Solicitor General will drive further efficiencies through digital information delivery, including Justice Digital .
15Overview | Fiscal Plan 2020 – 23
The Alberta Health Services (AHS) review, the first in the 10 years since AHS was formed, contains recommendations and savings opportunities to improve the quality and long-term sustainability of health services . The recommendations address four key areas: people, clinical services, non-clinical services and governance . The government accepts the report with two key exceptions: there will be no hospital closures or consolidation of urban trauma centres .
The AHS review identified a range of long-term savings initiatives with the potential to save between $1 .5 billion and $1 .9 billion annually . Every dollar of savings will be re-invested in the health care system to improve care for patients .
Investing in InfrastructureBudget 2020 provides the public infrastructure that families and communities need . The Capital Plan makes a commitment of $19 billion over three years . It honours previous public commitments to build and maintain key infrastructure projects and includes additional investments in health care facilities, schools, and transportation networks .
The 2020-2023 plan includes:
• $5 .6 billion for direct municipal support .
• $2 .7 billion for capital maintenance and renewal of public infrastructure .
• $2 .5 billion for health facilities .
• $2 .3 billion for roads and bridges .
• $1 .5 billion for schools .
• $353 million for family social supports and housing .
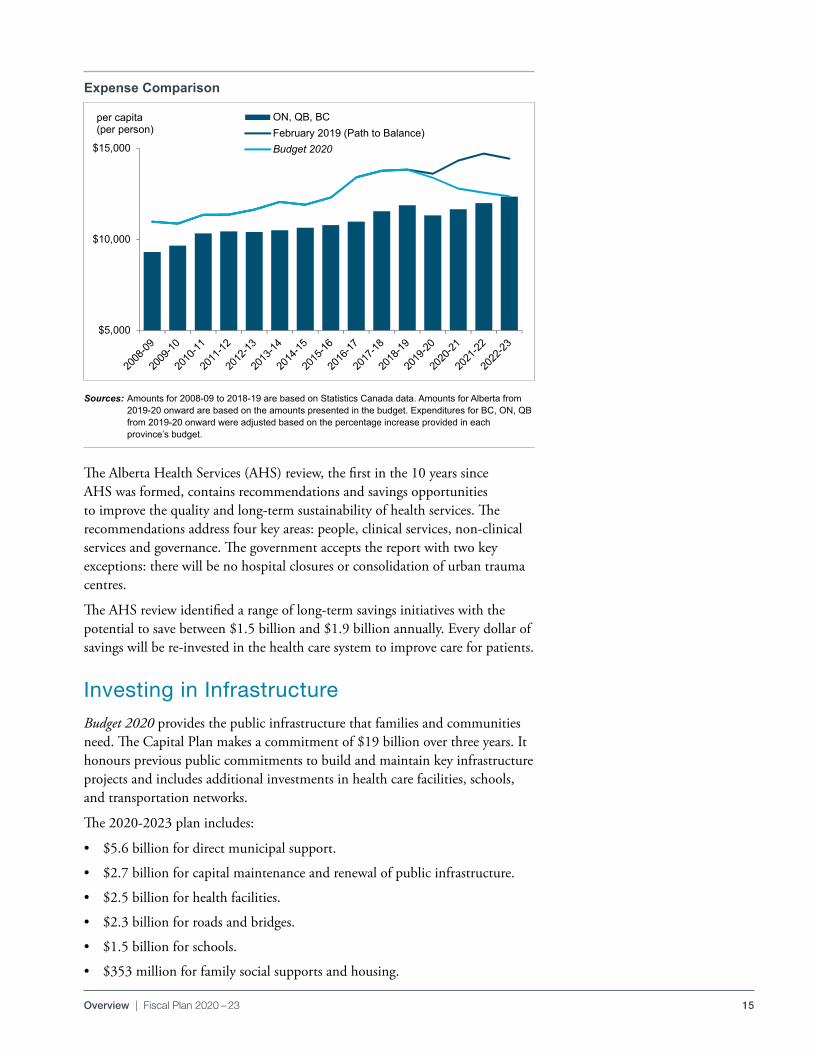
Sources: Amounts for 2008-09 to 2018-19 are based on Statistics Canada data. Amounts for Alberta from 2019-20 onward are based on the amounts presented in the budget. Expenditures for BC, ON, QB from 2019-20 onward were adjusted based on the percentage increase provided in each province’s budget.
pdf named: B20_FP_OVW_kfm_tb.pdf Budget 2020Overview Section
Expense Comparison
pdf named: B20_FP_OVW_exp.pdf
$5,000
$10,000
$15,000
per capita (per person)
ON, QB, BCFebruary 2019 (Path to Balance)Budget 2020
S:\TBF\MinShare\PublnsProd\CorpFin\OBM.PUBLNS-2020-21\B20_Fiscal-Plan_vol\06_EXPense_B20\source-docs\All overview tables/ Expense per capita Last update: 2/17/2020 /10:34 AM
Expense Comparison
16 Overview | Fiscal Plan 2020 – 23
• $288 million for post-secondary infrastructure .
The plan includes federal funding for capital programs . It also includes nearly $2 billion in self-financed capital by Alberta Health Services, school boards and post-secondary institutions for ancillary and other projects .
Capital spending in Alberta is maintained and focused on critical infrastructure such as schools, roads and health facilities . Plans are in place to partner with the private sector to deliver projects efficiently and effectively through P3s or other private-public arrangements .
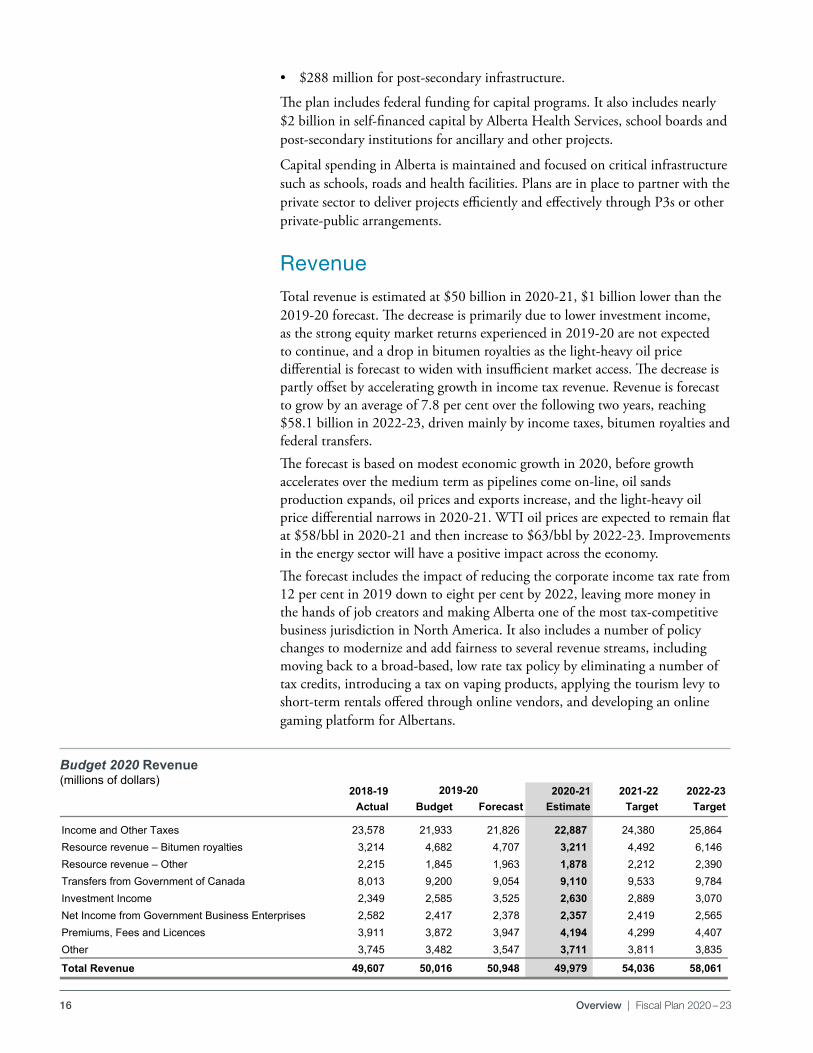
RevenueTotal revenue is estimated at $50 billion in 2020-21, $1 billion lower than the 2019-20 forecast . The decrease is primarily due to lower investment income, as the strong equity market returns experienced in 2019-20 are not expected to continue, and a drop in bitumen royalties as the light-heavy oil price differential is forecast to widen with insufficient market access . The decrease is partly offset by accelerating growth in income tax revenue . Revenue is forecast to grow by an average of 7 .8 per cent over the following two years, reaching $58 .1 billion in 2022-23, driven mainly by income taxes, bitumen royalties and federal transfers . The forecast is based on modest economic growth in 2020, before growth accelerates over the medium term as pipelines come on-line, oil sands production expands, oil prices and exports increase, and the light-heavy oil price differential narrows in 2020-21 . WTI oil prices are expected to remain flat at $58/bbl in 2020-21 and then increase to $63/bbl by 2022-23 . Improvements in the energy sector will have a positive impact across the economy .The forecast includes the impact of reducing the corporate income tax rate from 12 per cent in 2019 down to eight per cent by 2022, leaving more money in the hands of job creators and making Alberta one of the most tax-competitive business jurisdiction in North America . It also includes a number of policy changes to modernize and add fairness to several revenue streams, including moving back to a broad-based, low rate tax policy by eliminating a number of tax credits, introducing a tax on vaping products, applying the tourism levy to short-term rentals offered through online vendors, and developing an online gaming platform for Albertans .
pdf named: B20_FP_OVW_kfm_tb.pdf Budget 2020Overview Section
Budget 2020 Revenue (millions of dollars)
2018-19 2020-21 2021-22 2022-23Actual Budget Forecast Estimate Target Target
Income and Other Taxes 23,578 21,933 21,826 22,887 24,380 25,864 Resource revenue – Bitumen royalties 3,214 4,682 4,707 3,211 4,492 6,146 Resource revenue – Other 2,215 1,845 1,963 1,878 2,212 2,390 Transfers from Government of Canada 8,013 9,200 9,054 9,110 9,533 9,784 Investment Income 2,349 2,585 3,525 2,630 2,889 3,070 Net Income from Government Business Enterprises 2,582 2,417 2,378 2,357 2,419 2,565 Premiums, Fees and Licences 3,911 3,872 3,947 4,194 4,299 4,407 Other 3,745 3,482 3,547 3,711 3,811 3,835
Total Revenue 49,607 50,016 50,948 49,979 54,036 58,061
pdf named: B20_FP_OVW_B20-rev_tb.pdf
2019-20
S:\TBF\MinShare\PublnsProd\CorpFin\OBM.PUBLNS‐2020‐21\B20_Fiscal‐Plan_vol\01_Overview_B20\Source docs\Bud20_FP_Overview_tables/ budget 2020 revenue Last update: 2/18/2020 /4:30 PM
Budget 2020 Revenue(millions of dollars)
17Overview | Fiscal Plan 2020 – 23
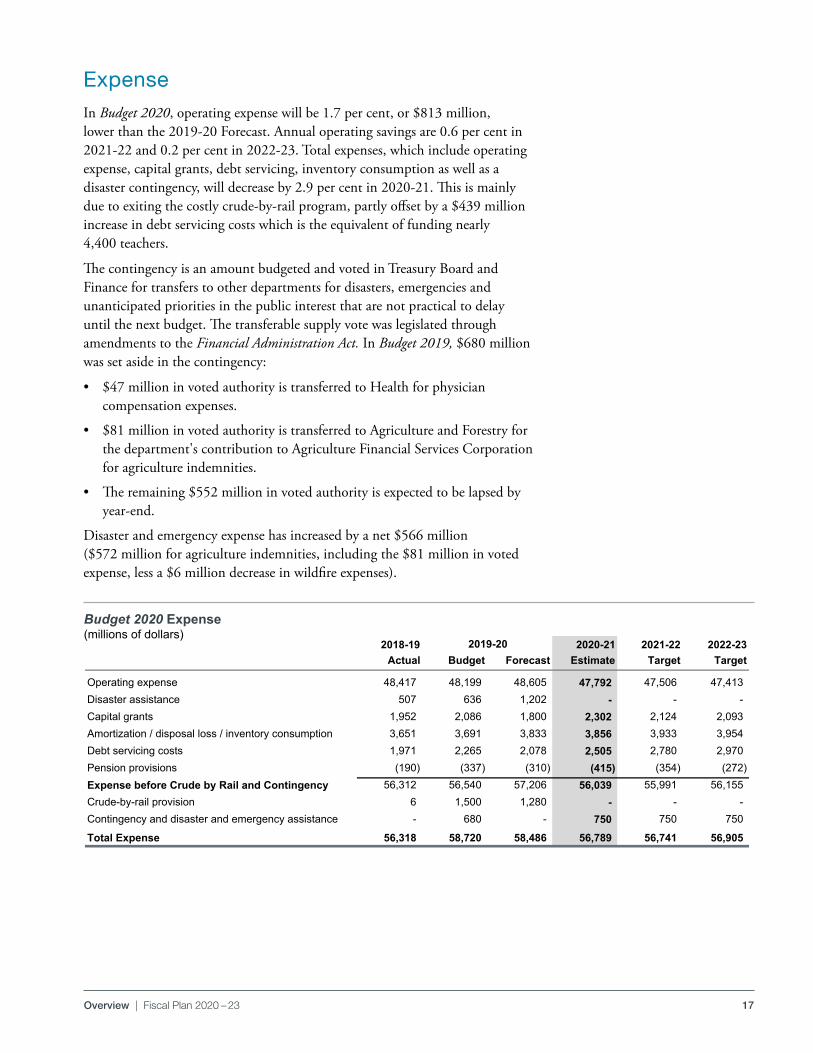
ExpenseIn Budget 2020, operating expense will be 1 .7 per cent, or $813 million, lower than the 2019-20 Forecast . Annual operating savings are 0 .6 per cent in 2021-22 and 0 .2 per cent in 2022-23 . Total expenses, which include operating expense, capital grants, debt servicing, inventory consumption as well as a disaster contingency, will decrease by 2 .9 per cent in 2020-21 . This is mainly due to exiting the costly crude-by-rail program, partly offset by a $439 million increase in debt servicing costs which is the equivalent of funding nearly 4,400 teachers .
The contingency is an amount budgeted and voted in Treasury Board and Finance for transfers to other departments for disasters, emergencies and unanticipated priorities in the public interest that are not practical to delay until the next budget . The transferable supply vote was legislated through amendments to the Financial Administration Act. In Budget 2019, $680 million was set aside in the contingency:
• $47 million in voted authority is transferred to Health for physician compensation expenses .
• $81 million in voted authority is transferred to Agriculture and Forestry for the department's contribution to Agriculture Financial Services Corporation for agriculture indemnities .
• The remaining $552 million in voted authority is expected to be lapsed by year-end .
Disaster and emergency expense has increased by a net $566 million ($572 million for agriculture indemnities, including the $81 million in voted expense, less a $6 million decrease in wildfire expenses) .
pdf named: B20_FP_OVW_B20‐Exp.tb.pdf Budget 2020Overview Section
Budget 2020 Expense (millions of dollars)
2018-19 2020-21 2021-22 2022-23Actual Budget Forecast Estimate Target Target
Operating expense 48,417 48,199 48,605 47,792 47,506 47,413 Disaster assistance 507 636 1,202 - - - Capital grants 1,952 2,086 1,800 2,302 2,124 2,093 Amortization / disposal loss / inventory consumption 3,651 3,691 3,833 3,856 3,933 3,954 Debt servicing costs 1,971 2,265 2,078 2,505 2,780 2,970 Pension provisions (190) (337) (310) (415) (354) (272) Expense before Crude by Rail and Contingency 56,312 56,540 57,206 56,039 55,991 56,155 Crude-by-rail provision 6 1,500 1,280 - - - Contingency and disaster and emergency assistance - 680 - 750 750 750
Total Expense 56,318 58,720 58,486 56,789 56,741 56,905
999 1.0%pdf named: B20_FP_OVW_B20-Exp-tb.pdf ‐2.1%
2019-20
S:\TBF\MinShare\PublnsProd\CorpFin\OBM.PUBLNS‐2020‐21\B20_Fiscal‐Plan_vol\01_Overview_B20\Source docs\Bud20_FP_Overview_tables/ budget 2020 expense Last update: 2/17/2020 /3:56 PM
Budget 2020 Expense(millions of dollars)
18 Overview | Fiscal Plan 2020 – 23
Alberta’s Public Sector
Spending on public sector compensation represents the most significant component of the government’s operating budget, at approximately 56 per cent of spending or $26 .7 billion in 2020-21 . In 2020, collective bargaining negotiations will begin with public sector unions . Aligning Alberta’s public sector compensation levels over time with those in similar provinces is responsible and fair, and will help the province continue to deliver the high quality supports and services that Albertans expect .
Budget 2020 continues to call for tight controls on public sector compensation . Expected position reductions for the year are outlined on pages 142 to 143 . Reductions – mainly through attrition – are expected by 2023-24 . Compensation reductions are commensurate with the expected reduction in full-time equivalent (FTE) positions .
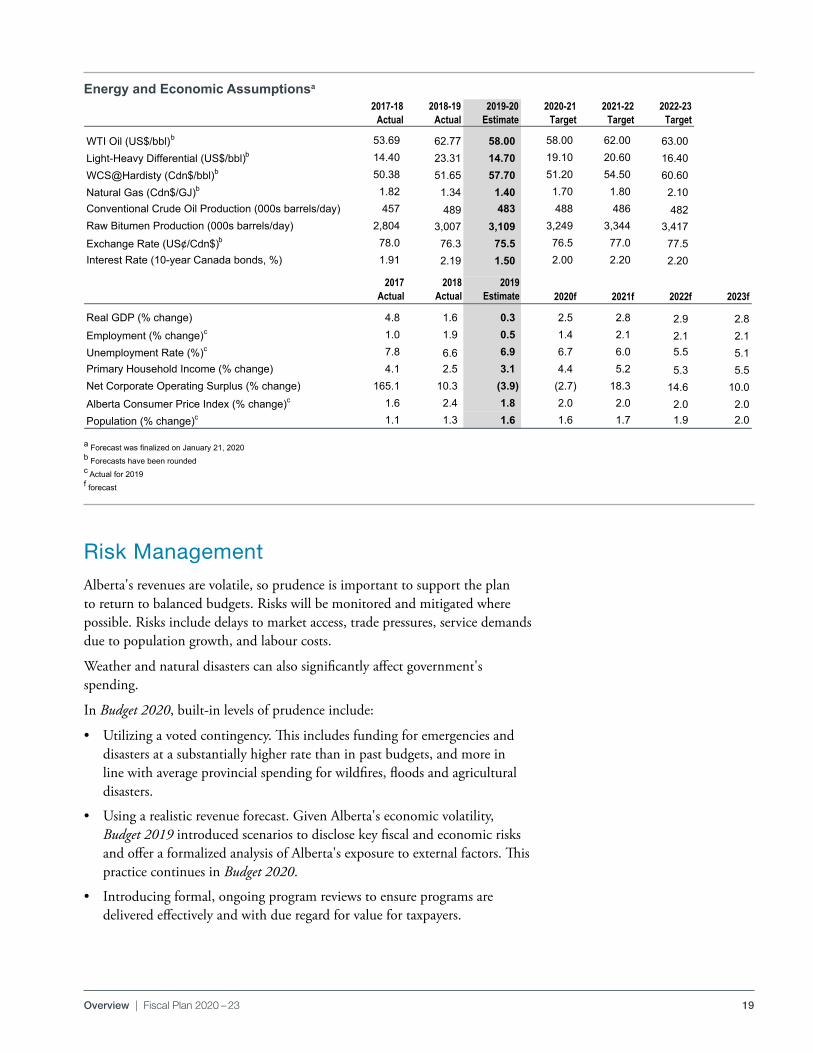
Energy and Economic AssumptionsThe Budget 2020 outlook is prudent, with a muted outlook for oil prices, a main revenue driver . After stagnating last year, real GDP is forecast to grow at a solid pace of 2 .5 per cent in 2020 as oil production rebounds and business investment finally turns a corner . Over the medium term, real GDP growth is forecast to accelerate to an average of 2 .8 per cent amid a continued pickup in business investment and gradually strengthening labour market . Despite the improvement, the forecast is consistent with a prolonged recovery . While real GDP is expected to return to 2014 levels this year, the economy is not assumed to reach full employment until 2023 .
As the economy moves from recovery into expansion, business investment will contribute more to growth . Reductions in the corporate income tax rate will make Alberta among the most attractive investment destinations in North America by 2022 . This, along with improved market access, will set the stage for long-term and sustainable investment in the province .
Solid fundamentals, including a relatively young and fast-growing population, will also support Alberta’s growth .
Although growth prospects are solid, external risks are high for Alberta’s trade and energy-driven economy . While the global economy is showing signs of stabilization and some of the trade and geopolitical uncertainties have subsided, other external risks that can impact global trade, investment and commodity prices remain elevated .
19Overview | Fiscal Plan 2020 – 23
Risk ManagementAlberta's revenues are volatile, so prudence is important to support the plan to return to balanced budgets . Risks will be monitored and mitigated where possible . Risks include delays to market access, trade pressures, service demands due to population growth, and labour costs .
Weather and natural disasters can also significantly affect government's spending .
In Budget 2020, built-in levels of prudence include:
• Utilizing a voted contingency . This includes funding for emergencies and disasters at a substantially higher rate than in past budgets, and more in line with average provincial spending for wildfires, floods and agricultural disasters .
• Using a realistic revenue forecast . Given Alberta's economic volatility, Budget 2019 introduced scenarios to disclose key fiscal and economic risks and offer a formalized analysis of Alberta's exposure to external factors . This practice continues in Budget 2020 .
• Introducing formal, ongoing program reviews to ensure programs are delivered effectively and with due regard for value for taxpayers .
pdf named: B20_FP_OVW_eaea‐tb.pdf Budget 2020Overview Section
Energy and Economic Assumptionsa
2017-18 2018-19 2019-20 2020-21 2021-22 2022-23Actual Actual Estimate Target Target Target
WTI Oil (US$/bbl)b 53.69 62.77 58.00 58.00 62.00 63.00 Light-Heavy Differential (US$/bbl)b 14.40 23.31 14.70 19.10 20.60 16.40 WCS@Hardisty (Cdn$/bbl)b 50.38 51.65 57.70 51.20 54.50 60.60 Natural Gas (Cdn$/GJ)b 1.82 1.34 1.40 1.70 1.80 2.10 Conventional Crude Oil Production (000s barrels/day) 457 489 483 488 486 482 Raw Bitumen Production (000s barrels/day) 2,804 3,007 3,109 3,249 3,344 3,417 Exchange Rate (US¢/Cdn$)b 78.0 76.3 75.5 76.5 77.0 77.5 Interest Rate (10-year Canada bonds, %) 1.91 2.19 1.50 2.00 2.20 2.20
2017 Actual
2018 Actual
2019 Estimate 2020f 2021f 2022f 2023f
Real GDP (% change) 4.8 1.6 0.3 2.5 2.8 2.9 2.8Employment (% change)c 1.0 1.9 0.5 1.4 2.1 2.1 2.1Unemployment Rate (%)c 7.8 6.6 6.9 6.7 6.0 5.5 5.1Primary Household Income (% change) 4.1 2.5 3.1 4.4 5.2 5.3 5.5Net Corporate Operating Surplus (% change) 165.1 10.3 (3.9) (2.7) 18.3 14.6 10.0Alberta Consumer Price Index (% change)c 1.6 2.4 1.8 2.0 2.0 2.0 2.0Population (% change)c 1.1 1.3 1.6 1.6 1.7 1.9 2.0
a Forecast was finalized on January 21, 2020b Forecasts have been roundedc Actual for 2019f-forecast
pdf named: B20_FP_OVW_eaea-tb.pdf
S:\TBF\MinShare\PublnsProd\CorpFin\OBM.PUBLNS‐2020‐21\B20_Fiscal‐Plan_vol\01_Overview_B20\Source docs\Bud20_FP_Overview_tables/Energy&EconAssumpt‐tbl‐OVW 2/17/2020/2:03 PM
Energy and Economic Assumptionsa
a Forecast was finalized on January 21, 2020b Forecasts have been roundedc Actual for 2019f forecast
20 Overview | Fiscal Plan 2020 – 23
• Identifying additional savings in-year for the purpose of re-allocation to new infrastructure projects that support job creation for the underemployed .
• Adding a revenue forecast allowance of $450 million in 2022-23 .
The government continues to monitor key risks . One unexpected development that materialized after the Budget 2020 forecast was finalized in mid-January is the rapid spread of the Coronavirus . WTI oil prices have dropped by over US$ 10/bbl since early January on expectations of weaker demand . However, as with SARS, most analysts believe the impact will be short term in nature . There are also concerns about the disruptions in the transport and export of goods .
The government will continue to track these and other developments, and provide quarterly updates on the fiscal situation . Should risks persist and materially affect the revenue outlook, the fiscal plan will be revisited in light of the commitment to balance the budget by 2022-23 .
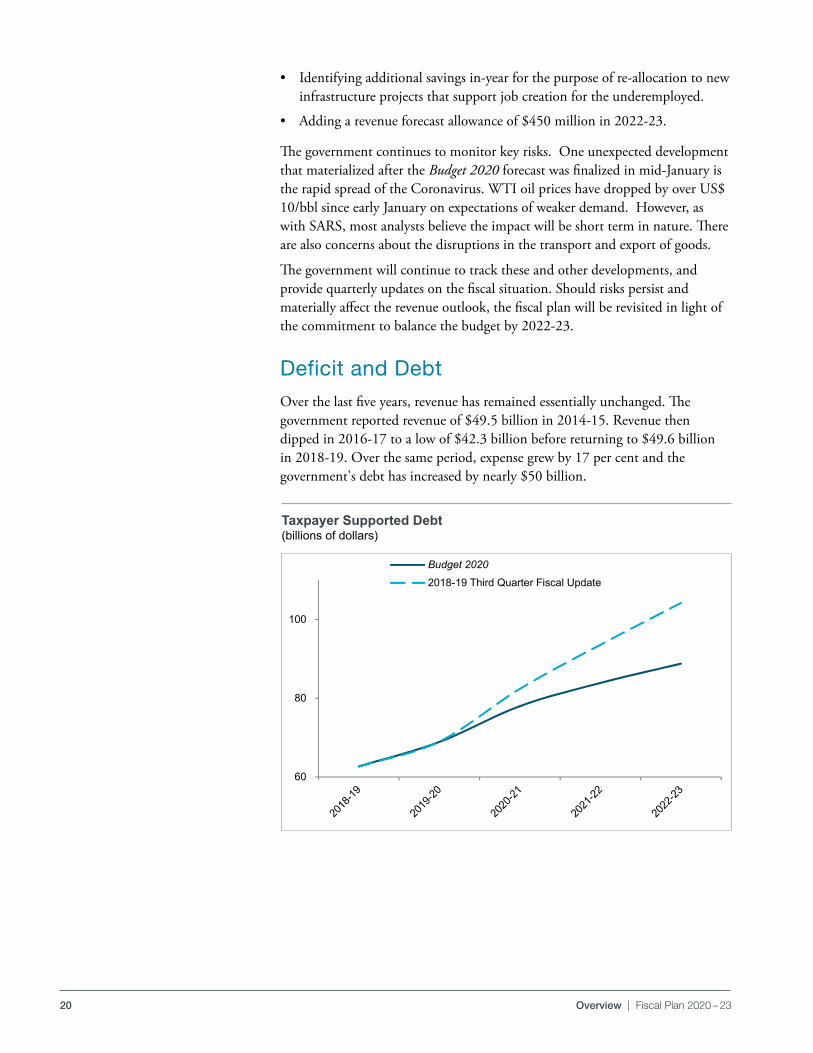
Deficit and DebtOver the last five years, revenue has remained essentially unchanged . The government reported revenue of $49 .5 billion in 2014-15 . Revenue then dipped in 2016-17 to a low of $42 .3 billion before returning to $49 .6 billion in 2018-19 . Over the same period, expense grew by 17 per cent and the government's debt has increased by nearly $50 billion .
Taxpayer Supported Debt(billions of dollars)
Budget 2020Debt Reduction
PDF Name: B20_FP_OVW_tsd.pdf
Taxpayer Supported Debt($ billions)
pdf name: B20_FP_OVW_tsd.pdf
60
80
100
Budget 2020
2018-19 Third Quarter Fiscal Update
Path: S:\TBF\MinShare\PublnsProd\CorpFin\OBM.PUBLNS‐2020‐21\B20_Fiscal‐Plan_vol\01_Overview_B20\Source docs\File: Bud20_FP_Overview_tablesTab: Taxpayer supported debt Last Updated: 2/15/2020 @ 4:08 PM
21Overview | Fiscal Plan 2020 – 23
Every $1 billion in debt reduction saves Albertans about $30 million in debt servicing costs . Budget 2020 will lower the financial burden for Alberta taxpayers and future generations .
The primary objective of government’s medium-term fiscal strategy is to eliminate deficits and create surpluses using credible expenditure plans . This is underpinned by four policy elements:
• Investing in infrastructure and spending that accelerates economic growth;
• Reducing the government’s share of the economy over time by controlling expenditure;
• Promoting policies that support revenue growth and increased investment without putting taxpayers at undue financial risk; and
• Strengthening Alberta’s net worth over time .
Once the deficit is eliminated, we will continue to be prudent and implement measures to pay down the debt .
Disciplined financial management through this budget will deliver government’s ambitious agenda and its platform commitments . We remain focused on delivering better outcomes, not bigger government . We remain resolute in our conviction that the public sector will deliver high quality services, with more innovation and nimbleness, resulting in a reduced burden to taxpayers .
22 Overview | Fiscal Plan 2020 – 23
Fiscal Summarypdf named: B20_FP_OVW_B20‐b2020fs‐tb.pdf Budget 2020
Overview Section
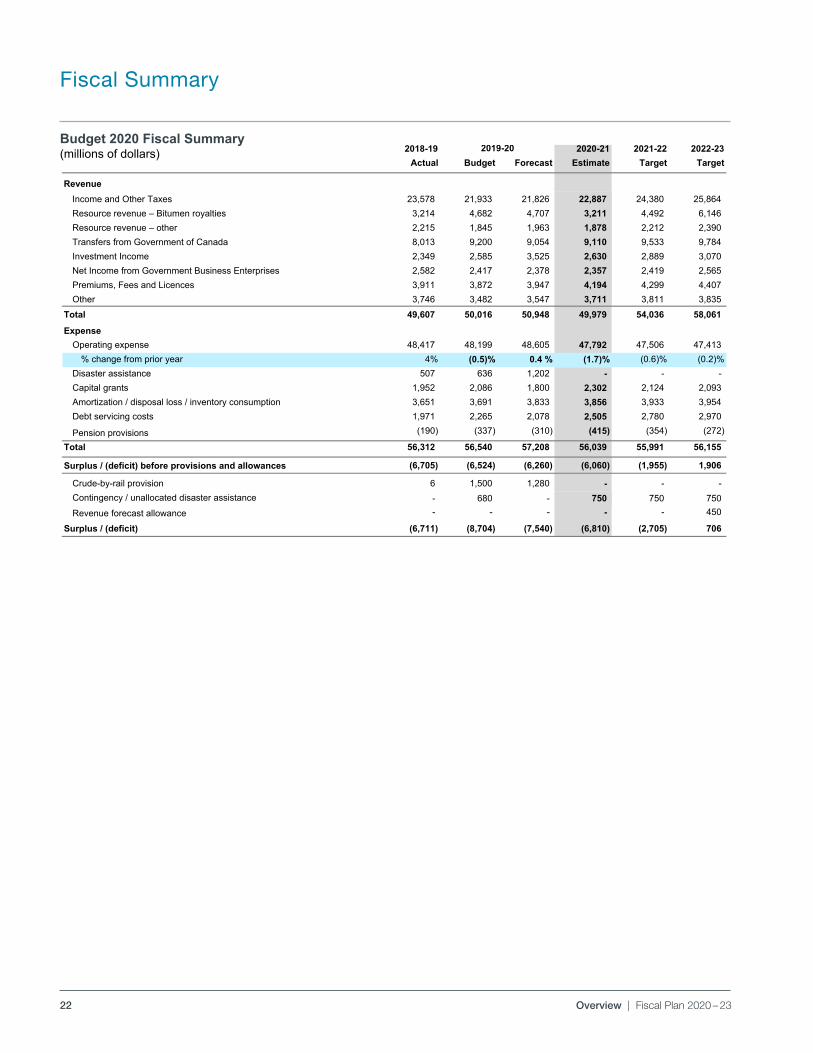
Budget 2020 Fiscal Summary(millions of dollars)
2018-19 2020-21 2021-22 2022-23Actual Budget Forecast Estimate Target Target
RevenueIncome and Other Taxes 23,578 21,933 21,826 22,887 24,380 25,864 Resource revenue – Bitumen royalties 3,214 4,682 4,707 3,211 4,492 6,146 Resource revenue – other 2,215 1,845 1,963 1,878 2,212 2,390 Transfers from Government of Canada 8,013 9,200 9,054 9,110 9,533 9,784 Investment Income 2,349 2,585 3,525 2,630 2,889 3,070 Net Income from Government Business Enterprises 2,582 2,417 2,378 2,357 2,419 2,565 Premiums, Fees and Licences 3,911 3,872 3,947 4,194 4,299 4,407 Other 3,746 3,482 3,547 3,711 3,811 3,835
Total 49,607 50,016 50,948 49,979 54,036 58,061 Expense
Operating expense 48,417 48,199 48,605 47,792 47,506 47,413 % change from prior year 4% (0.5)% 0.4 % (1.7)% (0.6)% (0.2)%
Disaster assistance 507 636 1,202 - - - Capital grants 1,952 2,086 1,800 2,302 2,124 2,093 Amortization / disposal loss / inventory consumption 3,651 3,691 3,833 3,856 3,933 3,954 Debt servicing costs 1,971 2,265 2,078 2,505 2,780 2,970
Pension provisions (190) (337) (310) (415) (354) (272)
Total 56,312 56,540 57,208 56,039 55,991 56,155
Surplus / (deficit) before provisions and allowances (6,705) (6,524) (6,260) (6,060) (1,955) 1,906
Crude-by-rail provision 6 1,500 1,280 - - - Contingency / unallocated disaster assistance - 680 - 750 750 750 Revenue forecast allowance - - - - - 450
Surplus / (deficit) (6,711) (8,704) (7,540) (6,810) (2,705) 706
pdf named: B20_FP_OVW_B20‐b2020fs‐tb.pdf (813) (1,099) (1,192) 188 (625) (911) (1,004)
2019-20
S:\TBF\MinShare\PublnsProd\CorpFin\OBM.PUBLNS‐2020‐21\B20_Fiscal‐Plan_vol\01_Overview_B20\Source docs\Bud20_FP_Overview_tables/ Summary Table Last update: 2/18/2020 /2:20 PM
Budget 2020 Fiscal Summary(millions of dollars)
23
BUDGET 2020
GOVERNMENT OF ALBERTA | 2020 –23
Fiscal PlanA Blueprint for Jobs

24 A Blueprint for Jobs | Fiscal Plan 2020 – 23
A Blueprint for Jobs . . . . . . . . . . . . . . . . . . . . . . . . . . . . . . . . . . . . . . . . . . . . . . . . . . . . . . . . . . . . . . . . . . . . 25
Getting Alberta Back to Work . . . . . . . . . . . . . . . . . . . . . . . . . . . . . . . . . . . . . . . . . . . . . . . . . . . . . . . . . . . . . 25
Key Sectors . . . . . . . . . . . . . . . . . . . . . . . . . . . . . . . . . . . . . . . . . . . . . . . . . . . . . . . . . . . . . . . . . . . . . . . . . . . . 27
Foundation for Growth . . . . . . . . . . . . . . . . . . . . . . . . . . . . . . . . . . . . . . . . . . . . . . . . . . . . . . . . . . . . . . . . . . 36
Factors for Success . . . . . . . . . . . . . . . . . . . . . . . . . . . . . . . . . . . . . . . . . . . . . . . . . . . . . . . . . . . . . . . . . . . . . . 41
Table of Contents
Note: Amounts presented in tables may not add to totals due to rounding.
25A Blueprint for Jobs | Fiscal Plan 2020 – 23
Getting Alberta Back to Work Alberta recognizes that governments do not create wealth or prosperity .
Government policies can spur and support growth – and they can impede it – but they cannot create it . Ultimately, the most robust economies are built on the effort, investment and ambition of citizens and businesses that are prepared to take risks to create wealth .
Government’s best role is to offer a predictable and competitive environment that allows the private sector to thrive .
Alberta’s government is already implementing important initiatives as part of A Blueprint for Jobs . The following reflect the key features of our strategy .
A Balanced and Pro-growth Fiscal Strategy
• The Job Creation Tax Cut that ensures Alberta has the lowest corporate tax rate in the country and lower than 44 U .S . states .
• A measured approach to restraining spending that has resulted in moderate reductions to government expenditures .
Targeted Programs
• Maintaining the Petrochemicals Diversification Program to develop value-added and upstream investment in the energy industry .
• Roll out of the Technology, Innovation and Emissions Reduction (TIER) system to support the clean development of Alberta’s resource based economy .
• Support for our energy sector that includes:
− Ensuring market access and supporting the completion of key pipeline projects;
− Creating the regulatory environment to encourage the development of our natural gas industry and expansion into new markets;
− Developing a mineral strategy to diversify the sector; and − Attracting investments in the petrochemical and other value-added
sectors . • Consultations on a 10-year Tourism Strategy whose goal will be to double
tourism spending in the province to $20 billion annually .
• Development of the Alberta Advantage Immigration Strategy, and our Skills for Jobs initiative that will ensure Albertans have the skills necessary to support our economy .
A Blueprint for Jobs
26 A Blueprint for Jobs | Fiscal Plan 2020 – 23
• The government will increase the loan, and extend repayment period, to the Orphan Well Association . The government will work with the Orphan Well Association on accelerating the clean up of orphaned oil and gas wells in Alberta, and will determine the most appropriate timing for this work to occur .
Cutting Red Tape
• The ambitious Red Tape Reduction initiative that seeks to cut the regulatory burden by at least one third will include:
− Substantial reforms to regulations faced by the energy and natural resource sectors to speed up approvals and reduce compliance costs including the Regulatory Assurance Framework;
− Identifying and eliminating unnecessary regulatory burdens while maintaining consumer, environmental, health and safety protections, and fiscal accountability;
− Regulating as lightly as possible and using alternatives when able to enable competitiveness; and
− Focusing on small business needs and ensuring regulatory barriers are minimized for these job-creators .
Accelerated Public Investments in Critical Infrastructure
• The 2020 Capital Plan, which includes approximately $6 .4 billion in average annual spending over the next three years to ensure Alberta has the infrastructure to support private sector success:
− New projects announced in Budget 2020 worth an estimated $772 million over the next three years will create opportunities for private sector participation and support more than 3,000 jobs by 2022 .
Selling Alberta to the World
• Realigning Alberta’s investment attraction with an evolving global economy .
• Allocating $184 million to Alberta Innovates as well as $42 million in direct government programming to support innovation across the economy .
• $75 million over the next three years to support a new investment attraction strategy .
World-class ESG Credentials
• Highlighting Alberta’s world class Environmental, Social and Governance (ESG) credentials through initiatives such as the Canadian Energy Centre to maintain the confidence of investors and to ensure that jobs in Alberta are defended .
A Blueprint for Jobs brings together initiatives and policies that support fiscal responsibility, investment, competitiveness, innovation, employee and immigrant attraction, and business enterprise growth and retention, and commits to growth and continuous improvement .
27A Blueprint for Jobs | Fiscal Plan 2020 – 23
We recognize the natural strengths of our province – our forests, oil and gas, and agricultural industries .
A Blueprint for Jobs will support continued, dynamic growth in these key sectors, and leverage our advantages to support sustainable economic diversification, innovation, business attraction and investment in the energy, agricultural, forestry, technology, aviation, financial and tourism sectors .
Our plan will be dynamic . It will evolve as goals are met and new opportunities emerge, and it will form the basis of a relentless, cross-government focus to support economic growth and job creation .
Specific sectoral strategies will be further elaborated and supported by industry engagement . A strong feedback loop will be established to better link information from our international and intergovernmental representatives, job creators in Alberta, and policy-makers in government . As the economy in Alberta improves and government is better able to make strategic investments, we will focus on further supports for skills training, infrastructure, and investment attraction .
A focus for government is to support demographic groups that have been disproportionately impacted by the economic downturn over the past four years – in particular, young Albertans . Government is considering initiatives that can specifically support these Albertans, and we will work to find internal savings in government that can be used to fund effective job-creation initiatives, such as further capital investments that support economic development .
With the Job Creation Tax Cut as a foundation, we will harness effort in every corner of government to re-ignite the power of Alberta’s economy – an economy that has sustained Alberta’s high standard of living for generations .
Key Sectors
Energy
Global energy demand is expected to increase by 24 per cent by 2040 .
Global oil demand is expected to rise by nine per cent .
Global natural gas demand is expected to rise by 36 per cent, overtaking coal .
Alberta’s energy sector is poised to meet this growing demand . Not only does Alberta have abundant energy resources, but we are a world leader in sustainable and responsible resource development . Canada has the third-highest environmental, social and governance (ESG) performance among oil-producing countries .
Alberta has the world’s third-largest petroleum reserves and produced 81 per cent of Canada’s crude oil in 2018 . Canada is the world’s fifth-largest supplier of natural gas, with Alberta producing over two-thirds of Canada’s production .
The development of Alberta’s energy resources is supported by an extensive extraction, processing and transportation infrastructure system, and petroleum services sector . This sector represents the single largest source of employment in the province .
Government’s best role is to offer a predictable and competitive environment that allows the private sector to thrive.
28 A Blueprint for Jobs | Fiscal Plan 2020 – 23
Alberta will further unleash the economic potential of the energy sector by demonstrating to investors, and the public, that our resources are sustainable, economic and secure by:
• Leveraging innovation funding through the Technology Innovation and Emissions Reduction (TIER) program to advance the development and deployment of emission reduction technologies that help energy-intensive facilities innovate to stay competitive .
• Demonstrating the world-class ESG performance of Alberta energy companies as proof point of sustainable and responsible resource development in our province .
• Improving corporate competitiveness with the Job Creation Tax Cut .
• Reducing red tape to streamline business and development decisions, and streamlining the regulatory environment to advance energy projects in a timely fashion .
• Demonstrating national leadership in development of renewable energy, including geothermal, energy storage and hydrogen .
• Accelerating reclamation of legacy sites – including orphan wells – in ways that prioritize job creation . We will assess and address regulatory barriers that may be impeding the effectiveness of this work .
Reducing red tape will underpin the productivity of our energy sector and its ability to create well paying jobs for Albertans . Initiatives such as the Regulatory Assurance Framework will streamline the regulatory process for the energy sector in Alberta, speeding up approvals, reducing costs and increasing productivity for the sector .
With the advent of the shale revolution, North American natural gas markets have been shifting and Alberta has been losing market share in regions across North America, including in traditional eastern Canadian natural gas markets . At the same time, natural gas production has shifted within the province as producers move activity to the Duvernay and Montney formations to develop liquids-rich natural gas resources that provide better economic returns .
The growth potential in the Liquefied Natural Gas (LNG) industry in Canada, the increased availability of natural gas liquids, and a rejuvenated petrochemical sector provide investment opportunities for enhanced production, transportation, and value-added processing .
We will seize opportunities by:
• Advancing investment in LNG infrastructure and natural gas transmission infrastructure in western and eastern Canada, expanding markets for Alberta’s natural gas resources .
• Supporting and pursuing regional, national and international investment in the petrochemical sector to catalyze new construction and long-term, high-paying jobs for Albertans .
Alberta produces over two-thirds of Canada’s natural gas - placing
Alberta as the 8th largest producer in the world.
29A Blueprint for Jobs | Fiscal Plan 2020 – 23
• Continuing regulatory and policy support for the expansion of the NOVA Gas Transmission (NGTL) system that will support increased supply and distribution on Alberta’s natural gas to intra-Alberta, North American and eventually international LNG markets .
Alberta will further ensure that the energy sector can make investments that maximize job creation in the province by:
• Ensuring that the province continues to welcome new investments in electricity generation and supports an open and competitive electricity market to maximize benefits to all sectors of the economy .
• Developing a mineral strategy that ensures Albertans capture appropriate value from the extraction of rare-earth and mineral resources in the province .
• Securing additional investment in Alberta’s petrochemical and value-added sectors, including through maintenance of the Petrochemicals Diversification Program . Petrochemicals represent a significant growth opportunity for Alberta .
• Streamlining the regulatory process for the entire sector to ensure the regulatory burden on industry is minimized .
• Prioritizing capital investments that support growth in the sector .
• Sharing factual information that demonstrates how newer projects have significantly lower per barrel GHGs . The proposed Frontier project, for example, would operate far below current GHG intensity across the oilsands .
Our work is already yielding results .
Canada Natural Resources Limited (CNRL) recently announced that, “due to the Alberta government’s recently-announced elimination of curtailment for certain conventional drilling in Alberta and its previously announced reduction in income tax rates,” they are increasing their 2020 capital budget by approximately $250 million over 2019 levels .
Canadian Association of Petroleum Producers (CAPP) recently announced they expect to see a significant increase in capital investment for 2020, “… a reflection of the hard work and determination on many fronts to bring industry into a more competitive position … [including] the corporate tax cut by the Government of Alberta …”
Dow has announced plans for its ethylene plant expansion in Alberta, valued at more than US$200 million .
Under the Petrochemicals Diversification Program, two major projects have been approved . Construction of the $3 .5-billion Heartland Petrochemical Complex continues to ramp up . . And Pembina Pipeline Corporation along with partner Canada Kuwait Petroleum Corporation, has announced a $4 .5 billion investment in a second integrated propane dehydrogenation plant and polypropylene upgrading facility expected to be in-service by mid-2023 .
30 A Blueprint for Jobs | Fiscal Plan 2020 – 23
And Greengate Power and Copenhagen Infrastructure Partners have announced an investment agreement for Canada’s largest solar energy project – one of the largest in the world .
Agriculture
The agriculture and agri-food sector in Alberta includes crops and livestock, horticulture, bio-industries, food production, and food and beverage processing . It continues to be a bright spot in the province’s economy, even during the recent economic downturn .
Last year, primary agriculture in Alberta contributed $5 .2 billion to GDP and generated $13 .5 billion in total farm cash receipts - representing over 20 per cent of total Canadian farm cash receipts . The sector also employs around 49,300 Albertans .
We have one of the world’s most productive primary agriculture economies and we enjoy an outstanding reputation for food quality . Alberta is one of the few jurisdictions in the world that produces more agricultural products than it consumes .
The agriculture and agri-food sector has been aggressively trending toward value-added and processed foods, which enables companies to better capitalize on global food trends . Government will develop a strategy for the agriculture sector with goals of:
• Implementing an investment, value-added and export growth strategy led by Government to increase the value of agriculture in Alberta .
• Attracting investment with an aggressive investment attraction target of $1 .4 billion over the next four years .
• Creating 2,000 new direct jobs in key sectors such as canola processing, pork industry, plant protein, greenhouse, food processing, malt industry, agri-technology, and other emerging sectors .
• Growing Alberta’s exports in primary agriculture to 7 .5 per cent per year and in value-added exports to 8 .5 per cent per year .
• Advocating for more dedicated agricultural capacity at Global Affairs Canada and Agriculture and Agri-Food Canada, and for a Canada Food Inspection Agency that is more responsive to industry and better oriented to business development .
Forestry
The forestry sector in Alberta contributes to the economic well-being of more than 90 communities across the province . The industry provides forestry jobs to over 18,000 Albertans and also supports an additional 25,000 jobs across the province .
The government is working to increase the number and security of forestry jobs through a number of initiatives, such as:
• Fighting against mountain pine beetle, for a total of $30 million annually .
31A Blueprint for Jobs | Fiscal Plan 2020 – 23
• Evaluating forested lands to ensure economic opportunities and better forest management .
• Managing forests on all lands through timber harvesting to provide short-term economic opportunities for industry, while also helping to protect neighboring communities .
• Exploring potential opportunities to enhance the supply of fibre in Alberta’s White Area, which has historically supported municipal development, agriculture and other industries, but could also provide additional harvesting opportunities for Alberta foresters .
• Evaluating constraints on industry’s access to fibre to ensure we are getting the most out of this important natural resource and supporting forest industry jobs . There is potential to harvest up to one-third more of the current annual allowable cut, which could mean hundreds of millions of dollars more in timber value .
• Applying the government-wide red-tape reduction effort in the forestry sector, for example, by promising forestry companies greater certainty around long-term tenure and Forest Management Agreements .
• Increasing efforts to expand and diversify international markets for Alberta forestry products .
Technology, Data and Telecommunications
Technology is, increasingly, a foundation of Alberta’s economy . Our energy sector has driven technological advancements and is, in turn, sustained by ongoing innovation .
Alberta’s information and communications technology (ICT) industry includes approximately 4,600 companies and 40,000 employees generating about $15 billion in annual revenues in 2016, making it one of Alberta’s key sectors .
This sector enjoys many strengths, including a growing creative cluster, excellent post-secondary and research institutions, and established infrastructure . Plans by TELUS to invest $16 billion in Alberta over the next five years to expand its broadband infrastructure and prepare the province for the introduction of 5G will ensure that the sector, and the province as a whole, has access to world-class wireless and wireline connectivity to support further innovation .
The government is supporting and accelerating research, innovation and entrepreneurship through post-secondary institutions, Alberta Innovates, Alberta Enterprise Corporation (AEC) and Economic Development, Trade and Tourism . More than $200 million is being invested in research, innovation and commercialization to develop talent, grow sectors, leverage funding from partners and private sector, and help drive global investment .
32 A Blueprint for Jobs | Fiscal Plan 2020 – 23
Through investments at Alberta Innovates (2020-21 budget of $184 million, including grants to post-secondary institutions) we have initiatives or investment opportunities in:
• Artificial intelligence;
• Quantum computing – Alberta Innovates currently has four quantum projects underway with an approximate value of $3 .6 million;
• Leveraging our competency in digital health – Alberta Innovates continues to explore ways to use digital health to achieve three goals for the province: controlling healthcare costs, improving health outcomes and attracting investments;
• Alberta oil – to look at potential growth opportunities through alternate bitumen transport technologies, bitumen beyond combustion (carbon fibres, asphalts, etc .), and automation;
• Natural gas and clean energy; and
• Agricultural innovation for the future farm .
In addition, the government is investing $1 .85 million at AEC to connect Alberta inventors, innovators and entrepreneurs to money, markets and mentors – by fostering a thriving venture capital industry in the province . AEC manages a fund which, via venture capital partners, invests in technology and innovation companies, while $41 million in department funding supports innovation, including policy, strategy, technology partnerships, and enhancing research capacity .
Budget 2020 includes funding to develop an active and sustainable angel capital ecosystem to fuel growth within the technology and innovation space in Alberta . Working with groups like the National Angel Capital Organization, Alberta will enable the access to capital and mentorship entrepreneurs need to scale their companies .
Since 2009, the number of technology companies in Alberta has increased by 87 per cent, and the province is home to many successful companies that have Fortune 1000 clients and attract large equity investments .
Alberta’s Artificial Intelligence (AI) ecosystem, in particular, has seen an incredible upswing in growth, with the attraction of various research labs and an increased number of AI start-ups . Alberta is home to one of three Canadian AI hubs, which includes numerous artificial intelligence start-ups, research labs/institutes, accelerators/incubators, and investor organizations .
Companies seek a competitive, innovative environment to commercialize their technology and products . This is equally true for tech start-ups as it is for our established global energy companies .
Our government will maintain its investments in this sector in order to:
• Sustain our commitment to lead on AI;
• Commercialize research and intellectual property;
• Enable access to capital; and
• Administer the new Alberta Film and Television Tax Credit .
The number of technology companies in Alberta has increased
by 87 per cent since 2009.
33A Blueprint for Jobs | Fiscal Plan 2020 – 23
A technology sector strategy as part of A Blueprint for Jobs will include:
• Input from the Innovation Working Group;
• Aggressively supporting and promoting the province’s global position as a leader in AI and machine learning, including commercialization;
• Ensuring prospective investors are aware of the advanced industries environment already established in the province, including post-secondary training, entrepreneur-driven companies, world-class infrastructure, and an improving business environment;
• Ensuring Alberta students have the skills and training necessary to successfully engage with high technology sectors, including the provision of training through the private sector; and
• Developing a broadband strategy to support regional economic development .
One of the biggest barriers to growth in Alberta’s digital economy is a shortage of people with relevant skills and experience:
• A Blueprint for Jobs will address this challenge through the creation of the Startup Visa Stream within the new Alberta Advantage Immigration Strategy . The startup visa will offer fast track processing for qualified graduates of top universities if they commit to launch a startup enterprise in Alberta, with a bridge to permanent residency through the Alberta Immigrant Nominee Program . The visa will initially target foreign student graduates in the United States .
• The Foreign Graduate Entrepreneur Program will offer similar fast track immigration opportunities for foreign nationals who have graduated from Alberta post-secondary institutions . This stream will be supported by a renewed strategy to attract highly qualified foreign students to Alberta colleges and universities .
Aviation, Aerospace and Logistics
Alberta’s aerospace and defense sector ranges from air transportation to remotely piloted aircraft systems (RPAS) . The sector employs over of 10,000 Albertans and contributes $1 .6 billion to our GDP in 2016 .
Additionally, Alberta has world-class post-secondary institutions with multiple training, research and innovation facilities . Alberta is ranked third nationally by company size, fourth by number of companies, and fourth by GDP contribution in aerospace and defense .
The Government of Alberta will work with this growing industry by:
• Seeking partnerships to grow and expand remotely piloted aircraft systems (RPAS) by leveraging assets such as the aircraft testing range in Foremost;
• Promoting Alberta’s position as a growing hub for logistics, including the significant scope to grow services in both Edmonton and Calgary;
• Enacting regulatory changes that permit increased airline traffic and services in Alberta, including expansion by WestJet, and other airlines that have a significant presence and focus in Alberta, such as Swoop and Flair; and
34 A Blueprint for Jobs | Fiscal Plan 2020 – 23
• Working with post-secondary institutions to address the massive shortage in trained pilots and maintenance personnel within the aviation sector .
Finance and Fintech
Alberta operates within one of the strongest financial services sectors in the world, comprised of banks, trust and loan companies, insurance companies, credit unions, securities dealers, finance and leasing companies, pension fund managers, mutual-fund companies and independent insurance agents and brokers .
Combined with prudent regulatory oversight, this stable, diversified and well-funded base means significant growth opportunities for investors .
Institutional finance and investment has been key to Alberta’s success in the past, and must be a priority in the future .
Alberta has a significant value proposition for this sector – we are the lowest-tax jurisdiction in Canada and have significant cost-of-living advantages, abundant skills and real estate, and a vast capital foundation . We want to build a capital market in Alberta and will be developing a strategy to achieve that goal .
In order to take this Alberta strength to the next level, the Government of Alberta will take the following steps:
• Premier and ministerial engagement with institutional investors, and the broader financial community, to promote the advantages of Alberta’s business environment .
• Leverage the long-term viability and strength of the other pillars of the economy to project opportunity for expansion within the finance community .
• Effectively promote the significant financial and social benefits of locating in Alberta, and work closely with sector representatives to monetize all of Alberta’s advantages .
• Support Alberta’s credit union sector through the Job Creation Tax Cut, as well as implementation of regulatory powers that expand their scope of business .
Tourism
Tourism is one of the fastest growing industries in the world, with global traveller expenditures expected to double over the coming decade . Destinations internationally have invested in tourism industry development to grow and diversify their economies and generate jobs . Tourism does more than fill hotel rooms, airplanes, attractions and convention centres: it is a powerful engine for broader economic growth that in turn attracts investment and stimulates job growth across the economy .
As a part of A Blueprint for Jobs, a 10-year tourism strategy is being developed to support our ambitious goal of doubling tourism spending in Alberta to $20 billion by 2030 . The strategy will represent an aggressive, coordinated government approach, with initiatives to encourage more private sector
35A Blueprint for Jobs | Fiscal Plan 2020 – 23
investment, create jobs, contribute to economic growth in the province and build quality of life throughout Alberta . The strategy will:
• Evaluate the delivery model for destination development and product development;
• Review and enhance the mandate for Travel Alberta to move from a destination promotion organization to a destination management organization;
• Seek to create stable and predictable funding to advance commitments to programs and services focused on destination development and promotion, and encourage private sector investment and confidence;
• Promote the province as a desirable destination to live, work, play, invest and learn;
• Remove red-tape that impairs the tourism industry such as extending leases for tourism operators on public lands, making it easier for operators to secure financing;
• Support the development of infrastructure that improves the tourist experience, and makes it easier to access tourist destinations;
• Work with the industry to address labour force challenges; and
• Work with Indigenous communities to expand growing tourism opportunities .
The government will continue our close engagement and consultation with the tourism sector to develop a strategy that meets our ambitious goals . As the economy improves, we will consider mechanisms to increase funding for tourism initiatives, including full allocation of the tourism levy to the Ministry responsible for Tourism .
Sources: Statistics Canada, U.S. Bureau of Labor Statistics, U.S. Federal Reserve Board, U.S. Federal Reserve Bank of St. Louis
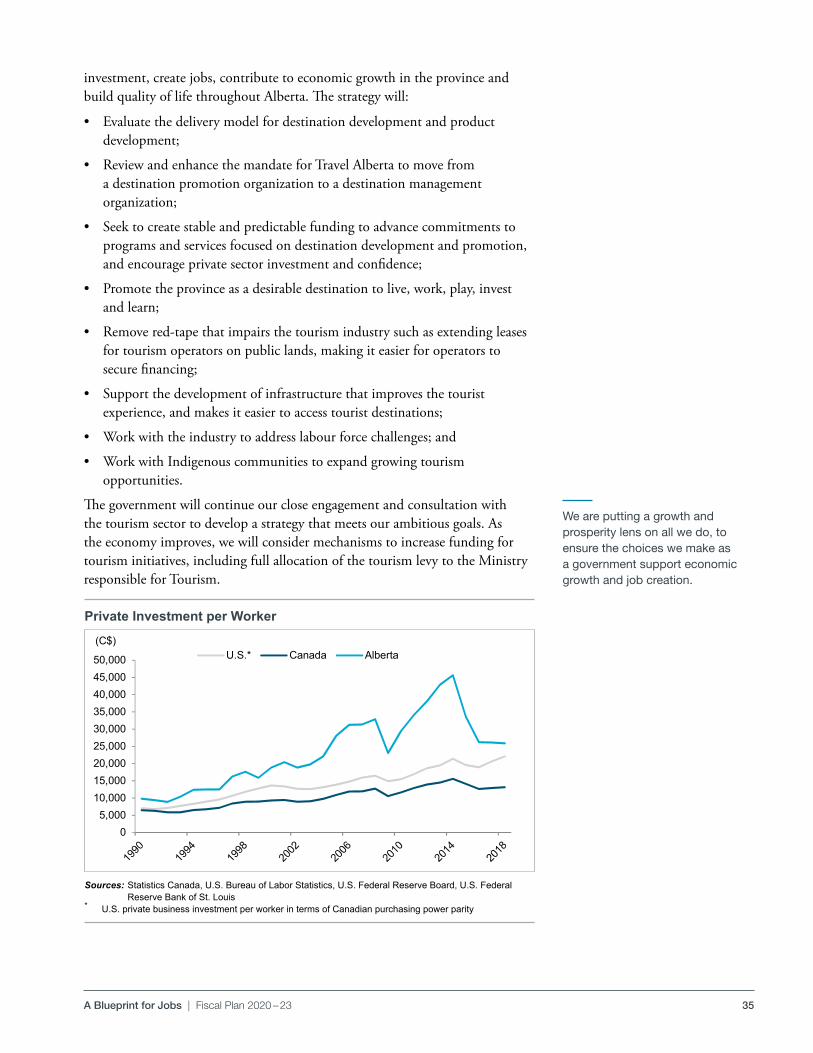
* U.S. private business investment per worker in terms of Canadian purchasing power parity
pdf name: Budget 2020 Fiscal PlanJobs Plan
Private Investment per worker
Sources: Statistics Canada, U.S. Bureau of Labor Statistics, U.S. Federal Reserve Board, U.S. Federal Reserve Bank of St. Louis* U.S. private business investment per worker in terms of Canadian purchasing power parity
pdf name: B20_FP_JP_pipw.pdf
05,000
10,00015,00020,00025,00030,00035,00040,00045,00050,000
(C$)U.S.* Canada Alberta
\\ter-fin-fs-01.fin.gov.ab.ca\Publications\_Economics_publications\Budget\5_Economic-Outlook_2020-21\SourceDocs\JobPlan\InvestmentJobs_Charts (CPE)/Chart 1 Investment per worker 2020-02-2012:30 PM
Private Investment per Worker
We are putting a growth and prosperity lens on all we do, to ensure the choices we make as a government support economic growth and job creation.
36 A Blueprint for Jobs | Fiscal Plan 2020 – 23
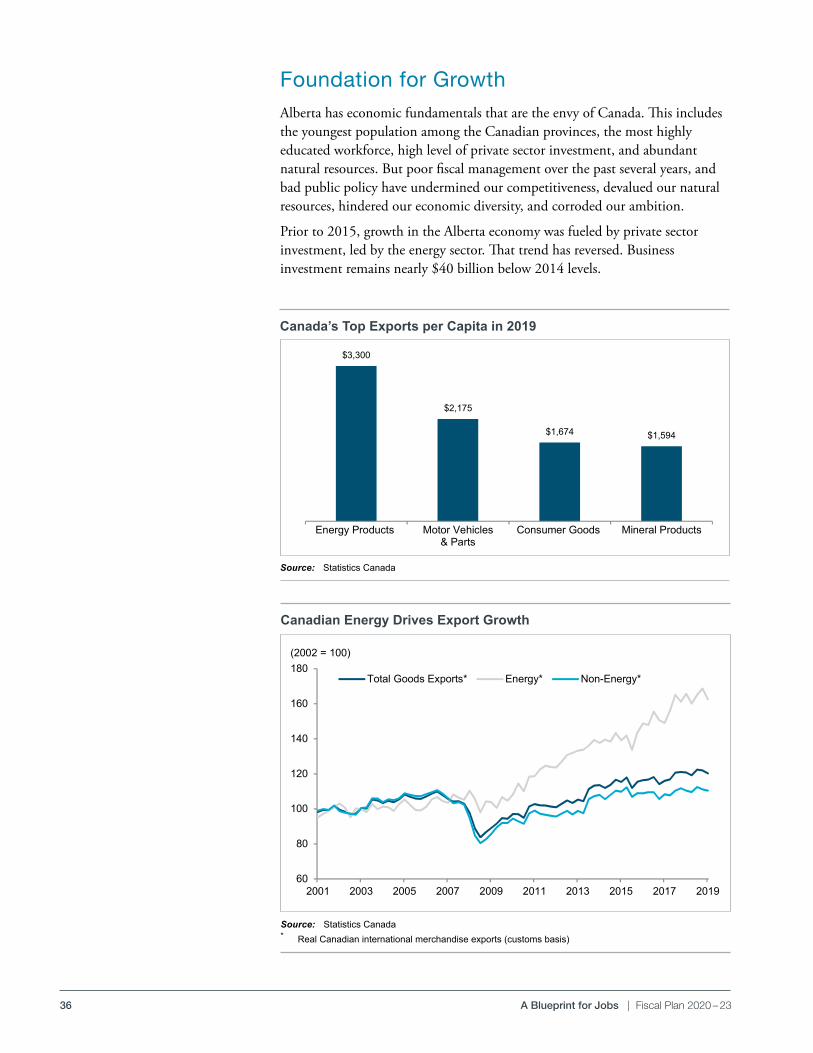
Foundation for GrowthAlberta has economic fundamentals that are the envy of Canada . This includes the youngest population among the Canadian provinces, the most highly educated workforce, high level of private sector investment, and abundant natural resources . But poor fiscal management over the past several years, and bad public policy have undermined our competitiveness, devalued our natural resources, hindered our economic diversity, and corroded our ambition .
Prior to 2015, growth in the Alberta economy was fueled by private sector investment, led by the energy sector . That trend has reversed . Business investment remains nearly $40 billion below 2014 levels .
pdf name: Budget 2020 Fiscal PlanJobs Plan
Canada's Top Exports ($ per capita)
Source: Statistics Canada
pdf name: B20_FP_JP_cte.pdf
$3,300
$2,175
$1,674 $1,594
Energy Products Motor Vehicles& Parts
Consumer Goods Mineral Products
\\ter-fin-fs-01.fin.gov.ab.ca\Publications\_Economics_publications\Budget\5_Economic-Outlook_2020-21\SourceDocs\JobPlan\InvestmentJobs_Charts (CPE)/Chart 02 ExportsCap 2/14/20201:43 PM
Canada’s Top Exports per Capita in 2019
Source: Statistics Canada
pdf name: Budget 2020 Fiscal PlanJobs Plan
Canadian Energy Drives Export Growth
Source: Statistics Canada* Real Canadian international merchandise exports (customs basis)
pdf name: B20_FP_JP_edeg.pdf
60
80
100
120
140
160
180
2001 2003 2005 2007 2009 2011 2013 2015 2017 2019
(2002 = 100)
Total Goods Exports* Energy* Non-Energy*
\\ter-fin-fs-01.fin.gov.ab.ca\Publications\_Economics_publications\Budget\5_Economic-Outlook_2020-21\SourceDocs\JobPlan\InvestmentJobs_Charts (CPE)/Chart 03 CARealExports 2020-02-2012:42 PM
Canadian Energy Drives Export Growth
Source: Statistics Canada* Real Canadian international merchandise exports (customs basis)
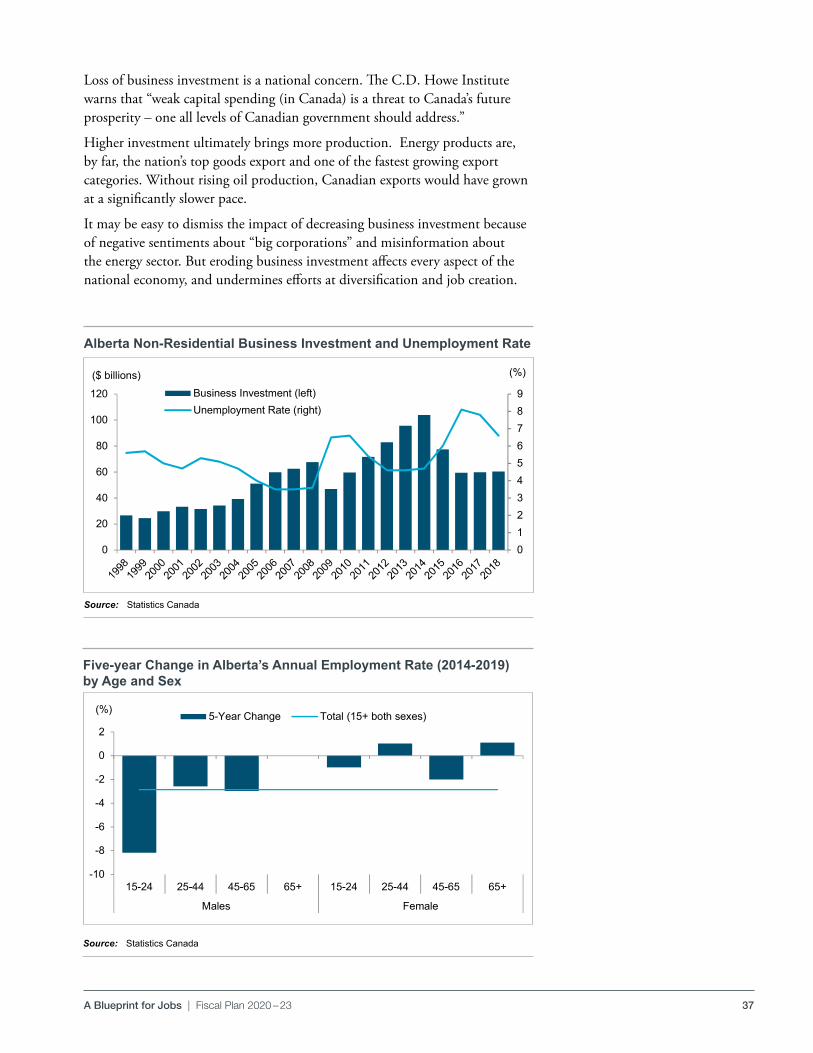
37A Blueprint for Jobs | Fiscal Plan 2020 – 23
Loss of business investment is a national concern . The C .D . Howe Institute warns that “weak capital spending (in Canada) is a threat to Canada’s future prosperity – one all levels of Canadian government should address .”
Higher investment ultimately brings more production . Energy products are, by far, the nation’s top goods export and one of the fastest growing export categories . Without rising oil production, Canadian exports would have grown at a significantly slower pace .
It may be easy to dismiss the impact of decreasing business investment because of negative sentiments about “big corporations” and misinformation about the energy sector . But eroding business investment affects every aspect of the national economy, and undermines efforts at diversification and job creation .
pdf name: B20_FP_JP_apbiur.pdf Budget 2020 Fiscal PlanJobs Plan
Alberta Non-Residential Business Investment and Unemployment Rate
Source: Statistics Canada
pdf name: B20_FP_JP_apbiur.pdf
0123456789
0
20
40
60
80
100
120
(%)($ billions)Business Investment (left)Unemployment Rate (right)
\\ter-fin-fs-01.fin.gov.ab.ca\Publications\_Economics_publications\Budget\5_Economic-Outlook_2020-21\SourceDocs\JobPlan\InvestmentJobs_Charts (CPE)/Chart 04 CapexUR 2020-02-2012:32 PM
Alberta Non-Residential Business Investment and Unemployment Rate
Source: Statistics Canadapdf name: Budget 2020 Fiscal Plan
Jobs Plan
Five-year change in Alberta's annual employment rate (2014-2019), by age a sex
Source: Statistics Canada
pdf name: B20_FP_JP_5yciaaer.pdf
-10
-8
-6
-4
-2
0
2
15-24 25-44 45-65 65+ 15-24 25-44 45-65 65+
Males Female
(%) 5-Year Change Total (15+ both sexes)
\\ter-fin-fs-01.fin.gov.ab.ca\Publications\_Economics_publications\Budget\5_Economic-Outlook_2020-21\SourceDocs\JobPlan\InvestmentJobs_Charts (CPE)/Chart 05 Emp Rate 2020-02-2012:33 PM
Five-year Change in Alberta’s Annual Employment Rate (2014-2019) by Age and Sex
Source: Statistics Canada
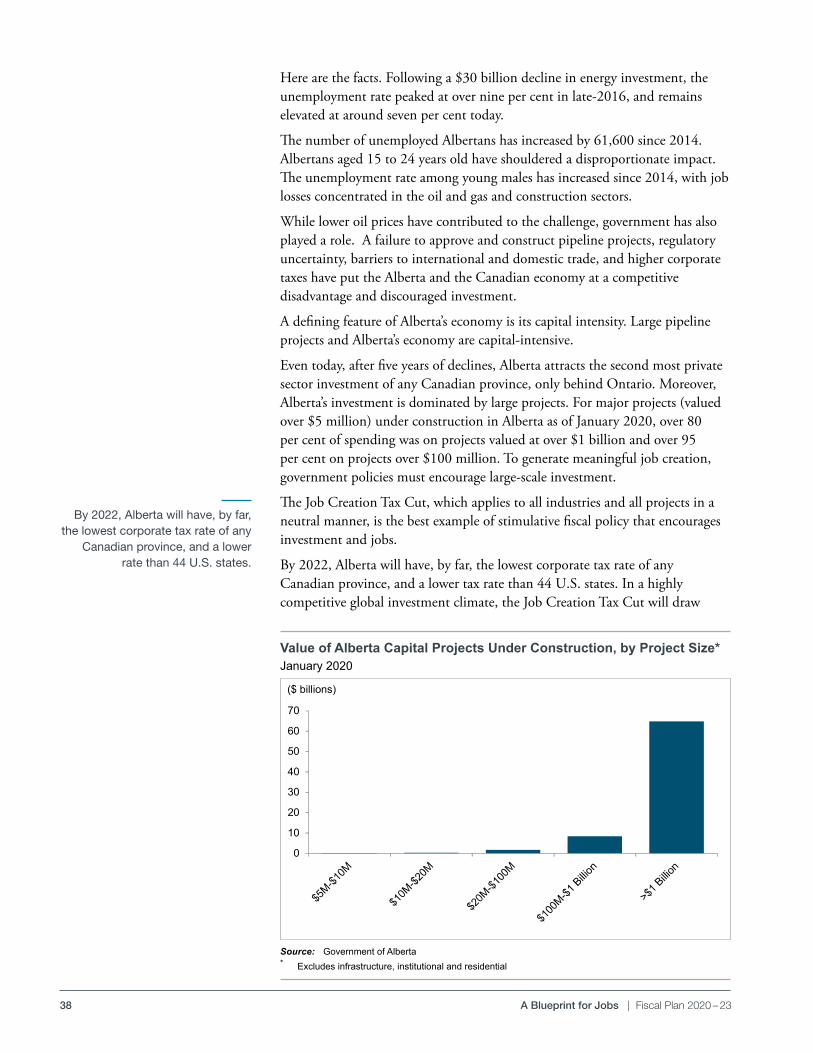
38 A Blueprint for Jobs | Fiscal Plan 2020 – 23
Here are the facts . Following a $30 billion decline in energy investment, the unemployment rate peaked at over nine per cent in late-2016, and remains elevated at around seven per cent today .
The number of unemployed Albertans has increased by 61,600 since 2014 . Albertans aged 15 to 24 years old have shouldered a disproportionate impact . The unemployment rate among young males has increased since 2014, with job losses concentrated in the oil and gas and construction sectors .
While lower oil prices have contributed to the challenge, government has also played a role . A failure to approve and construct pipeline projects, regulatory uncertainty, barriers to international and domestic trade, and higher corporate taxes have put the Alberta and the Canadian economy at a competitive disadvantage and discouraged investment .
A defining feature of Alberta’s economy is its capital intensity . Large pipeline projects and Alberta’s economy are capital-intensive .
Even today, after five years of declines, Alberta attracts the second most private sector investment of any Canadian province, only behind Ontario . Moreover, Alberta’s investment is dominated by large projects . For major projects (valued over $5 million) under construction in Alberta as of January 2020, over 80 per cent of spending was on projects valued at over $1 billion and over 95 per cent on projects over $100 million . To generate meaningful job creation, government policies must encourage large-scale investment .
The Job Creation Tax Cut, which applies to all industries and all projects in a neutral manner, is the best example of stimulative fiscal policy that encourages investment and jobs .
By 2022, Alberta will have, by far, the lowest corporate tax rate of any Canadian province, and a lower tax rate than 44 U .S . states . In a highly competitive global investment climate, the Job Creation Tax Cut will draw
By 2022, Alberta will have, by far, the lowest corporate tax rate of any
Canadian province, and a lower rate than 44 U.S. states.pdf name: Budget 2020 Fiscal Plan
Jobs Plan
Value of Alberta Capital Projects* under construction, by project size, January 2020
Source: Government of Alberta* Excludes infrastructure, institutional and residential
pdf name: B20_FP_JP_voacpucbps.pdf
0
10
20
30
40
50
60
70
($ billions)
\\ter-fin-fs-01.fin.gov.ab.ca\Publications\_Economics_publications\Budget\5_Economic-Outlook_2020-21\SourceDocs\JobPlan\InvestmentJobs_Charts (CPE)/Chart 06 Major Projects 2020-02-2012:34 PM
Value of Alberta Capital Projects Under Construction, by Project Size*January 2020
Source: Government of Alberta* Excludes infrastructure, institutional and residential
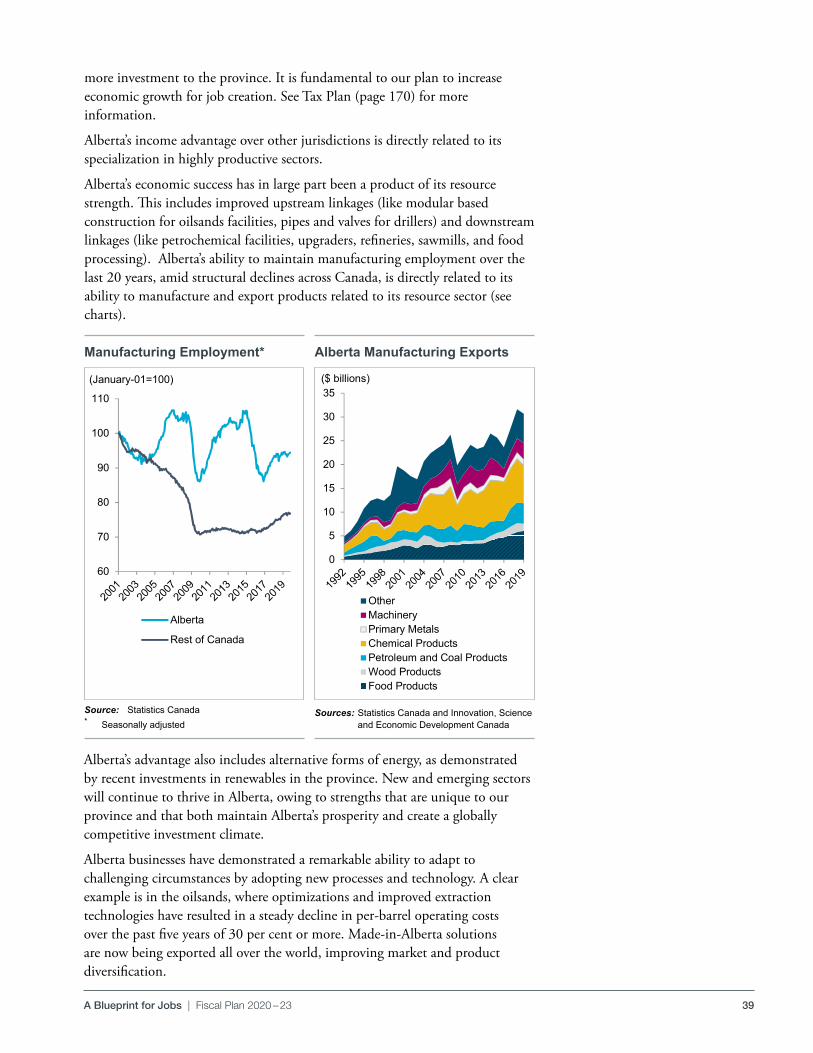
39A Blueprint for Jobs | Fiscal Plan 2020 – 23
more investment to the province . It is fundamental to our plan to increase economic growth for job creation . See Tax Plan (page 170) for more information .
Alberta’s income advantage over other jurisdictions is directly related to its specialization in highly productive sectors .
Alberta’s economic success has in large part been a product of its resource strength . This includes improved upstream linkages (like modular based construction for oilsands facilities, pipes and valves for drillers) and downstream linkages (like petrochemical facilities, upgraders, refineries, sawmills, and food processing) . Alberta’s ability to maintain manufacturing employment over the last 20 years, amid structural declines across Canada, is directly related to its ability to manufacture and export products related to its resource sector (see charts) .
Alberta’s advantage also includes alternative forms of energy, as demonstrated by recent investments in renewables in the province . New and emerging sectors will continue to thrive in Alberta, owing to strengths that are unique to our province and that both maintain Alberta’s prosperity and create a globally competitive investment climate .
Alberta businesses have demonstrated a remarkable ability to adapt to challenging circumstances by adopting new processes and technology . A clear example is in the oilsands, where optimizations and improved extraction technologies have resulted in a steady decline in per-barrel operating costs over the past five years of 30 per cent or more . Made-in-Alberta solutions are now being exported all over the world, improving market and product diversification .
pdf name: Budget 2020 Fiscal PlanJobs Plan
Alberta Manufacturing* Exports
Sources: Statistics Canada and Innovation, Science and Economic Development Canada* Selected industries
pdf name: B20_FP_JP_ame.pdf
0
5
10
15
20
25
30
35
OtherMachineryPrimary MetalsChemical ProductsPetroleum and Coal ProductsWood ProductsFood Products
($ billions)
\\ter-fin-fs-01.fin.gov.ab.ca\Publications\_Economics_publications\Budget\5_Economic-Outlook_2020-21\SourceDocs\JobPlan\InvestmentJobs_Charts (CPE)/Chart 08 Mfg Exports 2020-02-2012:45 PM
pdf name: Budget 2020 Fiscal PlanJobs Plan
Manufacturing Employment*
60
70
80
90
100
110
Alberta
Rest of Canada
(January-01=100)
\\ter-fin-fs-01.fin.gov.ab.ca\Publications\_Economics_publications\Budget\5_Economic-Outlook_2020-21\SourceDocs\JobPlan\InvestmentJobs_Charts (CPE)/Chart 07 Mfg Emp 2/18/20201:00 PM
Manufacturing Employment* Alberta Manufacturing Exports
Source: Statistics Canada* Seasonally adjusted
Sources: Statistics Canada and Innovation, Science and Economic Development Canada
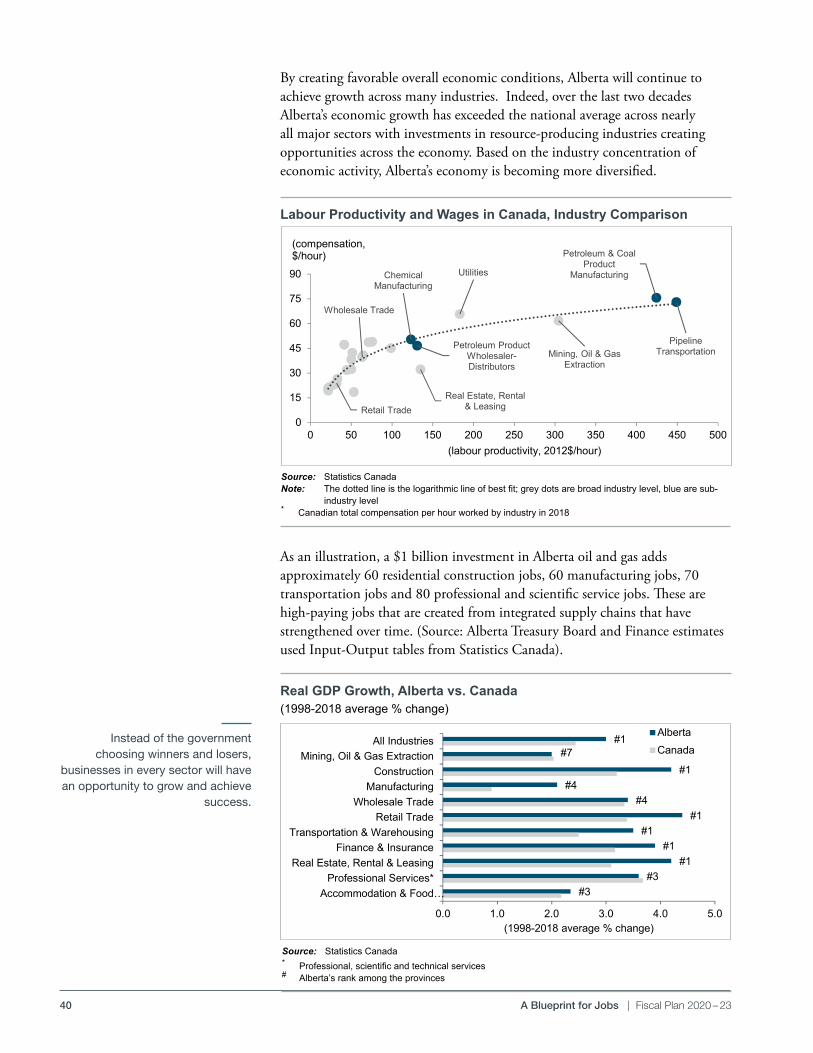
40 A Blueprint for Jobs | Fiscal Plan 2020 – 23
By creating favorable overall economic conditions, Alberta will continue to achieve growth across many industries . Indeed, over the last two decades Alberta’s economic growth has exceeded the national average across nearly all major sectors with investments in resource-producing industries creating opportunities across the economy . Based on the industry concentration of economic activity, Alberta’s economy is becoming more diversified .
Instead of the government choosing winners and losers,
businesses in every sector will have an opportunity to grow and achieve
success.
As an illustration, a $1 billion investment in Alberta oil and gas adds approximately 60 residential construction jobs, 60 manufacturing jobs, 70 transportation jobs and 80 professional and scientific service jobs . These are high-paying jobs that are created from integrated supply chains that have strengthened over time . (Source: Alberta Treasury Board and Finance estimates used Input-Output tables from Statistics Canada) .
Real GDP Growth, Alberta vs. Canada(1998-2018 average % change)
pdf name: B20_FP_JP_rgdpgavsc.pdf Budget 2020 Fiscal PlanJobs Plan
Real GDP Growth, Alberta vs. Canada
Source: Statistics Canada* Professional, scientific and technical services# Alberta's rank among the provinces
pdf name: B20_FP_JP_rgdpgavsc.pdf
#1#7
#1#4
#4#1
#1#1
#1#3
#3
0.0 1.0 2.0 3.0 4.0 5.0
All IndustriesMining, Oil & Gas Extraction
ConstructionManufacturing
Wholesale TradeRetail Trade
Transportation & WarehousingFinance & Insurance
Real Estate, Rental & LeasingProfessional Services*
Accommodation & Food…
(1998-2018 average % change)
AlbertaCanada
\\ter-fin-fs-01.fin.gov.ab.ca\Publications\_Economics_publications\Budget\5_Economic-Outlook_2020-21\SourceDocs\JobPlan\InvestmentJobs_Charts (CPE)/Chart 11 GDP 2/19/20209:26 AM
Source: Statistics Canada* Professional, scientific and technical services# Alberta’s rank among the provinces
pdf name: Budget 2020 Fiscal PlanJobs Plan
Labour Productivity and Wages in Canada, Industry Comparison
Source: Statistics CanadaNote: The dotted line is the logarithmic line of best fit; grey dots are broad industry level, blue are sub-industry level* Canadian total compensation per hour worked by industry in 2018
pdf name: B20_FP_JP_moagitmpmiic.pdf
Mining, Oil & Gas Extraction
Utilities
Petroleum & Coal Product
ManufacturingChemical Manufacturing
Wholesale Trade
Petroleum Product Wholesaler-Distributors
Retail Trade
Pipeline Transportation
Real Estate, Rental & Leasing
0
15
30
45
60
75
90
0 50 100 150 200 250 300 350 400 450 500
(compensation,$/hour)
(labour productivity, 2012$/hour)
\\ter-fin-fs-01.fin.gov.ab.ca\Publications\_Economics_publications\Budget\5_Economic-Outlook_2020-21\SourceDocs\JobPlan\InvestmentJobs_Charts (CPE)/Chart 10 Productivity_Wages 2020-02-2012:28 PM
Labour Productivity and Wages in Canada, Industry Comparison
Source: Statistics CanadaNote: The dotted line is the logarithmic line of best fit; grey dots are broad industry level, blue are sub-
industry level* Canadian total compensation per hour worked by industry in 2018
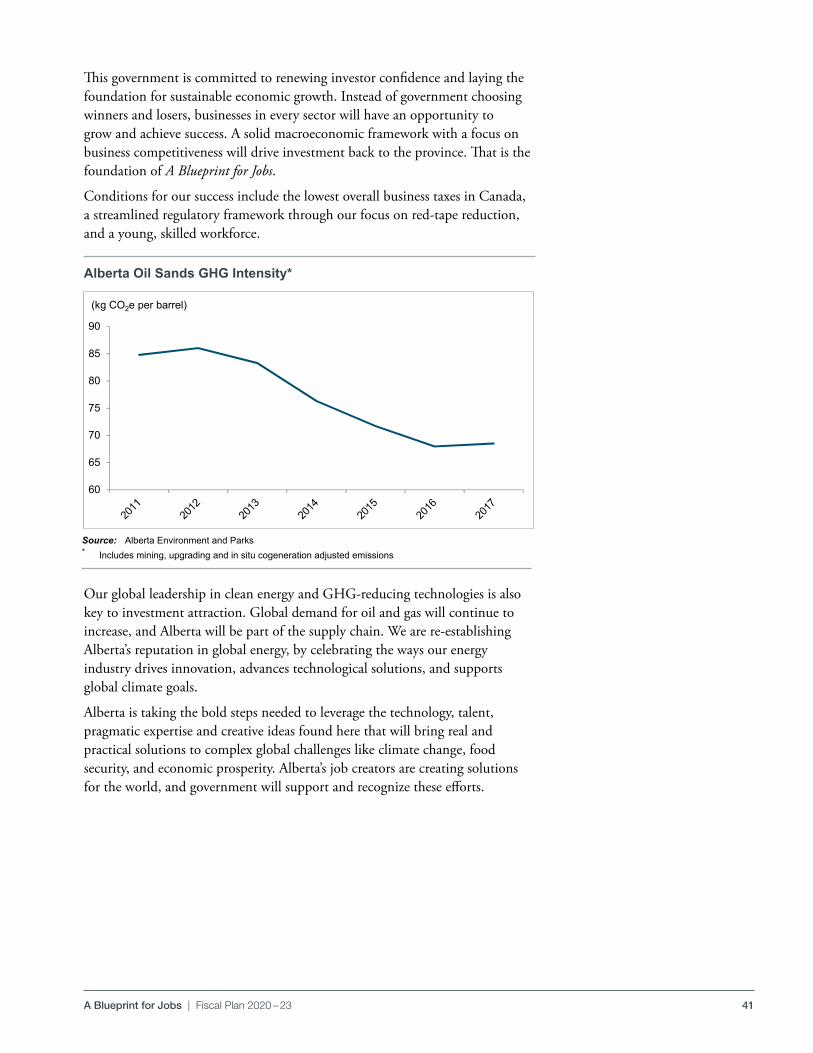
41A Blueprint for Jobs | Fiscal Plan 2020 – 23
This government is committed to renewing investor confidence and laying the foundation for sustainable economic growth . Instead of government choosing winners and losers, businesses in every sector will have an opportunity to grow and achieve success . A solid macroeconomic framework with a focus on business competitiveness will drive investment back to the province . That is the foundation of A Blueprint for Jobs .
Conditions for our success include the lowest overall business taxes in Canada, a streamlined regulatory framework through our focus on red-tape reduction, and a young, skilled workforce .
Our global leadership in clean energy and GHG-reducing technologies is also key to investment attraction . Global demand for oil and gas will continue to increase, and Alberta will be part of the supply chain . We are re-establishing Alberta’s reputation in global energy, by celebrating the ways our energy industry drives innovation, advances technological solutions, and supports global climate goals .
Alberta is taking the bold steps needed to leverage the technology, talent, pragmatic expertise and creative ideas found here that will bring real and practical solutions to complex global challenges like climate change, food security, and economic prosperity . Alberta’s job creators are creating solutions for the world, and government will support and recognize these efforts .
Alberta Oil Sands GHG Intensity*
pdf name: B20_FP_JP_coagghgi.pdf Budget 2020 Fiscal PlanJobs Plan
Carbon Intensity is DeAlberta oil sands GHG intensity*
Source: Alberta Environment and Parks* Includes mining, upgrading and in-situ cogeneration adjusted emissiopdf name: B20_FP_JP_coagghgi.pdf
60
65
70
75
80
85
90
(kg CO2e per barrel)
\\ter-fin-fs-01.fin.gov.ab.ca\Publications\_Economics_publications\Budget\5_Economic-Outlook_2020-21\SourceDocs\JobPlan\InvestmentJobs_Charts (CPE)/Chart 12 EmissionIntensity 2/18/20201:20 PM
Source: Alberta Environment and Parks* Includes mining, upgrading and in situ cogeneration adjusted emissions
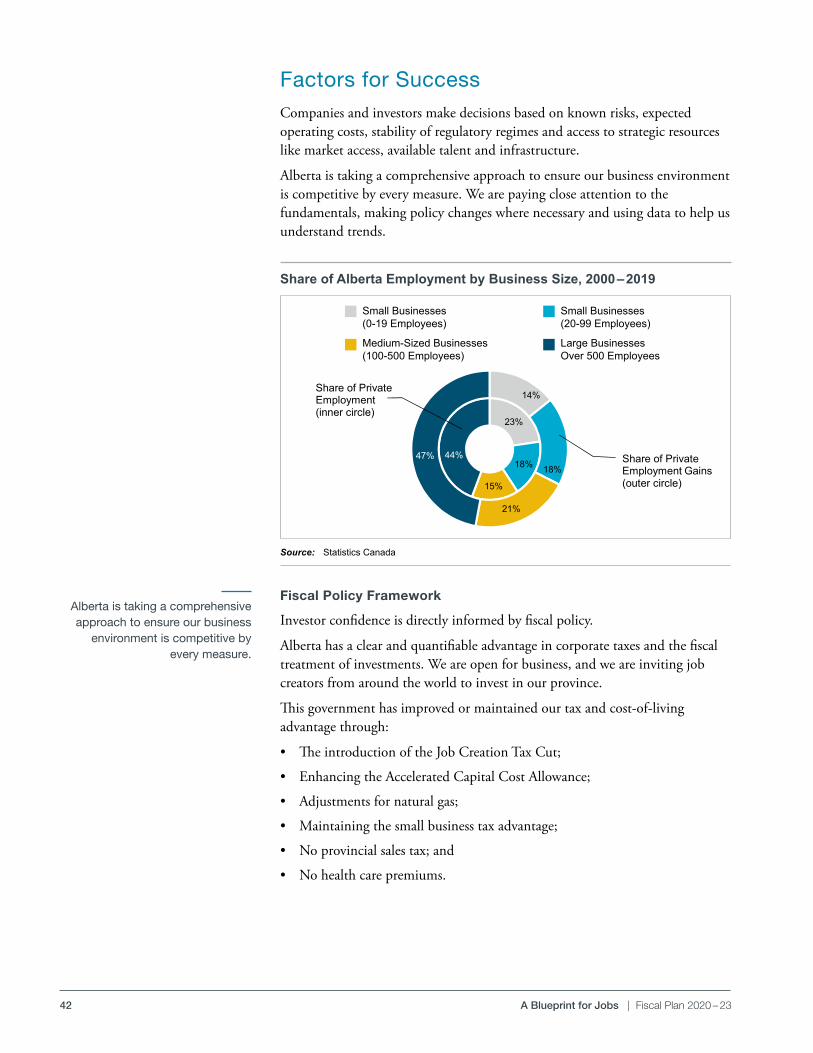
42 A Blueprint for Jobs | Fiscal Plan 2020 – 23
Alberta is taking a comprehensive approach to ensure our business
environment is competitive by every measure.
Factors for SuccessCompanies and investors make decisions based on known risks, expected operating costs, stability of regulatory regimes and access to strategic resources like market access, available talent and infrastructure .
Alberta is taking a comprehensive approach to ensure our business environment is competitive by every measure . We are paying close attention to the fundamentals, making policy changes where necessary and using data to help us understand trends .
Fiscal Policy Framework
Investor confidence is directly informed by fiscal policy .
Alberta has a clear and quantifiable advantage in corporate taxes and the fiscal treatment of investments . We are open for business, and we are inviting job creators from around the world to invest in our province .
This government has improved or maintained our tax and cost-of-living advantage through:
• The introduction of the Job Creation Tax Cut;
• Enhancing the Accelerated Capital Cost Allowance;
• Adjustments for natural gas;
• Maintaining the small business tax advantage;
• No provincial sales tax; and
• No health care premiums .
Source: Statistics Canada
Share of Alberta Employment by Business Size, 2000 – 2019
pdf name: B20_FP_JP_soaebbs.pdf Budget 2020 Fiscal PlanJobs Plan
Share of Alberta Employment by Business Size, 2000-2019
Source: Statistics Canada
pdf name: B20_FP_JP_soaebbs.pdf
23%
18%
15%
44%
14%
18%
21%
47%
Share of PrivateEmployment(inner circle)
Share of Private Employment Gains(outer circle)
\\ter-fin-fs-01.fin.gov.ab.ca\Publications\_Economics_publications\Budget\5_Economic-Outlook_2020-21\SourceDocs\JobPlan\InvestmentJobs_Charts (CPE)/Chart 13 Employment 2020-02-203:23 PM
Small Businesses Small Businesses (0-19 Employees) (20-99 Employees)
Medium-Sized Businesses Large Businesses (100-500 Employees) Over 500 Employees
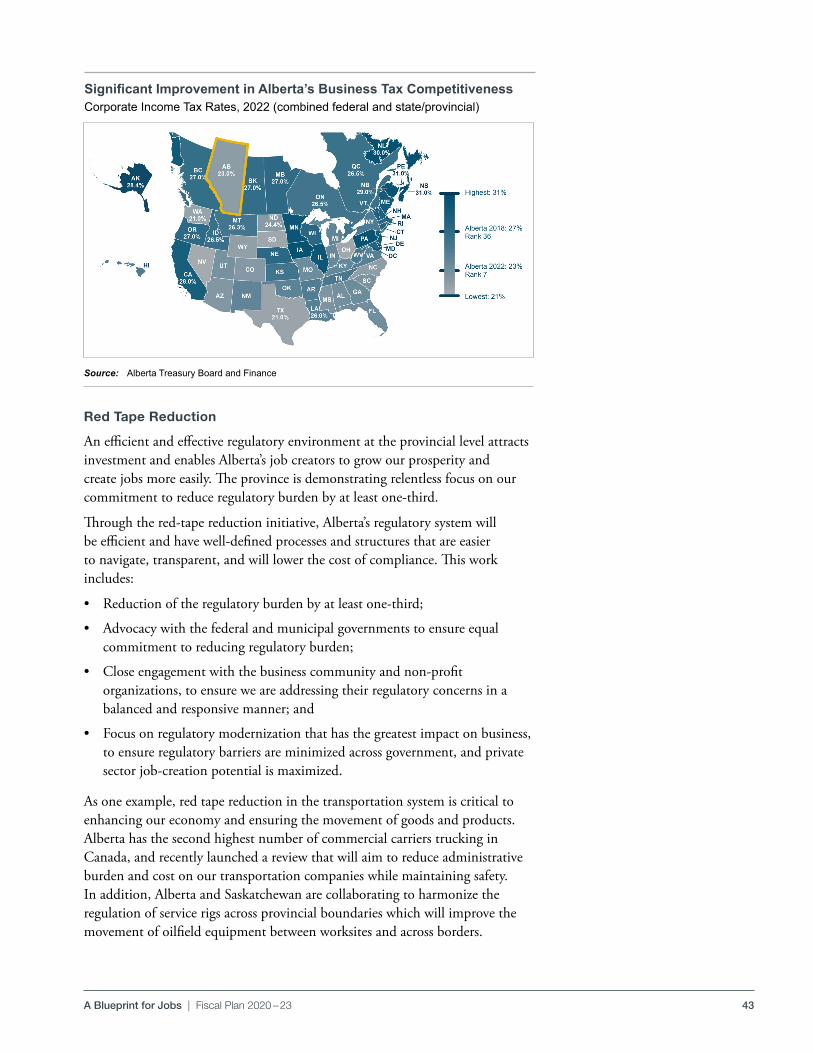
43A Blueprint for Jobs | Fiscal Plan 2020 – 23
Red Tape Reduction
An efficient and effective regulatory environment at the provincial level attracts investment and enables Alberta’s job creators to grow our prosperity and create jobs more easily . The province is demonstrating relentless focus on our commitment to reduce regulatory burden by at least one-third .
Through the red-tape reduction initiative, Alberta’s regulatory system will be efficient and have well-defined processes and structures that are easier to navigate, transparent, and will lower the cost of compliance . This work includes:
• Reduction of the regulatory burden by at least one-third;
• Advocacy with the federal and municipal governments to ensure equal commitment to reducing regulatory burden;
• Close engagement with the business community and non-profit organizations, to ensure we are addressing their regulatory concerns in a balanced and responsive manner; and
• Focus on regulatory modernization that has the greatest impact on business, to ensure regulatory barriers are minimized across government, and private sector job-creation potential is maximized .
As one example, red tape reduction in the transportation system is critical to enhancing our economy and ensuring the movement of goods and products . Alberta has the second highest number of commercial carriers trucking in Canada, and recently launched a review that will aim to reduce administrative burden and cost on our transportation companies while maintaining safety . In addition, Alberta and Saskatchewan are collaborating to harmonize the regulation of service rigs across provincial boundaries which will improve the movement of oilfield equipment between worksites and across borders .
Significant Improvement in Alberta’s Business Tax CompetitivenessCorporate Income Tax Rates, 2022 (combined federal and state/provincial)
Source: Alberta Treasury Board and Finance
44 A Blueprint for Jobs | Fiscal Plan 2020 – 23
Aggressive Investment Attraction
Budget 2019 allocated $75 million over the next three years to support key activities aimed at boosting Alberta’s competitiveness and attractiveness to investors . We are developing an Investment and Growth Strategy that aims to reverse the trend of capital flight in recent years .
The strategy will guide targeted actions in our priority sectors to identify and attract new foreign and domestic investment that will grow our economy . We will highlight Alberta as the best place to invest and do business by aggressively marketing the province’s competitive advantages . We will:
• focus on initiatives that will improve Alberta’s investment attraction and promote investment and the delivery of investor services to the highest impact reinvestment opportunities in select priority sectors;
• re-align Alberta’s International Office network to bolster investment attraction efforts in key markets;
• expand services and expertise for attracting and expanding international and domestic investment into Alberta companies and major projects; and
• strengthen relationships with investment attraction agencies, governments and intermediaries to leverage opportunities, encourage shared priorities and improve investment readiness
Government will raise Alberta’s reputation as an investment destination by:
1 . Marketing Alberta as a key investment destination;
2 . Leveraging existing and building on new investment attraction and trade promotion events to showcase Alberta and its unique value-proposition;
3 . Proactively identifying new potential investors, clients and businesses; and
4 . Leveraging Premier and Ministerial missions to increase awareness of Alberta as an investment destination .
We will restore Alberta’s international reputation as a global energy producer through:
1 . Vigorous defense of Alberta’s and Canada’s natural resource sector;
2 . Driving investment attraction and competitiveness through international relations, concierge investor services, and proactive marketing; and
3 . Vigorous defense of provincial jurisdiction over natural resources .
Skills for Jobs Strategy
The government is ensuring Albertans have the skills demanded by Alberta’s labour market . This includes training and re-training programs that help unemployed or under-employed Albertans obtain the skills needed to succeed both now and into the future .
The government develops and aligns evidence-based policies and programs to influence and respond effectively to the province’s short and long-term labour market needs . Our first priority is ensuring Albertans are able to participate in the labour market .
Our first priority is ensuring Albertans are able to participate in
the labour market.
45A Blueprint for Jobs | Fiscal Plan 2020 – 23
Private enterprise is increasingly concerned about the ability to address pressure points by calibrating skills and training to labour market demand .
We are continuing to invest in training and other supports that lead to full-time employment, especially for Albertans who have been adversely impacted by the economic downturn, and including oil and gas workers, coal workers, Indigenous Albertans, young people and newcomers . Tens of thousands of Albertans access these programs on an annual basis in both urban and rural centres across Alberta .
The Government of Alberta provides information services and training to help Albertans understand the labour market, make informed career decisions, develop education and training plans, and prepare for, find and maintain employment . Along with the Ministry of Education, the ministries of Labour and Immigration, Advanced Education, Community and Social Services and Indigenous Relations are working together to ensure programs are more effective, have appropriate outcomes, and remain nimble to adapt to changing markets . Policies and programs are being reviewed to ensure they are effective, including through outcomes-based funding for post-secondary institutions . We are:
• Revising curriculum to ensure improvement in math and sciences;
• Reskilling labour;
• Implementing an outcomes-based funding model for post-secondary institutions;
• Increasing skilled trades training;
• Attracting talented immigrants;
• Attracting skilled and experienced foreign entrepreneurs;
• Supporting the participation of Albertans with disabilities in the labour force; and
• Closely analyzing labour market forecasts to ensure we are aligning government support to emerging need .
There are currently thousands of available jobs in transport truck driving in Alberta even while thousands of Albertans remain unemployed . The new national safety standards have driven the cost of obtaining a commercial license upwards of $10,000 . The government will bring forward initiatives to address the existing and growing shortage of qualified transport truck drivers, help Albertans find steady work in the transportation industry and help make a career as a transport truck driver a more easily attainable goal .
Examples of current investments include:
• The Canada-Alberta Job Grant, which helps Alberta workers and job creators access the skills they need to adapt to the changing requirements of jobs and the labour market;
• The Training for Work Program, which can assist Albertans with short-term skills training and work experience leading to employment;
Existing resources will be analyzed and re-profiled as necessary to address private sector labour needs.
46 A Blueprint for Jobs | Fiscal Plan 2020 – 23
• Indigenous training programs that offer short-term training opportunities leading to employment;
• Career Services and Foundational Learning programs improving Albertans long term employment outcomes;
• Training and employment supporting Albertans with disabilities to participate in post-secondary education and secure employment;
• Apprenticeship training supports Albertans to enter skilled trades, including support for women who wish to pursue the skilled trades, by expanding the Women Building Futures program;
• Help for young Albertans to demonstrate their skills on the national and world stage and participate in the Skills Canada National Competition;
• Doubling the number of schools to 1,000 from 500 that work with CAREERS the Next Generation, and quadruple the number of students and full-time apprentices from 1,567 to 6,000 by 2023; and
• Labour mobility efforts to speed up recognition of credentials for professions and trades, reducing barriers and getting people working sooner .
To assist Albertans impacted by the downturn to return to work as soon as possible, enhanced job search and placement supports have been expanded and include specialized supports for engineers and other professionals . With federal support, we will accelerate training in key economic sectors with labour market shortages, to ensure effective deployment of labour that supports growth . As part of A Blueprint for Jobs, we will demonstrate we can be more nimble and effective in developing programs that target acute labour shortages, for example in the agriculture sector .
Finally, the Fairness for Newcomers Action Plan will help immigrants with skills from their home country get to work at their skill level more quickly . The Fair Registration Practices Act, passed in June 2019, does just that by eliminating unjust procedural barriers to registration in regulated professions and trades for new and foreign-trained Albertans . The Act creates a Fair Registration Practices Office to work with regulators to speed up and simplify the credential-assessment process . Other initiatives to help immigrants get to work quickly include the new Startup Visa Program within the New Alberta Advantage Immigration Program that includes a bridge to permanent residency through the Alberta Immigrant Nominee Program and opportunities to fast track immigration for highly qualified foreign students at Alberta colleges and universities through the Foreign Graduate Entrepreneur Program .
Infrastructure
Long term availability of infrastructure, including transportation, research institutions, communication and information networks, education, health, water and waste management, and tourism events and accommodation, is important in location investment decisions .
Strategic investments in the transportation system help to create jobs and contribute to economic growth . Developing key transportation corridors that can more seamlessly move goods and products is crucial in supporting
47A Blueprint for Jobs | Fiscal Plan 2020 – 23
economic growth . This includes high-load corridors to enhance Alberta’s competitiveness and expand access to new markets within and outside our province . Government will continue to collaborate in partnership with industry and municipalities to identify critical investments and align our capital spending priorities accordingly . We will also pursue opportunities to accelerate capital spending in areas that support economic growth .
We will focus on infrastructure that advances jobs and growth . We have re-focused our efforts to ensure:
• Strategic land-use planning;
• Maintaining and building infrastructure with a focus on transportation, education, public safety, health care and connectivity;
• Alberta is demonstrating national leadership in the development of P3 projects, and to focus on delivering large-scale infrastructure projects through innovative partnership with industry, including public-private partnerships;
• Investments that increase tourism; and
• Market access for Alberta energy .
Alberta’s expansive Capital Plan includes funding over three years for roads, bridges and LRTs, which is anticipated to support, on an annual basis, around 13,000 jobs and account for between $2-2 .5 billion in economic activity . It will also enable better access for new and expanded development and removing pinch points on trade corridors, which will further attract new investment .
Too often, governments justify higher capital spending because they believe it will provide short-term fiscal stimulus . Our government is ensuring broader economic needs are considered . The government of Alberta is working hard to accelerate our already aggressive Capital Plan, with a focus on projects that support economic growth and trade . Analysis is underway to identify investments that support job creation both in their construction phase and over the longer-term:
• Government will prioritize infrastructure projects that enable future private sector investment . This includes clearing transportation bottlenecks and reducing congestion in key trading and industrial corridors .
• Priority will be assigned to investments that will increase the economy’s productive capacity, lower the cost of doing business, and encourage new private investment in the province .
• Such prioritization criteria will also be extended to the budget for capital maintenance .
As part of A Blueprint for Jobs, government is looking at potential new investments in the Edmonton-Calgary corridor, in the Industrial Heartland, in the Grande Prairie region, and to improve east-west provincial and export trade and labour market access .

BLANK PAGE
48
49
BUDGET 2020
GOVERNMENT OF ALBERTA | 2020 –23
Fiscal PlanEconomic Outlook
50 Economic Outlook | Fiscal Plan 2020 – 23
Table of Contents
Key Energy and Economic Assumptions . . . . . . . . . . . . . . . . . . . . . . . . . . . . . . . . . . . . . . . . . . . . . . . . . . . . 52
Economic Outlook 2020 – 23 . . . . . . . . . . . . . . . . . . . . . . . . . . . . . . . . . . . . . . . . . . . . . . . . . . . . . . . . . . . . . 53
Chart 1: Investment to fuel growth in domestic demand . . . . . . . . . . . . . . . . . . . . . . . . . . . . . . . . . . . . . . . . 53
Chart 2: A prolonged recovery for the Alberta economy . . . . . . . . . . . . . . . . . . . . . . . . . . . . . . . . . . . . . . . . 54
Global Economy . . . . . . . . . . . . . . . . . . . . . . . . . . . . . . . . . . . . . . . . . . . . . . . . . . . . . . . . . . . . . . . . . . . . . . . 55
Chart 3: Manufacturing stabilizing . . . . . . . . . . . . . . . . . . . . . . . . . . . . . . . . . . . . . . . . . . . . . . . . . . . . . . . . 55
Chart 4: Households driving U .S . economy . . . . . . . . . . . . . . . . . . . . . . . . . . . . . . . . . . . . . . . . . . . . . . . . . 56
Chart 5: Canada an outlier on monetary policy . . . . . . . . . . . . . . . . . . . . . . . . . . . . . . . . . . . . . . . . . . . . . . 57
Chart 6: Modest price appreciation forecast for oil . . . . . . . . . . . . . . . . . . . . . . . . . . . . . . . . . . . . . . . . . . . . 58
Alberta Economy . . . . . . . . . . . . . . . . . . . . . . . . . . . . . . . . . . . . . . . . . . . . . . . . . . . . . . . . . . . . . . . . . . . . . . 59
Chart 7: Oil a major driver of export growth . . . . . . . . . . . . . . . . . . . . . . . . . . . . . . . . . . . . . . . . . . . . . . . . 59
Chart 8: Takeaway capacity critical for expanding production . . . . . . . . . . . . . . . . . . . . . . . . . . . . . . . . . . . . 60
Chart 9: Modest oil price outlook to support growth in corporate profits . . . . . . . . . . . . . . . . . . . . . . . . . . . 61
Chart 10: Oil and gas investment no longer a drag on growth . . . . . . . . . . . . . . . . . . . . . . . . . . . . . . . . . . . 62
Chart 11: Non‑energy sector a key driver of investment . . . . . . . . . . . . . . . . . . . . . . . . . . . . . . . . . . . . . . . . 63
Chart 12: Value‑added food products a source of growth . . . . . . . . . . . . . . . . . . . . . . . . . . . . . . . . . . . . . . . 65
Chart 13: Unemployment rate to ease gradually . . . . . . . . . . . . . . . . . . . . . . . . . . . . . . . . . . . . . . . . . . . . . . 66
Chart 14: Participation rate to come down with aging population . . . . . . . . . . . . . . . . . . . . . . . . . . . . . . . . 67
Chart 15: Natural increase and immigration drive population growth . . . . . . . . . . . . . . . . . . . . . . . . . . . . . . 68
Chart 16: Housing starts to rise gradually . . . . . . . . . . . . . . . . . . . . . . . . . . . . . . . . . . . . . . . . . . . . . . . . . . . 69
Chart 17: Albertans are younger, more engaged and highly productive . . . . . . . . . . . . . . . . . . . . . . . . . . . . . 70
Risks to the Economic Outlook . . . . . . . . . . . . . . . . . . . . . . . . . . . . . . . . . . . . . . . . . . . . . . . . . . . . . . . . . . . 71
Chart 18: Alberta exposed to unique market risks . . . . . . . . . . . . . . . . . . . . . . . . . . . . . . . . . . . . . . . . . . . . . 71
Table 1: Scenario Impacts . . . . . . . . . . . . . . . . . . . . . . . . . . . . . . . . . . . . . . . . . . . . . . . . . . . . . . . . . . . . . . . 73
51Economic Outlook | Fiscal Plan 2020 – 23
Table of Contents, continued
Annex . . . . . . . . . . . . . . . . . . . . . . . . . . . . . . . . . . . . . . . . . . . . . . . . . . . . . . . . . . . . . . . . . . . . . . . . . . . . . . . 75
Oil Price Benchmark . . . . . . . . . . . . . . . . . . . . . . . . . . . . . . . . . . . . . . . . . . . . . . . . . . . . . . . . . . . . . . . . . . . 76
How Oil Price Forecasters Fared in Budget 2019 . . . . . . . . . . . . . . . . . . . . . . . . . . . . . . . . . . . . . . . . . . . . . . 76
Light‑Heavy Oil Price Differential Benchmark . . . . . . . . . . . . . . . . . . . . . . . . . . . . . . . . . . . . . . . . . . . . . . . 77
Natural Gas Price Benchmark . . . . . . . . . . . . . . . . . . . . . . . . . . . . . . . . . . . . . . . . . . . . . . . . . . . . . . . . . . . . 78
How Natural Gas Price Forecasters Did in Budget 2019 . . . . . . . . . . . . . . . . . . . . . . . . . . . . . . . . . . . . . . . . 78
United States / Canada Exchange Rate Benchmark . . . . . . . . . . . . . . . . . . . . . . . . . . . . . . . . . . . . . . . . . . . . 79
Canadian Long‑Term Interest Rate Benchmark . . . . . . . . . . . . . . . . . . . . . . . . . . . . . . . . . . . . . . . . . . . . . . 79
Alberta Real Gross Domestic Product Benchmark . . . . . . . . . . . . . . . . . . . . . . . . . . . . . . . . . . . . . . . . . . . . . 80
Alberta Nominal Gross Domestic Product Benchmark . . . . . . . . . . . . . . . . . . . . . . . . . . . . . . . . . . . . . . . . . 80
Alberta Employment Benchmark . . . . . . . . . . . . . . . . . . . . . . . . . . . . . . . . . . . . . . . . . . . . . . . . . . . . . . . . . 81
Alberta Unemployment Rate Benchmark . . . . . . . . . . . . . . . . . . . . . . . . . . . . . . . . . . . . . . . . . . . . . . . . . . . 81
Alberta Housing Starts Benchmark . . . . . . . . . . . . . . . . . . . . . . . . . . . . . . . . . . . . . . . . . . . . . . . . . . . . . . . . 82
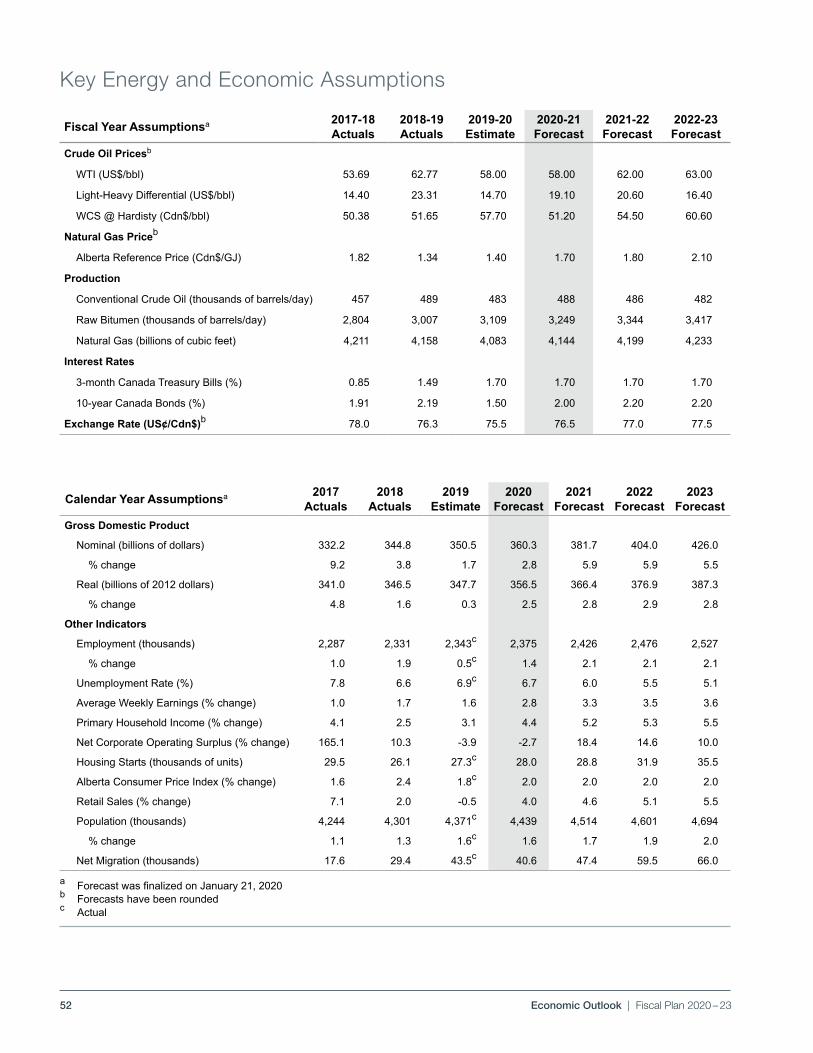
52 Economic Outlook | Fiscal Plan 2020 – 23
Key Energy and Economic Assumptions
Fiscal Year Assumptionsa 2017‑18 Actuals
2018‑19 Actuals
2019‑20 Estimate
2020‑21 Forecast
2021‑22 Forecast
2022‑23 Forecast
Crude Oil Pricesb
WTI (US$/bbl) 53.69 62.77 58.00 58.00 62.00 63.00
Light‑Heavy Differential (US$/bbl) 14.40 23.31 14.70 19.10 20.60 16.40
WCS @ Hardisty (Cdn$/bbl) 50.38 51.65 57.70 51.20 54.50 60.60
Natural Gas Priceb
Alberta Reference Price (Cdn$/GJ) 1.82 1.34 1.40 1.70 1.80 2.10
Production
Conventional Crude Oil (thousands of barrels/day) 457 489 483 488 486 482
Raw Bitumen (thousands of barrels/day) 2,804 3,007 3,109 3,249 3,344 3,417
Natural Gas (billions of cubic feet) 4,211 4,158 4,083 4,144 4,199 4,233
Interest Rates
3‑month Canada Treasury Bills (%) 0.85 1.49 1.70 1.70 1.70 1.70
10‑year Canada Bonds (%) 1.91 2.19 1.50 2.00 2.20 2.20
Exchange Rate (US¢/Cdn$)b 78.0 76.3 75.5 76.5 77.0 77.5
a ForecastwasfinalizedonJanuary21,2020b Forecasts have been rounded c Actual
Calendar Year Assumptionsa 2017 Actuals
2018 Actuals
2019 Estimate
2020 Forecast
2021 Forecast
2022 Forecast
2023 Forecast
Gross Domestic Product
Nominal (billions of dollars) 332.2 344.8 350.5 360.3 381.7 404.0 426.0
% change 9.2 3.8 1.7 2.8 5.9 5.9 5.5
Real (billions of 2012 dollars) 341.0 346.5 347.7 356.5 366.4 376.9 387.3
% change 4.8 1.6 0.3 2.5 2.8 2.9 2.8
Other Indicators
Employment (thousands) 2,287 2,331 2,343c 2,375 2,426 2,476 2,527
% change 1.0 1.9 0.5c 1.4 2.1 2.1 2.1
Unemployment Rate (%) 7.8 6.6 6.9c 6.7 6.0 5.5 5.1
Average Weekly Earnings (% change) 1.0 1.7 1.6 2.8 3.3 3.5 3.6
Primary Household Income (% change) 4.1 2.5 3.1 4.4 5.2 5.3 5.5
Net Corporate Operating Surplus (% change) 165.1 10.3 ‑3.9 ‑2.7 18.4 14.6 10.0
Housing Starts (thousands of units) 29.5 26.1 27.3c 28.0 28.8 31.9 35.5
Alberta Consumer Price Index (% change) 1.6 2.4 1.8c 2.0 2.0 2.0 2.0
Retail Sales (% change) 7.1 2.0 ‑0.5 4.0 4.6 5.1 5.5
Population (thousands) 4,244 4,301 4,371c 4,439 4,514 4,601 4,694
% change 1.1 1.3 1.6c 1.6 1.7 1.9 2.0
Net Migration (thousands) 17.6 29.4 43.5c 40.6 47.4 59.5 66.0
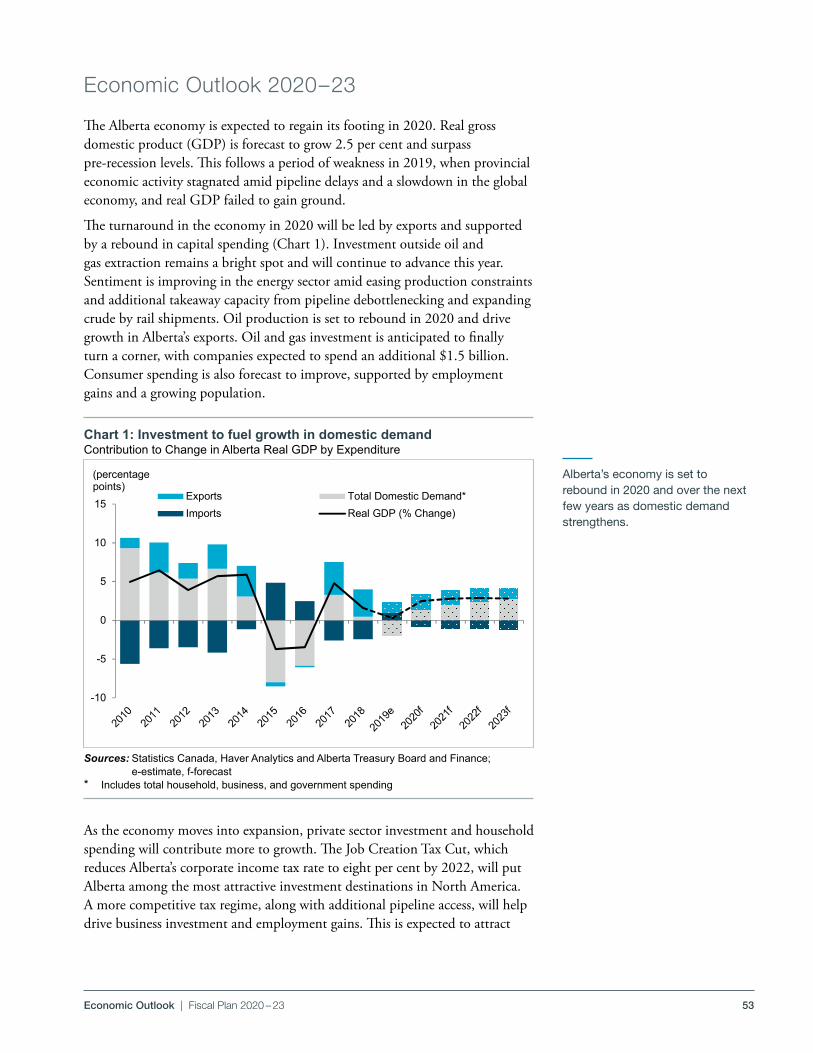
53Economic Outlook | Fiscal Plan 2020 – 23
Economic Outlook 2020 – 23
The Alberta economy is expected to regain its footing in 2020 . Real gross domestic product (GDP) is forecast to grow 2 .5 per cent and surpass pre‑recession levels . This follows a period of weakness in 2019, when provincial economic activity stagnated amid pipeline delays and a slowdown in the global economy, and real GDP failed to gain ground .
The turnaround in the economy in 2020 will be led by exports and supported by a rebound in capital spending (Chart 1) . Investment outside oil and gas extraction remains a bright spot and will continue to advance this year . Sentiment is improving in the energy sector amid easing production constraints and additional takeaway capacity from pipeline debottlenecking and expanding crude by rail shipments . Oil production is set to rebound in 2020 and drive growth in Alberta’s exports . Oil and gas investment is anticipated to finally turn a corner, with companies expected to spend an additional $1 .5 billion . Consumer spending is also forecast to improve, supported by employment gains and a growing population .
As the economy moves into expansion, private sector investment and household spending will contribute more to growth . The Job Creation Tax Cut, which reduces Alberta’s corporate income tax rate to eight per cent by 2022, will put Alberta among the most attractive investment destinations in North America . A more competitive tax regime, along with additional pipeline access, will help drive business investment and employment gains . This is expected to attract
Alberta’s economy is set to rebound in 2020 and over the next few years as domestic demand strengthens.
Chart 1: Investment to fuel growth in domestic demandContribution to Change in Alberta Real GDP by Expenditure
Sources: Statistics Canada, Haver Analytics and Alberta Treasury Board and Finance; e‑estimate, f‑forecast
* Includes total household, business, and government spending
2020 BudgetEconomic Outlook
PDF Name: EO20_chrt_01.pdf
Investment to fuel growth in domestic demandContribution to Change in Alberta Real GDP by Expenditure
Sources: Statistics Canada, Haver Analytics and Alberta Treasury Board and Finance; e-estimate, f-forecast* Includes total household, business, and government spending
EO20_chrt_01.pdf
-10
-5
0
5
10
15
(percentage points)
Exports Total Domestic Demand*Imports Real GDP (% Change)
Path: \\ter-fin-fs-01.fin.gov.ab.ca\Publications\_Economics_publications\Budget\5_Economic-Outlook_2020-21\SourceDocs\File: 6-16,1_Budget2020Charts-ALBERTATab: Chart 1 RGDP by Comp Last updated: 2020-02-18: 11:15 AM
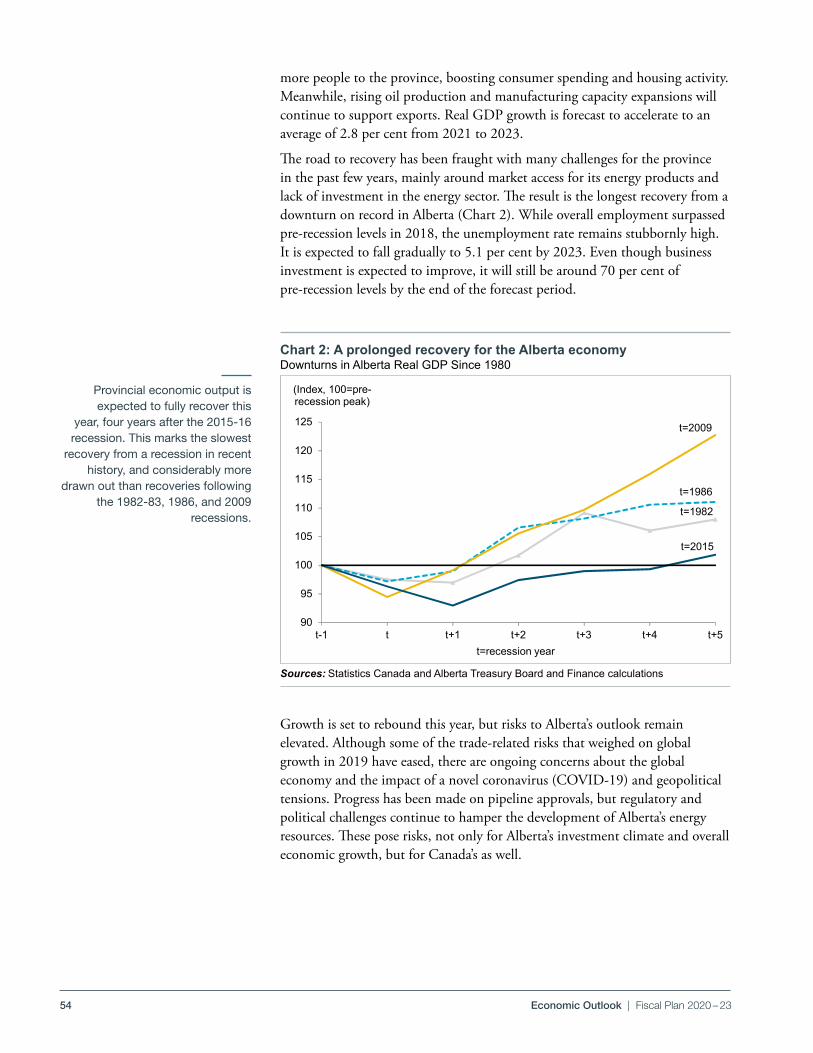
54 Economic Outlook | Fiscal Plan 2020 – 23
more people to the province, boosting consumer spending and housing activity . Meanwhile, rising oil production and manufacturing capacity expansions will continue to support exports . Real GDP growth is forecast to accelerate to an average of 2 .8 per cent from 2021 to 2023 .
The road to recovery has been fraught with many challenges for the province in the past few years, mainly around market access for its energy products and lack of investment in the energy sector . The result is the longest recovery from a downturn on record in Alberta (Chart 2) . While overall employment surpassed pre‑recession levels in 2018, the unemployment rate remains stubbornly high . It is expected to fall gradually to 5 .1 per cent by 2023 . Even though business investment is expected to improve, it will still be around 70 per cent of pre‑recession levels by the end of the forecast period .
Growth is set to rebound this year, but risks to Alberta’s outlook remain elevated . Although some of the trade‑related risks that weighed on global growth in 2019 have eased, there are ongoing concerns about the global economy and the impact of a novel coronavirus (COVID‑19) and geopolitical tensions . Progress has been made on pipeline approvals, but regulatory and political challenges continue to hamper the development of Alberta’s energy resources . These pose risks, not only for Alberta’s investment climate and overall economic growth, but for Canada’s as well .
Provincial economic output is expected to fully recover this
year, four years after the 2015‑16 recession. This marks the slowest
recovery from a recession in recent history, and considerably more
drawn out than recoveries following the 1982‑83, 1986, and 2009
recessions.
Chart 2: A prolonged recovery for the Alberta economyDownturns in Alberta Real GDP Since 1980
Sources: Statistics Canada and Alberta Treasury Board and Finance calculations
2020 BudgetEconomic Outlook
PDF Name: EO20_chrt_02.pdf
A longer recovery for Alberta's economyDownturns in Alberta Real GDP Since 1980
Sources: Statistics Canada and Alberta Treasury Board and Finance
EO20_chrt_02.pdf
90
95
100
105
110
115
120
125
t-1 t t+1 t+2 t+3 t+4 t+5
(Index, 100=pre-recession peak)
t=recession year
t=2009
t=1982
t=1986
t=2015
Path: \\ter-fin-fs-01.fin.gov.ab.ca\Publications\_Economics_publications\Budget\5_Economic-Outlook_2020-21\SourceDocs\File: 6-16,1_Budget2020Charts-ALBERTATab: Chart 2 Recovery Last updated: 2/14/2020: 2:01 PM
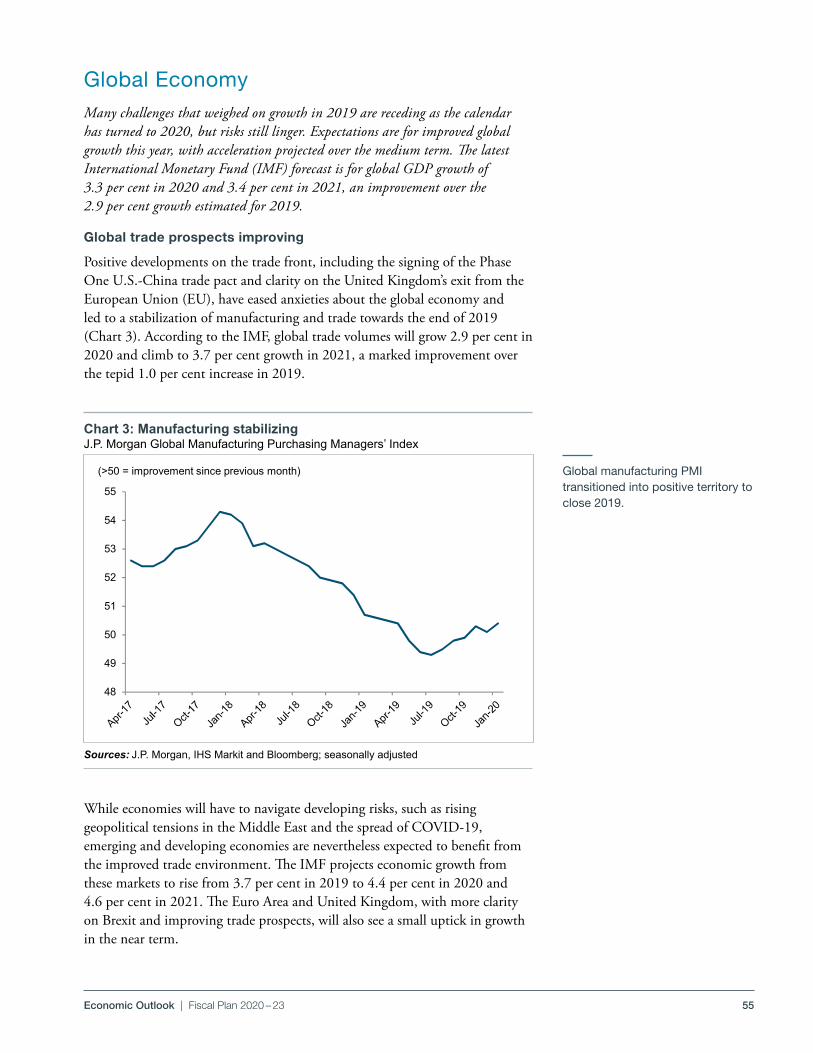
55Economic Outlook | Fiscal Plan 2020 – 23
Global EconomyMany challenges that weighed on growth in 2019 are receding as the calendar has turned to 2020, but risks still linger. Expectations are for improved global growth this year, with acceleration projected over the medium term. The latest International Monetary Fund (IMF) forecast is for global GDP growth of 3.3 per cent in 2020 and 3.4 per cent in 2021, an improvement over the 2.9 per cent growth estimated for 2019.
Global trade prospects improving
Positive developments on the trade front, including the signing of the Phase One U .S .‑China trade pact and clarity on the United Kingdom’s exit from the European Union (EU), have eased anxieties about the global economy and led to a stabilization of manufacturing and trade towards the end of 2019 (Chart 3) . According to the IMF, global trade volumes will grow 2 .9 per cent in 2020 and climb to 3 .7 per cent growth in 2021, a marked improvement over the tepid 1 .0 per cent increase in 2019 .
While economies will have to navigate developing risks, such as rising geopolitical tensions in the Middle East and the spread of COVID‑19, emerging and developing economies are nevertheless expected to benefit from the improved trade environment . The IMF projects economic growth from these markets to rise from 3 .7 per cent in 2019 to 4 .4 per cent in 2020 and 4 .6 per cent in 2021 . The Euro Area and United Kingdom, with more clarity on Brexit and improving trade prospects, will also see a small uptick in growth in the near term .
Global manufacturing PMI transitioned into positive territory to close 2019.
Sources: J.P. Morgan, IHS Markit and Bloomberg; seasonally adjusted
Chart 3: Manufacturing stabilizingJ.P. Morgan Global Manufacturing Purchasing Managers’ Index
2020 BudgetEconomic Outlook
PDF Name: EO20_chrt_03.pdf
Chart 2: Manufacturing outlook stabilizingJ.P. Morgan Global Manufacturing Purchasing Managers' Index, SA
Sources: J.P. Morgan, IHS Markit, Bloomberg
EO20_chrt_03.pdf
48
49
50
51
52
53
54
55
(>50 = improvement since previous month)
Path: \\ter-fin-fs-01.fin.gov.ab.ca\Publications\_Economics_publications\Budget\5_Economic-Outlook_2020-21\SourceDocs\File: 2-5_Budget2020Charts-EXTERNALTab: Chart 3 Global PMI Last Updated: 2020-02-10: 2:38 PM
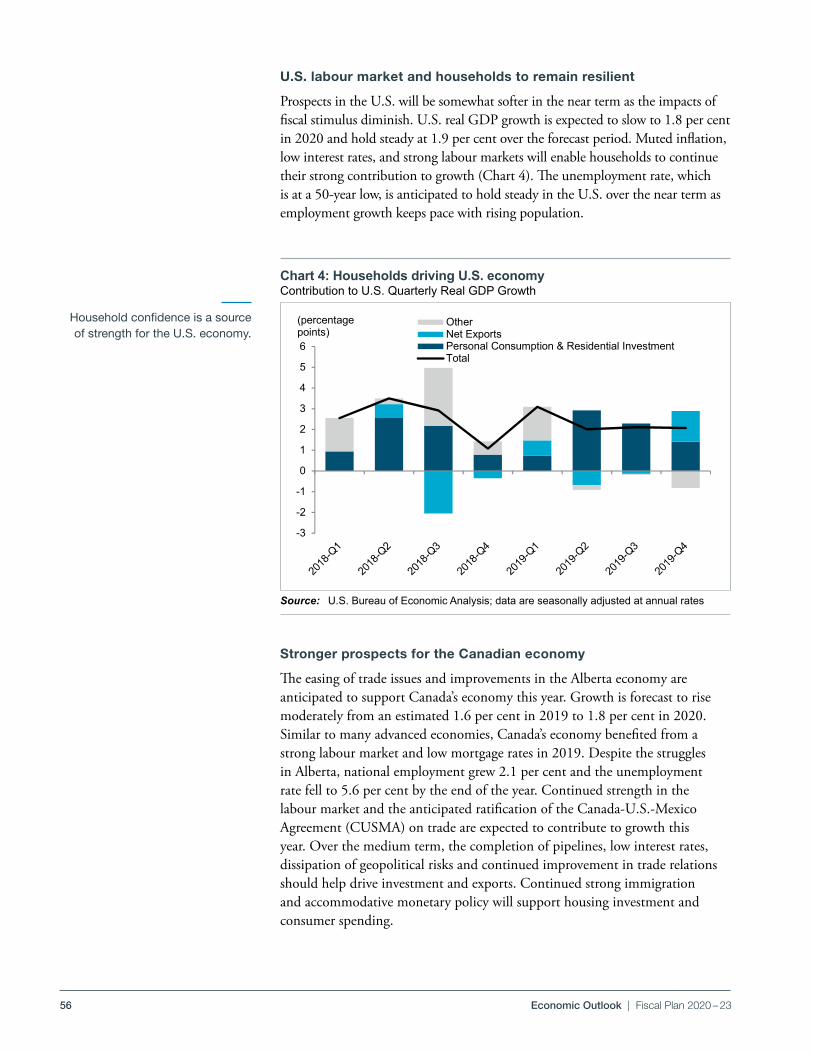
56 Economic Outlook | Fiscal Plan 2020 – 23
U.S. labour market and households to remain resilient
Prospects in the U .S . will be somewhat softer in the near term as the impacts of fiscal stimulus diminish . U .S . real GDP growth is expected to slow to 1 .8 per cent in 2020 and hold steady at 1 .9 per cent over the forecast period . Muted inflation, low interest rates, and strong labour markets will enable households to continue their strong contribution to growth (Chart 4) . The unemployment rate, which is at a 50‑year low, is anticipated to hold steady in the U .S . over the near term as employment growth keeps pace with rising population .
Stronger prospects for the Canadian economy
The easing of trade issues and improvements in the Alberta economy are anticipated to support Canada’s economy this year . Growth is forecast to rise moderately from an estimated 1 .6 per cent in 2019 to 1 .8 per cent in 2020 .Similar to many advanced economies, Canada’s economy benefited from a strong labour market and low mortgage rates in 2019 . Despite the struggles in Alberta, national employment grew 2 .1 per cent and the unemployment rate fell to 5 .6 per cent by the end of the year . Continued strength in the labour market and the anticipated ratification of the Canada‑U .S .‑Mexico Agreement (CUSMA) on trade are expected to contribute to growth this year . Over the medium term, the completion of pipelines, low interest rates, dissipation of geopolitical risks and continued improvement in trade relations should help drive investment and exports . Continued strong immigration and accommodative monetary policy will support housing investment and consumer spending .
Household confidence is a source of strength for the U.S. economy.
Chart 4: Households driving U.S. economyContribution to U.S. Quarterly Real GDP Growth
Source: U.S. Bureau of Economic Analysis; data are seasonally adjusted at annual rates
2020 BudgetEconomic Outlook
PDF Name: EO20_chrt_04.pdf
Chart 3: Households driving U.S. economyContribution to U.S. Quarterly Real GDP Growth (SAAR)
Source: U.S. Bureau of Economic Analysis
EO20_chrt_04.pdf
-3
-2
-1
0
1
2
3
4
5
6
(percentage points)
OtherNet ExportsPersonal Consumption & Residential InvestmentTotal
Path: \\ter-fin-fs-01.fin.gov.ab.ca\Publications\_Economics_publications\Budget\5_Economic-Outlook_2020-21\SourceDocs\File: 2-5_Budget2020Charts-EXTERNALTab: Chart 4 US Growth Last Updated: 2020-02-12: 12:07 PM

57Economic Outlook | Fiscal Plan 2020 – 23
Global growth strengthening over the medium term
Medium‑term growth remains positive across the globe, supported by continued consumer strength and improving manufacturing and investment . Broadly speaking, advanced economies are expected to see 2020 growth levels carry through the remainder of the forecast horizon, with a pick up in the U .S . starting in 2021 . Growth in emerging markets is expected to accelerate, even as Chinese growth gradually slows, led by improving activity in underperforming economies, such as India and Mexico .
The medium‑term growth prospects will be buffeted by the continuation of low policy interest rates from central banks . The second half of 2019 saw an increase in the number of advanced and emerging economies loosening monetary policy . A sustained low interest rate environment should benefit both households and businesses, especially in terms of debt management and investment . As economic activity accelerates across most economies, interest rates are expected to rise gradually but remain accommodative .
Of note, the Bank of Canada (BoC) has not followed the lead of many advanced economies in reducing policy rates; rather, rates have remained unchanged since the end of 2018 (Chart 5) . Nonetheless, short‑and long‑term bond yields have fallen in Canada along with rates in the U .S . and elsewhere . Easing Canadian borrowing rates, especially for mortgages, and stable inflation have enabled the BoC to stay on the sidelines . The BoC is expected to continue to stand pat as inflation remains in check and Canada’s growth prospects improve on a strengthening energy sector, improving business investment and rising exports . The 10‑year Canadian bond rate is forecast to reach 2 .2 per cent by 2022‑23 . The exchange rate is expected to average 75 .5US¢/Cdn$ in 2019‑20 and climb to 77 .5US¢/Cdn$ by 2022‑23 .
Broadly, the Canadian economy has been more resilient than elsewhere, allowing the BoC to take a more restrained approach to monetary policy.
Chart 5: Canada an outlier on monetary policyCentral Bank Policy Rates
Sources: Bank of Canada, U.S. Federal Reserve and Haver Analytics* Includes policy rates for U.S., Japan, Germany, France, United Kingdom, Italy, Canada,
Spain, Netherlands, Australia, Belgium, Sweden, Austria, Denmark, Norway, Finland, Greece, Portugal, Ireland, New Zealand and Luxembourg weighted by nominal GDP in U.S. dollars in the preceeding quarter.
2020 BudgetEconomic Outlook
PDF Name: EO20_chrt_05.pdf
Chart 4: Commodities reflecting manufacturing weaknessIndices of Select Commodity Prices
Sources: Bank of Canada, U.S. Federal Reserve and Haver Analytics* Includes policy rates for U.S., Japan, Germany, France, United Kingdom, Italy, Canada, Spain, Netherlands, Australia, Belgium, Sweden, Austria, Denmark, Norway, Finland, Greece, Portugal, Ireland, New Zealand and Luxembourg weighted by nominal GDP in U.S. dollars in the preceeding quarter.EO20_chrt_05.pdf
0.0
0.5
1.0
1.5
2.0
2.5(%)
CanadaU.S.Advanced Economies *
Path: \\ter-fin-fs-01.fin.gov.ab.ca\Publications\_Economics_publications\Budget\5_Economic-Outlook_2020-21\SourceDocs\File: 2-5_Budget2020Charts-EXTERNALTab: Chart 5 Monetary Policy Rates Last Updated: 2020-02-10: 2:38 PM
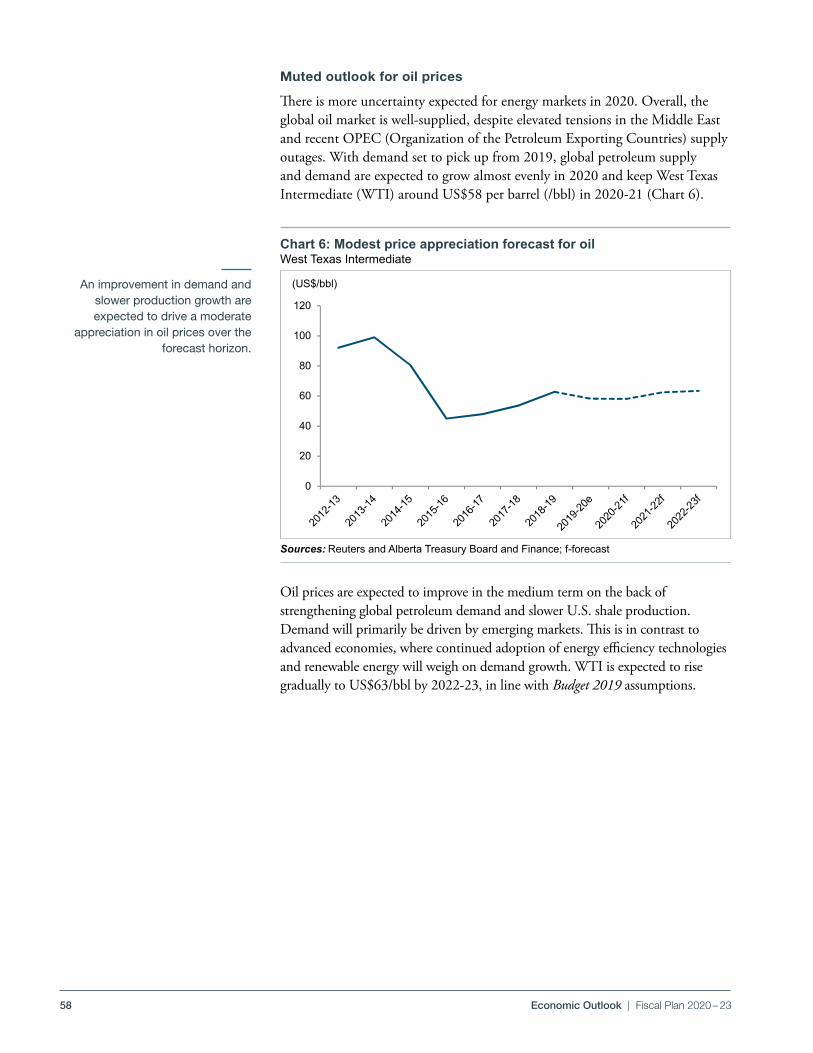
58 Economic Outlook | Fiscal Plan 2020 – 23
Muted outlook for oil prices
There is more uncertainty expected for energy markets in 2020 . Overall, the global oil market is well‑supplied, despite elevated tensions in the Middle East and recent OPEC (Organization of the Petroleum Exporting Countries) supply outages . With demand set to pick up from 2019, global petroleum supply and demand are expected to grow almost evenly in 2020 and keep West Texas Intermediate (WTI) around US$58 per barrel (/bbl) in 2020‑21 (Chart 6) .
Oil prices are expected to improve in the medium term on the back of strengthening global petroleum demand and slower U .S . shale production . Demand will primarily be driven by emerging markets . This is in contrast to advanced economies, where continued adoption of energy efficiency technologies and renewable energy will weigh on demand growth . WTI is expected to rise gradually to US$63/bbl by 2022‑23, in line with Budget 2019 assumptions .
An improvement in demand and slower production growth are expected to drive a moderate
appreciation in oil prices over the forecast horizon.
Sources: Reuters and Alberta Treasury Board and Finance; f‑forecast
Chart 6: Modest price appreciation forecast for oil West Texas Intermediate
2020 BudgetEconomic Outlook
PDF Name: EO20_chrt_06.pdf
Modest price appreciation forecast for oilWest Texas Intermediate
Source: Alberta Treasury Board and Finance, f-forecast
EO20_chrt_06.pdf
0
20
40
60
80
100
120
(US$/bbl)
Path: \\ter-fin-fs-01.fin.gov.ab.ca\Publications\_Economics_publications\Budget\5_Economic-Outlook_2020-21\SourceDocs\File: 2-5_Budget2020Charts-EXTERNALTab: Chart 6 WTI Last Updated: 2020-02-18: 10:30 AM
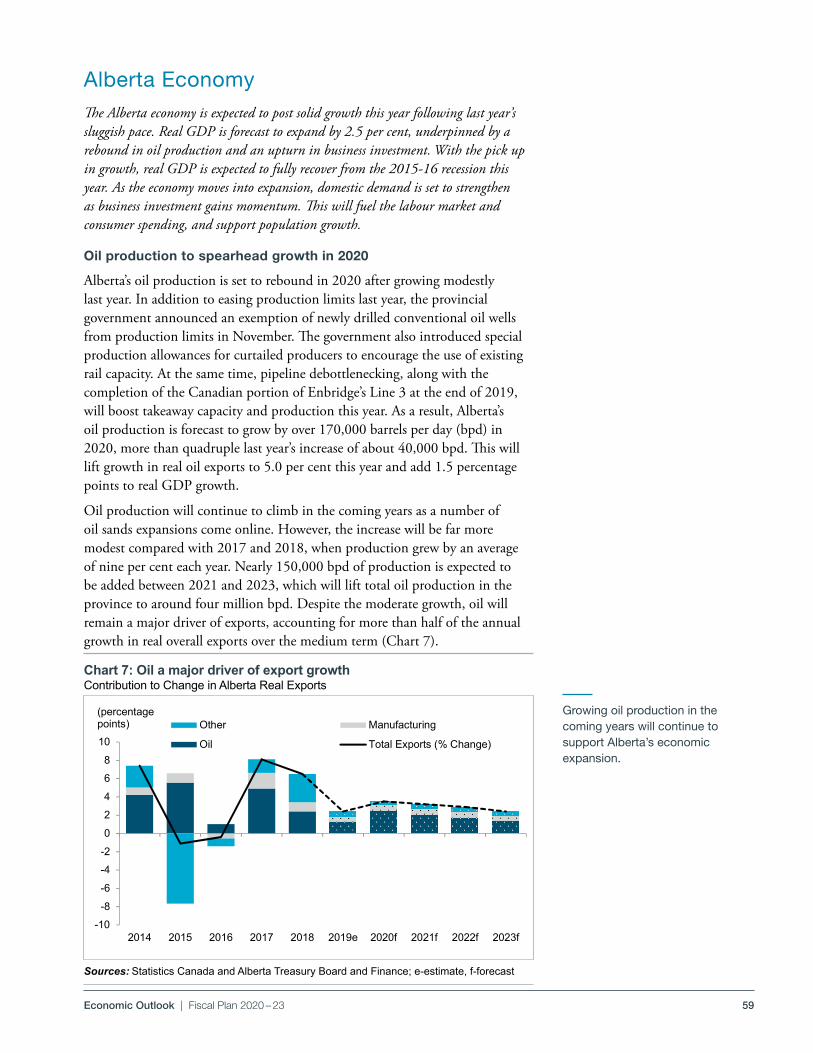
59Economic Outlook | Fiscal Plan 2020 – 23
Alberta EconomyThe Alberta economy is expected to post solid growth this year following last year’s sluggish pace. Real GDP is forecast to expand by 2.5 per cent, underpinned by a rebound in oil production and an upturn in business investment. With the pick up in growth, real GDP is expected to fully recover from the 2015‑16 recession this year. As the economy moves into expansion, domestic demand is set to strengthen as business investment gains momentum. This will fuel the labour market and consumer spending, and support population growth.
Oil production to spearhead growth in 2020
Alberta’s oil production is set to rebound in 2020 after growing modestly last year . In addition to easing production limits last year, the provincial government announced an exemption of newly drilled conventional oil wells from production limits in November . The government also introduced special production allowances for curtailed producers to encourage the use of existing rail capacity . At the same time, pipeline debottlenecking, along with the completion of the Canadian portion of Enbridge’s Line 3 at the end of 2019, will boost takeaway capacity and production this year . As a result, Alberta’s oil production is forecast to grow by over 170,000 barrels per day (bpd) in 2020, more than quadruple last year’s increase of about 40,000 bpd . This will lift growth in real oil exports to 5 .0 per cent this year and add 1 .5 percentage points to real GDP growth .
Oil production will continue to climb in the coming years as a number of oil sands expansions come online . However, the increase will be far more modest compared with 2017 and 2018, when production grew by an average of nine per cent each year . Nearly 150,000 bpd of production is expected to be added between 2021 and 2023, which will lift total oil production in the province to around four million bpd . Despite the moderate growth, oil will remain a major driver of exports, accounting for more than half of the annual growth in real overall exports over the medium term (Chart 7) .
Growing oil production in the coming years will continue to support Alberta’s economic expansion.
Sources: Statistics Canada and Alberta Treasury Board and Finance; e‑estimate, f‑forecast
Chart 7: Oil a major driver of export growthContribution to Change in Alberta Real Exports
2020 BudgetEconomic Outlook
PDF Name: EO20_chrt_07.pdf
Oil a major driver of export growthContribution to Change in Alberta Real Exports
Sources: Statistics Canada and Alberta Treasury Board and Finance, e-estimate, f-forecast
EO20_chrt_07.pdf
-10-8
-6
-4-2
0
24
68
10
2014 2015 2016 2017 2018 2019e 2020f 2021f 2022f 2023f
(percentage points) Other Manufacturing
Oil Total Exports (% Change)
Path: \\ter-fin-fs-01.fin.gov.ab.ca\Publications\_Economics_publications\Budget\5_Economic-Outlook_2020-21\SourceDocs\File: 6-16,1_Budget2020Charts-ALBERTATab: Chart 7 ExportsC2G Last updated: 2020-02-19: 11:17 AM

60 Economic Outlook | Fiscal Plan 2020 – 23
Market access weighs on Alberta prices
While oil production is set to rebound this year, Alberta heavy oil producers are expected to face larger discounts for their crude . Without sufficient pipeline capacity, the price discount between WTI and Alberta’s heavy oil benchmark, Western Canadian Select (WCS), will continue to reflect the higher cost of transporting crude by rail . The light‑heavy differential is forecast to average US$19 .10/bbl in 2020‑21, up from US$14 .70/bbl in 2019‑20 . It is expected to peak at US$20 .60/bbl in 2021‑22 before easing to US$16 .40/bbl in 2022‑23 . The province is anticipated to reach full pipeline access in the fourth quarter of 2022 when the Trans Mountain Expansion (TMX) pipeline comes online, followed by the completion of Keystone XL (KXL) in early 2023 (Chart 8) . Once completed, these pipelines will lift total takeaway capacity in Western Canada to more than six million bpd by the end of 2023 .
With recent progress, pipeline start dates appear to be on track . The Canadian portion of Line 3 was completed and began commercial service in December 2019 . Decisions by the Canadian Federal Court of Appeal and the Minnesota Public Utilities Commission have moved the needle on TMX and the U .S . portion of Line 3, respectively . TC Energy received approval on several permits from the U .S . Bureau of Land Management and South Dakota for KXL . However, all three pipelines still face several regulatory hurdles .
Although Alberta natural gas producers continue to face significant market access issues, local natural gas prices have improved recently . This is mainly due to combined impacts of the Nova Gas Transmission Ltd (NGTL) temporary tariff amendment, declining production, and lower storage inventory levels heading into the winter heating season . The temporary tariff amendment
Sources: Canadian Energy Regulator, Alberta Energy Regulator, Enbridge, Canadian Association of Petroleum Producers, and Alberta Energy; f‑forecast
Chart 8: Takeaway capacity critical for expanding productionTakeaway capacity and Western Canadian crude oil production
Completion of additional pipelines will ease transportation bottlenecks and support prices starting in 2022.
2020 BudgetEconomic Outlook
PDF Name:
Takeaway capacity critical for expanding productionTakeaway capacity and Western Canadian crude oil production
Source: Alberta Energy, * Includes crude-by-railEO20_chrt_08.pdf
0
1,000
2,000
3,000
4,000
5,000
6,000
7,000(kbpd) Rail Takeaway Capacity
Western Canada Demand and Pipeline Takeaway CapacityTotal Western Canada Crude Oil Production
Keystone XL
TMX
Line 3 fully commences
Path: \\ter-fin-fs-01.fin.gov.ab.ca\Publications\_Economics_publications\Budget\5_Economic-Outlook_2020-21\SourceDocs\File: 6-16,1_Budget2020Charts-ALBERTATab: Chart 8 Takeaway Modified Last updated: 2020-02-13: 12:21 PM
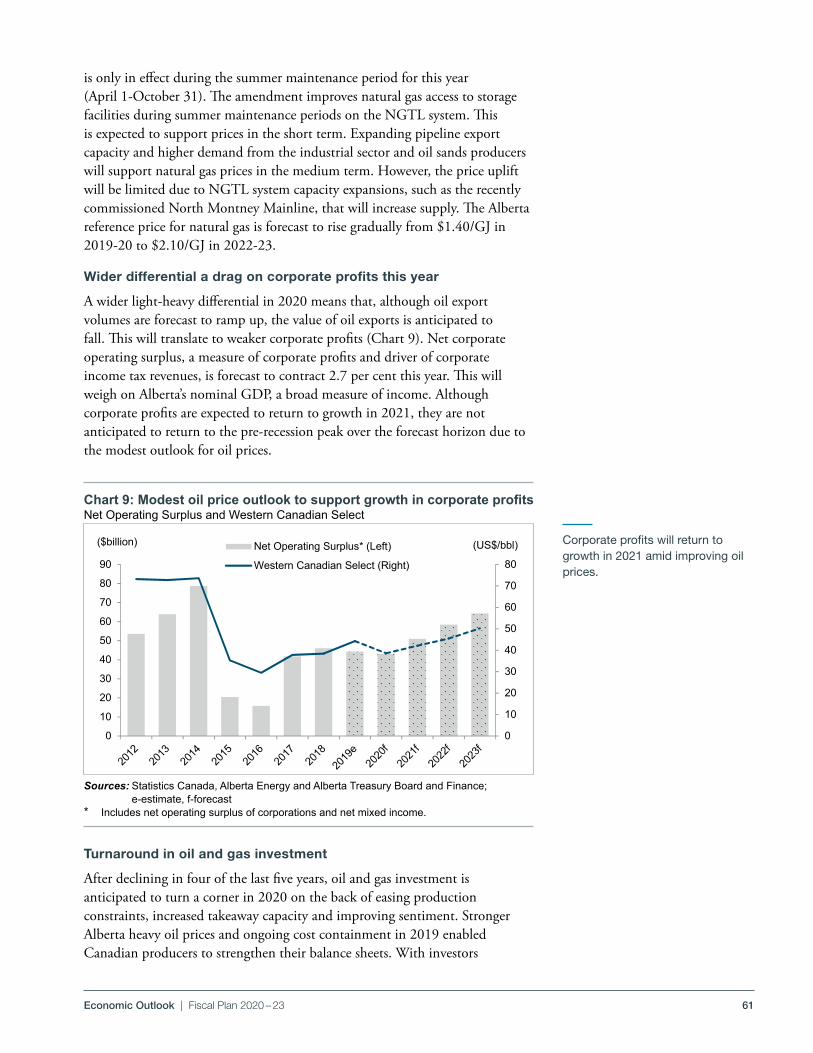
61Economic Outlook | Fiscal Plan 2020 – 23
Corporate profits will return to growth in 2021 amid improving oil prices.
is only in effect during the summer maintenance period for this year (April 1‑October 31) . The amendment improves natural gas access to storage facilities during summer maintenance periods on the NGTL system . This is expected to support prices in the short term . Expanding pipeline export capacity and higher demand from the industrial sector and oil sands producers will support natural gas prices in the medium term . However, the price uplift will be limited due to NGTL system capacity expansions, such as the recently commissioned North Montney Mainline, that will increase supply . The Alberta reference price for natural gas is forecast to rise gradually from $1 .40/GJ in 2019‑20 to $2 .10/GJ in 2022‑23 .
Wider differential a drag on corporate profits this year
A wider light‑heavy differential in 2020 means that, although oil export volumes are forecast to ramp up, the value of oil exports is anticipated to fall . This will translate to weaker corporate profits (Chart 9) . Net corporate operating surplus, a measure of corporate profits and driver of corporate income tax revenues, is forecast to contract 2 .7 per cent this year . This will weigh on Alberta’s nominal GDP, a broad measure of income . Although corporate profits are expected to return to growth in 2021, they are not anticipated to return to the pre‑recession peak over the forecast horizon due to the modest outlook for oil prices .
Turnaround in oil and gas investment
After declining in four of the last five years, oil and gas investment is anticipated to turn a corner in 2020 on the back of easing production constraints, increased takeaway capacity and improving sentiment . Stronger Alberta heavy oil prices and ongoing cost containment in 2019 enabled Canadian producers to strengthen their balance sheets . With investors
Sources: Statistics Canada, Alberta Energy and Alberta Treasury Board and Finance; e‑estimate, f‑forecast
* Includes net operating surplus of corporations and net mixed income.
Chart 9: Modest oil price outlook to support growth in corporate profitsNet Operating Surplus and Western Canadian Select
2020 BudgetEconomic Outlook
PDF Name: EO20_chrt_09.pdf
Lower WCS prices to weigh on corporate profits in 2020Western Canadian Select and Net Corporate Operating Surplus
Sources: Statistics Canada and Alberta Treasury Board and Finance, e-estimate, f-forecast* Includes net operating surplus of corporations and net mixed income
EO20_chrt_09.pdf
0
10
20
30
40
50
60
70
80
0
10
20
30
40
50
60
70
80
90
(US$/bbl)($billion) Net Operating Surplus* (Left)
Western Canadian Select (Right)
Path: \\ter-fin-fs-01.fin.gov.ab.ca\Publications\_Economics_publications\Budget\5_Economic-Outlook_2020-21\SourceDocs\File: 6-16,1_Budget2020Charts-ALBERTATab: Chart 9 WCS CorpProf Last updated: 2/14/2020: 2:07 PM
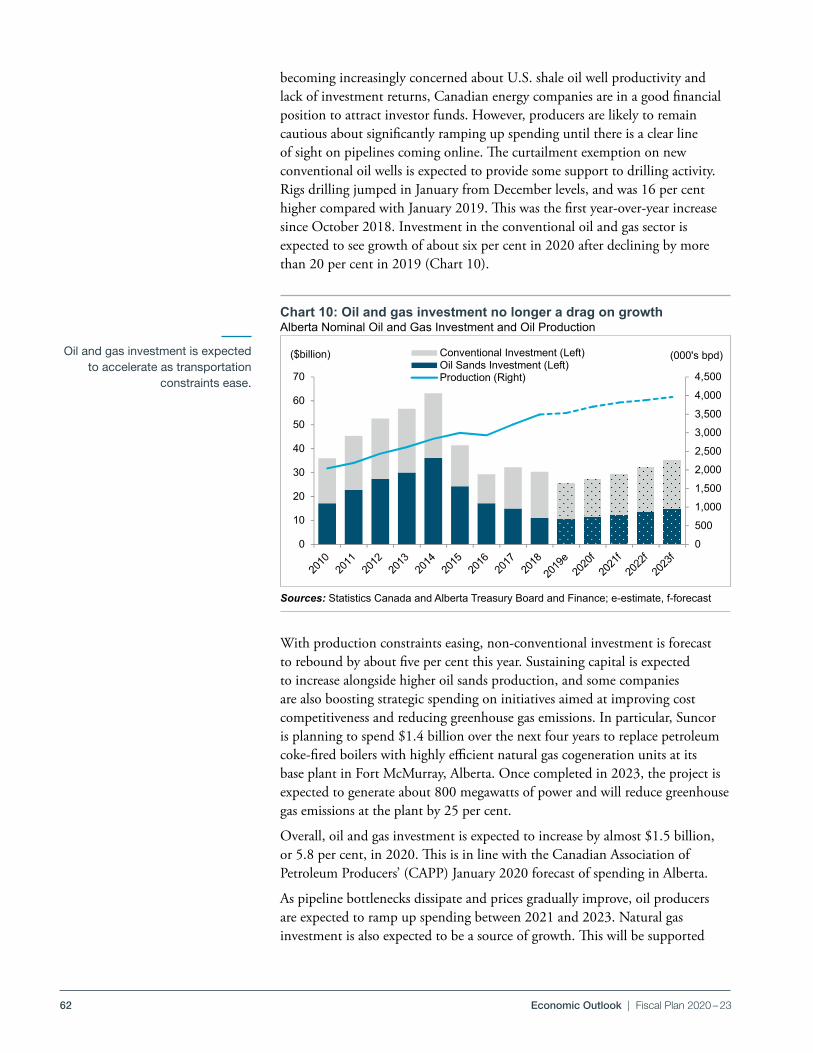
62 Economic Outlook | Fiscal Plan 2020 – 23
becoming increasingly concerned about U .S . shale oil well productivity and lack of investment returns, Canadian energy companies are in a good financial position to attract investor funds . However, producers are likely to remain cautious about significantly ramping up spending until there is a clear line of sight on pipelines coming online . The curtailment exemption on new conventional oil wells is expected to provide some support to drilling activity . Rigs drilling jumped in January from December levels, and was 16 per cent higher compared with January 2019 . This was the first year‑over‑year increase since October 2018 . Investment in the conventional oil and gas sector is expected to see growth of about six per cent in 2020 after declining by more than 20 per cent in 2019 (Chart 10) .
With production constraints easing, non‑conventional investment is forecast to rebound by about five per cent this year . Sustaining capital is expected to increase alongside higher oil sands production, and some companies are also boosting strategic spending on initiatives aimed at improving cost competitiveness and reducing greenhouse gas emissions . In particular, Suncor is planning to spend $1 .4 billion over the next four years to replace petroleum coke‑fired boilers with highly efficient natural gas cogeneration units at its base plant in Fort McMurray, Alberta . Once completed in 2023, the project is expected to generate about 800 megawatts of power and will reduce greenhouse gas emissions at the plant by 25 per cent .
Overall, oil and gas investment is expected to increase by almost $1 .5 billion, or 5 .8 per cent, in 2020 . This is in line with the Canadian Association of Petroleum Producers’ (CAPP) January 2020 forecast of spending in Alberta .
As pipeline bottlenecks dissipate and prices gradually improve, oil producers are expected to ramp up spending between 2021 and 2023 . Natural gas investment is also expected to be a source of growth . This will be supported
Oil and gas investment is expected to accelerate as transportation
constraints ease.
Sources: Statistics Canada and Alberta Treasury Board and Finance; e‑estimate, f‑forecast
Chart 10: Oil and gas investment no longer a drag on growthAlberta Nominal Oil and Gas Investment and Oil Production
2020 BudgetEconomic Outlook
PDF Name: EO20_chrt_10.pdf
Oil and gas investment no longer a drag on growthAlberta Nominal Oil and Gas Investment and Crude Oil Production
Sources: Statistics Canada and Alberta Treasury Board and Finance, e-estimate, f-forecast
EO20_chrt_10.pdf
0
500
1,000
1,500
2,000
2,500
3,000
3,500
4,000
4,500
0
10
20
30
40
50
60
70
(000's bpd)($billion) Conventional Investment (Left)Oil Sands Investment (Left)Production (Right)
Path: \\ter-fin-fs-01.fin.gov.ab.ca\Publications\_Economics_publications\Budget\5_Economic-Outlook_2020-21\SourceDocs\File: 6-16,1_Budget2020Charts-ALBERTATab: Chart 10 Oil Inv Last updated: 2020-02-18: 11:13 AM
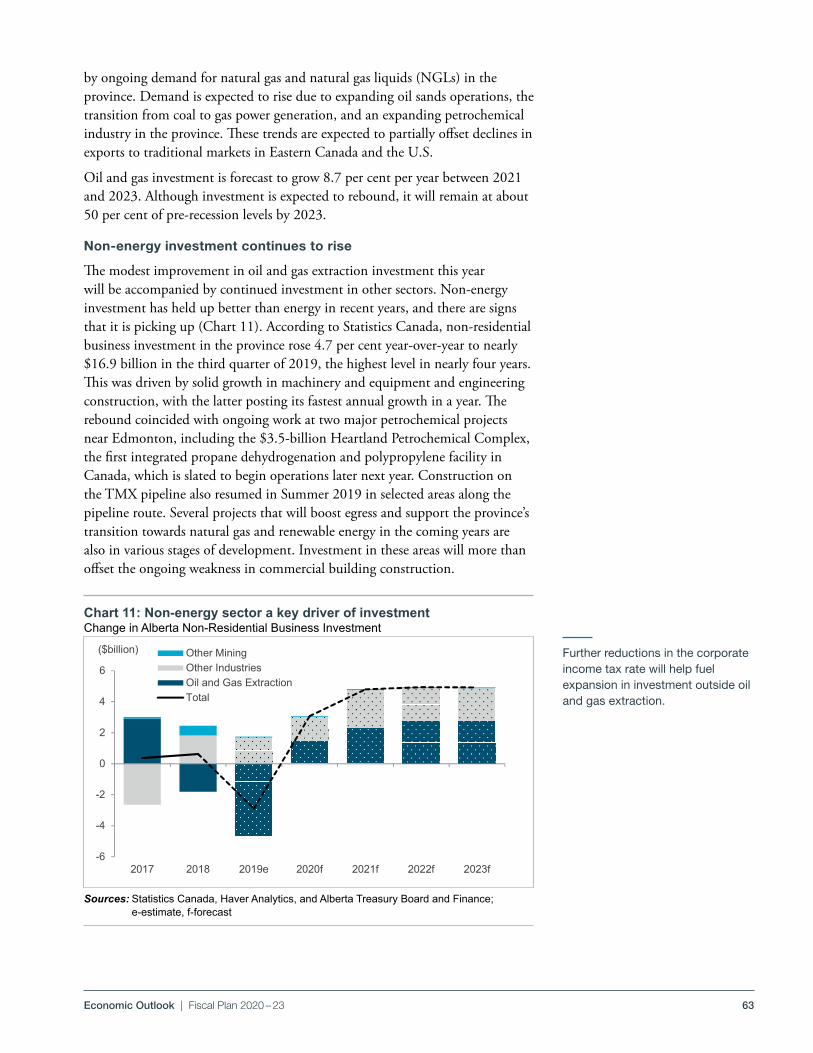
63Economic Outlook | Fiscal Plan 2020 – 23
by ongoing demand for natural gas and natural gas liquids (NGLs) in the province . Demand is expected to rise due to expanding oil sands operations, the transition from coal to gas power generation, and an expanding petrochemical industry in the province . These trends are expected to partially offset declines in exports to traditional markets in Eastern Canada and the U .S .
Oil and gas investment is forecast to grow 8 .7 per cent per year between 2021 and 2023 . Although investment is expected to rebound, it will remain at about 50 per cent of pre‑recession levels by 2023 .
Non‑energy investment continues to rise
The modest improvement in oil and gas extraction investment this year will be accompanied by continued investment in other sectors . Non‑energy investment has held up better than energy in recent years, and there are signs that it is picking up (Chart 11) . According to Statistics Canada, non‑residential business investment in the province rose 4 .7 per cent year‑over‑year to nearly $16 .9 billion in the third quarter of 2019, the highest level in nearly four years . This was driven by solid growth in machinery and equipment and engineering construction, with the latter posting its fastest annual growth in a year . The rebound coincided with ongoing work at two major petrochemical projects near Edmonton, including the $3 .5‑billion Heartland Petrochemical Complex, the first integrated propane dehydrogenation and polypropylene facility in Canada, which is slated to begin operations later next year . Construction on the TMX pipeline also resumed in Summer 2019 in selected areas along the pipeline route . Several projects that will boost egress and support the province’s transition towards natural gas and renewable energy in the coming years are also in various stages of development . Investment in these areas will more than offset the ongoing weakness in commercial building construction .
Sources: Statistics Canada, Haver Analytics, and Alberta Treasury Board and Finance; e‑estimate, f‑forecast
Chart 11: Non‑energy sector a key driver of investmentChange in Alberta Non‑Residential Business Investment
Further reductions in the corporate income tax rate will help fuel expansion in investment outside oil and gas extraction.
2020 BudgetEconomic Outlook
PDF Name: EO20_chrt_11.pdf
Non-energy sector a key driver of investmentChange in Alberta Non-Residential Business Investment
Sources: Statistics Canada, Haver Analytics and Alberta Treasury Board and Finance, e-estimate, f-forecast
EO20_chrt_11.pdf
-6
-4
-2
0
2
4
6
2017 2018 2019e 2020f 2021f 2022f 2023f
($billion) Other MiningOther IndustriesOil and Gas ExtractionTotal
Path: \\ter-fin-fs-01.fin.gov.ab.ca\Publications\_Economics_publications\Budget\5_Economic-Outlook_2020-21\SourceDocs\File: 6-16,1_Budget2020Charts-ALBERTATab: Chart 11 Nom Investment Last updated: 2020-02-13: 12:23 PM
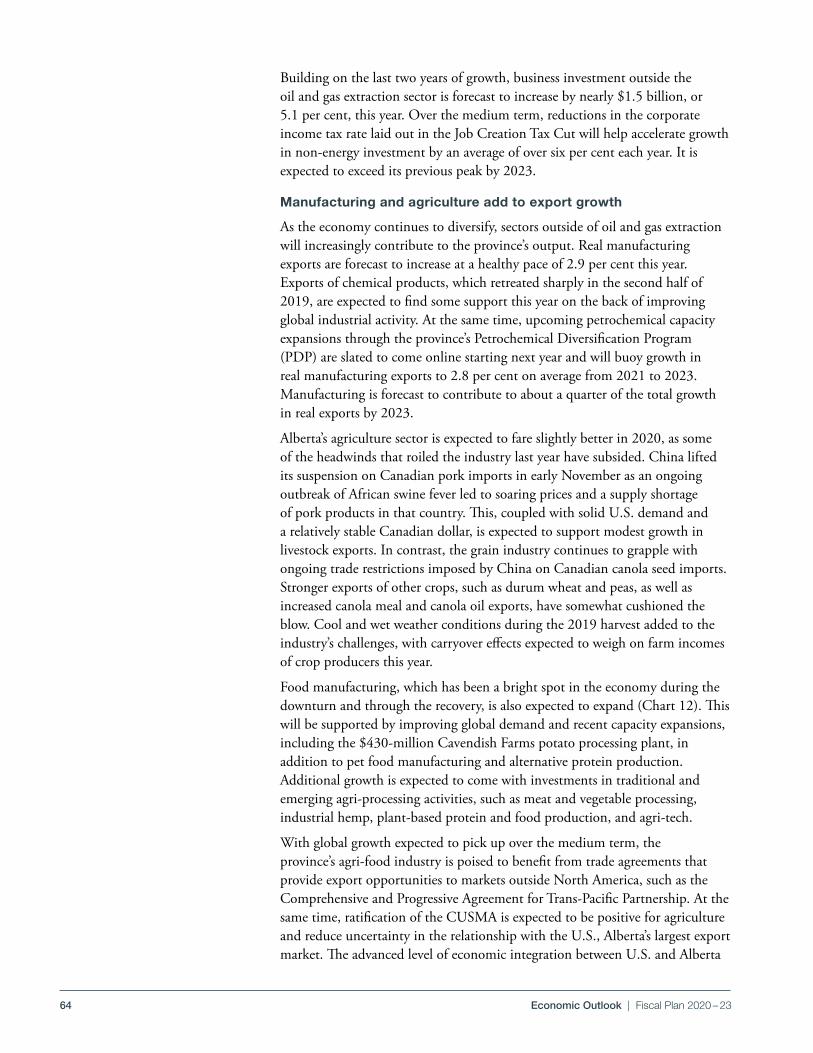
64 Economic Outlook | Fiscal Plan 2020 – 23
Building on the last two years of growth, business investment outside the oil and gas extraction sector is forecast to increase by nearly $1 .5 billion, or 5 .1 per cent, this year . Over the medium term, reductions in the corporate income tax rate laid out in the Job Creation Tax Cut will help accelerate growth in non‑energy investment by an average of over six per cent each year . It is expected to exceed its previous peak by 2023 .
Manufacturing and agriculture add to export growth
As the economy continues to diversify, sectors outside of oil and gas extraction will increasingly contribute to the province’s output . Real manufacturing exports are forecast to increase at a healthy pace of 2 .9 per cent this year . Exports of chemical products, which retreated sharply in the second half of 2019, are expected to find some support this year on the back of improving global industrial activity . At the same time, upcoming petrochemical capacity expansions through the province’s Petrochemical Diversification Program (PDP) are slated to come online starting next year and will buoy growth in real manufacturing exports to 2 .8 per cent on average from 2021 to 2023 . Manufacturing is forecast to contribute to about a quarter of the total growth in real exports by 2023 .
Alberta’s agriculture sector is expected to fare slightly better in 2020, as some of the headwinds that roiled the industry last year have subsided . China lifted its suspension on Canadian pork imports in early November as an ongoing outbreak of African swine fever led to soaring prices and a supply shortage of pork products in that country . This, coupled with solid U .S . demand and a relatively stable Canadian dollar, is expected to support modest growth in livestock exports . In contrast, the grain industry continues to grapple with ongoing trade restrictions imposed by China on Canadian canola seed imports . Stronger exports of other crops, such as durum wheat and peas, as well as increased canola meal and canola oil exports, have somewhat cushioned the blow . Cool and wet weather conditions during the 2019 harvest added to the industry’s challenges, with carryover effects expected to weigh on farm incomes of crop producers this year .
Food manufacturing, which has been a bright spot in the economy during the downturn and through the recovery, is also expected to expand (Chart 12) . This will be supported by improving global demand and recent capacity expansions, including the $430‑million Cavendish Farms potato processing plant, in addition to pet food manufacturing and alternative protein production . Additional growth is expected to come with investments in traditional and emerging agri‑processing activities, such as meat and vegetable processing, industrial hemp, plant‑based protein and food production, and agri‑tech .
With global growth expected to pick up over the medium term, the province’s agri‑food industry is poised to benefit from trade agreements that provide export opportunities to markets outside North America, such as the Comprehensive and Progressive Agreement for Trans‑Pacific Partnership . At the same time, ratification of the CUSMA is expected to be positive for agriculture and reduce uncertainty in the relationship with the U .S ., Alberta’s largest export market . The advanced level of economic integration between U .S . and Alberta
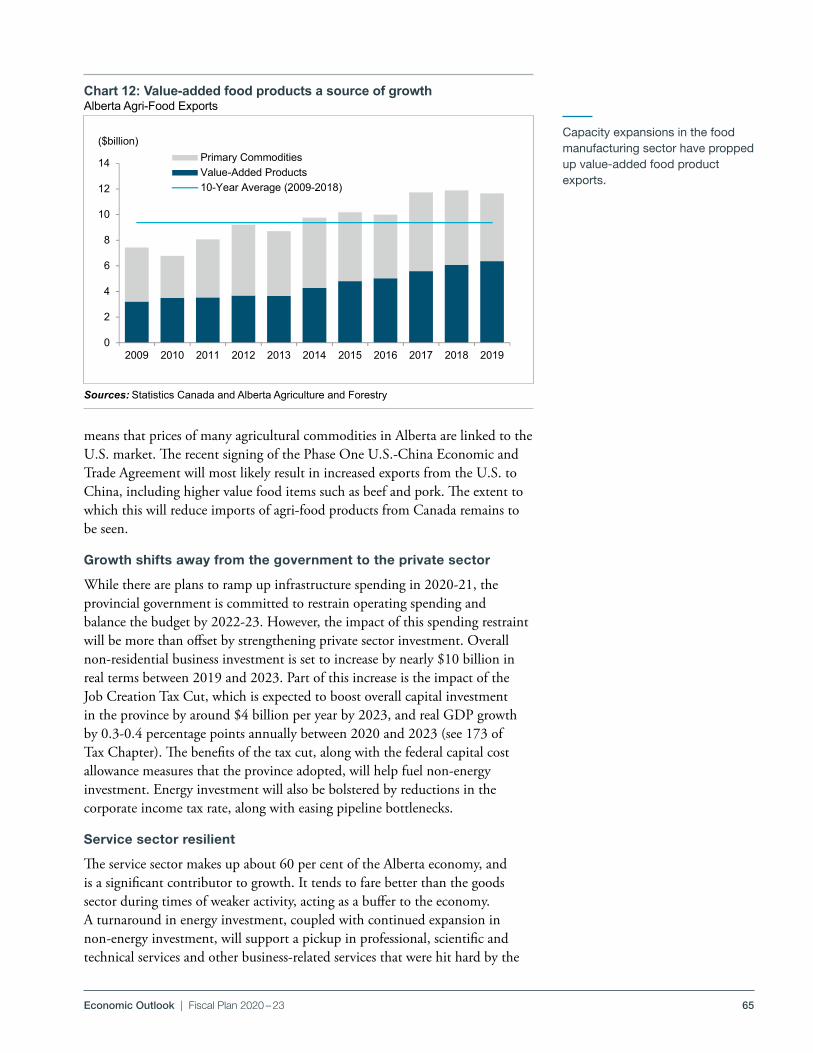
65Economic Outlook | Fiscal Plan 2020 – 23
means that prices of many agricultural commodities in Alberta are linked to the U .S . market . The recent signing of the Phase One U .S .‑China Economic and Trade Agreement will most likely result in increased exports from the U .S . to China, including higher value food items such as beef and pork . The extent to which this will reduce imports of agri‑food products from Canada remains to be seen .
Growth shifts away from the government to the private sector
While there are plans to ramp up infrastructure spending in 2020‑21, the provincial government is committed to restrain operating spending and balance the budget by 2022‑23 . However, the impact of this spending restraint will be more than offset by strengthening private sector investment . Overall non‑residential business investment is set to increase by nearly $10 billion in real terms between 2019 and 2023 . Part of this increase is the impact of the Job Creation Tax Cut, which is expected to boost overall capital investment in the province by around $4 billion per year by 2023, and real GDP growth by 0 .3‑0 .4 percentage points annually between 2020 and 2023 (see 173 of Tax Chapter) . The benefits of the tax cut, along with the federal capital cost allowance measures that the province adopted, will help fuel non‑energy investment . Energy investment will also be bolstered by reductions in the corporate income tax rate, along with easing pipeline bottlenecks .
Service sector resilient
The service sector makes up about 60 per cent of the Alberta economy, and is a significant contributor to growth . It tends to fare better than the goods sector during times of weaker activity, acting as a buffer to the economy . A turnaround in energy investment, coupled with continued expansion in non‑energy investment, will support a pickup in professional, scientific and technical services and other business‑related services that were hit hard by the
Chart 12: Value‑added food products a source of growthAlberta Agri‑Food Exports
Sources: Statistics Canada and Alberta Agriculture and Forestry
Capacity expansions in the food manufacturing sector have propped up value‑added food product exports.
2020 BudgetEconomic Outlook
PDF Name: EO20_chrt_12.pdf
Value-added food products a source of growthAlberta Agri-Foods Exports
Sources: Statistics Canada and Alberta Agriculture and Forestry
EO20_chrt_12.pdf
0
2
4
6
8
10
12
14
2009 2010 2011 2012 2013 2014 2015 2016 2017 2018 2019
($billion)Primary CommoditiesValue-Added Products10-Year Average (2009-2018)
Path: \\ter-fin-fs-01.fin.gov.ab.ca\Publications\_Economics_publications\Budget\5_Economic-Outlook_2020-21\SourceDocs\File: 6-16,1_Budget2020Charts-ALBERTATab: Chart 12 AgriFoods Last updated: 2020-02-18: 3:09 PM
66 Economic Outlook | Fiscal Plan 2020 – 23
oil price crash . Plans by TELUS to invest $16 billion in Alberta over the next five years to expand its broadband infrastructure and prepare the province for the introduction of 5G is also expected to boost information services in the province . A gradual recovery in the housing market will support activity in finance, insurance and real estate, and wholesale trade sectors . Meanwhile, consumer services will continue to benefit from a growing population and solid income growth .
Job prospects to improve
Employment opportunities are expected to increase in the province alongside the turnaround in business investment . Goods sector employment, which struggled in 2019, is expected to see some improvement as drilling and construction activity in the province ramps up . This, along with continued gains in the service sector, will buoy employment growth of 1 .4 per cent in 2020, up from 0 .5 per cent in 2019 (Chart 13) . Over the medium term, employment growth is expected to accelerate to 2 .1 per cent as strengthening business investment and household spending drive Alberta’s economic expansion .
Gradual decline in unemployment rate
With employment advancing this year, the unemployment rate is expected to edge down after moving higher at the end of 2019 . Unemployment among young workers (15‑24 age group), particularly males, jumped last year amid subdued drilling and construction activity . This is in contrast to prime‑aged workers (25‑54 age group), whose unemployment rate averaged below six per cent . This year, employment among young workers is expected to get
The labour market will strengthen gradually as a broad‑based
increase in economic activity fuels employment and lowers the
unemployment rate.
Sources: Statistics Canada, Haver Analytics and Alberta Treasury Board and Finance, f‑forecast
* The number of people working or looking for work.
Chart 13: Unemployment rate to ease graduallyLabour Market Indicators
2020 BudgetEconomic Outlook
PDF Name: EO20_chrt_13.pdf
Unemployment rate to ease graduallyLabour Market Indicators
Sources: Statistics Canada, Haver Analytics and Alberta Treasury Board and Finance; e-estimate, f-forecast*The number of people working or looking for work.
EO20_chrt_13.pdf
-2-10123456789(%)
Unemployment RateLabour Force* GrowthEmployment Growth
Path: \\ter-fin-fs-01.fin.gov.ab.ca\Publications\_Economics_publications\Budget\5_Economic-Outlook_2020-21\SourceDocs\File: 6-16,1_Budget2020Charts-ALBERTATab: Chart 13 LMI Last updated: 2020-02-18: 11:11 AM
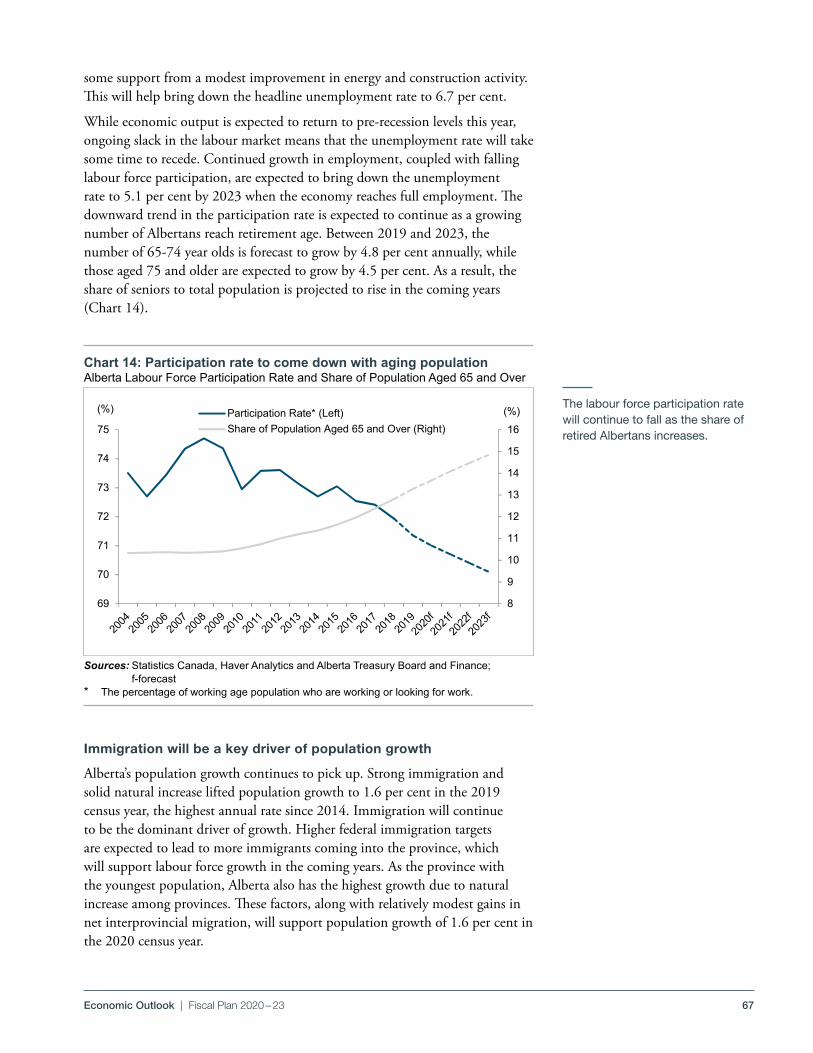
67Economic Outlook | Fiscal Plan 2020 – 23
some support from a modest improvement in energy and construction activity . This will help bring down the headline unemployment rate to 6 .7 per cent .
While economic output is expected to return to pre‑recession levels this year, ongoing slack in the labour market means that the unemployment rate will take some time to recede . Continued growth in employment, coupled with falling labour force participation, are expected to bring down the unemployment rate to 5 .1 per cent by 2023 when the economy reaches full employment . The downward trend in the participation rate is expected to continue as a growing number of Albertans reach retirement age . Between 2019 and 2023, the number of 65‑74 year olds is forecast to grow by 4 .8 per cent annually, while those aged 75 and older are expected to grow by 4 .5 per cent . As a result, the share of seniors to total population is projected to rise in the coming years (Chart 14) .
Immigration will be a key driver of population growth
Alberta’s population growth continues to pick up . Strong immigration and solid natural increase lifted population growth to 1 .6 per cent in the 2019 census year, the highest annual rate since 2014 . Immigration will continue to be the dominant driver of growth . Higher federal immigration targets are expected to lead to more immigrants coming into the province, which will support labour force growth in the coming years . As the province with the youngest population, Alberta also has the highest growth due to natural increase among provinces . These factors, along with relatively modest gains in net interprovincial migration, will support population growth of 1 .6 per cent in the 2020 census year .
The labour force participation rate will continue to fall as the share of retired Albertans increases.
Sources: Statistics Canada, Haver Analytics and Alberta Treasury Board and Finance; f‑forecast
* The percentage of working age population who are working or looking for work.
Chart 14: Participation rate to come down with aging populationAlberta Labour Force Participation Rate and Share of Population Aged 65 and Over
2020 BudgetEconomic Outlook
PDF Name: EO20_chrt_14.pdf
Participation rate to come down with an aging population
Alberta Labour Force Participation Rate and Share of Population Aged 65 and Over
Sources: Statistics Canada, Haver Analytics and Alberta Treasury Board and Finance, f-forecast* The percentage of working age population who are not in the labour force.EO20_chrt_14.pdf
8
9
10
11
12
13
14
15
16
69
70
71
72
73
74
75(%)(%) Participation Rate* (Left)
Share of Population Aged 65 and Over (Right)
Path: \\ter-fin-fs-01.fin.gov.ab.ca\Publications\_Economics_publications\Budget\5_Economic-Outlook_2020-21\SourceDocs\File: 6-16,1_Budget2020Charts-ALBERTATab: Chart 14 Part Rate Last updated: 2020-02-18: 11:11 AM
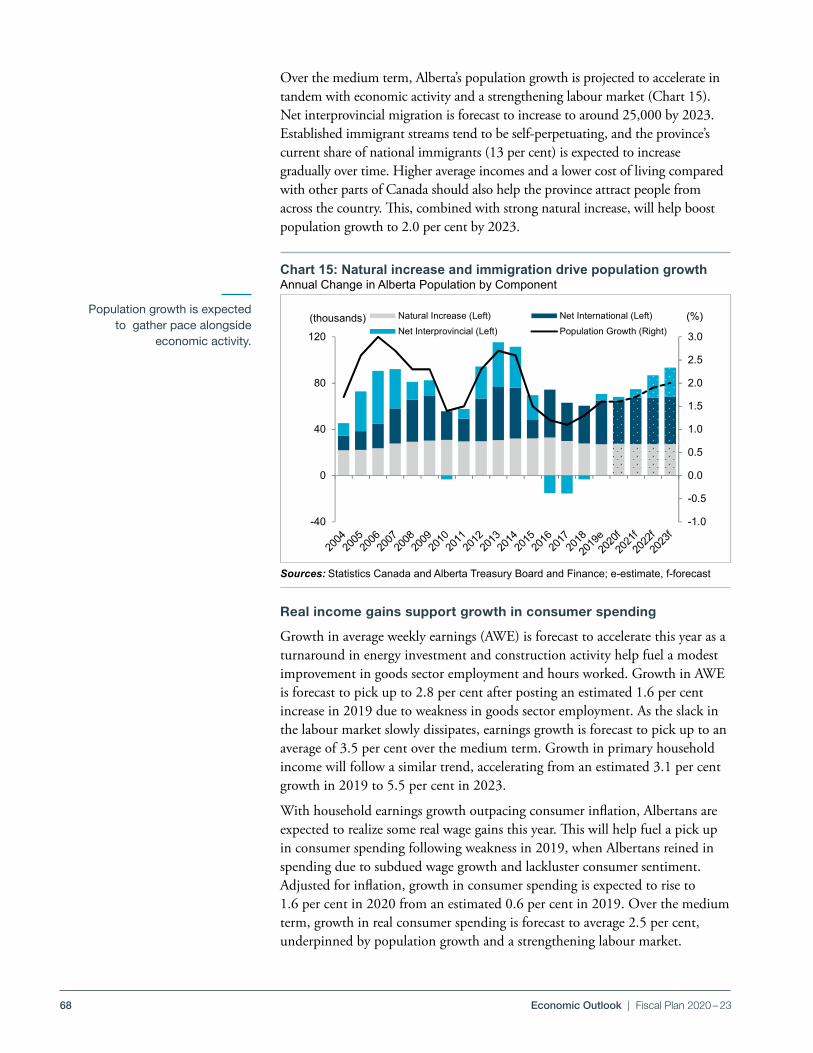
68 Economic Outlook | Fiscal Plan 2020 – 23
Over the medium term, Alberta’s population growth is projected to accelerate in tandem with economic activity and a strengthening labour market (Chart 15) . Net interprovincial migration is forecast to increase to around 25,000 by 2023 . Established immigrant streams tend to be self‑perpetuating, and the province’s current share of national immigrants (13 per cent) is expected to increase gradually over time . Higher average incomes and a lower cost of living compared with other parts of Canada should also help the province attract people from across the country . This, combined with strong natural increase, will help boost population growth to 2 .0 per cent by 2023 .
Real income gains support growth in consumer spending
Growth in average weekly earnings (AWE) is forecast to accelerate this year as a turnaround in energy investment and construction activity help fuel a modest improvement in goods sector employment and hours worked . Growth in AWE is forecast to pick up to 2 .8 per cent after posting an estimated 1 .6 per cent increase in 2019 due to weakness in goods sector employment . As the slack in the labour market slowly dissipates, earnings growth is forecast to pick up to an average of 3 .5 per cent over the medium term . Growth in primary household income will follow a similar trend, accelerating from an estimated 3 .1 per cent growth in 2019 to 5 .5 per cent in 2023 .
With household earnings growth outpacing consumer inflation, Albertans are expected to realize some real wage gains this year . This will help fuel a pick up in consumer spending following weakness in 2019, when Albertans reined in spending due to subdued wage growth and lackluster consumer sentiment . Adjusted for inflation, growth in consumer spending is expected to rise to 1 .6 per cent in 2020 from an estimated 0 .6 per cent in 2019 . Over the medium term, growth in real consumer spending is forecast to average 2 .5 per cent, underpinned by population growth and a strengthening labour market .
Population growth is expected to gather pace alongside
economic activity.
Chart 15: Natural increase and immigration drive population growthAnnual Change in Alberta Population by Component
Sources: Statistics Canada and Alberta Treasury Board and Finance; e‑estimate, f‑forecast
2020 BudgetEconomic Outlook
PDF Name: EO20_chrt_15.pdf
Natural increase and immigration drive population growthAnnual Change in the Alberta Population by Component
Sources: Statistics Canada, Haver Analytics and Alberta Treasury Board and Finance; e-estimate, f-forecast
EO20_chrt_15.pdf
-1.0
-0.5
0.0
0.5
1.0
1.5
2.0
2.5
3.0
-40
0
40
80
120
(%)(thousands) Natural Increase (Left) Net International (Left)Net Interprovincial (Left) Population Growth (Right)
Path: S:\TBF\MinShare\PublnsProd\CorpFin\OBM.PUBLNS-2020-21\B20_Fiscal-Plan_vol\13_WEB-FINALS\updates to WEB Version\File: revised Chart 15_popTab: Chart 15 C2G_Pop Last updated: 2/26/2020: 8:54 AM
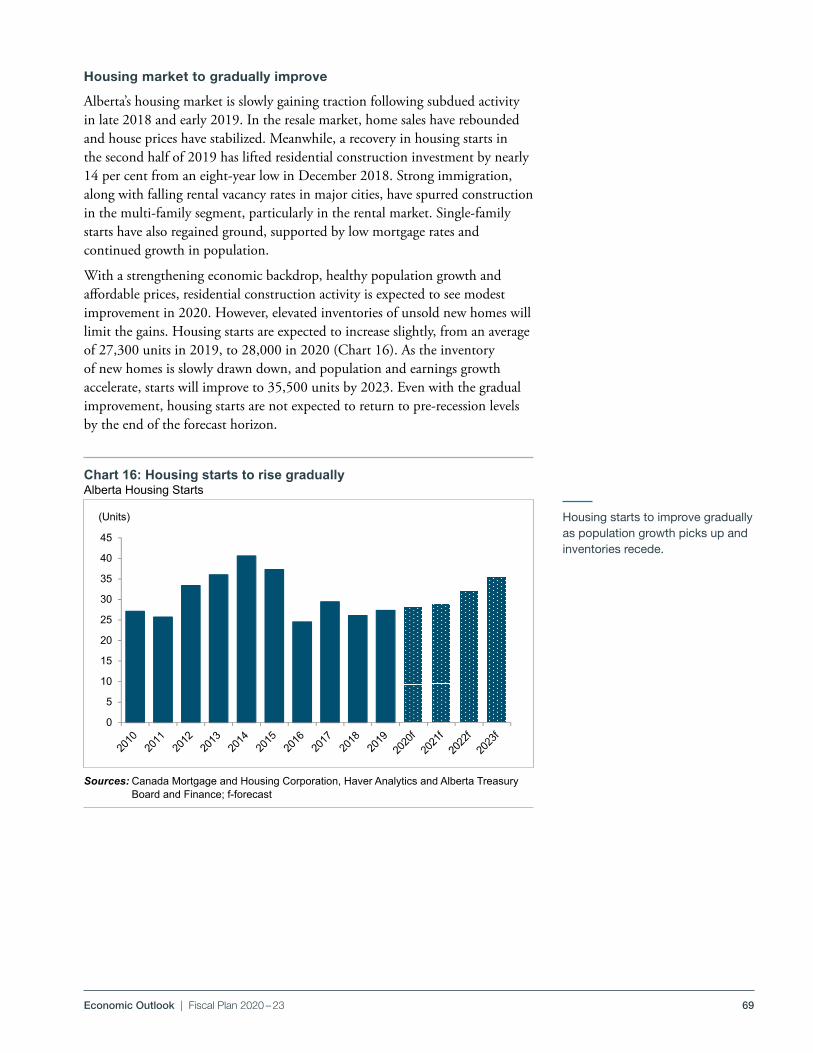
69Economic Outlook | Fiscal Plan 2020 – 23
Housing market to gradually improve
Alberta’s housing market is slowly gaining traction following subdued activity in late 2018 and early 2019 . In the resale market, home sales have rebounded and house prices have stabilized . Meanwhile, a recovery in housing starts in the second half of 2019 has lifted residential construction investment by nearly 14 per cent from an eight‑year low in December 2018 . Strong immigration, along with falling rental vacancy rates in major cities, have spurred construction in the multi‑family segment, particularly in the rental market . Single‑family starts have also regained ground, supported by low mortgage rates and continued growth in population .
With a strengthening economic backdrop, healthy population growth and affordable prices, residential construction activity is expected to see modest improvement in 2020 . However, elevated inventories of unsold new homes will limit the gains . Housing starts are expected to increase slightly, from an average of 27,300 units in 2019, to 28,000 in 2020 (Chart 16) . As the inventory of new homes is slowly drawn down, and population and earnings growth accelerate, starts will improve to 35,500 units by 2023 . Even with the gradual improvement, housing starts are not expected to return to pre‑recession levels by the end of the forecast horizon .
Chart 16: Housing starts to rise graduallyAlberta Housing Starts
Sources: Canada Mortgage and Housing Corporation, Haver Analytics and Alberta Treasury Board and Finance; f‑forecast
Housing starts to improve gradually as population growth picks up and inventories recede.
2020 BudgetEconomic Outlook
PDF Name: EO20_chrt_16.pdf
Housing starts to rise graduallyAlberta Housing Starts by Type
Source: Canada Mortgage and Housing Corporation, Haver Analytics and Alberta Treasury Board and Finance; f-forecast
EO20_chrt_16.pdf
0
5
10
15
20
25
30
35
40
45
(Units)
Path: \\ter-fin-fs-01.fin.gov.ab.ca\Publications\_Economics_publications\Budget\5_Economic-Outlook_2020-21\SourceDocs\File: 6-16,1_Budget2020Charts-ALBERTATab: Chart 16 Housing Last updated: 2020-02-10: 2:56 PM
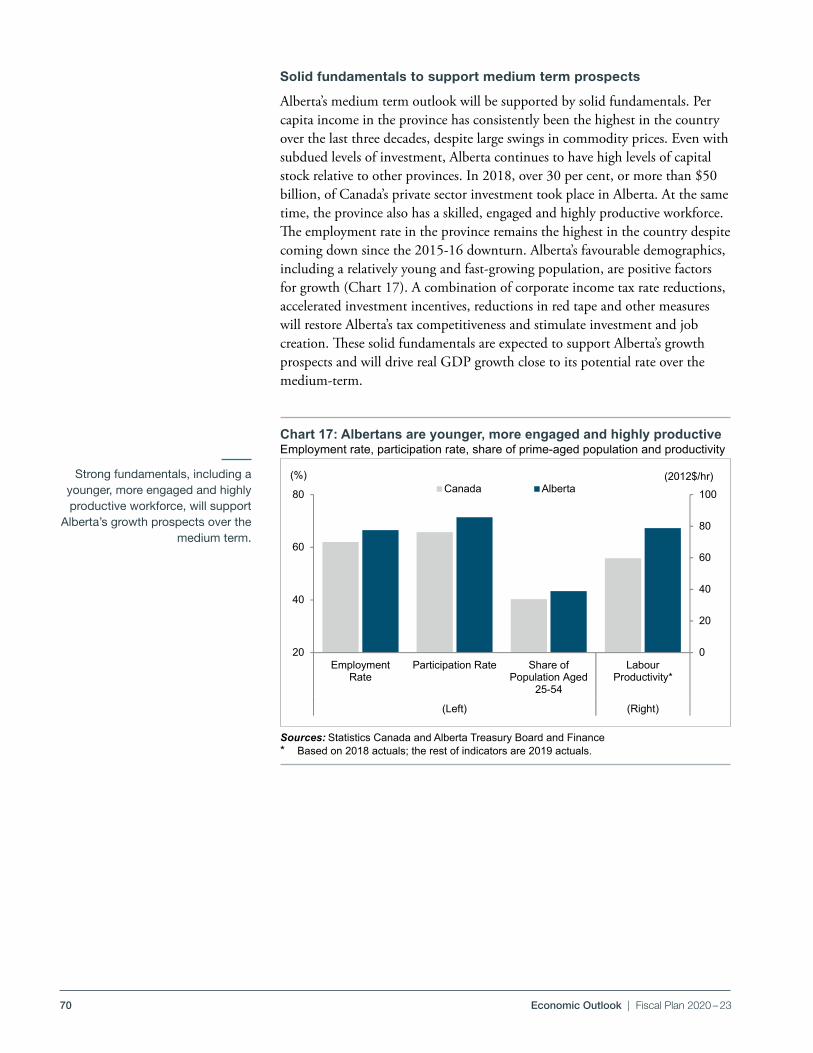
70 Economic Outlook | Fiscal Plan 2020 – 23
Strong fundamentals, including a younger, more engaged and highly productive workforce, will support
Alberta’s growth prospects over the medium term.
Solid fundamentals to support medium term prospects
Alberta’s medium term outlook will be supported by solid fundamentals . Per capita income in the province has consistently been the highest in the country over the last three decades, despite large swings in commodity prices . Even with subdued levels of investment, Alberta continues to have high levels of capital stock relative to other provinces . In 2018, over 30 per cent, or more than $50 billion, of Canada’s private sector investment took place in Alberta . At the same time, the province also has a skilled, engaged and highly productive workforce . The employment rate in the province remains the highest in the country despite coming down since the 2015‑16 downturn . Alberta’s favourable demographics, including a relatively young and fast‑growing population, are positive factors for growth (Chart 17) . A combination of corporate income tax rate reductions, accelerated investment incentives, reductions in red tape and other measures will restore Alberta’s tax competitiveness and stimulate investment and job creation . These solid fundamentals are expected to support Alberta’s growth prospects and will drive real GDP growth close to its potential rate over the medium‑term .
Chart 17: Albertans are younger, more engaged and highly productiveEmployment rate, participation rate, share of prime‑aged population and productivity
Sources: Statistics Canada and Alberta Treasury Board and Finance * Based on 2018 actuals; the rest of indicators are 2019 actuals.
2020 BudgetEconomic Outlook
PDF Name: EO20_chrt_17.pdf
Albertans are younger, more engaged and more productiveEmployment rate, participation rate, share of prime aged workers and productivity
Source: Statistics Canada* based on 2018 actuals; the rest are 2019 actuals.
EO20_chrt_17.pdf
0
20
40
60
80
100
20
40
60
80
EmploymentRate
Participation Rate Share ofPopulation Aged
25-54
LabourProductivity*
(Left) (Right)
(2012$/hr)(%)Canada Alberta
Path: \\ter-fin-fs-01.fin.gov.ab.ca\Publications\_Economics_publications\Budget\5_Economic-Outlook_2020-21\SourceDocs\File: 6-16,1_Budget2020Charts-ALBERTATab: Chart 17 Fundamentals Last updated: 2020-02-13: 12:26 PM
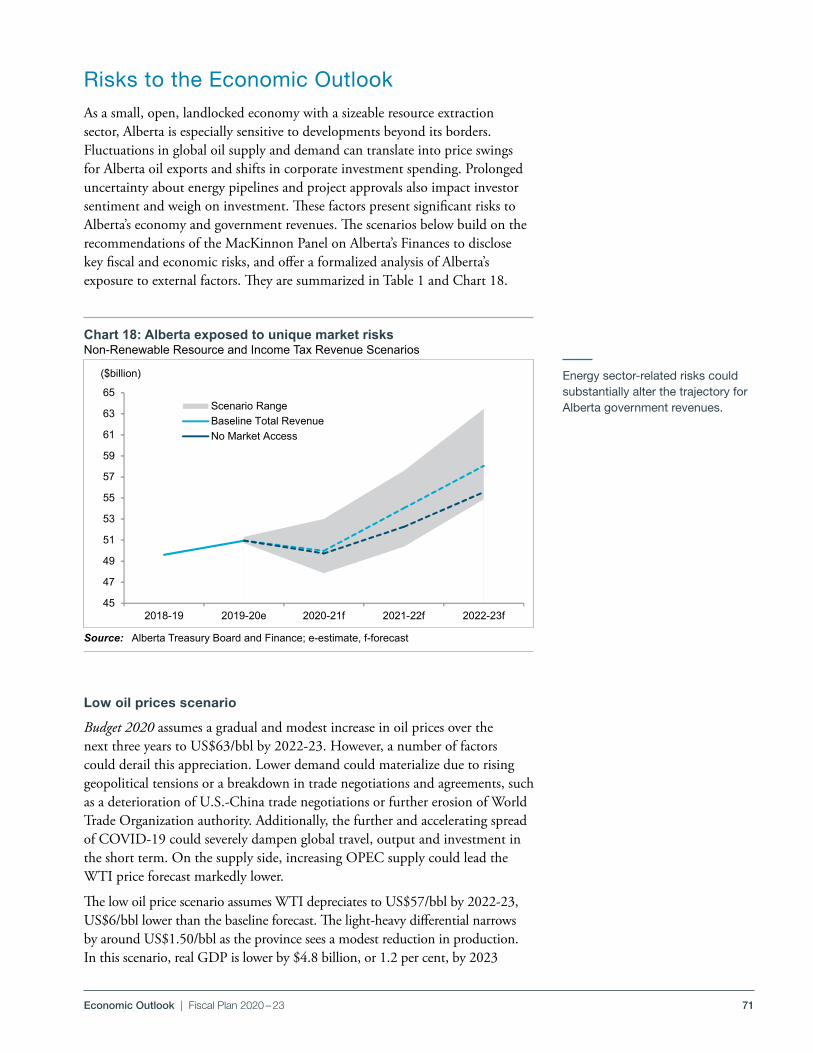
71Economic Outlook | Fiscal Plan 2020 – 23
Risks to the Economic OutlookAs a small, open, landlocked economy with a sizeable resource extraction sector, Alberta is especially sensitive to developments beyond its borders . Fluctuations in global oil supply and demand can translate into price swings for Alberta oil exports and shifts in corporate investment spending . Prolonged uncertainty about energy pipelines and project approvals also impact investor sentiment and weigh on investment . These factors present significant risks to Alberta’s economy and government revenues . The scenarios below build on the recommendations of the MacKinnon Panel on Alberta’s Finances to disclose key fiscal and economic risks, and offer a formalized analysis of Alberta’s exposure to external factors . They are summarized in Table 1 and Chart 18 .
Low oil prices scenario
Budget 2020 assumes a gradual and modest increase in oil prices over the next three years to US$63/bbl by 2022‑23 . However, a number of factors could derail this appreciation . Lower demand could materialize due to rising geopolitical tensions or a breakdown in trade negotiations and agreements, such as a deterioration of U .S .‑China trade negotiations or further erosion of World Trade Organization authority . Additionally, the further and accelerating spread of COVID‑19 could severely dampen global travel, output and investment in the short term . On the supply side, increasing OPEC supply could lead the WTI price forecast markedly lower .
The low oil price scenario assumes WTI depreciates to US$57/bbl by 2022‑23, US$6/bbl lower than the baseline forecast . The light‑heavy differential narrows by around US$1 .50/bbl as the province sees a modest reduction in production . In this scenario, real GDP is lower by $4 .8 billion, or 1 .2 per cent, by 2023
Chart 18: Alberta exposed to unique market risksNon‑Renewable Resource and Income Tax Revenue Scenarios
Source: Alberta Treasury Board and Finance; e‑estimate, f‑forecast
Energy sector‑related risks could substantially alter the trajectory for Alberta government revenues.
2019 BudgetEconomic Outlook
PDF Name: EO20_chrt_18.pdf
Alberta exposed to unique market access riskRisk Exposure of Alberta Revenues
Source: Alberta Treasury Board and Finance
EO20_chrt_18.pdf
45
47
49
51
53
55
57
59
61
63
65
2018-19 2019-20e 2020-21f 2021-22f 2022-23f
($billion)
Scenario RangeBaseline Total RevenueNo Market Access
Path: \\ter-fin-fs-01.fin.gov.ab.ca\Publications\_Economics_publications\Budget\5_Economic-Outlook_2020-21\SourceDocs\File: 6-16,1_Budget2020Charts-ALBERTATab: Chart 18 Total Rev Scenarios Last updated: 2020-02-18: 3:08 PM
72 Economic Outlook | Fiscal Plan 2020 – 23
compared with the base case . Employment is 20,000 or 0 .8 per cent lower by 2023 . The exchange rate weakens on lower crude prices and exports, and the Bank of Canada gradually decreases interest rates as economic activity is negatively impacted across the country .
No market access scenario
The impact of pipeline bottlenecks and greater reliance on rail are becoming increasingly tangible to expansion prospects in the province’s oil sector . While progress is being made on the regulatory front with all three pipeline projects, they continue to face regulatory hurdles . Enbridge’s Line 3 is expected to offer the first sign of relief in 2021, followed by TMX and Keystone XL . Combined, these three pipelines will add over 1 .5 million barrels per day of export capacity by 2023 .
The no market access scenario assumes all three pipeline projects do not get completed . Without sufficient pipeline access, the light‑heavy differential remains above US$20/bbl, reflecting higher rail costs and some additional rail capacity and infrastructure, which will be required . Further, growth potential to the U .S . West Coast and Asian markets is limited without the TMX pipeline .
Under this scenario, production is expected to be more than 60,000 bpd lower by 2023, and over 250,000 by 2026, compared with the baseline . This drags down investment and employment . Real GDP is estimated to be nearly $10 .4 billion, or 2 .7 per cent, lower by 2023 . Employment is 50,000, or 2 .0 per cent lower, relative to the base case by 2023 . Lost resource revenues and income taxes are estimated at $4 .5 billion between 2020‑21 and 2022‑23 .
High oil prices scenario
While there are downside risks to the forecast for benchmark energy prices and the energy sector in general, there are also potential upsides . A variety of developments could lift WTI prices forecast markedly higher . On the demand side, price appreciation could arise from easing of trade and geopolitical risks and stronger global growth . On the supply side, prices could be driven higher by an escalation of tensions in the Middle East or a sharp slowdown in U .S . shale oil production, which reduce supplies . This will positively affect the value of Alberta exports .
The high oil price scenario assumes WTI appreciates to about US$77/bbl by 2022‑23, about US$14/bbl higher than the baseline forecast . The light‑heavy differential widens by just over US$3/bbl as the province sees a rise in investment and production . This leads real GDP almost $11 .3 billion, or 2 .9 per cent, higher by 2023 compared with the base case . Employment is nearly 51,000, or 2 .0 per cent, higher by 2023 . The exchange rate strengthens on higher crude prices and exports, and the Bank of Canada gradually increases interest rates .
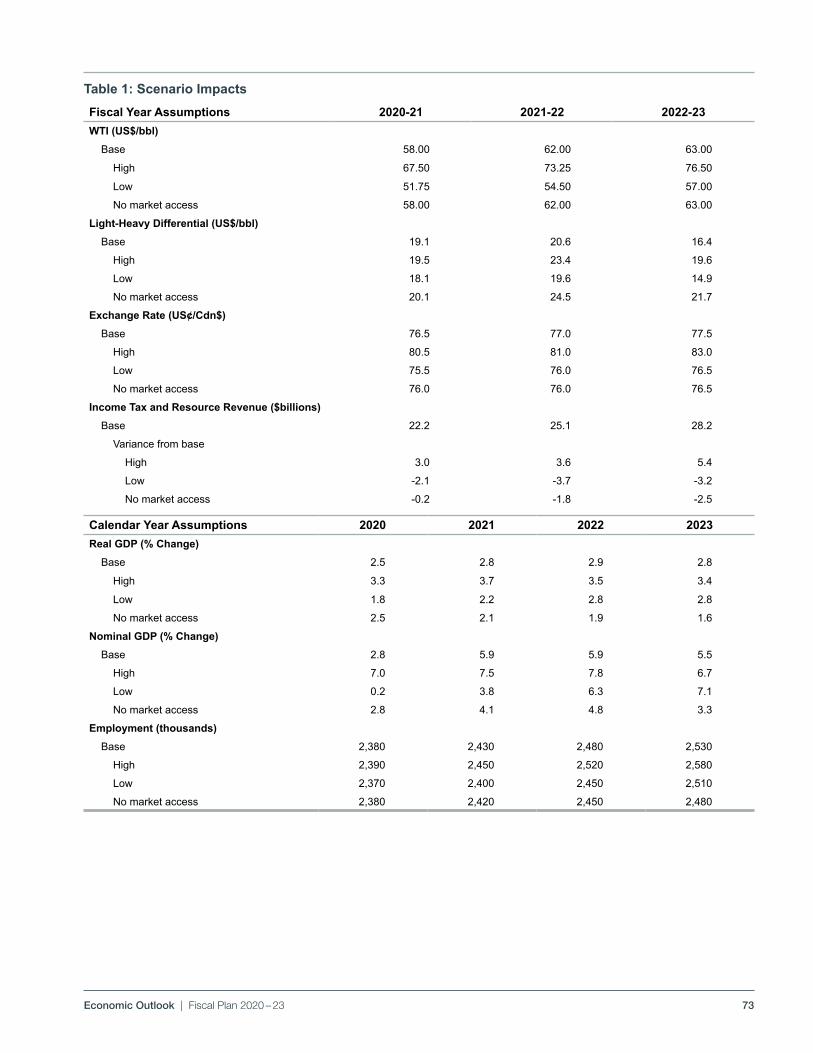
73Economic Outlook | Fiscal Plan 2020 – 23
Fiscal Year Assumptions 2020‑21 2021‑22 2022‑23WTI (US$/bbl)
Base 58.00 62.00 63.00
High 67.50 73.25 76.50
Low 51.75 54.50 57.00
No market access 58.00 62.00 63.00
Light‑Heavy Differential (US$/bbl)Base 19.1 20.6 16.4
High 19.5 23.4 19.6
Low 18.1 19.6 14.9
No market access 20.1 24.5 21.7
Exchange Rate (US¢/Cdn$)Base 76.5 77.0 77.5
High 80.5 81.0 83.0
Low 75.5 76.0 76.5
No market access 76.0 76.0 76.5
Income Tax and Resource Revenue ($billions)Base 22.2 25.1 28.2
Variance from base
High 3.0 3.6 5.4
Low ‑2.1 ‑3.7 ‑3.2
No market access ‑0.2 ‑1.8 ‑2.5
Calendar Year Assumptions 2020 2021 2022 2023Real GDP (% Change)
Base 2.5 2.8 2.9 2.8
High 3.3 3.7 3.5 3.4
Low 1.8 2.2 2.8 2.8
No market access 2.5 2.1 1.9 1.6
Nominal GDP (% Change)Base 2.8 5.9 5.9 5.5
High 7.0 7.5 7.8 6.7
Low 0.2 3.8 6.3 7.1
No market access 2.8 4.1 4.8 3.3
Employment (thousands)Base 2,380 2,430 2,480 2,530
High 2,390 2,450 2,520 2,580
Low 2,370 2,400 2,450 2,510
No market access 2,380 2,420 2,450 2,480
Table 1: Scenario Impacts

BLANK PAGE
74
AnnexEconomic Outlook
75

76 Economic Outlook | Fiscal Plan 2020 – 23
Benchmarking Tables
The Government of Alberta underestimated the WTI oil price by 0.1% while the private sector
overestimated the WTI oil price for 2019, by 3.5%.
IncludesforecastsfinalizedonorbeforeJanuary17,2020.
a TheGovernmentofAlbertasurveys,onaconfidentialbasis,privatesectorforecastsfromPIRA,theBankofMontreal,IHSMarkit,StratasAdvisors,andWoodMackenzie.Theannualfigurespresentedhereareanaverageoftheforecastpricesfromthesesources. High/Lowforecastsmayrepresentoneoftheconfidentialforecasts.Theprivatesectoraverage,consultantaverageandGovernmentofAlberta forecasts have been rounded to the nearest dollar.
How Oil Price Forecasters Fared in Budget 2019
West Texas Intermediate (US$/bbl)
Sources: Alberta Treasury Board and Finance and Alberta Energy
Oil Price BenchmarkWest Texas Intermediate (US$/bbl)
Organization 2020 2021 2022 2023National Forecasting Agencies
Conference Board of Canada (Dec/19) 58.69 61.39 64.09 66.79
Stokes Economics (Jan/20) 57.50 60.13 64.24 69.56
Banks and Investment DealersCIBC World Markets (Oct/19) 60.50 59.50 n/a n/a
Credit Suisse (Nov/19) 55.00 55.00 55.00 n/a
Deloittte (Dec/19) 58.00 61.20 65.55 66.85
Goldman Sachs (Jan/20) 58.50 54.50 54.50 n/a
Laurentian Bank (Jan/20) 62.50 60.00 n/a n/a
National Bank (Jan/20) 58.00 60.00 n/a n/a
RBC Capital Markets (Jan/20) 59.32 59.32 60.00 60.00
Scotiabank (Jan/20) 59.00 64.00 n/a n/a
TD Bank (Dec/19) 57.00 59.75 n/a n/a
Industry AnalystsU.S. Energy Information Administration (Jan/20) 59.25 62.03 n/a n/a
GLJ Petroleum Consultants (Jan/20) 61.00 63.00 66.00 68.00
Sproule Associates Limited (Dec/19) 61.00 65.00 67.00 68.34
Confidential Forecasts Provided to the Government of Albertaa
Average 57.00 55.00 59.00 62.00
High 62.50 65.00 67.00 72.33
Low 53.86 50.98 52.44 53.50
Average of All Private Forecasts 58.00 59.00 61.00 64.00
Government of Alberta (calendar year) 58.00 62.00 63.00 64.00
Organization (#) How did they do in Budget 2019?National Forecasting Agencies (2) 57.77
Banks and Investment Dealers (8) 59.53
Industry Analysts (3) 58.51
ConfidentialForecasts(5) 57.00
Average 59.00Government of Alberta (calendar year) 57.002019 Actual 57.03
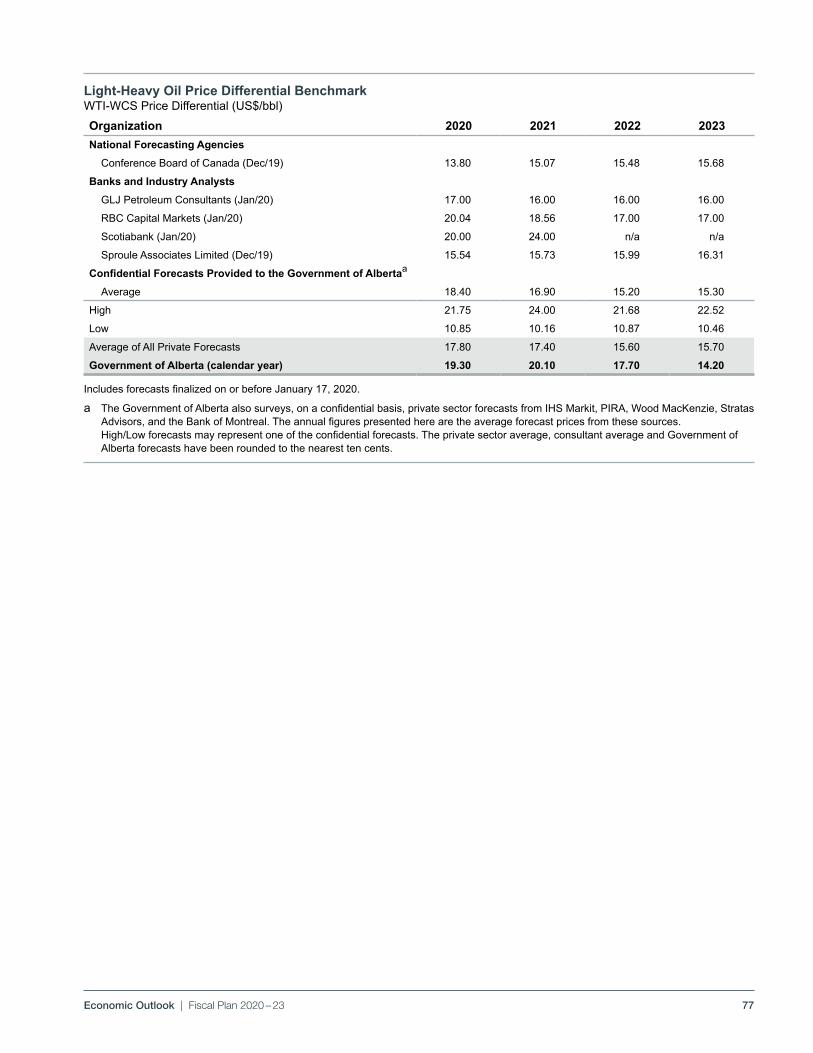
77Economic Outlook | Fiscal Plan 2020 – 23
Light‑Heavy Oil Price Differential BenchmarkWTI‑WCS Price Differential (US$/bbl)
IncludesforecastsfinalizedonorbeforeJanuary17,2020.
a TheGovernmentofAlbertaalsosurveys,onaconfidentialbasis,privatesectorforecastsfromIHSMarkit,PIRA,WoodMacKenzie,StratasAdvisors,andtheBankofMontreal.Theannualfigurespresentedherearetheaverageforecastpricesfromthesesources. High/Lowforecastsmayrepresentoneoftheconfidentialforecasts.Theprivatesectoraverage,consultantaverageandGovernmentofAlberta forecasts have been rounded to the nearest ten cents.
Organization 2020 2021 2022 2023National Forecasting Agencies
Conference Board of Canada (Dec/19) 13.80 15.07 15.48 15.68
Banks and Industry AnalystsGLJ Petroleum Consultants (Jan/20) 17.00 16.00 16.00 16.00
RBC Capital Markets (Jan/20) 20.04 18.56 17.00 17.00
Scotiabank (Jan/20) 20.00 24.00 n/a n/a
Sproule Associates Limited (Dec/19) 15.54 15.73 15.99 16.31
Confidential Forecasts Provided to the Government of Albertaa
Average 18.40 16.90 15.20 15.30
High 21.75 24.00 21.68 22.52
Low 10.85 10.16 10.87 10.46
Average of All Private Forecasts 17.80 17.40 15.60 15.70
Government of Alberta (calendar year) 19.30 20.10 17.70 14.20
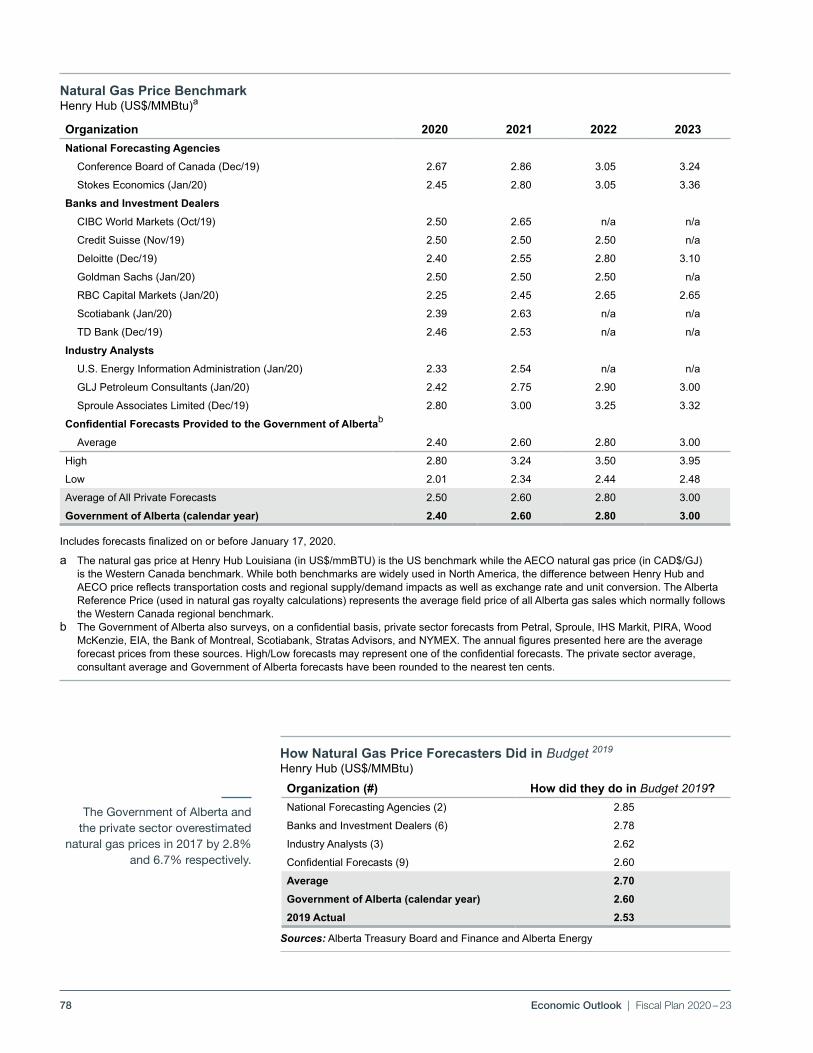
78 Economic Outlook | Fiscal Plan 2020 – 23
The Government of Alberta and the private sector overestimated
natural gas prices in 2017 by 2.8% and 6.7% respectively.
How Natural Gas Price Forecasters Did in Budget 2019
Henry Hub (US$/MMBtu)
Sources: Alberta Treasury Board and Finance and Alberta Energy
IncludesforecastsfinalizedonorbeforeJanuary17,2020.
a The natural gas price at Henry Hub Louisiana (in US$/mmBTU) is the US benchmark while the AECO natural gas price (in CAD$/GJ) is the Western Canada benchmark. While both benchmarks are widely used in North America, the difference between Henry Hub and AECOpricereflectstransportationcostsandregionalsupply/demandimpactsaswellasexchangerateandunitconversion.TheAlbertaReferencePrice(usedinnaturalgasroyaltycalculations)representstheaveragefieldpriceofallAlbertagassaleswhichnormallyfollowsthe Western Canada regional benchmark.
b TheGovernmentofAlbertaalsosurveys,onaconfidentialbasis,privatesectorforecastsfromPetral,Sproule,IHSMarkit,PIRA,WoodMcKenzie,EIA,theBankofMontreal,Scotiabank,StratasAdvisors,andNYMEX.Theannualfigurespresentedherearetheaverageforecastpricesfromthesesources.High/Lowforecastsmayrepresentoneoftheconfidentialforecasts.Theprivatesectoraverage,consultant average and Government of Alberta forecasts have been rounded to the nearest ten cents.
Organization 2020 2021 2022 2023National Forecasting Agencies
Conference Board of Canada (Dec/19) 2.67 2.86 3.05 3.24
Stokes Economics (Jan/20) 2.45 2.80 3.05 3.36
Banks and Investment DealersCIBC World Markets (Oct/19) 2.50 2.65 n/a n/a
Credit Suisse (Nov/19) 2.50 2.50 2.50 n/a
Deloitte (Dec/19) 2.40 2.55 2.80 3.10
Goldman Sachs (Jan/20) 2.50 2.50 2.50 n/a
RBC Capital Markets (Jan/20) 2.25 2.45 2.65 2.65
Scotiabank (Jan/20) 2.39 2.63 n/a n/a
TD Bank (Dec/19) 2.46 2.53 n/a n/a
Industry AnalystsU.S. Energy Information Administration (Jan/20) 2.33 2.54 n/a n/a
GLJ Petroleum Consultants (Jan/20) 2.42 2.75 2.90 3.00
Sproule Associates Limited (Dec/19) 2.80 3.00 3.25 3.32
Confidential Forecasts Provided to the Government of Albertab
Average 2.40 2.60 2.80 3.00
High 2.80 3.24 3.50 3.95
Low 2.01 2.34 2.44 2.48
Average of All Private Forecasts 2.50 2.60 2.80 3.00
Government of Alberta (calendar year) 2.40 2.60 2.80 3.00
Natural Gas Price BenchmarkHenry Hub (US$/MMBtu)a
Organization (#) How did they do in Budget 2019?National Forecasting Agencies (2) 2.85
Banks and Investment Dealers (6) 2.78
Industry Analysts (3) 2.62
ConfidentialForecasts(9) 2.60
Average 2.70Government of Alberta (calendar year) 2.602019 Actual 2.53
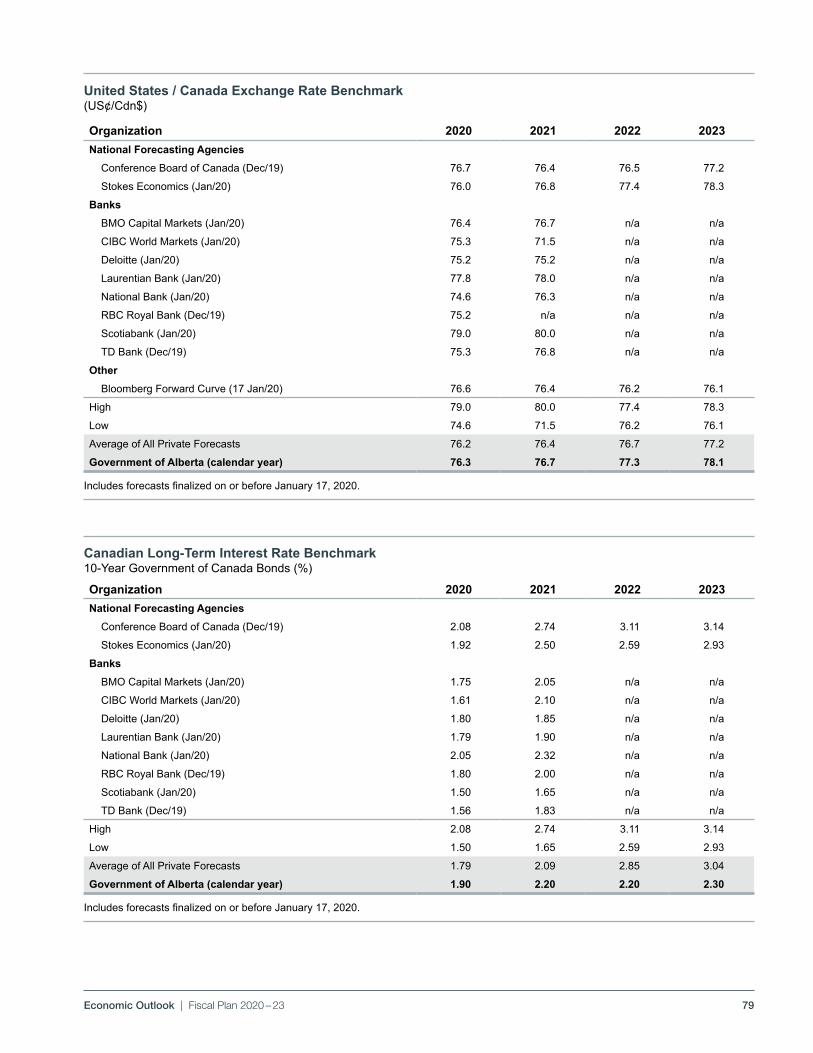
79Economic Outlook | Fiscal Plan 2020 – 23
Organization 2020 2021 2022 2023National Forecasting Agencies
Conference Board of Canada (Dec/19) 2.08 2.74 3.11 3.14
Stokes Economics (Jan/20) 1.92 2.50 2.59 2.93
BanksBMO Capital Markets (Jan/20) 1.75 2.05 n/a n/a
CIBC World Markets (Jan/20) 1.61 2.10 n/a n/a
Deloitte (Jan/20) 1.80 1.85 n/a n/a
Laurentian Bank (Jan/20) 1.79 1.90 n/a n/a
National Bank (Jan/20) 2.05 2.32 n/a n/a
RBC Royal Bank (Dec/19) 1.80 2.00 n/a n/a
Scotiabank (Jan/20) 1.50 1.65 n/a n/a
TD Bank (Dec/19) 1.56 1.83 n/a n/a
High 2.08 2.74 3.11 3.14
Low 1.50 1.65 2.59 2.93
Average of All Private Forecasts 1.79 2.09 2.85 3.04
Government of Alberta (calendar year) 1.90 2.20 2.20 2.30
Canadian Long‑Term Interest Rate Benchmark10‑YearGovernmentofCanadaBonds(%)
IncludesforecastsfinalizedonorbeforeJanuary17,2020.
United States / Canada Exchange Rate Benchmark(US¢/Cdn$)
IncludesforecastsfinalizedonorbeforeJanuary17,2020.
Organization 2020 2021 2022 2023National Forecasting Agencies
Conference Board of Canada (Dec/19) 76.7 76.4 76.5 77.2
Stokes Economics (Jan/20) 76.0 76.8 77.4 78.3
BanksBMO Capital Markets (Jan/20) 76.4 76.7 n/a n/a
CIBC World Markets (Jan/20) 75.3 71.5 n/a n/a
Deloitte (Jan/20) 75.2 75.2 n/a n/a
Laurentian Bank (Jan/20) 77.8 78.0 n/a n/a
National Bank (Jan/20) 74.6 76.3 n/a n/a
RBC Royal Bank (Dec/19) 75.2 n/a n/a n/a
Scotiabank (Jan/20) 79.0 80.0 n/a n/a
TD Bank (Dec/19) 75.3 76.8 n/a n/a
OtherBloomberg Forward Curve (17 Jan/20) 76.6 76.4 76.2 76.1
High 79.0 80.0 77.4 78.3
Low 74.6 71.5 76.2 76.1
Average of All Private Forecasts 76.2 76.4 76.7 77.2
Government of Alberta (calendar year) 76.3 76.7 77.3 78.1
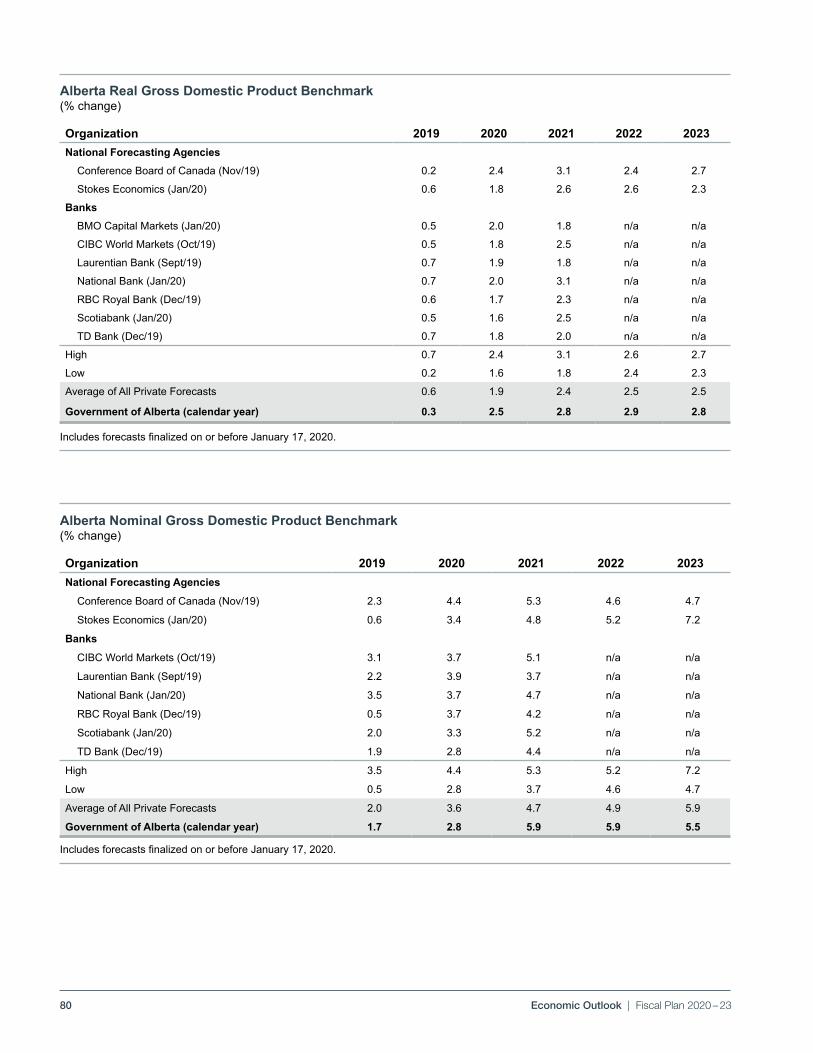
80 Economic Outlook | Fiscal Plan 2020 – 23
IncludesforecastsfinalizedonorbeforeJanuary17,2020.
Alberta Nominal Gross Domestic Product Benchmark(% change)
Organization 2019 2020 2021 2022 2023National Forecasting Agencies
Conference Board of Canada (Nov/19) 2.3 4.4 5.3 4.6 4.7
Stokes Economics (Jan/20) 0.6 3.4 4.8 5.2 7.2
Banks
CIBC World Markets (Oct/19) 3.1 3.7 5.1 n/a n/a
Laurentian Bank (Sept/19) 2.2 3.9 3.7 n/a n/a
National Bank (Jan/20) 3.5 3.7 4.7 n/a n/a
RBC Royal Bank (Dec/19) 0.5 3.7 4.2 n/a n/a
Scotiabank (Jan/20) 2.0 3.3 5.2 n/a n/a
TD Bank (Dec/19) 1.9 2.8 4.4 n/a n/a
High 3.5 4.4 5.3 5.2 7.2
Low 0.5 2.8 3.7 4.6 4.7
Average of All Private Forecasts 2.0 3.6 4.7 4.9 5.9
Government of Alberta (calendar year) 1.7 2.8 5.9 5.9 5.5
IncludesforecastsfinalizedonorbeforeJanuary17,2020.
Alberta Real Gross Domestic Product Benchmark(% change)
Organization 2019 2020 2021 2022 2023National Forecasting Agencies
Conference Board of Canada (Nov/19) 0.2 2.4 3.1 2.4 2.7
Stokes Economics (Jan/20) 0.6 1.8 2.6 2.6 2.3
BanksBMO Capital Markets (Jan/20) 0.5 2.0 1.8 n/a n/a
CIBC World Markets (Oct/19) 0.5 1.8 2.5 n/a n/a
Laurentian Bank (Sept/19) 0.7 1.9 1.8 n/a n/a
National Bank (Jan/20) 0.7 2.0 3.1 n/a n/a
RBC Royal Bank (Dec/19) 0.6 1.7 2.3 n/a n/a
Scotiabank (Jan/20) 0.5 1.6 2.5 n/a n/a
TD Bank (Dec/19) 0.7 1.8 2.0 n/a n/a
High 0.7 2.4 3.1 2.6 2.7
Low 0.2 1.6 1.8 2.4 2.3
Average of All Private Forecasts 0.6 1.9 2.4 2.5 2.5
Government of Alberta (calendar year) 0.3 2.5 2.8 2.9 2.8

81Economic Outlook | Fiscal Plan 2020 – 23
Alberta Unemployment Rate Benchmark(%)
IncludesforecastsfinalizedonorbeforeJanuary17,2020.
Organization 2020 2021 2022 2023National Forecasting Agencies
Conference Board of Canada (Nov/19) 7.8 8.0 7.9 7.7
Stokes Economics (Jan/20) 6.6 6.2 5.9 5.9
BanksBMO Capital Markets (Jan/20) 7.0 6.9 n/a n/a
CIBC World Markets (Oct/19) 7.0 6.7 n/a n/a
Laurentian Bank (Sep/19) 6.6 6.4 n/a n/a
National Bank (Jan/20) 6.8 6.7 n/a n/a
RBC Royal Bank (Dec/19) 6.8 6.0 n/a n/a
Scotiabank (Jan/20) 7.0 6.9 n/a n/a
TD Bank (Dec/19) 7.1 6.7 n/a n/a
High 7.8 8.0 7.9 7.7
Low 6.6 6.0 5.9 5.9
Average of All Private Forecasts 7.0 6.7 6.9 6.8
Government of Alberta (calendar year) 6.7 6.0 5.5 5.1
Alberta Employment Benchmark(% change)
IncludesforecastsfinalizedonorbeforeJanuary17,2020.
Organization 2020 2021 2022 2023National Forecasting Agencies
Conference Board of Canada (Nov/19) 0.8 1.6 2.1 2.1
Stokes Economics (Jan/20) 1.2 1.6 1.7 1.5
BanksBMO Capital Markets (Jan/20) 0.5 0.8 n/a n/a
CIBC World Markets (Oct/19) 0.8 1.2 n/a n/a
Laurentian Bank (Sep/19) 0.8 0.7 n/a n/a
National Bank (Jan/20) 1.5 1.2 n/a n/a
RBC Royal Bank (Dec/19) 1.1 1.6 n/a n/a
Scotiabank (Jan/20) 1.0 1.2 n/a n/a
TD Bank (Dec/19) 0.7 1.6 n/a n/a
High 1.5 1.6 2.1 2.1
Low 0.5 0.7 1.7 1.5
Average of All Private Forecasts 0.9 1.3 1.9 1.8
Government of Alberta (calendar year) 1.4 2.1 2.1 2.1
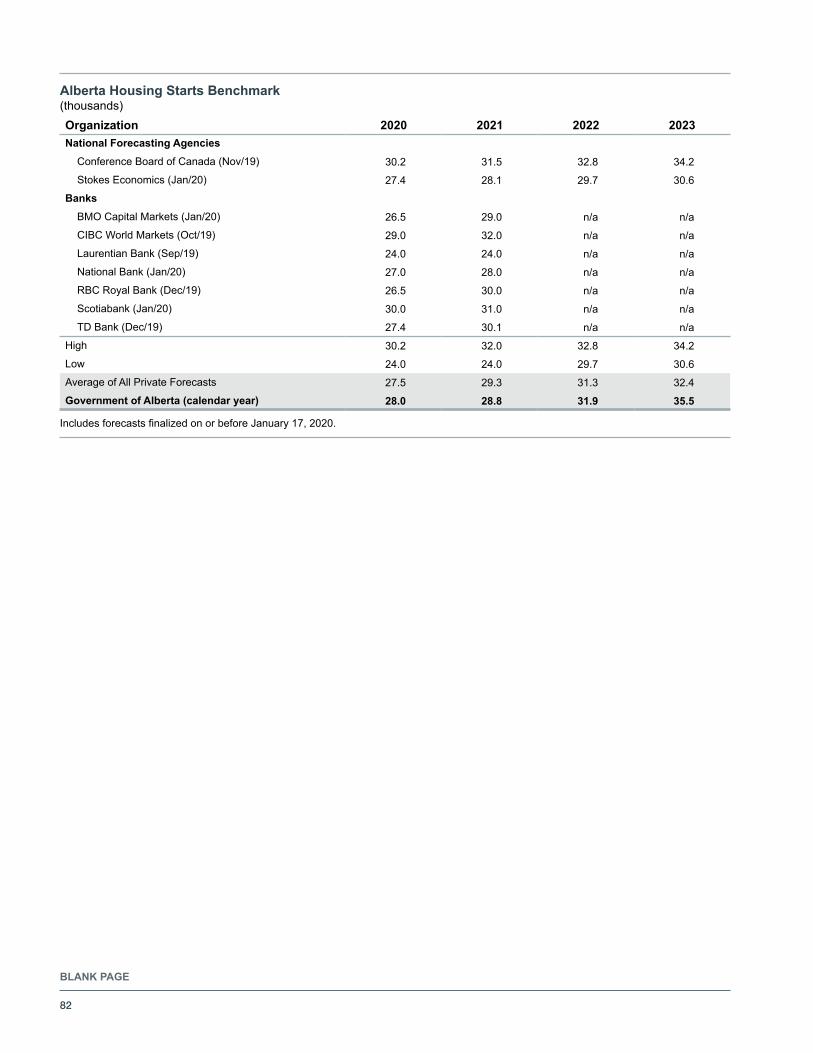
BLANK PAGE
82
Organization 2020 2021 2022 2023National Forecasting Agencies
Conference Board of Canada (Nov/19) 30.2 31.5 32.8 34.2
Stokes Economics (Jan/20) 27.4 28.1 29.7 30.6
BanksBMO Capital Markets (Jan/20) 26.5 29.0 n/a n/a
CIBC World Markets (Oct/19) 29.0 32.0 n/a n/a
Laurentian Bank (Sep/19) 24.0 24.0 n/a n/a
National Bank (Jan/20) 27.0 28.0 n/a n/a
RBC Royal Bank (Dec/19) 26.5 30.0 n/a n/a
Scotiabank (Jan/20) 30.0 31.0 n/a n/a
TD Bank (Dec/19) 27.4 30.1 n/a n/a
High 30.2 32.0 32.8 34.2
Low 24.0 24.0 29.7 30.6
Average of All Private Forecasts 27.5 29.3 31.3 32.4
Government of Alberta (calendar year) 28.0 28.8 31.9 35.5
Alberta Housing Starts Benchmark(thousands)
IncludesforecastsfinalizedonorbeforeJanuary17,2020.
83
BUDGET 2020
GOVERNMENT OF ALBERTA | 2020 –23
Fiscal PlanA Fair Deal For Alberta
84 A Fair Deal For Alberta | Fiscal Plan 2020 – 23
Table of Contents
A Fair Deal For Alberta . . . . . . . . . . . . . . . . . . . . . . . . . . . . . . . . . . . . . . . . . . . . . . . . . . . . . . . . . . . . . . . . . 85
Introduction . . . . . . . . . . . . . . . . . . . . . . . . . . . . . . . . . . . . . . . . . . . . . . . . . . . . . . . . . . . . . . . . . . . . . . . . . . . 85
Alberta’s Economic and Fiscal Contributions to Canada . . . . . . . . . . . . . . . . . . . . . . . . . . . . . . . . . . . . . . . . . . 85
Major Federal Fiscal Transfers . . . . . . . . . . . . . . . . . . . . . . . . . . . . . . . . . . . . . . . . . . . . . . . . . . . . . . . . . . . . . 88
Fiscal Stabilization Program – A Brief History . . . . . . . . . . . . . . . . . . . . . . . . . . . . . . . . . . . . . . . . . . . . . . . . . 90
Other Federal‑Provincial Fiscal Issues . . . . . . . . . . . . . . . . . . . . . . . . . . . . . . . . . . . . . . . . . . . . . . . . . . . . . . . . 96
The Fair Deal Panel . . . . . . . . . . . . . . . . . . . . . . . . . . . . . . . . . . . . . . . . . . . . . . . . . . . . . . . . . . . . . . . . . . . . . 97
85A Fair Deal For Alberta | Fiscal Plan 2020 – 23
A Fair Deal For Alberta
IntroductionFor many years, Alberta has been the economic and fiscal engine of Canada . Due in large part to the contributions of the energy sector, our economy has generated over a million jobs in Alberta over the past quarter century – along with thousands more across the country1 – and has added hundreds of billions of dollars to the federal treasury .
Over the past five years, however, adverse market conditions have been exacerbated by national policies that have impeded market access for our resources, damaged conditions for investment and otherwise hindered the province’s economic recovery .
Alberta’s economy remains smaller today than it was in 20142, yet our fiscal contributions to the country continue to far exceed the amounts returned to the province in federal spending and transfers .
During the most difficult period for the province in over a generation, our contributions to Canada have not been reciprocated . Alberta is seeking a fair deal to address this imbalance .
Alberta’s Economic and Fiscal Contributions to CanadaAlberta has been a major contributor to the Canadian economy for decades . Currently, with just 12 per cent of Canada’s population, Alberta attracts nearly a quarter of the capital investment in the country, and is responsible for over 20 per cent of the Canadian goods exported internationally . Overall, Alberta contributes about 16 per cent to the national economy3 (Chart 1) .
1 Over the past 25 years (1994 to 2019), Alberta’s total employment increased by 1,018,500, accounting for 17 per cent of the total increase in Canada’s employment over this period.
2 As measured by nominal Gross Domestic Product (GDP), a broad measure of income. Alberta’s 2019 nominal GDP is estimated at $350.5 billion, approximately $26 billion below 2014 levels.
3 In 2018, Alberta’s economy accounted for almost 17 per cent of national GDP in real terms.
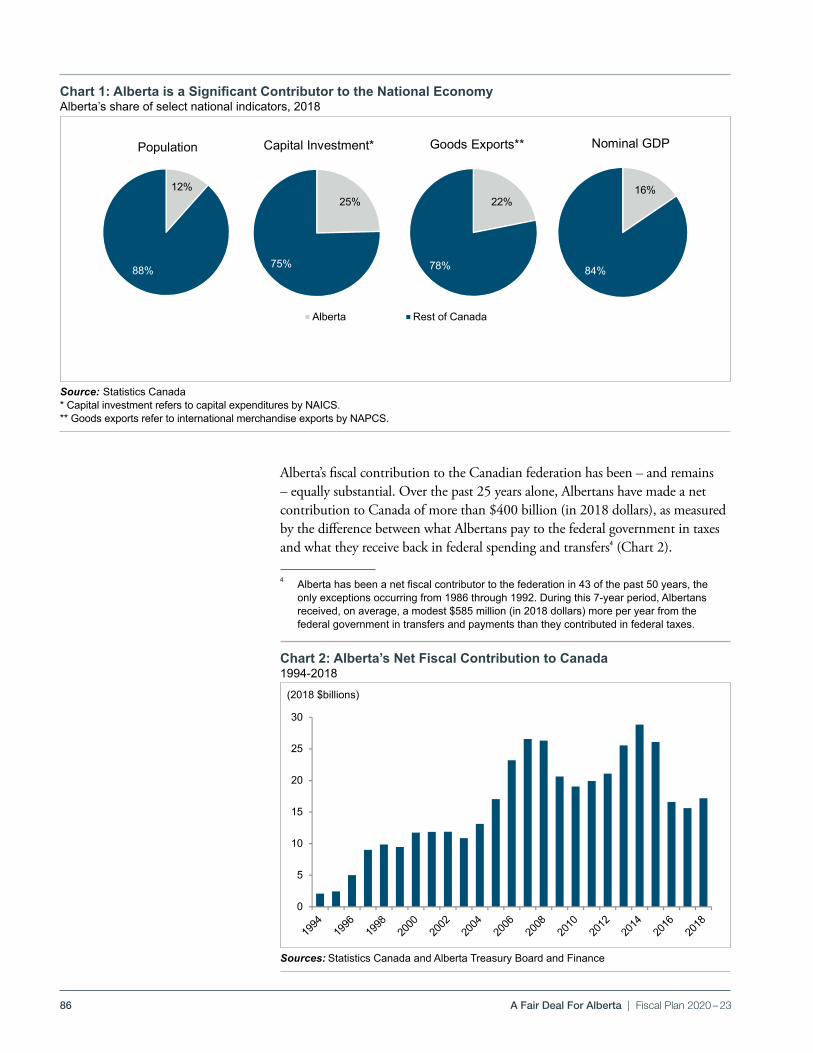
86 A Fair Deal For Alberta | Fiscal Plan 2020 – 23
Alberta’s fiscal contribution to the Canadian federation has been – and remains – equally substantial . Over the past 25 years alone, Albertans have made a net contribution to Canada of more than $400 billion (in 2018 dollars), as measured by the difference between what Albertans pay to the federal government in taxes and what they receive back in federal spending and transfers4 (Chart 2) .
4 Albertahasbeenanetfiscalcontributortothefederationin43ofthepast50years,theonly exceptions occurring from 1986 through 1992. During this 7‑year period, Albertans received, on average, a modest $585 million (in 2018 dollars) more per year from the federal government in transfers and payments than they contributed in federal taxes.
Chart 2: Alberta’s Net Fiscal Contribution to Canada 1994‑2018
Chart 1: Alberta is a Significant Contributor to the National EconomyAlberta’s share of select national indicators, 2018
Source: Statistics Canada* Capital investment refers to capital expenditures by NAICS.** Goods exports refer to international merchandise exports by NAPCS.
Sources: Statistics Canada and Alberta Treasury Board and Finance
Budget 2020Alberta's Fair Deal
PDF Name: FD20_chrt_01.pdf
Alberta A Significant Contributor to the National EconomyAlberta's share of select national indicators, 2018
FD20_chrt_01.pdf
25%
75%
Capital Investment*
Alberta Rest of Canada
22%
78%
Goods Exports**
16%
84%
Nominal GDP
12%
88%
Population
Path: [1ath]File: [Fed_Prov_Budget_2020_Charts_January10_2020ile]Tab: [3:09 PMab] Last Updated: [1ath] @ [3:09 PMime]
Budget 2020Alberta's Fair Deal
PDF Name: FD20_chrt_02.pdf
Chart 2: Alberta's Contribution Over 25 Years Exceeded $400
Source: Statistics Canada
FD20_chrt_02.pdf
0
5
10
15
20
25
30
(2018 $billions)
Path: [1ath]File: [Fed_Prov_Budget_2020_Charts_January10_2020ile]Tab: [9:36 AMab] Last Updated: [1ath] @ [9:36 AMime]
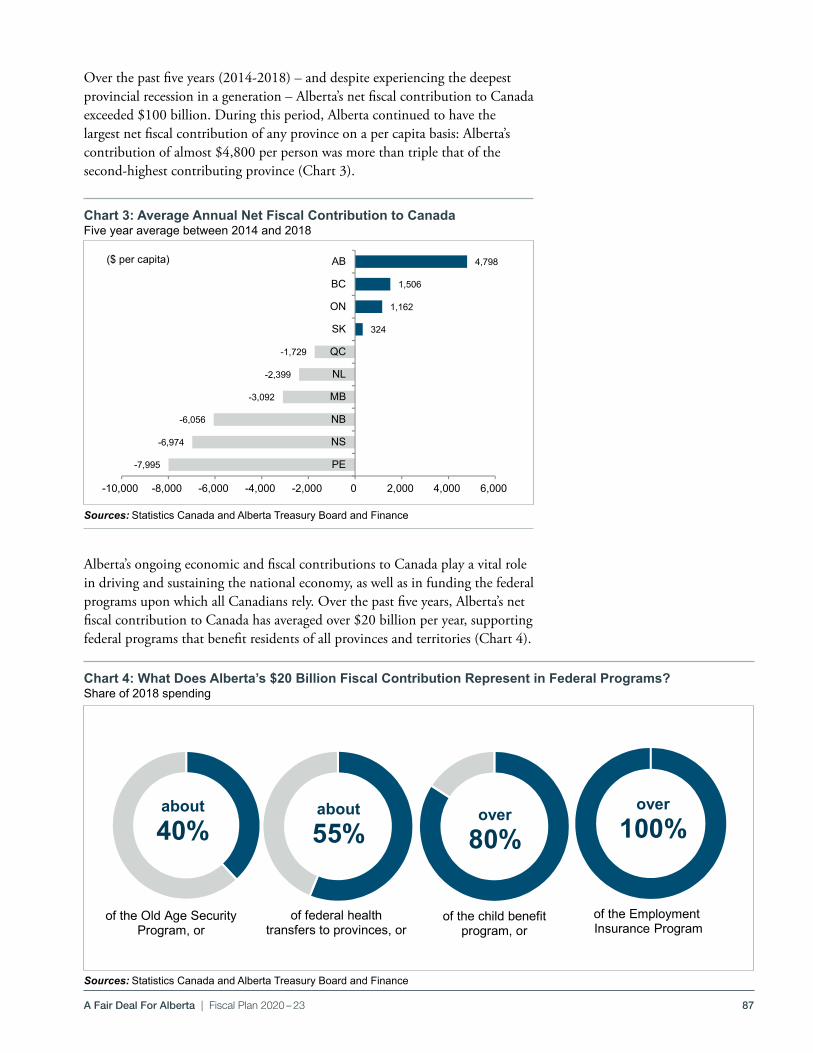
87A Fair Deal For Alberta | Fiscal Plan 2020 – 23
Over the past five years (2014‑2018) – and despite experiencing the deepest provincial recession in a generation – Alberta’s net fiscal contribution to Canada exceeded $100 billion . During this period, Alberta continued to have the largest net fiscal contribution of any province on a per capita basis: Alberta’s contribution of almost $4,800 per person was more than triple that of the second‑highest contributing province (Chart 3) .
Alberta’s ongoing economic and fiscal contributions to Canada play a vital role in driving and sustaining the national economy, as well as in funding the federal programs upon which all Canadians rely . Over the past five years, Alberta’s net fiscal contribution to Canada has averaged over $20 billion per year, supporting federal programs that benefit residents of all provinces and territories (Chart 4) .
Chart 3: Average Annual Net Fiscal Contribution to CanadaFive year average between 2014 and 2018
Sources: Statistics Canada and Alberta Treasury Board and Finance
Chart 4: What Does Alberta’s $20 Billion Fiscal Contribution Represent in Federal Programs?Share of 2018 spending
Sources: Statistics Canada and Alberta Treasury Board and Finance
Budget 2020Alberta's Fair Deal
PDF Name: FD20_chrt_03.pdf
Average Annual Net Fiscal Contribution to Canada Five year average between 2014 and 2018
Source: Statistics Canada
FD20_chrt_03.pdf
-7,995
-6,974
-6,056
-3,092
-2,399
-1,729
324
1,162
1,506
4,798
-10,000 -8,000 -6,000 -4,000 -2,000 0 2,000 4,000 6,000
PE
NS
NB
MB
NL
QC
SK
ON
BC
AB($ per capita)
Path: [1ath]File: [Fed_Prov_Budget_2020_Charts_January10_2020ile]Tab: [9:36 AMab] Last Updated: [1ath] @ [9:36 AMime]
Budget 2020Alberta's Fair Deal
PDF Name: FD20_chrt_04.pdf
What Does Alberta's $20 Billion Fiscal Contribution Respresent in Federal Programs?Share of 2018 spending
Source: Statistics Canada
FD20_chrt_04.pdf
Please do not move or resize these charts - prints to pdf properly.
of the Old Age Security Program, or
about40%
of federal healthtransfers to provinces, or
about55%
of the child benefitprogram, or
over80%
of the EmploymentInsurance Program
over100%
Path: [1ath]File: [Fed_Prov_Budget_2020_Charts_January10_2020ile]Tab: [9:37 AMab] Last Updated: [1ath] @ [9:37 AMime]
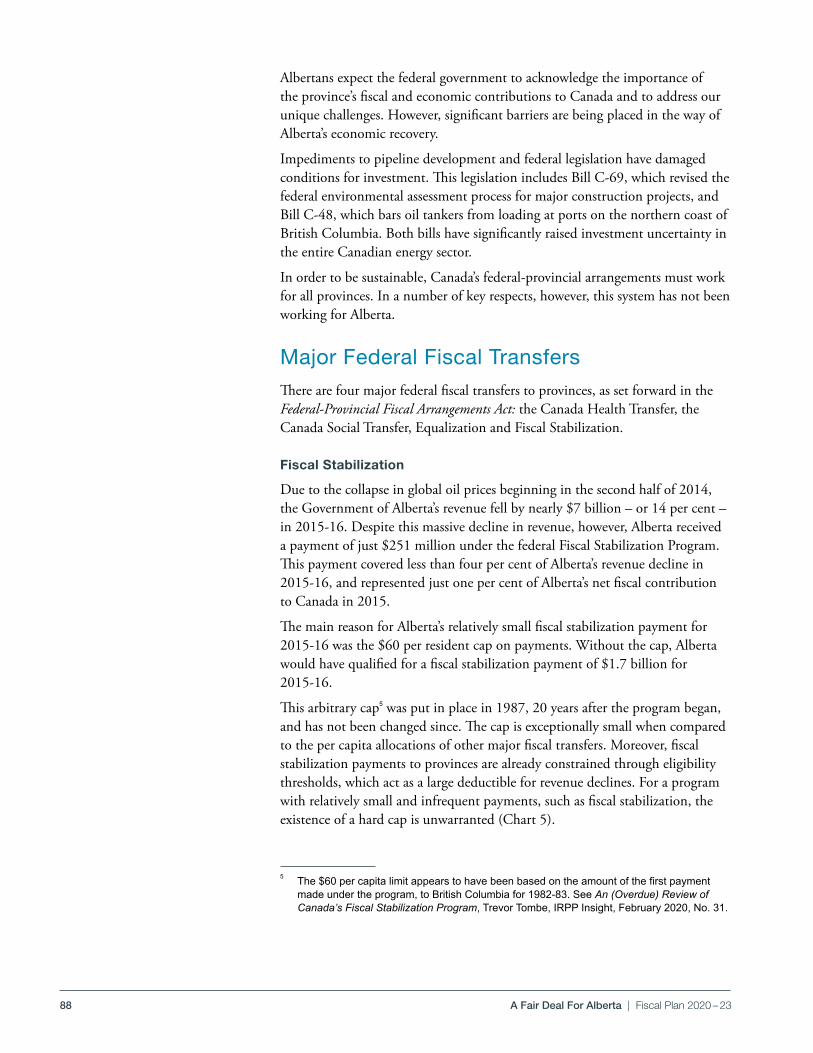
88 A Fair Deal For Alberta | Fiscal Plan 2020 – 23
Albertans expect the federal government to acknowledge the importance of the province’s fiscal and economic contributions to Canada and to address our unique challenges . However, significant barriers are being placed in the way of Alberta’s economic recovery .
Impediments to pipeline development and federal legislation have damaged conditions for investment . This legislation includes Bill C‑69, which revised the federal environmental assessment process for major construction projects, and Bill C‑48, which bars oil tankers from loading at ports on the northern coast of British Columbia . Both bills have significantly raised investment uncertainty in the entire Canadian energy sector .
In order to be sustainable, Canada’s federal‑provincial arrangements must work for all provinces . In a number of key respects, however, this system has not been working for Alberta .
Major Federal Fiscal Transfers There are four major federal fiscal transfers to provinces, as set forward in the Federal‑Provincial Fiscal Arrangements Act: the Canada Health Transfer, the Canada Social Transfer, Equalization and Fiscal Stabilization .
Fiscal Stabilization
Due to the collapse in global oil prices beginning in the second half of 2014, the Government of Alberta’s revenue fell by nearly $7 billion – or 14 per cent – in 2015‑16 . Despite this massive decline in revenue, however, Alberta received a payment of just $251 million under the federal Fiscal Stabilization Program . This payment covered less than four per cent of Alberta’s revenue decline in 2015‑16, and represented just one per cent of Alberta’s net fiscal contribution to Canada in 2015 .
The main reason for Alberta’s relatively small fiscal stabilization payment for 2015‑16 was the $60 per resident cap on payments . Without the cap, Alberta would have qualified for a fiscal stabilization payment of $1 .7 billion for 2015‑16 .
This arbitrary cap5 was put in place in 1987, 20 years after the program began, and has not been changed since . The cap is exceptionally small when compared to the per capita allocations of other major fiscal transfers . Moreover, fiscal stabilization payments to provinces are already constrained through eligibility thresholds, which act as a large deductible for revenue declines . For a program with relatively small and infrequent payments, such as fiscal stabilization, the existence of a hard cap is unwarranted (Chart 5) .
5 The$60percapitalimitappearstohavebeenbasedontheamountofthefirstpaymentmade under the program, to British Columbia for 1982‑83. See An (Overdue) Review of Canada’s Fiscal Stabilization Program, Trevor Tombe, IRPP Insight, February 2020, No. 31.
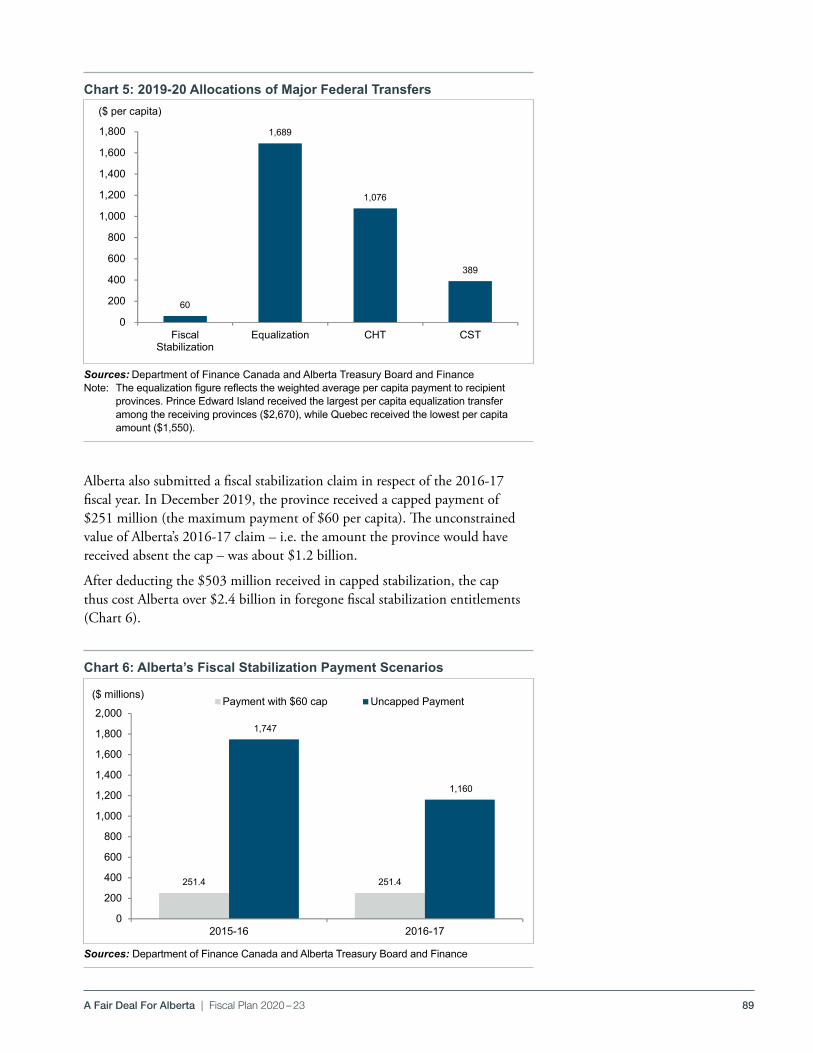
89A Fair Deal For Alberta | Fiscal Plan 2020 – 23
Alberta also submitted a fiscal stabilization claim in respect of the 2016‑17 fiscal year . In December 2019, the province received a capped payment of $251 million (the maximum payment of $60 per capita) . The unconstrained value of Alberta’s 2016‑17 claim – i .e . the amount the province would have received absent the cap – was about $1 .2 billion .
After deducting the $503 million received in capped stabilization, the cap thus cost Alberta over $2 .4 billion in foregone fiscal stabilization entitlements (Chart 6) .
Chart 5: 2019-20 Allocations of Major Federal Transfers
Chart 6: Alberta’s Fiscal Stabilization Payment Scenarios
Sources: Department of Finance Canada and Alberta Treasury Board and FinanceNote: Theequalizationfigurereflectstheweightedaveragepercapitapaymenttorecipient
provinces. Prince Edward Island received the largest per capita equalization transfer among the receiving provinces ($2,670), while Quebec received the lowest per capita amount ($1,550).
Sources: Department of Finance Canada and Alberta Treasury Board and Finance
Budget 2020Alberta's Fair Deal
PDF Name: FD20_chrt_05.pdf
Chart 5: 2019-20 Allocations of Major Federal Transfers
Source: Department of Finance CanadaNote: The Equalization figure above reflects the weighted average per capita Equalization payment to receipient provinces.Prince Edward Island received the largest per capita Equalization transfer among the receiving provinces ($2,670), while Quebec received the lowest per capita amount ($1,550).FD20_chrt_05.pdf
60
1,689
1,076
389
0
200
400
600
800
1,000
1,200
1,400
1,600
1,800
FiscalStabilization
Equalization CHT CST
($ per capita)
Path: [1ath]File: [Fed_Prov_Budget_2020_Charts_January10_2020ile]Tab: [2:16 PMab] Last Updated: [1ath] @ [2:16 PMime]
Budget 2020Alberta's Fair Deal
PDF Name: FD20_chrt_06.pdf
Chart 6: Alberta's Fiscal Stabilization Payment Scenarios
Source: Department of Finance Canada, Alberta Treasury Board and Finance
FD20_chrt_06.pdf
251.4 251.4
1,747
1,160
0
200
400
600
800
1,000
1,200
1,400
1,600
1,800
2,000
2015-16 2016-17
($ millions) Payment with $60 cap Uncapped Payment
Path: [1ath]File: [Fed_Prov_Budget_2020_Charts_January10_2020ile]Tab: [9:37 AMab] Last Updated: [1ath] @ [9:37 AMime]
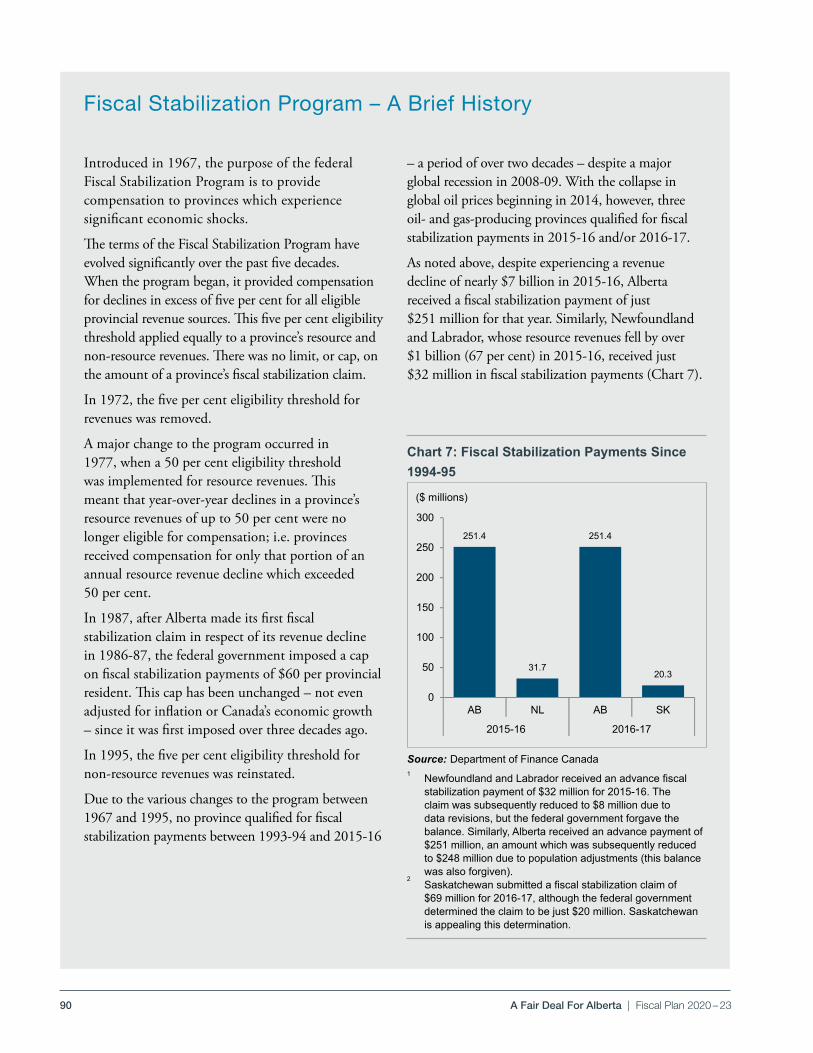
90 A Fair Deal For Alberta | Fiscal Plan 2020 – 23
Fiscal Stabilization Program – A Brief History
– a period of over two decades – despite a major global recession in 2008‑09 . With the collapse in global oil prices beginning in 2014, however, three oil‑ and gas‑producing provinces qualified for fiscal stabilization payments in 2015‑16 and/or 2016‑17 .
As noted above, despite experiencing a revenue decline of nearly $7 billion in 2015‑16, Alberta received a fiscal stabilization payment of just $251 million for that year . Similarly, Newfoundland and Labrador, whose resource revenues fell by over $1 billion (67 per cent) in 2015‑16, received just $32 million in fiscal stabilization payments (Chart 7) .
Introduced in 1967, the purpose of the federal Fiscal Stabilization Program is to provide compensation to provinces which experience significant economic shocks .
The terms of the Fiscal Stabilization Program have evolved significantly over the past five decades . When the program began, it provided compensation for declines in excess of five per cent for all eligible provincial revenue sources . This five per cent eligibility threshold applied equally to a province’s resource and non‑resource revenues . There was no limit, or cap, on the amount of a province’s fiscal stabilization claim .
In 1972, the five per cent eligibility threshold for revenues was removed .
A major change to the program occurred in 1977, when a 50 per cent eligibility threshold was implemented for resource revenues . This meant that year‑over‑year declines in a province’s resource revenues of up to 50 per cent were no longer eligible for compensation; i .e . provinces received compensation for only that portion of an annual resource revenue decline which exceeded 50 per cent .
In 1987, after Alberta made its first fiscal stabilization claim in respect of its revenue decline in 1986‑87, the federal government imposed a cap on fiscal stabilization payments of $60 per provincial resident . This cap has been unchanged – not even adjusted for inflation or Canada’s economic growth – since it was first imposed over three decades ago .
In 1995, the five per cent eligibility threshold for non‑resource revenues was reinstated .
Due to the various changes to the program between 1967 and 1995, no province qualified for fiscal stabilization payments between 1993‑94 and 2015‑16
Chart 7: Fiscal Stabilization Payments Since 1994-95
Source: Department of Finance Canada1 NewfoundlandandLabradorreceivedanadvancefiscal
stabilization payment of $32 million for 2015‑16. The claim was subsequently reduced to $8 million due to data revisions, but the federal government forgave the balance. Similarly, Alberta received an advance payment of $251 million, an amount which was subsequently reduced to $248 million due to population adjustments (this balance was also forgiven).
2 Saskatchewansubmittedafiscalstabilizationclaimof
$69 million for 2016‑17, although the federal government determined the claim to be just $20 million. Saskatchewan is appealing this determination.
Budget 2020Alberta's Fair Deal
PDF Name: FD20_chrt_07.pdf
Fiscal Stabilization Payments Since 2015
Source: Department of Finance Canada
FD20_chrt_07.pdf
251.4
31.7
251.4
20.3
0
50
100
150
200
250
300
AB NL AB SK
2015-16 2016-17
($ millions)
Path: [1ath]File: [Fed_Prov_Budget_2020_Charts_January10_2020ile]Tab: [3:11 PMab] Last Updated: [1ath] @ [3:11 PMime]
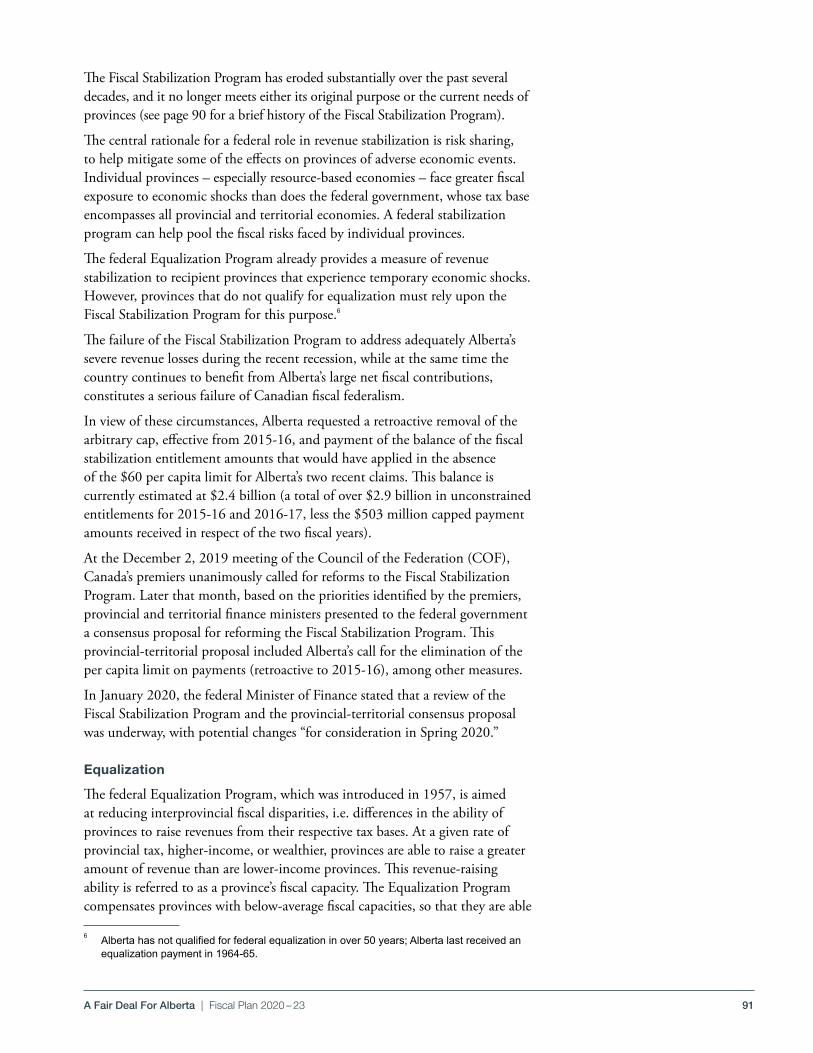
91A Fair Deal For Alberta | Fiscal Plan 2020 – 23
The Fiscal Stabilization Program has eroded substantially over the past several decades, and it no longer meets either its original purpose or the current needs of provinces (see page 90 for a brief history of the Fiscal Stabilization Program) .
The central rationale for a federal role in revenue stabilization is risk sharing, to help mitigate some of the effects on provinces of adverse economic events . Individual provinces – especially resource‑based economies – face greater fiscal exposure to economic shocks than does the federal government, whose tax base encompasses all provincial and territorial economies . A federal stabilization program can help pool the fiscal risks faced by individual provinces .
The federal Equalization Program already provides a measure of revenue stabilization to recipient provinces that experience temporary economic shocks . However, provinces that do not qualify for equalization must rely upon the Fiscal Stabilization Program for this purpose .6
The failure of the Fiscal Stabilization Program to address adequately Alberta’s severe revenue losses during the recent recession, while at the same time the country continues to benefit from Alberta’s large net fiscal contributions, constitutes a serious failure of Canadian fiscal federalism .
In view of these circumstances, Alberta requested a retroactive removal of the arbitrary cap, effective from 2015‑16, and payment of the balance of the fiscal stabilization entitlement amounts that would have applied in the absence of the $60 per capita limit for Alberta’s two recent claims . This balance is currently estimated at $2 .4 billion (a total of over $2 .9 billion in unconstrained entitlements for 2015‑16 and 2016‑17, less the $503 million capped payment amounts received in respect of the two fiscal years) .
At the December 2, 2019 meeting of the Council of the Federation (COF), Canada’s premiers unanimously called for reforms to the Fiscal Stabilization Program . Later that month, based on the priorities identified by the premiers, provincial and territorial finance ministers presented to the federal government a consensus proposal for reforming the Fiscal Stabilization Program . This provincial‑territorial proposal included Alberta’s call for the elimination of the per capita limit on payments (retroactive to 2015‑16), among other measures .
In January 2020, the federal Minister of Finance stated that a review of the Fiscal Stabilization Program and the provincial‑territorial consensus proposal was underway, with potential changes “for consideration in Spring 2020 .”
Equalization
The federal Equalization Program, which was introduced in 1957, is aimed at reducing interprovincial fiscal disparities, i .e . differences in the ability of provinces to raise revenues from their respective tax bases . At a given rate of provincial tax, higher‑income, or wealthier, provinces are able to raise a greater amount of revenue than are lower‑income provinces . This revenue‑raising ability is referred to as a province’s fiscal capacity . The Equalization Program compensates provinces with below‑average fiscal capacities, so that they are able
6 Albertahasnotqualifiedforfederalequalizationinover50years;Albertalastreceivedanequalization payment in 1964‑65.
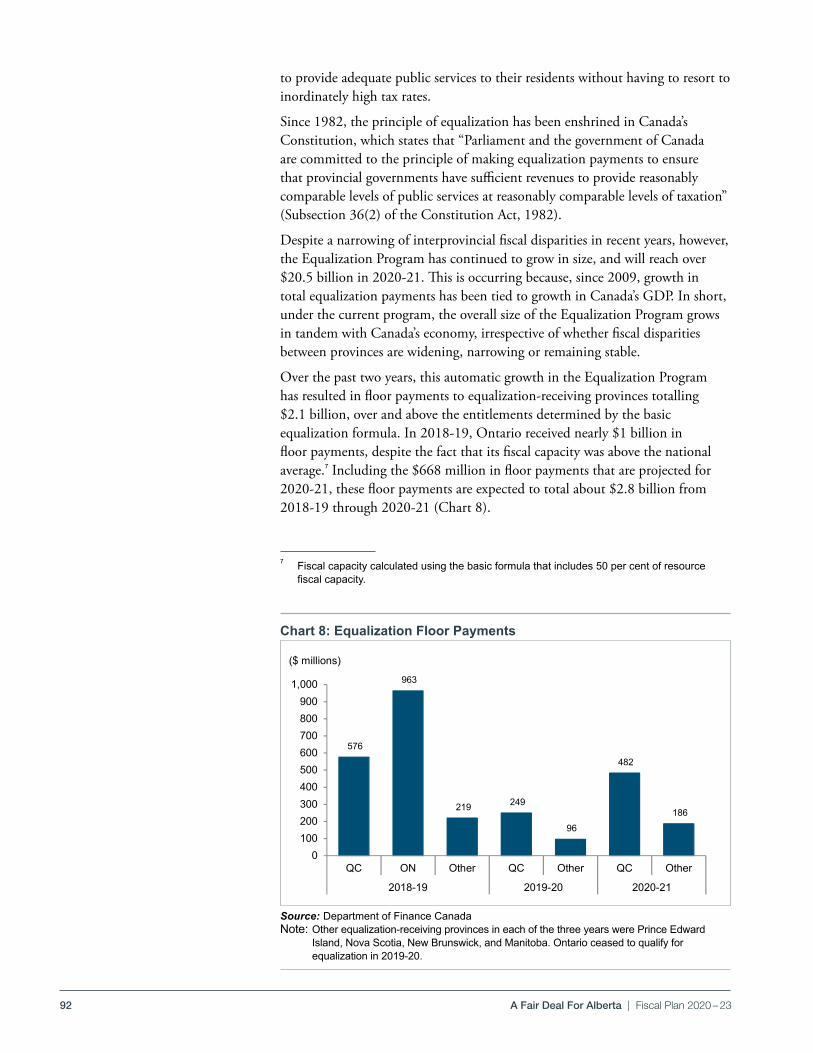
92 A Fair Deal For Alberta | Fiscal Plan 2020 – 23
to provide adequate public services to their residents without having to resort to inordinately high tax rates .
Since 1982, the principle of equalization has been enshrined in Canada’s Constitution, which states that “Parliament and the government of Canada are committed to the principle of making equalization payments to ensure that provincial governments have sufficient revenues to provide reasonably comparable levels of public services at reasonably comparable levels of taxation” (Subsection 36(2) of the Constitution Act, 1982) .
Despite a narrowing of interprovincial fiscal disparities in recent years, however, the Equalization Program has continued to grow in size, and will reach over $20 .5 billion in 2020‑21 . This is occurring because, since 2009, growth in total equalization payments has been tied to growth in Canada’s GDP . In short, under the current program, the overall size of the Equalization Program grows in tandem with Canada’s economy, irrespective of whether fiscal disparities between provinces are widening, narrowing or remaining stable .
Over the past two years, this automatic growth in the Equalization Program has resulted in floor payments to equalization‑receiving provinces totalling $2 .1 billion, over and above the entitlements determined by the basic equalization formula . In 2018‑19, Ontario received nearly $1 billion in floor payments, despite the fact that its fiscal capacity was above the national average .7 Including the $668 million in floor payments that are projected for 2020‑21, these floor payments are expected to total about $2 .8 billion from 2018‑19 through 2020‑21 (Chart 8) .
7 Fiscal capacity calculated using the basic formula that includes 50 per cent of resource fiscalcapacity.
Chart 8: Equalization Floor Payments
Source: Department of Finance CanadaNote: Other equalization‑receiving provinces in each of the three years were Prince Edward
Island, Nova Scotia, New Brunswick, and Manitoba. Ontario ceased to qualify for equalization in 2019‑20.
Budget 2020Alberta's Fair Deal
PDF Name: FP20_chrt_08.pdf
Equalization 'Floor Payments'
Source: Department of Finance CanadaNote: Other equalization-receiving provinces in each of three years were Prince Edward Island, Nova Scotia, New Brunswick, Manitoba. Ontario seized to qualify for equalization in 2019-20.
FP20_chrt_08.pdf
576
963
219 249
96
482
186
0100200300400500600700800900
1,000
QC ON Other QC Other QC Other
2018-19 2019-20 2020-21
($ millions)
Path: [1ath]File: [Fed_Prov_Budget_2020_Charts_January10_2020ile]Tab: [3:15 PMab] Last Updated: [1ath] @ [3:15 PMime]
93A Fair Deal For Alberta | Fiscal Plan 2020 – 23
This outcome is contrary to the fundamental purpose of the program . Simply put, when interprovincial fiscal disparities decline, the size of the Equalization Program should decline to a corresponding degree .
At the same time, it is important that the Equalization Program remain affordable to taxpayers . For this reason, the GDP constraint should continue to function as a ceiling on total equalization payments . It should be noted that a similar GDP growth constraint is presently in effect for the Canada Health Transfer (CHT) – the largest federal fiscal transfer .
Alberta is also seeking significant reforms to the measurement of provincial fiscal capacity in the equalization formula . In particular, Alberta proposes that non‑renewable resource revenue be removed from the calculation of equalization payments . Currently, 50 per cent of a province’s resource revenues are included in the measurement of its fiscal capacity .
In 2007, the federal government made significant reforms to the Equalization Program, based upon the recommendations of the 2006 report of the Expert Panel on Equalization and Territorial Formula Financing . The panel gave extensive thought to the treatment of natural resources in the equalization formula .
In its report, the panel stated that “The starting point for the Panel’s recommendations is ownership . Under Canada’s Constitution, provinces own their natural resources . As owners, they should receive a net fiscal benefit from those resources . The workings of the Equalization program should not compromise this fundamental principle .” 8
The panel ultimately recommended that 50 per cent of a province’s resource revenues be included in the equalization formula, due to the impact of resource revenues on interprovincial fiscal disparities (an impact that has declined significantly in recent years) . Importantly, the panel emphasized that “nothing in the Equalization program should provide a disincentive for maximizing the potential of resource developments .” 9
The current equalization formula, however, does penalize some provinces for developing their natural resources . For example, if resource revenues were excluded entirely from the equalization formula, Newfoundland and Labrador would be eligible for an equalization payment of $446 million in 2020‑21 . However, because resource fiscal capacity is included in the equalization calculations, Newfoundland and Labrador will receive no equalization payments in 2020‑2110 (and has not received any since 2007‑08) . In this manner, the Equalization Program remains a disincentive for provinces to develop their natural resources .
8 Achieving A National Purpose: Putting Equalization Back on Track, Expert Panel on Equalization and Territorial Formula Financing, May 2006, p.55.
9 Ibid, p. 56
10 This is due to the operation of the Fiscal Capacity Cap (FCC) in the equalization formula. The FCC adjusts a province’s potential equalization payments based upon 100 per cent ofthatprovince’sresourcefiscalcapacity.In2020‑21,theFCCresultedina$900millionnegative adjustment for Newfoundland, reducing their potential equalization entitlement from $446 million (as calculated under the basic equalization formula) to zero.
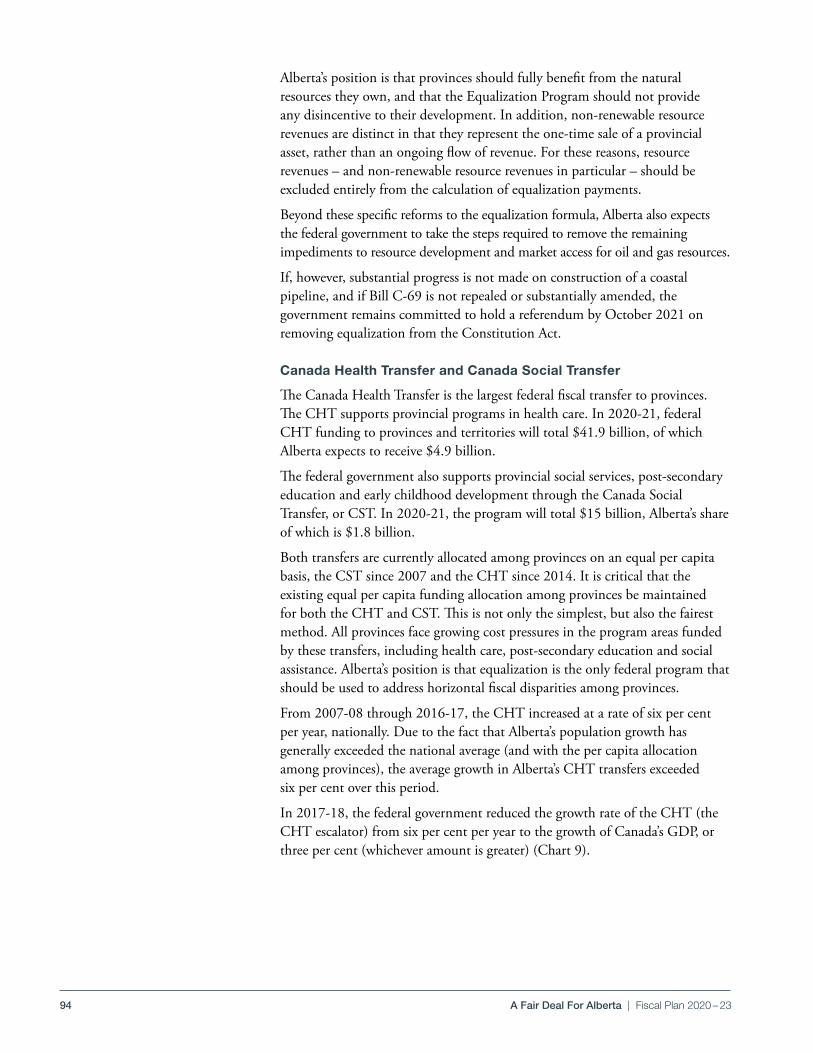
94 A Fair Deal For Alberta | Fiscal Plan 2020 – 23
Alberta’s position is that provinces should fully benefit from the natural resources they own, and that the Equalization Program should not provide any disincentive to their development . In addition, non‑renewable resource revenues are distinct in that they represent the one‑time sale of a provincial asset, rather than an ongoing flow of revenue . For these reasons, resource revenues – and non‑renewable resource revenues in particular – should be excluded entirely from the calculation of equalization payments .
Beyond these specific reforms to the equalization formula, Alberta also expects the federal government to take the steps required to remove the remaining impediments to resource development and market access for oil and gas resources .
If, however, substantial progress is not made on construction of a coastal pipeline, and if Bill C‑69 is not repealed or substantially amended, the government remains committed to hold a referendum by October 2021 on removing equalization from the Constitution Act .
Canada Health Transfer and Canada Social Transfer
The Canada Health Transfer is the largest federal fiscal transfer to provinces . The CHT supports provincial programs in health care . In 2020‑21, federal CHT funding to provinces and territories will total $41 .9 billion, of which Alberta expects to receive $4 .9 billion .
The federal government also supports provincial social services, post‑secondary education and early childhood development through the Canada Social Transfer, or CST . In 2020‑21, the program will total $15 billion, Alberta’s share of which is $1 .8 billion .
Both transfers are currently allocated among provinces on an equal per capita basis, the CST since 2007 and the CHT since 2014 . It is critical that the existing equal per capita funding allocation among provinces be maintained for both the CHT and CST . This is not only the simplest, but also the fairest method . All provinces face growing cost pressures in the program areas funded by these transfers, including health care, post‑secondary education and social assistance . Alberta’s position is that equalization is the only federal program that should be used to address horizontal fiscal disparities among provinces .
From 2007‑08 through 2016‑17, the CHT increased at a rate of six per cent per year, nationally . Due to the fact that Alberta’s population growth has generally exceeded the national average (and with the per capita allocation among provinces), the average growth in Alberta’s CHT transfers exceeded six per cent over this period .
In 2017‑18, the federal government reduced the growth rate of the CHT (the CHT escalator) from six per cent per year to the growth of Canada’s GDP, or three per cent (whichever amount is greater) (Chart 9) .
95A Fair Deal For Alberta | Fiscal Plan 2020 – 23
Independent experts such as the Conference Board of Canada have estimated provincial/territorial cost pressures in health at over five per cent per year . Since the reduced CHT escalator took effect, annual growth in the national CHT has averaged 3 .8 per cent .
In December 2019, Canada’s premiers called upon the federal government to increase the annual growth of the CHT to 5 .2 per cent, in line with independent projections for provincial health costs .
If an adequate escalator for the CHT is not secured, provinces and territories will need to explore other approaches to ensure that their public health‑care systems are fiscally sustainable over the long term .
One such option is to seek a transfer of tax points from the federal government to provinces . Such a tax transfer could be effected by having the federal government reduce its tax rates in a major area of taxation (e .g . personal income tax), and provinces occupying this newly vacated tax room by raising their tax rates by an equal‑value amount, leaving the combined federal‑provincial tax burden unchanged . The tax transfers could help mitigate the existing misalignment between the revenue powers and spending responsibilities of the federal and provincial orders of government .
Tax point transfers are one of the policy options on which Alberta’s Fair Deal Panel has been consulting with Albertans . The Fair Deal Panel’s mandate is described in detail on page 97 .
Chart 9: Alberta’s CHT Annual Growth Has Slowed
Sources: Department of Finance Canada and Alberta Treasury Board and Finance
Budget 2020Alberta's Fair Deal
PDF Name: FP20_chrt_09.pdf
Alberta's CHT's Annual Growth Has Slowed
Source: Department of Finance Canada
FP20_chrt_09.pdf
6.6 6.3
2.4
3.84.8
3.9
6.4
3.7
0
1
2
3
4
5
6
7
2015-16 2016-17 2017-18 2018-19 2019-20 2020-21
(%)
Path: [1ath]File: [Fed_Prov_Budget_2020_Charts_January10_2020ile]Tab: [9:48 AMab] Last Updated: [1ath] @ [9:48 AMime]
96 A Fair Deal For Alberta | Fiscal Plan 2020 – 23
Other Federal‑Provincial Fiscal IssuesBeyond the major fiscal transfers, several other issues in the federal‑provincial sphere are of pressing concern to Alberta . As the province continues to experience the aftereffects of the 2015‑16 recession amid continued low global oil prices, it is critical that federal policies support – rather than hinder – Alberta’s economic recovery . However, in addition to continuing policies that negatively affect the energy sector, the federal government has also been unresponsive to Alberta’s calls for policy changes in other areas . Two important examples are mortgage eligibility requirements and federal infrastructure funding .
The B20 mortgage stress test imposed by the Office of the Superintendent of Financial Institutions (OSFI) was implemented in 2018 . This measure was intended to address overheated housing markets, primarily in the Toronto and Vancouver areas . However, housing markets in Alberta – as in many other parts of Canada – are far from overheated, and are at little risk of becoming so .
Since May 2019, Alberta has made repeated requests to the federal government to remove the B20 stress test requirement from properties in the province . Removal of the B20 requirement would support Albertans’ efforts to become homeowners and aid the recovery of Alberta’s housing sector . Technical changes announced by the federal government do not address Alberta’s request to remove the B20 stress test on Albertans .
Alberta also continues to press for changes to federal infrastructure funding under the Investing in Canada Infrastructure Program (ICIP) . Alberta is seeking greater discretion to target its allocation to the province’s areas of priority, rather than being restricted to specific amounts by funding stream .
Since the signing of the Canada‑Alberta Integrated Bilateral Agreement, further conditions and administrative requirements have been added . This has affected project eligibility and added administrative burdens to accessing ICIP funding . Futhermore, project approvals from the federal government have frequently been delayed .
Alberta reiterates its requests that the federal government collaborate with provincial governments on project priorities, give provinces greater flexibility in the use of federal infrastructure funds and take measures to expedite the project approvals process .
Alberta’s concerns are shared by other provinces and territories . At the COF meeting in December 2019, Canada’s premiers jointly requested that “federal infrastructure funding should be flexible, respect provincial‑territorial priorities, and (that) the federal approval process must be accelerated .”
97A Fair Deal For Alberta | Fiscal Plan 2020 – 23
The Fair Deal PanelIn November 2019, the Government of Alberta established the Fair Deal Panel . Its mandate is to explore – and consult with Albertans on – ideas for reform that would strengthen the province’s economic position, give Alberta a larger voice within Confederation, and increase the province’s power over institutions and funding in areas of provincial jurisdiction .
The panel was tasked with considering whether the following measures would advance the province’s interests:
• Establishing a provincial revenue agency to collect provincial taxes directly by ending the Canada‑Alberta Tax Collection Agreement, while joining Quebec in seeking an agreement to collect federal taxes within the province .
• Creating an Alberta Pension Plan by withdrawing from the Canada Pension Plan .
• Establishing a provincial police force by ending the Alberta Police Service Agreement with the Government of Canada .
• Emulating Quebec’s practice of playing a larger role in international relations, in part by seeking Albertan representation in treaty negotiations that affect Alberta’s interests .
• Emulating Quebec’s legal requirement that public bodies, including municipalities and school boards, obtain the approval of the provincial government before they can enter into agreements with the federal government .
• Using the existing provincial power to appoint the Chief Firearms Office for Alberta .
• Opting out of federal cost‑share programs with full compensation, such as the federal government’s proposed pharmacare program .
• Seeking an exchange of tax points for federal cash transfers under the Canada Health and Social Transfers .
• Establishing a formalized provincial constitution .
The panel held open town hall meetings across Alberta from December 2019 through January 2020 . It is also consulting with experts on the issues within its mandate, and on the ideas put forward by Albertans during the public consultations .
The panel will report its findings to the government by March 31, 2020 .

98
BLANK PAGE

99
BUDGET 2020
GOVERNMENT OF ALBERTA | 2020 –23
Fiscal PlanRevenue
100 Revenue | Fiscal Plan 2020 – 23
Revenue Outlook . . . . . . . . . . . . . . . . . . . . . . . . . . . . . . . . . . . . . . . . . . . . . . . . . . . . . . . . . . . . . . . . . . . . . . 101
Non-Renewable Resource Revenue . . . . . . . . . . . . . . . . . . . . . . . . . . . . . . . . . . . . . . . . . . . . . . . . . . . . . . . . . . 105
Tax Revenue . . . . . . . . . . . . . . . . . . . . . . . . . . . . . . . . . . . . . . . . . . . . . . . . . . . . . . . . . . . . . . . . . . . . . . . . . . . 109
Federal Transfers . . . . . . . . . . . . . . . . . . . . . . . . . . . . . . . . . . . . . . . . . . . . . . . . . . . . . . . . . . . . . . . . . . . . . . . . 111
Investment Income . . . . . . . . . . . . . . . . . . . . . . . . . . . . . . . . . . . . . . . . . . . . . . . . . . . . . . . . . . . . . . . . . . . . . . 112
Other Revenue . . . . . . . . . . . . . . . . . . . . . . . . . . . . . . . . . . . . . . . . . . . . . . . . . . . . . . . . . . . . . . . . . . . . . . . . . 112
Risks . . . . . . . . . . . . . . . . . . . . . . . . . . . . . . . . . . . . . . . . . . . . . . . . . . . . . . . . . . . . . . . . . . . . . . . . . . . . . . . . 115
Table of Contents
Note: Amounts presented in tables may not add to totals due to rounding.
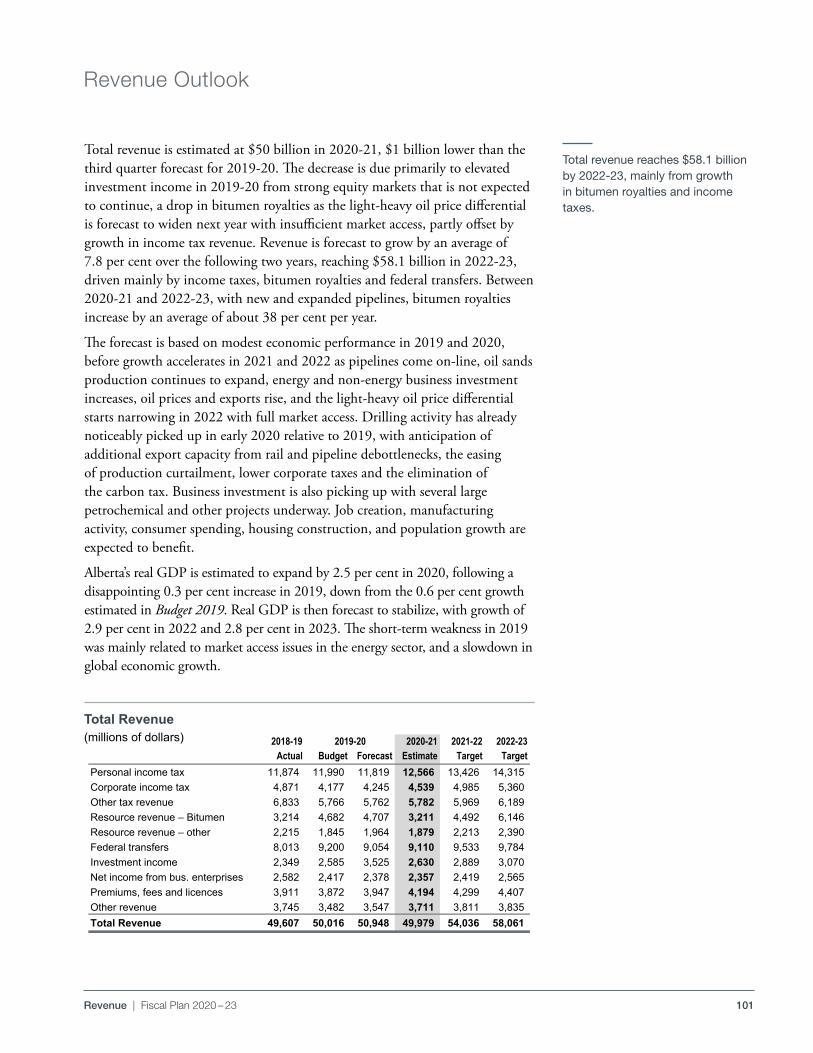
101Revenue | Fiscal Plan 2020 – 23
Total revenue is estimated at $50 billion in 2020-21, $1 billion lower than the third quarter forecast for 2019-20 . The decrease is due primarily to elevated investment income in 2019-20 from strong equity markets that is not expected to continue, a drop in bitumen royalties as the light-heavy oil price differential is forecast to widen next year with insufficient market access, partly offset by growth in income tax revenue . Revenue is forecast to grow by an average of 7 .8 per cent over the following two years, reaching $58 .1 billion in 2022-23, driven mainly by income taxes, bitumen royalties and federal transfers . Between 2020-21 and 2022-23, with new and expanded pipelines, bitumen royalties increase by an average of about 38 per cent per year .
The forecast is based on modest economic performance in 2019 and 2020, before growth accelerates in 2021 and 2022 as pipelines come on-line, oil sands production continues to expand, energy and non-energy business investment increases, oil prices and exports rise, and the light-heavy oil price differential starts narrowing in 2022 with full market access . Drilling activity has already noticeably picked up in early 2020 relative to 2019, with anticipation of additional export capacity from rail and pipeline debottlenecks, the easing of production curtailment, lower corporate taxes and the elimination of the carbon tax . Business investment is also picking up with several large petrochemical and other projects underway . Job creation, manufacturing activity, consumer spending, housing construction, and population growth are expected to benefit .
Alberta’s real GDP is estimated to expand by 2 .5 per cent in 2020, following a disappointing 0 .3 per cent increase in 2019, down from the 0 .6 per cent growth estimated in Budget 2019 . Real GDP is then forecast to stabilize, with growth of 2 .9 per cent in 2022 and 2 .8 per cent in 2023 . The short-term weakness in 2019 was mainly related to market access issues in the energy sector, and a slowdown in global economic growth .
Revenue Outlook
Total revenue reaches $58.1 billion by 2022-23, mainly from growth in bitumen royalties and income taxes.
Pdf name: B20-FP_Rev_tb02_tr.pdf Budget 2020Revenue section
Total Revenue(millions of dollars)
2018-19 2020-21 2021-22 2022-23Actual Budget Forecast Estimate Target Target
Personal income tax 11,874 11,990 11,819 12,566 13,426 14,315 Corporate income tax 4,871 4,177 4,245 4,539 4,985 5,360 Other tax revenue 6,833 5,766 5,762 5,782 5,969 6,189 Resource revenue – Bitumen 3,214 4,682 4,707 3,211 4,492 6,146 Resource revenue – other 2,215 1,845 1,964 1,879 2,213 2,390 Federal transfers 8,013 9,200 9,054 9,110 9,533 9,784 Investment income 2,349 2,585 3,525 2,630 2,889 3,070 Net income from bus. enterprises 2,582 2,417 2,378 2,357 2,419 2,565 Premiums, fees and licences 3,911 3,872 3,947 4,194 4,299 4,407 Other revenue 3,745 3,482 3,547 3,711 3,811 3,835 Total Revenue 49,607 50,016 50,948 49,979 54,036 58,061
2019-20
M:\MinShare\PublnsProd\CorpFin\OBM.PUBLNS-2020-21\B20_Fiscal-Plan_vol\05_REVenue_B20\source-docs\B-20_FP_REVenue_tables.xlsx
2/16/20209:32 PM
Total Revenue(millions of dollars)
102 Revenue | Fiscal Plan 2020 – 23
This forecast reflects the implications of a number of policy changes, including:
• Removing the carbon tax, which accounted for $1 .3 billion in 2018-19 .
• Making Alberta the best place to do business through the Job Creation Tax Cut . The general corporate income tax (CIT) rate dropped from 12 per cent to 11 per cent last summer, to 10 per cent on January 1, 2020, and will decrease twice more by a single percentage point on January 1 of 2021 and 2022, when it reaches 8 per cent . Lowering the rate is starting to add momentum to economic growth, with private sector investment strengthening . CIT revenue is expected to grow to $5 .4 billion by 2022-23 .
• A number of tax credits were eliminated in Budget 2019, in pursuit of a broad-based, low-rate tax policy which is more efficient to administer, is more equitable as it avoids picking industries or activities to subsidize, and over time is more effective in generating economic growth .
• Modernizing and adding fairness to several revenue streams by introducing a tax on vaping, applying the tourism levy to short-term rentals offered on on-line marketplaces, and developing an on-line gaming portal for Albertans .
• Several new revenue sources, and adjustments to current ones:
− a recreation trail fee ($4 .5 million per year beginning in 2021-22), as committed in the government’s platform;
− an increase, from 15 per cent to 20 per cent, to the provincial fine surcharge that funds victims of crime programs and now also public safety priorities ($14 million per year in 2020-21 and on);
− increases to a number of provincial park fees, beginning in 2020-21; − a new royalty stream for removal of resources from Coffee Lake gravel
pit ($6 .6 million per year in 2020-21 onward) .
Relative to Budget 2019, the revenue forecast has increased by $932 million in 2019-20, is estimated to be $101 million lower in 2020-21, and then has increased by $407 million in 2021-22 and $518 million in 2022-23 .
Changes to 2020-21 to 2022-23 revenue from the Budget 2019 forecast:
• Personal income tax (PIT) revenue is down slightly, as updated lower 2018 assessment data reduces the base used to forecast PIT in subsequent years, and as there was some weakness in the labour market in late 2019 .
• Corporate income tax revenue is also lower moving forward from the wider light-heavy oil price differential in the short term, the weaker economic outlook, and revised lower oil production .
• Other tax revenue has been adjusted, primarily for lower fuel consumption .
• Forecast resource revenue has declined $296 million in 2020-21 relative to Budget 2019, and is expected to be $55 million lower by 2022-23 . The drop in 2020-21 is mainly related to bitumen royalties ($281 million decrease from wider differential, lower production), natural gas royalties (lower natural gas liquid prices) and land lease sales, offset by higher crude oil royalties (higher prices for light and medium conventional grades mitigates lower production) . By 2022-23, with market access resolution, bitumen royalties are $15 million higher than the previous forecast (due mainly to a
Broad-based, low-rate tax policy considered more efficient than targeted tax credits, and more
supportive of long-term economic prosperity.
Investment income increased in 2019-20. The Budget 2020 total
revenue forecast is otherwise close to that of Budget 2019.
Job Creation Tax Cut leaves more resources in the hands of
employers and investors, spurring economic activity.
Job-killing carbon tax eliminated and corporate income tax rate will
be down to 8 per cent by 2022.
Resource revenue has declined mainly from a wider forecast for
the differential in 2020-21.
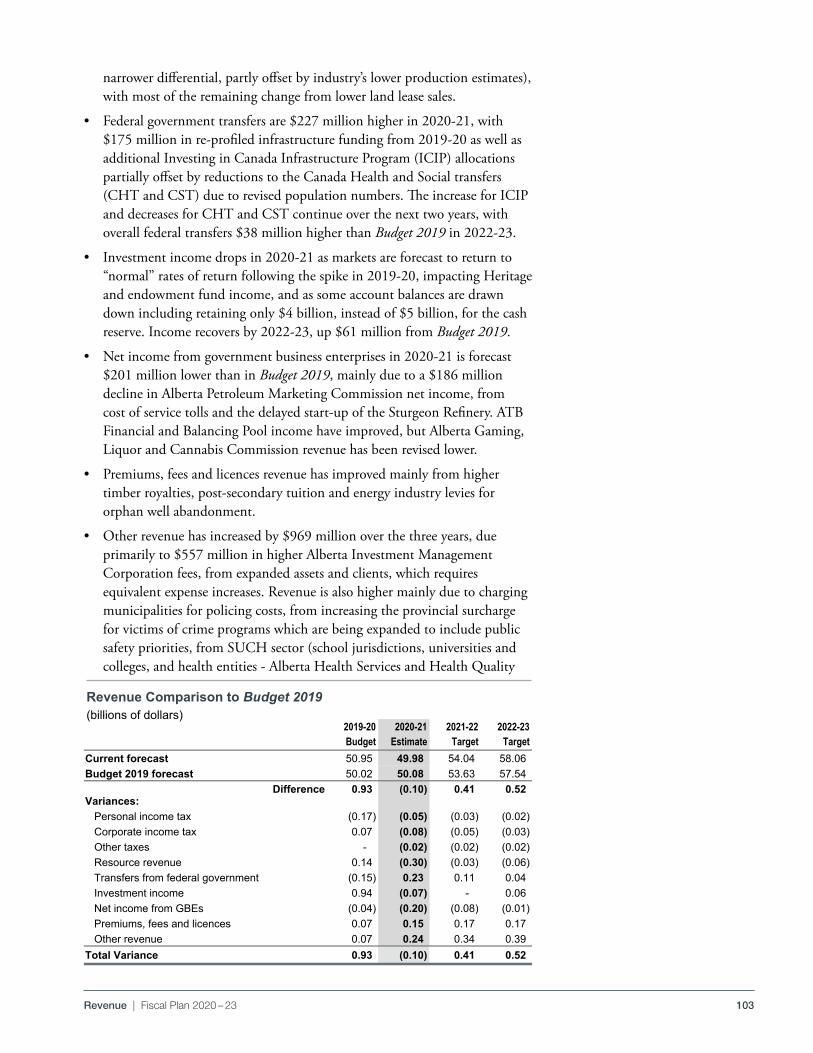
103Revenue | Fiscal Plan 2020 – 23
narrower differential, partly offset by industry’s lower production estimates), with most of the remaining change from lower land lease sales .
• Federal government transfers are $227 million higher in 2020-21, with $175 million in re-profiled infrastructure funding from 2019-20 as well as additional Investing in Canada Infrastructure Program (ICIP) allocations partially offset by reductions to the Canada Health and Social transfers (CHT and CST) due to revised population numbers . The increase for ICIP and decreases for CHT and CST continue over the next two years, with overall federal transfers $38 million higher than Budget 2019 in 2022-23 .
• Investment income drops in 2020-21 as markets are forecast to return to “normal” rates of return following the spike in 2019-20, impacting Heritage and endowment fund income, and as some account balances are drawn down including retaining only $4 billion, instead of $5 billion, for the cash reserve . Income recovers by 2022-23, up $61 million from Budget 2019 .
• Net income from government business enterprises in 2020-21 is forecast $201 million lower than in Budget 2019, mainly due to a $186 million decline in Alberta Petroleum Marketing Commission net income, from cost of service tolls and the delayed start-up of the Sturgeon Refinery . ATB Financial and Balancing Pool income have improved, but Alberta Gaming, Liquor and Cannabis Commission revenue has been revised lower .
• Premiums, fees and licences revenue has improved mainly from higher timber royalties, post-secondary tuition and energy industry levies for orphan well abandonment .
• Other revenue has increased by $969 million over the three years, due primarily to $557 million in higher Alberta Investment Management Corporation fees, from expanded assets and clients, which requires equivalent expense increases . Revenue is also higher mainly due to charging municipalities for policing costs, from increasing the provincial surcharge for victims of crime programs which are being expanded to include public safety priorities, from SUCH sector (school jurisdictions, universities and colleges, and health entities - Alberta Health Services and Health Quality
Pdf name: B20-FP_Rev_tb02_rctq.pdf Budget 2020Revenue section
Revenue comparison to Budget 2020(millions of dollars)
2019-20 2020-21 2021-22 2022-23Budget Estimate Target Target
Current forecast 50.95 49.98 54.04 58.06 Budget 2019 forecast 50.02 50.08 53.63 57.54
Difference 0.93 (0.10) 0.41 0.52 Variances:
Personal income tax (0.17) (0.05) (0.03) (0.02) Corporate income tax 0.07 (0.08) (0.05) (0.03) Other taxes - (0.02) (0.02) (0.02) Resource revenue 0.14 (0.30) (0.03) (0.06) Transfers from federal government (0.15) 0.23 0.11 0.04 Investment income 0.94 (0.07) - 0.06 Net income from GBEs (0.04) (0.20) (0.08) (0.01) Premiums, fees and licences 0.07 0.15 0.17 0.17 Other revenue 0.07 0.24 0.34 0.39
Total Variance 0.93 (0.10) 0.41 0.52
M:\MinShare\PublnsProd\CorpFin\OBM.PUBLNS-2020-21\B20_Fiscal-Plan_vol\05_REVenue_B20\source-docs\B-20_FP_REVenue_tables.xlsx
2/16/20209:37 PM
Revenue Comparison to Budget 2019(billions of dollars)
104 Revenue | Fiscal Plan 2020 – 23
Council of Alberta) sales, fundraising, donations and income from restricted contributions, and from a new dedicated revenue for caribou recovery .
2019-20 revenue changes from Budget 2019:
• Personal income tax revenue has declined by $171 million due primarily to updated 2018 assessment data, which was lower than expected in fall 2019, and some labour market weakness in late 2019 . The revised assessments lower the base used to forecast future years, and also requires prior-years’ adjustments for 2017-18 and 2018-19 revenue already reported . These adjustments are included in 2019-20 revenue .
• Corporate income tax is forecast to be up $68 million, due primarily to higher-than-expected instalment payments so far this year .
• The resource revenue forecast has increased by $144 million, with about half of the improvement from natural gas and by-product royalties from higher gas prices and lower industry costs . Bitumen and crude oil royalties are also up, due to an increase in the forecast West Texas Intermediate (WTI) oil price, partly offset by a slightly wider differential and higher exchange rate .
• Federal transfers are forecast to be a net $146 million lower . Increased agriculture support of $93 million is more than offset by re-profiling infrastructure funding of $175 million to 2020-21, mainly for municipal projects, and downward adjustments to the Canada Health and Social transfers based on revisions to Alberta’s share of the national population .
• Investment income is up $940 million, from strong market returns in the Heritage and endowment funds, an unexpected loan pre-payment to Alberta Capital Finance Authority (ACFA) from a municipality (a near equivalent amount for the costs incurred relating to the associated debt is included in ACFA debt servicing costs), and from higher balances in a number of funds and agencies, including Agriculture Financial Services Corporation .
• Net income from government business enterprises has decreased by a net $39 million . Balancing Pool net revenue is forecast $110 million lower than expected at budget due mainly to higher costs of settling power purchase agreements . This is partly offset by an increase of $46 million in ATB Financial net income from lower-than-expected credit losses, and an increase of $20 million in Alberta Petroleum Marketing Commission income primarily related to lower Sturgeon Refinery operating expense .
• Premiums, fees and licences revenue is up $75 million mainly from increases of $30 million in timber royalties, due to reduced BC lumber supply and elevated demand in late 2019 from the US housing market, $21 million in agriculture insurance premiums and recoveries, and $13 million for payments-in-lieu-of-taxes due to ATB’s higher net income .
• Other revenue is forecast to be $65 million higher . SUCH sector fundraising, donations and restricted contributions revenue has increased $110 million, mainly for post-secondary institutions, and $22 million has been added for the Trans Mountain Pipeline expansion transportation utility corridor . Revenue from the Technology Innovation and Emissions Reduction Fund has decreased by $71 million due mainly to implementation of TIER and expectations in the electricity sector .
2019-20 forecast includes revenue from the transportation utility
corridor for the Trans Mountain pipeline expansion.
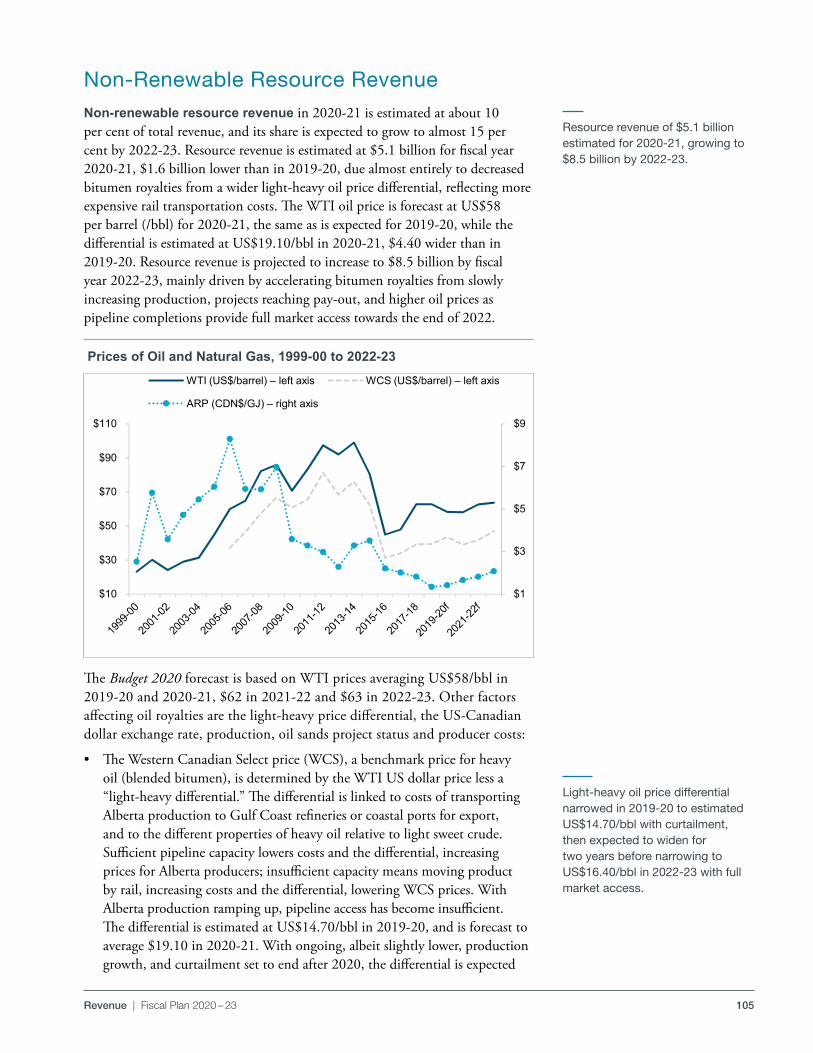
105Revenue | Fiscal Plan 2020 – 23
Non-Renewable Resource RevenueNon-renewable resource revenue in 2020-21 is estimated at about 10 per cent of total revenue, and its share is expected to grow to almost 15 per cent by 2022-23 . Resource revenue is estimated at $5 .1 billion for fiscal year 2020-21, $1 .6 billion lower than in 2019-20, due almost entirely to decreased bitumen royalties from a wider light-heavy oil price differential, reflecting more expensive rail transportation costs . The WTI oil price is forecast at US$58 per barrel (/bbl) for 2020-21, the same as is expected for 2019-20, while the differential is estimated at US$19 .10/bbl in 2020-21, $4 .40 wider than in 2019-20 . Resource revenue is projected to increase to $8 .5 billion by fiscal year 2022-23, mainly driven by accelerating bitumen royalties from slowly increasing production, projects reaching pay-out, and higher oil prices as pipeline completions provide full market access towards the end of 2022 .
The Budget 2020 forecast is based on WTI prices averaging US$58/bbl in 2019-20 and 2020-21, $62 in 2021-22 and $63 in 2022-23 . Other factors affecting oil royalties are the light-heavy price differential, the US-Canadian dollar exchange rate, production, oil sands project status and producer costs:
• The Western Canadian Select price (WCS), a benchmark price for heavy oil (blended bitumen), is determined by the WTI US dollar price less a “light-heavy differential .” The differential is linked to costs of transporting Alberta production to Gulf Coast refineries or coastal ports for export, and to the different properties of heavy oil relative to light sweet crude . Sufficient pipeline capacity lowers costs and the differential, increasing prices for Alberta producers; insufficient capacity means moving product by rail, increasing costs and the differential, lowering WCS prices . With Alberta production ramping up, pipeline access has become insufficient . The differential is estimated at US$14 .70/bbl in 2019-20, and is forecast to average $19 .10 in 2020-21 . With ongoing, albeit slightly lower, production growth, and curtailment set to end after 2020, the differential is expected
Resource revenue of $5.1 billion estimated for 2020-21, growing to $8.5 billion by 2022-23.
Light-heavy oil price differential narrowed in 2019-20 to estimated US$14.70/bbl with curtailment, then expected to widen for two years before narrowing to US$16.40/bbl in 2022-23 with full market access.
Prices of Oil and Natural Gas, 1999-00 to 2022-23
Pdf name: B20-FP_REV_chrt02.pdf Budget 2020Revenue section
Oil and Natural Gas Prices
$1
$3
$5
$7
$9
$10
$30
$50
$70
$90
$110
WTI (US$/barrel) – left axis WCS (US$/barrel) – left axis
ARP (CDN$/GJ) – right axis
S:\TBF\MinShare\PublnsProd\CorpFin\OBM.PUBLNS-2020-21\B20_Fiscal-Plan_vol\05_REVenue_B20\source-docs\B-20_FP_REVenue_tables
2/19/202012:35 PM
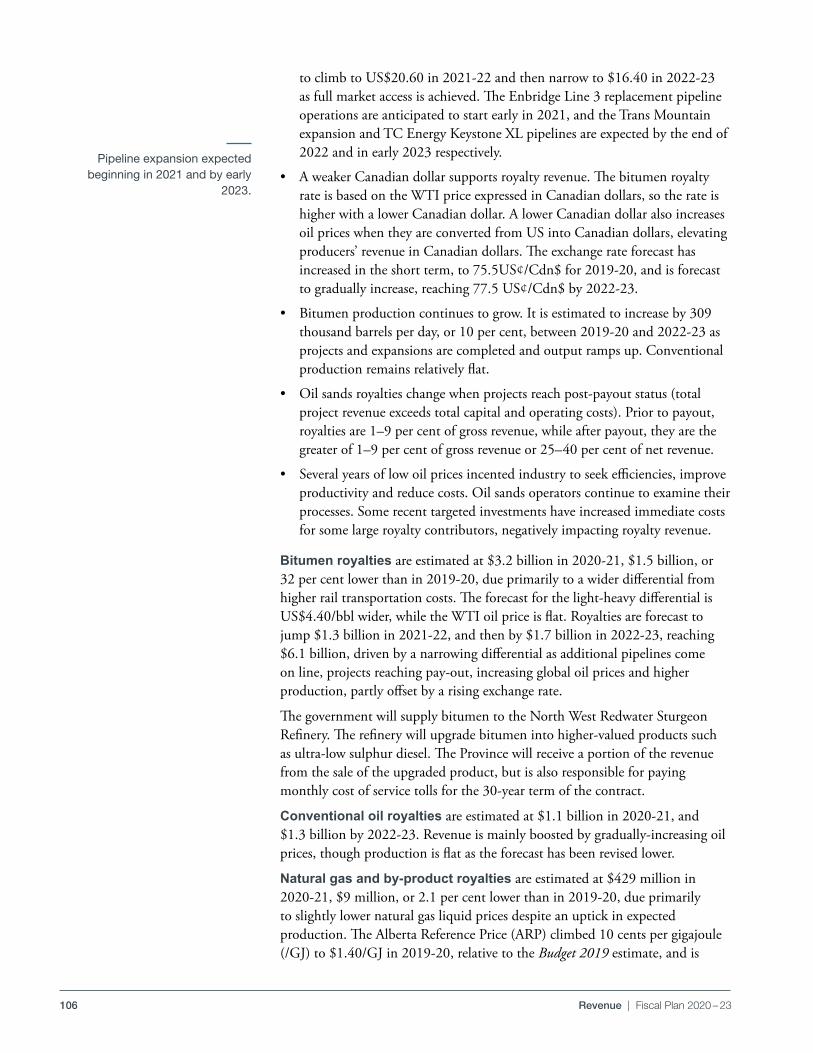
106 Revenue | Fiscal Plan 2020 – 23
to climb to US$20 .60 in 2021-22 and then narrow to $16 .40 in 2022-23 as full market access is achieved . The Enbridge Line 3 replacement pipeline operations are anticipated to start early in 2021, and the Trans Mountain expansion and TC Energy Keystone XL pipelines are expected by the end of 2022 and in early 2023 respectively .
• A weaker Canadian dollar supports royalty revenue . The bitumen royalty rate is based on the WTI price expressed in Canadian dollars, so the rate is higher with a lower Canadian dollar . A lower Canadian dollar also increases oil prices when they are converted from US into Canadian dollars, elevating producers’ revenue in Canadian dollars . The exchange rate forecast has increased in the short term, to 75 .5US¢/Cdn$ for 2019-20, and is forecast to gradually increase, reaching 77 .5 US¢/Cdn$ by 2022-23 .
• Bitumen production continues to grow . It is estimated to increase by 309 thousand barrels per day, or 10 per cent, between 2019-20 and 2022-23 as projects and expansions are completed and output ramps up . Conventional production remains relatively flat .
• Oil sands royalties change when projects reach post-payout status (total project revenue exceeds total capital and operating costs) . Prior to payout, royalties are 1–9 per cent of gross revenue, while after payout, they are the greater of 1–9 per cent of gross revenue or 25– 40 per cent of net revenue .
• Several years of low oil prices incented industry to seek efficiencies, improve productivity and reduce costs . Oil sands operators continue to examine their processes . Some recent targeted investments have increased immediate costs for some large royalty contributors, negatively impacting royalty revenue .
Bitumen royalties are estimated at $3 .2 billion in 2020-21, $1 .5 billion, or 32 per cent lower than in 2019-20, due primarily to a wider differential from higher rail transportation costs . The forecast for the light-heavy differential is US$4 .40/bbl wider, while the WTI oil price is flat . Royalties are forecast to jump $1 .3 billion in 2021-22, and then by $1 .7 billion in 2022-23, reaching $6 .1 billion, driven by a narrowing differential as additional pipelines come on line, projects reaching pay-out, increasing global oil prices and higher production, partly offset by a rising exchange rate .
The government will supply bitumen to the North West Redwater Sturgeon Refinery . The refinery will upgrade bitumen into higher-valued products such as ultra-low sulphur diesel . The Province will receive a portion of the revenue from the sale of the upgraded product, but is also responsible for paying monthly cost of service tolls for the 30-year term of the contract .
Conventional oil royalties are estimated at $1 .1 billion in 2020-21, and $1 .3 billion by 2022-23 . Revenue is mainly boosted by gradually-increasing oil prices, though production is flat as the forecast has been revised lower .
Natural gas and by-product royalties are estimated at $429 million in 2020-21, $9 million, or 2 .1 per cent lower than in 2019-20, due primarily to slightly lower natural gas liquid prices despite an uptick in expected production . The Alberta Reference Price (ARP) climbed 10 cents per gigajoule (/GJ) to $1 .40/GJ in 2019-20, relative to the Budget 2019 estimate, and is
Pipeline expansion expected beginning in 2021 and by early
2023.
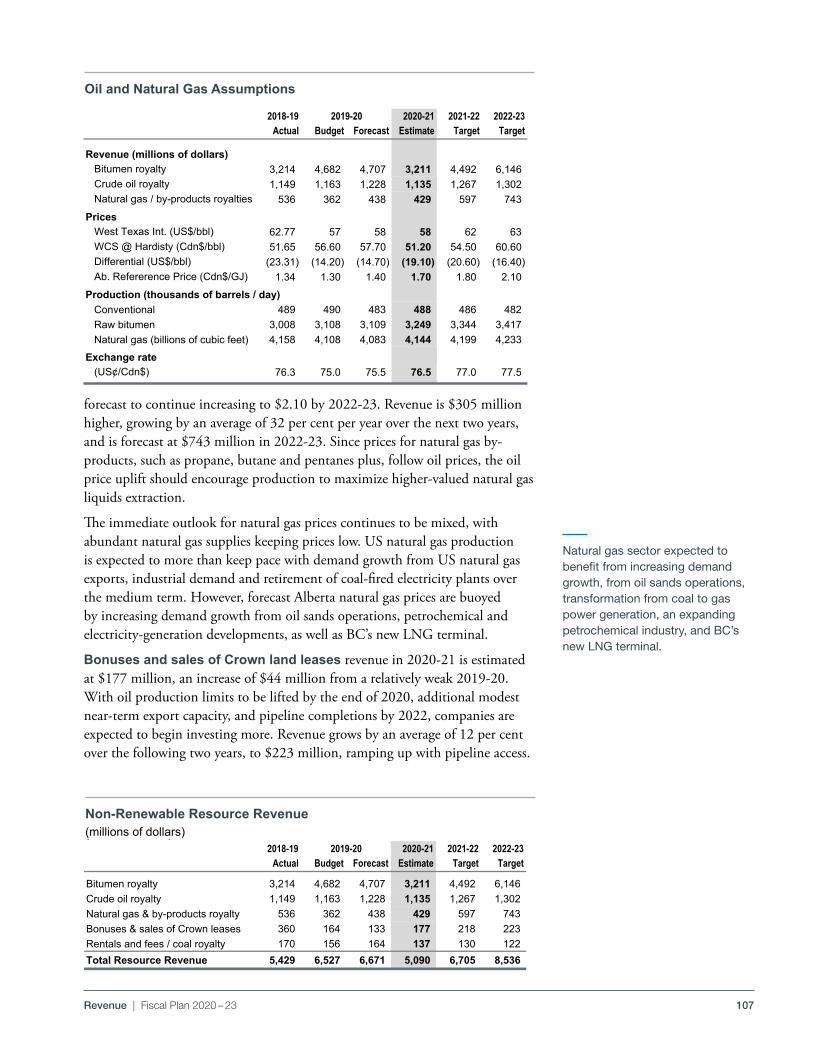
107Revenue | Fiscal Plan 2020 – 23
forecast to continue increasing to $2 .10 by 2022-23 . Revenue is $305 million higher, growing by an average of 32 per cent per year over the next two years, and is forecast at $743 million in 2022-23 . Since prices for natural gas by-products, such as propane, butane and pentanes plus, follow oil prices, the oil price uplift should encourage production to maximize higher-valued natural gas liquids extraction .
The immediate outlook for natural gas prices continues to be mixed, with abundant natural gas supplies keeping prices low . US natural gas production is expected to more than keep pace with demand growth from US natural gas exports, industrial demand and retirement of coal-fired electricity plants over the medium term . However, forecast Alberta natural gas prices are buoyed by increasing demand growth from oil sands operations, petrochemical and electricity-generation developments, as well as BC’s new LNG terminal .
Bonuses and sales of Crown land leases revenue in 2020-21 is estimated at $177 million, an increase of $44 million from a relatively weak 2019-20 . With oil production limits to be lifted by the end of 2020, additional modest near-term export capacity, and pipeline completions by 2022, companies are expected to begin investing more . Revenue grows by an average of 12 per cent over the following two years, to $223 million, ramping up with pipeline access .
Natural gas sector expected to benefit from increasing demand growth, from oil sands operations, transformation from coal to gas power generation, an expanding petrochemical industry, and BC’s new LNG terminal.
Pdf name: B19-FP_REV_tb05_oa.pdf Budget 2019Revenue section
Oil Assumptions
2018-19 2020-21 2021-22 2022-23Actual Budget Forecast Estimate Target Target
Revenue (millions of dollars)Bitumen royalty 3,214 4,682 4,707 3,211 4,492 6,146 Crude oil royalty 1,149 1,163 1,228 1,135 1,267 1,302 Natural gas / by-products royalties 536 362 438 429 597 743
PricesWest Texas Int. (US$/bbl) 62.77 57 58 58 62 63 WCS @ Hardisty (Cdn$/bbl) 51.65 56.60 57.70 51.20 54.50 60.60 Differential (US$/bbl) (23.31) (14.20) (14.70) (19.10) (20.60) (16.40) Ab. Refererence Price (Cdn$/GJ) 1.34 1.30 1.40 1.70 1.80 2.10
Production (thousands of barrels / day)Conventional 489 490 483 488 486 482 Raw bitumen 3,008 3,108 3,109 3,249 3,344 3,417 Natural gas (billions of cubic feet) 4,158 4,108 4,083 4,144 4,199 4,233
Exchange rate(US¢/Cdn$) 76.3 75.0 75.5 76.5 77.0 77.5
2019-20
M:\MinShare\PublnsProd\CorpFin\OBM.PUBLNS-2020-21\B20_Fiscal-Plan_vol\05_REVenue_B20\source-docs\B-20_FP_REVenue_tables.xlsx
2/14/20209:49 PM
Oil and Natural Gas Assumptions
Pdf name: B19-FP_REV_tb07_nrrr.pdf Budget 2019Revenue section
Non-renewable resource revenue(millions of dollars)
2018-19 2020-21 2021-22 2022-23Actual Budget Forecast Estimate Target Target
Bitumen royalty 3,214 4,682 4,707 3,211 4,492 6,146 Crude oil royalty 1,149 1,163 1,228 1,135 1,267 1,302 Natural gas & by-products royalty 536 362 438 429 597 743 Bonuses & sales of Crown leases 360 164 133 177 218 223 Rentals and fees / coal royalty 170 156 164 137 130 122 Total Resource Revenue 5,429 6,527 6,671 5,090 6,705 8,536
2019-20
M:\MinShare\PublnsProd\CorpFin\OBM.PUBLNS-2020-21\B20_Fiscal-Plan_vol\05_REVenue_B20\source-docs\B-20_FP_REVenue_tables.xlsx
2/14/20209:49 PM
Non-Renewable Resource Revenue(millions of dollars)
108 Revenue | Fiscal Plan 2020 – 23
Alberta’s resource revenue royalty structure
The Alberta government has substantial non-renewable resource revenue (NRR), including royalties from bitumen, crude oil, natural gas and by-products and coal, as well as revenue from bonuses and sales of Crown leases, and rentals and fees .
Alberta’s royalty regimes follow a concession system where mineral rights are owned by the Crown . Companies earn the right to explore mineral rights through land sale auctions, and then pay royalties to the Crown for a share of the resulting production . The share is calculated by applying a royalty formula, which is unique to each commodity .
• The generic oil sands royalty regime is based on the revenue of individual projects . The royalty rate is determined by oil prices and whether the project is in pre- or post-payout . Royalty rates are calculated based on the West Texas Intermediate (WTI) oil price expressed in Canadian dollars . An oil sands project reaches payout when its cumulative revenue exceeds its cumulative eligible costs for the first time . Prior to payout, royalties are 1–9 per cent of gross revenue, while after payout, they are the greater of 1–9 per cent of gross revenue or 25– 40 per cent of net revenue .
• Royalties for natural gas and by-products, and conventional oil, are well-based, and are calculated based on two systems: the former Alberta Royalty Framework (ARF), and the current Modernized Royalty Framework (MRF) . Since January 2017, new wells drilled pay under MRF, while most producing wells drilled before then pay under ARF (scheduled to fully transition to MRF by end of 2026) . The MRF regime is a revenue minus cost system similar to the oil sands regime, but with a standardized cost (C*) based on an industry average to drill and complete a well . This benefits companies that reduce costs below the industry average . MRF also has a payout feature where pre-payout wells pay a lower royalty rate which increases once the well has recovered its C* costs .
Three main factors drive royalty revenue: price, cost to produce, and quantity . The exchange rate is also a driver as most commodities are priced in US dollars . Energy prices, like prices for other goods, are determined by supply and demand . The Alberta
government uses information and advice from energy analysts, and compares the forecast with those from investment houses, banks and private forecasters .
• The most important oil prices to Alberta are WTI and Western Canadian Select (WCS) . WTI is the North American price benchmark for light sweet crude oil, which broadly captures global oil pricing trends . WCS is the Western Canadian price benchmark for heavy oil - a heavy Alberta-produced crude composed largely of bitumen blended with diluents . Alberta oil prices trade at a differential to WTI to reflect local market fundamentals, adjustments in quality relative to WTI, and transportation costs .
• The most important natural gas and natural gas liquid prices are: Henry Hub, AECO, Alberta Reference Price (ARP) and natural gas liquid prices . Henry Hub is the US and North American price benchmark for natural gas, while AECO is the Western Canadian price benchmark . ARP is the monthly weighted average field price of all Alberta natural gas sales, and is used to calculate royalties . Natural gas by-product or liquid prices, such as propane, butane, and pentanes plus, closely follow WTI prices but with regional discounts reflecting local supply and demand fundamentals . Alberta natural gas prices have remained depressed and volatile, while natural gas by-product prices have provided some relief to natural gas operators as they follow WTI prices .
Bitumen production and costs are based on project forecasts submitted annually by oil sands operators, and compared with internal and external forecasts for reasonableness . Forecasts for conventional oil and natural gas production use Alberta Energy Regulator estimates, current market trends and industry activity . Costs are based on C* (the industry average) .
All these drivers can impact payout status, affecting royalties dramatically . This is especially the case for bitumen . Changes to project costs or revenue may delay pre-payout projects from reaching post-payout status and paying higher royalties on net revenue, while royalties from post-payout projects could be much lower, especially if they are pushed into paying based on gross revenue .
109Revenue | Fiscal Plan 2020 – 23
Tax RevenueTax revenue is forecast at $22 .9 billion in 2020-21, 46 per cent of total revenue . This is $1 .1 billion, or 4 .9 per cent higher than in 2019-20, with increases of $747 million in personal income tax, $294 million in corporate income tax, $102 million in education property tax and $103 million in other tax revenue . These are offset by a $185 million reduction due to the elimination of the carbon tax on May 30, 2019 . Tax revenue is forecast to increase by an average of 6 .3 per cent for the following two years, reaching $25 .9 billion and 45 per cent of total revenue by 2022-23 . This mainly reflects strong growth in personal and corporate income taxes as revenue recovers from the weakness experienced in 2019-20 . Of the $4 billion increase in tax revenue between 2019-20 and 2022-23, $3 .6 billion, or 89 per cent, is from income taxes .
Personal income tax (PIT) revenue in 2020-21 is estimated at $12 .6 billion, an increase of $747 million, or 6 .3 per cent from 2019-20 . PIT revenue in 2019-20 decreased $171 million from the Budget 2019 estimate after revised 2018 assessment data was lower than expected . This reduces the base used to forecast future years’ PIT revenue (including 2019 and 2020), and lowers the prior-years’ adjustment added to 2019-20 revenue to account for revisions to 2017-18 and 2018-19 revenue already reported in the government’s financial statements . The adjustment included is now down to $17 million .
PIT revenue is forecast to increase by $1 .7 billion, or an average of 6 .7 per cent per year between 2020-21 and 2022-23, to $14 .3 billion, from improving employment and household income growth . This forecast includes the impact of pausing indexation of tax brackets and credits, and elimination of the tuition and education tax credits .
Corporate income tax (CIT) is forecast at $4 .5 billion in 2020-21, an increase of $294 million or 7 per cent from 2019-20 . Based on improving oil prices, expanding oil production, achievement of market access, as well as growth in manufacturing and exports and rising economic activity, CIT is forecast to grow to $5 .4 billion by 2022-23, with average growth of 8 .7 per cent between 2020-21 and 2022-23 .
The CIT forecast includes the impact of the rate reduction from 12 per cent to 11 per cent in 2019-20, to 10 per cent, effective January 1, 2020, and then two further annual reductions on January 1 of 2021 and 2022, to 8 per cent . The resulting economic impact expands the corporate tax base and boosts other revenue, primarily personal income tax . The forecast also reflects the elimination of several tax credits, as Alberta moves back to broad-based, low-rate tax policy . More details on the impact of the Job Creation Tax Cut and broad-based, low-rate tax policy are described in the Tax Plan on pages 170-173 . The CIT forecast also includes the impact of enhancements to capital cost allowances that became effective in 2019-20, reducing revenue by an estimated $370 million that year, and then by diminishing amounts moving forward, with an estimate of $240 million by 2022-23 . Taken together, these changes improve competitiveness and attract investment by reducing the cost of doing business in Alberta, as suggested by the MacKinnon Panel .
Tax revenue in 2020-21 estimated at $22.9 billion, and forecast to reach $25.9 billion by 2022-23.
Corporate income tax rate reduction increases competitiveness and attracts investment, as recommended by MacKinnon Panel.
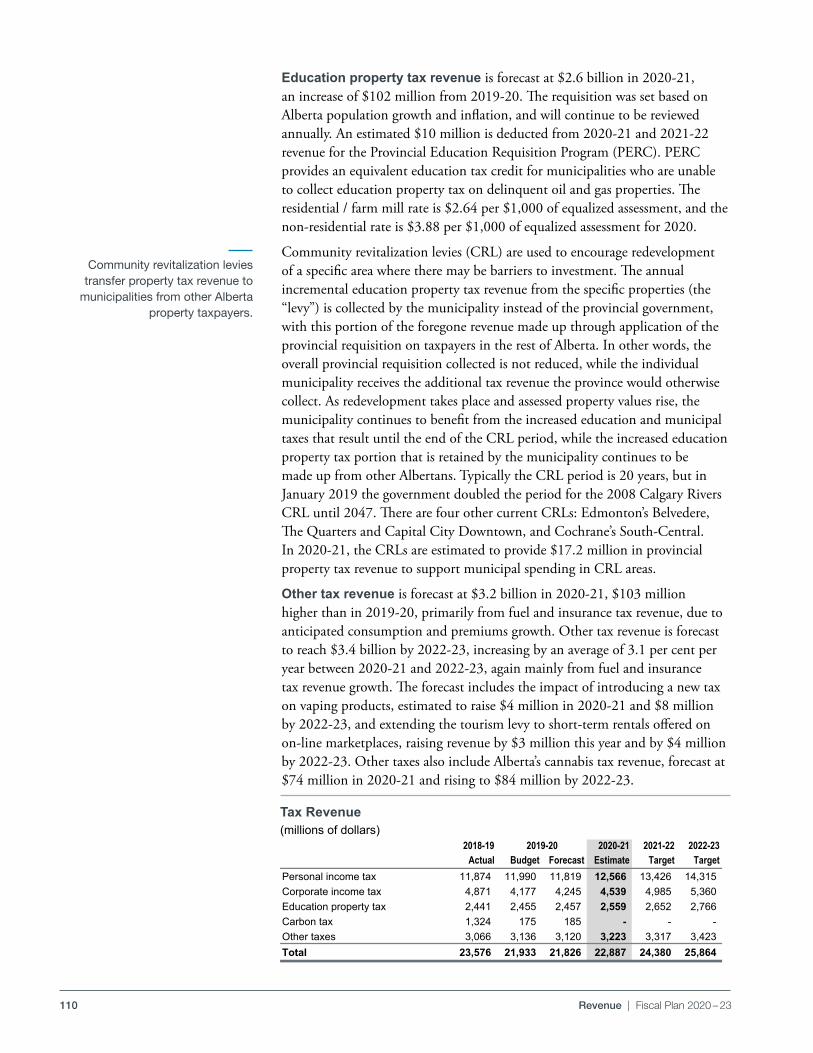
110 Revenue | Fiscal Plan 2020 – 23
Education property tax revenue is forecast at $2 .6 billion in 2020-21, an increase of $102 million from 2019-20 . The requisition was set based on Alberta population growth and inflation, and will continue to be reviewed annually . An estimated $10 million is deducted from 2020-21 and 2021-22 revenue for the Provincial Education Requisition Program (PERC) . PERC provides an equivalent education tax credit for municipalities who are unable to collect education property tax on delinquent oil and gas properties . The residential / farm mill rate is $2 .64 per $1,000 of equalized assessment, and the non-residential rate is $3 .88 per $1,000 of equalized assessment for 2020 .
Community revitalization levies (CRL) are used to encourage redevelopment of a specific area where there may be barriers to investment . The annual incremental education property tax revenue from the specific properties (the “levy”) is collected by the municipality instead of the provincial government, with this portion of the foregone revenue made up through application of the provincial requisition on taxpayers in the rest of Alberta . In other words, the overall provincial requisition collected is not reduced, while the individual municipality receives the additional tax revenue the province would otherwise collect . As redevelopment takes place and assessed property values rise, the municipality continues to benefit from the increased education and municipal taxes that result until the end of the CRL period, while the increased education property tax portion that is retained by the municipality continues to be made up from other Albertans . Typically the CRL period is 20 years, but in January 2019 the government doubled the period for the 2008 Calgary Rivers CRL until 2047 . There are four other current CRLs: Edmonton’s Belvedere, The Quarters and Capital City Downtown, and Cochrane’s South-Central . In 2020-21, the CRLs are estimated to provide $17 .2 million in provincial property tax revenue to support municipal spending in CRL areas .
Other tax revenue is forecast at $3 .2 billion in 2020-21, $103 million higher than in 2019-20, primarily from fuel and insurance tax revenue, due to anticipated consumption and premiums growth . Other tax revenue is forecast to reach $3 .4 billion by 2022-23, increasing by an average of 3 .1 per cent per year between 2020-21 and 2022-23, again mainly from fuel and insurance tax revenue growth . The forecast includes the impact of introducing a new tax on vaping products, estimated to raise $4 million in 2020-21 and $8 million by 2022-23, and extending the tourism levy to short-term rentals offered on on-line marketplaces, raising revenue by $3 million this year and by $4 million by 2022-23 . Other taxes also include Alberta’s cannabis tax revenue, forecast at $74 million in 2020-21 and rising to $84 million by 2022-23 .
Community revitalization levies transfer property tax revenue to
municipalities from other Alberta property taxpayers.
Pdf name: B19-FP_REV_tb10_tr.pdf Budget 2019Revenue section
Tax Revenue(millions of dollars)
2018-19 2020-21 2021-22 2022-23Actual Budget Forecast Estimate Target Target
Personal income tax 11,874 11,990 11,819 12,566 13,426 14,315 Corporate income tax 4,871 4,177 4,245 4,539 4,985 5,360 Education property tax 2,441 2,455 2,457 2,559 2,652 2,766 Carbon tax 1,324 175 185 - - - Other taxes 3,066 3,136 3,120 3,223 3,317 3,423 Total 23,576 21,933 21,826 22,887 24,380 25,864
2019-20
M:\MinShare\PublnsProd\CorpFin\OBM.PUBLNS-2020-21\B20_Fiscal-Plan_vol\05_REVenue_B20\source-docs\B-20_FP_REVenue_tables.xlsx
2/13/20209:57 PM
Tax Revenue(millions of dollars)
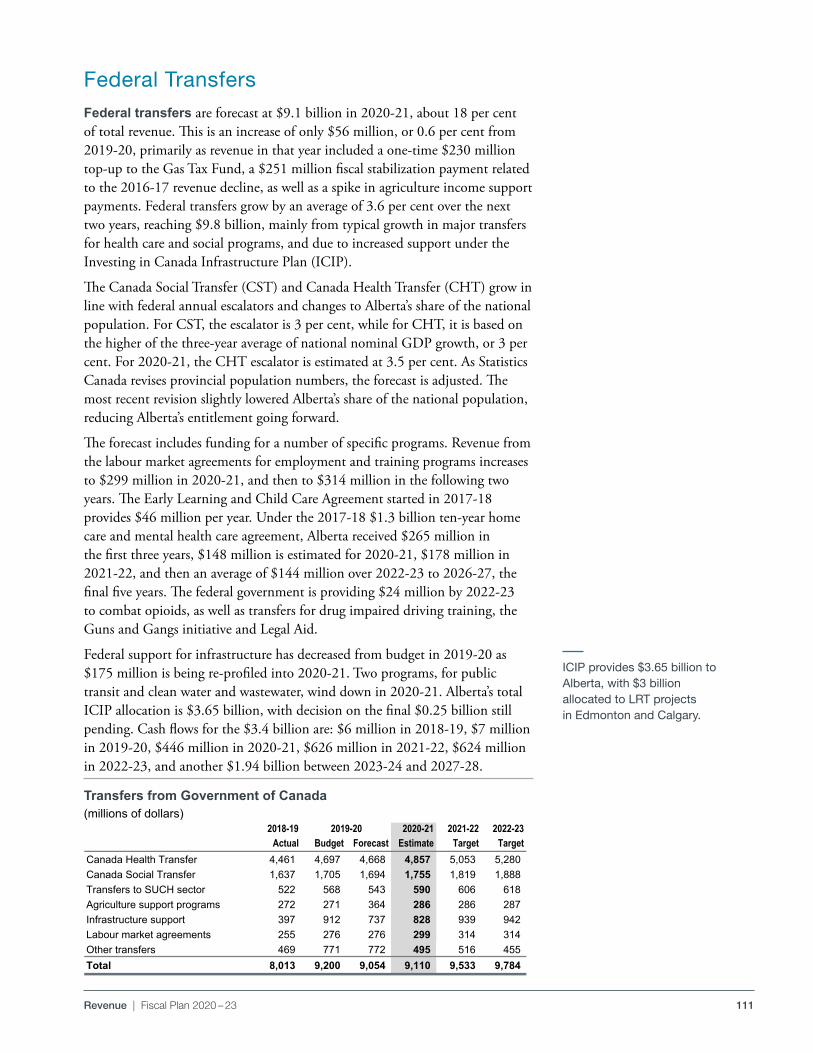
111Revenue | Fiscal Plan 2020 – 23
Federal TransfersFederal transfers are forecast at $9 .1 billion in 2020-21, about 18 per cent of total revenue . This is an increase of only $56 million, or 0 .6 per cent from 2019-20, primarily as revenue in that year included a one-time $230 million top-up to the Gas Tax Fund, a $251 million fiscal stabilization payment related to the 2016-17 revenue decline, as well as a spike in agriculture income support payments . Federal transfers grow by an average of 3 .6 per cent over the next two years, reaching $9 .8 billion, mainly from typical growth in major transfers for health care and social programs, and due to increased support under the Investing in Canada Infrastructure Plan (ICIP) .
The Canada Social Transfer (CST) and Canada Health Transfer (CHT) grow in line with federal annual escalators and changes to Alberta’s share of the national population . For CST, the escalator is 3 per cent, while for CHT, it is based on the higher of the three-year average of national nominal GDP growth, or 3 per cent . For 2020-21, the CHT escalator is estimated at 3 .5 per cent . As Statistics Canada revises provincial population numbers, the forecast is adjusted . The most recent revision slightly lowered Alberta’s share of the national population, reducing Alberta’s entitlement going forward .
The forecast includes funding for a number of specific programs . Revenue from the labour market agreements for employment and training programs increases to $299 million in 2020-21, and then to $314 million in the following two years . The Early Learning and Child Care Agreement started in 2017-18 provides $46 million per year . Under the 2017-18 $1 .3 billion ten-year home care and mental health care agreement, Alberta received $265 million in the first three years, $148 million is estimated for 2020-21, $178 million in 2021-22, and then an average of $144 million over 2022-23 to 2026-27, the final five years . The federal government is providing $24 million by 2022-23 to combat opioids, as well as transfers for drug impaired driving training, the Guns and Gangs initiative and Legal Aid .
Federal support for infrastructure has decreased from budget in 2019-20 as $175 million is being re-profiled into 2020-21 . Two programs, for public transit and clean water and wastewater, wind down in 2020-21 . Alberta’s total ICIP allocation is $3 .65 billion, with decision on the final $0 .25 billion still pending . Cash flows for the $3 .4 billion are: $6 million in 2018-19, $7 million in 2019-20, $446 million in 2020-21, $626 million in 2021-22, $624 million in 2022-23, and another $1 .94 billion between 2023-24 and 2027-28 .
ICIP provides $3.65 billion to Alberta, with $3 billion allocated to LRT projects in Edmonton and Calgary.
Pdf name: B19-FP_Rev_tb11_tfgoc.pdf Budget 2019Revenue section
Transfers from Government of Canada(millions of dollars)
2018-19 2020-21 2021-22 2022-23Actual Budget Forecast Estimate Target Target
Canada Health Transfer 4,461 4,697 4,668 4,857 5,053 5,280 Canada Social Transfer 1,637 1,705 1,694 1,755 1,819 1,888 Transfers to SUCH sector 522 568 543 590 606 618 Agriculture support programs 272 271 364 286 286 287 Infrastructure support 397 912 737 828 939 942 Labour market agreements 255 276 276 299 314 314 Other transfers 469 771 772 495 516 455 Total 8,013 9,200 9,054 9,110 9,533 9,784
2019-20
M:\MinShare\PublnsProd\CorpFin\OBM.PUBLNS-2020-21\B20_Fiscal-Plan_vol\05_REVenue_B20\source-docs\B-20_FP_REVenue_tables.xlsx
2/16/20209:44 PM
Transfers from Government of Canada(millions of dollars)
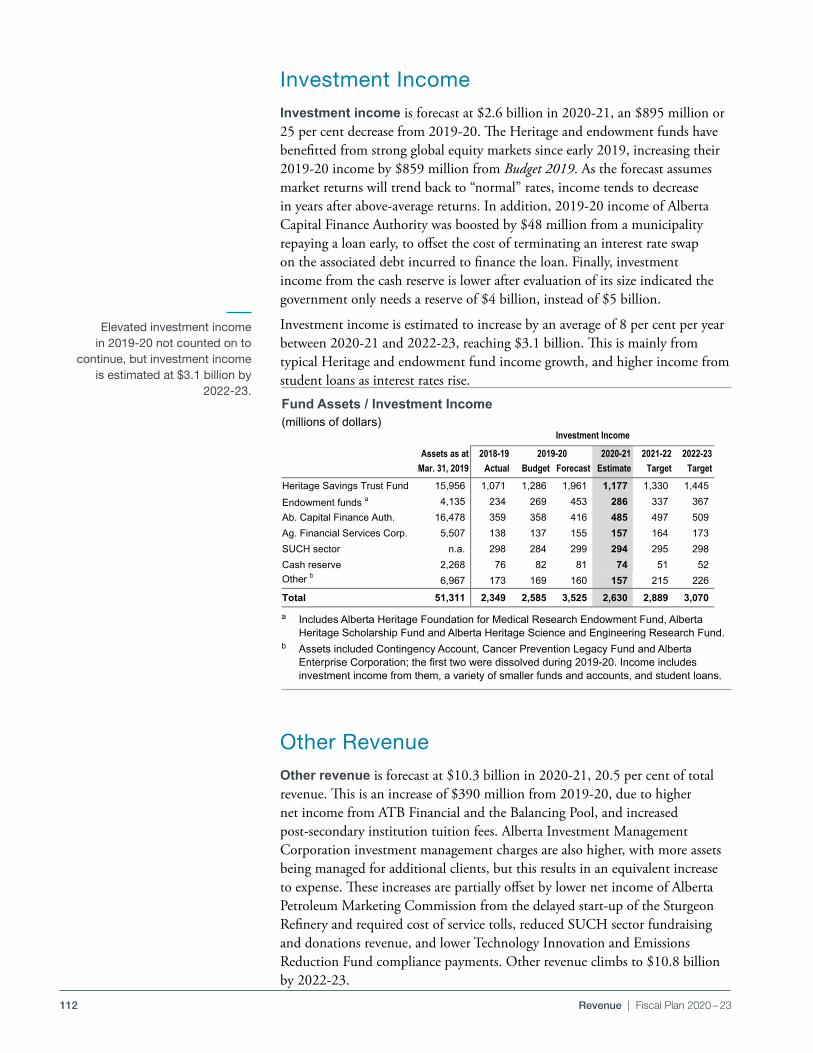
112 Revenue | Fiscal Plan 2020 – 23
Investment IncomeInvestment income is forecast at $2 .6 billion in 2020-21, an $895 million or 25 per cent decrease from 2019-20 . The Heritage and endowment funds have benefitted from strong global equity markets since early 2019, increasing their 2019-20 income by $859 million from Budget 2019 . As the forecast assumes market returns will trend back to “normal” rates, income tends to decrease in years after above-average returns . In addition, 2019-20 income of Alberta Capital Finance Authority was boosted by $48 million from a municipality repaying a loan early, to offset the cost of terminating an interest rate swap on the associated debt incurred to finance the loan . Finally, investment income from the cash reserve is lower after evaluation of its size indicated the government only needs a reserve of $4 billion, instead of $5 billion .
Investment income is estimated to increase by an average of 8 per cent per year between 2020-21 and 2022-23, reaching $3 .1 billion . This is mainly from typical Heritage and endowment fund income growth, and higher income from student loans as interest rates rise .
Other RevenueOther revenue is forecast at $10 .3 billion in 2020-21, 20 .5 per cent of total revenue . This is an increase of $390 million from 2019-20, due to higher net income from ATB Financial and the Balancing Pool, and increased post-secondary institution tuition fees . Alberta Investment Management Corporation investment management charges are also higher, with more assets being managed for additional clients, but this results in an equivalent increase to expense . These increases are partially offset by lower net income of Alberta Petroleum Marketing Commission from the delayed start-up of the Sturgeon Refinery and required cost of service tolls, reduced SUCH sector fundraising and donations revenue, and lower Technology Innovation and Emissions Reduction Fund compliance payments . Other revenue climbs to $10 .8 billion by 2022-23 .
Elevated investment income in 2019-20 not counted on to
continue, but investment income is estimated at $3.1 billion by
2022-23.
Pdf name: B19-FP_Rev_tb12_faii.pdf Budget 2019Revenue section
Fund Assets/Investment Income(millions of dollars)
Assets as at 2018-19 2020-21 2021-22 2022-23Mar. 31, 2019 Actual Budget Forecast Estimate Target Target
Heritage Savings Trust Fund 15,956 1,071 1,286 1,961 1,177 1,330 1,445 Endowment funds a 4,135 234 269 453 286 337 367 Ab. Capital Finance Auth. 16,478 359 358 416 485 497 509 Ag. Financial Services Corp. 5,507 138 137 155 157 164 173 SUCH sector n.a. 298 284 299 294 295 298 Cash reserve 2,268 76 82 81 74 51 52 Other b 6,967 173 169 160 157 215 226
Total 51,311 2,349 2,585 3,525 2,630 2,889 3,070
2019-20
Investment Income
S:\TBF\MinShare\PublnsProd\CorpFin\OBM.PUBLNS-2020-21\B20_Fiscal-Plan_vol\05_REVenue_B20\source-docs\B-20_FP_REVenue_tables
2/17/2020 3:29 PM
a Includes Alberta Heritage Foundation for Medical Research Endowment Fund, Alberta Heritage Scholarship Fund and Alberta Heritage Science and Engineering Research Fund.
b Assets included Contingency Account, Cancer Prevention Legacy Fund and Alberta Enterprise Corporation; the first two were dissolved during 2019-20. Income includes investment income from them, a variety of smaller funds and accounts, and student loans.
Fund Assets / Investment Income(millions of dollars)
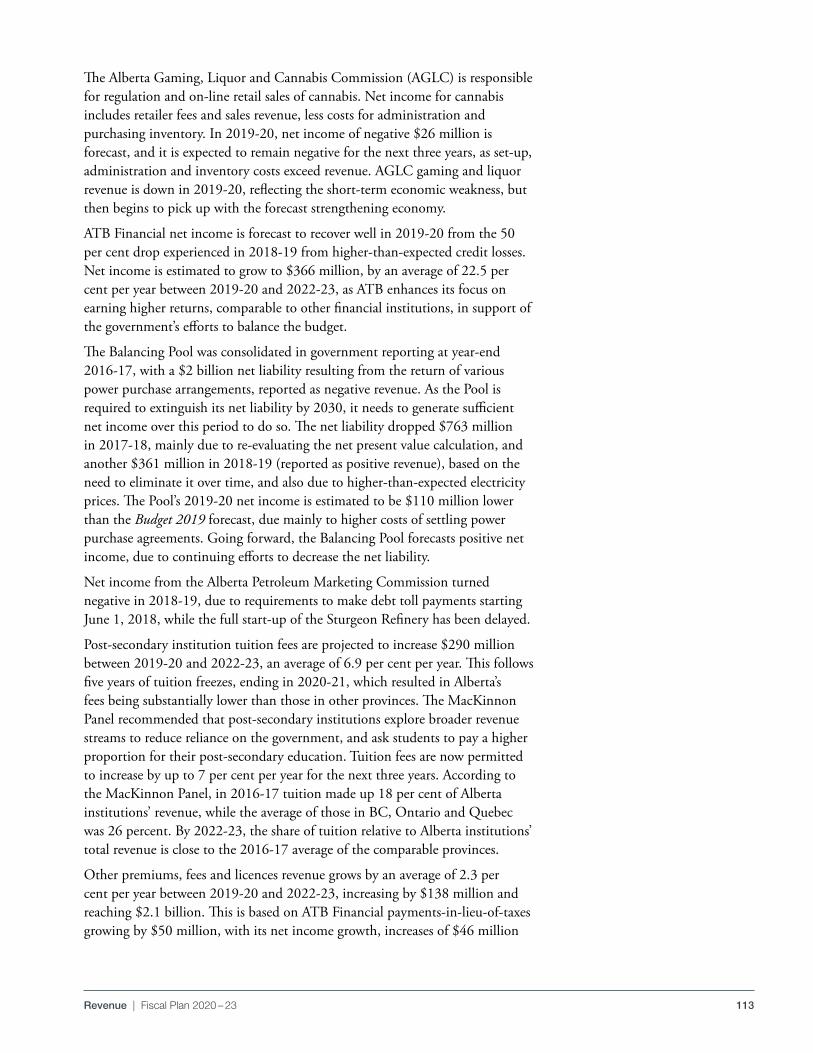
113Revenue | Fiscal Plan 2020 – 23
The Alberta Gaming, Liquor and Cannabis Commission (AGLC) is responsible for regulation and on-line retail sales of cannabis . Net income for cannabis includes retailer fees and sales revenue, less costs for administration and purchasing inventory . In 2019-20, net income of negative $26 million is forecast, and it is expected to remain negative for the next three years, as set-up, administration and inventory costs exceed revenue . AGLC gaming and liquor revenue is down in 2019-20, reflecting the short-term economic weakness, but then begins to pick up with the forecast strengthening economy .
ATB Financial net income is forecast to recover well in 2019-20 from the 50 per cent drop experienced in 2018-19 from higher-than-expected credit losses . Net income is estimated to grow to $366 million, by an average of 22 .5 per cent per year between 2019-20 and 2022-23, as ATB enhances its focus on earning higher returns, comparable to other financial institutions, in support of the government’s efforts to balance the budget .
The Balancing Pool was consolidated in government reporting at year-end 2016-17, with a $2 billion net liability resulting from the return of various power purchase arrangements, reported as negative revenue . As the Pool is required to extinguish its net liability by 2030, it needs to generate sufficient net income over this period to do so . The net liability dropped $763 million in 2017-18, mainly due to re-evaluating the net present value calculation, and another $361 million in 2018-19 (reported as positive revenue), based on the need to eliminate it over time, and also due to higher-than-expected electricity prices . The Pool’s 2019-20 net income is estimated to be $110 million lower than the Budget 2019 forecast, due mainly to higher costs of settling power purchase agreements . Going forward, the Balancing Pool forecasts positive net income, due to continuing efforts to decrease the net liability .
Net income from the Alberta Petroleum Marketing Commission turned negative in 2018-19, due to requirements to make debt toll payments starting June 1, 2018, while the full start-up of the Sturgeon Refinery has been delayed .
Post-secondary institution tuition fees are projected to increase $290 million between 2019-20 and 2022-23, an average of 6 .9 per cent per year . This follows five years of tuition freezes, ending in 2020-21, which resulted in Alberta’s fees being substantially lower than those in other provinces . The MacKinnon Panel recommended that post-secondary institutions explore broader revenue streams to reduce reliance on the government, and ask students to pay a higher proportion for their post-secondary education . Tuition fees are now permitted to increase by up to 7 per cent per year for the next three years . According to the MacKinnon Panel, in 2016-17 tuition made up 18 per cent of Alberta institutions’ revenue, while the average of those in BC, Ontario and Quebec was 26 percent . By 2022-23, the share of tuition relative to Alberta institutions’ total revenue is close to the 2016-17 average of the comparable provinces .
Other premiums, fees and licences revenue grows by an average of 2 .3 per cent per year between 2019-20 and 2022-23, increasing by $138 million and reaching $2 .1 billion . This is based on ATB Financial payments-in-lieu-of-taxes growing by $50 million, with its net income growth, increases of $46 million
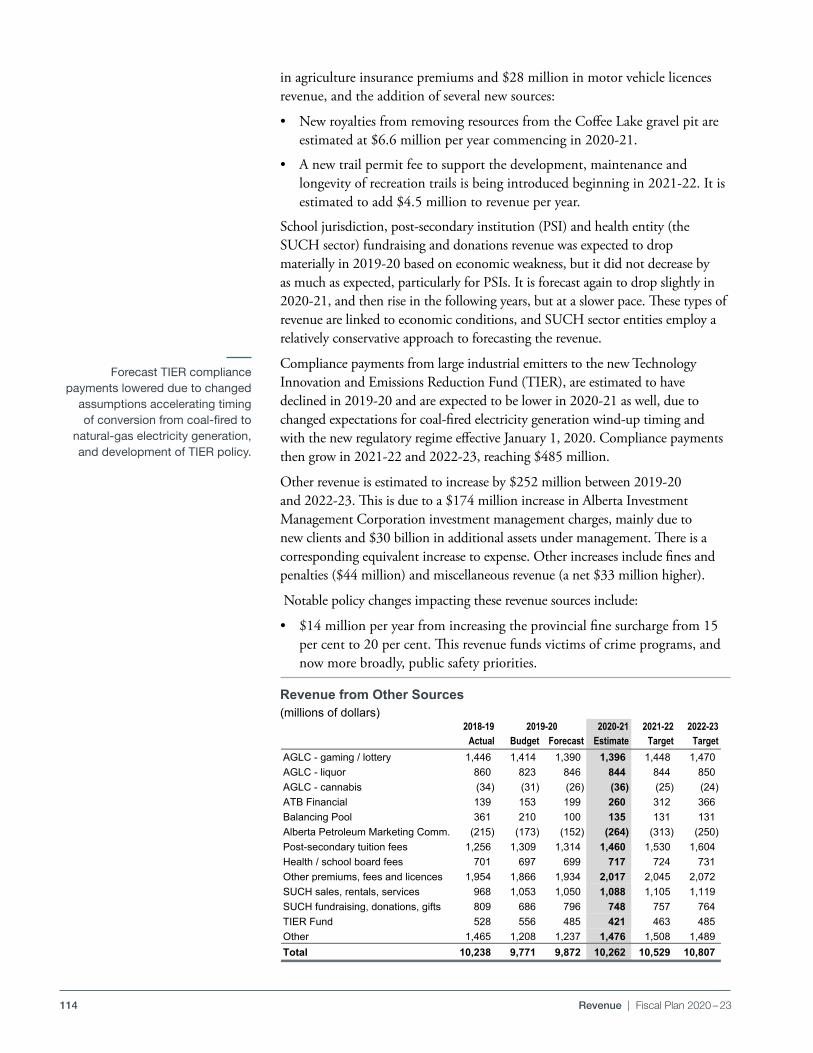
114 Revenue | Fiscal Plan 2020 – 23
in agriculture insurance premiums and $28 million in motor vehicle licences revenue, and the addition of several new sources:
• New royalties from removing resources from the Coffee Lake gravel pit are estimated at $6 .6 million per year commencing in 2020-21 .
• A new trail permit fee to support the development, maintenance and longevity of recreation trails is being introduced beginning in 2021-22 . It is estimated to add $4 .5 million to revenue per year .
School jurisdiction, post-secondary institution (PSI) and health entity (the SUCH sector) fundraising and donations revenue was expected to drop materially in 2019-20 based on economic weakness, but it did not decrease by as much as expected, particularly for PSIs . It is forecast again to drop slightly in 2020-21, and then rise in the following years, but at a slower pace . These types of revenue are linked to economic conditions, and SUCH sector entities employ a relatively conservative approach to forecasting the revenue .
Compliance payments from large industrial emitters to the new Technology Innovation and Emissions Reduction Fund (TIER), are estimated to have declined in 2019-20 and are expected to be lower in 2020-21 as well, due to changed expectations for coal-fired electricity generation wind-up timing and with the new regulatory regime effective January 1, 2020 . Compliance payments then grow in 2021-22 and 2022-23, reaching $485 million .
Other revenue is estimated to increase by $252 million between 2019-20 and 2022-23 . This is due to a $174 million increase in Alberta Investment Management Corporation investment management charges, mainly due to new clients and $30 billion in additional assets under management . There is a corresponding equivalent increase to expense . Other increases include fines and penalties ($44 million) and miscellaneous revenue (a net $33 million higher) .
Notable policy changes impacting these revenue sources include:
• $14 million per year from increasing the provincial fine surcharge from 15 per cent to 20 per cent . This revenue funds victims of crime programs, and now more broadly, public safety priorities .
Forecast TIER compliance payments lowered due to changed
assumptions accelerating timing of conversion from coal-fired to
natural-gas electricity generation, and development of TIER policy.
Pdf name: B19-FP_Rev_tb13_rfos.pdf Budget 2019Revenue section
Revenue from Other Sources(millions of dollars)
2018-19 2020-21 2021-22 2022-23Actual Budget Forecast Estimate Target Target
AGLC - gaming / lottery 1,446 1,414 1,390 1,396 1,448 1,470 AGLC - liquor 860 823 846 844 844 850 AGLC - cannabis (34) (31) (26) (36) (25) (24) ATB Financial 139 153 199 260 312 366 Balancing Pool 361 210 100 135 131 131 Alberta Petroleum Marketing Comm. (215) (173) (152) (264) (313) (250) Post-secondary tuition fees 1,256 1,309 1,314 1,460 1,530 1,604 Health / school board fees 701 697 699 717 724 731 Other premiums, fees and licences 1,954 1,866 1,934 2,017 2,045 2,072 SUCH sales, rentals, services 968 1,053 1,050 1,088 1,105 1,119 SUCH fundraising, donations, gifts 809 686 796 748 757 764 TIER Fund 528 556 485 421 463 485 Other 1,465 1,208 1,237 1,476 1,508 1,489 Total 10,238 9,771 9,872 10,262 10,529 10,807
2019-20
M:\MinShare\PublnsProd\CorpFin\OBM.PUBLNS-2020-21\B20_Fiscal-Plan_vol\05_REVenue_B20\source-docs\B-20_FP_REVenue_tables.xlsx
2/16/20209:50 PM
Revenue from Other Sources(millions of dollars)
115Revenue | Fiscal Plan 2020 – 23
• $22 million in 2020-21, growing to $45 million by 2022-23, from municipalities for policing costs .
• $23 million increase for a new dedicated revenue for caribou recovery, funded by the Canadian Association of Petroleum Producers, Environment Climate Change Canada and Encana .
RisksAlberta relies heavily on revenue that is volatile and unpredictable, including non-renewable resource revenue, corporate income tax and investment income . Since 2004-05, these have accounted for up to 55 per cent of total revenue, but in 2020-21 they are estimated at only 25 per cent . This revenue is linked to factors such as energy prices, equity markets, exchange and interest rates, geopolitical events, global economic swings and weather, which are all uncertain and can fluctuate rapidly . The corporate income tax and resource revenue decline relative to 2014-15 was directly tied to the oil price collapse . This large revenue uncertainty means the Alberta government must assess the degree of risk associated with its revenue outlook and spending decisions .
For example, under a “no market access” scenario, described on pages 71-73 of the Economic Outlook, in which the three expected pipelines (Enbridge Line 3, Trans Mountain expansion and Keystone XL) are permanently cancelled, income tax and resource revenue would be $2 .5 billion lower by 2022-23 . This is due to the higher transportation costs bitumen producers would face and, in turn, lower prices they would receive . Transportation by rail adds US$7–9 per barrel to costs, and the light-heavy oil price differential would climb to US$21 .70 per barrel instead of the US$16 .40 per barrel that the Budget 2020 forecast is based on . As a result, investment and employment in Alberta would suffer . By 2023, production would be about 60,000 barrels per day less, and the economy would be significantly impacted, with real GDP $10 .4 billion lower .
The MacKinnon Panel recommended the government adopt a Revenue Forecast Allowance equal to 0 .75 per cent of total revenue, once the budget is balanced in 2022-23, growing to 1 .25 per cent of revenue over the following three years . Budget 2019 implemented this recommendation . An allowance of $450 million must be deducted prior to the balanced budget calculation .
Global and US Economies
• Budget 2020 assumes global economic expansion of 3 .3 per cent in 2020,rising to 3 .4 per cent in 2021 . Growth in China continues to decelerate,and trade disputes and other issues have slowed economic activity in manyeconomies . Substantial risks remain . Weaker-than-forecast global growthwould harm Alberta’s revenue forecast, as oil prices would remain lower forlonger .
New dedicated revenue for caribou recovery.
No market access scenario reduces revenue by $2.5 billion in 2022-23.
Revenue Forecast Allowance of $450 million included in 2022-23 bottom line, as recommended by MacKinnon Panel.
116 Revenue | Fiscal Plan 2020 – 23
Energy Prices
• The WTI oil price is forecast to average US$58/bbl in 2020-21, and then rise to $63 by 2022-23 . These prices are in line with the average of energy analysts surveyed by the government .
• Price forecasts depend on an array of assumptions about demand and supply . Factors influencing demand include economic growth in disparate regions around the world, from the U .S . to China to Europe, pipeline or refinery outages, and storage and speculative market activities by traders . On the supply side, the level and duration of compliance with the agreement to cut production by OPEC and several non-OPEC members is critical, as has been the response to higher prices by the U .S . industry . Other factors include investment and drilling decisions by other producers, geopolitical events, civil unrest or terrorist strikes, economic sanctions, or simple weather-related production disruptions .
• Without sufficient pipeline capacity, Alberta’s growing bitumen production has to be transported by more costly rail, increasing the light-heavy differential, lowering prices for producers and government revenue .
• Natural gas prices remain weak due mainly to increasing production of U .S . shale gas that has outstripped demand growth .
Interest Rates
• Interest rates bumped up during the last year, and are forecast to rise very gradually over the next several years . Lower rates generally help government investment income . While short-term investments perform poorly, the market value of bonds with higher rates held in endowment portfolios increase . Lower rates also typically encourage business investment, economic activity and consumer spending, all providing economic support to Alberta’s resource-based economy .
• Rising rates pose risks for indebted households, consumer spending and the government . Substantial borrowing is planned, and higher rates make borrowing or refinancing of debt more expensive .
Exchange Rates
• The US-Canadian dollar exchange rate is forecast to average 75 .5US¢/Cdn$ in 2019-20, and then rise to 77 .5US¢/Cdn$ in 2022-23 . It was 76 .3US¢/Cdn$ in 2018-19 .
• A stronger Canadian dollar decreases the value of oil exports and the demand for exports priced in Canadian dollars . Changes in the exchange rate affect the profitability of energy producers, which can affect investment and government resource revenue as energy prices and contracts are mainly in US dollars . Investment income is also impacted due to significant foreign holdings in the Heritage Savings Trust Fund and endowment funds .
Stronger Canadian dollar reduces Government of Alberta revenue.
Without sufficient pipeline capacity, Alberta producers face
higher transportation costs, lowering prices they receive.
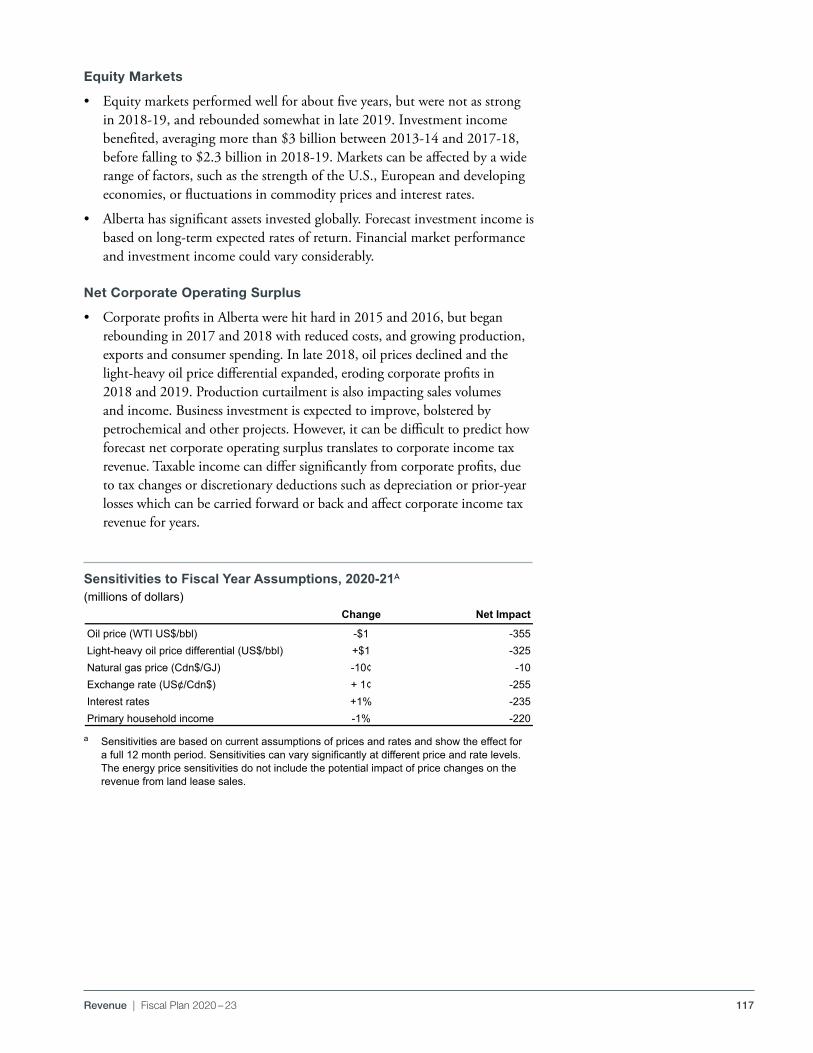
117Revenue | Fiscal Plan 2020 – 23
Equity Markets
• Equity markets performed well for about five years, but were not as strong in 2018-19, and rebounded somewhat in late 2019 . Investment income benefited, averaging more than $3 billion between 2013-14 and 2017-18, before falling to $2 .3 billion in 2018-19 . Markets can be affected by a wide range of factors, such as the strength of the U .S ., European and developing economies, or fluctuations in commodity prices and interest rates .
• Alberta has significant assets invested globally . Forecast investment income is based on long-term expected rates of return . Financial market performance and investment income could vary considerably .
Net Corporate Operating Surplus
• Corporate profits in Alberta were hit hard in 2015 and 2016, but began rebounding in 2017 and 2018 with reduced costs, and growing production, exports and consumer spending . In late 2018, oil prices declined and the light-heavy oil price differential expanded, eroding corporate profits in 2018 and 2019 . Production curtailment is also impacting sales volumes and income . Business investment is expected to improve, bolstered by petrochemical and other projects . However, it can be difficult to predict how forecast net corporate operating surplus translates to corporate income tax revenue . Taxable income can differ significantly from corporate profits, due to tax changes or discretionary deductions such as depreciation or prior-year losses which can be carried forward or back and affect corporate income tax revenue for years .
a Sensitivities are based on current assumptions of prices and rates and show the effect for a full 12 month period. Sensitivities can vary significantly at different price and rate levels. The energy price sensitivities do not include the potential impact of price changes on the revenue from land lease sales.
Pdf name: B19-FP_REV_tb14_sfya.pdf Budget 2019Revenue section
(millions of dollars)
Change Net Impact
Oil price (WTI US$/bbl) -$1 -355Light-heavy oil price differential (US$/bbl) +$1 -325Natural gas price (Cdn$/GJ) -10¢ -10Exchange rate (US¢/Cdn$) + 1¢ -255Interest rates +1% -235Primary household income -1% -220
Sensitivities to Fiscal Year Assumptions, 2020-21a
M:\MinShare\PublnsProd\CorpFin\OBM.PUBLNS-2020-21\B20_Fiscal-Plan_vol\05_REVenue_B20\source-docs\B-20_FP_REVenue_tables.xlsx
2/13/202010:17 PM
Sensitivities to Fiscal Year Assumptions, 2020-21A
(millions of dollars)

118 Revenue | Fiscal Plan 2020 – 23
119
BUDGET 2020
GOVERNMENT OF ALBERTA | 2020 –23
Fiscal PlanExpense
120 Expense | Fiscal Plan 2020 – 23
Table of Contents
Expense . . . . . . . . . . . . . . . . . . . . . . . . . . . . . . . . . . . . . . . . . . . . . . . . . . . . . . . . . . . . . . . . . . . . . . . . . . . . . . 121
Disciplined And Prudent Spending . . . . . . . . . . . . . . . . . . . . . . . . . . . . . . . . . . . . . . . . . . . . . . . . . . . . . . . . . 121
Health . . . . . . . . . . . . . . . . . . . . . . . . . . . . . . . . . . . . . . . . . . . . . . . . . . . . . . . . . . . . . . . . . . . . . . . . . . . . . . . 124
Kindergarten to Post-Secondary Education . . . . . . . . . . . . . . . . . . . . . . . . . . . . . . . . . . . . . . . . . . . . . . . . . . . 127
Social Services . . . . . . . . . . . . . . . . . . . . . . . . . . . . . . . . . . . . . . . . . . . . . . . . . . . . . . . . . . . . . . . . . . . . . . . . . 131
Community and Social Services . . . . . . . . . . . . . . . . . . . . . . . . . . . . . . . . . . . . . . . . . . . . . . . . . . . . . . . . . . . 132
Seniors and Housing . . . . . . . . . . . . . . . . . . . . . . . . . . . . . . . . . . . . . . . . . . . . . . . . . . . . . . . . . . . . . . . . . . . . 134
Justice and Solicitor General . . . . . . . . . . . . . . . . . . . . . . . . . . . . . . . . . . . . . . . . . . . . . . . . . . . . . . . . . . . . . . . 136
Resource Management and Economic Development . . . . . . . . . . . . . . . . . . . . . . . . . . . . . . . . . . . . . . . . . . . . 137
Environment, Regional Planning and Development . . . . . . . . . . . . . . . . . . . . . . . . . . . . . . . . . . . . . . . . . . . . 139
General Government . . . . . . . . . . . . . . . . . . . . . . . . . . . . . . . . . . . . . . . . . . . . . . . . . . . . . . . . . . . . . . . . . . . . 141
Public Sector Compensation . . . . . . . . . . . . . . . . . . . . . . . . . . . . . . . . . . . . . . . . . . . . . . . . . . . . . . . . . . . . . . 142
Streamlining Government Processes . . . . . . . . . . . . . . . . . . . . . . . . . . . . . . . . . . . . . . . . . . . . . . . . . . . . . . . . . 144
Note: Amounts presented in tables may not add to totals due to rounding.
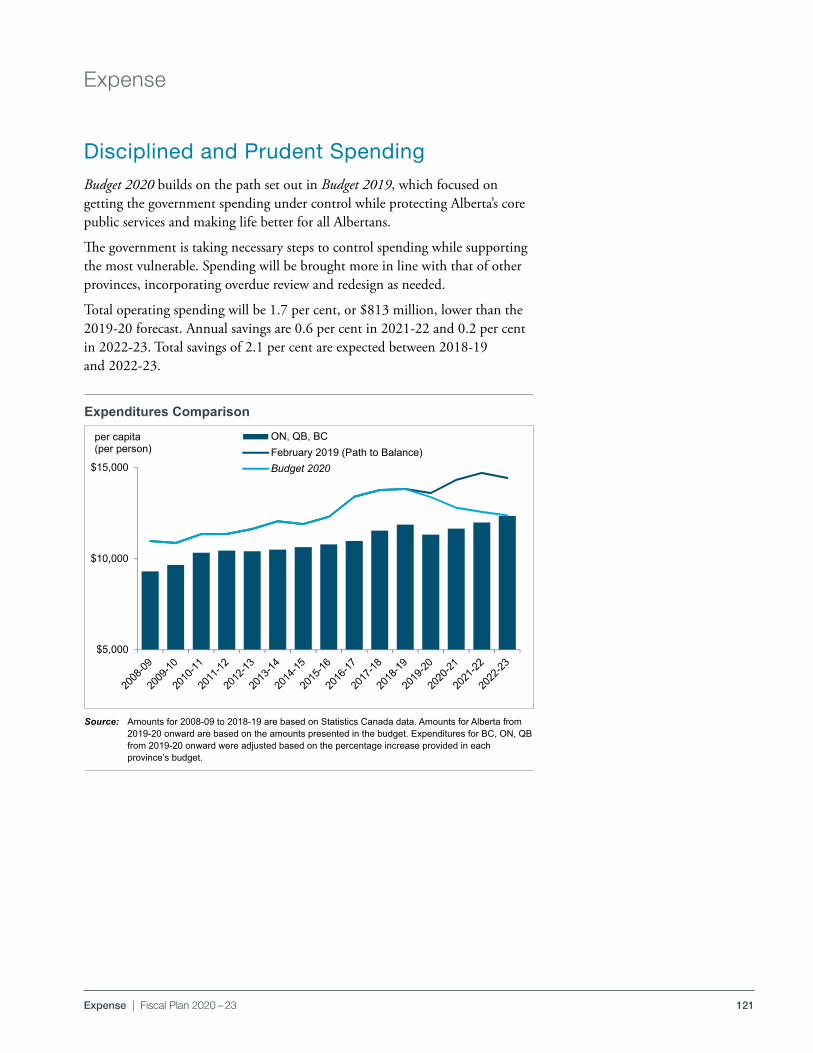
121Expense | Fiscal Plan 2020 – 23
Expense
Disciplined and Prudent SpendingBudget 2020 builds on the path set out in Budget 2019, which focused on getting the government spending under control while protecting Alberta’s core public services and making life better for all Albertans .
The government is taking necessary steps to control spending while supporting the most vulnerable . Spending will be brought more in line with that of other provinces, incorporating overdue review and redesign as needed .
Total operating spending will be 1 .7 per cent, or $813 million, lower than the 2019-20 forecast . Annual savings are 0 .6 per cent in 2021-22 and 0 .2 per cent in 2022-23 . Total savings of 2 .1 per cent are expected between 2018-19 and 2022-23 .
pdf named: B20_FP_OVW_kfm_tb.pdf Budget 2020Overview Section
Expense Comparison
pdf named: B20_FP_OVW_exp.pdf
$5,000
$10,000
$15,000
per capita (per person)
ON, QB, BCFebruary 2019 (Path to Balance)Budget 2020
S:\TBF\MinShare\PublnsProd\CorpFin\OBM.PUBLNS-2020-21\B20_Fiscal-Plan_vol\06_EXPense_B20\source-docs\All overview tables/ Expense per capita Last update: 2/14/2020 /6:10 PM
Expenditures Comparison
Source: Amounts for 2008-09 to 2018-19 are based on Statistics Canada data. Amounts for Alberta from 2019-20 onward are based on the amounts presented in the budget. Expenditures for BC, ON, QB from 2019-20 onward were adjusted based on the percentage increase provided in each province’s budget.
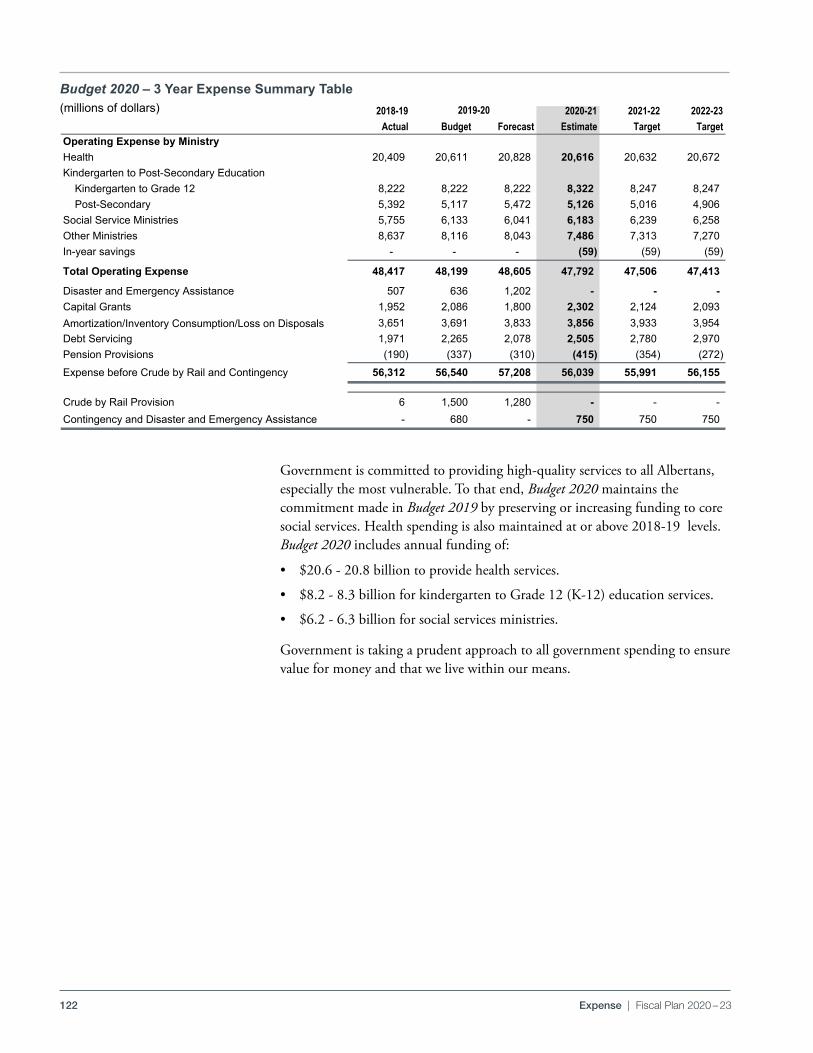
122 Expense | Fiscal Plan 2020 – 23
Government is committed to providing high-quality services to all Albertans, especially the most vulnerable . To that end, Budget 2020 maintains the commitment made in Budget 2019 by preserving or increasing funding to core social services . Health spending is also maintained at or above 2018-19 levels . Budget 2020 includes annual funding of:
• $20 .6 - 20 .8 billion to provide health services .
• $8 .2 - 8 .3 billion for kindergarten to Grade 12 (K-12) education services .
• $6 .2 - 6 .3 billion for social services ministries .
Government is taking a prudent approach to all government spending to ensure value for money and that we live within our means .
Budget 2020 – 3 Year Expense Summary Table (millions of dollars)
pdf named: B20-FP-EXP_mb20.pdf Budget 2020Fiscal Plan Expense
Modelling Budget 2019Confidential (TB deliberations) | Updated at Sep 11 @ 10 pm(Millions of dollars)
2018-19 2020-21 2021-22 2022-23Actual Budget Forecast Estimate Target Target
Operating Expense by Ministry Health 20,409 20,611 20,828 20,616 20,632 20,672 Kindergarten to Post-Secondary Education Kindergarten to Grade 12 8,222 8,222 8,222 8,322 8,247 8,247 Post-Secondary 5,392 5,117 5,472 5,126 5,016 4,906 Social Service Ministries 5,755 6,133 6,041 6,183 6,239 6,258 Other Ministries 8,637 8,116 8,043 7,486 7,313 7,270 In-year savings - - - (59) (59) (59)
Total Operating Expense 48,417 48,199 48,605 47,792 47,506 47,413
Disaster and Emergency Assistance 507 636 1,202 - - - Capital Grants 1,952 2,086 1,800 2,302 2,124 2,093 Amortization/Inventory Consumption/Loss on Disposals 3,651 3,691 3,833 3,856 3,933 3,954 Debt Servicing 1,971 2,265 2,078 2,505 2,780 2,970 Pension Provisions (190) (337) (310) (415) (354) (272) Expense before Crude by Rail and Contingency 56,312 56,540 57,208 56,039 55,991 56,155
Crude by Rail Provision 6 1,500 1,280 - - - Contingency and Disaster and Emergency Assistance - 680 - 750 750 750
pdf named: B20-FP-EXP_mb20.pdf
2019-20
S:\TBF\MinShare\PublnsProd\CorpFin\OBM.PUBLNS-2020-21\B20_Fiscal-Plan_vol\06_EXPense_B20\source-docs\All overview tables/Support for fiscal plan 2/18/2020/ 4:17 PM
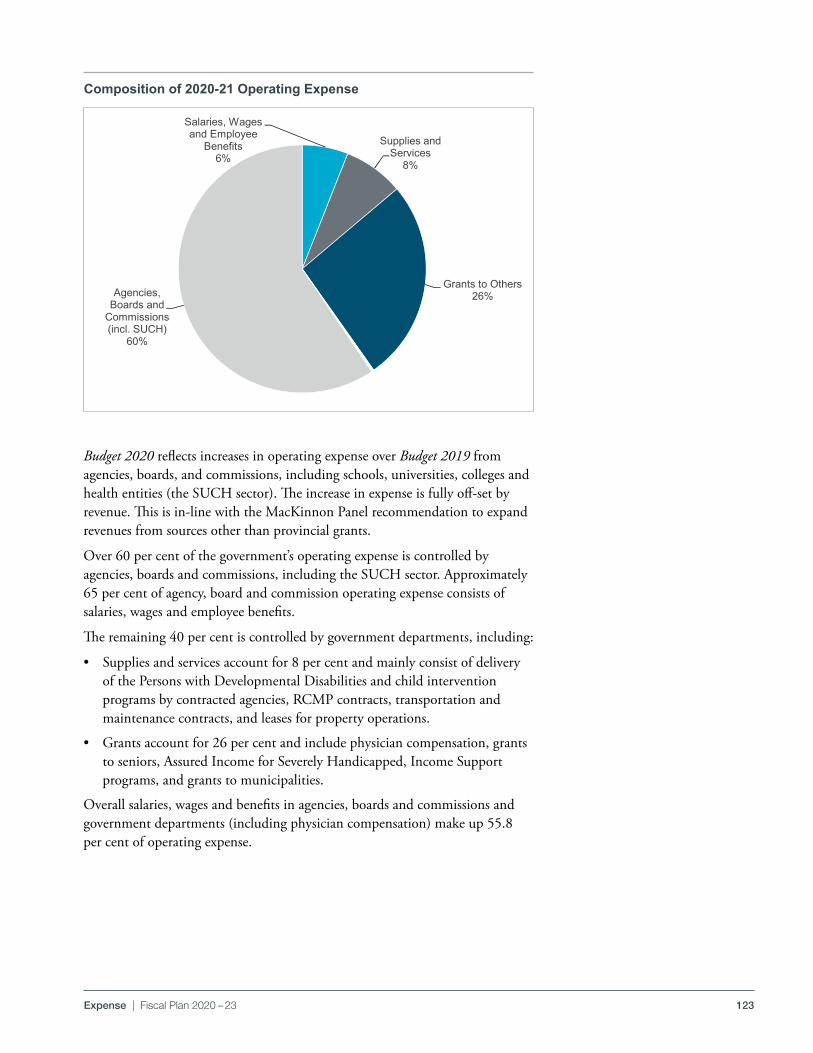
123Expense | Fiscal Plan 2020 – 23
Budget 2020 reflects increases in operating expense over Budget 2019 from agencies, boards, and commissions, including schools, universities, colleges and health entities (the SUCH sector) . The increase in expense is fully off-set by revenue . This is in-line with the MacKinnon Panel recommendation to expand revenues from sources other than provincial grants .
Over 60 per cent of the government’s operating expense is controlled by agencies, boards and commissions, including the SUCH sector . Approximately 65 per cent of agency, board and commission operating expense consists of salaries, wages and employee benefits .
The remaining 40 per cent is controlled by government departments, including:
• Supplies and services account for 8 per cent and mainly consist of delivery of the Persons with Developmental Disabilities and child intervention programs by contracted agencies, RCMP contracts, transportation and maintenance contracts, and leases for property operations .
• Grants account for 26 per cent and include physician compensation, grants to seniors, Assured Income for Severely Handicapped, Income Support programs, and grants to municipalities .
Overall salaries, wages and benefits in agencies, boards and commissions and government departments (including physician compensation) make up 55 .8 per cent of operating expense .
Composition of 2020-21 Operating Expense
pdf named: B20_FP_EXP_c202021oe.pdf Budget 2020Fiscal Plan Expense
Composition of 2020-21 Operating Expense
pdf named: B20-FP-EXP_c202021oe.pdf
Salaries, Wages and Employee
Benefits6%
Supplies and Services
8%
Grants to Others26%Agencies,
Boards and Commissions (incl. SUCH)
60%
S:\TBF\MinShare\PublnsProd\CorpFin\OBM.PUBLNS-2020-21\B20_Fiscal-Plan_vol\06_EXPense_B20\source-docs\[File]Composition of OPEX 2/17/202011:43 AM
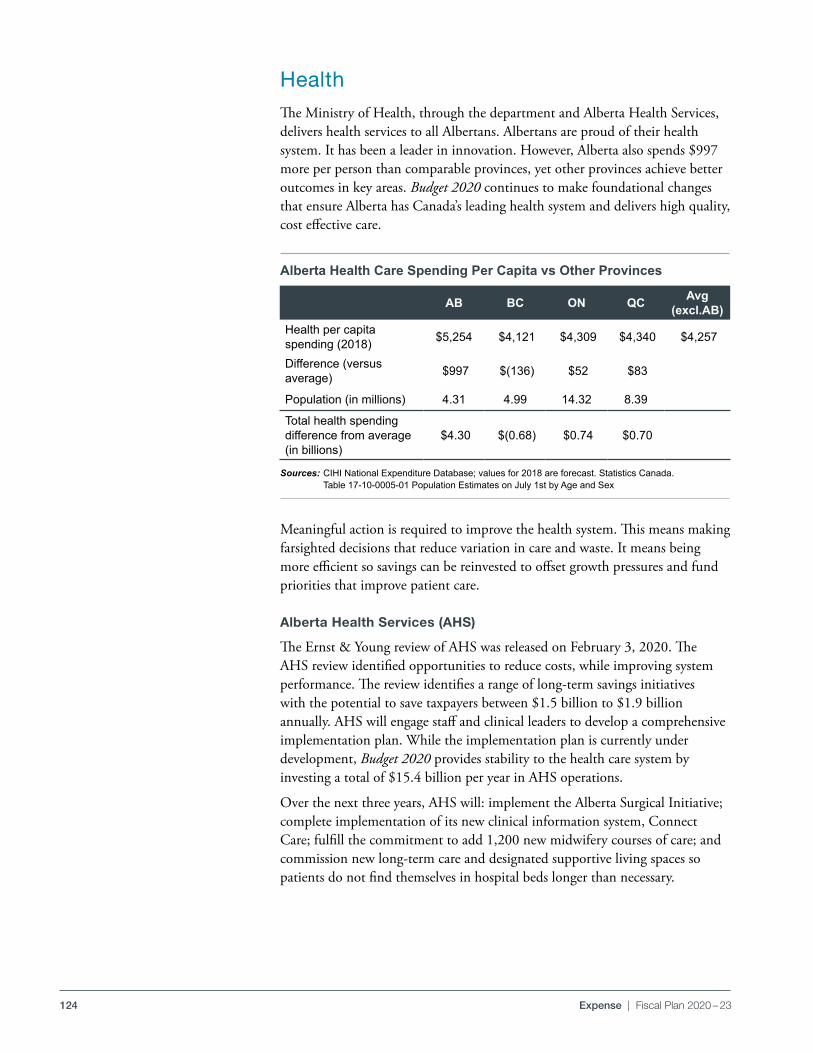
124 Expense | Fiscal Plan 2020 – 23
HealthThe Ministry of Health, through the department and Alberta Health Services, delivers health services to all Albertans . Albertans are proud of their health system . It has been a leader in innovation . However, Alberta also spends $997 more per person than comparable provinces, yet other provinces achieve better outcomes in key areas . Budget 2020 continues to make foundational changes that ensure Alberta has Canada’s leading health system and delivers high quality, cost effective care .
Meaningful action is required to improve the health system . This means making farsighted decisions that reduce variation in care and waste . It means being more efficient so savings can be reinvested to offset growth pressures and fund priorities that improve patient care .
Alberta Health Services (AHS)
The Ernst & Young review of AHS was released on February 3, 2020 . The AHS review identified opportunities to reduce costs, while improving system performance . The review identifies a range of long-term savings initiatives with the potential to save taxpayers between $1 .5 billion to $1 .9 billion annually . AHS will engage staff and clinical leaders to develop a comprehensive implementation plan . While the implementation plan is currently under development, Budget 2020 provides stability to the health care system by investing a total of $15 .4 billion per year in AHS operations .
Over the next three years, AHS will: implement the Alberta Surgical Initiative; complete implementation of its new clinical information system, Connect Care; fulfill the commitment to add 1,200 new midwifery courses of care; and commission new long-term care and designated supportive living spaces so patients do not find themselves in hospital beds longer than necessary .
Alberta Health Care Spending Per Capita vs Other Provinces
Sources: CIHI National Expenditure Database; values for 2018 are forecast. Statistics Canada. Table 17-10-0005-01 Population Estimates on July 1st by Age and Sex
AB BC ON QC Avg (excl.AB)
Health per capita spending (2018) $5,254 $4,121 $4,309 $4,340 $4,257
Difference (versus average) $997 $(136) $52 $83
Population (in millions) 4.31 4.99 14.32 8.39
Total health spending difference from average (in billions)
$4.30 $(0.68) $0.74 $0.70
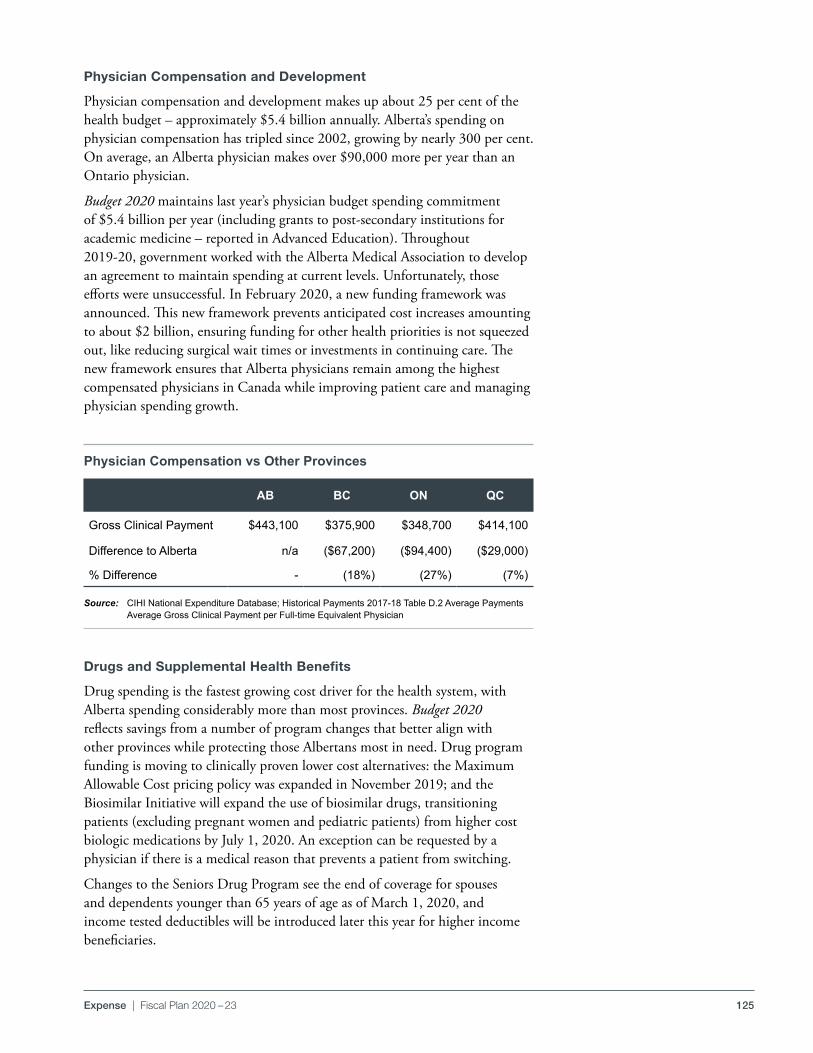
125Expense | Fiscal Plan 2020 – 23
Physician Compensation and Development
Physician compensation and development makes up about 25 per cent of the health budget – approximately $5 .4 billion annually . Alberta’s spending on physician compensation has tripled since 2002, growing by nearly 300 per cent . On average, an Alberta physician makes over $90,000 more per year than an Ontario physician .
Budget 2020 maintains last year’s physician budget spending commitment of $5 .4 billion per year (including grants to post-secondary institutions for academic medicine – reported in Advanced Education) . Throughout 2019-20, government worked with the Alberta Medical Association to develop an agreement to maintain spending at current levels . Unfortunately, those efforts were unsuccessful . In February 2020, a new funding framework was announced . This new framework prevents anticipated cost increases amounting to about $2 billion, ensuring funding for other health priorities is not squeezed out, like reducing surgical wait times or investments in continuing care . The new framework ensures that Alberta physicians remain among the highest compensated physicians in Canada while improving patient care and managing physician spending growth .
Drugs and Supplemental Health Benefits
Drug spending is the fastest growing cost driver for the health system, with Alberta spending considerably more than most provinces . Budget 2020 reflects savings from a number of program changes that better align with other provinces while protecting those Albertans most in need . Drug program funding is moving to clinically proven lower cost alternatives: the Maximum Allowable Cost pricing policy was expanded in November 2019; and the Biosimilar Initiative will expand the use of biosimilar drugs, transitioning patients (excluding pregnant women and pediatric patients) from higher cost biologic medications by July 1, 2020 . An exception can be requested by a physician if there is a medical reason that prevents a patient from switching .
Changes to the Seniors Drug Program see the end of coverage for spouses and dependents younger than 65 years of age as of March 1, 2020, and income tested deductibles will be introduced later this year for higher income beneficiaries .
Physician Compensation vs Other Provinces
Source: CIHI National Expenditure Database; Historical Payments 2017-18 Table D.2 Average Payments Average Gross Clinical Payment per Full-time Equivalent Physician
AB BC ON QC
Gross Clinical Payment $443,100 $375,900 $348,700 $414,100
Difference to Alberta n/a ($67,200) ($94,400) ($29,000)
% Difference - (18%) (27%) (7%)
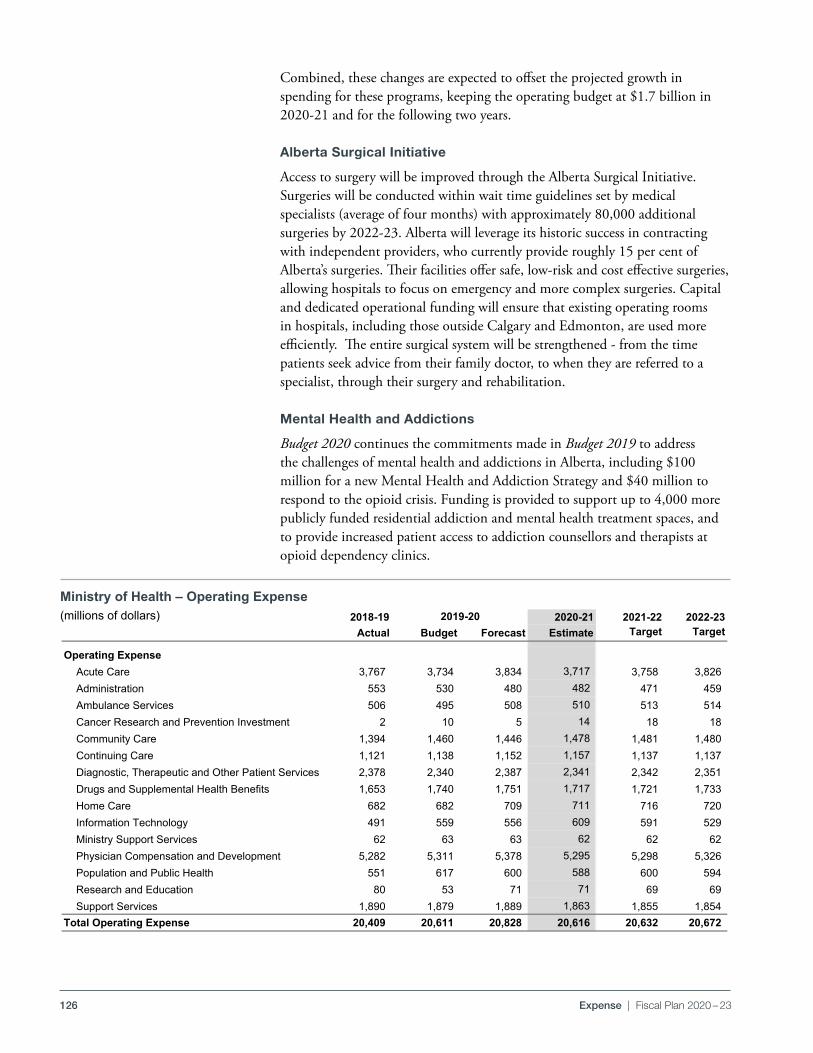
126 Expense | Fiscal Plan 2020 – 23
Combined, these changes are expected to offset the projected growth in spending for these programs, keeping the operating budget at $1 .7 billion in 2020-21 and for the following two years .
Alberta Surgical Initiative
Access to surgery will be improved through the Alberta Surgical Initiative . Surgeries will be conducted within wait time guidelines set by medical specialists (average of four months) with approximately 80,000 additional surgeries by 2022-23 . Alberta will leverage its historic success in contracting with independent providers, who currently provide roughly 15 per cent of Alberta’s surgeries . Their facilities offer safe, low-risk and cost effective surgeries, allowing hospitals to focus on emergency and more complex surgeries . Capital and dedicated operational funding will ensure that existing operating rooms in hospitals, including those outside Calgary and Edmonton, are used more efficiently . The entire surgical system will be strengthened - from the time patients seek advice from their family doctor, to when they are referred to a specialist, through their surgery and rehabilitation .
Mental Health and Addictions
Budget 2020 continues the commitments made in Budget 2019 to address the challenges of mental health and addictions in Alberta, including $100 million for a new Mental Health and Addiction Strategy and $40 million to respond to the opioid crisis . Funding is provided to support up to 4,000 more publicly funded residential addiction and mental health treatment spaces, and to provide increased patient access to addiction counsellors and therapists at opioid dependency clinics .
Ministry of Health – Operating Expense(millions of dollars)
pdf named: B20_FP_TBS_02-mohoe-tb.pdf Budget 2020Fiscal Plan Expense
Ministry of Health - Operating Expense(millions of dollars)
2018-19 2020-21 2021-22 2022-23Actual Budget Forecast Estimate Target Target
Operating ExpenseAcute Care 3,767 3,734 3,834 3,717 3,758 3,826 Administration 553 530 480 482 471 459 Ambulance Services 506 495 508 510 513 514 Cancer Research and Prevention Investment 2 10 5 14 18 18 Community Care 1,394 1,460 1,446 1,478 1,481 1,480 Continuing Care 1,121 1,138 1,152 1,157 1,137 1,137 Diagnostic, Therapeutic and Other Patient Services 2,378 2,340 2,387 2,341 2,342 2,351 Drugs and Supplemental Health Benefits 1,653 1,740 1,751 1,717 1,721 1,733 Home Care 682 682 709 711 716 720 Information Technology 491 559 556 609 591 529 Ministry Support Services 62 63 63 62 62 62 Physician Compensation and Development 5,282 5,311 5,378 5,295 5,298 5,326 Population and Public Health 551 617 600 588 600 594 Research and Education 80 53 71 71 69 69 Support Services 1,890 1,879 1,889 1,863 1,855 1,854
Total Operating Expense 20,409 20,611 20,828 20,616 20,632 20,672
pdf named: B20_FP_TBS_02-mohoe-tb.pdf
2019-20
S:\TBF\MinShare\PublnsProd\CorpFin\OBM.PUBLNS-2020-21\B20_Fiscal-Plan_vol\06_EXPense_B20\source-docs\All overview tables/Health 2/18/2020 /4:18 PM
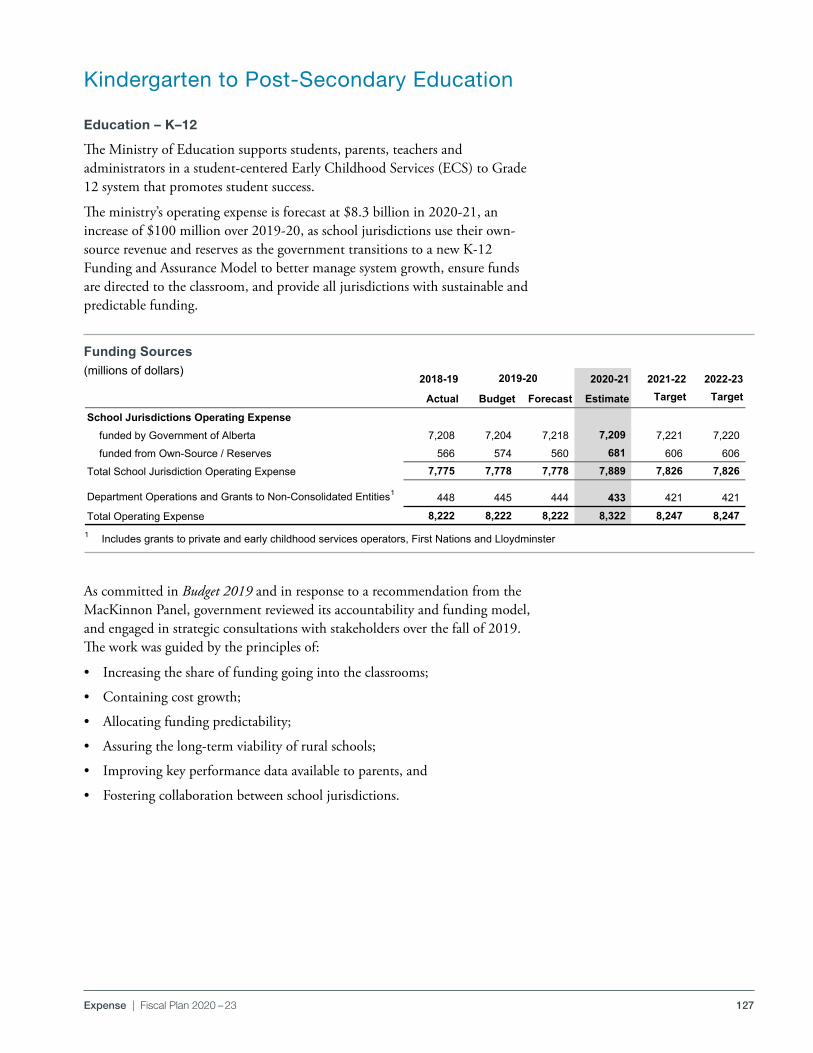
127Expense | Fiscal Plan 2020 – 23
Kindergarten to Post-Secondary Education
Education – K–12
The Ministry of Education supports students, parents, teachers and administrators in a student-centered Early Childhood Services (ECS) to Grade 12 system that promotes student success .
The ministry’s operating expense is forecast at $8 .3 billion in 2020-21, an increase of $100 million over 2019-20, as school jurisdictions use their own-source revenue and reserves as the government transitions to a new K-12 Funding and Assurance Model to better manage system growth, ensure funds are directed to the classroom, and provide all jurisdictions with sustainable and predictable funding .
As committed in Budget 2019 and in response to a recommendation from the MacKinnon Panel, government reviewed its accountability and funding model, and engaged in strategic consultations with stakeholders over the fall of 2019 . The work was guided by the principles of:
• Increasing the share of funding going into the classrooms;
• Containing cost growth;
• Allocating funding predictability;
• Assuring the long-term viability of rural schools;
• Improving key performance data available to parents, and
• Fostering collaboration between school jurisdictions .
1 Includes grants to private and early childhood services operators, First Nations and Lloydminster
pdf named: B20-FP-EXP_efs.pdf Budget 2020 Fiscal PlanExpense
Education - Funding Sources(millions of dollars)
2018-19 2020-21 2021-22 2022-23
Actual Budget Forecast Estimate Target Target
School Jurisdictions Operating Expensefunded by Government of Alberta 7,208 7,204 7,218 7,209 7,221 7,220funded from Own-Source / Reserves 566 574 560 681 606 606
Total School Jurisdiction Operating Expense 7,775 7,778 7,778 7,889 7,826 7,826
Department Operations and Grants to Non-Consolidated Entities1 448 445 444 433 421 421
Total Operating Expense 8,222 8,222 8,222 8,322 8,247 8,247
1 Includes grants to private and early childhood services operators, First Nations and Lioydminster
pdf named: B20-FP-EXP_efs.pdf
2019-20
S:\TBF\MinShare\PublnsProd\CorpFin\OBM.PUBLNS-2020-21\B20_Fiscal-Plan_vol\06_EXPense_B20\source-docs\[File]EDUC - funding sources 2/20/20201:44 PM
Funding Sources(millions of dollars)
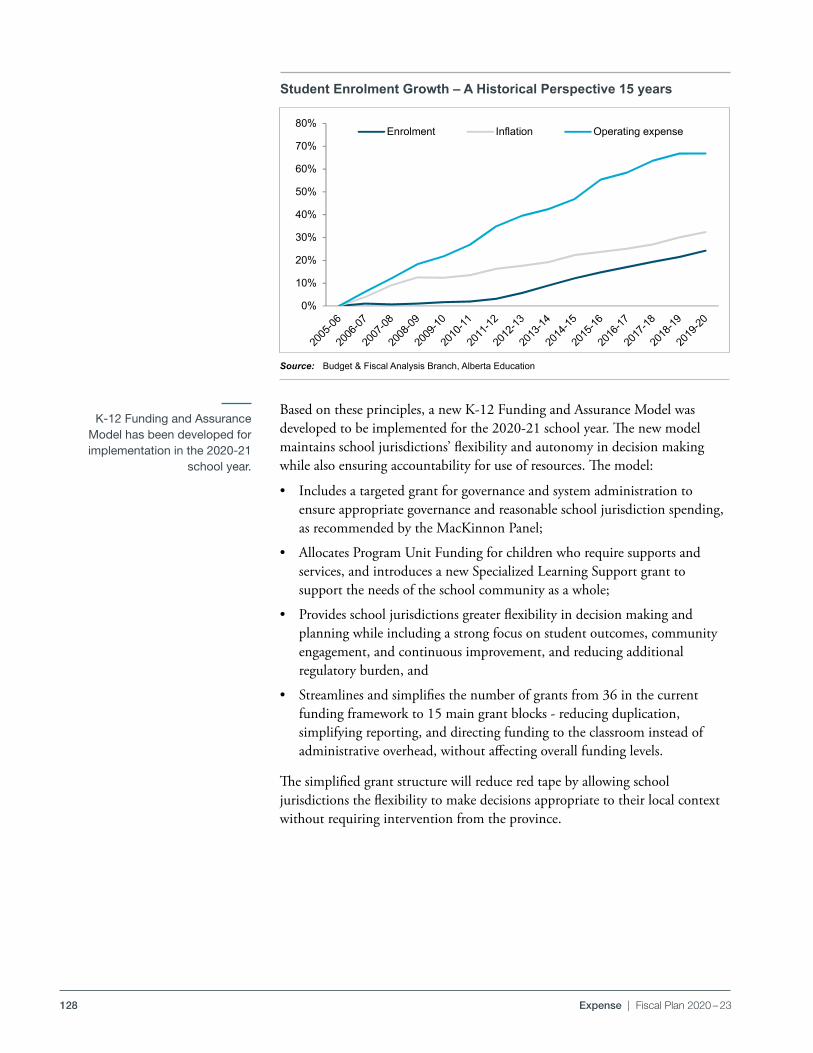
128 Expense | Fiscal Plan 2020 – 23
Based on these principles, a new K-12 Funding and Assurance Model was developed to be implemented for the 2020-21 school year . The new model maintains school jurisdictions’ flexibility and autonomy in decision making while also ensuring accountability for use of resources . The model:
• Includes a targeted grant for governance and system administration to ensure appropriate governance and reasonable school jurisdiction spending, as recommended by the MacKinnon Panel;
• Allocates Program Unit Funding for children who require supports and services, and introduces a new Specialized Learning Support grant to support the needs of the school community as a whole;
• Provides school jurisdictions greater flexibility in decision making and planning while including a strong focus on student outcomes, community engagement, and continuous improvement, and reducing additional regulatory burden, and
• Streamlines and simplifies the number of grants from 36 in the current funding framework to 15 main grant blocks - reducing duplication, simplifying reporting, and directing funding to the classroom instead of administrative overhead, without affecting overall funding levels .
The simplified grant structure will reduce red tape by allowing school jurisdictions the flexibility to make decisions appropriate to their local context without requiring intervention from the province .
K-12 Funding and Assurance Model has been developed for implementation in the 2020-21
school year.
Student Enrolment Growth – A Historical Perspective 15 years
Source: Budget & Fiscal Analysis Branch, Alberta Education
pdf name: B20-FP-EXP_segahp15y.pdf Budget 2020 Fiscal PlanExpense
Student Enrolment Growth – A Historical Perspective 15 years
pdf named: B20-FP-EXP_segahp15y.pdf
0%
10%
20%
30%
40%
50%
60%
70%
80%Enrolment Inflation Operating expense
S:\TBF\MinShare\PublnsProd\CorpFin\OBM.PUBLNS-2020-21\B20_Fiscal-Plan_vol\06_EXPense_B20\source-docs\[File]EDUC - Enrol 2/18/202012:09 PM
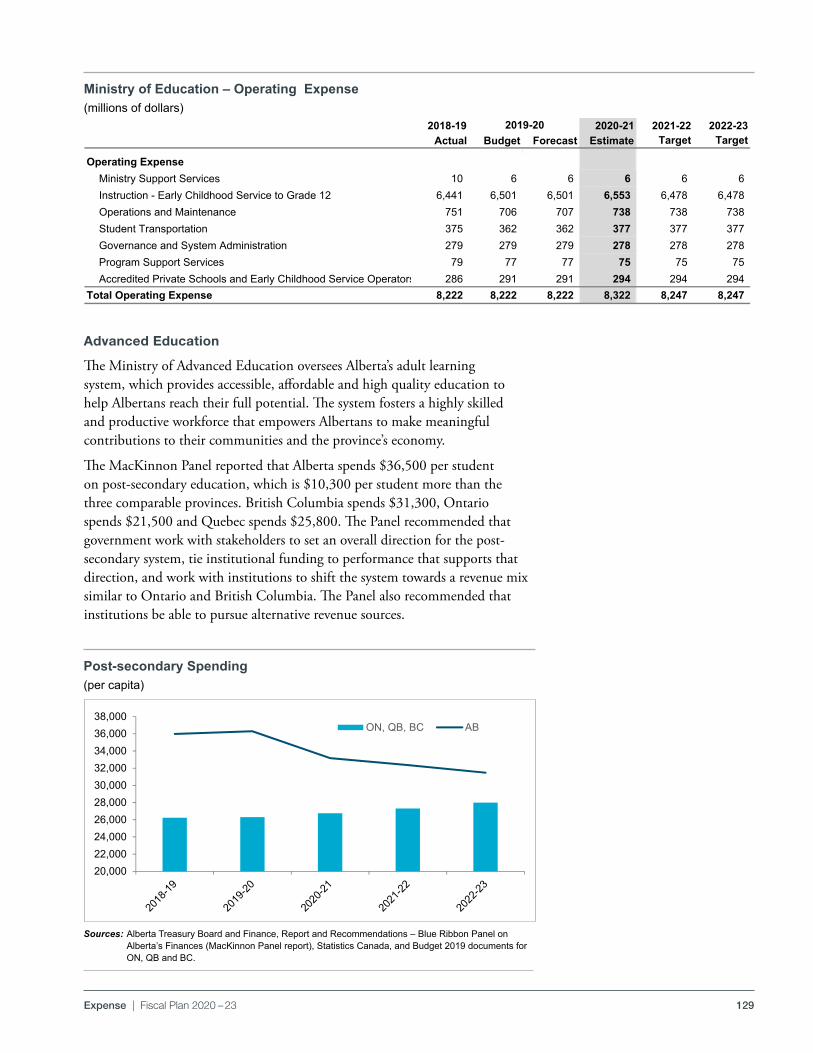
129Expense | Fiscal Plan 2020 – 23
Advanced Education
The Ministry of Advanced Education oversees Alberta’s adult learning system, which provides accessible, affordable and high quality education to help Albertans reach their full potential . The system fosters a highly skilled and productive workforce that empowers Albertans to make meaningful contributions to their communities and the province’s economy .
The MacKinnon Panel reported that Alberta spends $36,500 per student on post-secondary education, which is $10,300 per student more than the three comparable provinces . British Columbia spends $31,300, Ontario spends $21,500 and Quebec spends $25,800 . The Panel recommended that government work with stakeholders to set an overall direction for the post-secondary system, tie institutional funding to performance that supports that direction, and work with institutions to shift the system towards a revenue mix similar to Ontario and British Columbia . The Panel also recommended that institutions be able to pursue alternative revenue sources .
Ministry of Education – Operating Expense(millions of dollars)
pdf named: B20_FP_EXP_moeoe-tb Budget 2020Fiscal Plan Expense
Ministry of Education - Operating Expense(millions of dollars)
2018-19 2020-21 2021-22 2022-23Actual Budget Forecast Estimate Target Target
Operating ExpenseMinistry Support Services 10 6 6 6 6 6 Instruction - Early Childhood Service to Grade 12 6,441 6,501 6,501 6,553 6,478 6,478 Operations and Maintenance 751 706 707 738 738 738 Student Transportation 375 362 362 377 377 377 Governance and System Administration 279 279 279 278 278 278 Program Support Services 79 77 77 75 75 75 Accredited Private Schools and Early Childhood Service Operators 286 291 291 294 294 294
Total Operating Expense 8,222 8,222 8,222 8,322 8,247 8,247
pdf named: B20_FP_EXP_moeoe-tb
2019-20
S:\TBF\MinShare\PublnsProd\CorpFin\OBM.PUBLNS-2020-21\B20_Fiscal-Plan_vol\06_EXPense_B20\source-docs\All overview tables/Education 2/17/2020 /11:45 AM
pdf name: B20-FP-EXP_psspc.pdf Budget 2020 Fiscal PlanExpense
pdf named: B20-FP-EXP_psspc.pdf
20,00022,00024,00026,00028,00030,00032,00034,00036,00038,000
ON, QB, BC AB
S:\TBF\MinShare\PublnsProd\CorpFin\OBM.PUBLNS-2020-21\B20_Fiscal-Plan_vol\06_EXPense_B20\source-docs\/All overview tablesPSI Expense Comparison 2/17/202012:17 PM
Post-secondary Spending(per capita)
Sources: Alberta Treasury Board and Finance, Report and Recommendations – Blue Ribbon Panel on Alberta’s Finances (MacKinnon Panel report), Statistics Canada, and Budget 2019 documents for ON, QB and BC.
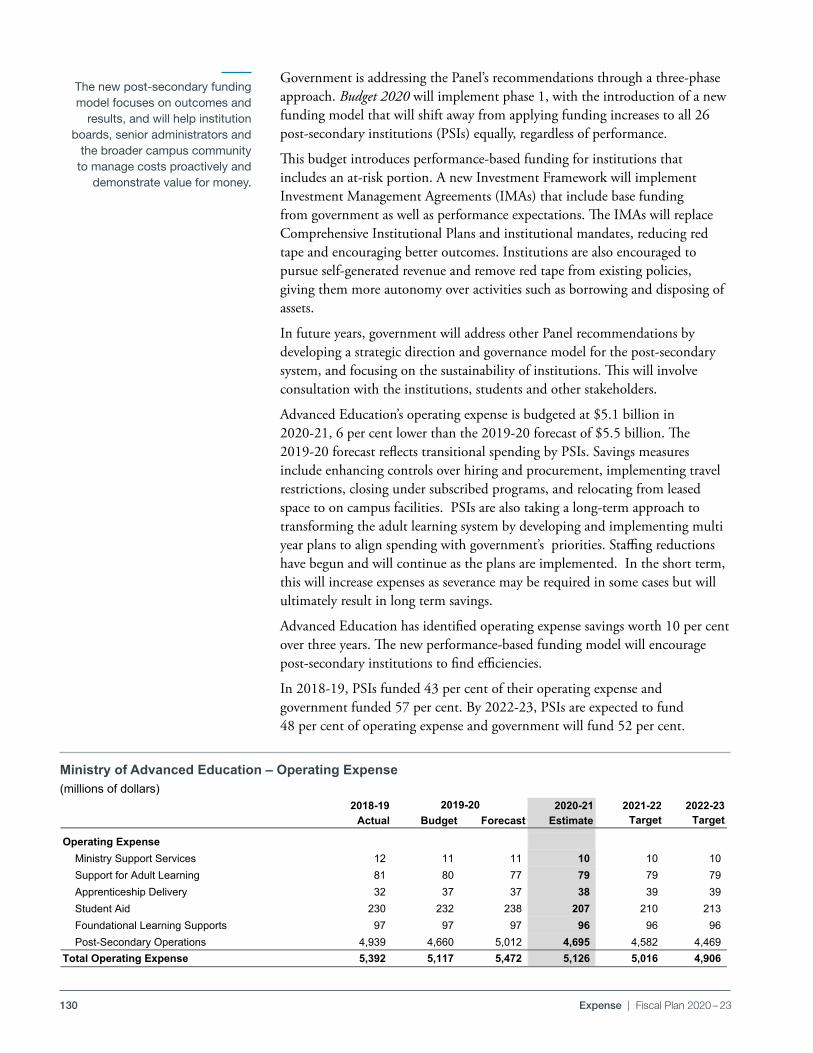
130 Expense | Fiscal Plan 2020 – 23
Government is addressing the Panel’s recommendations through a three-phase approach . Budget 2020 will implement phase 1, with the introduction of a new funding model that will shift away from applying funding increases to all 26 post-secondary institutions (PSIs) equally, regardless of performance .
This budget introduces performance-based funding for institutions that includes an at-risk portion . A new Investment Framework will implement Investment Management Agreements (IMAs) that include base funding from government as well as performance expectations . The IMAs will replace Comprehensive Institutional Plans and institutional mandates, reducing red tape and encouraging better outcomes . Institutions are also encouraged to pursue self-generated revenue and remove red tape from existing policies, giving them more autonomy over activities such as borrowing and disposing of assets .
In future years, government will address other Panel recommendations by developing a strategic direction and governance model for the post-secondary system, and focusing on the sustainability of institutions . This will involve consultation with the institutions, students and other stakeholders .
Advanced Education’s operating expense is budgeted at $5 .1 billion in 2020-21, 6 per cent lower than the 2019-20 forecast of $5 .5 billion . The 2019-20 forecast reflects transitional spending by PSIs . Savings measures include enhancing controls over hiring and procurement, implementing travel restrictions, closing under subscribed programs, and relocating from leased space to on campus facilities . PSIs are also taking a long-term approach to transforming the adult learning system by developing and implementing multi year plans to align spending with government’s priorities . Staffing reductions have begun and will continue as the plans are implemented . In the short term, this will increase expenses as severance may be required in some cases but will ultimately result in long term savings .
Advanced Education has identified operating expense savings worth 10 per cent over three years . The new performance-based funding model will encourage post-secondary institutions to find efficiencies .
In 2018-19, PSIs funded 43 per cent of their operating expense and government funded 57 per cent . By 2022-23, PSIs are expected to fund 48 per cent of operating expense and government will fund 52 per cent .
The new post-secondary funding model focuses on outcomes and
results, and will help institution boards, senior administrators and
the broader campus community to manage costs proactively and
demonstrate value for money.
Ministry of Advanced Education – Operating Expense(millions of dollars)
pdf named: B20_FP_EXP_moaeoe-tb Budget 2020Fiscal Plan Expense
Ministry of Advanced Education - Operating Expense(millions of dollars)
2018-19 2020-21 2021-22 2022-23Actual Budget Forecast Estimate Target Target
Operating ExpenseMinistry Support Services 12 11 11 10 10 10 Support for Adult Learning 81 80 77 79 79 79 Apprenticeship Delivery 32 37 37 38 39 39 Student Aid 230 232 238 207 210 213 Foundational Learning Supports 97 97 97 96 96 96 Post-Secondary Operations 4,939 4,660 5,012 4,695 4,582 4,469
Total Operating Expense 5,392 5,117 5,472 5,126 5,016 4,906
pdf named: B20_FP_EXP_moaeoe-tb
2019-20
S:\TBF\MinShare\PublnsProd\CorpFin\OBM.PUBLNS-2020-21\B20_Fiscal-Plan_vol\06_EXPense_B20\source-docs\All overview tables/Ad Education 2/18/2020 /4:18 PM
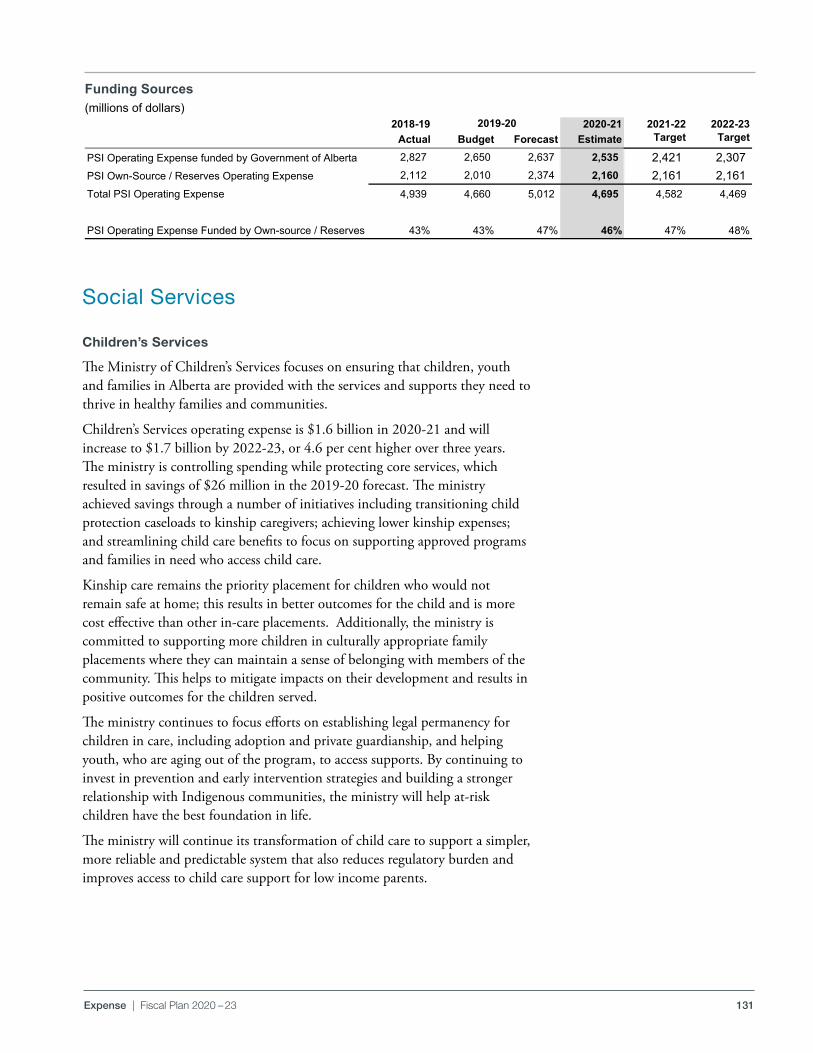
131Expense | Fiscal Plan 2020 – 23
Social Services
Children’s Services
The Ministry of Children’s Services focuses on ensuring that children, youth and families in Alberta are provided with the services and supports they need to thrive in healthy families and communities .
Children’s Services operating expense is $1 .6 billion in 2020-21 and will increase to $1 .7 billion by 2022-23, or 4 .6 per cent higher over three years . The ministry is controlling spending while protecting core services, which resulted in savings of $26 million in the 2019-20 forecast . The ministry achieved savings through a number of initiatives including transitioning child protection caseloads to kinship caregivers; achieving lower kinship expenses; and streamlining child care benefits to focus on supporting approved programs and families in need who access child care .
Kinship care remains the priority placement for children who would not remain safe at home; this results in better outcomes for the child and is more cost effective than other in-care placements . Additionally, the ministry is committed to supporting more children in culturally appropriate family placements where they can maintain a sense of belonging with members of the community . This helps to mitigate impacts on their development and results in positive outcomes for the children served .
The ministry continues to focus efforts on establishing legal permanency for children in care, including adoption and private guardianship, and helping youth, who are aging out of the program, to access supports . By continuing to invest in prevention and early intervention strategies and building a stronger relationship with Indigenous communities, the ministry will help at-risk children have the best foundation in life .
The ministry will continue its transformation of child care to support a simpler, more reliable and predictable system that also reduces regulatory burden and improves access to child care support for low income parents .
Funding Sources(millions of dollars)
pdf named: B20_FP_EXP_psifs.pdf Budget 2020 Fiscal PlanExpense
Post-Secondary Institutions - Funding Sources(millions of dollars)
2018-19 2020-21 2021-22 2022-23Actual Budget Forecast Estimate Target Target
PSI Operating Expense funded by Government of Alberta 2,827 2,650 2,637 2,535 2,421 2,307 PSI Own-Source / Reserves Operating Expense 2,112 2,010 2,374 2,160 2,161 2,161 Total PSI Operating Expense 4,939 4,660 5,012 4,695 4,582 4,469
PSI Operating Expense Funded by Own-source / Reserves 43% 43% 47% 46% 47% 48%
pdf named: B20_FP_EXP_psifs.pdf
2019-20
S:\TBF\MinShare\PublnsProd\CorpFin\OBM.PUBLNS-2020-21\B20_Fiscal-Plan_vol\06_EXPense_B20\source-docs\[File]ADED - funding sources 2/20/20201:48 PM
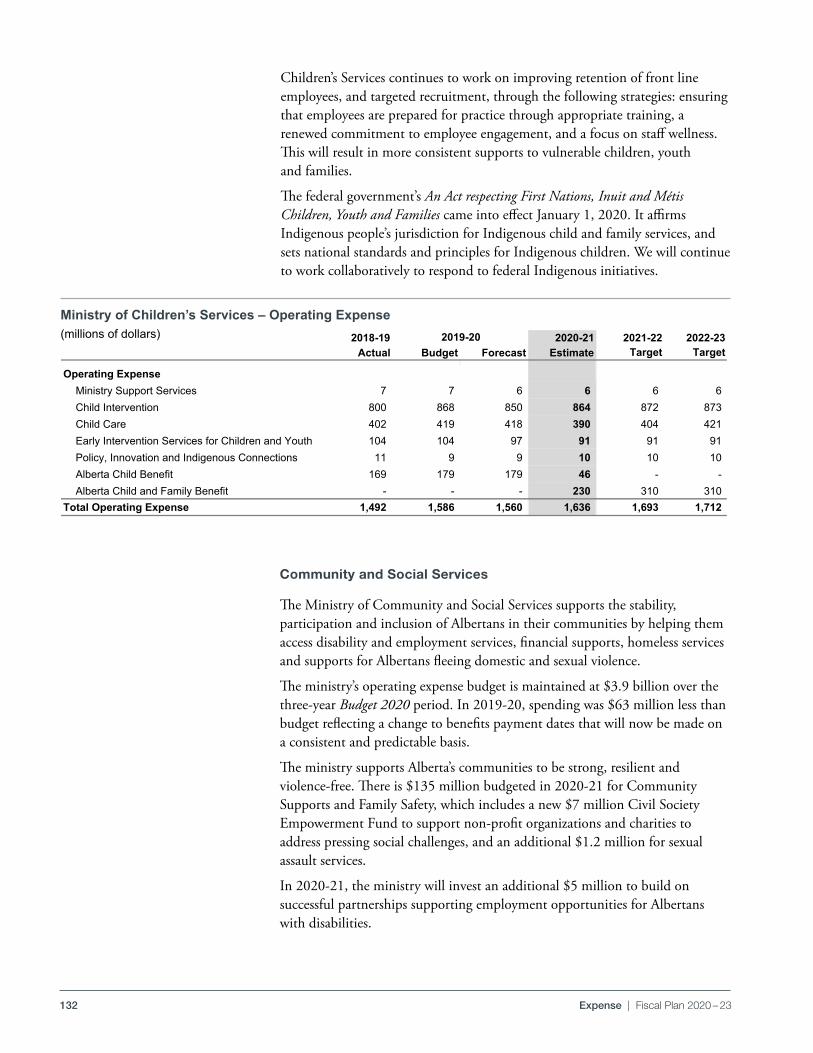
132 Expense | Fiscal Plan 2020 – 23
Children’s Services continues to work on improving retention of front line employees, and targeted recruitment, through the following strategies: ensuring that employees are prepared for practice through appropriate training, a renewed commitment to employee engagement, and a focus on staff wellness . This will result in more consistent supports to vulnerable children, youth and families .
The federal government’s An Act respecting First Nations, Inuit and Métis Children, Youth and Families came into effect January 1, 2020 . It affirms Indigenous people’s jurisdiction for Indigenous child and family services, and sets national standards and principles for Indigenous children . We will continue to work collaboratively to respond to federal Indigenous initiatives .
Community and Social Services
The Ministry of Community and Social Services supports the stability, participation and inclusion of Albertans in their communities by helping them access disability and employment services, financial supports, homeless services and supports for Albertans fleeing domestic and sexual violence .
The ministry’s operating expense budget is maintained at $3 .9 billion over the three-year Budget 2020 period . In 2019-20, spending was $63 million less than budget reflecting a change to benefits payment dates that will now be made on a consistent and predictable basis .
The ministry supports Alberta’s communities to be strong, resilient and violence-free . There is $135 million budgeted in 2020-21 for Community Supports and Family Safety, which includes a new $7 million Civil Society Empowerment Fund to support non-profit organizations and charities to address pressing social challenges, and an additional $1 .2 million for sexual assault services .
In 2020-21, the ministry will invest an additional $5 million to build on successful partnerships supporting employment opportunities for Albertans with disabilities .
Ministry of Children’s Services – Operating Expense(millions of dollars)
pdf named: B20_FP_EXP_mocsoe-tb Budget 2020Fiscal Plan Expense
Ministry of Children Services - Operating Expense(millions of dollars)
2018-19 2020-21 2021-22 2022-23Actual Budget Forecast Estimate Target Target
Operating ExpenseMinistry Support Services 7 7 6 6 6 6 Child Intervention 800 868 850 864 872 873 Child Care 402 419 418 390 404 421 Early Intervention Services for Children and Youth 104 104 97 91 91 91 Policy, Innovation and Indigenous Connections 11 9 9 10 10 10 Alberta Child Benefit 169 179 179 46 - - Alberta Child and Family Benefit - - - 230 310 310
Total Operating Expense 1,492 1,586 1,560 1,636 1,693 1,712
pdf named: B20_FP_EXP_mocsoe-tb
2019-20
S:\TBF\MinShare\PublnsProd\CorpFin\OBM.PUBLNS-2020-21\B20_Fiscal-Plan_vol\06_EXPense_B20\source-docs\All overview tables/Children Services 2/14/2020 /8:55 AM
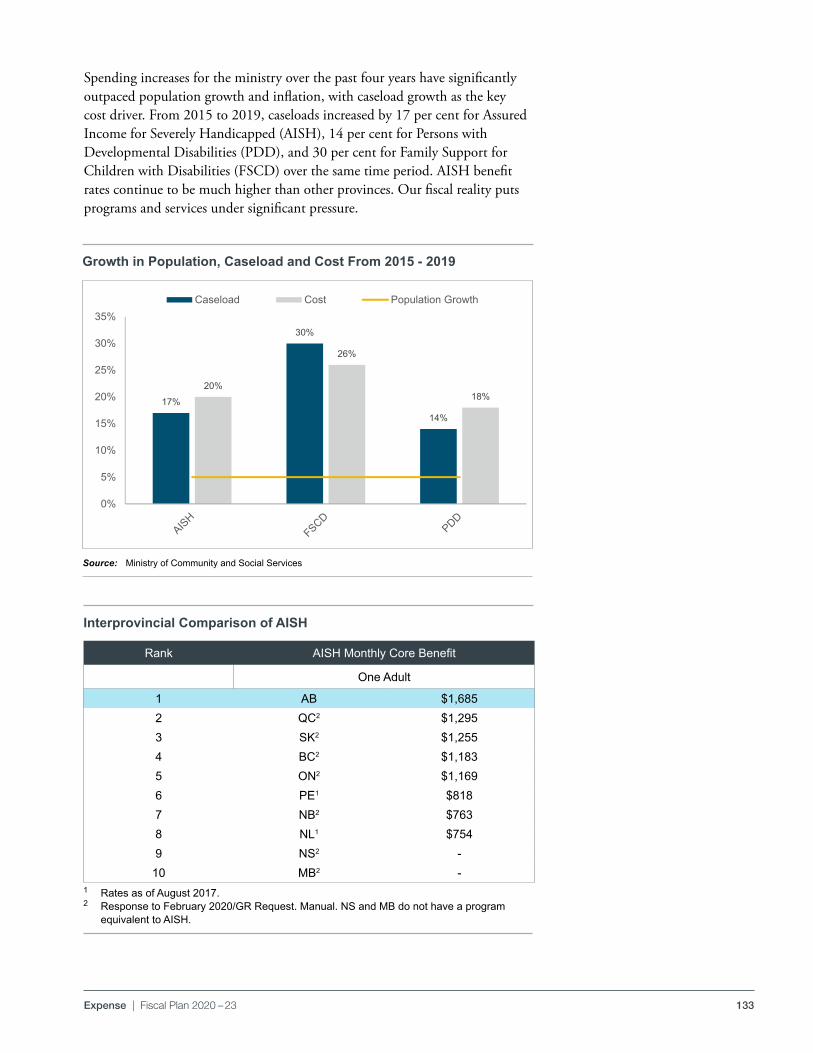
133Expense | Fiscal Plan 2020 – 23
Spending increases for the ministry over the past four years have significantly outpaced population growth and inflation, with caseload growth as the key cost driver . From 2015 to 2019, caseloads increased by 17 per cent for Assured Income for Severely Handicapped (AISH), 14 per cent for Persons with Developmental Disabilities (PDD), and 30 per cent for Family Support for Children with Disabilities (FSCD) over the same time period . AISH benefit rates continue to be much higher than other provinces . Our fiscal reality puts programs and services under significant pressure .
Growth in Population, Caseload and Cost From 2015 - 2019Growth in Population, Caseload and Cost from 2015-2019
pdf name: B20_FP_EXP_gipcac
17%
30%
14%
20%
26%
18%
0%
5%
10%
15%
20%
25%
30%
35%Caseload Cost Population Growth
Source: Ministry of Community and Social Services
Interprovincial Comparison of AISH
Rank AISH Monthly Core Benefit
One Adult
1 AB $1,6852 QC2 $1,2953 SK2 $1,2554 BC2 $1,1835 ON2 $1,1696 PE1 $8187 NB2 $7638 NL1 $7549 NS2 -
10 MB2 -1 Rates as of August 2017.2 Response to February 2020/GR Request. Manual. NS and MB do not have a program
equivalent to AISH.
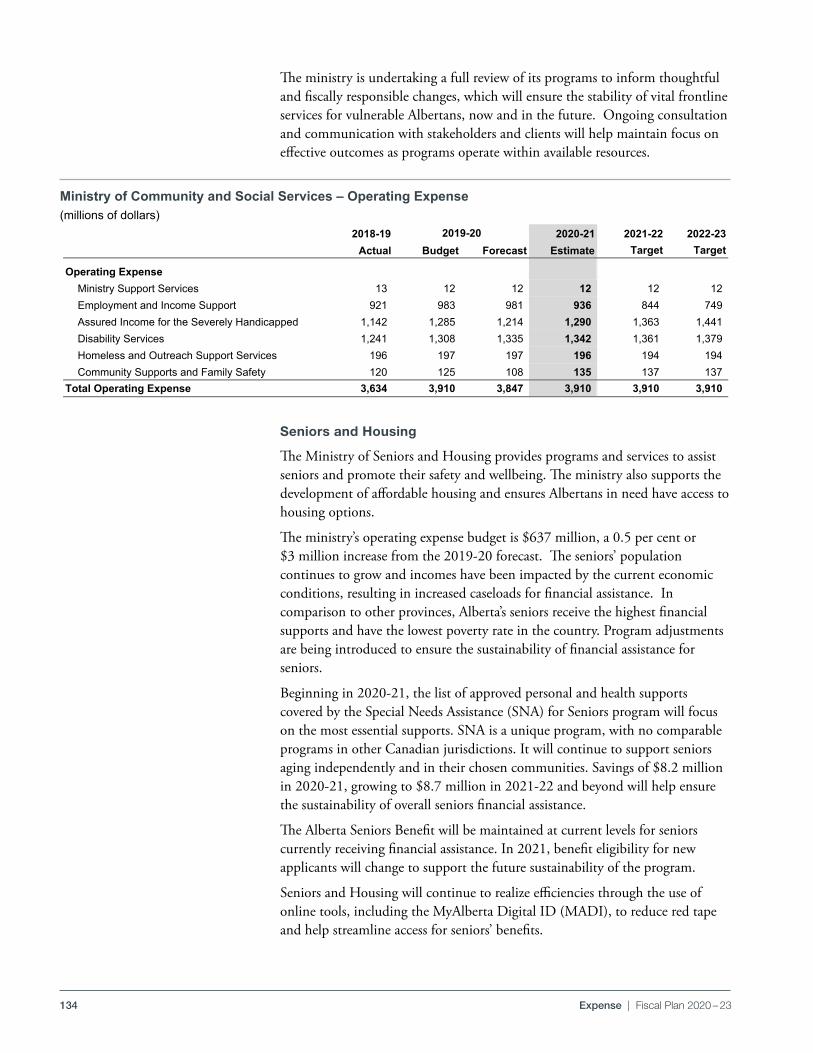
134 Expense | Fiscal Plan 2020 – 23
The ministry is undertaking a full review of its programs to inform thoughtful and fiscally responsible changes, which will ensure the stability of vital frontline services for vulnerable Albertans, now and in the future . Ongoing consultation and communication with stakeholders and clients will help maintain focus on effective outcomes as programs operate within available resources .
Seniors and Housing
The Ministry of Seniors and Housing provides programs and services to assist seniors and promote their safety and wellbeing . The ministry also supports the development of affordable housing and ensures Albertans in need have access to housing options .
The ministry’s operating expense budget is $637 million, a 0 .5 per cent or $3 million increase from the 2019-20 forecast . The seniors’ population continues to grow and incomes have been impacted by the current economic conditions, resulting in increased caseloads for financial assistance . In comparison to other provinces, Alberta’s seniors receive the highest financial supports and have the lowest poverty rate in the country . Program adjustments are being introduced to ensure the sustainability of financial assistance for seniors .
Beginning in 2020-21, the list of approved personal and health supports covered by the Special Needs Assistance (SNA) for Seniors program will focus on the most essential supports . SNA is a unique program, with no comparable programs in other Canadian jurisdictions . It will continue to support seniors aging independently and in their chosen communities . Savings of $8 .2 million in 2020-21, growing to $8 .7 million in 2021-22 and beyond will help ensure the sustainability of overall seniors financial assistance .
The Alberta Seniors Benefit will be maintained at current levels for seniors currently receiving financial assistance . In 2021, benefit eligibility for new applicants will change to support the future sustainability of the program .
Seniors and Housing will continue to realize efficiencies through the use of online tools, including the MyAlberta Digital ID (MADI), to reduce red tape and help streamline access for seniors’ benefits .
Ministry of Community and Social Services – Operating Expense(millions of dollars)
pdf named: B19_FP_TBS_02-soo.pdf Budget 2019Fiscal Plan Tables
Ministry of Community and Social Services - Operating Expense(millions of dollars)
2018-19 2020-21 2021-22 2022-23Actual Budget Forecast Estimate Target Target
Operating ExpenseMinistry Support Services 13 12 12 12 12 12 Employment and Income Support 921 983 981 936 844 749 Assured Income for the Severely Handicapped 1,142 1,285 1,214 1,290 1,363 1,441 Disability Services 1,241 1,308 1,335 1,342 1,361 1,379 Homeless and Outreach Support Services 196 197 197 196 194 194 Community Supports and Family Safety 120 125 108 135 137 137
Total Operating Expense 3,634 3,910 3,847 3,910 3,910 3,910
pdf named: B20_FP_EXP_mocassoe-tb
2019-20
S:\TBF\MinShare\PublnsProd\CorpFin\OBM.PUBLNS-2020-21\B20_Fiscal-Plan_vol\06_EXPense_B20\source-docs\All overview tables/CSS 2/19/2020 /11:53 AM
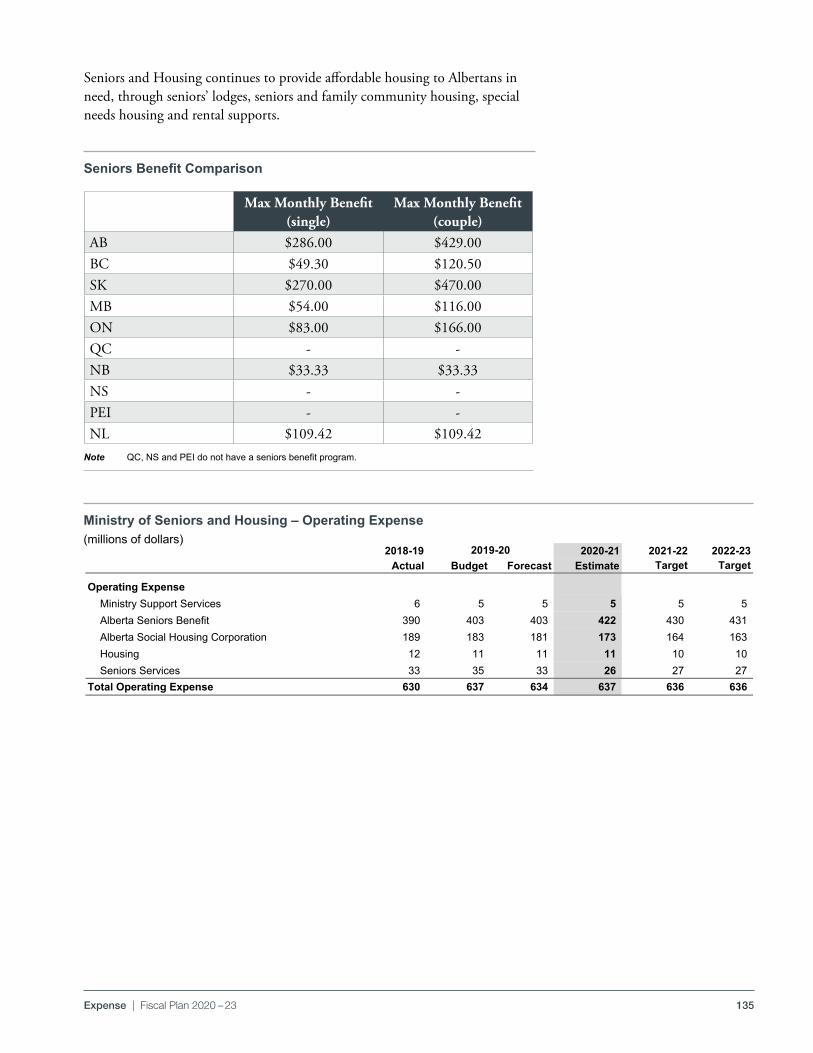
135Expense | Fiscal Plan 2020 – 23
Note QC, NS and PEI do not have a seniors benefit program.
Seniors and Housing continues to provide affordable housing to Albertans in need, through seniors’ lodges, seniors and family community housing, special needs housing and rental supports .
Seniors Benefit Comparison
Max Monthly Benefit (single)
Max Monthly Benefit (couple)
AB $286 .00 $429 .00BC $49 .30 $120 .50SK $270 .00 $470 .00MB $54 .00 $116 .00ON $83 .00 $166 .00QC - -NB $33 .33 $33 .33NS - -PEI - -NL $109 .42 $109 .42
Ministry of Seniors and Housing – Operating Expense(millions of dollars)
pdf name: B20_FP_EXP_mosahoe-tb Budget 2020Fiscal Plan Expense
Ministry of Seniors and Housing - Operating Expense(millions of dollars)
2018-19 2020-21 2021-22 2022-23Actual Budget Forecast Estimate Target Target
Operating ExpenseMinistry Support Services 6 5 5 5 5 5 Alberta Seniors Benefit 390 403 403 422 430 431 Alberta Social Housing Corporation 189 183 181 173 164 163 Housing 12 11 11 11 10 10 Seniors Services 33 35 33 26 27 27
Total Operating Expense 630 637 634 637 636 636
pdf named: B20_FP_EXP_mosahoe-tb
2019-20
S:\TBF\MinShare\PublnsProd\CorpFin\OBM.PUBLNS-2020-21\B20_Fiscal-Plan_vol\06_EXPense_B20\source-docs\All overview tables/Seniors 2/17/2020 /11:47 AM
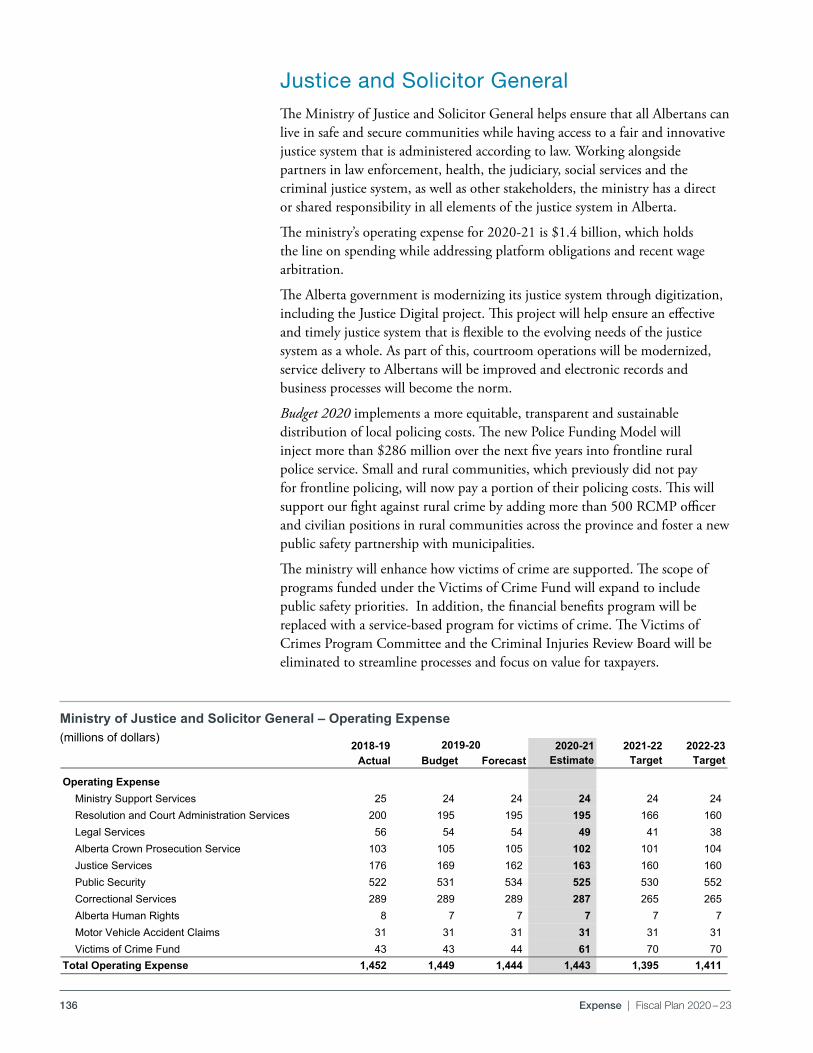
136 Expense | Fiscal Plan 2020 – 23
Justice and Solicitor GeneralThe Ministry of Justice and Solicitor General helps ensure that all Albertans can live in safe and secure communities while having access to a fair and innovative justice system that is administered according to law . Working alongside partners in law enforcement, health, the judiciary, social services and the criminal justice system, as well as other stakeholders, the ministry has a direct or shared responsibility in all elements of the justice system in Alberta .
The ministry’s operating expense for 2020-21 is $1 .4 billion, which holds the line on spending while addressing platform obligations and recent wage arbitration .
The Alberta government is modernizing its justice system through digitization, including the Justice Digital project . This project will help ensure an effective and timely justice system that is flexible to the evolving needs of the justice system as a whole . As part of this, courtroom operations will be modernized, service delivery to Albertans will be improved and electronic records and business processes will become the norm .
Budget 2020 implements a more equitable, transparent and sustainable distribution of local policing costs . The new Police Funding Model will inject more than $286 million over the next five years into frontline rural police service . Small and rural communities, which previously did not pay for frontline policing, will now pay a portion of their policing costs . This will support our fight against rural crime by adding more than 500 RCMP officer and civilian positions in rural communities across the province and foster a new public safety partnership with municipalities .
The ministry will enhance how victims of crime are supported . The scope of programs funded under the Victims of Crime Fund will expand to include public safety priorities . In addition, the financial benefits program will be replaced with a service-based program for victims of crime . The Victims of Crimes Program Committee and the Criminal Injuries Review Board will be eliminated to streamline processes and focus on value for taxpayers .
Ministry of Justice and Solicitor General – Operating Expense(millions of dollars)
pdf name: B20_FP_EXP_mojasgoe-tb Budget 2020 Fiscal PlanExpense
Ministry of Justice and Solicitor General - Operating Expense(millions of dollars)
2018-19 2020-21 2021-22 2022-23Actual Budget Forecast Estimate Target Target
Operating ExpenseMinistry Support Services 25 24 24 24 24 24 Resolution and Court Administration Services 200 195 195 195 166 160 Legal Services 56 54 54 49 41 38 Alberta Crown Prosecution Service 103 105 105 102 101 104 Justice Services 176 169 162 163 160 160 Public Security 522 531 534 525 530 552 Correctional Services 289 289 289 287 265 265 Alberta Human Rights 8 7 7 7 7 7 Motor Vehicle Accident Claims 31 31 31 31 31 31 Victims of Crime Fund 43 43 44 61 70 70
Total Operating Expense 1,452 1,449 1,444 1,443 1,395 1,411
pdf named: B20_FP_EXP_mojasgoe-tb
2019-20
S:\TBF\MinShare\PublnsProd\CorpFin\OBM.PUBLNS-2020-21\B20_Fiscal-Plan_vol\06_EXPense_B20\source-docs\[File]JSG 2/17/202011:48 AM
137Expense | Fiscal Plan 2020 – 23
Resource Management and Economic Development The government is refocusing efforts on supporting Alberta’s economic growth and job creation, reducing red tape, creating active and vibrant communities with access to cultural opportunities, and inspiring the celebration of diversity in a province where all Albertans can fully contribute to the economic and social development of the province .
A new Investment and Growth Strategy is under development . The strategy will guide targeted actions in priority sectors to attract new foreign and domestic investment and grow our economy, while improving Alberta’s overall investment reputation at a national and global level . Work will focus on driving investment in energy; agriculture; technology, data, and telecom; aviation and aerospace; and financial services and technologies .
Agriculture and Forestry
The Ministry of Agriculture and Forestry is responsible for the growth, prosperity and diversification of Alberta’s agriculture, food and forest sectors . The ministry also conducts wildfire and forest management and supports food quality and safety .
The ministry has an operating expense budget of $833 million in 2020-21, realizing savings of $43 million . Savings will be achieved by aligning Forestry operations with other provinces, transforming service delivery throughout the Department and by reducing spending on general supplies and grants .
Budget 2020 supports increased lending to Alberta’s producers, agri-processors, and agri-food industry through the Agriculture Financial Services Corporation and keeps the province’s commitment to fighting mountain pine beetle with an additional $15 million over three years, for a total of $30 million per year to mitigate damage to our natural forests .
Budget 2020 also maintains funding for farmer-led agricultural research which will remain whole at $37 million in fiscal year 2020-21 . This continued funding is essential to government fulfilling our commitment to maintain critical research and to ensure that investment and trade opportunities continue to grow in this sector .
138 Expense | Fiscal Plan 2020 – 23
Culture, Multiculturalism and Status of Women
The Ministry of Culture, Multiculturalism and Status of Women builds a vibrant cultural sector by supporting the development and sustainability of Alberta’s creative and cultural industries; recreation and sport; the non-profit and voluntary sectors; as well as the Francophone and multicultural communities . The ministry is working to create an Alberta with equal access and full economic and social participation for all peoples and communities, without discrimination .
The ministry’s operating expense budget for 2020-21 is $185 million, reducing to $157 million by 2022-23 due to the gradual conclusion of the screen-based production grants that have been transitioned to a film and television tax credit budgeted in the Ministry of Economic Development, Trade and Tourism .
Economic Development, Trade and Tourism
The Ministry of Economic Development, Trade and Tourism leads economic development efforts, supports businesses and investors, and promotes Alberta’s tourism industry . The ministry provides targeted support and enhanced access to capital for small and medium-sized businesses . The ministry also represents Alberta internationally by advancing export opportunities, attracting investment and leading negotiation on trade agreements . The ministry is also creating an investment attraction agency to lead investment promotion and the delivery of investor services to the highest impact investment opportunities in select priority sectors .
The ministry’s operating expense is $281 million for 2020-21, reflecting savings of $4 million or 1 .4 per cent from the 2019-20 forecast . The savings reflect the elimination of the Alberta Investor Tax Credit and the Interactive Media Tax Credit and savings initiatives across the ministry . This is partly offset by increases for the Investment Growth Strategy and the new Alberta Film and Television Tax Credit .
Energy
The Ministry of Energy sustains the interests of Albertans through the stewardship and responsible development of energy and mineral resource systems .
The ministry’s operating expense budget is $506 million in 2020-21, a savings of $88 million from the 2019-20 forecast . This reflects efficiencies in the department and the Alberta Energy Regulator (AER) and the elimination of the electricity consumer rate cap program for the Regulated Rate Option . Through Budget 2020, government is honouring its commitments to implement a robust natural gas strategy, streamline the AER, and work with industry and the federal government to reclaim abandoned wells and get Albertans back to work .
Labour and Immigration
The Ministry of Labour and Immigration supports a strong and diversified economy by working with job creators and other stakeholders to develop a strong and resilient workforce, promoting safe, fair and healthy workplaces and
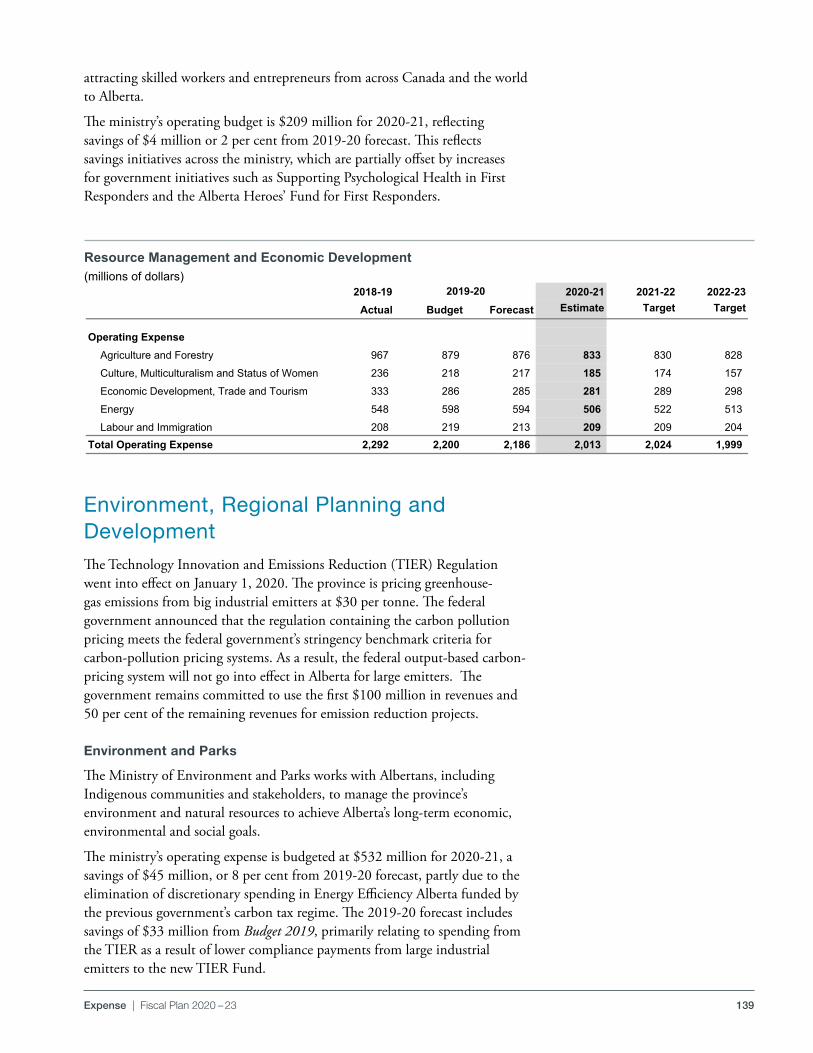
139Expense | Fiscal Plan 2020 – 23
attracting skilled workers and entrepreneurs from across Canada and the world to Alberta .
The ministry’s operating budget is $209 million for 2020-21, reflecting savings of $4 million or 2 per cent from 2019-20 forecast . This reflects savings initiatives across the ministry, which are partially offset by increases for government initiatives such as Supporting Psychological Health in First Responders and the Alberta Heroes’ Fund for First Responders .
Environment, Regional Planning and Development The Technology Innovation and Emissions Reduction (TIER) Regulation went into effect on January 1, 2020 . The province is pricing greenhouse-gas emissions from big industrial emitters at $30 per tonne . The federal government announced that the regulation containing the carbon pollution pricing meets the federal government’s stringency benchmark criteria for carbon-pollution pricing systems . As a result, the federal output-based carbon-pricing system will not go into effect in Alberta for large emitters . The government remains committed to use the first $100 million in revenues and 50 per cent of the remaining revenues for emission reduction projects .
Environment and Parks
The Ministry of Environment and Parks works with Albertans, including Indigenous communities and stakeholders, to manage the province’s environment and natural resources to achieve Alberta’s long-term economic, environmental and social goals .
The ministry’s operating expense is budgeted at $532 million for 2020-21, a savings of $45 million, or 8 per cent from 2019-20 forecast, partly due to the elimination of discretionary spending in Energy Efficiency Alberta funded by the previous government’s carbon tax regime . The 2019-20 forecast includes savings of $33 million from Budget 2019, primarily relating to spending from the TIER as a result of lower compliance payments from large industrial emitters to the new TIER Fund .
Resource Management and Economic Development(millions of dollars)
pdf name: B20_FP_EXP_carmaed.pdf Budget 2020 Fiscal PlanExpense
Resource Management and Economic Development changed title(millions of dollars)
2018-19 2020-21 2021-22 2022-23Actual Budget Forecast Estimate Target Target
Operating ExpenseAgriculture and Forestry 967 879 876 833 830 828 Culture, Multiculturalism and Status of Women 236 218 217 185 174 157 Economic Development, Trade and Tourism 333 286 285 281 289 298 Energy 548 598 594 506 522 513 Labour and Immigration 208 219 213 209 209 204
Total Operating Expense 2,292 2,200 2,186 2,013 2,024 1,999
pdf named: B20_FP_EXP_carmaed.pdf
2019-20
S:\TBF\MinShare\PublnsProd\CorpFin\OBM.PUBLNS-2020-21\B20_Fiscal-Plan_vol\06_EXPense_B20\source-docs\All overview tables/CARMED 2/18/20204:21 PM
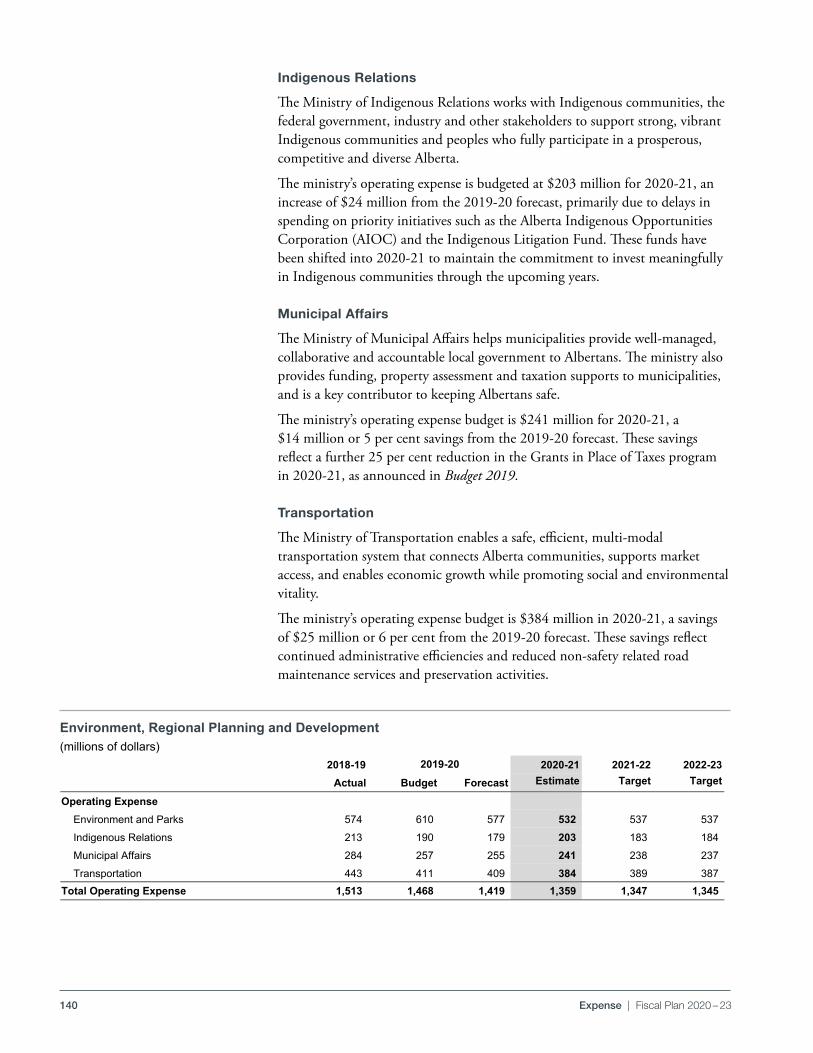
140 Expense | Fiscal Plan 2020 – 23
Indigenous Relations
The Ministry of Indigenous Relations works with Indigenous communities, the federal government, industry and other stakeholders to support strong, vibrant Indigenous communities and peoples who fully participate in a prosperous, competitive and diverse Alberta .
The ministry’s operating expense is budgeted at $203 million for 2020-21, an increase of $24 million from the 2019-20 forecast, primarily due to delays in spending on priority initiatives such as the Alberta Indigenous Opportunities Corporation (AIOC) and the Indigenous Litigation Fund . These funds have been shifted into 2020-21 to maintain the commitment to invest meaningfully in Indigenous communities through the upcoming years .
Municipal Affairs
The Ministry of Municipal Affairs helps municipalities provide well-managed, collaborative and accountable local government to Albertans . The ministry also provides funding, property assessment and taxation supports to municipalities, and is a key contributor to keeping Albertans safe .
The ministry’s operating expense budget is $241 million for 2020-21, a $14 million or 5 per cent savings from the 2019-20 forecast . These savings reflect a further 25 per cent reduction in the Grants in Place of Taxes program in 2020-21, as announced in Budget 2019 .
Transportation
The Ministry of Transportation enables a safe, efficient, multi-modal transportation system that connects Alberta communities, supports market access, and enables economic growth while promoting social and environmental vitality .
The ministry’s operating expense budget is $384 million in 2020-21, a savings of $25 million or 6 per cent from the 2019-20 forecast . These savings reflect continued administrative efficiencies and reduced non-safety related road maintenance services and preservation activities .
Environment, Regional Planning and Development(millions of dollars)
pdf name: B20_FP_EXP_earpd.pdf Budget 2020 Fiscal PlanExpense
Environment, Regional Planning and Development(millions of dollars)
2018-19 2020-21 2021-22 2022-23Actual Budget Forecast Estimate Target Target
Operating ExpenseEnvironment and Parks 574 610 577 532 537 537 Indigenous Relations 213 190 179 203 183 184 Municipal Affairs 284 257 255 241 238 237 Transportation 443 411 409 384 389 387
Total Operating Expense 1,513 1,468 1,419 1,359 1,347 1,345
pdf named: B20_FP_EXP_earpd.pdf
2019-20
S:\TBF\MinShare\PublnsProd\CorpFin\OBM.PUBLNS-2020-21\B20_Fiscal-Plan_vol\06_EXPense_B20\source-docs\/All overview tablesERPD 2/14/20206:12 PM
141Expense | Fiscal Plan 2020 – 23
General Government The government will lower service delivery costs by expanding online services and developing self-serve options . Further savings will be achieved by improving densities in government-owned and leased space to reduce government’s footprint and its reliance on expensive leased space . The long-term goal is to improve office space density by over one third, resulting in operating, maintenance and energy consumption savings .
The government will release a 20-year Strategic Capital Plan to ensure Alberta has a long-term view to meeting the province’s infrastructure needs . In delivering these capital projects, the government will use other procurement methods, such as public-private partnerships, where value for money for taxpayers can be demonstrated .
Executive Council
Executive Council supports the Premier, Cabinet and ministries as they implement the government’s agenda . The ministry helps ensure Alberta’s priorities are advanced across Canada and internationally .
The ministry’s operating budget is decreasing by approximately $3 million to $16 .6 million in 2020-21, ultimately decreasing to $16 .5 million in 2022-23 . This includes $3 .7 million for Intergovernmental Relations in each year .
Infrastructure
The Ministry of Infrastructure provides innovative, high quality and well-designed public infrastructure that contributes to the province’s economy and Albertans’ quality of life .
The ministry’s operating expense budget is $472 million in 2020-21, an increase of $14 million or 3 per cent from the 2019-20 forecast . However, this is a $16 million savings from 2018-19 spending under the previous government . The increase reflects one-time costs related to the cancellation of the Edmonton Clinical Laboratory Hub project . Ongoing savings initiatives reduce operating expense to $426 million by 2022-23 .
Service Alberta
The Ministry of Service Alberta has a strategic role within government to drive innovation and foster efficient delivery of government programs, services and information, while reducing unnecessary regulatory burdens for Albertans . The ministry also supports Alberta’s economic recovery by ensuring the marketplace is competitive and fair, and that consumers are protected .
The ministry’s operating expense budget is $482 million in 2020-21, a 6 per cent saving compared to the 2019-20 forecast . The majority of ministry savings come from implementing a new Enterprise Resource Planning system, and operational efficiencies .
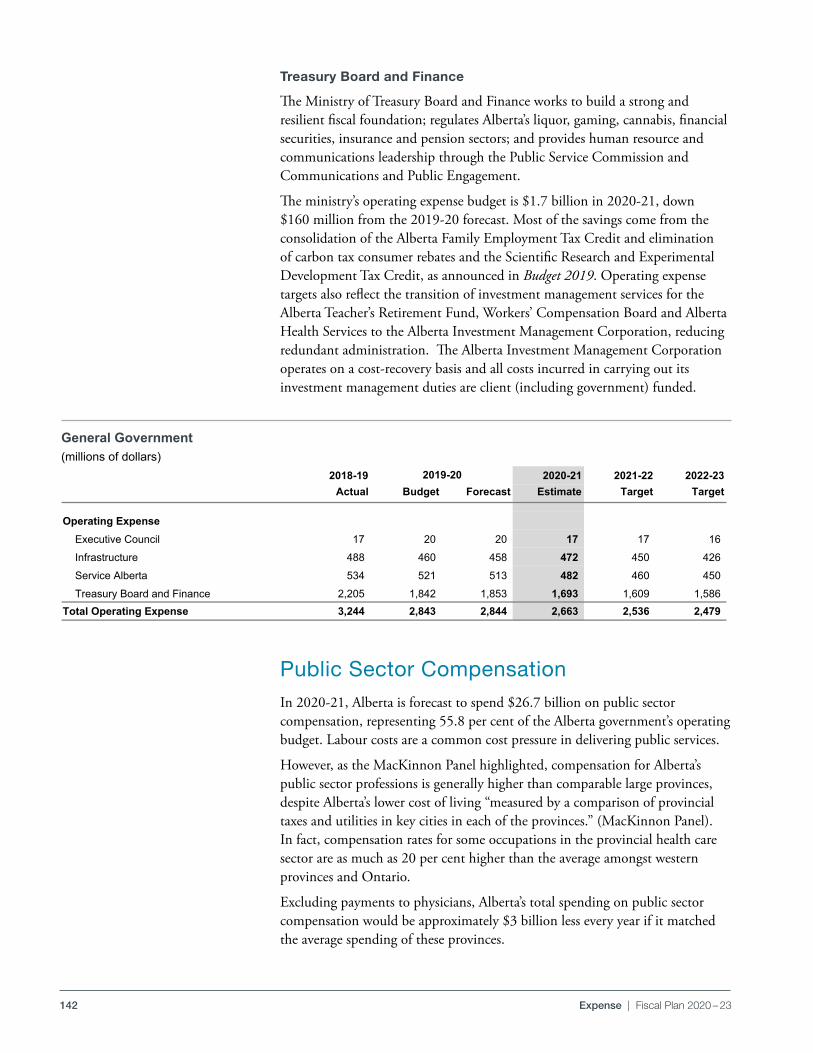
142 Expense | Fiscal Plan 2020 – 23
Treasury Board and Finance
The Ministry of Treasury Board and Finance works to build a strong and resilient fiscal foundation; regulates Alberta’s liquor, gaming, cannabis, financial securities, insurance and pension sectors; and provides human resource and communications leadership through the Public Service Commission and Communications and Public Engagement .
The ministry’s operating expense budget is $1 .7 billion in 2020-21, down $160 million from the 2019-20 forecast . Most of the savings come from the consolidation of the Alberta Family Employment Tax Credit and elimination of carbon tax consumer rebates and the Scientific Research and Experimental Development Tax Credit, as announced in Budget 2019 . Operating expense targets also reflect the transition of investment management services for the Alberta Teacher’s Retirement Fund, Workers’ Compensation Board and Alberta Health Services to the Alberta Investment Management Corporation, reducing redundant administration . The Alberta Investment Management Corporation operates on a cost-recovery basis and all costs incurred in carrying out its investment management duties are client (including government) funded .
Public Sector Compensation In 2020-21, Alberta is forecast to spend $26 .7 billion on public sector compensation, representing 55 .8 per cent of the Alberta government’s operating budget . Labour costs are a common cost pressure in delivering public services .
However, as the MacKinnon Panel highlighted, compensation for Alberta’s public sector professions is generally higher than comparable large provinces, despite Alberta’s lower cost of living “measured by a comparison of provincial taxes and utilities in key cities in each of the provinces .” (MacKinnon Panel) . In fact, compensation rates for some occupations in the provincial health care sector are as much as 20 per cent higher than the average amongst western provinces and Ontario .
Excluding payments to physicians, Alberta’s total spending on public sector compensation would be approximately $3 billion less every year if it matched the average spending of these provinces .
General Government(millions of dollars)
pdf name: B20_FP_EXP_gg.pdf Budget 2020 Fiscal PlanExpense
General Government(millions of dollars)
2018-19 2020-21 2021-22 2022-23Actual Budget Forecast Estimate Target Target
Operating ExpenseExecutive Council 17 20 20 17 17 16 Infrastructure 488 460 458 472 450 426 Service Alberta 534 521 513 482 460 450 Treasury Board and Finance 2,205 1,842 1,853 1,693 1,609 1,586
Total Operating Expense 3,244 2,843 2,844 2,663 2,536 2,479
pdf named: B20_FP_EXP_gg.pdf
2019-20
S:\TBF\MinShare\PublnsProd\CorpFin\OBM.PUBLNS-2020-21\B20_Fiscal-Plan_vol\06_EXPense_B20\source-docs\/All overview tablesGenGov 2/17/202011:48 AM
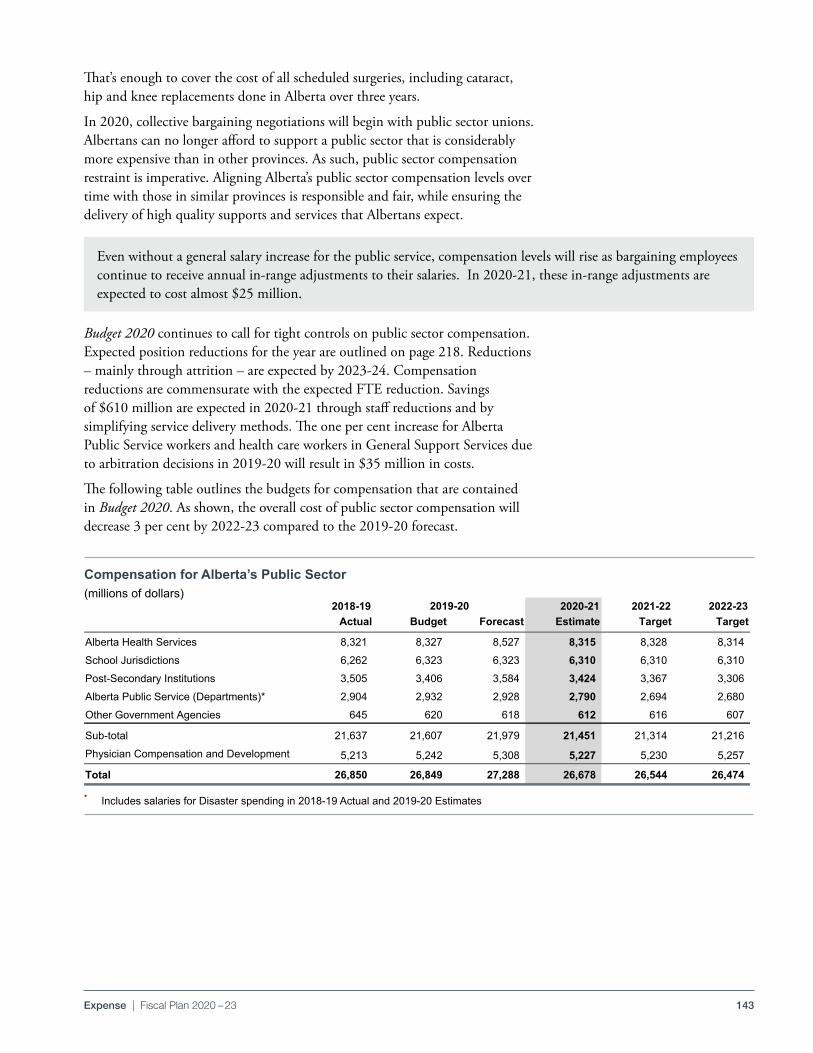
143Expense | Fiscal Plan 2020 – 23
That’s enough to cover the cost of all scheduled surgeries, including cataract, hip and knee replacements done in Alberta over three years .
In 2020, collective bargaining negotiations will begin with public sector unions . Albertans can no longer afford to support a public sector that is considerably more expensive than in other provinces . As such, public sector compensation restraint is imperative . Aligning Alberta’s public sector compensation levels over time with those in similar provinces is responsible and fair, while ensuring the delivery of high quality supports and services that Albertans expect .
Budget 2020 continues to call for tight controls on public sector compensation . Expected position reductions for the year are outlined on page 218 . Reductions – mainly through attrition – are expected by 2023-24 . Compensation reductions are commensurate with the expected FTE reduction . Savings of $610 million are expected in 2020-21 through staff reductions and by simplifying service delivery methods . The one per cent increase for Alberta Public Service workers and health care workers in General Support Services due to arbitration decisions in 2019-20 will result in $35 million in costs .
The following table outlines the budgets for compensation that are contained in Budget 2020 . As shown, the overall cost of public sector compensation will decrease 3 per cent by 2022-23 compared to the 2019-20 forecast .
Compensation for Alberta’s Public Sector (millions of dollars)
* Includes salaries for Disaster spending in 2018-19 Actual and 2019-20 Estimates
pdf named: B20-FP-EXP_sabts.pdf Budget 2020Fiscal Plan Expense
Salaries and Benefits Targets Summary(in millions)
2018-19 2020-21 2021-22 2022-23Actual Budget Forecast Estimate Target Target
Alberta Health Services 8,321 8,327 8,527 8,315 8,328 8,314 School Jurisdictions 6,262 6,323 6,323 6,310 6,310 6,310 Post-Secondary Institutions 3,505 3,406 3,584 3,424 3,367 3,306 Alberta Public Service (Departments)* 2,904 2,932 2,928 2,790 2,694 2,680 Other Government Agencies 645 620 618 612 616 607
Sub-total 21,637 21,607 21,979 21,451 21,314 21,216 Physician Compensation and Development 5,213 5,242 5,308 5,227 5,230 5,257
Total 26,850 26,849 27,288 26,678 26,544 26,474
* Includes salaries for Disaster spending in 2018-19 Actual and 2019-20 target 610- 814- -3.0%
pdf named: B20-FP-EXP_sabts.pdf
2019-20
S:\TBF\MinShare\PublnsProd\CorpFin\OBM.PUBLNS-2020-21\B20_Fiscal-Plan_vol\06_EXPense_B20\source-docs\All overview tables/Public Sector Comp 2/18/2020/ 12:10 PM
Even without a general salary increase for the public service, compensation levels will rise as bargaining employees continue to receive annual in-range adjustments to their salaries . In 2020-21, these in-range adjustments are expected to cost almost $25 million .
144 Expense | Fiscal Plan 2020 – 23
Streamlining Government Processes
Red Tape Reduction
Unnecessary red tape prevents employers from creating jobs and businesses from growing, and generally makes life difficult for all of us . Regulatory burdens are costing Albertans money and time that could be better spent with family and a better way of life . Our goal is simple: identify and cut the red tape that is preventing Albertans from obtaining the services they need, and eliminate unnecessary red tape by at least one-third .
We immediately established an action plan to:
• Cut red tape within government to allow the public sector to focus on serving Albertans better;
• Create a red tape reduction website to crowdsource input from businesses, organizations and the public;
• Form industry panels to help us identify unnecessary red tape in priority sectors of Alberta’s economy;
• Move from a process to outcome-based regulatory approach;
• Appointed an Associate Minister of Red Tape Reduction;
• Fight for an end to interprovincial barriers to free trade, and
• Passed Bill 4: the Red Tape Reduction Act to entrench the Government of Alberta’s commitment to eliminate and prevent unnecessary regulatory and administrative requirements .
Since then, we successfully eliminated various items of red tape, received over 4,000 submissions to our website (CutRedTape .Alberta .ca) and met with several industry panels in oil and gas, hospitality and tourism, and small business . We also passed Bill 25: the Red Tape Reduction Implementation Act. This bill helped cut red tape by amending 11 other pieces of legislation across 6 departments .
Here are some highlights from the past year:
• Reclassified oil well service rigs, which reduced the administrative burden for industry by exempting oil well service rigs from some regulatory requirements on commercial vehicles . This initiative works to align with other provinces .
• Reduced the burden on AISH applicants with disabilities and mental health challenges by no longer requiring them to fill out financial eligibility forms when seeking Legal Aid .
• Set up e-transfers for Community Grant Programs . This will allow organizations to receive their funding within three to five business days, rather than an average wait of 100 days .
• Alberta ranchers who go beyond the government’s environmental standards are being rewarded with extended 20-year leases . This gives ranchers long-term economic stability and clears the backlog of leases waiting approval .
145Expense | Fiscal Plan 2020 – 23
• Safety codes officers and master electricians will no longer pay administrative fees for certain services, such as training equivalency requests, preparation of records/photocopying and replacing certificates or identification cards .
• Reduced delays for forest-management agreements that support forestry jobs and ensure the best environmental and resource-management outcomes .
All of this work was resourced within current ministry budgets .
Program Review
Government is working to implement a comprehensive program review process that formalizes the recommendations of the MacKinnon Panel . This process will focus on ensuring services are in the public interest, eliminating waste and duplication, and ensuring programs are effective and efficient . Identifying efficiencies or cost-containment could produce significant savings . We will also consider Auditor General recommendations with the focus on program outcomes and business planning expectations as part of this work . Priority will be given to programs that account for a large portion of government expenditures . This process is expected to be ongoing and embedded in future fiscal planning cycles .
The first round of program reviews will incorporate and leverage existing ministry-initiated reviews . Some of the reviews currently underway include: Advanced Education’s Post-Secondary Transformation Initiative, Education’s curriculum-led program review, and Social Services program transformation including income support, AISH and seniors programs .
Transforming Procurement
The MacKinnon Panel reported that the provincial government has spent an average of $4 .8 billion a year on goods and services, and contracts . The Panel believes a well-managed procurement method and streamlined processes could help control costs .
The government has acted on this recommendation by forming a Procurement Council to provide a regular forum for conducting ongoing dialogue among representatives from major procurement ministries and industry organizations whose members supply goods, consulting services and construction services .
The MacKinnon Panel also recommended government refresh its major procurement policy to achieve best value for taxpayers’ money . The government is implementing several changes .
A new procurement centre-led service delivery model with a government-wide Executive Procurement Steering Committee will focus on enterprise-wide procurement initiatives . This includes category management to group similar items (goods, services) under a single procurement . Bundling by category helps government better leverage its significant buying power, maximize savings and efficiencies, reduce duplication, and cut red tape .

146 Expense | Fiscal Plan 2020 – 23
Transforming Financial Services
Treasury Board and Finance, in concert with Service Alberta, is continuing to lead the transformation of government’s financial services to maximize the benefits of new technologies . This modernization will strengthen government’s financial management through more efficient transactions and improved supports such as enhanced analytics, reporting, budgeting and decision- making .
The transformation will encourage the use of centralized services to take advantage of economies of scale and support such functions as procurement, accounts payable, accounts receivable, expense claims and asset management accounting .
In-year Savings and Jobs
Aligned with government’s focus to control spending, and ensuring we get the best value for the money spent, further savings will be targeted in-year . Government is setting an in-year target of $59 million per year . The intent will be to use those savings to fund infrastructure that will generate or support the creation of new and sustainable jobs, boosting the economy .
147
BUDGET 2020
GOVERNMENT OF ALBERTA | 2020 –23
Fiscal PlanCapital Plan
148 Capital Plan | Fiscal Plan 2020 – 23
Table of Contents
2020 Capital Plan . . . . . . . . . . . . . . . . . . . . . . . . . . . . . . . . . . . . . . . . . . . . . . . . . . . . . . . . . . . . . . . . . . . . . 149
Municipal Support . . . . . . . . . . . . . . . . . . . . . . . . . . . . . . . . . . . . . . . . . . . . . . . . . . . . . . . . . . . . . . . . . . . . . . 150
Capital Maintenance and Renewal . . . . . . . . . . . . . . . . . . . . . . . . . . . . . . . . . . . . . . . . . . . . . . . . . . . . . . . . . . 151
Protect Quality Health Care . . . . . . . . . . . . . . . . . . . . . . . . . . . . . . . . . . . . . . . . . . . . . . . . . . . . . . . . . . . . . . . 152
Roads and Bridges . . . . . . . . . . . . . . . . . . . . . . . . . . . . . . . . . . . . . . . . . . . . . . . . . . . . . . . . . . . . . . . . . . . . . . 153
Renewing Educational Infrastructure . . . . . . . . . . . . . . . . . . . . . . . . . . . . . . . . . . . . . . . . . . . . . . . . . . . . . . . . 153
Streamlining Service Delivery . . . . . . . . . . . . . . . . . . . . . . . . . . . . . . . . . . . . . . . . . . . . . . . . . . . . . . . . . . . . . . 154
Public Safety and Emergency Services . . . . . . . . . . . . . . . . . . . . . . . . . . . . . . . . . . . . . . . . . . . . . . . . . . . . . . . 154
Family, Social Supports and Housing . . . . . . . . . . . . . . . . . . . . . . . . . . . . . . . . . . . . . . . . . . . . . . . . . . . . . . . . 154
Other . . . . . . . . . . . . . . . . . . . . . . . . . . . . . . . . . . . . . . . . . . . . . . . . . . . . . . . . . . . . . . . . . . . . . . . . . . . . . . . . 155
Public Private Partnerships (P3s) and Alternative Financing . . . . . . . . . . . . . . . . . . . . . . . . . . . . . . . . . . . . . . . 156
Investing in Canada Infrastructure Program . . . . . . . . . . . . . . . . . . . . . . . . . . . . . . . . . . . . . . . . . . . . . . . . . . . 158
2019-20 Forecast . . . . . . . . . . . . . . . . . . . . . . . . . . . . . . . . . . . . . . . . . . . . . . . . . . . . . . . . . . . . . . . . . . . . . . . 159
Capital Plan Details . . . . . . . . . . . . . . . . . . . . . . . . . . . . . . . . . . . . . . . . . . . . . . . . . . . . . . . . . . . . . . . . . . . . . 160
Note: Amounts presented in tables may not add to totals due to rounding.
149Capital Plan | Fiscal Plan 2020 – 23
2020 Capital Plan
Alberta’s Budget 2020 Capital Plan outlines responsible investments that foster economic growth and support public infrastructure that families and communities need . This plan outlines key projects that unlock Alberta’s economic growth potential, and also directly supports job growth across the province .
The 2020 Capital Plan will spend, on average, $6 .4 billion a year on infrastructure projects . This spending supports a range of jobs related to the planning, design, building and implementation of this infrastructure . Alberta-based businesses and the skilled workers they employ will have an opportunity to bid on significant provincial projects for the next three years .
At the same time, the government is committed to strong fiscal management . Budget 2019 outlined changes that were needed to ensure Alberta’s finances were sustainable . The government must stay the course . Long-term fiscal sustainability will require the government to develop realistic annual budgets and live within them . It will also require that the government continues to examine and re-examine government spending with a view to ensuring Albertans that their tax dollars are put to the best use .
The MacKinnon Panel continues to guide how the province will manage its capital assets going forward . The province’s net capital assets, per capita, are still higher than every other province . This means any new additions to Alberta’s capital stock, through projects outlined in the Capital Plan, will need to be measured . The panel recommended that Alberta’s per capita capital assets fall in line with other provinces, meaning that our per capita assets need to fall to $10,000 per capita .
The net book value of the province’s capital assets per capita will start to fall, as recommended by the MacKinnon Panel . The net book value of capital assets takes into account the existing stock of capital assets, as well as new investments and amortization . Capital assets will peak in 2020-21 at $12,393 per capita as major projects from prior plans are completed, and then will fall as capital investments outlined in this plan start to grow slower than population growth .
The plan continues to honour the government’s platform commitments and other key projects . Major continuing projects and support include an Edmonton hospital, the Calgary Cancer Centre, the Grande Prairie Hospital, Edmonton and Calgary light rail transit (LRT), and the Local Government Fiscal Framework .
The 2020 Capital Plan includes new funding for the Bow Reservoir Options Project, the Alberta Surgical Initiative Capital Program, the Northern Laboratory Equipment Upgrade Program, and the Red Deer Integrated Emergency Shelter .
The MacKinnon Panel recommended bringing Alberta’s net public capital stock in line with the average per capita capital stock in the other provinces over the next 10 years.
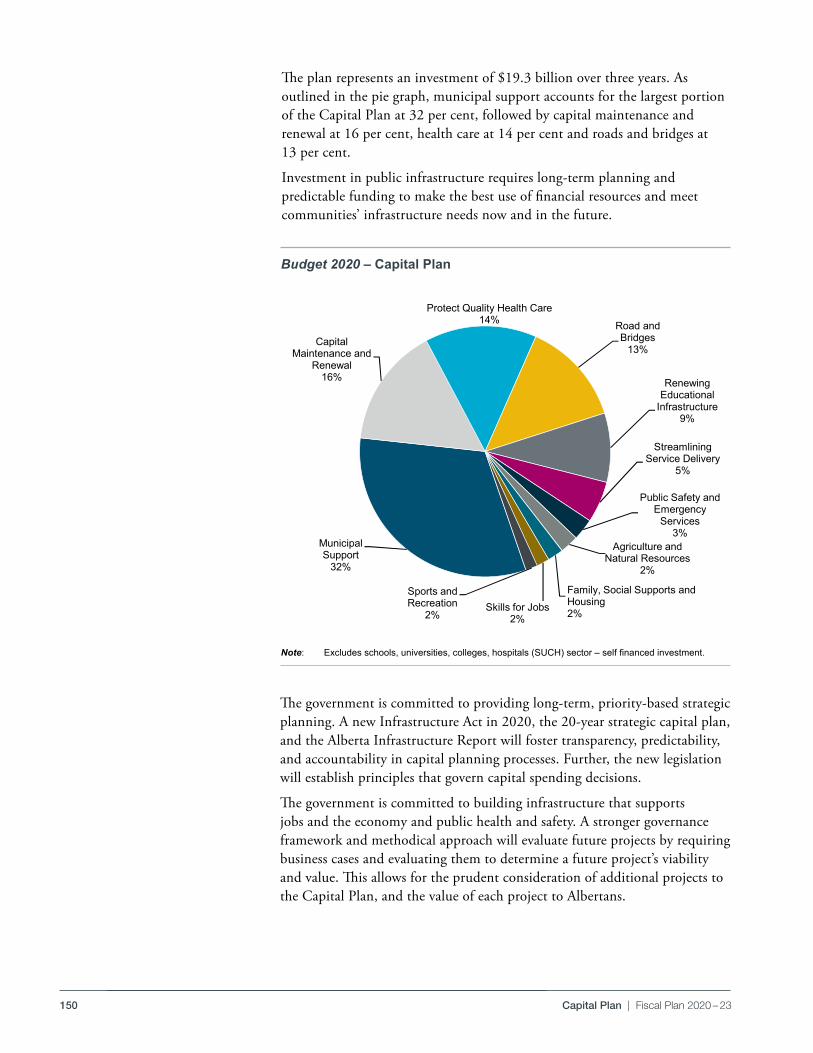
150 Capital Plan | Fiscal Plan 2020 – 23
The plan represents an investment of $19 .3 billion over three years . As outlined in the pie graph, municipal support accounts for the largest portion of the Capital Plan at 32 per cent, followed by capital maintenance and renewal at 16 per cent, health care at 14 per cent and roads and bridges at 13 per cent .
Investment in public infrastructure requires long-term planning and predictable funding to make the best use of financial resources and meet communities’ infrastructure needs now and in the future .
The government is committed to providing long-term, priority-based strategic planning . A new Infrastructure Act in 2020, the 20-year strategic capital plan, and the Alberta Infrastructure Report will foster transparency, predictability, and accountability in capital planning processes . Further, the new legislation will establish principles that govern capital spending decisions .
The government is committed to building infrastructure that supports jobs and the economy and public health and safety . A stronger governance framework and methodical approach will evaluate future projects by requiring business cases and evaluating them to determine a future project’s viability and value . This allows for the prudent consideration of additional projects to the Capital Plan, and the value of each project to Albertans .
pdf name: B20_FP_CP_b2020cp.pdf Budget 2020 Fiscal Plan Capital Plan
Budget 2020 Capital Plan
pdf name: B20_FP_CP_b2020cp.pdf
Municipal Support
32%
Capital Maintenance and
Renewal16%
Protect Quality Health Care14% Road and
Bridges13%
Renewing Educational
Infrastructure9%
Streamlining Service Delivery
5%
Public Safety and Emergency
Services3%
Agriculture and Natural Resources
2%
Family, Social Supports and Housing2%Skills for Jobs
2%
Sports and Recreation
2%
S:\TBF\MinShare\PublnsProd\CorpFin\OBM.PUBLNS-2020-21\B20_Fiscal-Plan_vol\07_Capital_Plan_B20\source-docs\2020 CP Charts for PublishingNew Feb. 14/Pie Chart 2/14/2020/4:24 PM
Budget 2020 – Capital Plan
Note: Excludesschools,universities,colleges,hospitals(SUCH)sector–selffinancedinvestment.
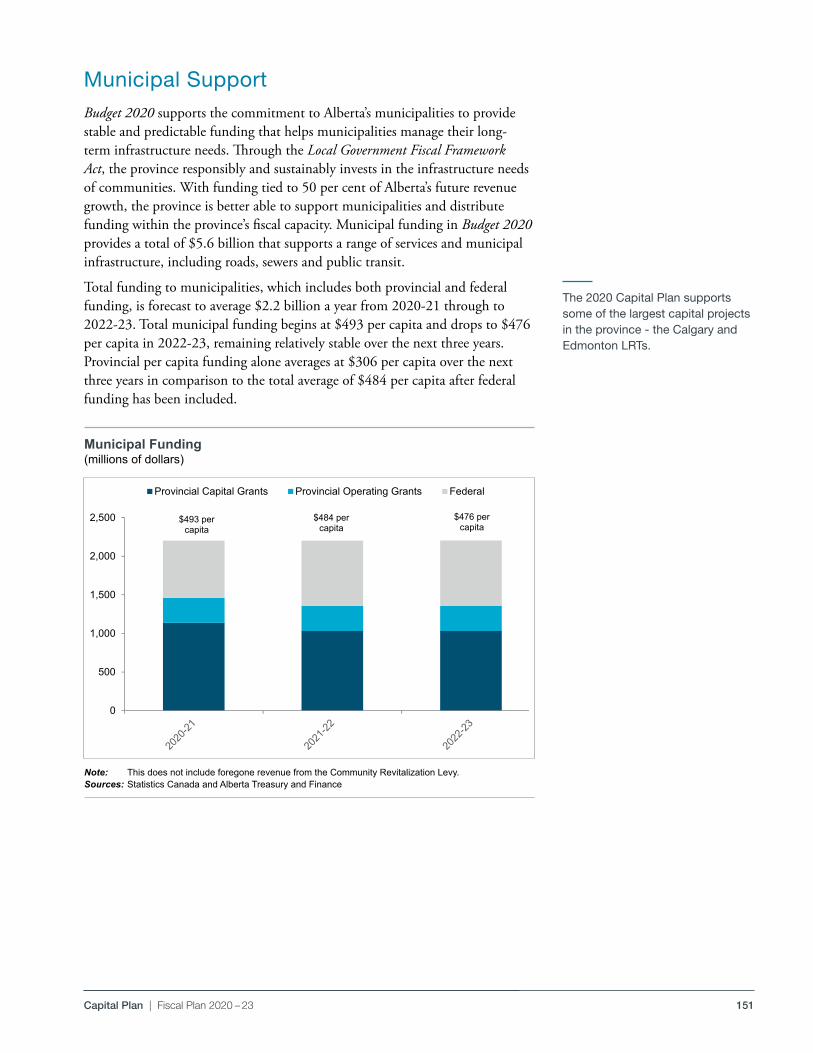
151Capital Plan | Fiscal Plan 2020 – 23
Municipal SupportBudget 2020 supports the commitment to Alberta’s municipalities to provide stable and predictable funding that helps municipalities manage their long-term infrastructure needs . Through the Local Government Fiscal Framework Act, the province responsibly and sustainably invests in the infrastructure needs of communities . With funding tied to 50 per cent of Alberta’s future revenue growth, the province is better able to support municipalities and distribute funding within the province’s fiscal capacity . Municipal funding in Budget 2020 provides a total of $5 .6 billion that supports a range of services and municipal infrastructure, including roads, sewers and public transit .
Total funding to municipalities, which includes both provincial and federal funding, is forecast to average $2 .2 billion a year from 2020-21 through to 2022-23 . Total municipal funding begins at $493 per capita and drops to $476 per capita in 2022-23, remaining relatively stable over the next three years . Provincial per capita funding alone averages at $306 per capita over the next three years in comparison to the total average of $484 per capita after federal funding has been included .
The 2020 Capital Plan supports some of the largest capital projects in the province - the Calgary and Edmonton LRTs.
Chart 3: Municipal Funding ($, per capita)
pdf name: B20_FP_CP_mf.pdf
$493 per capita
$484 per capita
$476 per capita
0
500
1,000
1,500
2,000
2,500
Provincial Capital Grants Provincial Operating Grants Federal
Municipal Funding(millions of dollars)
Note: This does not include foregone revenue from the Community Revitalization Levy.Sources: Statistics Canada and Alberta Treasury and Finance
152 Capital Plan | Fiscal Plan 2020 – 23
Capital Maintenance and RenewalCapital Maintenance and Renewal (CMR) accounts for 16 per cent of the total Capital Plan, representing a total of $2 .7 billion . A long term capital maintenance and renewal strategy is needed to ensure that capital assets in operation are most effectively sustained and repaired to generate the most value . Effectively regulating, monitoring, and responsibly managing the total CMR invested in each asset will directly affect their lifespan . This means maintaining schools, hospitals, roads and other assets for years to come .
Effectively and efficiently distributing CMR funds to all ministries is challenging in a decentralized system . As of Budget 2021,the government will centralize all CMR funds, and Treasury Board will determine ministry funding levels based on a government-wide needs assessment and prioritization process . This will increase transparency, improve tracking and reporting on CMR effectiveness, and ensure government capital assets can be reasonably maintained .
Protect Quality Health CareProtecting quality health care is a key priority for the government . With $2 .5 billion dedicated over the next three years, Budget 2020’s Capital Plan prioritizes ongoing capital projects like the state-of-the-art Calgary Cancer Centre, the newly named Gene Zwozdesky Centre at Norwood in Edmonton and the Grande Prairie Regional Hospital, scheduled to open in 2021 .
Major new infrastructure initiatives include funding for the renovation of the Peter Lougheed Centre in Calgary, bringing needed relief to Alberta’s busiest and most congested emergency department . New funding will also be made available to provide for critical laboratory equipment needs in Edmonton and Northern Alberta .
The government will also launch a new Rural Health Facilities Revitalization Program that will provide infrastructure upgrades across rural Alberta . In addition, funding will be made available for the long awaited Red Deer Regional Hospital Centre Renewal Project, improving access to critical lifesaving services for central Albertans, including expanded cardiac care .
Substantial new capital funding has also been made available to open new operating rooms, renovate existing space, and purchase new equipment in publicly owned and operated hospitals as part of the Alberta Surgical Initiative (ASI) . The initiative will reduce Alberta’s surgical wait times to an average of four months, funding 80,000 additional surgeries by 2022-23 .
The Capital Plan also includes $164 million over the next three years to open new continuing care beds by bringing back a new and improved version of the Affordable Supportive Living Initiative (ASLI) .
153Capital Plan | Fiscal Plan 2020 – 23
Roads and BridgesBuilding and improving roads and bridges effectively connects people and resources for increased commerce and tourism that results in more jobs . Strong transportation infrastructure is key to creating an efficient and robust economy . Just-in-time global supply chains mean that, to remain competitive, Alberta-based businesses need to get their goods to market quickly and cheaply . The plan invests $2 .3 billion in projects that connect Albertans, which includes the Edmonton and Calgary Ring Roads, Deerfoot Trail Upgrade in Calgary, Highway 19, and the Peace River Bridge .
Under A Blueprint for Jobs, the government is also taking steps to advance the development and construction of road and bridge capital projects that enhance the economic development potential of regions across the province . Often the private sector looks to the government as a partner in developing our province’s assets, but is told that there are other priorities . Too many times the government undervalues the role that infrastructure can play in increasing the profitability of businesses or attracting investment . The government has heard the message and will work with the private sector as a full partner, including examining the opportunity to identify alternative financing that will bring these key projects to completion sooner .
Renewing Educational InfrastructureProviding all Alberta students with access to education is a continuous priority . Schools are the foundation of learning and knowledge, and investment in new school projects ensures students continue to have access in expanding and developing communities . Five months ago, the 2019 Capital Plan supported 25 school projects bringing the total number of schools in various phases of planning and construction to over 200 schools across the province .
The 2020 Capital Plan invests $1 .5 billion towards new schools and modernization projects across Alberta over the next three years to ensure school infrastructure and learning needs are accommodated . The plan supports the construction of nine previously announced new schools projects to help address capacity pressures and accommodate new students, as well as two new modernization school projects to help address building conditions .

154 Capital Plan | Fiscal Plan 2020 – 23
Streamlining Service DeliveryService delivery innovation within the public service effectively leverages home-grown information technology (IT) systems . This year’s plan invests $927 million in projects to deliver services to Albertans . It also continues to fund previously committed projects such as Enabling New Models of Care (Ministry of Health), Integrated Decision Approach (Ministry of Energy), Justice Digital (Ministry of Justice and Solicitor General), and One Information Management and Technology (Ministry of Service Alberta), projects that support transforming and streamlining public service processes .
Funding under this category will also be used to expand the Alberta Business Portal, a suite of applications that provide Alberta and international businesses with comprehensive data and information to help them make key investment decisions, while connecting investors and partners with business opportunities here in the province .
Public Safety and Emergency ServicesThe 2020 Capital Plan will invest $487 million over the next three years for public safety and emergency services . The floods of 2013 resulted in over $4 billion of insured and uninsured damage in the most heavily populated watershed, the Bow River basin . The Capital Plan will fund $15 million for the Bow Reservoir Options project, a four phase project to assess the feasibility of a multi-use dam on the Bow River upstream from Calgary .
Family, Social Supports and HousingOver the next three years, $353 million will be invested for families and communities in need of affordable housing and social supports, in making housing more affordable and accessible, and in protecting vulnerable Albertans by maintaining access to the vital housing and services they need . This investment builds 1,197 units for Alberta seniors, 1,117 non-seniors affordable housing units and 500 shelter spaces .
The government commits $7 million in the 2020 Capital Plan for the Red Deer Integrated Emergency Shelter to address the urgent need for a larger, more functional and integrated shelter to accommodate the current demand for shelter spaces throughout the year . The new integrated emergency homeless shelter will be targeted towards adults, by expanding the existing facility to accommodate approximately 160 new shelter spaces .
The government continues to explore strategic options through mixed-income and public private partnerships (P3s) where cost efficiencies can be achieved . The 2020 Capital Plan supports vulnerable Albertans through ongoing projects such as the Seniors Housing Development and Renewal, Family and Community Housing Development and Renewal, and Indigenous Housing Capital Program . The plan continues to invest in maintaining the 36,000 government-owned and supported housing units across Alberta .
155Capital Plan | Fiscal Plan 2020 – 23
OtherPost-secondary institutions will receive $288 million over the next three years to build and renew colleges and universities . Post-secondary construction, upgrade and renewal projects can significantly improve the use of space . Investments are targeted to enhance the learning and development environment and to accommodate growth . Ongoing projects include the University of Calgary’s MacKimmie Complex, University of Alberta’s Dentistry Pharmacy Renewal, and Northern Lakes College High Prairie Consolidation .
Sport, recreation, cultural and community facilities will be supported through $266 million in funding . This includes investment in the Community Facility Enhancement Program to buy, build and upgrade public-use community facilities . It also includes other projects such as renovating the Telus World of Science and Winspear Centre in Edmonton, and the Vivo for Healthier Generations Centre in Calgary .
156 Capital Plan | Fiscal Plan 2020 – 23
Public Private Partnerships (P3s) and Alternative FinancingThe government is focused on finding innovative and alternative ways to finance and deliver infrastructure projects through public private partnerships (P3s) . In the P3 model, a contractor is hired to design, build, and partially finance and maintain a project such as a building or road . This presents an opportunity to engage the private sector to deliver infrastructure projects when selected projects are deemed to be eligible and thus be more competitively delivered through a P3 model .
A key distinction between P3s and traditional design-bid-build capital projects relate to the allocation of risk . Some risks include risks in design, procurement, cost overruns, construction delays, and market conditions . Under the traditional model, the government assumes most of the risk . Under a P3 model, the aim is to distribute the financial, technical and operational risks optimally between both the private sector and the government, thereby effectively shifting or reducing some of the risk associated with capital projects from the government to the private sector .
Collaboration leverages private sector expertise and economies of scale that can produce significant benefits to the province when proceeding with P3 capital projects .
For projects that meet the criteria outlined by Alberta Infrastructure on the next page, every potential P3 project undergoes a value for money (VFM) assessment to determine whether a P3 project delivery method is the best option for that project . The goal of a P3 is to provide value and to do so, the P3 must cost less than the traditional project delivery method over the life of the project’s contract .
The types of projects currently under P3 consideration include schools, highways and hospitals . The Capital Plan projects being assessed under the P3 model are the Deerfoot Trail Upgrade and a bundle of high schools in the Edmonton and Calgary regions .
P3 projects under consideration could total $2 billion under the
2020 Capital Plan.
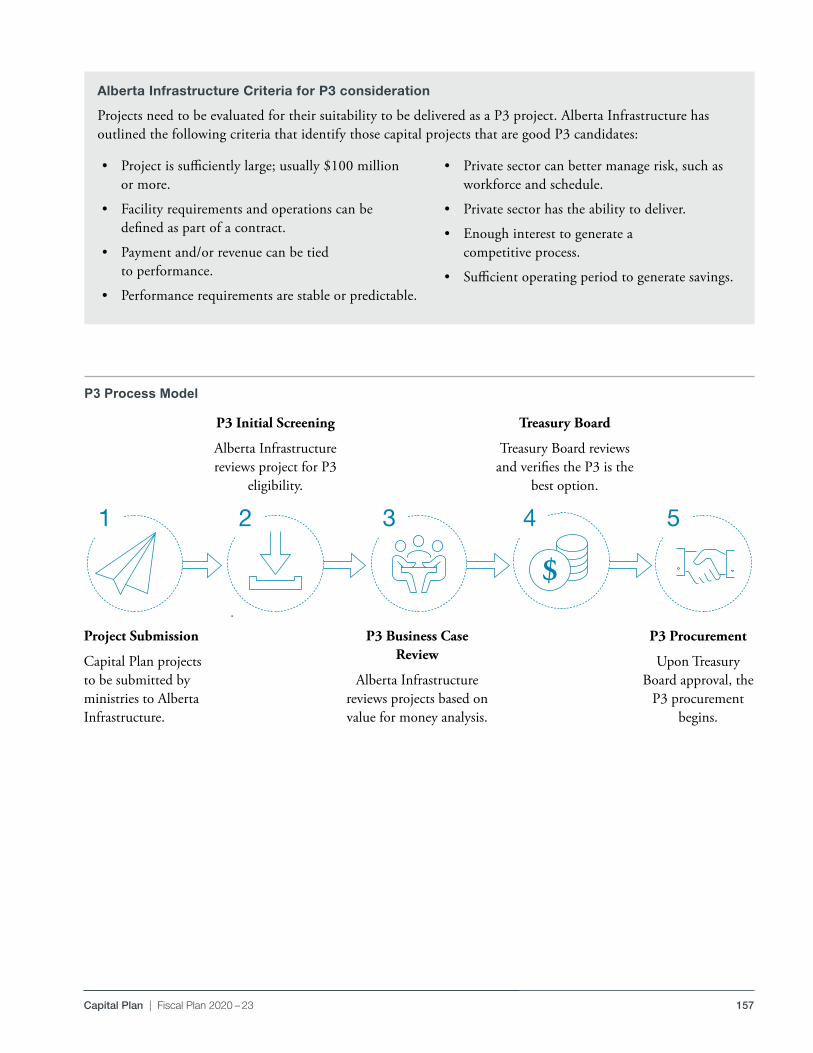
157Capital Plan | Fiscal Plan 2020 – 23
Alberta Infrastructure Criteria for P3 consideration
Projects need to be evaluated for their suitability to be delivered as a P3 project . Alberta Infrastructure has outlined the following criteria that identify those capital projects that are good P3 candidates:
Project Submission
Capital Plan projects to be submitted by ministries to Alberta Infrastructure .
P3 Business Case Review
Alberta Infrastructure reviews projects based on value for money analysis .
P3 Initial Screening
Alberta Infrastructure reviews project for P3
eligibility .
Treasury Board
Treasury Board reviews and verifies the P3 is the
best option .
P3 Procurement
Upon Treasury Board approval, the
P3 procurement begins .
$
P3 Process Model
1 2 43 5
• Project is sufficiently large; usually $100 million or more .
• Facility requirements and operations can be defined as part of a contract .
• Payment and/or revenue can be tied to performance .
• Performance requirements are stable or predictable .
• Private sector can better manage risk, such as workforce and schedule .
• Private sector has the ability to deliver .
• Enough interest to generate a competitive process .
• Sufficient operating period to generate savings .
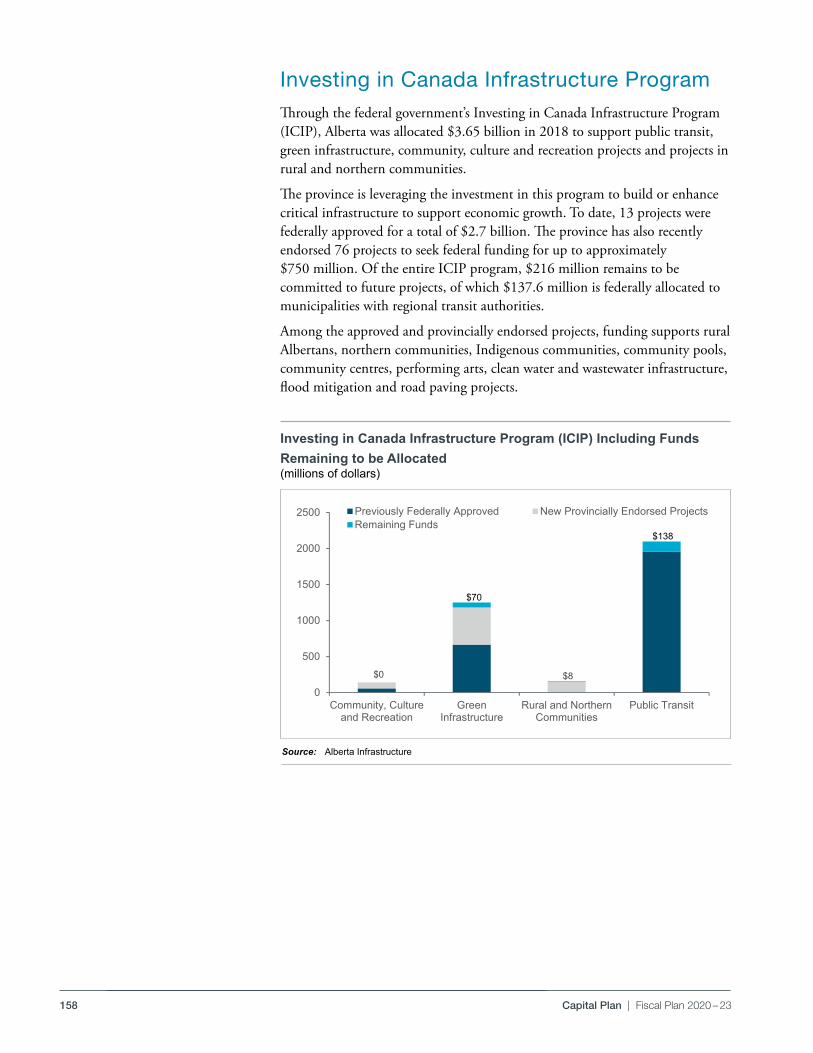
158 Capital Plan | Fiscal Plan 2020 – 23
Investing in Canada Infrastructure ProgramThrough the federal government’s Investing in Canada Infrastructure Program (ICIP), Alberta was allocated $3 .65 billion in 2018 to support public transit, green infrastructure, community, culture and recreation projects and projects in rural and northern communities .
The province is leveraging the investment in this program to build or enhance critical infrastructure to support economic growth . To date, 13 projects were federally approved for a total of $2 .7 billion . The province has also recently endorsed 76 projects to seek federal funding for up to approximately $750 million . Of the entire ICIP program, $216 million remains to be committed to future projects, of which $137 .6 million is federally allocated to municipalities with regional transit authorities .
Among the approved and provincially endorsed projects, funding supports rural Albertans, northern communities, Indigenous communities, community pools, community centres, performing arts, clean water and wastewater infrastructure, flood mitigation and road paving projects .S:\TBF\MinShare\PublnsProd\CorpFin\OBM.PUBLNS-2020-21\B20_Fiscal-Plan_vol\07_Capital_Plan_B20\source-docs\2020 CP Charts for
PublishingNew Feb. 13/Chart 2
Budget 2019 Fiscal Plan Capital Plan
Investing in Canada Infrastructure Program (ICIP)
Remaining Funds by ICIP Funding Stream
pdf name: B20_FP_CP_icip.pdf
$0
$70
$8
$138
0
500
1000
1500
2000
2500
Community, Cultureand Recreation
GreenInfrastructure
Rural and NorthernCommunities
Public Transit
Previously Federally Approved New Provincially Endorsed ProjectsRemaining Funds
S:\TBF\MinShare\PublnsProd\CorpFin\OBM.PUBLNS-2020-21\B20_Fiscal-Plan_vol\07_Capital_Plan_B20\source-docs\2020 CP Charts for PublishingNew Feb. 13/Chart 2 2/13/20209:17 AM
Investing in Canada Infrastructure Program (ICIP) Including Funds Remaining to be Allocated(millions of dollars)
Source: Alberta Infrastructure
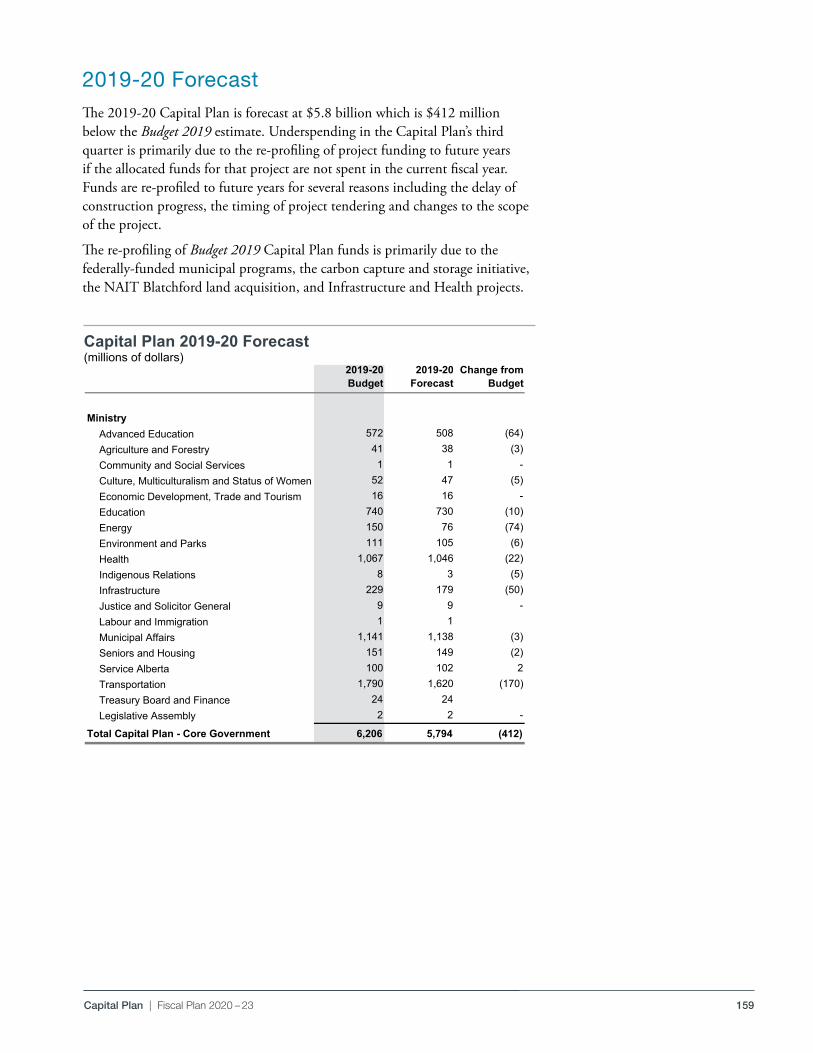
159Capital Plan | Fiscal Plan 2020 – 23
2019-20 ForecastThe 2019-20 Capital Plan is forecast at $5 .8 billion which is $412 million below the Budget 2019 estimate . Underspending in the Capital Plan’s third quarter is primarily due to the re-profiling of project funding to future years if the allocated funds for that project are not spent in the current fiscal year . Funds are re-profiled to future years for several reasons including the delay of construction progress, the timing of project tendering and changes to the scope of the project .
The re-profiling of Budget 2019 Capital Plan funds is primarily due to the federally-funded municipal programs, the carbon capture and storage initiative, the NAIT Blatchford land acquisition, and Infrastructure and Health projects .
pdf name: B20_FP_CP_cptq.pdf Budget 2019 Fiscal Plan Capital Plan
2019-20Budget
2019-20Forecast
Change from Budget
MinistryAdvanced Education 572 508 (64)Agriculture and Forestry 41 38 (3)Community and Social Services 1 1 -Culture, Multiculturalism and Status of Women 52 47 (5)Economic Development, Trade and Tourism 16 16 -Education 740 730 (10)Energy 150 76 (74)Environment and Parks 111 105 (6)Health 1,067 1,046 (22)Indigenous Relations 8 3 (5)Infrastructure 229 179 (50)Justice and Solicitor General 9 9 -Labour and Immigration 1 1Municipal Affairs 1,141 1,138 (3)Seniors and Housing 151 149 (2)Service Alberta 100 102 2Transportation 1,790 1,620 (170)Treasury Board and Finance 24 24Legislative Assembly 2 2 -
Total Capital Plan - Core Government 6,206 5,794 (412)
pdf name: B20_FP_CP_cptq.pdf
S:\TBF\MinShare\PublnsProd\CorpFin\OBM.PUBLNS-2020-21\B20_Fiscal-Plan_vol\07_Capital_Plan_B20\source-docs\2020 CP Charts for PublishingNew Feb19 1448Q3 Summary 2/19/20203:29 PM
Capital Plan 2019-20 Forecast(millions of dollars)
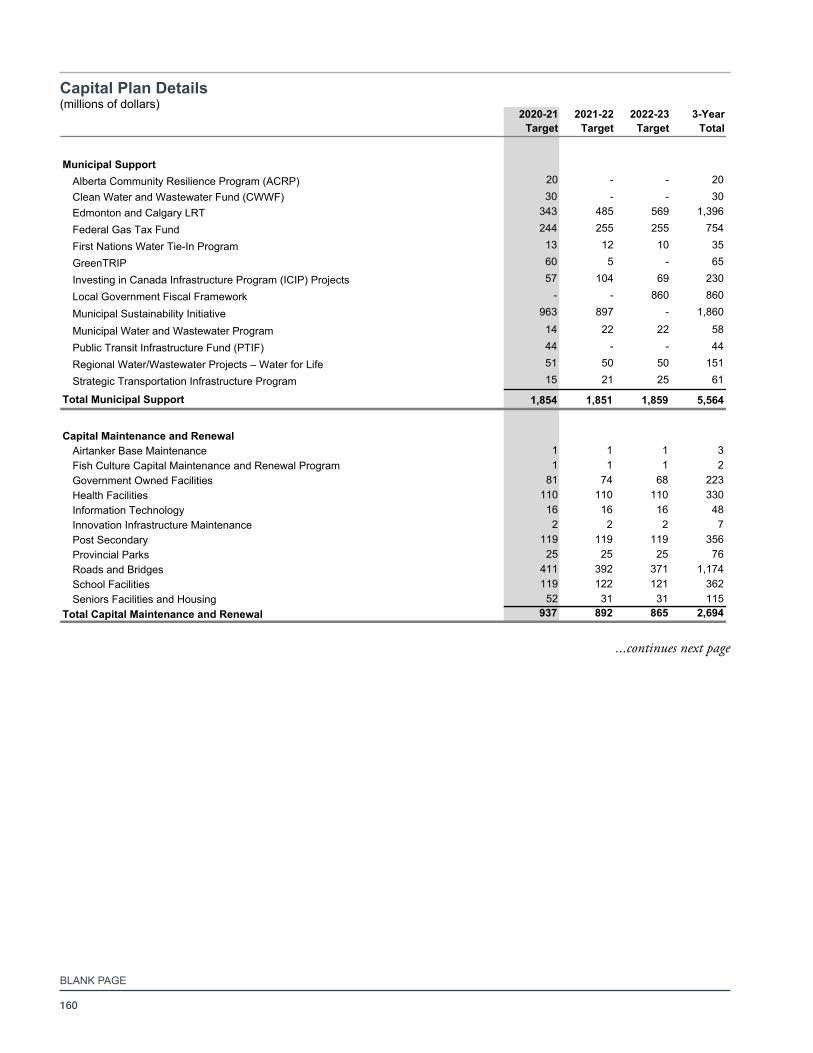
160
BLANK PAGE
pdf named: B20_FP_CP_cpd-1.pdf Budget 2020Capital Plan Spending
Capital Plan Details(millions of dollars)
2020-21Target
2021-22Target
2022-23Target
3-YearTotal
Municipal SupportAlberta Community Resilience Program (ACRP) 20 - - 20Clean Water and Wastewater Fund (CWWF) 30 - - 30Edmonton and Calgary LRT 343 485 569 1,396
Federal Gas Tax Fund 244 255 255 754
First Nations Water Tie-In Program 13 12 10 35
GreenTRIP 60 5 - 65
Investing in Canada Infrastructure Program (ICIP) Projects 57 104 69 230
Local Government Fiscal Framework - - 860 860
Municipal Sustainability Initiative 963 897 - 1,860
Municipal Water and Wastewater Program 14 22 22 58
Public Transit Infrastructure Fund (PTIF) 44 - - 44
Regional Water/Wastewater Projects – Water for Life 51 50 50 151
Strategic Transportation Infrastructure Program 15 21 25 61
Total Municipal Support 1,854 1,851 1,859 5,564
Capital Maintenance and RenewalAirtanker Base Maintenance 1 1 1 3Fish Culture Capital Maintenance and Renewal Program 1 1 1 2Government Owned Facilities 81 74 68 223Health Facilities 110 110 110 330Information Technology 16 16 16 48Innovation Infrastructure Maintenance 2 2 2 7Post Secondary 119 119 119 356Provincial Parks 25 25 25 76Roads and Bridges 411 392 371 1,174School Facilities 119 122 121 362Seniors Facilities and Housing 52 31 31 115
Total Capital Maintenance and Renewal 937 892 865 2,694
pdf name: B20_FP_CP_cpd-1.pdf
S:\TBF\MinShare\PublnsProd\CorpFin\OBM.PUBLNS-2020-21\B20_Fiscal-Plan_vol\07_Capital_Plan_B20\source-docs\B20_FP_CP_Details-tables v3 / Cap Plan Det1 2/11/2020 / 3:14 PM
Capital Plan Details(millions of dollars)
...continues next page
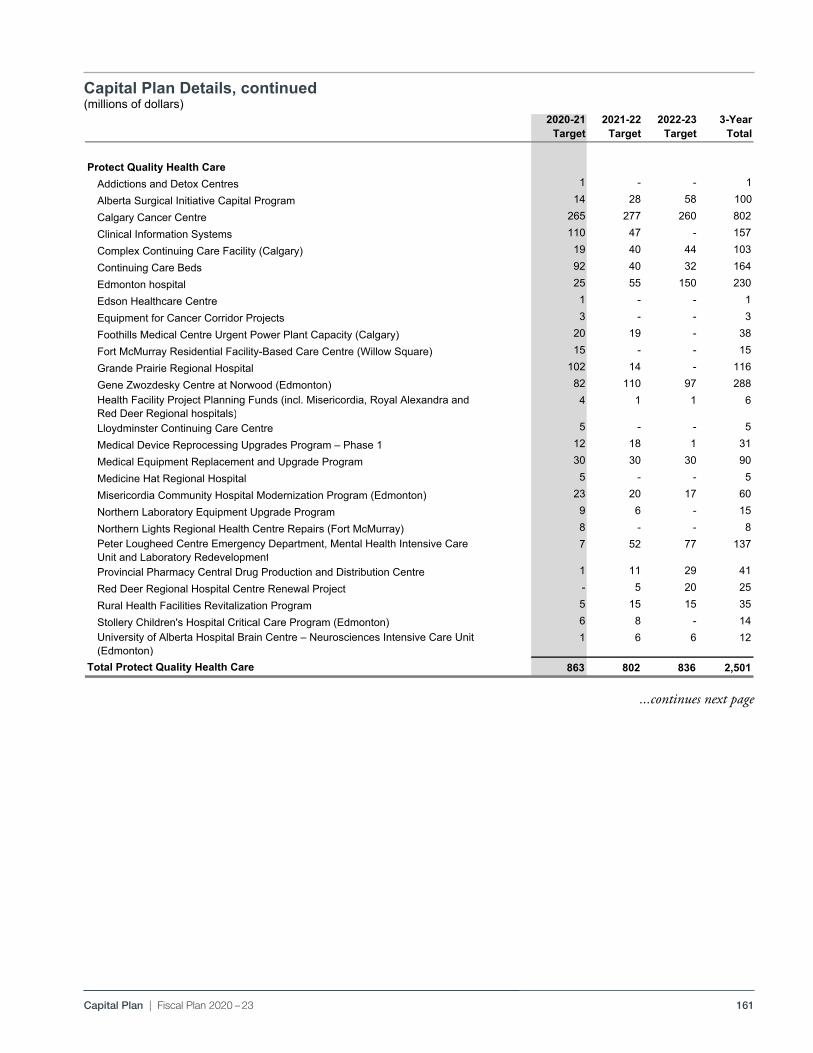
161Capital Plan | Fiscal Plan 2020 – 23
pdf named: B20_FP_CP_cpd-2.pdf Budget 2020Capital Plan Spending
Capital Plan Details, continued(millions of dollars)
2020-21Target
2021-22Target
2022-23Target
3-YearTotal
Protect Quality Health CareAddictions and Detox Centres 1 - - 1
Alberta Surgical Initiative Capital Program 14 28 58 100
Calgary Cancer Centre 265 277 260 802
Clinical Information Systems 110 47 - 157
Complex Continuing Care Facility (Calgary) 19 40 44 103
Continuing Care Beds 92 40 32 164
Edmonton hospital 25 55 150 230
Edson Healthcare Centre 1 - - 1
Equipment for Cancer Corridor Projects 3 - - 3
Foothills Medical Centre Urgent Power Plant Capacity (Calgary) 20 19 - 38
Fort McMurray Residential Facility-Based Care Centre (Willow Square) 15 - - 15
Grande Prairie Regional Hospital 102 14 - 116
Gene Zwozdesky Centre at Norwood (Edmonton) 82 110 97 288Health Facility Project Planning Funds (incl. Misericordia, Royal Alexandra and Red Deer Regional hospitals)
4 1 1 6
Lloydminster Continuing Care Centre 5 - - 5
Medical Device Reprocessing Upgrades Program – Phase 1 12 18 1 31
Medical Equipment Replacement and Upgrade Program 30 30 30 90
Medicine Hat Regional Hospital 5 - - 5
Misericordia Community Hospital Modernization Program (Edmonton) 23 20 17 60
Northern Laboratory Equipment Upgrade Program 9 6 - 15
Northern Lights Regional Health Centre Repairs (Fort McMurray) 8 - - 8Peter Lougheed Centre Emergency Department, Mental Health Intensive Care Unit and Laboratory Redevelopment
7 52 77 137
Provincial Pharmacy Central Drug Production and Distribution Centre 1 11 29 41
Red Deer Regional Hospital Centre Renewal Project - 5 20 25
Rural Health Facilities Revitalization Program 5 15 15 35
Stollery Children's Hospital Critical Care Program (Edmonton) 6 8 - 14University of Alberta Hospital Brain Centre – Neurosciences Intensive Care Unit (Edmonton)
1 6 6 12
Total Protect Quality Health Care 863 802 836 2,501
pdf name: B20_FP_CP_cpd-2.pdf
S:\TBF\MinShare\PublnsProd\CorpFin\OBM.PUBLNS-2020-21\B20_Fiscal-Plan_vol\07_Capital_Plan_B20\source-docs\Copy of B20_FP_CP_Details-tables v5 Feb 14 533 / Cap Plan Det2 2/14/2020 / 5:48 PM
Capital Plan Details, continued(millions of dollars)
...continues next page
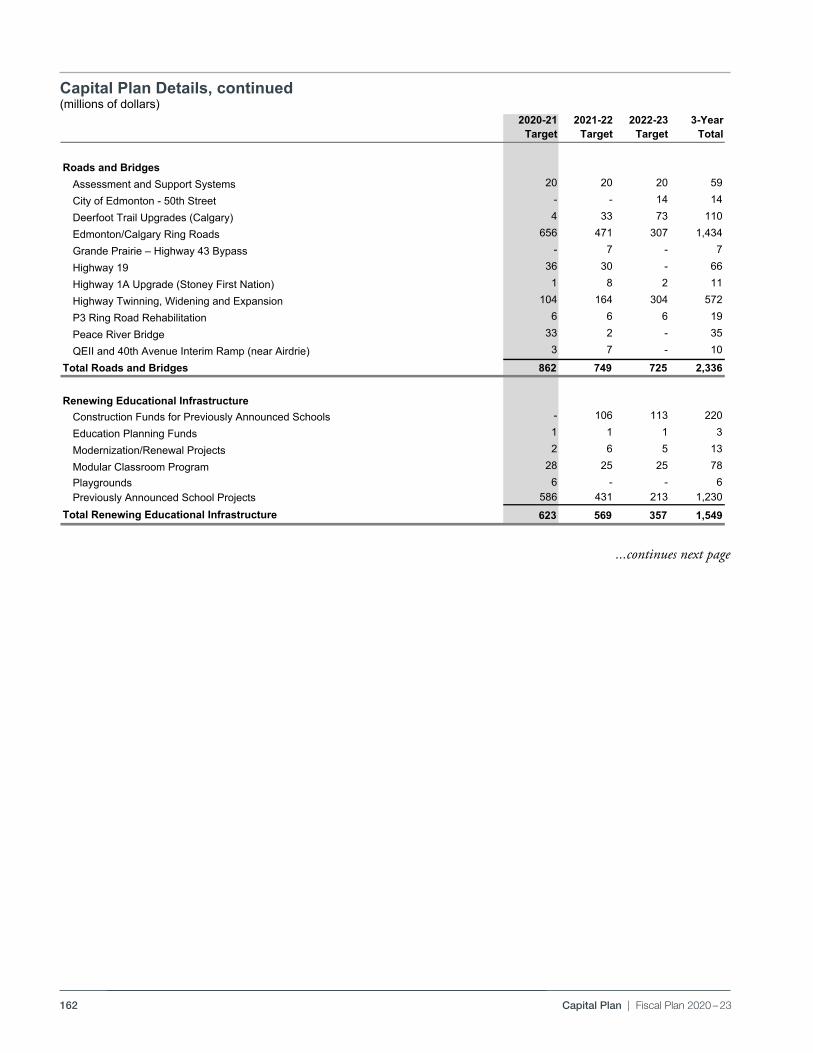
162 Capital Plan | Fiscal Plan 2020 – 23
pdf named: B20_FP_CP_cpd-3.pdf Budget 2020Capital Plan Spending
Capital Plan Details, continued(millions of dollars)
2020-21Target
2021-22Target
2022-23Target
3-YearTotal
Roads and BridgesAssessment and Support Systems 20 20 20 59
City of Edmonton - 50th Street - - 14 14
Deerfoot Trail Upgrades (Calgary) 4 33 73 110
Edmonton/Calgary Ring Roads 656 471 307 1,434
Grande Prairie – Highway 43 Bypass - 7 - 7
Highway 19 36 30 - 66
Highway 1A Upgrade (Stoney First Nation) 1 8 2 11
Highway Twinning, Widening and Expansion 104 164 304 572
P3 Ring Road Rehabilitation 6 6 6 19
Peace River Bridge 33 2 - 35
QEII and 40th Avenue Interim Ramp (near Airdrie) 3 7 - 10
Total Roads and Bridges 862 749 725 2,336
Renewing Educational Infrastructure Construction Funds for Previously Announced Schools - 106 113 220
Education Planning Funds 1 1 1 3
Modernization/Renewal Projects 2 6 5 13
Modular Classroom Program 28 25 25 78Playgrounds 6 - - 6Previously Announced School Projects 586 431 213 1,230
Total Renewing Educational Infrastructure 623 569 357 1,549
pdf name: B20_FP_CP_cpd-3.pdf
S:\TBF\MinShare\PublnsProd\CorpFin\OBM.PUBLNS-2020-21\B20_Fiscal-Plan_vol\07_Capital_Plan_B20\source-docs\B20_FP_CP_Details-tables v5 Feb 18 1345 / Cap Plan Det3 2/18/2020 / 4:06 PM
Capital Plan Details, continued(millions of dollars)
...continues next page
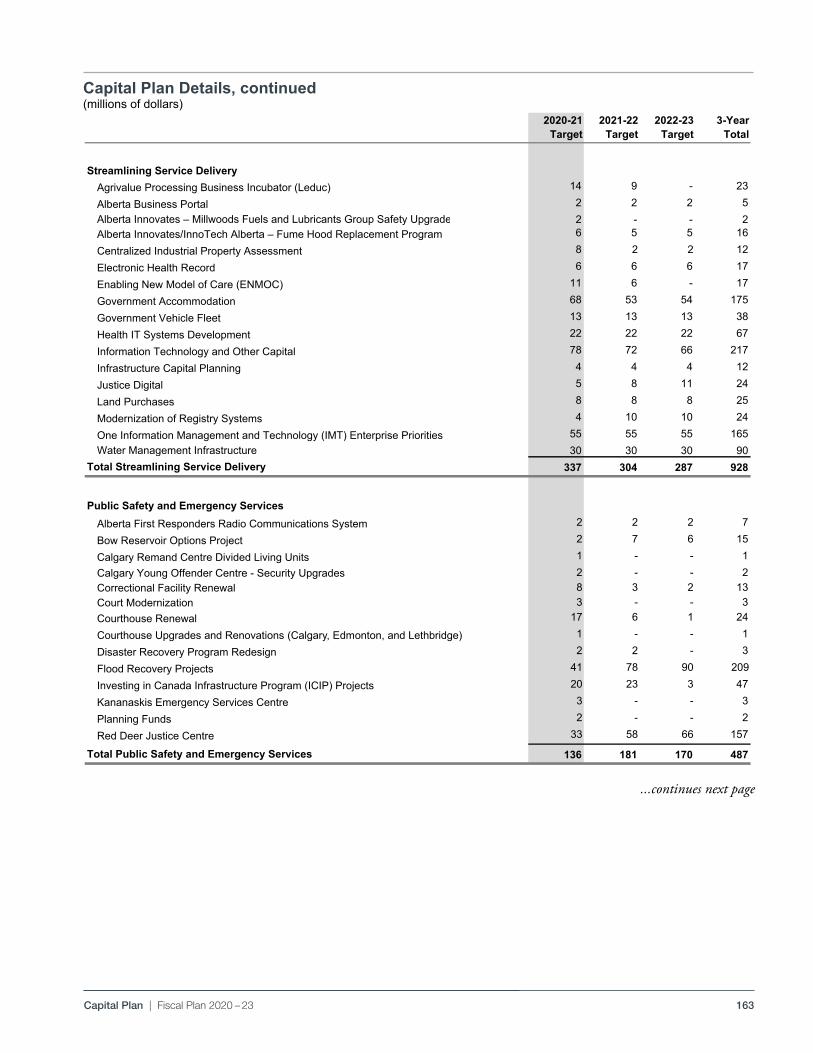
163Capital Plan | Fiscal Plan 2020 – 23
Capital Plan Details, continued(millions of dollars)
pdf named: B20_FP_CP_cpd-4.pdf Budget 2020Capital Plan Spending
Capital Plan Details, continued
(millions of dollars)2020-21
Target2021-22
Target2022-23
Target3-Year
Total
Streamlining Service DeliveryAgrivalue Processing Business Incubator (Leduc) 14 9 - 23
Alberta Business Portal 2 2 2 5Alberta Innovates – Millwoods Fuels and Lubricants Group Safety Upgrade 2 - - 2Alberta Innovates/InnoTech Alberta – Fume Hood Replacement Program 6 5 5 16
Centralized Industrial Property Assessment 8 2 2 12
Electronic Health Record 6 6 6 17
Enabling New Model of Care (ENMOC) 11 6 - 17
Government Accommodation 68 53 54 175
Government Vehicle Fleet 13 13 13 38
Health IT Systems Development 22 22 22 67
Information Technology and Other Capital 78 72 66 217
Infrastructure Capital Planning 4 4 4 12
Justice Digital 5 8 11 24
Land Purchases 8 8 8 25
Modernization of Registry Systems 4 10 10 24
One Information Management and Technology (IMT) Enterprise Priorities 55 55 55 165Water Management Infrastructure 30 30 30 90
Total Streamlining Service Delivery 337 304 287 928
Public Safety and Emergency ServicesAlberta First Responders Radio Communications System 2 2 2 7
Bow Reservoir Options Project 2 7 6 15
Calgary Remand Centre Divided Living Units 1 - - 1Calgary Young Offender Centre - Security Upgrades 2 - - 2Correctional Facility Renewal 8 3 2 13Court Modernization 3 - - 3Courthouse Renewal 17 6 1 24
Courthouse Upgrades and Renovations (Calgary, Edmonton, and Lethbridge) 1 - - 1
Disaster Recovery Program Redesign 2 2 - 3
Flood Recovery Projects 41 78 90 209
Investing in Canada Infrastructure Program (ICIP) Projects 20 23 3 47
Kananaskis Emergency Services Centre 3 - - 3
Planning Funds 2 - - 2
Red Deer Justice Centre 33 58 66 157
Total Public Safety and Emergency Services 136 181 170 487
pdf name: B20_FP_CP_cpd-4.pdf
S:\TBF\MinShare\PublnsProd\CorpFin\OBM.PUBLNS-2020-21\B20_Fiscal-Plan_vol\07_Capital_Plan_B20\source-docs\B20_FP_CP_Details-tables v5 Feb 18 1345 / Cap Plan Det4 2/18/2020 / 4:07 PM
...continues next page
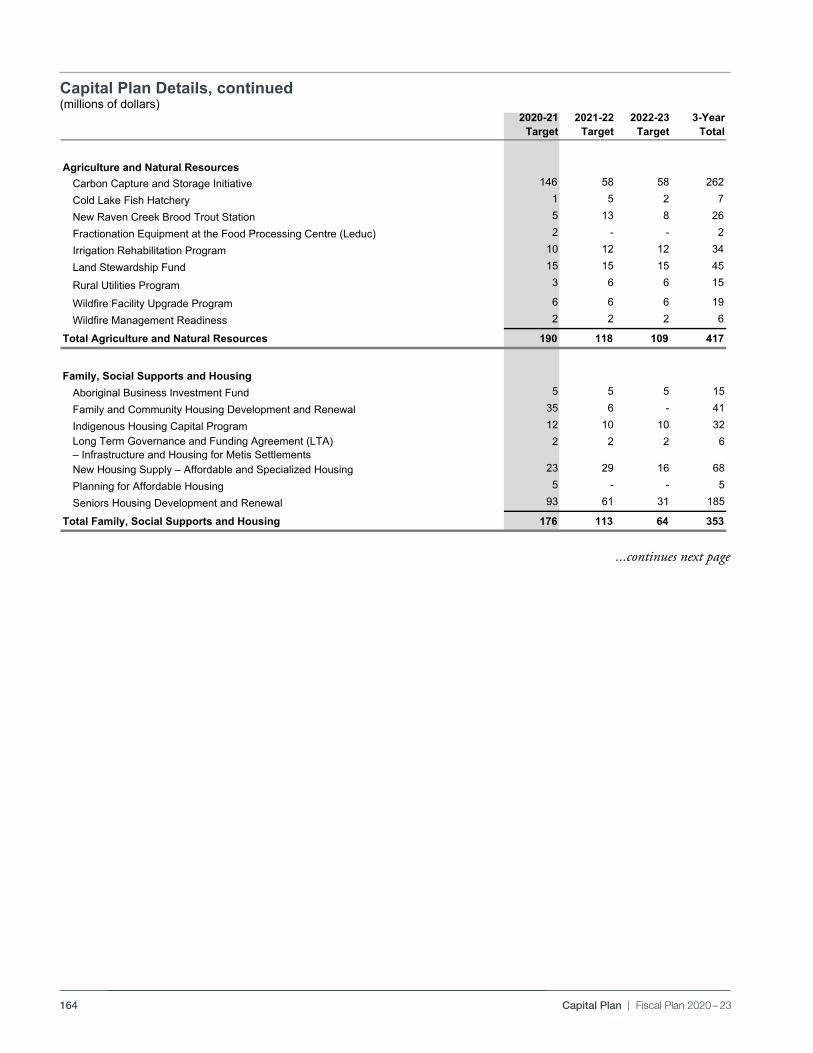
164 Capital Plan | Fiscal Plan 2020 – 23
Capital Plan Details, continued(millions of dollars)
pdf named: B20_FP_CP_cpd-5.pdf Budget 2020Capital Plan Spending
Capital Plan Details, continued
(millions of dollars)2020-21
Target2021-22
Target2022-23
Target3-Year
Total
Agriculture and Natural ResourcesCarbon Capture and Storage Initiative 146 58 58 262
Cold Lake Fish Hatchery 1 5 2 7
New Raven Creek Brood Trout Station 5 13 8 26
Fractionation Equipment at the Food Processing Centre (Leduc) 2 - - 2
Irrigation Rehabilitation Program 10 12 12 34
Land Stewardship Fund 15 15 15 45
Rural Utilities Program 3 6 6 15
Wildfire Facility Upgrade Program 6 6 6 19
Wildfire Management Readiness 2 2 2 6
Total Agriculture and Natural Resources 190 118 109 417
Family, Social Supports and HousingAboriginal Business Investment Fund 5 5 5 15
Family and Community Housing Development and Renewal 35 6 - 41
Indigenous Housing Capital Program 12 10 10 32Long Term Governance and Funding Agreement (LTA) – Infrastructure and Housing for Metis Settlements
2 2 2 6
New Housing Supply – Affordable and Specialized Housing 23 29 16 68
Planning for Affordable Housing 5 - - 5
Seniors Housing Development and Renewal 93 61 31 185
Total Family, Social Supports and Housing 176 113 64 353
pdf name: B20_FP_CP_cpd-5.pdf
S:\TBF\MinShare\PublnsProd\CorpFin\OBM.PUBLNS-2020-21\B20_Fiscal-Plan_vol\07_Capital_Plan_B20\source-docs\B20_FP_CP_Details-tables v5 Feb 18 1345 / Cap Plan Det5 2/18/2020 / 4:08 PM
...continues next page
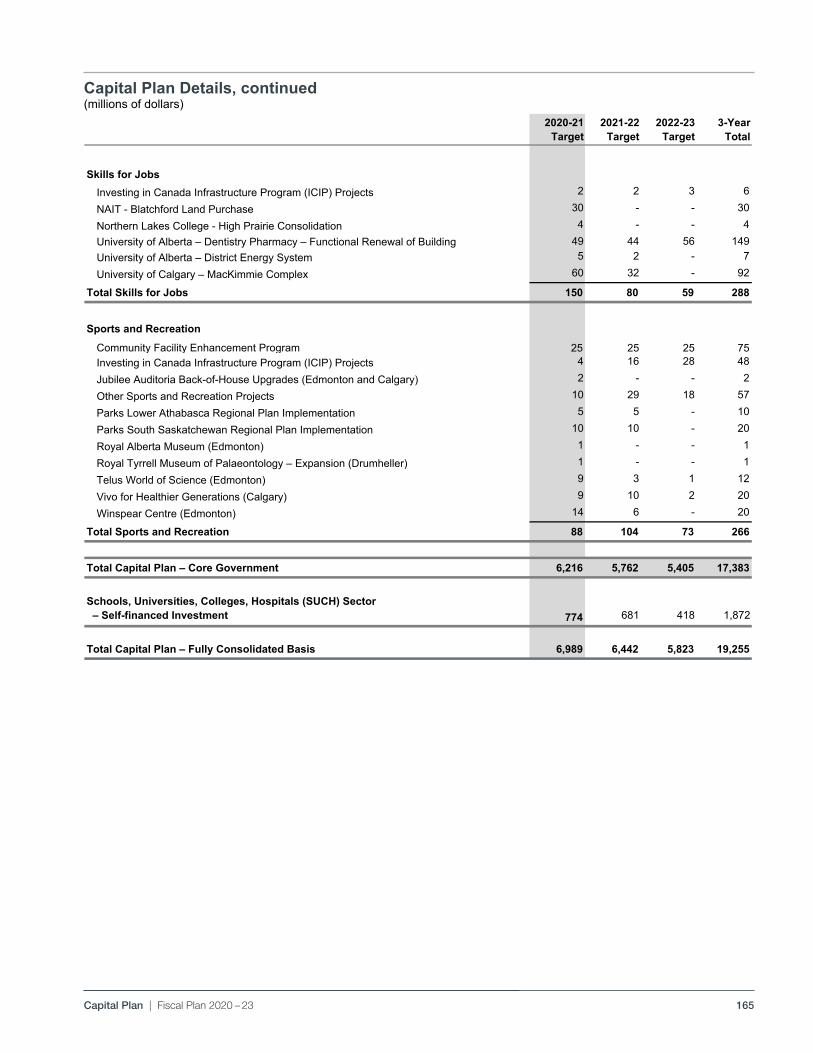
165Capital Plan | Fiscal Plan 2020 – 23
Capital Plan Details, continued(millions of dollars)
pdf named: B20_FP_CP_cpd-6.pdf Budget 2020Capital Plan Spending
Capital Plan Details, continued
(millions of dollars)
2020-21Target
2021-22Target
2022-23Target
3-YearTotal
Skills for JobsInvesting in Canada Infrastructure Program (ICIP) Projects 2 2 3 6
NAIT - Blatchford Land Purchase 30 - - 30
Northern Lakes College - High Prairie Consolidation 4 - - 4University of Alberta – Dentistry Pharmacy – Functional Renewal of Building 49 44 56 149University of Alberta – District Energy System 5 2 - 7
University of Calgary – MacKimmie Complex 60 32 - 92
Total Skills for Jobs 150 80 59 288
Sports and RecreationCommunity Facility Enhancement Program 25 25 25 75Investing in Canada Infrastructure Program (ICIP) Projects 4 16 28 48
Jubilee Auditoria Back-of-House Upgrades (Edmonton and Calgary) 2 - - 2
Other Sports and Recreation Projects 10 29 18 57
Parks Lower Athabasca Regional Plan Implementation 5 5 - 10
Parks South Saskatchewan Regional Plan Implementation 10 10 - 20
Royal Alberta Museum (Edmonton) 1 - - 1
Royal Tyrrell Museum of Palaeontology – Expansion (Drumheller) 1 - - 1
Telus World of Science (Edmonton) 9 3 1 12
Vivo for Healthier Generations (Calgary) 9 10 2 20
Winspear Centre (Edmonton) 14 6 - 20
Total Sports and Recreation 88 104 73 266
Total Capital Plan – Core Government 6,216 5,762 5,405 17,383
Schools, Universities, Colleges, Hospitals (SUCH) Sector – Self-financed Investment 774 681 418 1,872
Total Capital Plan – Fully Consolidated Basis 6,989 6,442 5,823 19,255
pdf name: B20_FP_CP_cpd-6.pdf
S:\TBF\MinShare\PublnsProd\CorpFin\OBM.PUBLNS-2020-21\B20_Fiscal-Plan_vol\07_Capital_Plan_B20\source-docs\B20_FP_CP_Details-tables v5 Feb 19 1545 / Cap Plan Det6 2/19/2020 / 3:27 PM

166
BLANK PAGE
167
BUDGET 2020
GOVERNMENT OF ALBERTA | 2020 –23
Fiscal PlanTax Plan
168 Tax Plan | Fiscal Plan 2020 – 23
Table of Contents
Tax Plan . . . . . . . . . . . . . . . . . . . . . . . . . . . . . . . . . . . . . . . . . . . . . . . . . . . . . . . . . . . . . . . . . . . . . . . . . . . . . 169
Overview . . . . . . . . . . . . . . . . . . . . . . . . . . . . . . . . . . . . . . . . . . . . . . . . . . . . . . . . . . . . . . . . . . . . . . . . . . . . . 169
Job Creation Tax Cut . . . . . . . . . . . . . . . . . . . . . . . . . . . . . . . . . . . . . . . . . . . . . . . . . . . . . . . . . . . . . . . . . . . . 170
Approach to Corporate Taxation . . . . . . . . . . . . . . . . . . . . . . . . . . . . . . . . . . . . . . . . . . . . . . . . . . . . . . . . . . . 171
Vaping Products Tax . . . . . . . . . . . . . . . . . . . . . . . . . . . . . . . . . . . . . . . . . . . . . . . . . . . . . . . . . . . . . . . . . . . . . 173
Tourism Levy and Short‑term Rentals . . . . . . . . . . . . . . . . . . . . . . . . . . . . . . . . . . . . . . . . . . . . . . . . . . . . . . . 175
The New Alberta Child and Family Benefit . . . . . . . . . . . . . . . . . . . . . . . . . . . . . . . . . . . . . . . . . . . . . . . . . . . 176
Education Property Tax . . . . . . . . . . . . . . . . . . . . . . . . . . . . . . . . . . . . . . . . . . . . . . . . . . . . . . . . . . . . . . . . . . 177
Who Pays Alberta’s Personal Taxes? . . . . . . . . . . . . . . . . . . . . . . . . . . . . . . . . . . . . . . . . . . . . . . . . . . . . . . . . . . 179
Annex . . . . . . . . . . . . . . . . . . . . . . . . . . . . . . . . . . . . . . . . . . . . . . . . . . . . . . . . . . . . . . . . . . . . . . . . . . . . . . . 181
Alberta Non‑Refundable Tax Credit Block, 2020 . . . . . . . . . . . . . . . . . . . . . . . . . . . . . . . . . . . . . . . . . . . . . . . 182
Alberta Personal Income Tax Brackets, 2020 . . . . . . . . . . . . . . . . . . . . . . . . . . . . . . . . . . . . . . . . . . . . . . . . . . 182
Tax Expenditure Estimates, 2020 . . . . . . . . . . . . . . . . . . . . . . . . . . . . . . . . . . . . . . . . . . . . . . . . . . . . . . . . . . . 183
Tax Revenue, 2020‑21 . . . . . . . . . . . . . . . . . . . . . . . . . . . . . . . . . . . . . . . . . . . . . . . . . . . . . . . . . . . . . . . . . . . 184
Tax Revenue Sources, 2020‑21 . . . . . . . . . . . . . . . . . . . . . . . . . . . . . . . . . . . . . . . . . . . . . . . . . . . . . . . . . . . . . 185
Interprovincial Tax Comparison, 2020 . . . . . . . . . . . . . . . . . . . . . . . . . . . . . . . . . . . . . . . . . . . . . . . . . . . . . . . 186
Major Provincial Tax Rates, 2020 . . . . . . . . . . . . . . . . . . . . . . . . . . . . . . . . . . . . . . . . . . . . . . . . . . . . . . . . . . . 187
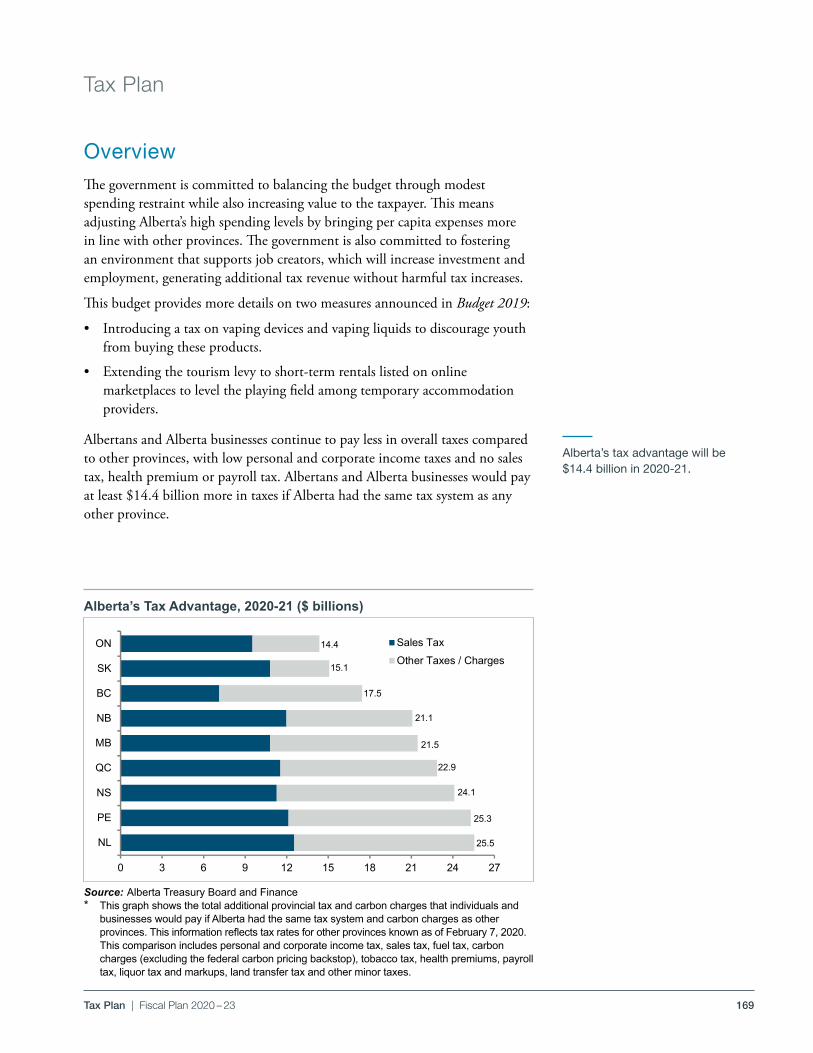
169Tax Plan | Fiscal Plan 2020 – 23
Tax Plan
OverviewThe government is committed to balancing the budget through modest spending restraint while also increasing value to the taxpayer . This means adjusting Alberta’s high spending levels by bringing per capita expenses more in line with other provinces . The government is also committed to fostering an environment that supports job creators, which will increase investment and employment, generating additional tax revenue without harmful tax increases .
This budget provides more details on two measures announced in Budget 2019:
• Introducing a tax on vaping devices and vaping liquids to discourage youth from buying these products .
• Extending the tourism levy to short‑term rentals listed on online marketplaces to level the playing field among temporary accommodation providers .
Albertans and Alberta businesses continue to pay less in overall taxes compared to other provinces, with low personal and corporate income taxes and no sales tax, health premium or payroll tax . Albertans and Alberta businesses would pay at least $14 .4 billion more in taxes if Alberta had the same tax system as any other province .
Alberta’s Tax Advantage, 2020-21 ($ billions)
Source: Alberta Treasury Board and Finance* This graph shows the total additional provincial tax and carbon charges that individuals and
businesses would pay if Alberta had the same tax system and carbon charges as other provinces. This information reflects tax rates for other provinces known as of February 7, 2020. This comparison includes personal and corporate income tax, sales tax, fuel tax, carbon charges (excluding the federal carbon pricing backstop), tobacco tax, health premiums, payroll tax, liquor tax and markups, land transfer tax and other minor taxes.
Alberta’s tax advantage will be $14.4 billion in 2020-21.
PDF named:TP20_chrt_01.pdf
Budget 2020Tax Plan
Alberta's Tax Advantage, 2020-21 ($ billions)
TP20_chrt_01.pdf
Source: Alberta Treasury Board and Finance
* This graph shows the total additional provincial tax and carbon charges that individuals and businesses would pay if Alberta had the same tax system and carbon charges as other provinces. This information reflects tax rates for other provinces known as of February 7, 2020. This comparison includes personal and corporate income tax, sales tax, fuel tax, carbon charges (excluding the federal carbon pricing backstop), tobacco tax, health premiums, payroll tax, liquor tax and markups, land transfer tax and other minor taxes.
0 3 6 9 12 15 18 21 24 27
NL
PE
NS
QC
MB
NB
BC
SK
ON Sales TaxOther Taxes / Charges
14.4
15.1
17.5
21.1
21.5
22.9
24.1
25.3
25.5
Path: W:\TAX-BUDGET\TAX-BUDGET-2020-21\Tables\Advantage\Model and Output\File: AB ADV, Budget 2020 - Jan 20 2020Tab: 1 - AlbertaTaxAdvantage Last printed: 2020-02-12 | 10:23 AM
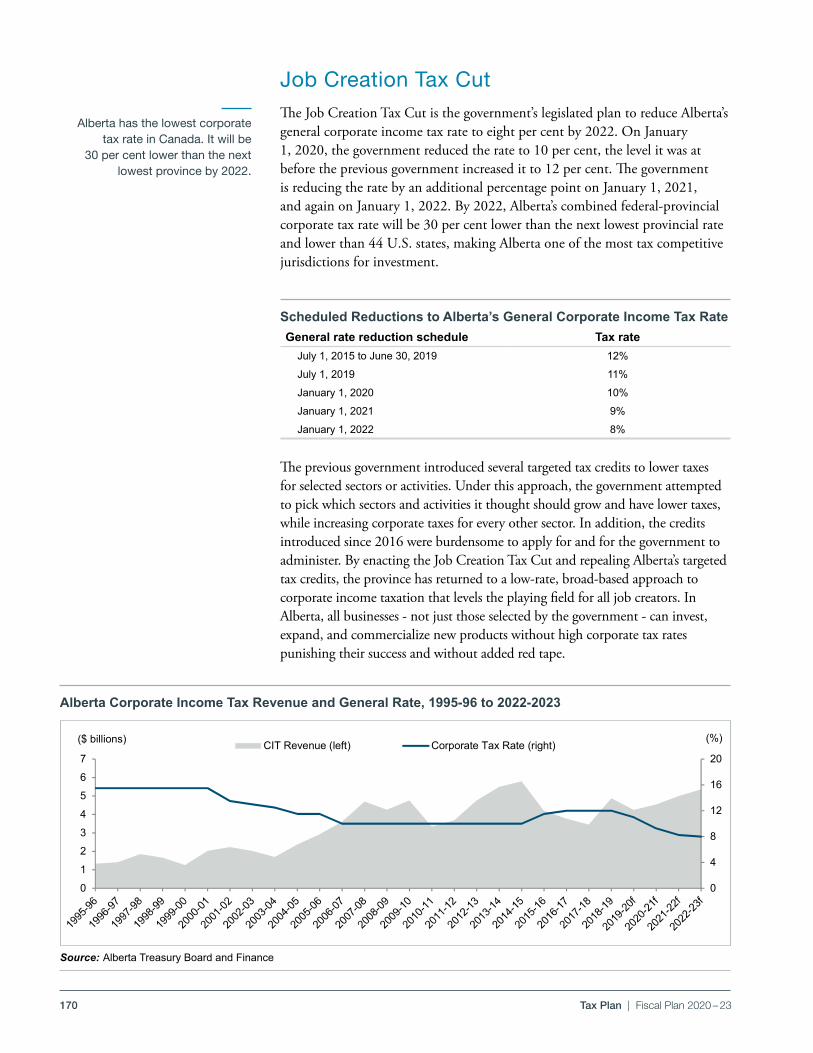
170 Tax Plan | Fiscal Plan 2020 – 23
Job Creation Tax CutThe Job Creation Tax Cut is the government’s legislated plan to reduce Alberta’s general corporate income tax rate to eight per cent by 2022 . On January 1, 2020, the government reduced the rate to 10 per cent, the level it was at before the previous government increased it to 12 per cent . The government is reducing the rate by an additional percentage point on January 1, 2021, and again on January 1, 2022 . By 2022, Alberta’s combined federal‑provincial corporate tax rate will be 30 per cent lower than the next lowest provincial rate and lower than 44 U .S . states, making Alberta one of the most tax competitive jurisdictions for investment .
Alberta has the lowest corporate tax rate in Canada. It will be
30 per cent lower than the next lowest province by 2022.
The previous government introduced several targeted tax credits to lower taxes for selected sectors or activities . Under this approach, the government attempted to pick which sectors and activities it thought should grow and have lower taxes, while increasing corporate taxes for every other sector . In addition, the credits introduced since 2016 were burdensome to apply for and for the government to administer . By enacting the Job Creation Tax Cut and repealing Alberta’s targeted tax credits, the province has returned to a low‑rate, broad‑based approach to corporate income taxation that levels the playing field for all job creators . In Alberta, all businesses ‑ not just those selected by the government ‑ can invest, expand, and commercialize new products without high corporate tax rates punishing their success and without added red tape .
Scheduled Reductions to Alberta’s General Corporate Income Tax RateGeneral rate reduction schedule Tax rate
July 1, 2015 to June 30, 2019 12%
July 1, 2019 11%
January 1, 2020 10%
January 1, 2021 9%
January 1, 2022 8%
Alberta Corporate Income Tax Revenue and General Rate, 1995-96 to 2022-2023
Source: Alberta Treasury Board and Finance
Alberta Corporate Income Tax Revenues and General Rate, 1995-96 to 2022-2023
Source: Alberta Treasury Board and Finance
TP20_chrt_03.pdf
0
4
8
12
16
20
0
1
2
3
4
5
6
7
(%)CIT Revenue (left) Corporate Tax Rate (right)($ billions)
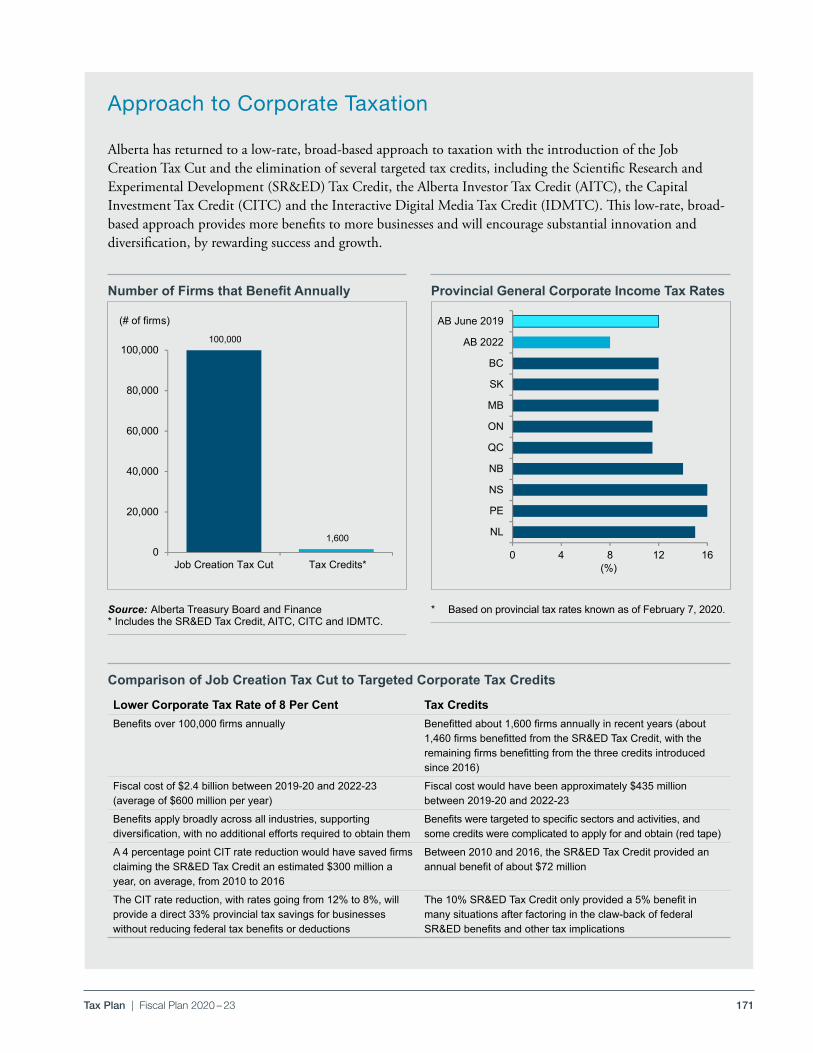
171Tax Plan | Fiscal Plan 2020 – 23
Approach to Corporate Taxation
Number of Firms that Benefit Annually Provincial General Corporate Income Tax Rates
Comparison of Job Creation Tax Cut to Targeted Corporate Tax Credits
Source: Alberta Treasury Board and Finance* Includes the SR&ED Tax Credit, AITC, CITC and IDMTC.
Alberta has returned to a low‑rate, broad‑based approach to taxation with the introduction of the Job Creation Tax Cut and the elimination of several targeted tax credits, including the Scientific Research and Experimental Development (SR&ED) Tax Credit, the Alberta Investor Tax Credit (AITC), the Capital Investment Tax Credit (CITC) and the Interactive Digital Media Tax Credit (IDMTC) . This low‑rate, broad‑based approach provides more benefits to more businesses and will encourage substantial innovation and diversification, by rewarding success and growth .
* Based on provincial tax rates known as of February 7, 2020.
Lower Corporate Tax Rate of 8 Per Cent Tax Credits Benefits over 100,000 firms annually Benefitted about 1,600 firms annually in recent years (about
1,460 firms benefitted from the SR&ED Tax Credit, with the remaining firms benefitting from the three credits introduced since 2016)
Fiscal cost of $2.4 billion between 2019-20 and 2022-23 (average of $600 million per year)
Fiscal cost would have been approximately $435 million between 2019-20 and 2022-23
Benefits apply broadly across all industries, supporting diversification, with no additional efforts required to obtain them
Benefits were targeted to specific sectors and activities, and some credits were complicated to apply for and obtain (red tape)
A 4 percentage point CIT rate reduction would have saved firms claiming the SR&ED Tax Credit an estimated $300 million a year, on average, from 2010 to 2016
Between 2010 and 2016, the SR&ED Tax Credit provided an annual benefit of about $72 million
The CIT rate reduction, with rates going from 12% to 8%, will provide a direct 33% provincial tax savings for businesses without reducing federal tax benefits or deductions
The 10% SR&ED Tax Credit only provided a 5% benefit in many situations after factoring in the claw-back of federal SR&ED benefits and other tax implications
Number of Firms that Benefit
Source: Alberta Treasury Board and Finance* Includes the SR&ED Tax Credit, AITC, CITC and IDMTC.
Provincial General Corporate Income Tax Rates
* Based on provincial tax rates known as of February 7, 2020.
100,000
1,600 0
20,000
40,000
60,000
80,000
100,000
Job Creation Tax Cut Tax Credits*
(# of firms)
0 4 8 12 16
NL
PE
NS
NB
QC
ON
MB
SK
BC
AB 2022
AB June 2019
(%)
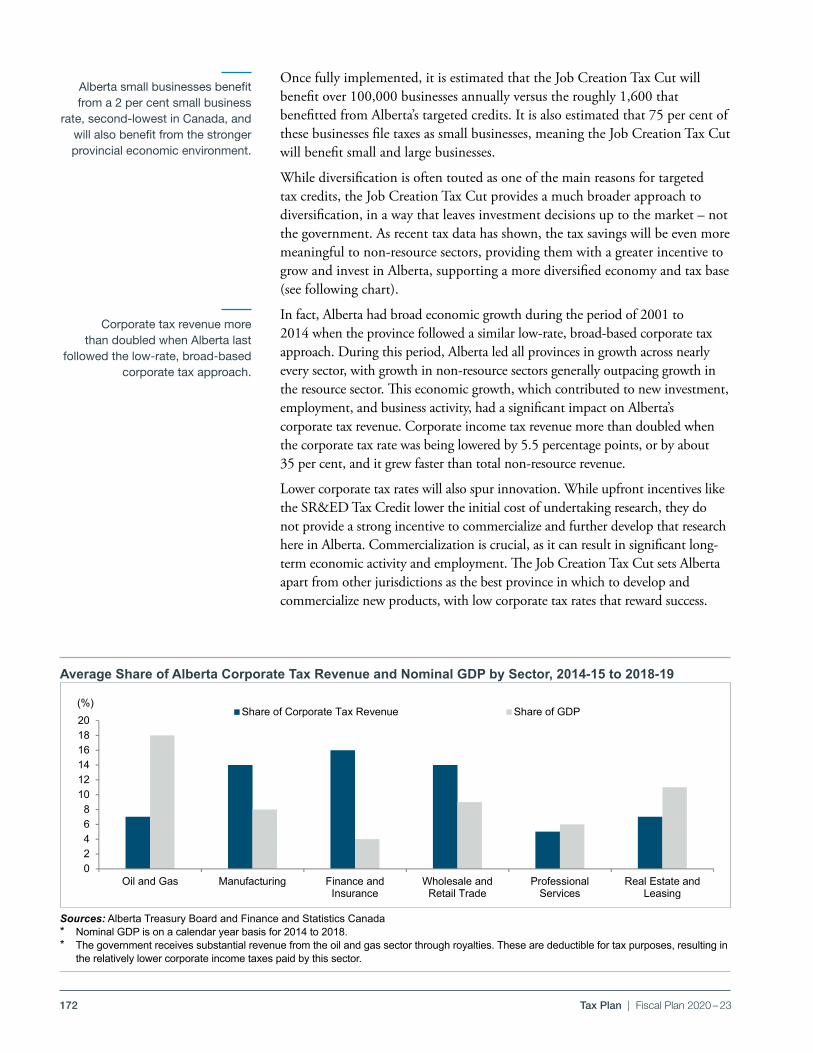
172 Tax Plan | Fiscal Plan 2020 – 23
Once fully implemented, it is estimated that the Job Creation Tax Cut will benefit over 100,000 businesses annually versus the roughly 1,600 that benefitted from Alberta’s targeted credits . It is also estimated that 75 per cent of these businesses file taxes as small businesses, meaning the Job Creation Tax Cut will benefit small and large businesses .
While diversification is often touted as one of the main reasons for targeted tax credits, the Job Creation Tax Cut provides a much broader approach to diversification, in a way that leaves investment decisions up to the market – not the government . As recent tax data has shown, the tax savings will be even more meaningful to non‑resource sectors, providing them with a greater incentive to grow and invest in Alberta, supporting a more diversified economy and tax base (see following chart) .
In fact, Alberta had broad economic growth during the period of 2001 to 2014 when the province followed a similar low‑rate, broad‑based corporate tax approach . During this period, Alberta led all provinces in growth across nearly every sector, with growth in non‑resource sectors generally outpacing growth in the resource sector . This economic growth, which contributed to new investment, employment, and business activity, had a significant impact on Alberta’s corporate tax revenue . Corporate income tax revenue more than doubled when the corporate tax rate was being lowered by 5 .5 percentage points, or by about 35 per cent, and it grew faster than total non‑resource revenue .
Lower corporate tax rates will also spur innovation . While upfront incentives like the SR&ED Tax Credit lower the initial cost of undertaking research, they do not provide a strong incentive to commercialize and further develop that research here in Alberta . Commercialization is crucial, as it can result in significant long‑term economic activity and employment . The Job Creation Tax Cut sets Alberta apart from other jurisdictions as the best province in which to develop and commercialize new products, with low corporate tax rates that reward success .
Average Share of Alberta Corporate Tax Revenue and Nominal GDP by Sector, 2014-15 to 2018-19
Sources: Alberta Treasury Board and Finance and Statistics Canada* Nominal GDP is on a calendar year basis for 2014 to 2018. * The government receives substantial revenue from the oil and gas sector through royalties. These are deductible for tax purposes, resulting in
the relatively lower corporate income taxes paid by this sector.
Corporate tax revenue more than doubled when Alberta last
followed the low-rate, broad-based corporate tax approach.
Alberta small businesses benefit from a 2 per cent small business
rate, second-lowest in Canada, and will also benefit from the stronger provincial economic environment.
Tax PlanBudget 2019
PDF Name: TP19_chrt_05
Average Share of Alberta Corporate Tax Revenue and Nominal GDP by Sector, 2014-15 to 2018-19
Sources: Statistics Canada and Alberta Treasury Board and Finance*Nominal GDP is on a calendar year basis for 2014 to 2018.
TP20_chrt_07.pdf
02468
101214161820
Oil and Gas Manufacturing Finance andInsurance
Wholesale andRetail Trade
ProfessionalServices
Real Estate andLeasing
(%)Share of Corporate Tax Revenue Share of GDP
Path: W:\TAX-BUDGET\TAX-BUDGET-2020-21\Tables\CIT Tables and Charts\File: Share of Total AB CIT Revenues and GDPTab: 7 - % CIT Revenues & GDP Last updated: 2020-01-31 @ 3:49 PM
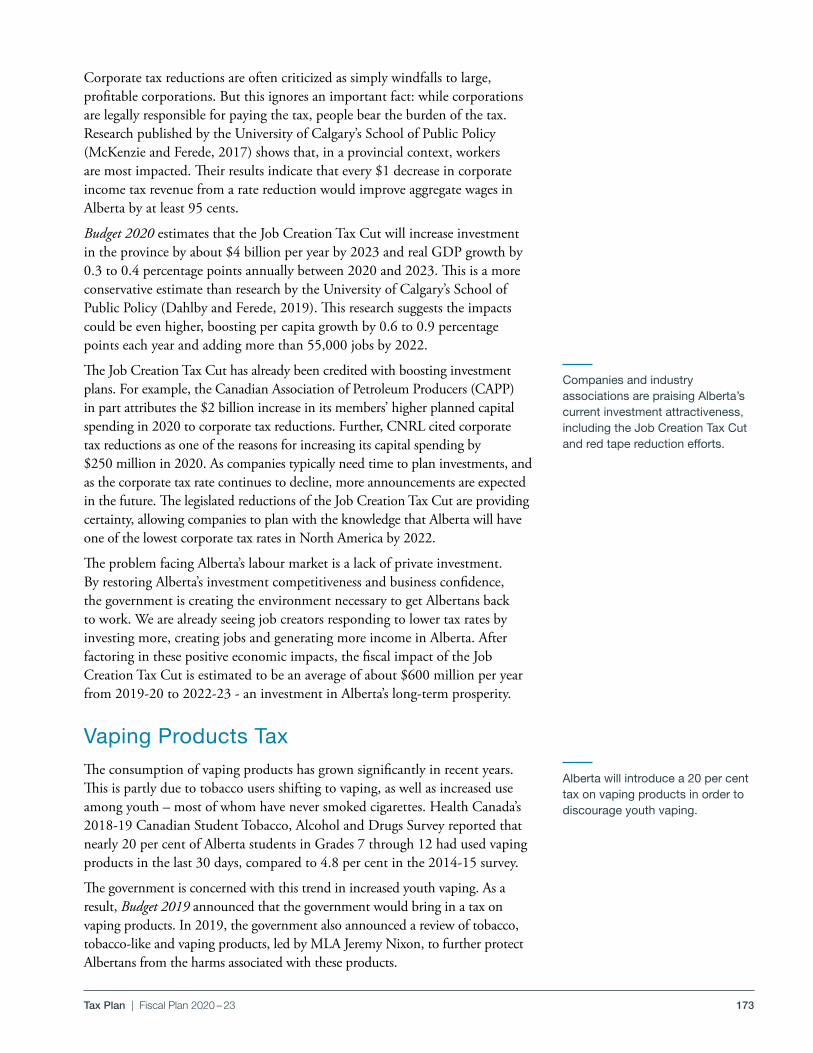
173Tax Plan | Fiscal Plan 2020 – 23
Corporate tax reductions are often criticized as simply windfalls to large, profitable corporations . But this ignores an important fact: while corporations are legally responsible for paying the tax, people bear the burden of the tax . Research published by the University of Calgary’s School of Public Policy (McKenzie and Ferede, 2017) shows that, in a provincial context, workers are most impacted . Their results indicate that every $1 decrease in corporate income tax revenue from a rate reduction would improve aggregate wages in Alberta by at least 95 cents .
Budget 2020 estimates that the Job Creation Tax Cut will increase investment in the province by about $4 billion per year by 2023 and real GDP growth by 0 .3 to 0 .4 percentage points annually between 2020 and 2023 . This is a more conservative estimate than research by the University of Calgary’s School of Public Policy (Dahlby and Ferede, 2019) . This research suggests the impacts could be even higher, boosting per capita growth by 0 .6 to 0 .9 percentage points each year and adding more than 55,000 jobs by 2022 .
The Job Creation Tax Cut has already been credited with boosting investment plans . For example, the Canadian Association of Petroleum Producers (CAPP) in part attributes the $2 billion increase in its members’ higher planned capital spending in 2020 to corporate tax reductions . Further, CNRL cited corporate tax reductions as one of the reasons for increasing its capital spending by $250 million in 2020 . As companies typically need time to plan investments, and as the corporate tax rate continues to decline, more announcements are expected in the future . The legislated reductions of the Job Creation Tax Cut are providing certainty, allowing companies to plan with the knowledge that Alberta will have one of the lowest corporate tax rates in North America by 2022 .
The problem facing Alberta’s labour market is a lack of private investment . By restoring Alberta’s investment competitiveness and business confidence, the government is creating the environment necessary to get Albertans back to work . We are already seeing job creators responding to lower tax rates by investing more, creating jobs and generating more income in Alberta . After factoring in these positive economic impacts, the fiscal impact of the Job Creation Tax Cut is estimated to be an average of about $600 million per year from 2019‑20 to 2022‑23 ‑ an investment in Alberta’s long‑term prosperity .
Vaping Products TaxThe consumption of vaping products has grown significantly in recent years . This is partly due to tobacco users shifting to vaping, as well as increased use among youth – most of whom have never smoked cigarettes . Health Canada’s 2018‑19 Canadian Student Tobacco, Alcohol and Drugs Survey reported that nearly 20 per cent of Alberta students in Grades 7 through 12 had used vaping products in the last 30 days, compared to 4 .8 per cent in the 2014‑15 survey .
The government is concerned with this trend in increased youth vaping . As a result, Budget 2019 announced that the government would bring in a tax on vaping products . In 2019, the government also announced a review of tobacco, tobacco‑like and vaping products, led by MLA Jeremy Nixon, to further protect Albertans from the harms associated with these products .
Companies and industry associations are praising Alberta’s current investment attractiveness, including the Job Creation Tax Cut and red tape reduction efforts.
Alberta will introduce a 20 per cent tax on vaping products in order to discourage youth vaping.
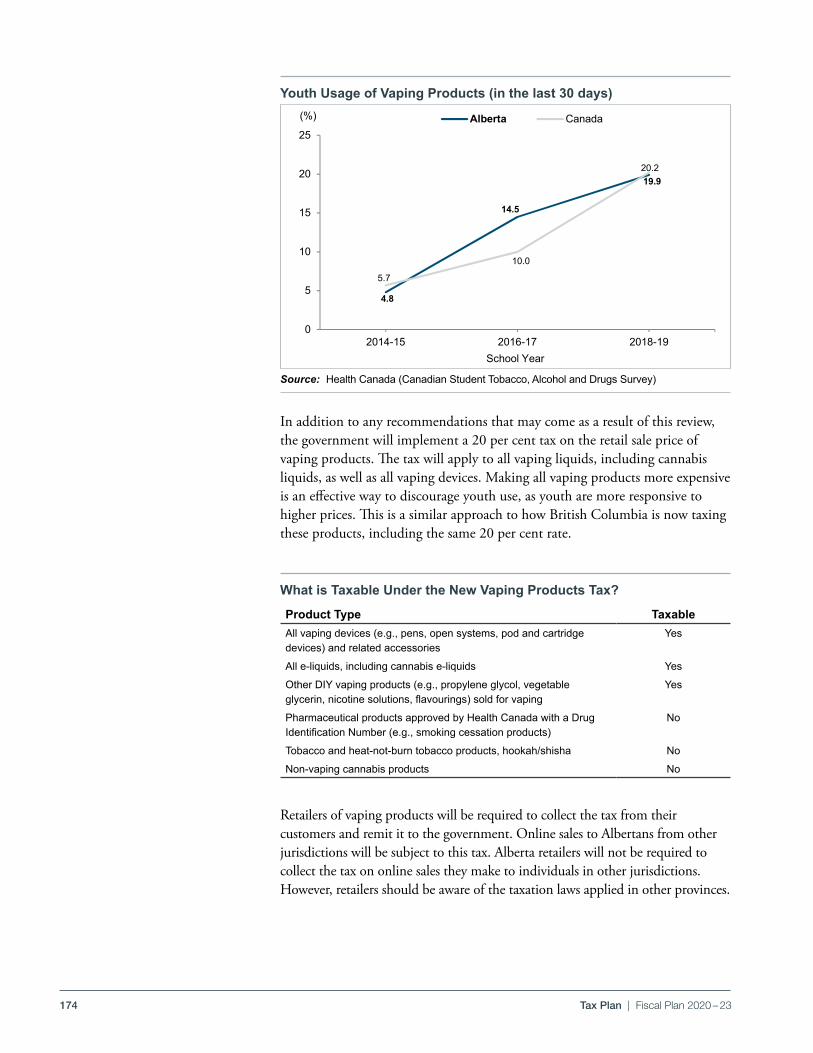
174 Tax Plan | Fiscal Plan 2020 – 23
In addition to any recommendations that may come as a result of this review, the government will implement a 20 per cent tax on the retail sale price of vaping products . The tax will apply to all vaping liquids, including cannabis liquids, as well as all vaping devices . Making all vaping products more expensive is an effective way to discourage youth use, as youth are more responsive to higher prices . This is a similar approach to how British Columbia is now taxing these products, including the same 20 per cent rate .
Retailers of vaping products will be required to collect the tax from their customers and remit it to the government . Online sales to Albertans from other jurisdictions will be subject to this tax . Alberta retailers will not be required to collect the tax on online sales they make to individuals in other jurisdictions . However, retailers should be aware of the taxation laws applied in other provinces .
What is Taxable Under the New Vaping Products Tax?
Product Type TaxableAll vaping devices (e.g., pens, open systems, pod and cartridge devices) and related accessories
Yes
All e-liquids, including cannabis e-liquids Yes
Other DIY vaping products (e.g., propylene glycol, vegetable glycerin, nicotine solutions, flavourings) sold for vaping
Yes
Pharmaceutical products approved by Health Canada with a Drug Identification Number (e.g., smoking cessation products)
No
Tobacco and heat-not-burn tobacco products, hookah/shisha No
Non-vaping cannabis products No
Youth Usage of Vaping Products (in the last 30 days)
Source: Health Canada (Canadian Student Tobacco, Alcohol and Drugs Survey)
PDF named:TP20_chrt_08.pdf
Budget 2020Tax Plan
Source: Health Canada (Canadian Student Tobacco, Alcohol and Drugs Survey )
TP20_chrt_08.pdf
Youth Usage of Vaping Products (in the last 30 Days)
4.8
14.5
19.9
5.7
10.0
20.2
0
5
10
15
20
25
2014-15 2016-17 2018-19
(%)
School Year
Alberta Canada
Path: \\ter-fin-fs-01.fin.gov.ab.ca\Publications\Tax\Budget2020_Tax_Plan\SourceDocs\For Gwen\File: 8 - Youth VapingTab: 8 - Youth Vaping graph Last printed: 2/4/2020 | 3:39 PM
175Tax Plan | Fiscal Plan 2020 – 23
The date of implementation for the tax, as well as other details, will be announced with the introduction of the legislation in spring 2020 and associated regulations . The government also intends to introduce several other measures to help address the problems associated with youth vaping . More details on these measures will also be available later in 2020, when new legislation and regulations are introduced .
Revenue from the tax is estimated to be $4 million in 2020‑21 and $8 million in 2021‑22 .
Tourism Levy and Short-term RentalsThe tourism levy is currently charged at a rate of four per cent on most types of temporary accommodation rentals in Alberta . However, the operators of short‑term rentals (STRs) offered through online marketplaces, such as Airbnb, HomeAway and Vacation Rental by Owner (VRBO), are generally not required to charge the tourism levy when they rent out their properties . This is because rentals in establishments with fewer than four bedrooms available for rent separately are not currently subject to the tourism levy . This exemption, which was introduced before the proliferation of rentals offered through online marketplaces, has provided these operators with an advantage over hotels and other accommodation providers that are required to collect the levy when they rent out their property .
As announced in Budget 2019, the government will extend the tourism levy to apply to the rental of all STRs listed on online marketplaces in order to level the playing field among temporary accommodation providers in Alberta . Specifically, the current exemption for establishments with fewer than four bedrooms available for rent separately will be removed .
A new exemption will be introduced for properties that are not listed on any online marketplace, where the purchase price of the rental is less than $30 per day or $210 per week, or the operator has annual gross revenue from the rental of temporary accommodation in Alberta of less than $5,000 . This new exemption is intended to minimize red tape by alleviating the administrative and compliance costs for owners not listed on online marketplaces who only occasionally rent out their accommodations .
In order to simplify collection and reduce compliance effort for STR operators, online marketplaces will be authorized to collect and remit the tourism levy on behalf of operators . Operators who offer STRs on online marketplaces that do not collect the levy on their behalf will be required to register with Alberta’s Tax and Revenue Administration, collect the tourism levy from their customers, file an online return and remit the levy to the government . These operators can reduce their compliance effort by listing properties on online marketplaces that agree to collect and remit the levy .
The tourism levy will be extended to short-term rentals listed on online marketplaces, levelling the playing field among temporary accommodation providers.
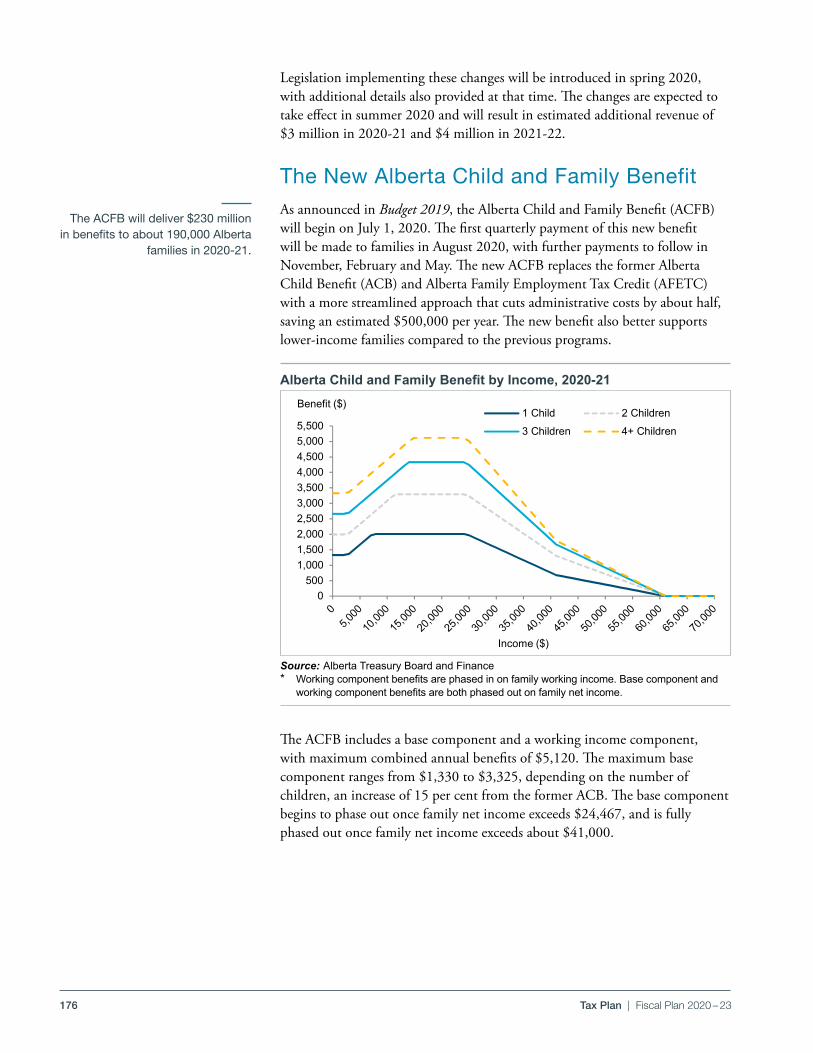
176 Tax Plan | Fiscal Plan 2020 – 23
Legislation implementing these changes will be introduced in spring 2020, with additional details also provided at that time . The changes are expected to take effect in summer 2020 and will result in estimated additional revenue of $3 million in 2020‑21 and $4 million in 2021‑22 .
The New Alberta Child and Family BenefitAs announced in Budget 2019, the Alberta Child and Family Benefit (ACFB) will begin on July 1, 2020 . The first quarterly payment of this new benefit will be made to families in August 2020, with further payments to follow in November, February and May . The new ACFB replaces the former Alberta Child Benefit (ACB) and Alberta Family Employment Tax Credit (AFETC) with a more streamlined approach that cuts administrative costs by about half, saving an estimated $500,000 per year . The new benefit also better supports lower‑income families compared to the previous programs .
Alberta Child and Family Benefit by Income, 2020-21
Source: Alberta Treasury Board and Finance* Working component benefits are phased in on family working income. Base component and
working component benefits are both phased out on family net income.
The ACFB will deliver $230 million in benefits to about 190,000 Alberta
families in 2020-21.
The ACFB includes a base component and a working income component, with maximum combined annual benefits of $5,120 . The maximum base component ranges from $1,330 to $3,325, depending on the number of children, an increase of 15 per cent from the former ACB . The base component begins to phase out once family net income exceeds $24,467, and is fully phased out once family net income exceeds about $41,000 .
Tax PlanBudget 2020
PDF Name: TP20_chrt_10.pdf
Alberta Child and Family Benefit by Income, 2020-21
Source: Alberta Treasury Board and Finance
TP20_chrt_10.pdf
0500
1,0001,5002,0002,5003,0003,5004,0004,5005,0005,500
Income ($)
1 Child 2 Children3 Children 4+ Children
Benefit ($)
Path: Z:\EFP\TP\TAX-BUDGET\TAX-BUDGET-2020-21\Tables\Children's Benefit Parameters\File: Supports for Working FamiliesTab: 10 - ACFB Line Chart Last updated: 2020-01-31 @ 11:18 AM
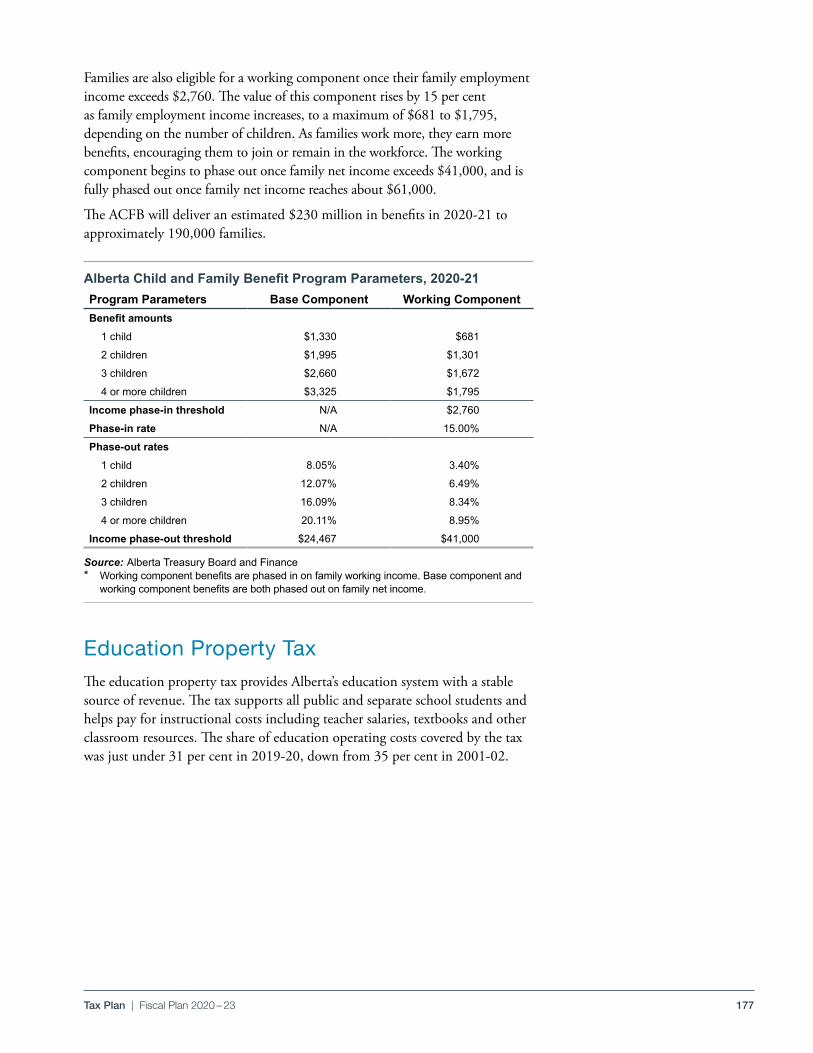
177Tax Plan | Fiscal Plan 2020 – 23
Source: Alberta Treasury Board and Finance* Working component benefits are phased in on family working income. Base component and
working component benefits are both phased out on family net income.
Alberta Child and Family Benefit Program Parameters, 2020-21
Families are also eligible for a working component once their family employment income exceeds $2,760 . The value of this component rises by 15 per cent as family employment income increases, to a maximum of $681 to $1,795, depending on the number of children . As families work more, they earn more benefits, encouraging them to join or remain in the workforce . The working component begins to phase out once family net income exceeds $41,000, and is fully phased out once family net income reaches about $61,000 .
The ACFB will deliver an estimated $230 million in benefits in 2020‑21 to approximately 190,000 families .
Education Property TaxThe education property tax provides Alberta’s education system with a stable source of revenue . The tax supports all public and separate school students and helps pay for instructional costs including teacher salaries, textbooks and other classroom resources . The share of education operating costs covered by the tax was just under 31 per cent in 2019‑20, down from 35 per cent in 2001‑02 .
Program Parameters Base Component Working ComponentBenefit amounts
1 child $1,330 $681
2 children $1,995 $1,301
3 children $2,660 $1,672
4 or more children $3,325 $1,795
Income phase-in threshold N/A $2,760
Phase-in rate N/A 15.00%
Phase-out rates1 child 8.05% 3.40%
2 children 12.07% 6.49%
3 children 16.09% 8.34%
4 or more children 20.11% 8.95%
Income phase-out threshold $24,467 $41,000
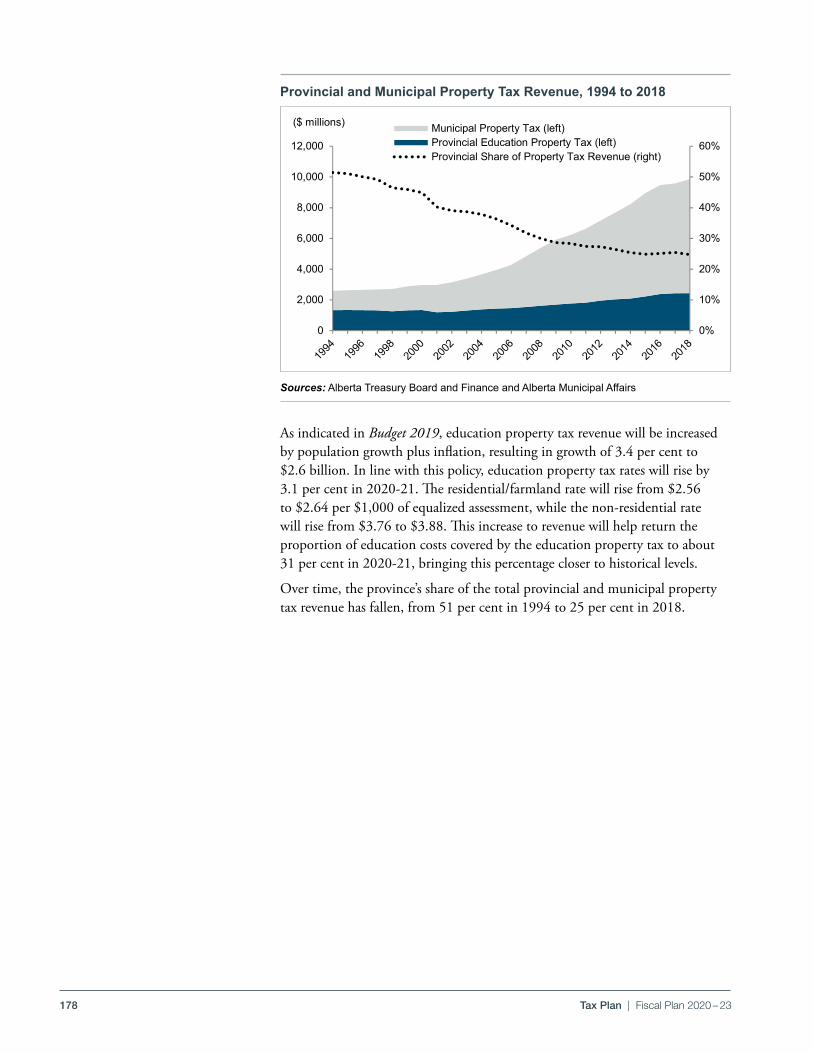
178 Tax Plan | Fiscal Plan 2020 – 23
As indicated in Budget 2019, education property tax revenue will be increased by population growth plus inflation, resulting in growth of 3 .4 per cent to $2 .6 billion . In line with this policy, education property tax rates will rise by 3 .1 per cent in 2020‑21 . The residential/farmland rate will rise from $2 .56 to $2 .64 per $1,000 of equalized assessment, while the non‑residential rate will rise from $3 .76 to $3 .88 . This increase to revenue will help return the proportion of education costs covered by the education property tax to about 31 per cent in 2020‑21, bringing this percentage closer to historical levels .
Over time, the province’s share of the total provincial and municipal property tax revenue has fallen, from 51 per cent in 1994 to 25 per cent in 2018 .
Provincial and Municipal Property Tax Revenue, 1994 to 2018
Sources: Alberta Treasury Board and Finance and Alberta Municipal Affairs
Tax Plan Budget 2020
PDF Name: TP20_chrt_13.pdf
Provincial and Municipal Property Tax Revenue, 1994 to 2018
Sources: Alberta Treasury Board and Finance and Alberta Municipal Affairs
TP20_chrt_13.pdf
0%
10%
20%
30%
40%
50%
60%
0
2,000
4,000
6,000
8,000
10,000
12,000
($ millions) Municipal Property Tax (left)Provincial Education Property Tax (left)Provincial Share of Property Tax Revenue (right)
Path: S:\TBF\EFP\TP\TAX-BUDGET\TAX-BUDGET-2020-21\Tables\Education Property Tax Table\File: Distribution of Property Tax -Pie Chart (Budget 2020)Tab: 13 - For Budget Last Updated: 2020-02-13 @ 1:51 PM
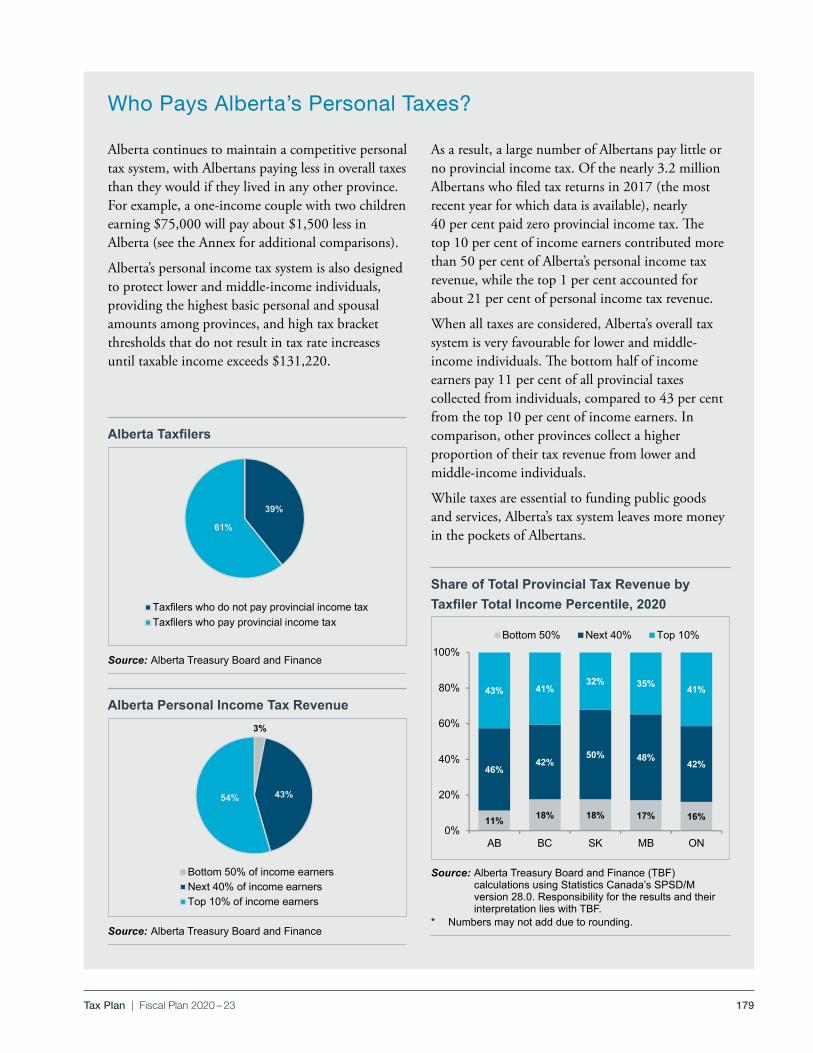
179Tax Plan | Fiscal Plan 2020 – 23
Alberta continues to maintain a competitive personal tax system, with Albertans paying less in overall taxes than they would if they lived in any other province . For example, a one‑income couple with two children earning $75,000 will pay about $1,500 less in Alberta (see the Annex for additional comparisons) .
Alberta’s personal income tax system is also designed to protect lower and middle‑income individuals, providing the highest basic personal and spousal amounts among provinces, and high tax bracket thresholds that do not result in tax rate increases until taxable income exceeds $131,220 .
Alberta Taxfilers
Source: Alberta Treasury Board and Finance
Share of Total Provincial Tax Revenue by Taxfiler Total Income Percentile, 2020
Source: Alberta Treasury Board and Finance (TBF) calculations using Statistics Canada’s SPSD/M version 28.0. Responsibility for the results and their interpretation lies with TBF.
* Numbers may not add due to rounding.
Alberta Personal Income Tax Revenue
Source: Alberta Treasury Board and Finance
As a result, a large number of Albertans pay little or no provincial income tax . Of the nearly 3 .2 million Albertans who filed tax returns in 2017 (the most recent year for which data is available), nearly 40 per cent paid zero provincial income tax . The top 10 per cent of income earners contributed more than 50 per cent of Alberta’s personal income tax revenue, while the top 1 per cent accounted for about 21 per cent of personal income tax revenue .
When all taxes are considered, Alberta’s overall tax system is very favourable for lower and middle‑ income individuals . The bottom half of income earners pay 11 per cent of all provincial taxes collected from individuals, compared to 43 per cent from the top 10 per cent of income earners . In comparison, other provinces collect a higher proportion of their tax revenue from lower and middle‑income individuals .
While taxes are essential to funding public goods and services, Alberta’s tax system leaves more money in the pockets of Albertans .
Who Pays Alberta’s Personal Taxes?
Tax PlanBudget 2020
PDF Name TP20_chrt_14.pdf
Alberta Taxfilers
Source: Alberta Treasury Board and Finance
TP20_chrt_14.pdf
39%
61%
Taxfilers who do not pay provincial income taxTaxfilers who pay provincial income tax
Path: W:\TAX-BUDGET\TAX-BUDGET-2020-21\Tables\Who Pays Alberta's Taxes\File: Who Pays Alberta's TaxesTab: 14 - Taxfilers No Tax Last Updated: 2020-02-13 @ 14 - Taxfilers No Tax
Tax PlanBudget 2020
PDF Name: TP20_chrt_15.pdf
Source of Alberta Personal Income Tax Revenue
TP20_chrt_15.pdf
3%
43%54%
Bottom 50% of income earnersNext 40% of income earnersTop 10% of income earners
Path: W:\TAX-BUDGET\TAX-BUDGET-2020-21\Tables\Who Pays Alberta's Taxes\File: Who Pays Alberta's TaxesTab: 15 - Source of PIT Revenue Last Updated: 2020-02-18 @ 15 - Source of PIT Revenue
Tax PlanBudget 2020
PDF Name: TP20_chrt_16.pdf
* Numbers may not add due to rounding.
TP20_chrt_16.pdf
Share of Total Provincial Tax Revenue by Taxfiler Total Income Percentile, 2020
Source: Alberta Treasury Board and Finance calculations using Statistics Canada’s Social Policy Simulation Database and Model (SPSD/M) version 28.0. Responsibility for the results and their interpretation lies with Treasury Board and Finance. The calculations include the impacts at the provincial level of income taxes, general sales, fuel, tobacco, amusement, carbon and environment taxes, as well as liquor profits/taxes and health premiums. The fuel charge under the federal carbon pricing backstop, as well as Climate Action Incentive payments, are excluded.
11% 18% 18% 17% 16%
46%42%
50% 48%42%
43% 41%32% 35% 41%
0%
20%
40%
60%
80%
100%
AB BC SK MB ON
Bottom 50% Next 40% Top 10%
Path: W:\TAX-BUDGET\TAX-BUDGET-2020-21\Tables\Who Pays Alberta's Taxes\File: Who Pays Alberta's TaxesTab: 16 - Total Tax Payable Last Updated: 2020-02-13 @ 16 - Total Tax Payable

180 Tax Plan | Fiscal Plan 2020 – 23
181
AnnexTax Plan
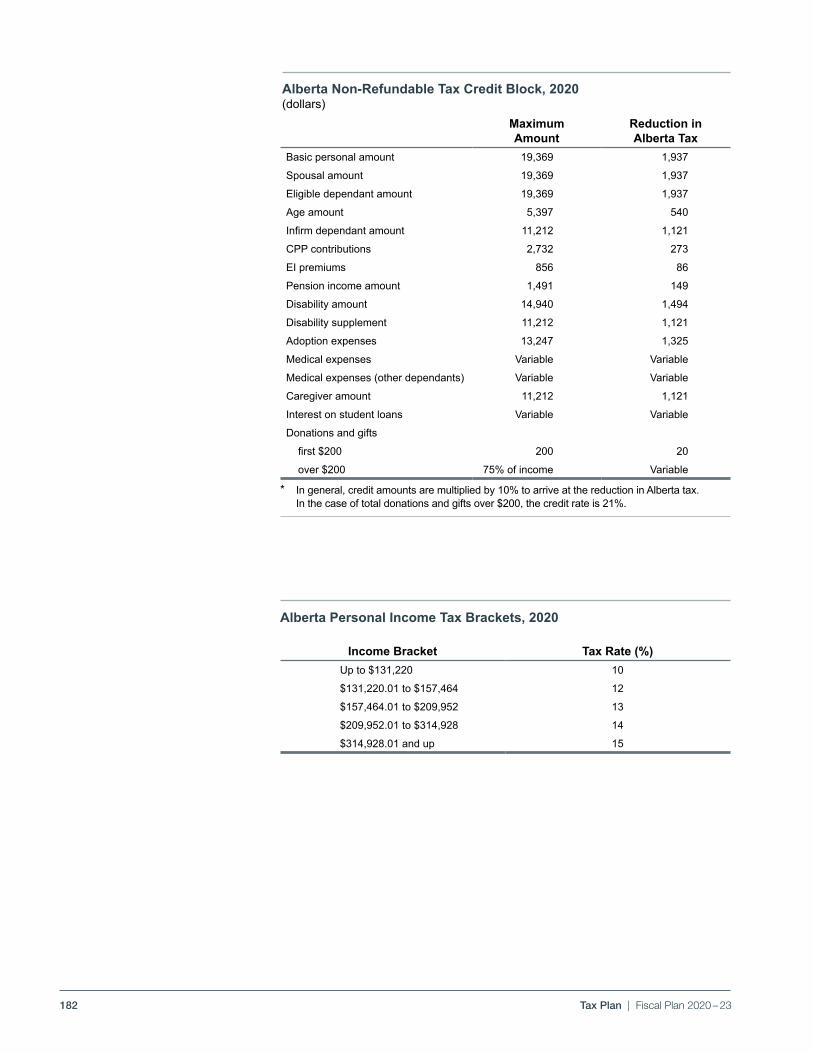
182 Tax Plan | Fiscal Plan 2020 – 23
Alberta Non-Refundable Tax Credit Block, 2020(dollars)
* In general, credit amounts are multiplied by 10% to arrive at the reduction in Alberta tax. In the case of total donations and gifts over $200, the credit rate is 21%.
Alberta Personal Income Tax Brackets, 2020
Maximum Amount
Reduction in Alberta Tax
Basic personal amount 19,369 1,937
Spousal amount 19,369 1,937
Eligible dependant amount 19,369 1,937
Age amount 5,397 540
Infirm dependant amount 11,212 1,121
CPP contributions 2,732 273
EI premiums 856 86
Pension income amount 1,491 149
Disability amount 14,940 1,494
Disability supplement 11,212 1,121
Adoption expenses 13,247 1,325
Medical expenses Variable Variable
Medical expenses (other dependants) Variable Variable
Caregiver amount 11,212 1,121
Interest on student loans Variable Variable
Donations and gifts
first $200 200 20
over $200 75% of income Variable
Income Bracket Tax Rate (%)Up to $131,220 10
$131,220.01 to $157,464 12
$157,464.01 to $209,952 13
$209,952.01 to $314,928 14
$314,928.01 and up 15
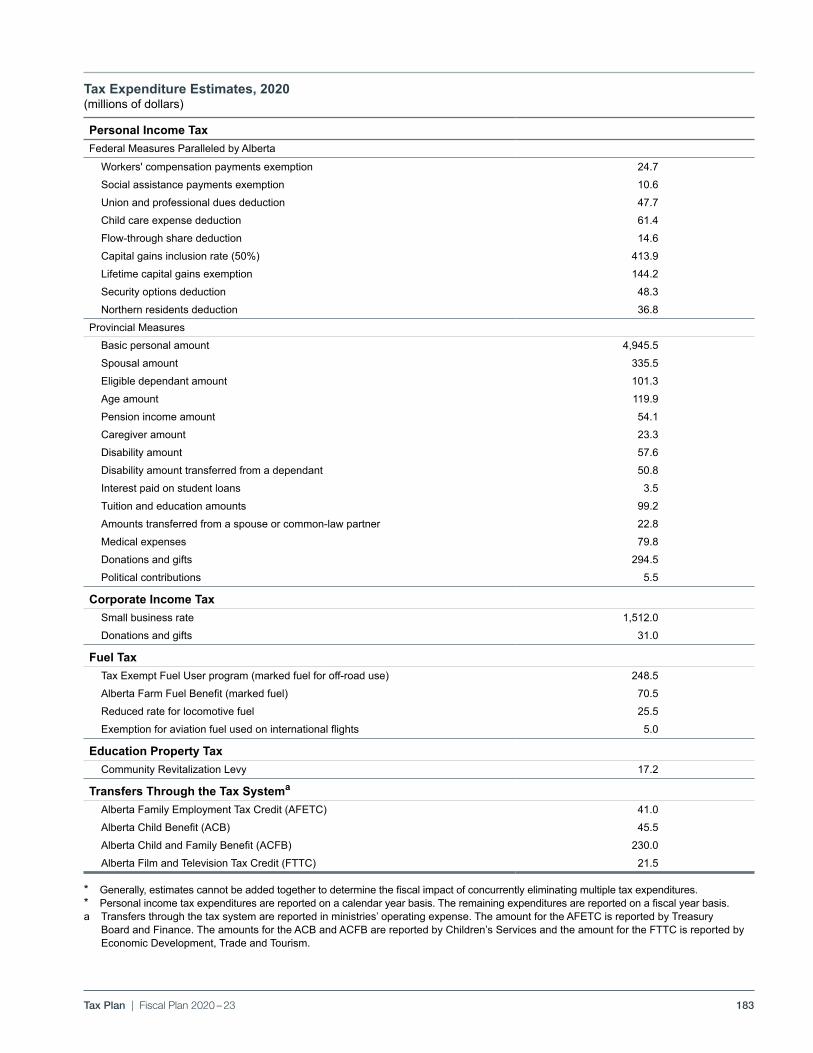
183Tax Plan | Fiscal Plan 2020 – 23
Tax Expenditure Estimates, 2020(millions of dollars)
* Generally, estimates cannot be added together to determine the fiscal impact of concurrently eliminating multiple tax expenditures. * Personal income tax expenditures are reported on a calendar year basis. The remaining expenditures are reported on a fiscal year basis.a Transfers through the tax system are reported in ministries’ operating expense. The amount for the AFETC is reported by Treasury
Board and Finance. The amounts for the ACB and ACFB are reported by Children’s Services and the amount for the FTTC is reported by Economic Development, Trade and Tourism.
Personal Income TaxFederal Measures Paralleled by Alberta
Workers' compensation payments exemption 24.7
Social assistance payments exemption 10.6
Union and professional dues deduction 47.7
Child care expense deduction 61.4
Flow-through share deduction 14.6
Capital gains inclusion rate (50%) 413.9
Lifetime capital gains exemption 144.2
Security options deduction 48.3
Northern residents deduction 36.8
Provincial Measures
Basic personal amount 4,945.5
Spousal amount 335.5
Eligible dependant amount 101.3
Age amount 119.9
Pension income amount 54.1
Caregiver amount 23.3
Disability amount 57.6
Disability amount transferred from a dependant 50.8
Interest paid on student loans 3.5
Tuition and education amounts 99.2
Amounts transferred from a spouse or common-law partner 22.8
Medical expenses 79.8
Donations and gifts 294.5
Political contributions 5.5
Corporate Income TaxSmall business rate 1,512.0
Donations and gifts 31.0
Fuel TaxTax Exempt Fuel User program (marked fuel for off-road use) 248.5
Alberta Farm Fuel Benefit (marked fuel) 70.5
Reduced rate for locomotive fuel 25.5
Exemption for aviation fuel used on international flights 5.0
Education Property TaxCommunity Revitalization Levy 17.2
Transfers Through the Tax Systema
Alberta Family Employment Tax Credit (AFETC) 41.0
Alberta Child Benefit (ACB) 45.5
Alberta Child and Family Benefit (ACFB) 230.0
Alberta Film and Television Tax Credit (FTTC) 21.5

184 Tax Plan | Fiscal Plan 2020 – 23
Total Tax Revenue: $22,900 million
Tax Revenue, 2020-21(millions of dollars)
Personal Income TaxRevenue: $12,566 Share: 54.9%
OthersRevenue: $943 Share: 4.1%
Corporate Income TaxRevenue: $4,539 Share: 19.8%
Education Property TaxRevenue: $2,569 Share: 11.2%
Tobacco TaxRevenue: $860 Share: 3.8%
Fuel TaxRevenue: $1,423 Share: 6.2%
Tax PlanBudget 2020
PDF Name: TP20_chrt_20.pdf
2019-20 Tax Revenue(millions of dollars)
Total Tax Revenue: $22,900 millionTP20_chrt_20.pdf
Path: W:\TAX-BUDGET\TAX-BUDGET-2020-21\Tables\Revenue from Tax Source\File: Revenue from Tax SourcesTab: 20 - Tax Rev Piechrt Last Updated: 2020-02-13 @ 2:03 PM
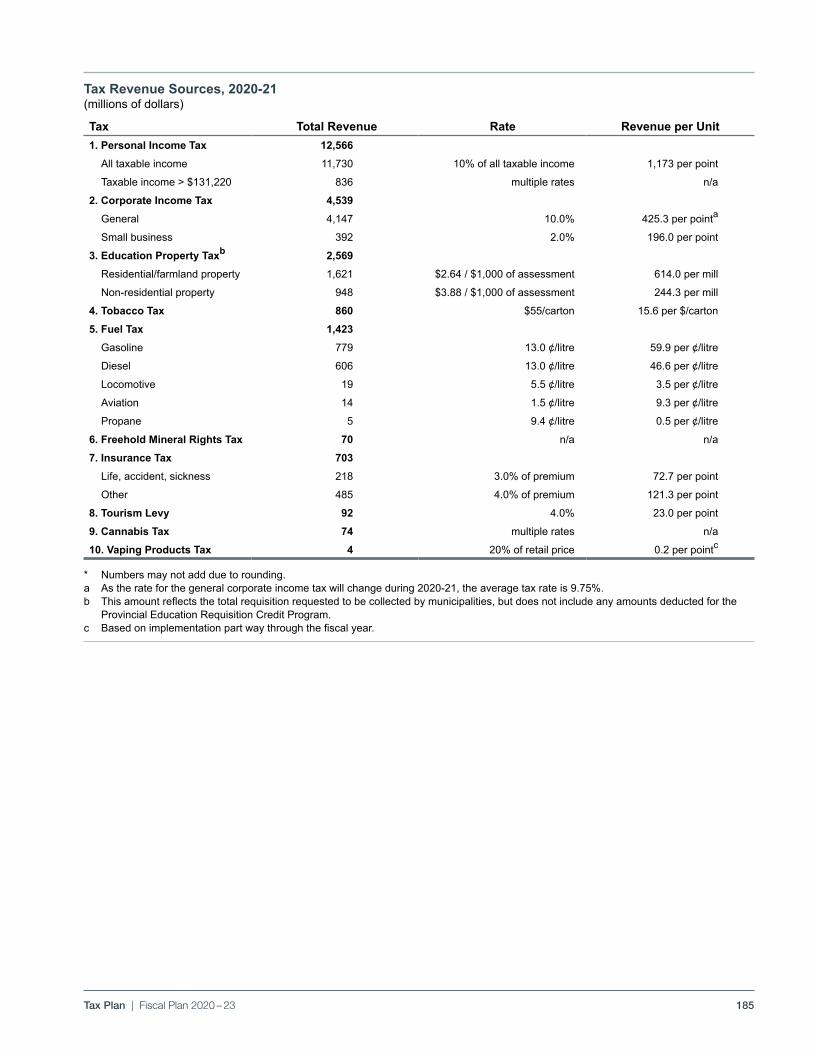
185Tax Plan | Fiscal Plan 2020 – 23
Tax Revenue Sources, 2020-21(millions of dollars)
* Numbers may not add due to rounding. a As the rate for the general corporate income tax will change during 2020-21, the average tax rate is 9.75%.b This amount reflects the total requisition requested to be collected by municipalities, but does not include any amounts deducted for the
Provincial Education Requisition Credit Program.c Based on implementation part way through the fiscal year.
Tax Total Revenue Rate Revenue per Unit1. Personal Income Tax 12,566
All taxable income 11,730 10% of all taxable income 1,173 per point
Taxable income > $131,220 836 multiple rates n/a
2. Corporate Income Tax 4,539 General 4,147 10.0% 425.3 per pointa
Small business 392 2.0% 196.0 per point
3. Education Property Taxb 2,569 Residential/farmland property 1,621 $2.64 / $1,000 of assessment 614.0 per mill
Non-residential property 948 $3.88 / $1,000 of assessment 244.3 per mill
4. Tobacco Tax 860 $55/carton 15.6 per $/carton
5. Fuel Tax 1,423 Gasoline 779 13.0 ¢/litre 59.9 per ¢/litre
Diesel 606 13.0 ¢/litre 46.6 per ¢/litre
Locomotive 19 5.5 ¢/litre 3.5 per ¢/litre
Aviation 14 1.5 ¢/litre 9.3 per ¢/litre
Propane 5 9.4 ¢/litre 0.5 per ¢/litre
6. Freehold Mineral Rights Tax 70 n/a n/a
7. Insurance Tax 703 Life, accident, sickness 218 3.0% of premium 72.7 per point
Other 485 4.0% of premium 121.3 per point
8. Tourism Levy 92 4.0% 23.0 per point
9. Cannabis Tax 74 multiple rates n/a
10. Vaping Products Tax 4 20% of retail price 0.2 per pointc
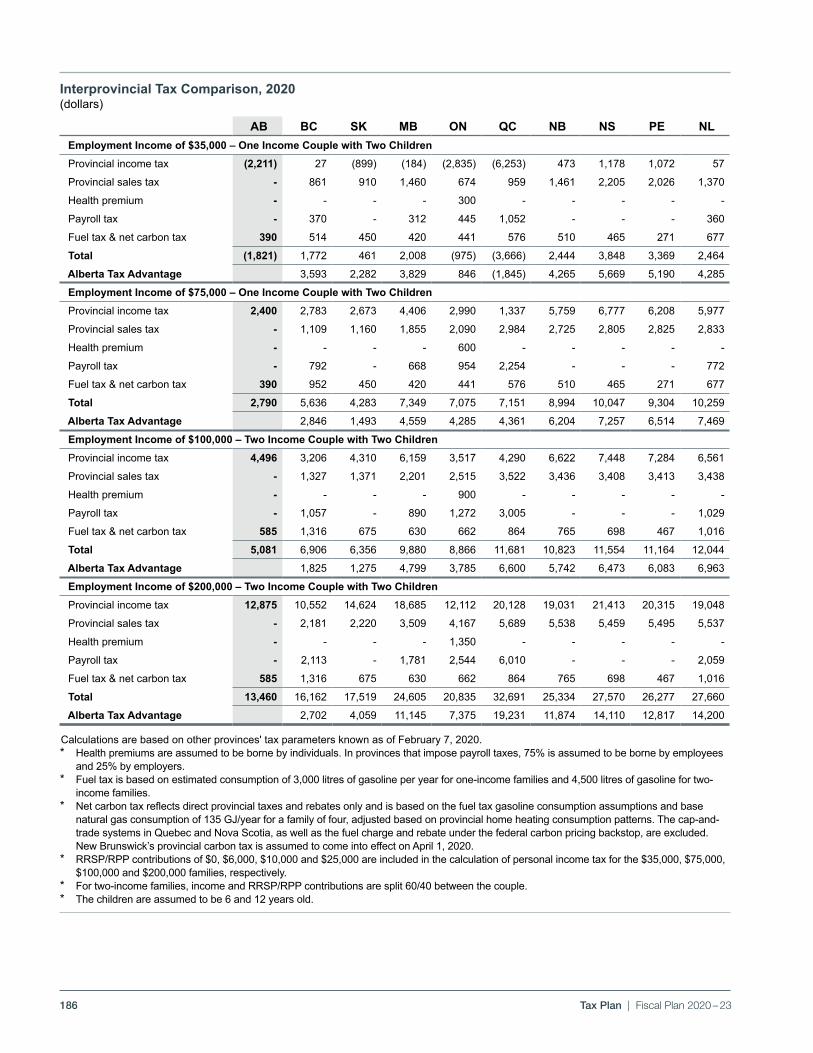
186 Tax Plan | Fiscal Plan 2020 – 23
Calculations are based on other provinces' tax parameters known as of February 7, 2020.* Health premiums are assumed to be borne by individuals. In provinces that impose payroll taxes, 75% is assumed to be borne by employees
and 25% by employers.* Fuel tax is based on estimated consumption of 3,000 litres of gasoline per year for one-income families and 4,500 litres of gasoline for two-
income families.* Net carbon tax reflects direct provincial taxes and rebates only and is based on the fuel tax gasoline consumption assumptions and base
natural gas consumption of 135 GJ/year for a family of four, adjusted based on provincial home heating consumption patterns. The cap-and-trade systems in Quebec and Nova Scotia, as well as the fuel charge and rebate under the federal carbon pricing backstop, are excluded. New Brunswick’s provincial carbon tax is assumed to come into effect on April 1, 2020.
* RRSP/RPP contributions of $0, $6,000, $10,000 and $25,000 are included in the calculation of personal income tax for the $35,000, $75,000, $100,000 and $200,000 families, respectively.
* For two-income families, income and RRSP/RPP contributions are split 60/40 between the couple.* The children are assumed to be 6 and 12 years old.
Interprovincial Tax Comparison, 2020(dollars)
AB BC SK MB ON QC NB NS PE NL Employment Income of $35,000 – One Income Couple with Two Children Provincial income tax (2,211) 27 (899) (184) (2,835) (6,253) 473 1,178 1,072 57
Provincial sales tax - 861 910 1,460 674 959 1,461 2,205 2,026 1,370
Health premium - - - - 300 - - - - -
Payroll tax - 370 - 312 445 1,052 - - - 360
Fuel tax & net carbon tax 390 514 450 420 441 576 510 465 271 677
Total (1,821) 1,772 461 2,008 (975) (3,666) 2,444 3,848 3,369 2,464
Alberta Tax Advantage 3,593 2,282 3,829 846 (1,845) 4,265 5,669 5,190 4,285
Employment Income of $75,000 – One Income Couple with Two Children Provincial income tax 2,400 2,783 2,673 4,406 2,990 1,337 5,759 6,777 6,208 5,977
Provincial sales tax - 1,109 1,160 1,855 2,090 2,984 2,725 2,805 2,825 2,833
Health premium - - - - 600 - - - - -
Payroll tax - 792 - 668 954 2,254 - - - 772
Fuel tax & net carbon tax 390 952 450 420 441 576 510 465 271 677
Total 2,790 5,636 4,283 7,349 7,075 7,151 8,994 10,047 9,304 10,259
Alberta Tax Advantage 2,846 1,493 4,559 4,285 4,361 6,204 7,257 6,514 7,469
Employment Income of $100,000 – Two Income Couple with Two Children Provincial income tax 4,496 3,206 4,310 6,159 3,517 4,290 6,622 7,448 7,284 6,561
Provincial sales tax - 1,327 1,371 2,201 2,515 3,522 3,436 3,408 3,413 3,438
Health premium - - - - 900 - - - - -
Payroll tax - 1,057 - 890 1,272 3,005 - - - 1,029
Fuel tax & net carbon tax 585 1,316 675 630 662 864 765 698 467 1,016
Total 5,081 6,906 6,356 9,880 8,866 11,681 10,823 11,554 11,164 12,044
Alberta Tax Advantage 1,825 1,275 4,799 3,785 6,600 5,742 6,473 6,083 6,963
Employment Income of $200,000 – Two Income Couple with Two Children Provincial income tax 12,875 10,552 14,624 18,685 12,112 20,128 19,031 21,413 20,315 19,048
Provincial sales tax - 2,181 2,220 3,509 4,167 5,689 5,538 5,459 5,495 5,537
Health premium - - - - 1,350 - - - - -
Payroll tax - 2,113 - 1,781 2,544 6,010 - - - 2,059
Fuel tax & net carbon tax 585 1,316 675 630 662 864 765 698 467 1,016
Total 13,460 16,162 17,519 24,605 20,835 32,691 25,334 27,570 26,277 27,660
Alberta Tax Advantage 2,702 4,059 11,145 7,375 19,231 11,874 14,110 12,817 14,200
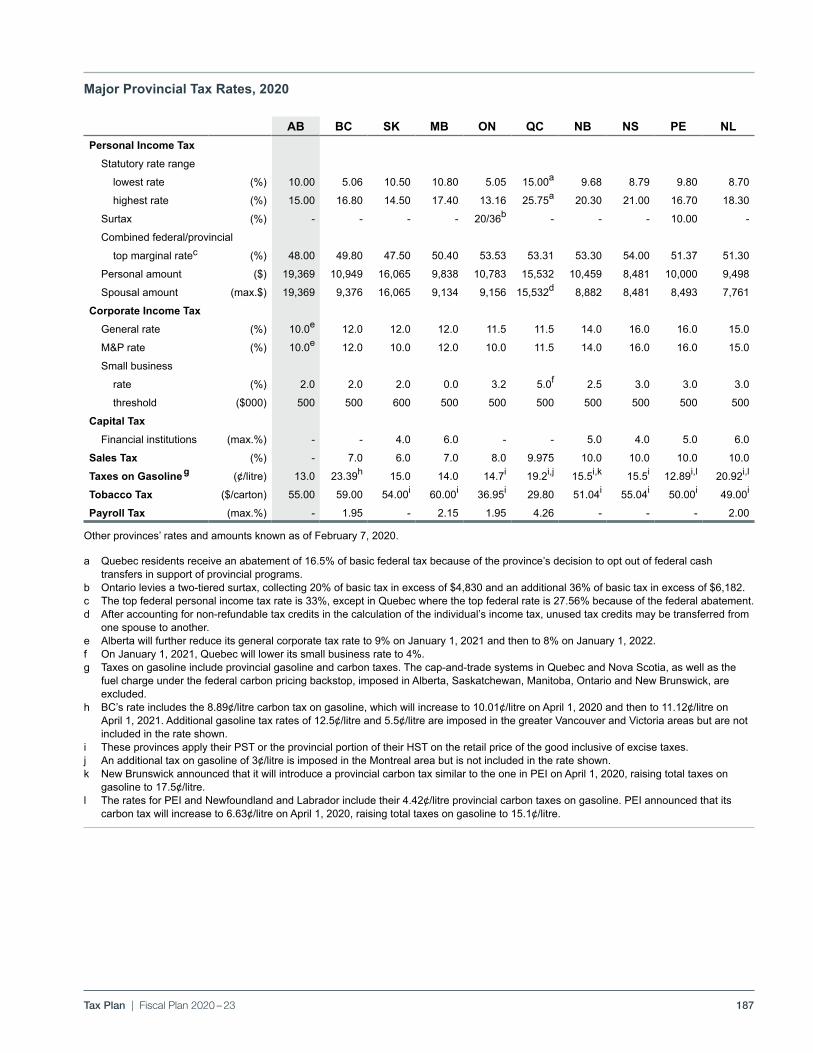
187Tax Plan | Fiscal Plan 2020 – 23
Other provinces’ rates and amounts known as of February 7, 2020.
a Quebec residents receive an abatement of 16.5% of basic federal tax because of the province’s decision to opt out of federal cash transfers in support of provincial programs.
b Ontario levies a two-tiered surtax, collecting 20% of basic tax in excess of $4,830 and an additional 36% of basic tax in excess of $6,182.c The top federal personal income tax rate is 33%, except in Quebec where the top federal rate is 27.56% because of the federal abatement.d After accounting for non-refundable tax credits in the calculation of the individual’s income tax, unused tax credits may be transferred from
one spouse to another. e Alberta will further reduce its general corporate tax rate to 9% on January 1, 2021 and then to 8% on January 1, 2022. f On January 1, 2021, Quebec will lower its small business rate to 4%.g Taxes on gasoline include provincial gasoline and carbon taxes. The cap-and-trade systems in Quebec and Nova Scotia, as well as the
fuel charge under the federal carbon pricing backstop, imposed in Alberta, Saskatchewan, Manitoba, Ontario and New Brunswick, are excluded.
h BC’s rate includes the 8.89¢/litre carbon tax on gasoline, which will increase to 10.01¢/litre on April 1, 2020 and then to 11.12¢/litre on April 1, 2021. Additional gasoline tax rates of 12.5¢/litre and 5.5¢/litre are imposed in the greater Vancouver and Victoria areas but are not included in the rate shown.
i These provinces apply their PST or the provincial portion of their HST on the retail price of the good inclusive of excise taxes.j An additional tax on gasoline of 3¢/litre is imposed in the Montreal area but is not included in the rate shown.k New Brunswick announced that it will introduce a provincial carbon tax similar to the one in PEI on April 1, 2020, raising total taxes on
gasoline to 17.5¢/litre.l The rates for PEI and Newfoundland and Labrador include their 4.42¢/litre provincial carbon taxes on gasoline. PEI announced that its
carbon tax will increase to 6.63¢/litre on April 1, 2020, raising total taxes on gasoline to 15.1¢/litre.
Major Provincial Tax Rates, 2020
AB BC SK MB ON QC NB NS PE NLPersonal Income Tax
Statutory rate range
lowest rate (%) 10.00 5.06 10.50 10.80 5.05 15.00a 9.68 8.79 9.80 8.70
highest rate (%) 15.00 16.80 14.50 17.40 13.16 25.75a 20.30 21.00 16.70 18.30
Surtax (%) - - - - 20/36b - - - 10.00 -
Combined federal/provincial
top marginal ratec (%) 48.00 49.80 47.50 50.40 53.53 53.31 53.30 54.00 51.37 51.30
Personal amount ($) 19,369 10,949 16,065 9,838 10,783 15,532 10,459 8,481 10,000 9,498
Spousal amount (max.$) 19,369 9,376 16,065 9,134 9,156 15,532d 8,882 8,481 8,493 7,761
Corporate Income TaxGeneral rate (%) 10.0e 12.0 12.0 12.0 11.5 11.5 14.0 16.0 16.0 15.0
M&P rate (%) 10.0e 12.0 10.0 12.0 10.0 11.5 14.0 16.0 16.0 15.0
Small business
rate (%) 2.0 2.0 2.0 0.0 3.2 5.0f 2.5 3.0 3.0 3.0
threshold ($000) 500 500 600 500 500 500 500 500 500 500
Capital TaxFinancial institutions (max.%) - - 4.0 6.0 - - 5.0 4.0 5.0 6.0
Sales Tax (%) - 7.0 6.0 7.0 8.0 9.975 10.0 10.0 10.0 10.0
Taxes on Gasoline g (¢/litre) 13.0 23.39h 15.0 14.0 14.7i 19.2i,j 15.5i,k 15.5i 12.89i,l 20.92i,l
Tobacco Tax ($/carton) 55.00 59.00 54.00i 60.00i 36.95i 29.80 51.04i 55.04i 50.00i 49.00i
Payroll Tax (max.%) - 1.95 - 2.15 1.95 4.26 - - - 2.00

188
BLANK PAGE
189
BUDGET 2020
GOVERNMENT OF ALBERTA | 2020 –23
Fiscal PlanDebt
190 Debt | Fiscal Plan 2020 – 23
Table of Contents
Debt . . . . . . . . . . . . . . . . . . . . . . . . . . . . . . . . . . . . . . . . . . . . . . . . . . . . . . . . . . . . . . . . . . . . . . . . . . . . . . . . 191
Historical Context . . . . . . . . . . . . . . . . . . . . . . . . . . . . . . . . . . . . . . . . . . . . . . . . . . . . . . . . . . . . . . . . . . . . . . 191
A Brief History of the Heritage Fund . . . . . . . . . . . . . . . . . . . . . . . . . . . . . . . . . . . . . . . . . . . . . . . . . . . . . . . . 193
Provincial Debt Outstanding . . . . . . . . . . . . . . . . . . . . . . . . . . . . . . . . . . . . . . . . . . . . . . . . . . . . . . . . . . . . . . 195
Debt and Borrowing Projections . . . . . . . . . . . . . . . . . . . . . . . . . . . . . . . . . . . . . . . . . . . . . . . . . . . . . . . . . . . 198
Comparison of Debt Projections . . . . . . . . . . . . . . . . . . . . . . . . . . . . . . . . . . . . . . . . . . . . . . . . . . . . . . . . . . . 199
Reducing Alberta’s Outstanding Debt . . . . . . . . . . . . . . . . . . . . . . . . . . . . . . . . . . . . . . . . . . . . . . . . . . . . . . . 200
Debt Metrics . . . . . . . . . . . . . . . . . . . . . . . . . . . . . . . . . . . . . . . . . . . . . . . . . . . . . . . . . . . . . . . . . . . . . . . . . . 202
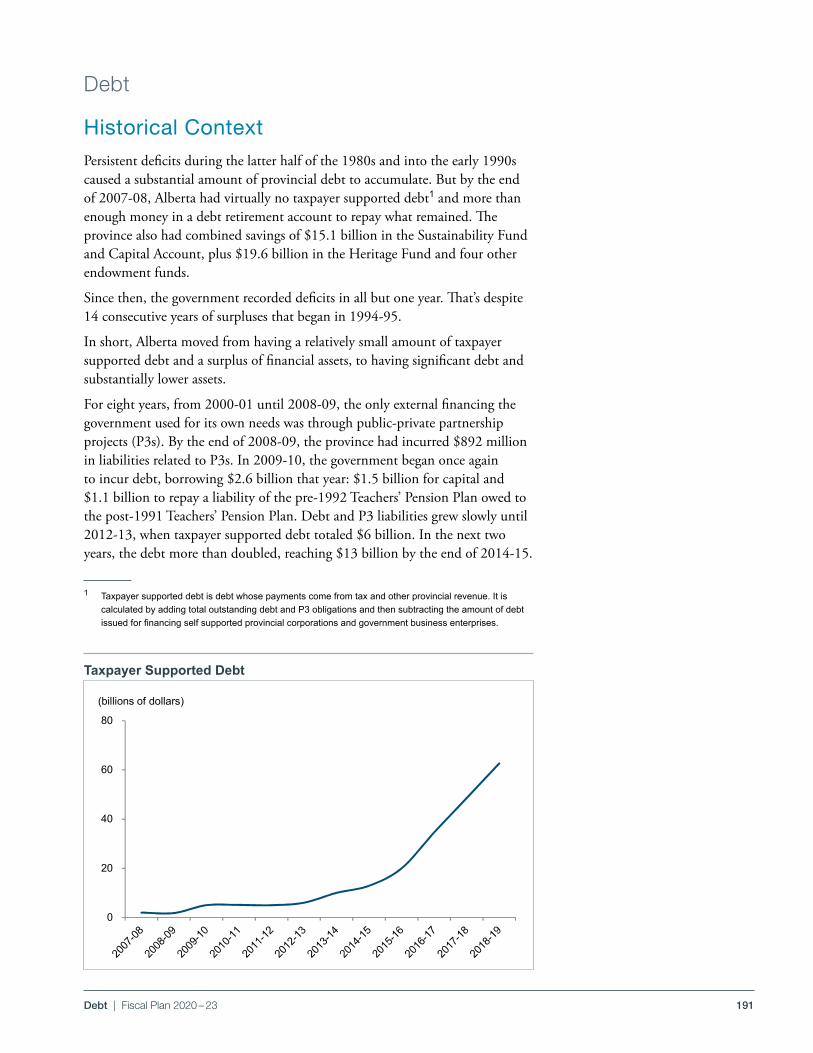
191Debt | Fiscal Plan 2020 – 23
Debt
Budget 2020Debt Reduction
PDF Name: DR20_chrt_01.pdf
Taxpayer Supported Debt
DR20_chrt_01.pdf
0
20
40
60
80
(billions of dollars)
Path: \\ter-fin-fs-01.fin.gov.ab.ca\Publications\TRM\Budget\2020\SourceDocuments\File: ChartsTab: Chart1 Last Updated: 2020-02-18 @ 12:39 PM
Historical ContextPersistent deficits during the latter half of the 1980s and into the early 1990s caused a substantial amount of provincial debt to accumulate . But by the end of 2007‑08, Alberta had virtually no taxpayer supported debt1 and more than enough money in a debt retirement account to repay what remained . The province also had combined savings of $15 .1 billion in the Sustainability Fund and Capital Account, plus $19 .6 billion in the Heritage Fund and four other endowment funds .
Since then, the government recorded deficits in all but one year . That’s despite 14 consecutive years of surpluses that began in 1994‑95 .
In short, Alberta moved from having a relatively small amount of taxpayer supported debt and a surplus of financial assets, to having significant debt and substantially lower assets .
For eight years, from 2000‑01 until 2008‑09, the only external financing the government used for its own needs was through public‑private partnership projects (P3s) . By the end of 2008‑09, the province had incurred $892 million in liabilities related to P3s . In 2009‑10, the government began once again to incur debt, borrowing $2 .6 billion that year: $1 .5 billion for capital and $1 .1 billion to repay a liability of the pre‑1992 Teachers’ Pension Plan owed to the post‑1991 Teachers’ Pension Plan . Debt and P3 liabilities grew slowly until 2012‑13, when taxpayer supported debt totaled $6 billion . In the next two years, the debt more than doubled, reaching $13 billion by the end of 2014‑15 .
1 Taxpayer supported debt is debt whose payments come from tax and other provincial revenue. It is calculated by adding total outstanding debt and P3 obligations and then subtracting the amount of debt issued for financing self supported provincial corporations and government business enterprises.
Taxpayer Supported Debt
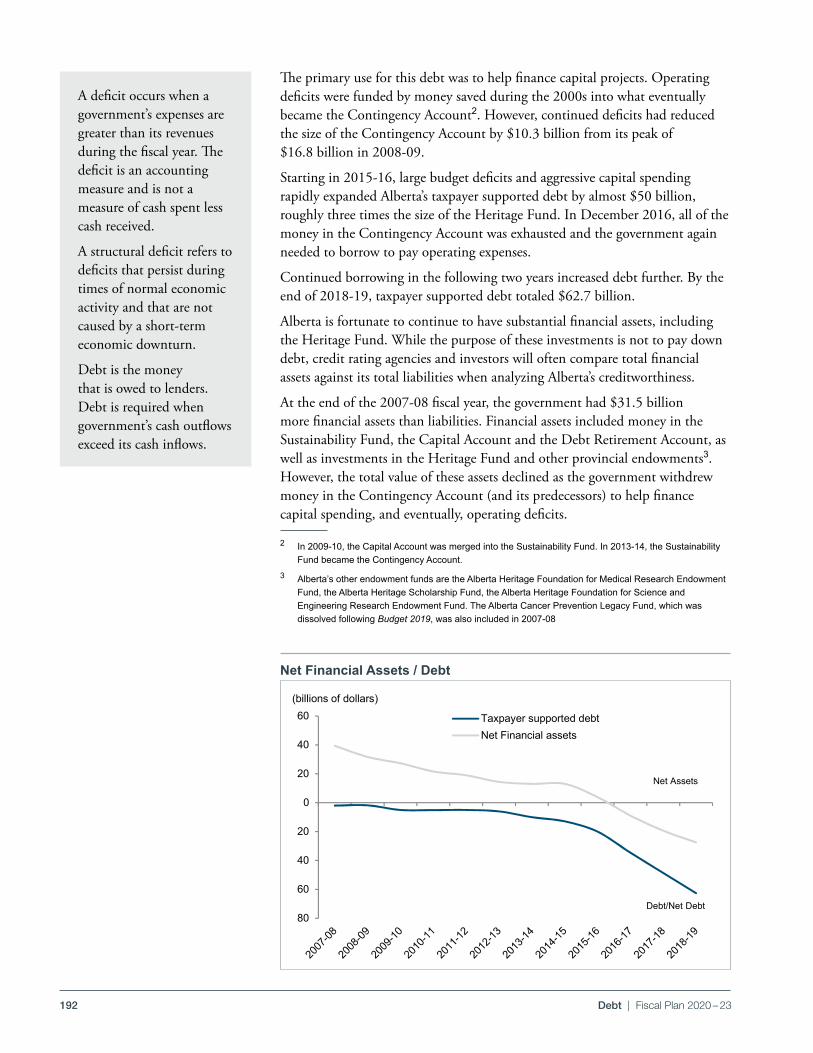
192 Debt | Fiscal Plan 2020 – 23
Budget 2020Debt Reduction
PDF Name: DR20_chrt_02.pdf
Net Financial Assets / Debt
DR20_chrt_02.pdf
80
60
40
20
0
20
40
60 Taxpayer supported debtNet Financial assets
Net Assets
Debt/Net Debt
(billions of dollars)
Path: \\ter-fin-fs-01.fin.gov.ab.ca\Publications\TRM\Budget\2020\SourceDocuments\File: ChartsTab: Chart2 Last Updated: 2020-02-18 @ 12:41 PM
The primary use for this debt was to help finance capital projects . Operating deficits were funded by money saved during the 2000s into what eventually became the Contingency Account2 . However, continued deficits had reduced the size of the Contingency Account by $10 .3 billion from its peak of $16 .8 billion in 2008‑09 .
Starting in 2015‑16, large budget deficits and aggressive capital spending rapidly expanded Alberta’s taxpayer supported debt by almost $50 billion, roughly three times the size of the Heritage Fund . In December 2016, all of the money in the Contingency Account was exhausted and the government again needed to borrow to pay operating expenses .
Continued borrowing in the following two years increased debt further . By the end of 2018‑19, taxpayer supported debt totaled $62 .7 billion .
Alberta is fortunate to continue to have substantial financial assets, including the Heritage Fund . While the purpose of these investments is not to pay down debt, credit rating agencies and investors will often compare total financial assets against its total liabilities when analyzing Alberta’s creditworthiness .
At the end of the 2007‑08 fiscal year, the government had $31 .5 billion more financial assets than liabilities . Financial assets included money in the Sustainability Fund, the Capital Account and the Debt Retirement Account, as well as investments in the Heritage Fund and other provincial endowments3 . However, the total value of these assets declined as the government withdrew money in the Contingency Account (and its predecessors) to help finance capital spending, and eventually, operating deficits .
2 In 2009‑10, the Capital Account was merged into the Sustainability Fund. In 2013‑14, the Sustainability Fund became the Contingency Account.
3 Alberta’s other endowment funds are the Alberta Heritage Foundation for Medical Research Endowment Fund, the Alberta Heritage Scholarship Fund, the Alberta Heritage Foundation for Science and Engineering Research Endowment Fund. The Alberta Cancer Prevention Legacy Fund, which was dissolved following Budget 2019, was also included in 2007‑08
A deficit occurs when a government’s expenses are greater than its revenues during the fiscal year . The deficit is an accounting measure and is not a measure of cash spent less cash received .
A structural deficit refers to deficits that persist during times of normal economic activity and that are not caused by a short‑term economic downturn .
Debt is the money that is owed to lenders . Debt is required when government’s cash outflows exceed its cash inflows .
Net Financial Assets / Debt
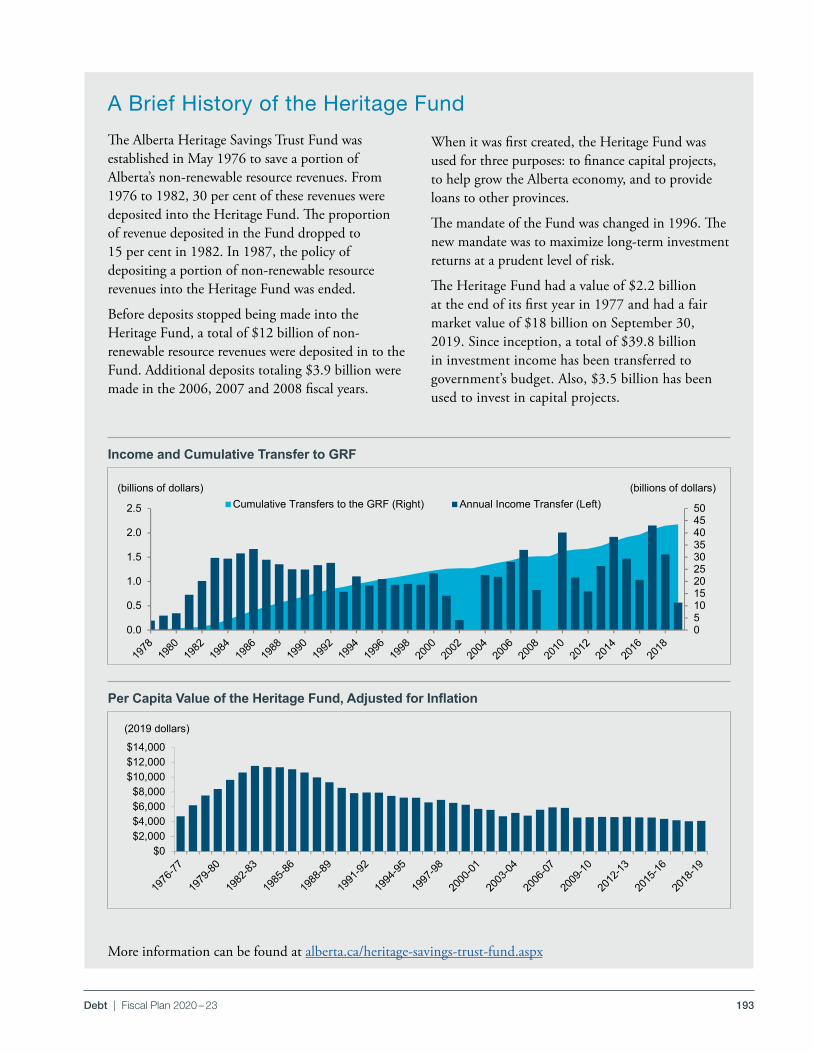
193Debt | Fiscal Plan 2020 – 23
Budget 2020Debt Reduction
PDF Name: DR20_HF_chrt_02.pdf
DR20_HF_chrt_02.pdf
$0$2,000$4,000$6,000$8,000
$10,000$12,000$14,000
(2019 dollars)
Path: \\ter‐fin‐fs‐01.fin.gov.ab.ca\Publications\TRM\Budget\2020\SourceDocuments\File: ChartsTab: HFChart2 Last Updated: 2/17/2020 @ 2:37 PM
Budget 2020Debt Reduction
PDF Name: DR20_HF_chrt_01.pdf
Income and Cumulative Transfer to GRF
DR20_HF_chrt_01.pdf
05101520253035404550
0.0
0.5
1.0
1.5
2.0
2.5 Cumulative Transfers to the GRF (Right) Annual Income Transfer (Left)(billions of dollars) (billions of dollars)
Path: \\ter‐fin‐fs‐01.fin.gov.ab.ca\Publications\TRM\Budget\2020\SourceDocuments\File: ChartsTab: HFChart1 Last Updated: 2/17/2020 @ 2:36 PM
Per Capita Value of the Heritage Fund, Adjusted for Inflation
Income and Cumulative Transfer to GRF
The Alberta Heritage Savings Trust Fund was established in May 1976 to save a portion of Alberta’s non‑renewable resource revenues . From 1976 to 1982, 30 per cent of these revenues were deposited into the Heritage Fund . The proportion of revenue deposited in the Fund dropped to 15 per cent in 1982 . In 1987, the policy of depositing a portion of non‑renewable resource revenues into the Heritage Fund was ended .
Before deposits stopped being made into the Heritage Fund, a total of $12 billion of non‑renewable resource revenues were deposited in to the Fund . Additional deposits totaling $3 .9 billion were made in the 2006, 2007 and 2008 fiscal years .
A Brief History of the Heritage Fund
When it was first created, the Heritage Fund was used for three purposes: to finance capital projects, to help grow the Alberta economy, and to provide loans to other provinces .
The mandate of the Fund was changed in 1996 . The new mandate was to maximize long‑term investment returns at a prudent level of risk .
The Heritage Fund had a value of $2 .2 billion at the end of its first year in 1977 and had a fair market value of $18 billion on September 30, 2019 . Since inception, a total of $39 .8 billion in investment income has been transferred to government’s budget . Also, $3 .5 billion has been used to invest in capital projects .
More information can be found at alberta .ca/heritage‑savings‑trust‑fund .aspx
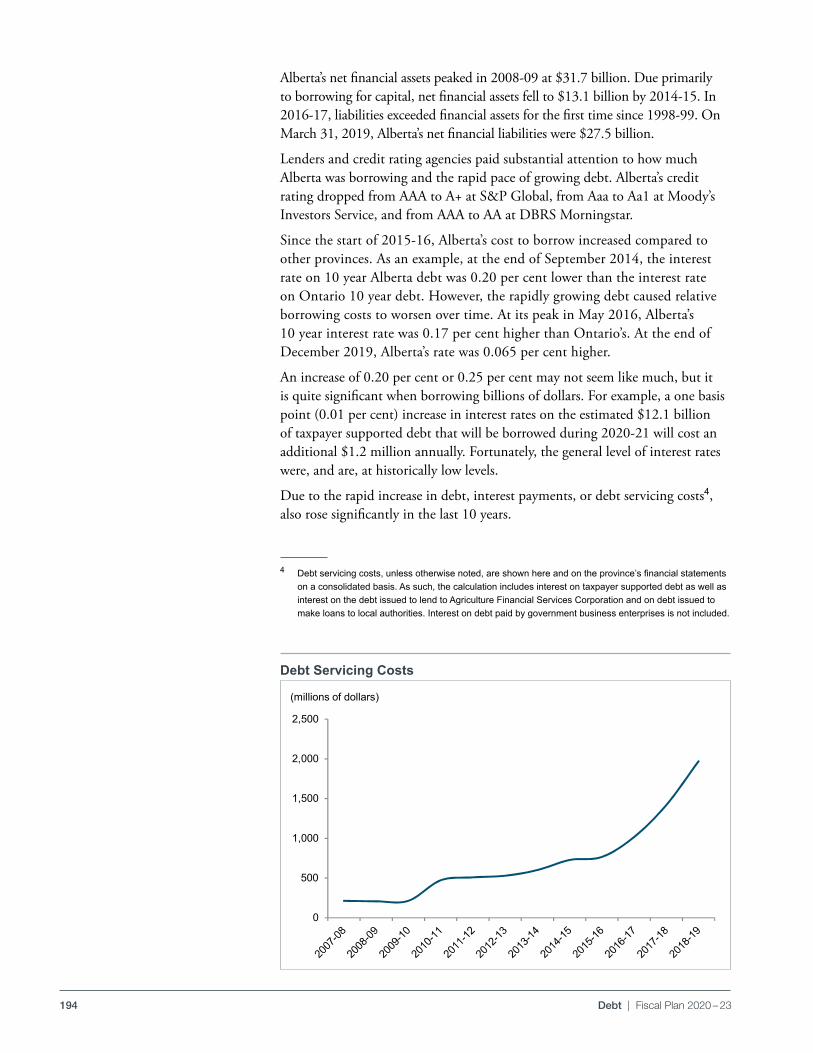
194 Debt | Fiscal Plan 2020 – 23
Budget 2020Debt Reduction
PDF Name: DR20_chrt_03.pdf
Debt Servicing Costs
DR20_chrt_03.pdf
0
500
1,000
1,500
2,000
2,500
(millions of dollars)
Path: \\ter-fin-fs-01.fin.gov.ab.ca\Publications\TRM\Budget\2020\SourceDocuments\File: ChartsTab: Chart3 Last Updated: 2020-02-18 @ 12:41 PM
Alberta’s net financial assets peaked in 2008‑09 at $31 .7 billion . Due primarily to borrowing for capital, net financial assets fell to $13 .1 billion by 2014‑15 . In 2016‑17, liabilities exceeded financial assets for the first time since 1998‑99 . On March 31, 2019, Alberta’s net financial liabilities were $27 .5 billion .
Lenders and credit rating agencies paid substantial attention to how much Alberta was borrowing and the rapid pace of growing debt . Alberta’s credit rating dropped from AAA to A+ at S&P Global, from Aaa to Aa1 at Moody’s Investors Service, and from AAA to AA at DBRS Morningstar .
Since the start of 2015‑16, Alberta’s cost to borrow increased compared to other provinces . As an example, at the end of September 2014, the interest rate on 10 year Alberta debt was 0 .20 per cent lower than the interest rate on Ontario 10 year debt . However, the rapidly growing debt caused relative borrowing costs to worsen over time . At its peak in May 2016, Alberta’s 10 year interest rate was 0 .17 per cent higher than Ontario’s . At the end of December 2019, Alberta’s rate was 0 .065 per cent higher .
An increase of 0 .20 per cent or 0 .25 per cent may not seem like much, but it is quite significant when borrowing billions of dollars . For example, a one basis point (0 .01 per cent) increase in interest rates on the estimated $12 .1 billion of taxpayer supported debt that will be borrowed during 2020‑21 will cost an additional $1 .2 million annually . Fortunately, the general level of interest rates were, and are, at historically low levels .
Due to the rapid increase in debt, interest payments, or debt servicing costs4, also rose significantly in the last 10 years .
4 Debt servicing costs, unless otherwise noted, are shown here and on the province’s financial statements on a consolidated basis. As such, the calculation includes interest on taxpayer supported debt as well as interest on the debt issued to lend to Agriculture Financial Services Corporation and on debt issued to make loans to local authorities. Interest on debt paid by government business enterprises is not included.
Debt Servicing Costs
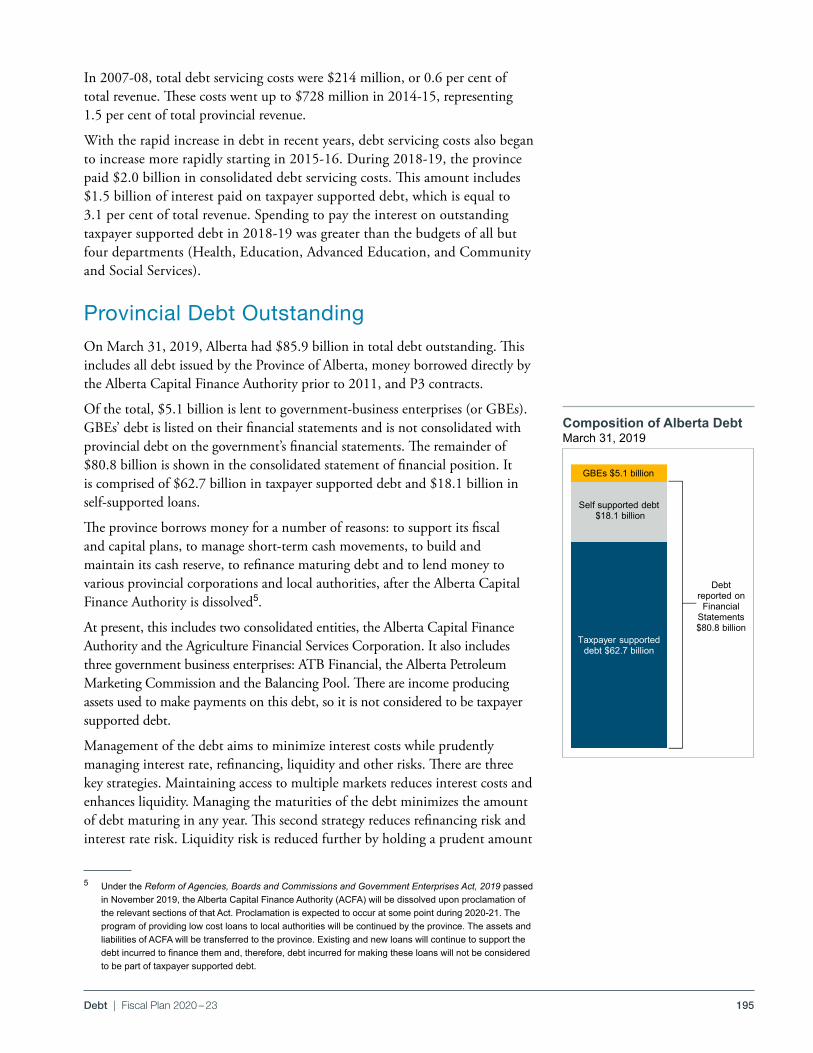
195Debt | Fiscal Plan 2020 – 23
Budget 2020Debt Reduction
PDF Name: DR20_chrt_04.pdf
Composition of Alberta DebtMarch 31, 2019
DR20_chrt_04.pdf
Taxpayer supported debt $62.7 billion
Self supported debt $18.1 billion
GBEs $5.1 billion
Debtreported on
Financial Statements $80.8 billion
Path: \\ter-fin-fs-01.fin.gov.ab.ca\Publications\TRM\Budget\2020\SourceDocuments\File: ChartsTab: Chart4 Last Updated: 2020-02-18 @ 1:59 PM
In 2007‑08, total debt servicing costs were $214 million, or 0 .6 per cent of total revenue . These costs went up to $728 million in 2014‑15, representing 1 .5 per cent of total provincial revenue .
With the rapid increase in debt in recent years, debt servicing costs also began to increase more rapidly starting in 2015‑16 . During 2018‑19, the province paid $2 .0 billion in consolidated debt servicing costs . This amount includes $1 .5 billion of interest paid on taxpayer supported debt, which is equal to 3 .1 per cent of total revenue . Spending to pay the interest on outstanding taxpayer supported debt in 2018‑19 was greater than the budgets of all but four departments (Health, Education, Advanced Education, and Community and Social Services) .
Provincial Debt OutstandingOn March 31, 2019, Alberta had $85 .9 billion in total debt outstanding . This includes all debt issued by the Province of Alberta, money borrowed directly by the Alberta Capital Finance Authority prior to 2011, and P3 contracts .
Of the total, $5 .1 billion is lent to government‑business enterprises (or GBEs) . GBEs’ debt is listed on their financial statements and is not consolidated with provincial debt on the government’s financial statements . The remainder of $80 .8 billion is shown in the consolidated statement of financial position . It is comprised of $62 .7 billion in taxpayer supported debt and $18 .1 billion in self‑supported loans .
The province borrows money for a number of reasons: to support its fiscal and capital plans, to manage short‑term cash movements, to build and maintain its cash reserve, to refinance maturing debt and to lend money to various provincial corporations and local authorities, after the Alberta Capital Finance Authority is dissolved5 .
At present, this includes two consolidated entities, the Alberta Capital Finance Authority and the Agriculture Financial Services Corporation . It also includes three government business enterprises: ATB Financial, the Alberta Petroleum Marketing Commission and the Balancing Pool . There are income producing assets used to make payments on this debt, so it is not considered to be taxpayer supported debt .
Management of the debt aims to minimize interest costs while prudently managing interest rate, refinancing, liquidity and other risks . There are three key strategies . Maintaining access to multiple markets reduces interest costs and enhances liquidity . Managing the maturities of the debt minimizes the amount of debt maturing in any year . This second strategy reduces refinancing risk and interest rate risk . Liquidity risk is reduced further by holding a prudent amount
5 Under the Reform of Agencies, Boards and Commissions and Government Enterprises Act, 2019 passed in November 2019, the Alberta Capital Finance Authority (ACFA) will be dissolved upon proclamation of the relevant sections of that Act. Proclamation is expected to occur at some point during 2020‑21. The program of providing low cost loans to local authorities will be continued by the province. The assets and liabilities of ACFA will be transferred to the province. Existing and new loans will continue to support the debt incurred to finance them and, therefore, debt incurred for making these loans will not be considered to be part of taxpayer supported debt.
Composition of Alberta DebtMarch 31, 2019
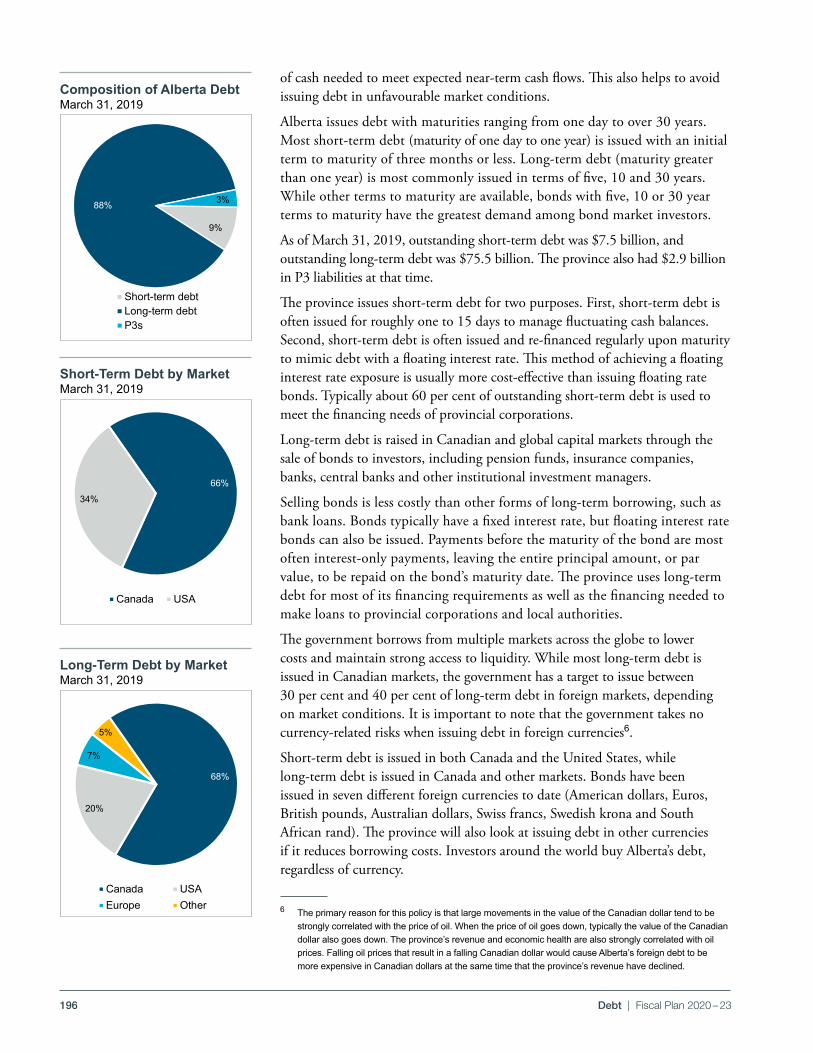
196 Debt | Fiscal Plan 2020 – 23
Budget 2020Debt Reduction
PDF Name: DR20_chrt_05.pdf
Debt Outstanding by TypeMarch 31, 2019
DR20_chrt_05.pdf
9%
88% 3%
Short-term debtLong-term debtP3s
Path: \\ter-fin-fs-01.fin.gov.ab.ca\Publications\TRM\Budget\2020\SourceDocuments\File: ChartsTab: Chart5 Last Updated: 2020-02-18 @ 12:42 PM
Budget 2020Debt Reduction
PDF Name: DR20_chrt_06.pdf
Short-Term Debt by Market
DR20_chrt_06.pdf
March 31, 2019
66%
34%
Canada USA
Path: \\ter-fin-fs-01.fin.gov.ab.ca\Publications\TRM\Budget\2020\SourceDocuments\File: ChartsTab: Chart6 Last Updated: 2020-02-18 @ 12:43 PM
Budget 2020Debt Reduction
PDF Name: DR20_chrt_07.pdf
Long-Term Debt by Market
DR20_chrt_07.pdf
March 31, 2019
68%
20%
7%
5%
Canada USAEurope Other
Path: \\ter-fin-fs-01.fin.gov.ab.ca\Publications\TRM\Budget\2020\SourceDocuments\File: ChartsTab: Chart7 Last Updated: 2020-02-18 @ 12:43 PM
of cash needed to meet expected near‑term cash flows . This also helps to avoid issuing debt in unfavourable market conditions .
Alberta issues debt with maturities ranging from one day to over 30 years . Most short‑term debt (maturity of one day to one year) is issued with an initial term to maturity of three months or less . Long‑term debt (maturity greater than one year) is most commonly issued in terms of five, 10 and 30 years . While other terms to maturity are available, bonds with five, 10 or 30 year terms to maturity have the greatest demand among bond market investors .
As of March 31, 2019, outstanding short‑term debt was $7 .5 billion, and outstanding long‑term debt was $75 .5 billion . The province also had $2 .9 billion in P3 liabilities at that time .
The province issues short‑term debt for two purposes . First, short‑term debt is often issued for roughly one to 15 days to manage fluctuating cash balances . Second, short‑term debt is often issued and re‑financed regularly upon maturity to mimic debt with a floating interest rate . This method of achieving a floating interest rate exposure is usually more cost‑effective than issuing floating rate bonds . Typically about 60 per cent of outstanding short‑term debt is used to meet the financing needs of provincial corporations .
Long‑term debt is raised in Canadian and global capital markets through the sale of bonds to investors, including pension funds, insurance companies, banks, central banks and other institutional investment managers .
Selling bonds is less costly than other forms of long‑term borrowing, such as bank loans . Bonds typically have a fixed interest rate, but floating interest rate bonds can also be issued . Payments before the maturity of the bond are most often interest‑only payments, leaving the entire principal amount, or par value, to be repaid on the bond’s maturity date . The province uses long‑term debt for most of its financing requirements as well as the financing needed to make loans to provincial corporations and local authorities .
The government borrows from multiple markets across the globe to lower costs and maintain strong access to liquidity . While most long‑term debt is issued in Canadian markets, the government has a target to issue between 30 per cent and 40 per cent of long‑term debt in foreign markets, depending on market conditions . It is important to note that the government takes no currency‑related risks when issuing debt in foreign currencies6 .
Short‑term debt is issued in both Canada and the United States, while long‑term debt is issued in Canada and other markets . Bonds have been issued in seven different foreign currencies to date (American dollars, Euros, British pounds, Australian dollars, Swiss francs, Swedish krona and South African rand) . The province will also look at issuing debt in other currencies if it reduces borrowing costs . Investors around the world buy Alberta’s debt, regardless of currency .
6 The primary reason for this policy is that large movements in the value of the Canadian dollar tend to be strongly correlated with the price of oil. When the price of oil goes down, typically the value of the Canadian dollar also goes down. The province’s revenue and economic health are also strongly correlated with oil prices. Falling oil prices that result in a falling Canadian dollar would cause Alberta’s foreign debt to be more expensive in Canadian dollars at the same time that the province’s revenue have declined.
Composition of Alberta DebtMarch 31, 2019
Short‑Term Debt by MarketMarch 31, 2019
Long‑Term Debt by MarketMarch 31, 2019
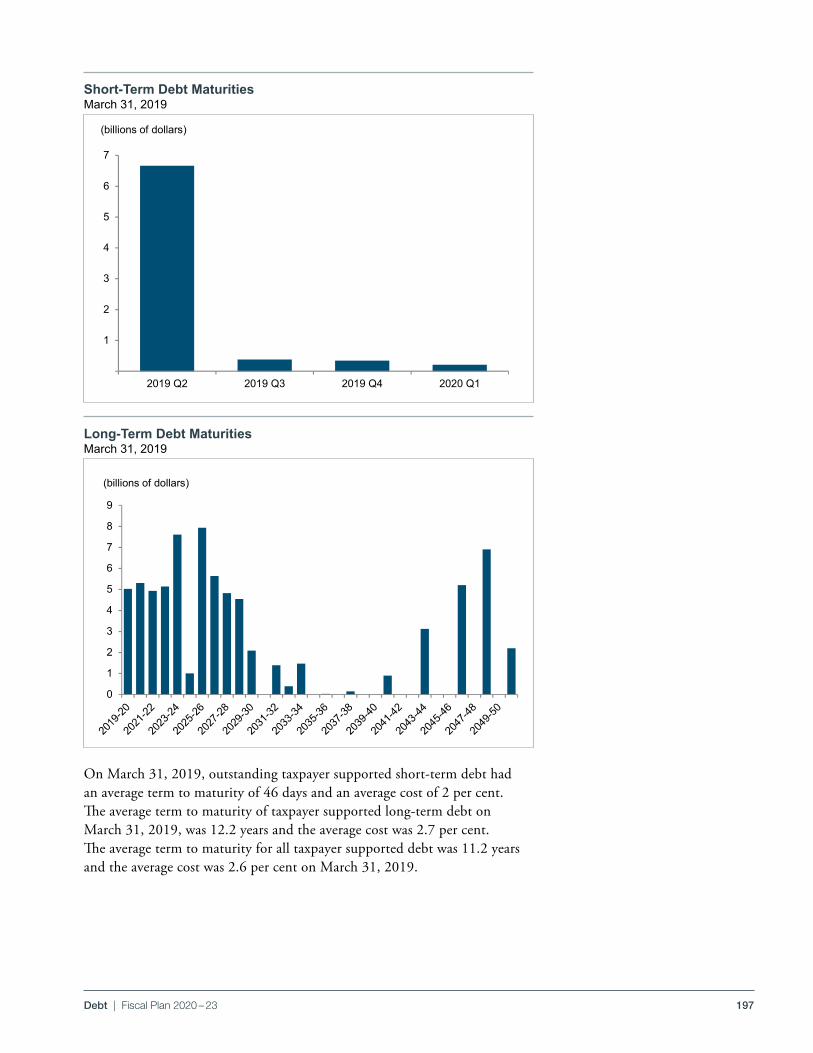
197Debt | Fiscal Plan 2020 – 23
Budget 2020Debt Reduction
PDF Name: DR20_chrt_08.pdf
Short-Term Debt Maturities
DR20_chrt_08.pdf
March 31, 2019
1
2
3
4
5
6
7
2019 Q2 2019 Q3 2019 Q4 2020 Q1
(billions of dollars)
Path: \\ter-fin-fs-01.fin.gov.ab.ca\Publications\TRM\Budget\2020\SourceDocuments\File: ChartsTab: Chart8 Last Updated: 2020-02-18 @ 12:43 PM
Budget 2020Debt Reduction
PDF Name: DR20_chrt_09.pdf
Long-Term Debt Maturities
DR20_chrt_09.pdf
March 31, 2019
0
1
2
3
4
5
6
7
8
9
(billions of dollars)
Path: \\ter-fin-fs-01.fin.gov.ab.ca\Publications\TRM\Budget\2020\SourceDocuments\File: ChartsTab: Chart9 Last Updated: 2020-02-18 @ 12:44 PM
On March 31, 2019, outstanding taxpayer supported short‑term debt had an average term to maturity of 46 days and an average cost of 2 per cent . The average term to maturity of taxpayer supported long‑term debt on March 31, 2019, was 12 .2 years and the average cost was 2 .7 per cent . The average term to maturity for all taxpayer supported debt was 11 .2 years and the average cost was 2 .6 per cent on March 31, 2019 .
Short‑Term Debt MaturitiesMarch 31, 2019
Long‑Term Debt MaturitiesMarch 31, 2019
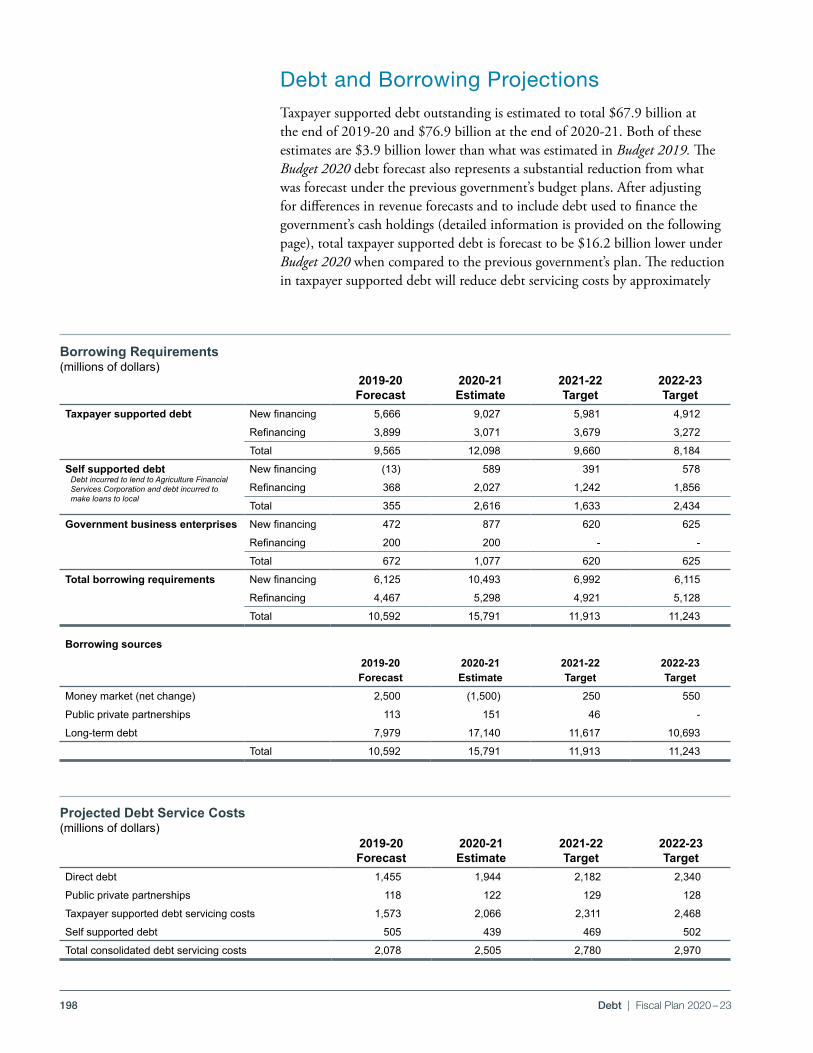
198 Debt | Fiscal Plan 2020 – 23
2019‑20 Forecast
2020‑21 Estimate
2021‑22 Target
2022‑23 Target
Taxpayer supported debt New financing 5,666 9,027 5,981 4,912
Refinancing 3,899 3,071 3,679 3,272
Total 9,565 12,098 9,660 8,184
Self supported debtDebt incurred to lend to Agriculture Financial Services Corporation and debt incurred to make loans to local
New financing (13) 589 391 578
Refinancing 368 2,027 1,242 1,856
Total 355 2,616 1,633 2,434
Government business enterprises New financing 472 877 620 625
Refinancing 200 200 ‑ ‑
Total 672 1,077 620 625
Total borrowing requirements New financing 6,125 10,493 6,992 6,115
Refinancing 4,467 5,298 4,921 5,128
Total 10,592 15,791 11,913 11,243
Borrowing sources
2019‑20 Forecast
2020‑21 Estimate
2021‑22 Target
2022‑23 Target
Money market (net change) 2,500 (1,500) 250 550
Public private partnerships 113 151 46 ‑
Long‑term debt 7,979 17,140 11,617 10,693
Total 10,592 15,791 11,913 11,243
2019‑20 Forecast
2020‑21 Estimate
2021‑22 Target
2022‑23 Target
Direct debt 1,455 1,944 2,182 2,340
Public private partnerships 118 122 129 128
Taxpayer supported debt servicing costs 1,573 2,066 2,311 2,468
Self supported debt 505 439 469 502
Total consolidated debt servicing costs 2,078 2,505 2,780 2,970
Debt and Borrowing ProjectionsTaxpayer supported debt outstanding is estimated to total $67 .9 billion at the end of 2019‑20 and $76 .9 billion at the end of 2020‑21 . Both of these estimates are $3 .9 billion lower than what was estimated in Budget 2019. The Budget 2020 debt forecast also represents a substantial reduction from what was forecast under the previous government’s budget plans . After adjusting for differences in revenue forecasts and to include debt used to finance the government’s cash holdings (detailed information is provided on the following page), total taxpayer supported debt is forecast to be $16 .2 billion lower under Budget 2020 when compared to the previous government’s plan . The reduction in taxpayer supported debt will reduce debt servicing costs by approximately
Borrowing Requirements(millions of dollars)
Projected Debt Service Costs(millions of dollars)
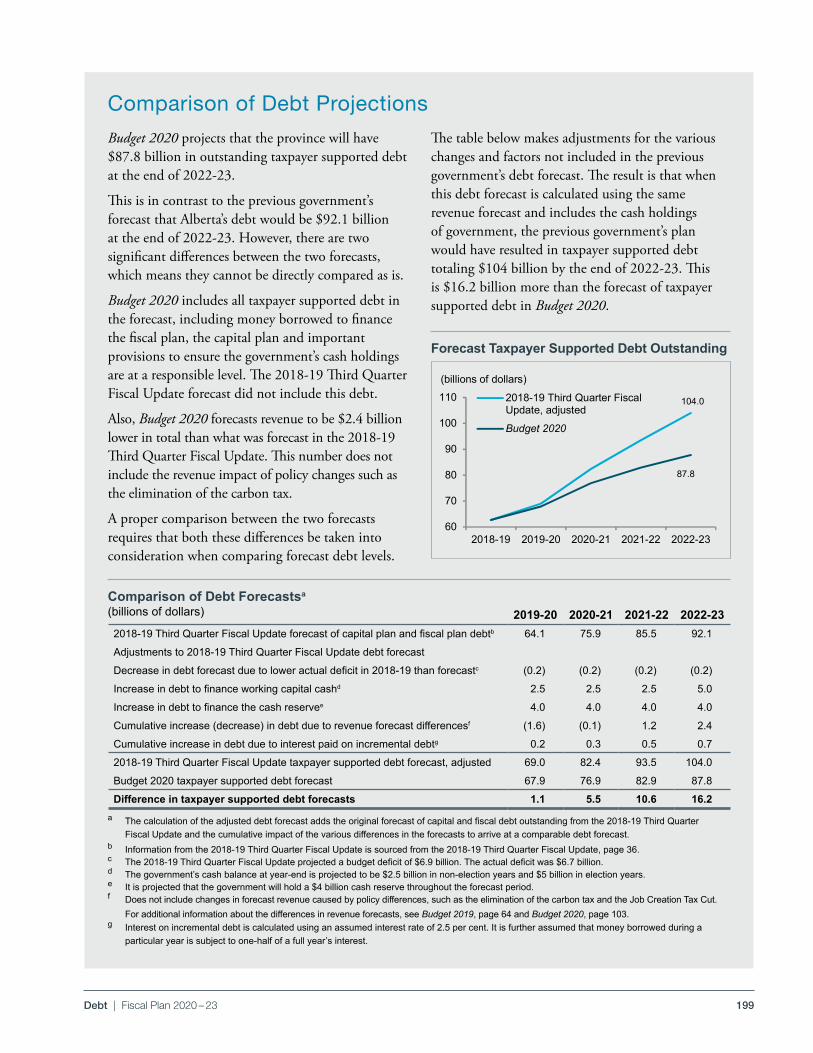
199Debt | Fiscal Plan 2020 – 23
Budget 2020Debt Reduction
PDF Name: DR20_Comp_chrt_01.pdf
Taxpayer Supported Debt Forecasts
DR20_Comp_chrt_01.pdf
104.0
87.8
60
70
80
90
100
110
2018-19 2019-20 2020-21 2021-22 2022-23
2018-19 Third Quarter FiscalUpdate, adjusted
Budget 2020
(billions of dollars)
Path: \\ter-fin-fs-01.fin.gov.ab.ca\Publications\TRM\Budget\2020\SourceDocuments\File: ChartsTab: Comparison2 Last Updated: 2020-02-18 @ 12:56 PM
2019‑20 2020‑21 2021‑22 2022‑232018-19 Third Quarter Fiscal Update forecast of capital plan and fiscal plan debtb 64.1 75.9 85.5 92.1
Adjustments to 2018‑19 Third Quarter Fiscal Update debt forecast
Decrease in debt forecast due to lower actual deficit in 2018-19 than forecastc (0.2) (0.2) (0.2) (0.2)
Increase in debt to finance working capital cashd 2.5 2.5 2.5 5.0
Increase in debt to finance the cash reservee 4.0 4.0 4.0 4.0
Cumulative increase (decrease) in debt due to revenue forecast differencesf (1.6) (0.1) 1.2 2.4
Cumulative increase in debt due to interest paid on incremental debtg 0.2 0.3 0.5 0.7
2018‑19 Third Quarter Fiscal Update taxpayer supported debt forecast, adjusted 69.0 82.4 93.5 104.0
Budget 2020 taxpayer supported debt forecast 67.9 76.9 82.9 87.8
Difference in taxpayer supported debt forecasts 1.1 5.5 10.6 16.2
Comparison of Debt Forecastsa
(billions of dollars)
Budget 2020 projects that the province will have $87 .8 billion in outstanding taxpayer supported debt at the end of 2022‑23 .
This is in contrast to the previous government’s forecast that Alberta’s debt would be $92 .1 billion at the end of 2022‑23 . However, there are two significant differences between the two forecasts, which means they cannot be directly compared as is .
Budget 2020 includes all taxpayer supported debt in the forecast, including money borrowed to finance the fiscal plan, the capital plan and important provisions to ensure the government’s cash holdings are at a responsible level . The 2018‑19 Third Quarter Fiscal Update forecast did not include this debt .
Also, Budget 2020 forecasts revenue to be $2 .4 billion lower in total than what was forecast in the 2018‑19 Third Quarter Fiscal Update . This number does not include the revenue impact of policy changes such as the elimination of the carbon tax .
A proper comparison between the two forecasts requires that both these differences be taken into consideration when comparing forecast debt levels .
Forecast Taxpayer Supported Debt Outstanding
Comparison of Debt Projections
a The calculation of the adjusted debt forecast adds the original forecast of capital and fiscal debt outstanding from the 2018-19 Third Quarter Fiscal Update and the cumulative impact of the various differences in the forecasts to arrive at a comparable debt forecast.
b Information from the 2018‑19 Third Quarter Fiscal Update is sourced from the 2018‑19 Third Quarter Fiscal Update, page 36.c The 2018-19 Third Quarter Fiscal Update projected a budget deficit of $6.9 billion. The actual deficit was $6.7 billion.d The government’s cash balance at year-end is projected to be $2.5 billion in non-election years and $5 billion in election years.e It is projected that the government will hold a $4 billion cash reserve throughout the forecast period.f Does not include changes in forecast revenue caused by policy differences, such as the elimination of the carbon tax and the Job Creation Tax Cut.
For additional information about the differences in revenue forecasts, see Budget 2019, page 64 and Budget 2020, page 103.g Interest on incremental debt is calculated using an assumed interest rate of 2.5 per cent. It is further assumed that money borrowed during a
particular year is subject to one‑half of a full year’s interest.
The table below makes adjustments for the various changes and factors not included in the previous government’s debt forecast . The result is that when this debt forecast is calculated using the same revenue forecast and includes the cash holdings of government, the previous government’s plan would have resulted in taxpayer supported debt totaling $104 billion by the end of 2022‑23 . This is $16 .2 billion more than the forecast of taxpayer supported debt in Budget 2020 .
200 Debt | Fiscal Plan 2020 – 23
2018‑19 Actual
2019‑20 Estimate
2020‑21 Target
2021‑22 Target
2022‑23 Target
Taxpayer supported debt 62,657 67,976 76,837 82,688 87,368
Net debt ‑27,477 ‑35,648 ‑43,381 ‑46,549 ‑45,859
$450 million annually . Instead of paying lenders, this money will be more wisely used to support government programs .
The government is projected to need to borrow $10 .6 billion for 2019‑20, a reduction of $4 .5 billion from what was estimated in Budget 2019 . The reduced borrowing requirements result from a lower deficit, the closure of regulated funds announced in Budget 2019 and improvements to cash management, among other factors .
It is projected that the government will need to borrow $15 .8 billion in total for 2020‑21 . The province is forecast to require $11 .9 billion in financing in 2021‑22 and $11 .2 billion in 2022‑23 .
Most of the borrowing will be completed using long‑term debt . The borrowing strategy will remain similar to that of the recent past: build liquid benchmark bonds, target 30 to 40 per cent to be issued in foreign markets, and issue debt in multiple terms to maturity out to 30 years .
Consolidated debt servicing costs are estimated to be $2 .5 billion in 2020‑21 . Debt servicing costs on taxpayer supported debt are projected to be $2 .1 billion in 2020‑21 . This represents 4 .1 per cent of estimated total revenue .
Taxpayer supported debt is estimated to be $76 .9 billion at the end of the 2020‑21 fiscal year . This is equal to 21 .3 per cent of GDP and 153 .9 per cent of total revenue . Taxpayer supported debt per capita is forecast to be $17,325 . Net financial liabilities are projected to be $43 .6 billion at year’s end . In relative terms, this is 12 .1 per cent of GDP and 87 .2 per cent of revenue . On a per capita basis, net financial liabilities are expected to be $9,820 .
Reducing Alberta’s Outstanding DebtThe most important step in slowing, and ultimately reversing, the growth of Alberta’s debt and interest costs is to balance the budget . The government will also improve how it manages its cash resources .
In Budget 2019, it was announced that a number of regulated funds that are no longer required would be closed . The regulated funds that have been closed are the Lottery Fund, the Access to the Future Fund, the Alberta Cancer Legacy Prevention Fund, the Historic Resources Fund and the Environmental Protection and Enhancement Fund . It is important to note that spending on the funds’ purpose will not change, but payments will come directly out of government’s cash . The total amount of money transferred from those funds was approximately $635 million . This money replaced money that would
201Debt | Fiscal Plan 2020 – 23
otherwise have been borrowed . It is estimated that the closure of these funds will reduce debt servicing costs by approximately $19 million annually .
The size of the cash reserve held by the province was also evaluated . Analysis concluded that the amount held in the reserve could be reduced because of lower spending and reduced borrowing requirements . Therefore, the cash reserve was reduced from $5 billion to $4 billion . This decision is expected to save about $30 million in annual interest costs .
Further areas where cash management can be improved will be identified and analyzed in 2020‑21 . This will include an analysis and possible reform of cash pooling across government and its agencies among other potential initiatives .
Reducing and eventually eliminating the province’s debt will first require the budget to be balanced . Since debt is also used to finance capital spending, the government will need to produce surpluses while prudently managing capital budgets in order to eliminate the need for borrowing and to reduce outstanding debt . When the debt is finally repaid, deposits of some of the province’s non‑renewable resource revenue will again flow into the Heritage Fund for the benefit of current and future Albertans .
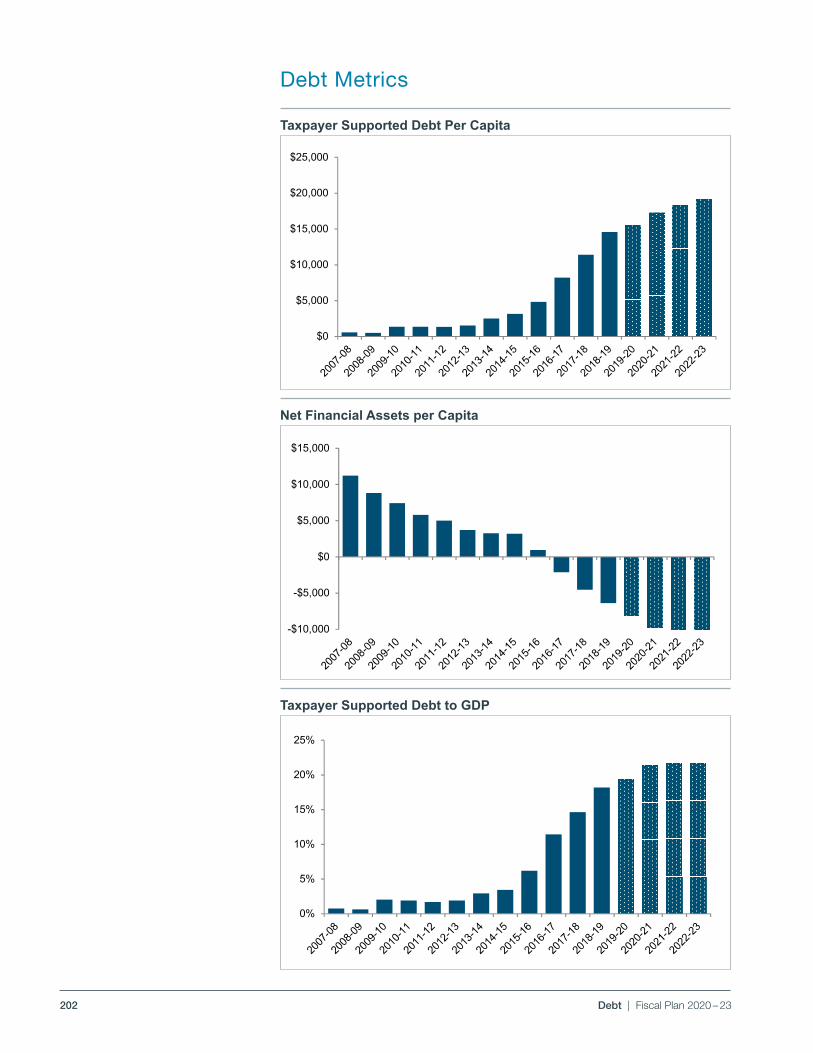
202 Debt | Fiscal Plan 2020 – 23
Budget 2020Debt Reduction
PDF Name: DR20_chrt_10.pdf
Taxpayer Supported Debt per Capita
DR20_chrt_10.pdf
$0
$5,000
$10,000
$15,000
$20,000
$25,000
Path: \\ter-fin-fs-01.fin.gov.ab.ca\Publications\TRM\Budget\2020\SourceDocuments\File: ChartsTab: Chart10 Last Updated: 2020-02-18 @ 12:44 PM
Budget 2020Debt Reduction
PDF Name: DR20_chrt_11.pdf
Net Financial Assets / Debt per Capita
DR20_chrt_11.pdf
-$10,000
-$5,000
$0
$5,000
$10,000
$15,000
Path: \\ter-fin-fs-01.fin.gov.ab.ca\Publications\TRM\Budget\2020\SourceDocuments\File: ChartsTab: Chart11 Last Updated: 2020-02-18 @ 12:45 PM
Budget 2020Debt Reduction
PDF Name: DR20_chrt_12.pdf
Taxpayer Supported Debt to GDP
DR20_chrt_12.pdf
0%
5%
10%
15%
20%
25%
Path: \\ter-fin-fs-01.fin.gov.ab.ca\Publications\TRM\Budget\2020\SourceDocuments\File: ChartsTab: Chart12 Last Updated: 2020-02-18 @ 12:45 PM
Taxpayer Supported Debt Per Capita
Net Financial Assets per Capita
Taxpayer Supported Debt to GDP
Debt Metrics
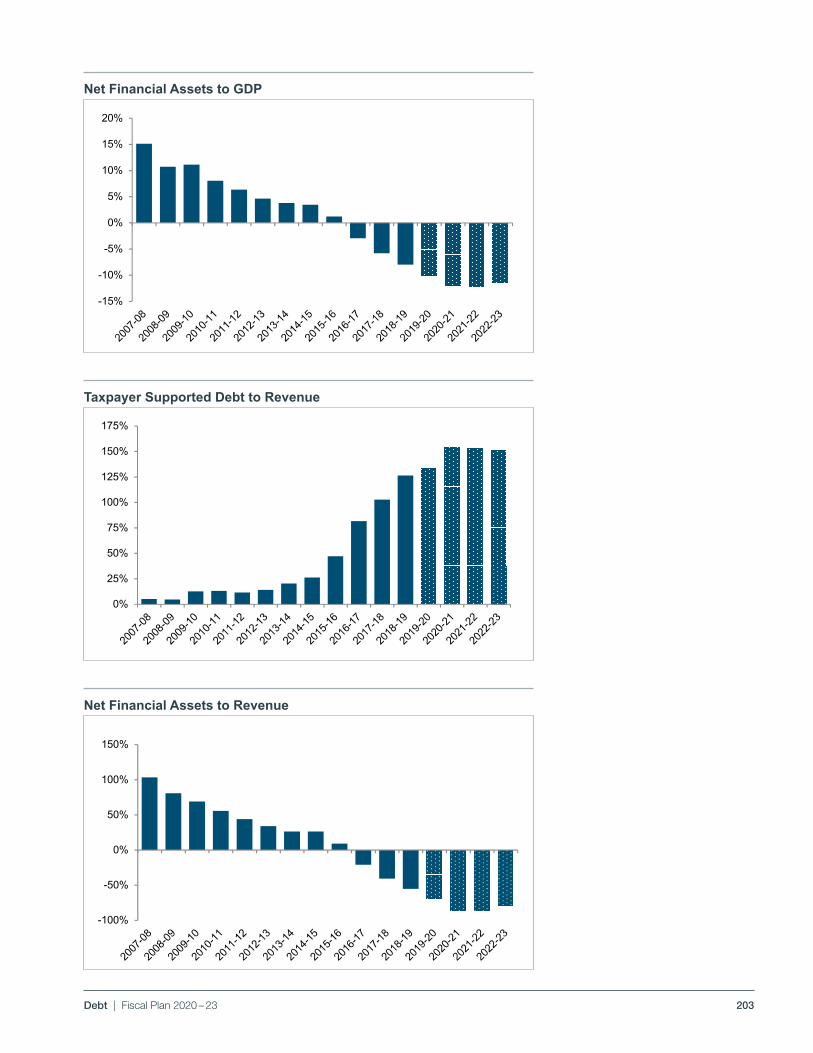
203Debt | Fiscal Plan 2020 – 23
Budget 2020Debt Reduction
PDF Name: DR20_chrt_13.pdf
Net Financial Assets / Debt to GDP
DR20_chrt_13.pdf
-15%
-10%
-5%
0%
5%
10%
15%
20%
Path: \\ter-fin-fs-01.fin.gov.ab.ca\Publications\TRM\Budget\2020\SourceDocuments\File: ChartsTab: Chart13 Last Updated: 2020-02-18 @ 12:46 PM
Budget 2020Debt Reduction
PDF Name: DR20_chrt_14.pdf
Taxpayer Supported Debt to Revenue
DR20_chrt_14.pdf
0%
25%
50%
75%
100%
125%
150%
175%
Path: \\ter-fin-fs-01.fin.gov.ab.ca\Publications\TRM\Budget\2020\SourceDocuments\File: ChartsTab: Chart14 Last Updated: 2020-02-18 @ 12:46 PM
Budget 2020Debt Reduction
PDF Name: DR20_chrt_15.pdf
Net Financial Assets / Debt to Revenue
DR20_chrt_15.pdf
-100%
-50%
0%
50%
100%
150%
Path: \\ter-fin-fs-01.fin.gov.ab.ca\Publications\TRM\Budget\2020\SourceDocuments\File: ChartsTab: Chart15 Last Updated: 2020-02-18 @ 12:46 PM
Net Financial Assets to GDP
Taxpayer Supported Debt to Revenue
Net Financial Assets to Revenue
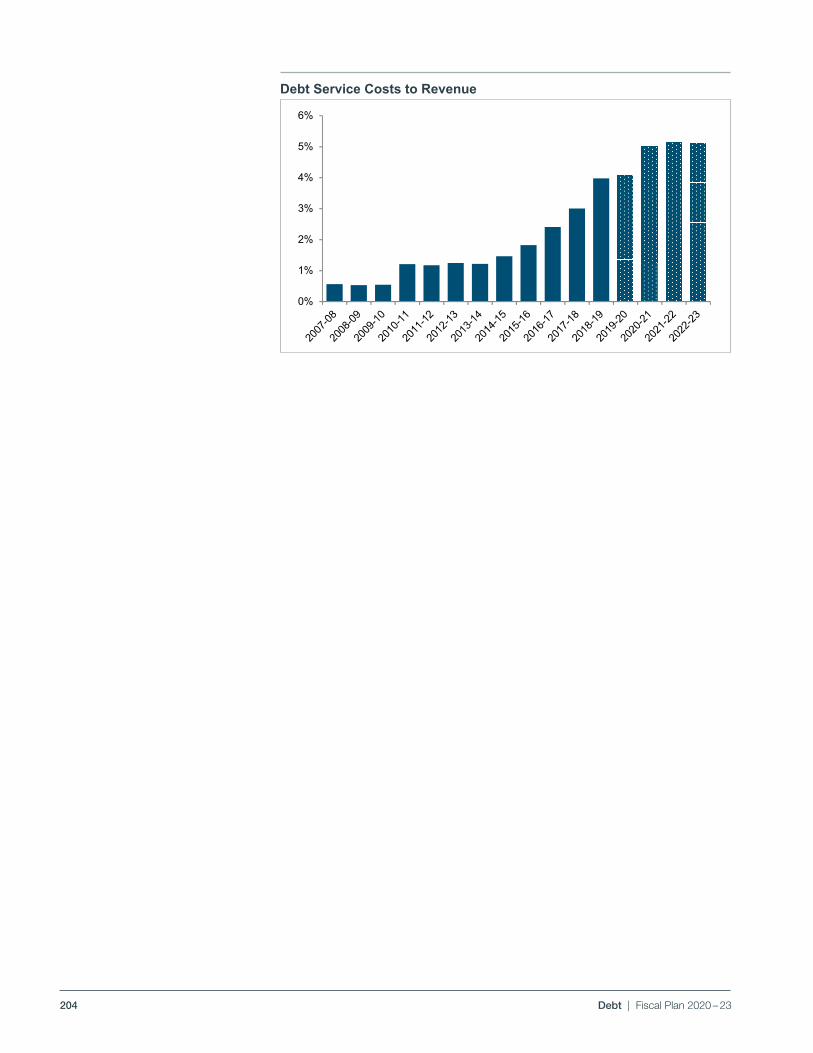
204 Debt | Fiscal Plan 2020 – 23
Budget 2020Debt Reduction
PDF Name: DR20_chrt_16.pdf
Debt Servicing Costs to Revenue
DR20_chrt_16.pdf
0%
1%
2%
3%
4%
5%
6%
Path: \\ter-fin-fs-01.fin.gov.ab.ca\Publications\TRM\Budget\2020\SourceDocuments\File: ChartsTab: Chart16 Last Updated: 2020-02-18 @ 12:47 PM
Debt Service Costs to Revenue
205
BUDGET 2020
GOVERNMENT OF ALBERTA | 2020 –23
Fiscal PlanTables
206 Tables | Fiscal Plan 2020 – 23
Table of ContentsSummary Statement of Operations . . . . . . . . . . . . . . . . . . . . . . . . . . . . . . . . . . . . . . . . . . . . . . . . . . . . . . . . . . 207
Summary Statement of Financial Position . . . . . . . . . . . . . . . . . . . . . . . . . . . . . . . . . . . . . . . . . . . . . . . . . . . . 207
Schedule 1: Consolidated Fiscal Summary . . . . . . . . . . . . . . . . . . . . . . . . . . . . . . . . . . . . . . . . . . . . . . . . . . . . 208
Schedule 2: Statement of Financial Position . . . . . . . . . . . . . . . . . . . . . . . . . . . . . . . . . . . . . . . . . . . . . . . . . . . 209
Schedule 3: Capital Assets . . . . . . . . . . . . . . . . . . . . . . . . . . . . . . . . . . . . . . . . . . . . . . . . . . . . . . . . . . . . . . . . 209
Schedule 4: Statement of Operations . . . . . . . . . . . . . . . . . . . . . . . . . . . . . . . . . . . . . . . . . . . . . . . . . . . . . . . . 210
Schedule 5: Revenue . . . . . . . . . . . . . . . . . . . . . . . . . . . . . . . . . . . . . . . . . . . . . . . . . . . . . . . . . . . . . . . . . . . . . 211
Schedule 6: Operating Expense . . . . . . . . . . . . . . . . . . . . . . . . . . . . . . . . . . . . . . . . . . . . . . . . . . . . . . . . . . . . 212
Schedule 7: Debt Servicing Costs . . . . . . . . . . . . . . . . . . . . . . . . . . . . . . . . . . . . . . . . . . . . . . . . . . . . . . . . . . 212
Schedule 8: Capital Amortization . . . . . . . . . . . . . . . . . . . . . . . . . . . . . . . . . . . . . . . . . . . . . . . . . . . . . . . . . . . 213
Schedule 9: Inventory Consumption . . . . . . . . . . . . . . . . . . . . . . . . . . . . . . . . . . . . . . . . . . . . . . . . . . . . . . . . 213
Schedule 10: Inventory Acquisition . . . . . . . . . . . . . . . . . . . . . . . . . . . . . . . . . . . . . . . . . . . . . . . . . . . . . . . . . 213
Schedule 11: Contingency and Disaster and Emergency Assistance . . . . . . . . . . . . . . . . . . . . . . . . . . . . . . . . . 214
Schedule 12: Borrowing Requirements . . . . . . . . . . . . . . . . . . . . . . . . . . . . . . . . . . . . . . . . . . . . . . . . . . . . . . 214
Schedule 13: Borrowing Sources . . . . . . . . . . . . . . . . . . . . . . . . . . . . . . . . . . . . . . . . . . . . . . . . . . . . . . . . . . . . 214
Schedule 14: Pension Liabilities . . . . . . . . . . . . . . . . . . . . . . . . . . . . . . . . . . . . . . . . . . . . . . . . . . . . . . . . . . . . 214
Schedule 15: Cash Adjustments . . . . . . . . . . . . . . . . . . . . . . . . . . . . . . . . . . . . . . . . . . . . . . . . . . . . . . . . . . . . 215
Schedule 16: Capital Plan . . . . . . . . . . . . . . . . . . . . . . . . . . . . . . . . . . . . . . . . . . . . . . . . . . . . . . . . . . . . . . . . . 216
Schedule 17: Capital Grants . . . . . . . . . . . . . . . . . . . . . . . . . . . . . . . . . . . . . . . . . . . . . . . . . . . . . . . . . . . . . . . 216
Schedule 18: Capital Investment . . . . . . . . . . . . . . . . . . . . . . . . . . . . . . . . . . . . . . . . . . . . . . . . . . . . . . . . . . . 217
Schedule 19: Capital Plan Liability / Fiscal Plan Borrowing Principal Repayments . . . . . . . . . . . . . . . . . . . . . . 217
Schedule 20: Capital Plan Funding Sources . . . . . . . . . . . . . . . . . . . . . . . . . . . . . . . . . . . . . . . . . . . . . . . . . . . 217
Schedule 21: Full-Time Equivalents . . . . . . . . . . . . . . . . . . . . . . . . . . . . . . . . . . . . . . . . . . . . . . . . . . . . . . . . . 218
Schedule 22: Changes to Fees . . . . . . . . . . . . . . . . . . . . . . . . . . . . . . . . . . . . . . . . . . . . . . . . . . . . . . . . . . . . . . 219
Schedule 23: Expense by Object . . . . . . . . . . . . . . . . . . . . . . . . . . . . . . . . . . . . . . . . . . . . . . . . . . . . . . . . . . . . 220
Schedule 24: Expense by Function . . . . . . . . . . . . . . . . . . . . . . . . . . . . . . . . . . . . . . . . . . . . . . . . . . . . . . . . . . 221
Schedule 25: Historical Fiscal Summary, 2008–09 to 2022–23 . . . . . . . . . . . . . . . . . . . . . . . . . . . . . . . . . . . . 222
Note: Amounts presented in tables may not add to totals due to rounding.
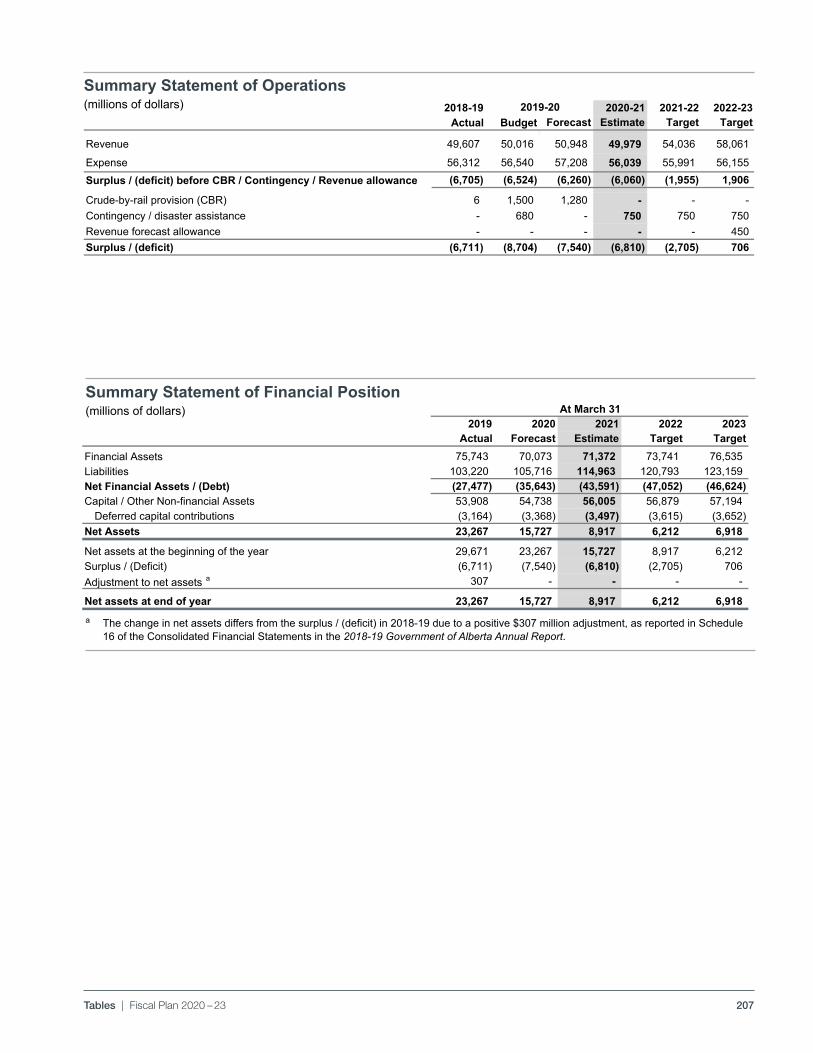
207Tables | Fiscal Plan 2020 – 23
Summary Statement of Operations(millions of dollars)
Summary Statement of Financial Position(millions of dollars)
pdf name: B19_FP_TBS_ssoo.pdf Budget 2019 Fiscal Plan Table Section
Summary Statement of Operations(millions of dollars)
2018-19 2020-21 2021-22 2022-23Actual Budget Forecast Estimate Target Target
Revenue 49,607 50,016 50,948 49,979 54,036 58,061
Expense 56,312 56,540 57,208 56,039 55,991 56,155 Surplus / (deficit) before CBR / Contingency / Revenue allowance (6,705) (6,524) (6,260) (6,060) (1,955) 1,906
Crude-by-rail provision (CBR) 6 1,500 1,280 - - - Contingency / disaster assistance - 680 - 750 750 750 Revenue forecast allowance - - - - - 450 Surplus / (deficit) (6,711) (8,704) (7,540) (6,810) (2,705) 706
2019-20
M:\MinShare\PublnsProd\CorpFin\OBM.PUBLNS-2020-21\B20_Fiscal-Plan_vol\10_FiscalPlan_TABLES_B20\source_docs_Tables\X-BUDGET-2020_TABLESPRINT.xlsx/Summary p1 st ops 2/16/2020/8:26 PM
pdf name: B19_FP_TBS_ssofp Budget 2019 Fiscal Plan Tables Section
Summary Statement of Financial Position(millions of dollars)
2019 2020 2021 2022 2023Actual Forecast Estimate Target Target
Financial Assets 75,743 70,073 71,372 73,741 76,535 Liabilities 103,220 105,716 114,963 120,793 123,159 Net Financial Assets / (Debt) (27,477) (35,643) (43,591) (47,052) (46,624) Capital / Other Non-financial Assets 53,908 54,738 56,005 56,879 57,194
Deferred capital contributions (3,164) (3,368) (3,497) (3,615) (3,652) Net Assets 23,267 15,727 8,917 6,212 6,918
Net assets at the beginning of the year 29,671 23,267 15,727 8,917 6,212 Surplus / (Deficit) (6,711) (7,540) (6,810) (2,705) 706 Adjustment to net assets a 307 - - - -
Net assets at end of year 23,267 15,727 8,917 6,212 6,918
At March 31
M:\MinShare\PublnsProd\CorpFin\OBM.PUBLNS-2020-21\B20_Fiscal-Plan_vol\10_FiscalPlan_TABLES_B20\source_docs_Tables\X-BUDGET-2020_TABLESPRINT.xlsx/Summary p1 st finp
2/18/2020/2:32 PM
a The change in net assets differs from the surplus / (deficit) in 2018-19 due to a positive $307 million adjustment, as reported in Schedule 16 of the Consolidated Financial Statements in the 2018-19 Government of Alberta Annual Report.
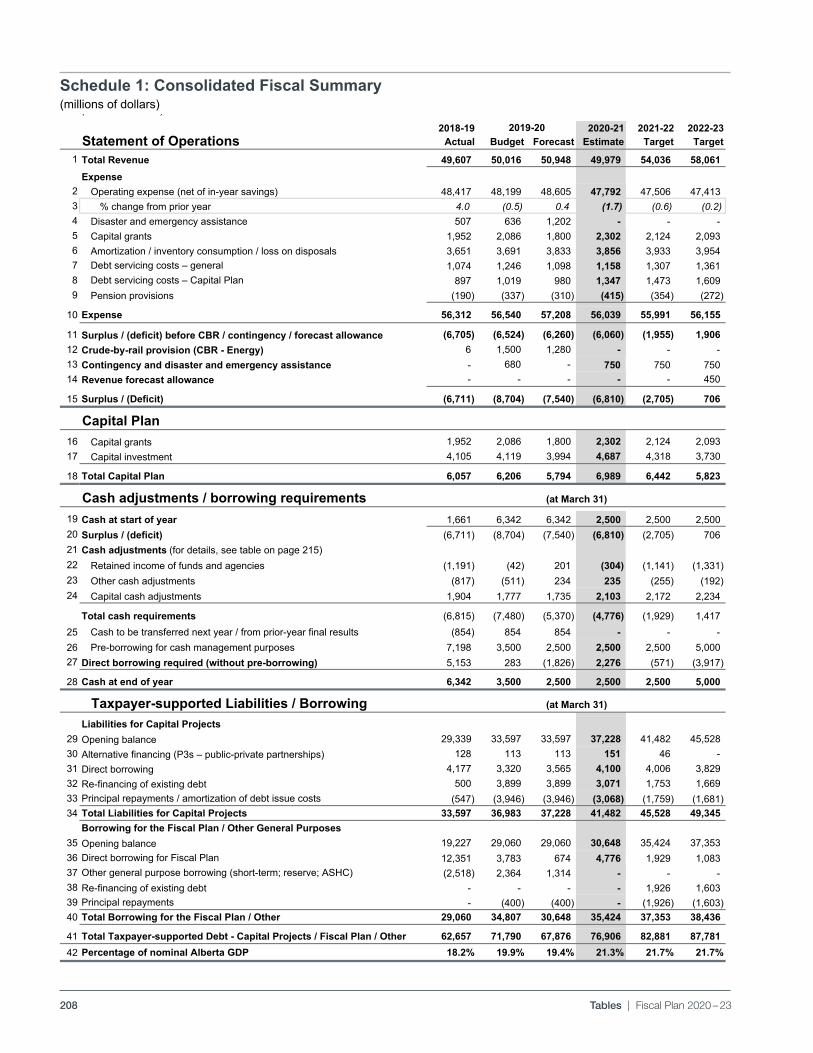
208 Tables | Fiscal Plan 2020 – 23
B19_FP_TBS_03_cfs.pdf Budget 2019 / Fiscal Plan Tables
Consolidated Fiscal Summary(millions of dollars)
2018-19 2020-21 2021-22 2022-23Actual Budget Forecast Estimate Target Target
1 Total Revenue 49,607 50,016 50,948 49,979 54,036 58,061 Expense
2 Operating expense (net of in-year savings) 48,417 48,199 48,605 47,792 47,506 47,413 3 % change from prior year 4.0 (0.5) 0.4 (1.7) (0.6) (0.2)4 Disaster and emergency assistance 507 636 1,202 - - - 5 Capital grants 1,952 2,086 1,800 2,302 2,124 2,093 6 Amortization / inventory consumption / loss on disposals 3,651 3,691 3,833 3,856 3,933 3,954 7 Debt servicing costs – general 1,074 1,246 1,098 1,158 1,307 1,361 8 Debt servicing costs – Capital Plan 897 1,019 980 1,347 1,473 1,609 9 Pension provisions (190) (337) (310) (415) (354) (272)
10 Expense 56,312 56,540 57,208 56,039 55,991 56,155
11 Surplus / (deficit) before CBR / contingency / forecast allowance (6,705) (6,524) (6,260) (6,060) (1,955) 1,906 12 Crude-by-rail provision (CBR - Energy) 6 1,500 1,280 - - - 13 Contingency and disaster and emergency assistance - 680 - 750 750 750 14 Revenue forecast allowance - - - - - 450
15 Surplus / (Deficit) (6,711) (8,704) (7,540) (6,810) (2,705) 706
Capital Plan16 Capital grants 1,952 2,086 1,800 2,302 2,124 2,093 17 Capital investment 4,105 4,119 3,994 4,687 4,318 3,730
18 Total Capital Plan 6,057 6,206 5,794 6,989 6,442 5,823
Cash adjustments / borrowing requirements19 Cash at start of year 1,661 6,342 6,342 2,500 2,500 2,500 20 Surplus / (deficit) (6,711) (8,704) (7,540) (6,810) (2,705) 706 21 Cash adjustments (for details, see table on page 215)22 Retained income of funds and agencies (1,191) (42) 201 (304) (1,141) (1,331) 23 Other cash adjustments (817) (511) 234 235 (255) (192) 24 Capital cash adjustments 1,904 1,777 1,735 2,103 2,172 2,234
Total cash requirements (6,815) (7,480) (5,370) (4,776) (1,929) 1,417 25 Cash to be transferred next year / from prior-year final results (854) 854 854 - - - 26 Pre-borrowing for cash management purposes 7,198 3,500 2,500 2,500 2,500 5,000 27 Direct borrowing required (without pre-borrowing) 5,153 283 (1,826) 2,276 (571) (3,917)
28 Cash at end of year 6,342 3,500 2,500 2,500 2,500 5,000
Taxpayer-supported Liabilities / BorrowingLiabilities for Capital Projects
29 Opening balance 29,339 33,597 33,597 37,228 41,482 45,528 30 Alternative financing (P3s – public-private partnerships) 128 113 113 151 46 - 31 Direct borrowing 4,177 3,320 3,565 4,100 4,006 3,829 32 Re-financing of existing debt 500 3,899 3,899 3,071 1,753 1,669 33 Principal repayments / amortization of debt issue costs (547) (3,946) (3,946) (3,068) (1,759) (1,681) 34 Total Liabilities for Capital Projects 33,597 36,983 37,228 41,482 45,528 49,345
Borrowing for the Fiscal Plan / Other General Purposes35 Opening balance 19,227 29,060 29,060 30,648 35,424 37,353 36 Direct borrowing for Fiscal Plan 12,351 3,783 674 4,776 1,929 1,083 37 Other general purpose borrowing (short-term; reserve; ASHC) (2,518) 2,364 1,314 - - - 38 Re-financing of existing debt - - - - 1,926 1,603 39 Principal repayments - (400) (400) - (1,926) (1,603) 40 Total Borrowing for the Fiscal Plan / Other 29,060 34,807 30,648 35,424 37,353 38,436
41 Total Taxpayer-supported Debt - Capital Projects / Fiscal Plan / Other 62,657 71,790 67,876 76,906 82,881 87,781 42 Percentage of nominal Alberta GDP 18.2% 19.9% 19.4% 21.3% 21.7% 21.7%
Statement of Operations
(at March 31)
(at March 31)
2019-20
M:\MinShare\PublnsProd\CorpFin\OBM.PUBLNS-2020-21\B20_Fiscal-Plan_vol\10_FiscalPlan_TABLES_B20\source_docs_Tables\X-BUDGET-2020_TABLESPRINT.xlsx/Cons Fisc Sum p3 2/18/2020 /3:19 PM
Schedule 1: Consolidated Fiscal Summary(millions of dollars)
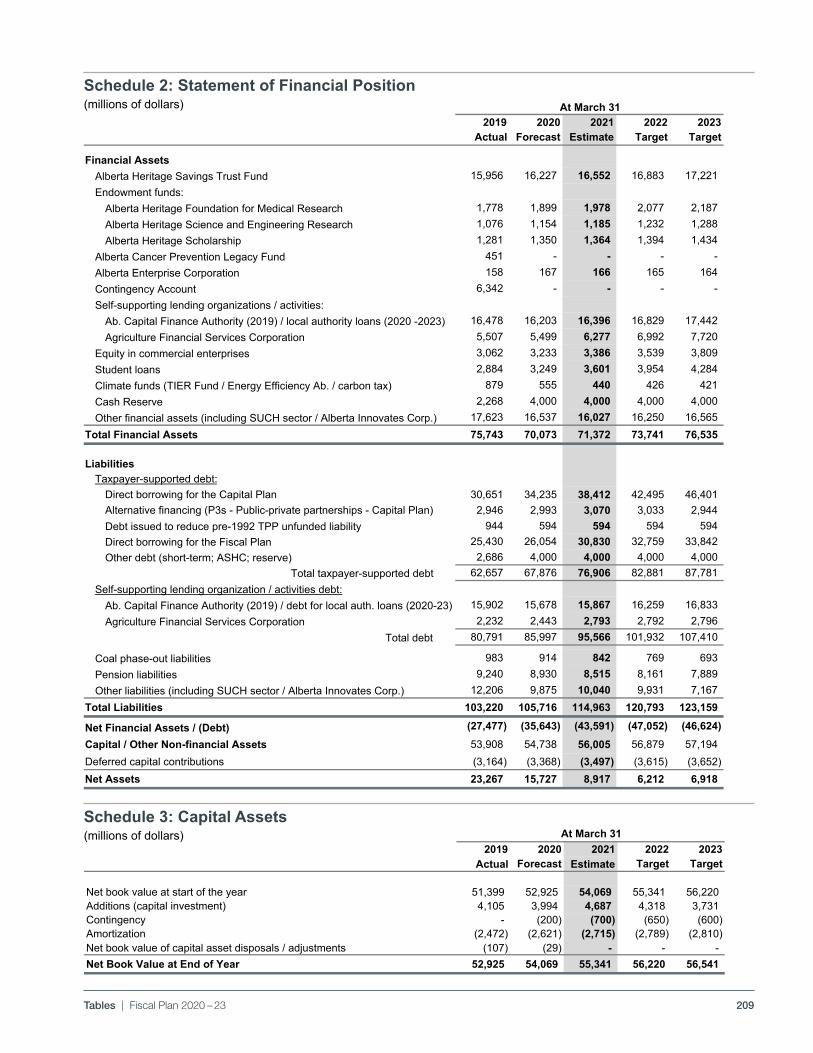
209Tables | Fiscal Plan 2020 – 23
pdf named: B19_FP_TBS_05_bsd.pdf Budget 2019Fiscal Plan Tables
Balance Sheet Details(millions of dollars)
2019 2020 2021 2022 2023Actual Forecast Estimate Target Target
Financial AssetsAlberta Heritage Savings Trust Fund 15,956 16,227 16,552 16,883 17,221 Endowment funds:
Alberta Heritage Foundation for Medical Research 1,778 1,899 1,978 2,077 2,187 Alberta Heritage Science and Engineering Research 1,076 1,154 1,185 1,232 1,288 Alberta Heritage Scholarship 1,281 1,350 1,364 1,394 1,434
Alberta Cancer Prevention Legacy Fund 451 - - - - Alberta Enterprise Corporation 158 167 166 165 164 Contingency Account 6,342 - - - - Self-supporting lending organizations / activities:
Ab. Capital Finance Authority (2019) / local authority loans (2020 -2023) 16,478 16,203 16,396 16,829 17,442 Agriculture Financial Services Corporation 5,507 5,499 6,277 6,992 7,720
Equity in commercial enterprises 3,062 3,233 3,386 3,539 3,809 Student loans 2,884 3,249 3,601 3,954 4,284 Climate funds (TIER Fund / Energy Efficiency Ab. / carbon tax) 879 555 440 426 421 Cash Reserve 2,268 4,000 4,000 4,000 4,000 Other financial assets (including SUCH sector / Alberta Innovates Corp.) 17,623 16,537 16,027 16,250 16,565
Total Financial Assets 75,743 70,073 71,372 73,741 76,535
LiabilitiesTaxpayer-supported debt:
Direct borrowing for the Capital Plan 30,651 34,235 38,412 42,495 46,401 Alternative financing (P3s - Public-private partnerships - Capital Plan) 2,946 2,993 3,070 3,033 2,944 Debt issued to reduce pre-1992 TPP unfunded liability 944 594 594 594 594 Direct borrowing for the Fiscal Plan 25,430 26,054 30,830 32,759 33,842 Other debt (short-term; ASHC; reserve) 2,686 4,000 4,000 4,000 4,000
Total taxpayer-supported debt 62,657 67,876 76,906 82,881 87,781 Self-supporting lending organization / activities debt:
Ab. Capital Finance Authority (2019) / debt for local auth. loans (2020-23) 15,902 15,678 15,867 16,259 16,833 Agriculture Financial Services Corporation 2,232 2,443 2,793 2,792 2,796
Total debt 80,791 85,997 95,566 101,932 107,410
Coal phase-out liabilities 983 914 842 769 693 Pension liabilities 9,240 8,930 8,515 8,161 7,889 Other liabilities (including SUCH sector / Alberta Innovates Corp.) 12,206 9,875 10,040 9,931 7,167
Total Liabilities 103,220 105,716 114,963 120,793 123,159
Net Financial Assets / (Debt) (27,477) (35,643) (43,591) (47,052) (46,624) Capital / Other Non-financial Assets 53,908 54,738 56,005 56,879 57,194 Deferred capital contributions (3,164) (3,368) (3,497) (3,615) (3,652) Net Assets 23,267 15,727 8,917 6,212 6,918
pdf named: B19_FP_TBS_05_bsd.pdf
At March 31
M:\MinShare\PublnsProd\CorpFin\OBM.PUBLNS-2020-21\B20_Fiscal-Plan_vol\10_FiscalPlan_TABLES_B20\source_docs_Tables\X-BUDGET-2020_TABLESPRINT.xlsx/Balance Sheet p4 2/18/2020/3:20 PM
Schedule 2: Statement of Financial Position(millions of dollars)
Schedule 3: Capital Assets(millions of dollars)
pdf named: B19_FP_TBS_cap-assets.pdf Budget 2019Fiscal Plan Tables
Capital Assets(millions of dollars)
2019 2020 2021 2022 2023Actual Forecast Estimate Target Target
Net book value at start of the year 51,399 52,925 54,069 55,341 56,220 Additions (capital investment) 4,105 3,994 4,687 4,318 3,731 Contingency - (200) (700) (650) (600) Amortization (2,472) (2,621) (2,715) (2,789) (2,810) Net book value of capital asset disposals / adjustments (107) (29) - - - Net Book Value at End of Year 52,925 54,069 55,341 56,220 56,541
pdf named: B19_FP_TBS_cap-assets.pdf
At March 31
M:\MinShare\PublnsProd\CorpFin\OBM.PUBLNS-2020-21\B20_Fiscal-Plan_vol\10_FiscalPlan_TABLES_B20\source_docs_Tables\X-BUDGET-2020_TABLESPRINT.xlsx/Capital assets p4 2/15/2020/2:43 AM
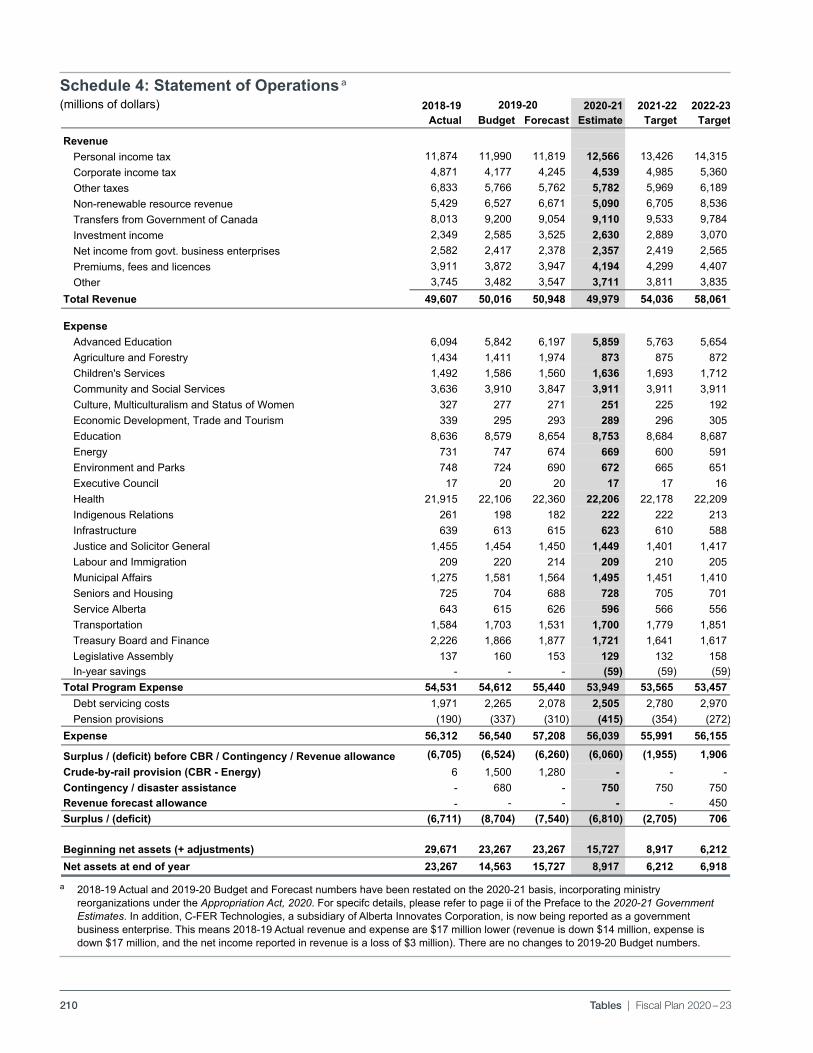
210 Tables | Fiscal Plan 2020 – 23
pdf named: B19_FP_TBS_02-soo.pdf Budget 2019Fiscal Plan Tables
Statement of Operations pdf name(millions of dollars)
2018-19 2020-21 2021-22 2022-23Actual Budget Forecast Estimate Target Target
RevenuePersonal income tax 11,874 11,990 11,819 12,566 13,426 14,315 Corporate income tax 4,871 4,177 4,245 4,539 4,985 5,360 Other taxes 6,833 5,766 5,762 5,782 5,969 6,189 Non-renewable resource revenue 5,429 6,527 6,671 5,090 6,705 8,536 Transfers from Government of Canada 8,013 9,200 9,054 9,110 9,533 9,784 Investment income 2,349 2,585 3,525 2,630 2,889 3,070 Net income from govt. business enterprises 2,582 2,417 2,378 2,357 2,419 2,565 Premiums, fees and licences 3,911 3,872 3,947 4,194 4,299 4,407 Other 3,745 3,482 3,547 3,711 3,811 3,835
Total Revenue 49,607 50,016 50,948 49,979 54,036 58,061
ExpenseAdvanced Education 6,094 5,842 6,197 5,859 5,763 5,654 Agriculture and Forestry 1,434 1,411 1,974 873 875 872 Children's Services 1,492 1,586 1,560 1,636 1,693 1,712 Community and Social Services 3,636 3,910 3,847 3,911 3,911 3,911 Culture, Multiculturalism and Status of Women 327 277 271 251 225 192 Economic Development, Trade and Tourism 339 295 293 289 296 305 Education 8,636 8,579 8,654 8,753 8,684 8,687 Energy 731 747 674 669 600 591 Environment and Parks 748 724 690 672 665 651 Executive Council 17 20 20 17 17 16 Health 21,915 22,106 22,360 22,206 22,178 22,209 Indigenous Relations 261 198 182 222 222 213 Infrastructure 639 613 615 623 610 588 Justice and Solicitor General 1,455 1,454 1,450 1,449 1,401 1,417 Labour and Immigration 209 220 214 209 210 205 Municipal Affairs 1,275 1,581 1,564 1,495 1,451 1,410 Seniors and Housing 725 704 688 728 705 701 Service Alberta 643 615 626 596 566 556 Transportation 1,584 1,703 1,531 1,700 1,779 1,851 Treasury Board and Finance 2,226 1,866 1,877 1,721 1,641 1,617 Legislative Assembly 137 160 153 129 132 158 In-year savings - - - (59) (59) (59)
Total Program Expense 54,531 54,612 55,440 53,949 53,565 53,457 Debt servicing costs 1,971 2,265 2,078 2,505 2,780 2,970 Pension provisions (190) (337) (310) (415) (354) (272)
Expense 56,312 56,540 57,208 56,039 55,991 56,155
Surplus / (deficit) before CBR / Contingency / Revenue allowance (6,705) (6,524) (6,260) (6,060) (1,955) 1,906 Crude-by-rail provision (CBR - Energy) 6 1,500 1,280 - - - Contingency / disaster assistance - 680 - 750 750 750 Revenue forecast allowance - - - - - 450 Surplus / (deficit) (6,711) (8,704) (7,540) (6,810) (2,705) 706
Beginning net assets (+ adjustments) 29,671 23,267 23,267 15,727 8,917 6,212 Net assets at end of year 23,267 14,563 15,727 8,917 6,212 6,918
2019-20
M:\MinShare\PublnsProd\CorpFin\OBM.PUBLNS-2020-21\B20_Fiscal-Plan_vol\10_FiscalPlan_TABLES_B20\source_docs_Tables\X-BUDGET-2020_TABLESPRINT.xlsx/St of Ops p2 2/18/2020 /3:19 PM
Schedule 4: Statement of Operations a(millions of dollars)
a 2018-19 Actual and 2019-20 Budget and Forecast numbers have been restated on the 2020-21 basis, incorporating ministry reorganizations under the Appropriation Act, 2020. For specifc details, please refer to page ii of the Preface to the 2020-21 Government Estimates. In addition, C-FER Technologies, a subsidiary of Alberta Innovates Corporation, is now being reported as a government business enterprise. This means 2018-19 Actual revenue and expense are $17 million lower (revenue is down $14 million, expense is down $17 million, and the net income reported in revenue is a loss of $3 million). There are no changes to 2019-20 Budget numbers.
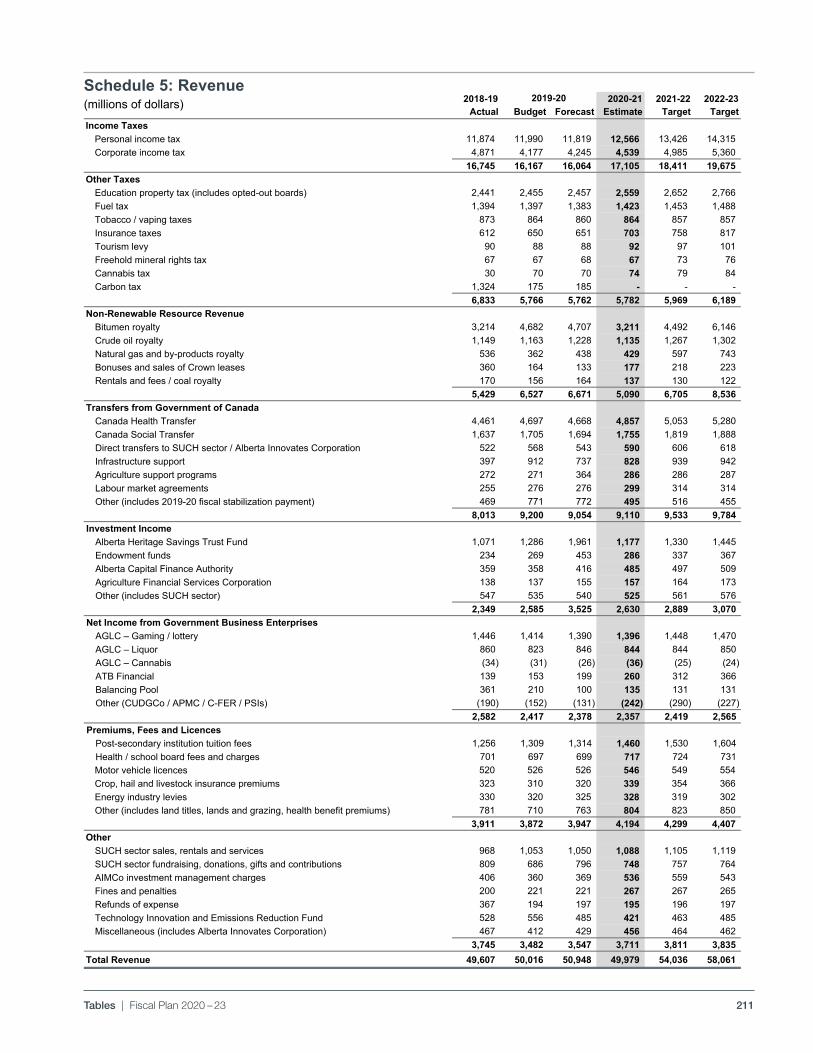
211Tables | Fiscal Plan 2020 – 23
pdf named: B19_FP_TBS_06_rev.pdf Budget 2019 /Fiscal Plan Tables
Revenue (millions of dollars)
2018-19 2020-21 2021-22 2022-23Actual Budget Forecast Estimate Target Target
Income TaxesPersonal income tax 11,874 11,990 11,819 12,566 13,426 14,315 Corporate income tax 4,871 4,177 4,245 4,539 4,985 5,360
16,745 16,167 16,064 17,105 18,411 19,675 Other Taxes
Education property tax (includes opted-out boards) 2,441 2,455 2,457 2,559 2,652 2,766 Fuel tax 1,394 1,397 1,383 1,423 1,453 1,488 Tobacco / vaping taxes 873 864 860 864 857 857 Insurance taxes 612 650 651 703 758 817 Tourism levy 90 88 88 92 97 101 Freehold mineral rights tax 67 67 68 67 73 76 Cannabis tax 30 70 70 74 79 84 Carbon tax 1,324 175 185 - - -
6,833 5,766 5,762 5,782 5,969 6,189 Non-Renewable Resource Revenue
Bitumen royalty 3,214 4,682 4,707 3,211 4,492 6,146 Crude oil royalty 1,149 1,163 1,228 1,135 1,267 1,302 Natural gas and by-products royalty 536 362 438 429 597 743 Bonuses and sales of Crown leases 360 164 133 177 218 223 Rentals and fees / coal royalty 170 156 164 137 130 122
5,429 6,527 6,671 5,090 6,705 8,536 Transfers from Government of Canada
Canada Health Transfer 4,461 4,697 4,668 4,857 5,053 5,280 Canada Social Transfer 1,637 1,705 1,694 1,755 1,819 1,888 Direct transfers to SUCH sector / Alberta Innovates Corporation 522 568 543 590 606 618 Infrastructure support 397 912 737 828 939 942 Agriculture support programs 272 271 364 286 286 287 Labour market agreements 255 276 276 299 314 314 Other (includes 2019-20 fiscal stabilization payment) 469 771 772 495 516 455
8,013 9,200 9,054 9,110 9,533 9,784 Investment Income
Alberta Heritage Savings Trust Fund 1,071 1,286 1,961 1,177 1,330 1,445 Endowment funds 234 269 453 286 337 367 Alberta Capital Finance Authority 359 358 416 485 497 509 Agriculture Financial Services Corporation 138 137 155 157 164 173 Other (includes SUCH sector) 547 535 540 525 561 576
2,349 2,585 3,525 2,630 2,889 3,070 Net Income from Government Business Enterprises
AGLC – Gaming / lottery 1,446 1,414 1,390 1,396 1,448 1,470 AGLC – Liquor 860 823 846 844 844 850 AGLC – Cannabis (34) (31) (26) (36) (25) (24) ATB Financial 139 153 199 260 312 366 Balancing Pool 361 210 100 135 131 131 Other (CUDGCo / APMC / C-FER / PSIs) (190) (152) (131) (242) (290) (227)
2,582 2,417 2,378 2,357 2,419 2,565 Premiums, Fees and Licences
Post-secondary institution tuition fees 1,256 1,309 1,314 1,460 1,530 1,604 Health / school board fees and charges 701 697 699 717 724 731 Motor vehicle licences 520 526 526 546 549 554 Crop, hail and livestock insurance premiums 323 310 320 339 354 366 Energy industry levies 330 320 325 328 319 302 Other (includes land titles, lands and grazing, health benefit premiums) 781 710 763 804 823 850
3,911 3,872 3,947 4,194 4,299 4,407 Other
SUCH sector sales, rentals and services 968 1,053 1,050 1,088 1,105 1,119 SUCH sector fundraising, donations, gifts and contributions 809 686 796 748 757 764 AIMCo investment management charges 406 360 369 536 559 543 Fines and penalties 200 221 221 267 267 265 Refunds of expense 367 194 197 195 196 197 Technology Innovation and Emissions Reduction Fund 528 556 485 421 463 485 Miscellaneous (includes Alberta Innovates Corporation) 467 412 429 456 464 462
3,745 3,482 3,547 3,711 3,811 3,835 Total Revenue 49,607 50,016 50,948 49,979 54,036 58,061
2019-20
M:\MinShare\PublnsProd\CorpFin\OBM.PUBLNS-2020-21\B20_Fiscal-Plan_vol\10_FiscalPlan_TABLES_B20\source_docs_Tables\X-BUDGET-2020_TABLESPRINT.xlsx/Revenue p6 2/16/2020/8:33 PM
Schedule 5: Revenue(millions of dollars)
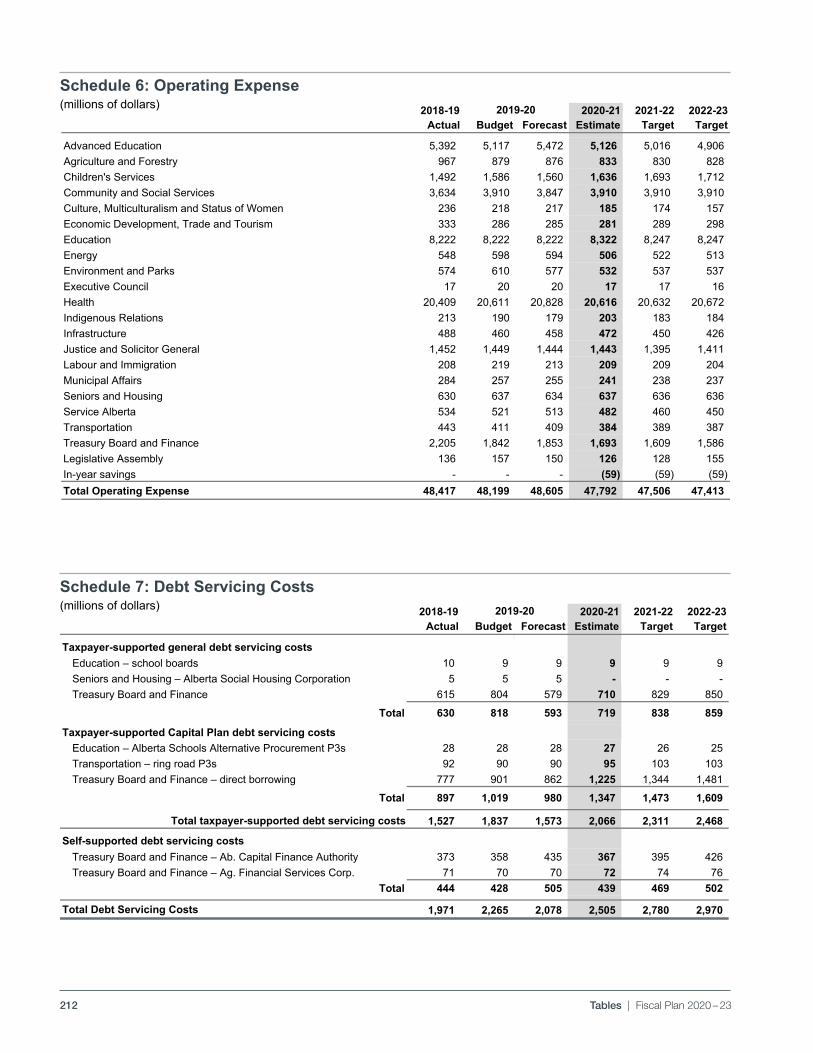
212 Tables | Fiscal Plan 2020 – 23
Schedule 7: Debt Servicing Costs (millions of dollars)
Pdf named: B19_FP_TBS_07_dsc.pdf Budget 2019Fiscal Plan Tables
Debt Servicing Costs (millions of dollars)
2018-19 2020-21 2021-22 2022-23Actual Budget Forecast Estimate Target Target
Taxpayer-supported general debt servicing costsEducation – school boards 10 9 9 9 9 9 Seniors and Housing – Alberta Social Housing Corporation 5 5 5 - - - Treasury Board and Finance 615 804 579 710 829 850
Total 630 818 593 719 838 859
Taxpayer-supported Capital Plan debt servicing costsEducation – Alberta Schools Alternative Procurement P3s 28 28 28 27 26 25 Transportation – ring road P3s 92 90 90 95 103 103 Treasury Board and Finance – direct borrowing 777 901 862 1,225 1,344 1,481
Total 897 1,019 980 1,347 1,473 1,609
Total taxpayer-supported debt servicing costs 1,527 1,837 1,573 2,066 2,311 2,468
Self-supported debt servicing costsTreasury Board and Finance – Ab. Capital Finance Authority 373 358 435 367 395 426 Treasury Board and Finance – Ag. Financial Services Corp. 71 70 70 72 74 76
Total 444 428 505 439 469 502
Total Debt Servicing Costs 1,971 2,265 2,078 2,505 2,780 2,970
2019-20
M:\MinShare\PublnsProd\CorpFin\OBM.PUBLNS-2020-21\B20_Fiscal-Plan_vol\10_FiscalPlan_TABLES_B20\source_docs_Tables\X-BUDGET-2020_TABLESPRINT.xlsx/Debt Serv Costs p7 2/15/2020/1:44 AM
pdf named: B19_FP_TBS_08_oe.pdf Budget 2019Fiscal Plan Tables
Operating Expense(millions of dollars)
2018-19 2020-21 2021-22 2022-23Actual Budget Forecast Estimate Target Target
Advanced Education 5,392 5,117 5,472 5,126 5,016 4,906 Agriculture and Forestry 967 879 876 833 830 828 Children's Services 1,492 1,586 1,560 1,636 1,693 1,712 Community and Social Services 3,634 3,910 3,847 3,910 3,910 3,910 Culture, Multiculturalism and Status of Women 236 218 217 185 174 157 Economic Development, Trade and Tourism 333 286 285 281 289 298 Education 8,222 8,222 8,222 8,322 8,247 8,247 Energy 548 598 594 506 522 513 Environment and Parks 574 610 577 532 537 537 Executive Council 17 20 20 17 17 16 Health 20,409 20,611 20,828 20,616 20,632 20,672 Indigenous Relations 213 190 179 203 183 184 Infrastructure 488 460 458 472 450 426 Justice and Solicitor General 1,452 1,449 1,444 1,443 1,395 1,411 Labour and Immigration 208 219 213 209 209 204 Municipal Affairs 284 257 255 241 238 237 Seniors and Housing 630 637 634 637 636 636 Service Alberta 534 521 513 482 460 450 Transportation 443 411 409 384 389 387 Treasury Board and Finance 2,205 1,842 1,853 1,693 1,609 1,586 Legislative Assembly 136 157 150 126 128 155 In-year savings - - - (59) (59) (59) Total Operating Expense 48,417 48,199 48,605 47,792 47,506 47,413
2019-20
M:\MinShare\PublnsProd\CorpFin\OBM.PUBLNS-2020-21\B20_Fiscal-Plan_vol\10_FiscalPlan_TABLES_B20\source_docs_Tables\X-BUDGET-2020_TABLESPRINT.xlsx/Oper by Min p8 2/16/2020/8:34 PM
Schedule 6: Operating Expense(millions of dollars)
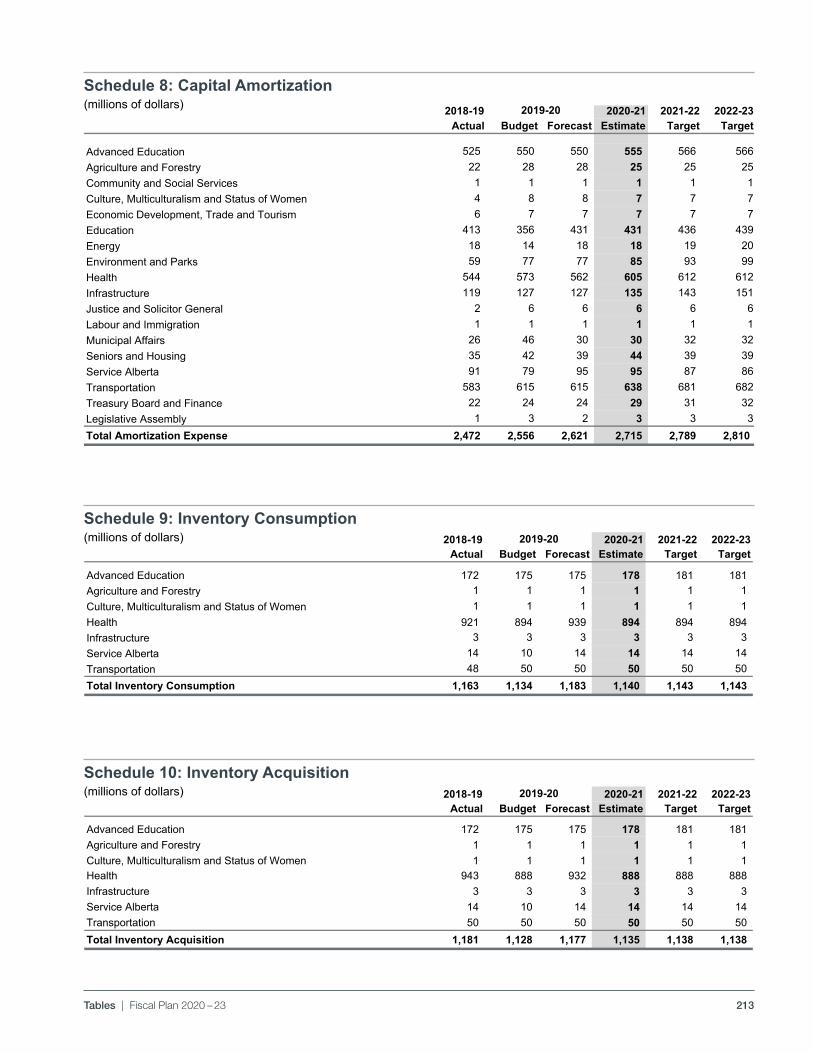
213Tables | Fiscal Plan 2020 – 23
pdf named: B19_FP_TBS_09_ca.pdf Budget 2019Fiscal Plan Tables
Capital Amortization(millions of dollars)
2018-19 2020-21 2021-22 2022-23Actual Budget Forecast Estimate Target Target
Advanced Education 525 550 550 555 566 566Agriculture and Forestry 22 28 28 25 25 25Community and Social Services 1 1 1 1 1 1Culture, Multiculturalism and Status of Women 4 8 8 7 7 7Economic Development, Trade and Tourism 6 7 7 7 7 7Education 413 356 431 431 436 439Energy 18 14 18 18 19 20Environment and Parks 59 77 77 85 93 99Health 544 573 562 605 612 612Infrastructure 119 127 127 135 143 151Justice and Solicitor General 2 6 6 6 6 6Labour and Immigration 1 1 1 1 1 1Municipal Affairs 26 46 30 30 32 32Seniors and Housing 35 42 39 44 39 39Service Alberta 91 79 95 95 87 86Transportation 583 615 615 638 681 682Treasury Board and Finance 22 24 24 29 31 32Legislative Assembly 1 3 2 3 3 3Total Amortization Expense 2,472 2,556 2,621 2,715 2,789 2,810
2019-20
M:\MinShare\PublnsProd\CorpFin\OBM.PUBLNS-2020-21\B20_Fiscal-Plan_vol\10_FiscalPlan_TABLES_B20\source_docs_Tables\X-BUDGET-2020_TABLESPRINT.xlsx/Cap Amort p9 2/18/2020/3:21 PM
Schedule 8: Capital Amortization(millions of dollars)
pdf named: B19_FP_TBS_09_ic.pdf Budget 2019Fiscal Plan Tables
Inventory Consumption (millions of dollars)
2018-19 2020-21 2021-22 2022-23Actual Budget Forecast Estimate Target Target
Advanced Education 172 175 175 178 181 181 Agriculture and Forestry 1 1 1 1 1 1 Culture, Multiculturalism and Status of Women 1 1 1 1 1 1 Health 921 894 939 894 894 894 Infrastructure 3 3 3 3 3 3 Service Alberta 14 10 14 14 14 14 Transportation 48 50 50 50 50 50 Total Inventory Consumption 1,163 1,134 1,183 1,140 1,143 1,143
2019-20
M:\MinShare\PublnsProd\CorpFin\OBM.PUBLNS-2020-21\B20_Fiscal-Plan_vol\10_FiscalPlan_TABLES_B20\source_docs_Tables\X-BUDGET-2020_TABLESPRINT.xlsx/Inv Consump p9 2/15/2020/1:45 AM
Schedule 9: Inventory Consumption
(millions of dollars)
Schedule 10: Inventory Acquisition(millions of dollars)
pdf named: B19_FP_TBS_14_ia.pdf Budget 2019Fiscal Plan Tables
Inventory Acquisition(millions of dollars)
2018-19 2020-21 2021-22 2022-23Actual Budget Forecast Estimate Target Target
Advanced Education 172 175 175 178 181 181 Agriculture and Forestry 1 1 1 1 1 1 Culture, Multiculturalism and Status of Women 1 1 1 1 1 1 Health 943 888 932 888 888 888 Infrastructure 3 3 3 3 3 3 Service Alberta 14 10 14 14 14 14 Transportation 50 50 50 50 50 50 Total Inventory Acquisition 1,181 1,128 1,177 1,135 1,138 1,138
2019-20
M:\MinShare\PublnsProd\CorpFin\OBM.PUBLNS-2020-21\B20_Fiscal-Plan_vol\10_FiscalPlan_TABLES_B20\source_docs_Tables\X-BUDGET-2020_TABLESPRINT.xlsx/Inven. Acquisition p14 2/18/2020/3:21 PM
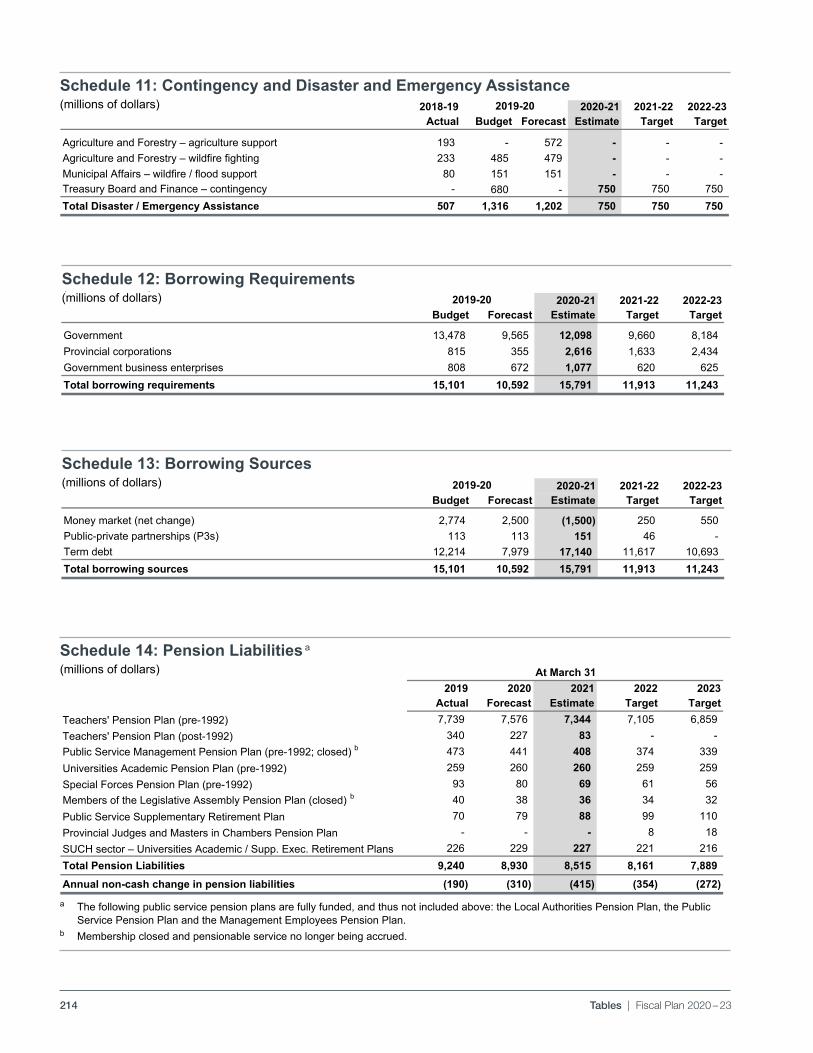
214 Tables | Fiscal Plan 2020 – 23
Schedule 14: Pension Liabilities a(millions of dollars)
pdf named: B19_FP_TBS_15_pl.pdf Budget 2019Fiscal Plan Tables
Pension Liabilities a
(millions of dollars)
2019 2020 2021 2022 2023Actual Forecast Estimate Target Target
Teachers' Pension Plan (pre-1992) 7,739 7,576 7,344 7,105 6,859 Teachers' Pension Plan (post-1992) 340 227 83 - - Public Service Management Pension Plan (pre-1992; closed) b 473 441 408 374 339 Universities Academic Pension Plan (pre-1992) 259 260 260 259 259 Special Forces Pension Plan (pre-1992) 93 80 69 61 56 Members of the Legislative Assembly Pension Plan (closed) b 40 38 36 34 32 Public Service Supplementary Retirement Plan 70 79 88 99 110 Provincial Judges and Masters in Chambers Pension Plan - - - 8 18 SUCH sector – Universities Academic / Supp. Exec. Retirement Plans 226 229 227 221 216 Total Pension Liabilities 9,240 8,930 8,515 8,161 7,889 Annual non-cash change in pension liabilities (190) (310) (415) (354) (272)
At March 31
M:\MinShare\PublnsProd\CorpFin\OBM.PUBLNS-2020-21\B20_Fiscal-Plan_vol\10_FiscalPlan_TABLES_B20\source_docs_Tables\X-BUDGET-2020_TABLESPRINT.xlsx/Pension Liab p15 2/18/2020/3:24 PM
a The following public service pension plans are fully funded, and thus not included above: the Local Authorities Pension Plan, the Public Service Pension Plan and the Management Employees Pension Plan.
b Membership closed and pensionable service no longer being accrued.
pdf named: B19_FP_TBS_08_dea.pdf Budget 2019Fiscal Plan Tables
Contingency / Disaster and Emergency Assistance(millions of dollars)
2018-19 2020-21 2021-22 2022-23Actual Budget Forecast Estimate Target Target
Agriculture and Forestry – agriculture support 193 - 572 - - - Agriculture and Forestry – wildfire fighting 233 485 479 - - - Municipal Affairs – wildfire / flood support 80 151 151 - - - Treasury Board and Finance – contingency - 680 - 750 750 750 Total Disaster / Emergency Assistance 507 1,316 1,202 750 750 750
2019-20
M:\MinShare\PublnsProd\CorpFin\OBM.PUBLNS-2020-21\B20_Fiscal-Plan_vol\10_FiscalPlan_TABLES_B20\source_docs_Tables\X-BUDGET-2020_TABLESPRINT.xlsx/Disaster-emerg p8 2/15/2020/1:44 AM
Schedule 11: Contingency and Disaster and Emergency Assistance(millions of dollars)
pdf named: B19_FP_TBS_15_br.pdf Budget 2019Fiscal Plan Tables
Borrowing Requirements(millions of dollars)
2020-21 2021-22 2022-23Budget Forecast Estimate Target Target
Government 13,478 9,565 12,098 9,660 8,184 Provincial corporations 815 355 2,616 1,633 2,434 Government business enterprises 808 672 1,077 620 625 Total borrowing requirements 15,101 10,592 15,791 11,913 11,243
2019-20
M:\MinShare\PublnsProd\CorpFin\OBM.PUBLNS-2020-21\B20_Fiscal-Plan_vol\10_FiscalPlan_TABLES_B20\source_docs_Tables\X-BUDGET-2020_TABLESPRINT.xlsx/Financing Reqt p15 2/18/2020/3:24 PM
Schedule 12: Borrowing Requirements (millions of dollars)
pdf named: B19_FP_TBS_15_bs.pdf Budget 2019Fiscal Plan Tables
Borrowing Sources(millions of dollars)
2020-21 2021-22 2022-23Budget Forecast Estimate Target Target
Money market (net change) 2,774 2,500 (1,500) 250 550 Public-private partnerships (P3s) 113 113 151 46 - Term debt 12,214 7,979 17,140 11,617 10,693 Total borrowing sources 15,101 10,592 15,791 11,913 11,243
pdf named: B19_FP_TBS_15_bs.pdf
2019-20
M:\MinShare\PublnsProd\CorpFin\OBM.PUBLNS-2020-21\B20_Fiscal-Plan_vol\10_FiscalPlan_TABLES_B20\source_docs_Tables\X-BUDGET-2020_TABLESPRINT.xlsx/Borrowing sources 2/18/2020/3:24 PM
Schedule 13: Borrowing Sources(millions of dollars)
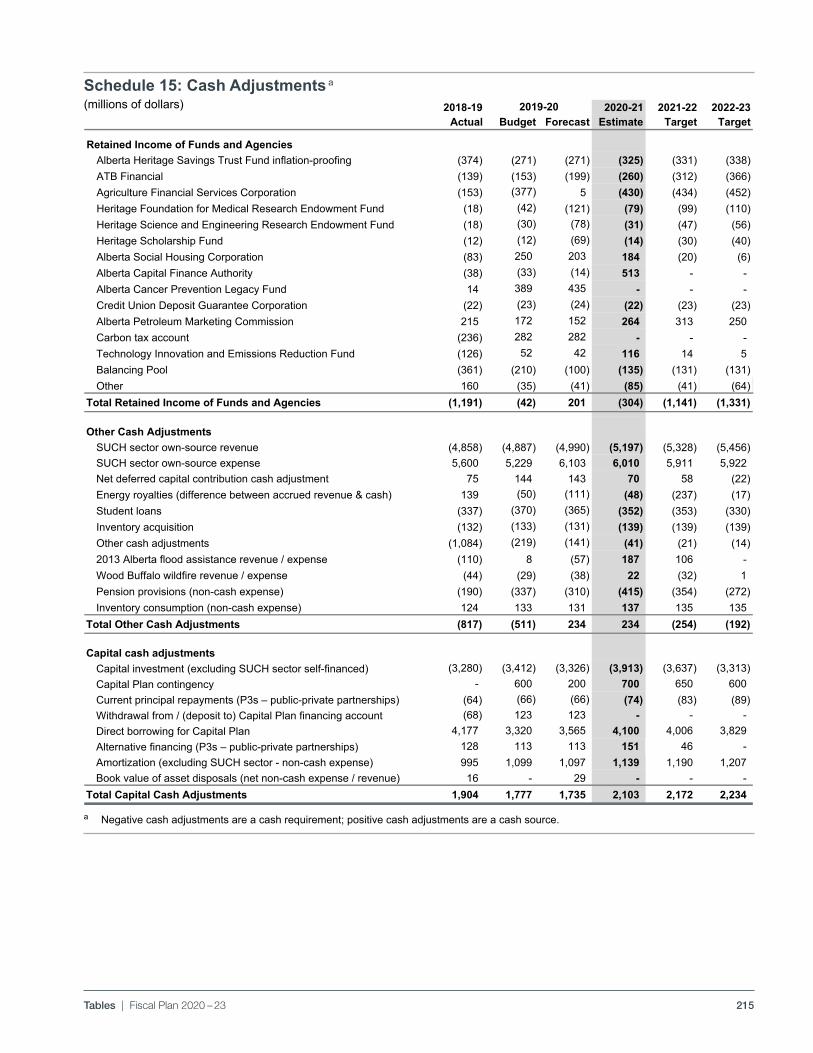
215Tables | Fiscal Plan 2020 – 23
Schedule 15: Cash Adjustments a(millions of dollars)
pdf named: B19_FP_TBS_14_ca.pdf Budget 2019Fiscal Plan Tables
Cash Adjustmentsa
2018-19 2020-21 2021-22 2022-23Actual Budget Forecast Estimate Target Target
Retained Income of Funds and AgenciesAlberta Heritage Savings Trust Fund inflation-proofing (374) (271) (271) (325) (331) (338) ATB Financial (139) (153) (199) (260) (312) (366) Agriculture Financial Services Corporation (153) (377) 5 (430) (434) (452) Heritage Foundation for Medical Research Endowment Fund (18) (42) (121) (79) (99) (110) Heritage Science and Engineering Research Endowment Fund (18) (30) (78) (31) (47) (56) Heritage Scholarship Fund (12) (12) (69) (14) (30) (40) Alberta Social Housing Corporation (83) 250 203 184 (20) (6) Alberta Capital Finance Authority (38) (33) (14) 513 - - Alberta Cancer Prevention Legacy Fund 14 389 435 - - - Credit Union Deposit Guarantee Corporation (22) (23) (24) (22) (23) (23) Alberta Petroleum Marketing Commission 215 172 152 264 313 250 Carbon tax account (236) 282 282 - - - Technology Innovation and Emissions Reduction Fund (126) 52 42 116 14 5 Balancing Pool (361) (210) (100) (135) (131) (131) Other 160 (35) (41) (85) (41) (64)
Total Retained Income of Funds and Agencies (1,191) (42) 201 (304) (1,141) (1,331)
Other Cash AdjustmentsSUCH sector own-source revenue (4,858) (4,887) (4,990) (5,197) (5,328) (5,456) SUCH sector own-source expense 5,600 5,229 6,103 6,010 5,911 5,922 Net deferred capital contribution cash adjustment 75 144 143 70 58 (22) Energy royalties (difference between accrued revenue & cash) 139 (50) (111) (48) (237) (17) Student loans (337) (370) (365) (352) (353) (330) Inventory acquisition (132) (133) (131) (139) (139) (139) Other cash adjustments (1,084) (219) (141) (41) (21) (14) 2013 Alberta flood assistance revenue / expense (110) 8 (57) 187 106 - Wood Buffalo wildfire revenue / expense (44) (29) (38) 22 (32) 1 Pension provisions (non-cash expense) (190) (337) (310) (415) (354) (272) Inventory consumption (non-cash expense) 124 133 131 137 135 135
Total Other Cash Adjustments (817) (511) 234 234 (254) (192)
Capital cash adjustmentsCapital investment (excluding SUCH sector self-financed) (3,280) (3,412) (3,326) (3,913) (3,637) (3,313) Capital Plan contingency - 600 200 700 650 600 Current principal repayments (P3s – public-private partnerships) (64) (66) (66) (74) (83) (89) Withdrawal from / (deposit to) Capital Plan financing account (68) 123 123 - - - Direct borrowing for Capital Plan 4,177 3,320 3,565 4,100 4,006 3,829 Alternative financing (P3s – public-private partnerships) 128 113 113 151 46 - Amortization (excluding SUCH sector - non-cash expense) 995 1,099 1,097 1,139 1,190 1,207 Book value of asset disposals (net non-cash expense / revenue) 16 - 29 - - -
Total Capital Cash Adjustments 1,904 1,777 1,735 2,103 2,172 2,234
2019-20
M:\MinShare\PublnsProd\CorpFin\OBM.PUBLNS-2020-21\B20_Fiscal-Plan_vol\10_FiscalPlan_TABLES_B20\source_docs_Tables\X-BUDGET-2020_TABLESPRINT.xlsx/Cash Adjustm p14 2/15/2020/1:50 AM
a Negative cash adjustments are a cash requirement; positive cash adjustments are a cash source.
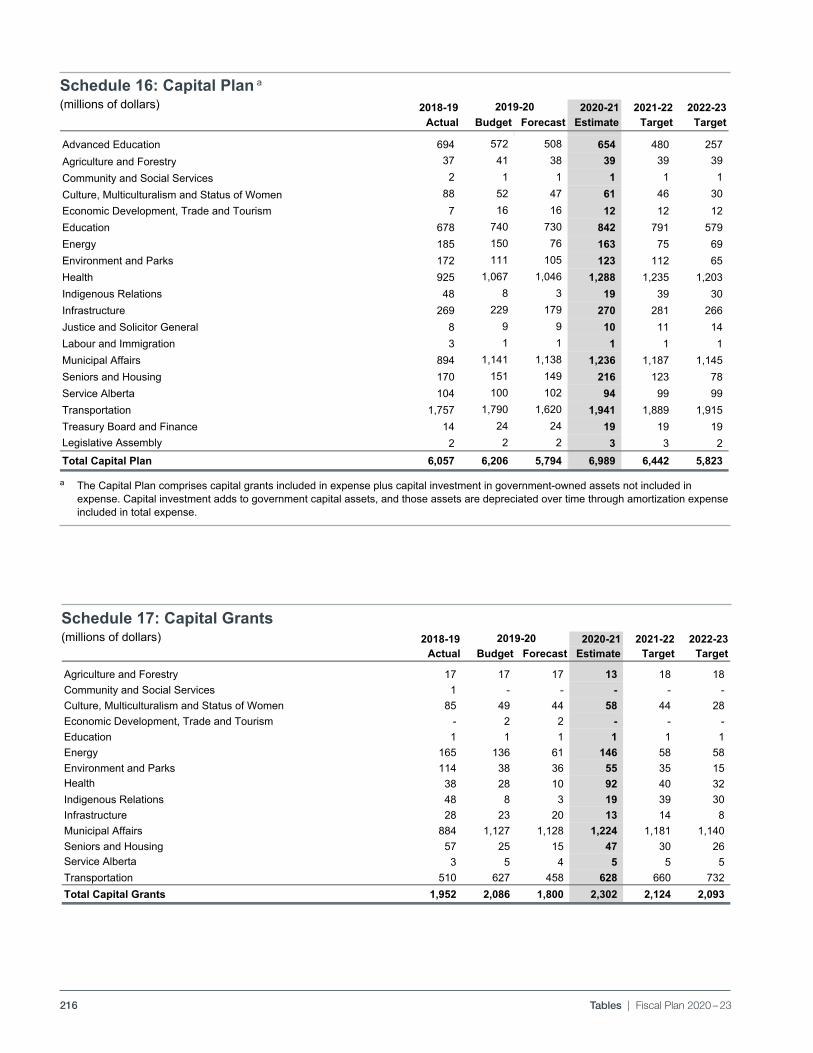
216 Tables | Fiscal Plan 2020 – 23
Schedule 17: Capital Grants(millions of dollars)
pdf named: B19_FP_TBS_13_cg.pdf Budget 2019Fiscal Plan Tables
Capital Grants(millions of dollars)
2018-19 2020-21 2021-22 2022-23Actual Budget Forecast Estimate Target Target
Agriculture and Forestry 17 17 17 13 18 18 Community and Social Services 1 - - - - - Culture, Multiculturalism and Status of Women 85 49 44 58 44 28 Economic Development, Trade and Tourism - 2 2 - - - Education 1 1 1 1 1 1 Energy 165 136 61 146 58 58 Environment and Parks 114 38 36 55 35 15 Health 38 28 10 92 40 32 Indigenous Relations 48 8 3 19 39 30 Infrastructure 28 23 20 13 14 8 Municipal Affairs 884 1,127 1,128 1,224 1,181 1,140 Seniors and Housing 57 25 15 47 30 26 Service Alberta 3 5 4 5 5 5 Transportation 510 627 458 628 660 732 Total Capital Grants 1,952 2,086 1,800 2,302 2,124 2,093
2019-20
M:\MinShare\PublnsProd\CorpFin\OBM.PUBLNS-2020-21\B20_Fiscal-Plan_vol\10_FiscalPlan_TABLES_B20\source_docs_Tables\X-BUDGET-2020_TABLESPRINT.xlsx/Capital grants p13 2/16/2020/8:36 PM
pdf named: B19_FP_TBS_12_cp.pdf Budget 2019Fiscal Plan Tables
Capital Plana
(millions of dollars)
2018-19 2020-21 2021-22 2022-23Actual Budget Forecast Estimate Target Target
Advanced Education 694 572 508 654 480 257 Agriculture and Forestry 37 41 38 39 39 39 Community and Social Services 2 1 1 1 1 1 Culture, Multiculturalism and Status of Women 88 52 47 61 46 30 Economic Development, Trade and Tourism 7 16 16 12 12 12 Education 678 740 730 842 791 579 Energy 185 150 76 163 75 69 Environment and Parks 172 111 105 123 112 65 Health 925 1,067 1,046 1,288 1,235 1,203 Indigenous Relations 48 8 3 19 39 30 Infrastructure 269 229 179 270 281 266 Justice and Solicitor General 8 9 9 10 11 14 Labour and Immigration 3 1 1 1 1 1 Municipal Affairs 894 1,141 1,138 1,236 1,187 1,145 Seniors and Housing 170 151 149 216 123 78 Service Alberta 104 100 102 94 99 99 Transportation 1,757 1,790 1,620 1,941 1,889 1,915 Treasury Board and Finance 14 24 24 19 19 19 Legislative Assembly 2 2 2 3 3 2 Total Capital Plan 6,057 6,206 5,794 6,989 6,442 5,823
2019-20
S:\TBF\MinShare\PublnsProd\CorpFin\OBM.PUBLNS-2020-21\B20_Fiscal-Plan_vol\10_FiscalPlan_TABLES_B20\source_docs_Tables\X-BUDGET-2020_TABLESPRINT/Capital Plan p12 2/19/2020/12:39 PM
a The Capital Plan comprises capital grants included in expense plus capital investment in government-owned assets not included in expense. Capital investment adds to government capital assets, and those assets are depreciated over time through amortization expense included in total expense.
Schedule 16: Capital Plan a(millions of dollars)
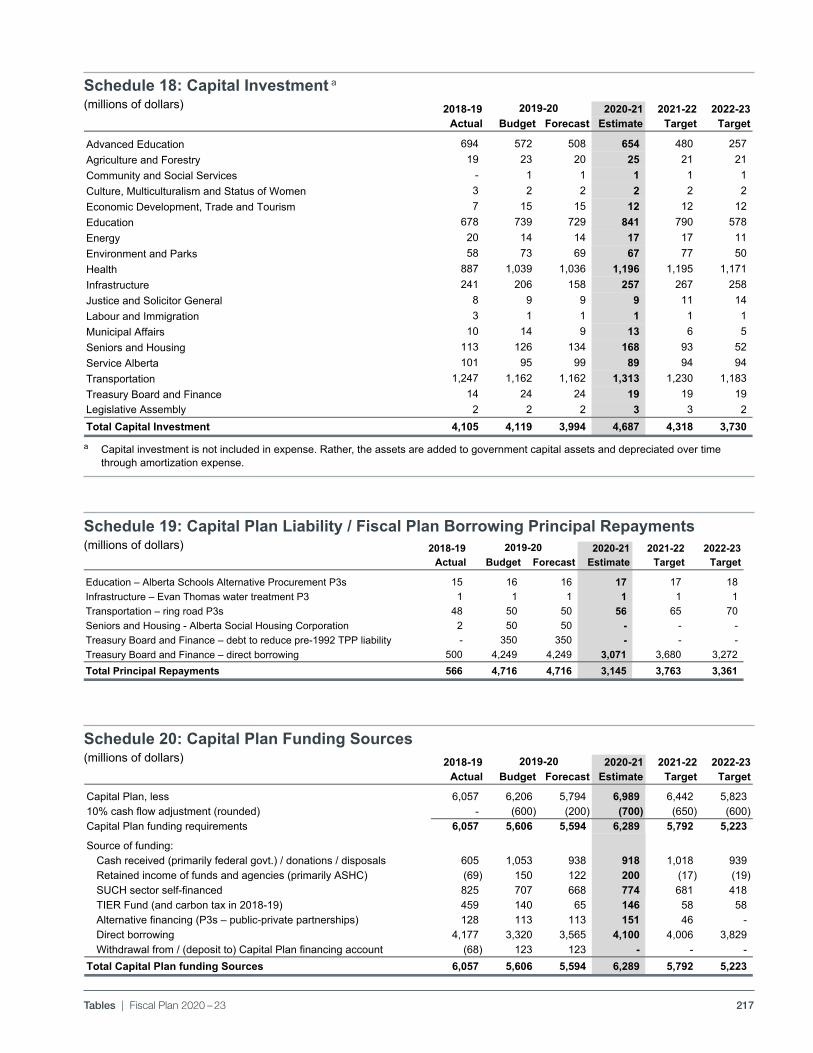
217Tables | Fiscal Plan 2020 – 23
Schedule 18: Capital Investment a(millions of dollars)
a Capital investment is not included in expense. Rather, the assets are added to government capital assets and depreciated over time through amortization expense.
pdf named: B19_FP_TBS_12_ci.pdf Budget 2019Fiscal Plan Tables
Capital Investment(millions of dollars)
2018-19 2020-21 2021-22 2022-23Actual Budget Forecast Estimate Target Target
Advanced Education 694 572 508 654 480 257 Agriculture and Forestry 19 23 20 25 21 21 Community and Social Services - 1 1 1 1 1 Culture, Multiculturalism and Status of Women 3 2 2 2 2 2 Economic Development, Trade and Tourism 7 15 15 12 12 12 Education 678 739 729 841 790 578 Energy 20 14 14 17 17 11 Environment and Parks 58 73 69 67 77 50 Health 887 1,039 1,036 1,196 1,195 1,171 Infrastructure 241 206 158 257 267 258 Justice and Solicitor General 8 9 9 9 11 14 Labour and Immigration 3 1 1 1 1 1 Municipal Affairs 10 14 9 13 6 5 Seniors and Housing 113 126 134 168 93 52 Service Alberta 101 95 99 89 94 94 Transportation 1,247 1,162 1,162 1,313 1,230 1,183 Treasury Board and Finance 14 24 24 19 19 19 Legislative Assembly 2 2 2 3 3 2 Total Capital Investment 4,105 4,119 3,994 4,687 4,318 3,730
2019-20
M:\MinShare\PublnsProd\CorpFin\OBM.PUBLNS-2020-21\B20_Fiscal-Plan_vol\10_FiscalPlan_TABLES_B20\source_docs_Tables\X-BUDGET-2020_TABLESPRINT.xlsx/Capital Invest p12 2/18/2020/3:22 PM
Schedule 20: Capital Plan Funding Sources(millions of dollars)
Pdf named: B19_FP_TBS_13_lfcp.pdf Budget 2019Fiscal Plan Tables
Capital Plan Funding Sources(millions of dollars)
2018-19 2020-21 2021-22 2022-23Actual Budget Forecast Estimate Target Target
Capital Plan, less 6,057 6,206 5,794 6,989 6,442 5,823 10% cash flow adjustment (rounded) - (600) (200) (700) (650) (600) Capital Plan funding requirements 6,057 5,606 5,594 6,289 5,792 5,223
Source of funding:Cash received (primarily federal govt.) / donations / disposals 605 1,053 938 918 1,018 939 Retained income of funds and agencies (primarily ASHC) (69) 150 122 200 (17) (19) SUCH sector self-financed 825 707 668 774 681 418 TIER Fund (and carbon tax in 2018-19) 459 140 65 146 58 58 Alternative financing (P3s – public-private partnerships) 128 113 113 151 46 - Direct borrowing 4,177 3,320 3,565 4,100 4,006 3,829 Withdrawal from / (deposit to) Capital Plan financing account (68) 123 123 - - -
Total Capital Plan funding Sources 6,057 5,606 5,594 6,289 5,792 5,223
2019-20
M:\MinShare\PublnsProd\CorpFin\OBM.PUBLNS-2020-21\B20_Fiscal-Plan_vol\10_FiscalPlan_TABLES_B20\source_docs_Tables\X-BUDGET-2020_TABLESPRINT.xlsx/Capital Plan Funding p13 2/18/2020/3:23 PM
Schedule 19: Capital Plan Liability / Fiscal Plan Borrowing Principal Repayments(millions of dollars)
Pdf named: B19_FP_TBS_13_cplpr.pdf Budget 2019Fiscal Plan Tables
Fiscal Plan and Capital Plan Liability Principal Repayments(millions of dollars)
2018-19 2020-21 2021-22 2022-23Actual Budget Forecast Estimate Target Target
Education – Alberta Schools Alternative Procurement P3s 15 16 16 17 17 18 Infrastructure – Evan Thomas water treatment P3 1 1 1 1 1 1 Transportation – ring road P3s 48 50 50 56 65 70 Seniors and Housing - Alberta Social Housing Corporation 2 50 50 - - - Treasury Board and Finance – debt to reduce pre-1992 TPP liability - 350 350 - - - Treasury Board and Finance – direct borrowing 500 4,249 4,249 3,071 3,680 3,272 Total Principal Repayments 566 4,716 4,716 3,145 3,763 3,361
2019-20
M:\MinShare\PublnsProd\CorpFin\OBM.PUBLNS-2020-21\B20_Fiscal-Plan_vol\10_FiscalPlan_TABLES_B20\source_docs_Tables\X-BUDGET-2020_TABLESPRINT.xlsx/Principal Repayments p13 2/16/2020/8:37 PM
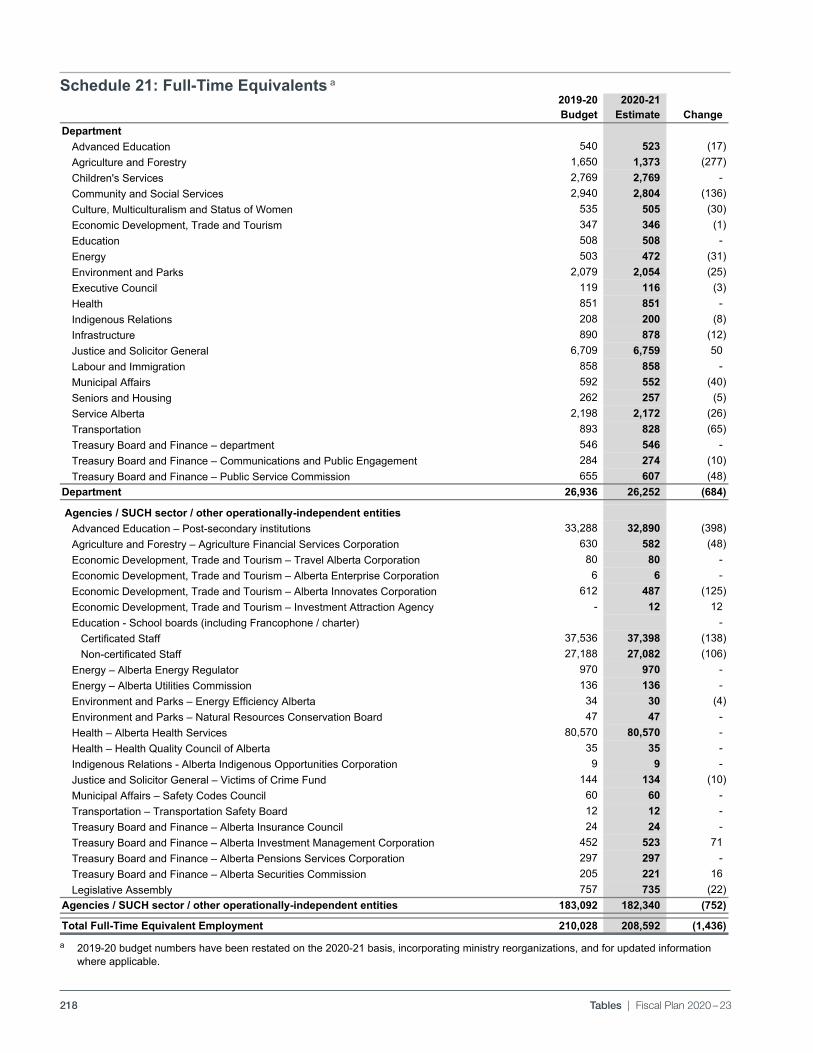
218 Tables | Fiscal Plan 2020 – 23
Schedule 21: Full-Time Equivalents a
pdf named: B19_FP_TBS_16_fte.pdf Budget 2019- Fiscal Plan Tables
Full-Time Equivalents a2019-20 2020-21Budget Estimate Change
DepartmentAdvanced Education 540 523 (17) Agriculture and Forestry 1,650 1,373 (277) Children's Services 2,769 2,769 - Community and Social Services 2,940 2,804 (136) Culture, Multiculturalism and Status of Women 535 505 (30) Economic Development, Trade and Tourism 347 346 (1) Education 508 508 - Energy 503 472 (31) Environment and Parks 2,079 2,054 (25) Executive Council 119 116 (3) Health 851 851 - Indigenous Relations 208 200 (8) Infrastructure 890 878 (12) Justice and Solicitor General 6,709 6,759 50 Labour and Immigration 858 858 - Municipal Affairs 592 552 (40) Seniors and Housing 262 257 (5) Service Alberta 2,198 2,172 (26) Transportation 893 828 (65) Treasury Board and Finance – department 546 546 - Treasury Board and Finance – Communications and Public Engagement 284 274 (10) Treasury Board and Finance – Public Service Commission 655 607 (48)
Department 26,936 26,252 (684)
Agencies / SUCH sector / other operationally-independent entities Advanced Education – Post-secondary institutions 33,288 32,890 (398) Agriculture and Forestry – Agriculture Financial Services Corporation 630 582 (48) Economic Development, Trade and Tourism – Travel Alberta Corporation 80 80 - Economic Development, Trade and Tourism – Alberta Enterprise Corporation 6 6 - Economic Development, Trade and Tourism – Alberta Innovates Corporation 612 487 (125) Economic Development, Trade and Tourism – Investment Attraction Agency - 12 12 Education - School boards (including Francophone / charter) - Certificated Staff 37,536 37,398 (138) Non-certificated Staff 27,188 27,082 (106) Energy – Alberta Energy Regulator 970 970 - Energy – Alberta Utilities Commission 136 136 - Environment and Parks – Energy Efficiency Alberta 34 30 (4) Environment and Parks – Natural Resources Conservation Board 47 47 - Health – Alberta Health Services 80,570 80,570 - Health – Health Quality Council of Alberta 35 35 - Indigenous Relations - Alberta Indigenous Opportunities Corporation 9 9 - Justice and Solicitor General – Victims of Crime Fund 144 134 (10) Municipal Affairs – Safety Codes Council 60 60 - Transportation – Transportation Safety Board 12 12 - Treasury Board and Finance – Alberta Insurance Council 24 24 - Treasury Board and Finance – Alberta Investment Management Corporation 452 523 71 Treasury Board and Finance – Alberta Pensions Services Corporation 297 297 - Treasury Board and Finance – Alberta Securities Commission 205 221 16 Legislative Assembly 757 735 (22)
Agencies / SUCH sector / other operationally-independent entities 183,092 182,340 (752)
Total Full-Time Equivalent Employment 210,028 208,592 (1,436)
M:\MinShare\PublnsProd\CorpFin\OBM.PUBLNS-2020-21\B20_Fiscal-Plan_vol\10_FiscalPlan_TABLES_B20\source_docs_Tables\X-BUDGET-2020_TABLESPRINT.xlsx/FTEs p16 2/18/2020/3:25 PM
a 2019-20 budget numbers have been restated on the 2020-21 basis, incorporating ministry reorganizations, and for updated information where applicable.
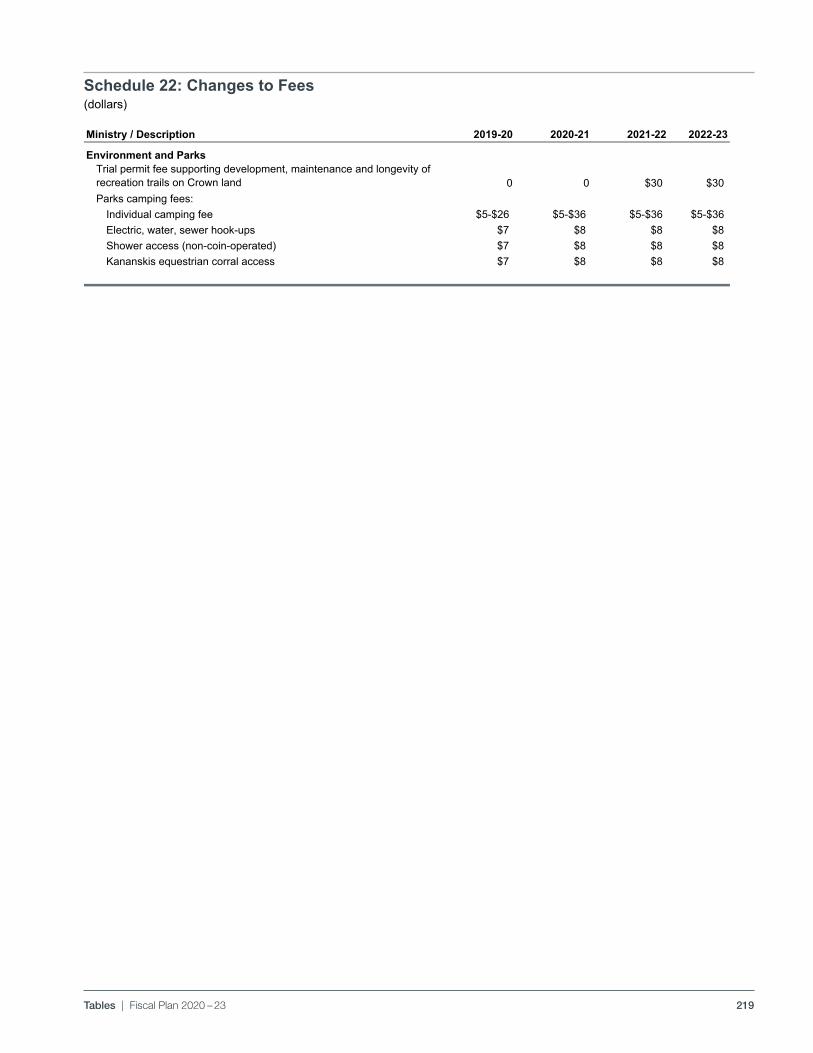
219Tables | Fiscal Plan 2020 – 23
Schedule 22: Changes to Fees(dollars)
pdf named: B19_FP_TBS_18_ctf.pdf Budget 2019Fiscal Plan Tables
Changes to Fees (dollars)Ministry / Description 2019-20 2020-21 2021-22 2022-23
Environment and ParksTrial permit fee supporting development, maintenance and longevity of recreation trails on Crown land 0 0 $30 $30Parks camping fees:
Individual camping fee $5-$26 $5-$36 $5-$36 $5-$36Electric, water, sewer hook-ups $7 $8 $8 $8Shower access (non-coin-operated) $7 $8 $8 $8Kananskis equestrian corral access $7 $8 $8 $8
M:\MinShare\PublnsProd\CorpFin\OBM.PUBLNS-2020-21\B20_Fiscal-Plan_vol\10_FiscalPlan_TABLES_B20\source_docs_Tables\X-BUDGET-2020_TABLESPRINT.xlsx/Changes Fees p18 2/18/2020/3:26 PM
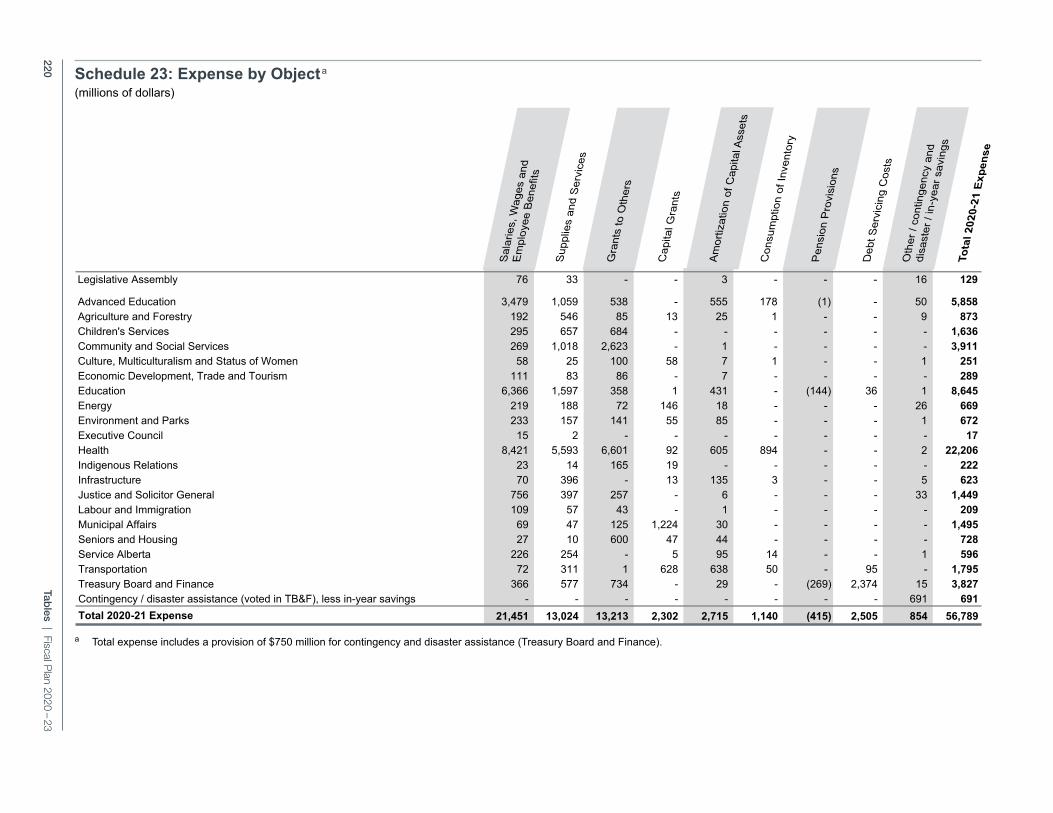
220Tab
les | Fiscal Plan 2020 – 23
Schedule 23: Expense by Object a(millions of dollars)
Sal
arie
s, W
ages
and
E
mpl
oyee
Ben
efits
Sup
plie
s an
d S
ervi
ces
Gra
nts
to O
ther
s
Cap
ital G
rant
s
Am
ortiz
atio
n of
Cap
ital A
sset
s
Con
sum
ptio
n of
Inve
ntor
y
Pen
sion
Pro
visi
ons
Deb
t Ser
vici
ng C
osts
Oth
er /
cont
inge
ncy
and
disa
ster
/ in
-yea
r sav
ings
Tota
l 202
0-21
Exp
ense
pdf named: B19_FP_TBS_11_mebo_hor.pdf Budget 2019- Fiscal Plan Tables
Ministry Expense by Object
on P
rovi
sion
s
Serv
icin
g C
osts
r/ c
ontin
genc
y an
d te
r ass
ista
nce
/ in-
year
gs 20
20-2
1 Ex
pens
e
es, W
ages
and
oyee
Ben
efits
ies
and
Serv
ices
s to
Oth
ers
al G
rant
s
tizat
ion
of C
apita
l Ass
ets
umpt
ion
of In
vent
ory
ensi
o
ebt S
ther
sa
ste
ving
otal
2
alar
iem
plo
uppl
i
rant
s
apita
mor
ti
onsu
Legislative Assembly 76 33 - - 3 - - - 16 129
Advanced Education 3,479 1,059 538 - 555 178 (1) - 50 5,858 Agriculture and Forestry 192 546 85 13 25 1 - - 9 873 Children's Services 295 657 684 - - - - - - 1,636 Community and Social Services 269 1,018 2,623 - 1 - - - - 3,911 Culture, Multiculturalism and Status of Women 58 25 100 58 7 1 - - 1 251 Economic Development, Trade and Tourism 111 83 86 - 7 - - - - 289 Education 6,366 1,597 358 1 431 - (144) 36 1 8,645 Energy 219 188 72 146 18 - - - 26 669 Environment and Parks 233 157 141 55 85 - - - 1 672 Executive Council 15 2 - - - - - - - 17 Health 8,421 5,593 6,601 92 605 894 - - 2 22,206 Indigenous Relations 23 14 165 19 - - - - - 222 Infrastructure 70 396 - 13 135 3 - - 5 623 Justice and Solicitor General 756 397 257 - 6 - - - 33 1,449 Labour and Immigration 109 57 43 - 1 - - - - 209 Municipal Affairs 69 47 125 1,224 30 - - - - 1,495 Seniors and Housing 27 10 600 47 44 - - - - 728 Service Alberta 226 254 - 5 95 14 - - 1 596 Transportation 72 311 1 628 638 50 - 95 - 1,795 Treasury Board and Finance 366 577 734 - 29 - (269) 2,374 15 3,827 Contingency / disaster assistance (voted in TB&F), less in-year savings - - - - - - - - 691 691 Total 2020-21 Expense 21,451 13,024 13,213 2,302 2,715 1,140 (415) 2,505 854 56,789
Pe De
Oth
dis
sav
Tot
Sa Em Su Gra
Ca
Am Co
M:\MinShare\PublnsProd\CorpFin\OBM.PUBLNS-2020-21\B20_Fiscal-Plan_vol\10_FiscalPlan_TABLES_B20\source_docs_Tables\X-BUDGET-2020_TABLESPRINT.xlsx/Exp by Object p11 2/16/2020/8:55 PM
a Total expense includes a provision of $750 million for contingency and disaster assistance (Treasury Board and Finance).
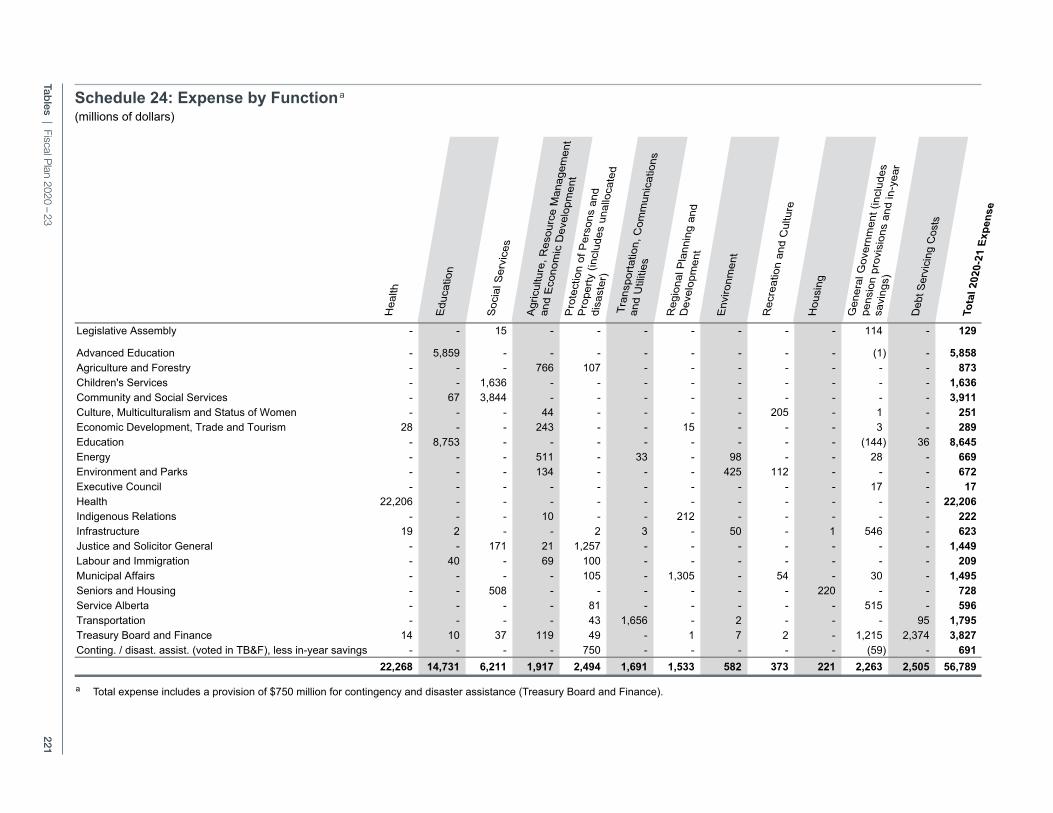
221Tab
les | Fiscal Plan 2020 – 23
Schedule 24: Expense by Function a(millions of dollars)
Hea
lth
Edu
catio
n
Soc
ial S
ervi
ces
Agr
icul
ture
, Res
ourc
e M
anag
emen
t
and
Eco
nom
ic D
evel
opm
ent
Pro
tect
ion
of P
erso
ns a
nd
Pro
perty
(inc
lude
s un
allo
cate
d
disa
ster
)
T
rans
porta
tion,
Com
mun
icat
ions
and
Util
ities
Reg
iona
l Pla
nnin
g an
d D
evel
opm
ent
Env
ironm
ent
Rec
reat
ion
and
Cul
ture
Hou
sing
Gen
eral
Gov
ernm
ent (
incl
udes
pens
ion
prov
isio
ns a
nd in
-yea
r
savi
ngs)
Deb
t Ser
vici
ng C
osts
Tota
l 202
0-21
Exp
ense
pdf name B19_FP_TBS_10_ebf_hor.pdf Budget 2019- Fiscal Plan Tables
Ministry Expense by Function
2020
-21
Expe
nse
ebt S
ervi
cing
C
osts
h atio
n
l Ser
vice
s
porta
tion,
m
unic
atio
ns a
nd U
tiliti
es
ultu
re, R
esou
rce
gem
ent a
nd E
cono
mic
op
men
tct
ion
of P
erso
ns a
nd
erty
(inc
lude
s ng
ency
and
dis
aste
r ta
nce)
onal
Pla
nnin
g an
d op
men
t
eatio
n an
d C
ultu
re
ngonm
ent
ral G
over
nmen
t de
s pe
nsio
n pr
ovis
ions
n-
year
sav
ings
)
otal
2
Deb
ealth
duca
ocia
l
ansp
omm
gric
uan
agev
elo
otec
oper
ntin
gsi
sta
egio
nev
elo
ecre
a
ousi
n
nviro
ener
clud
d in
Legislative Assembly - - 15 - - - - - - - 114 - 129
Advanced Education - 5,859 - - - - - - - - (1) - 5,858 Agriculture and Forestry - - - 766 107 - - - - - - - 873 Children's Services - - 1,636 - - - - - - - - - 1,636 Community and Social Services - 67 3,844 - - - - - - - - - 3,911 Culture, Multiculturalism and Status of Women - - - 44 - - - - 205 - 1 - 251 Economic Development, Trade and Tourism 28 - - 243 - - 15 - - - 3 - 289 Education - 8,753 - - - - - - - - (144) 36 8,645 Energy - - - 511 - 33 - 98 - - 28 - 669 Environment and Parks - - - 134 - - - 425 112 - - - 672 Executive Council - - - - - - - - - - 17 - 17 Health 22,206 - - - - - - - - - - - 22,206 Indigenous Relations - - - 10 - - 212 - - - - - 222 Infrastructure 19 2 - - 2 3 - 50 - 1 546 - 623 Justice and Solicitor General - - 171 21 1,257 - - - - - - - 1,449 Labour and Immigration - 40 - 69 100 - - - - - - - 209 Municipal Affairs - - - - 105 - 1,305 - 54 - 30 - 1,495 Seniors and Housing - - 508 - - - - - - 220 - - 728 Service Alberta - - - - 81 - - - - - 515 - 596 Transportation - - - - 43 1,656 - 2 - - - 95 1,795 Treasury Board and Finance 14 10 37 119 49 - 1 7 2 - 1,215 2,374 3,827 Conting. / disast. assist. (voted in TB&F), less in-year savings - - - - 750 - - - - - (59) - 691
22,268 14,731 6,211 1,917 2,494 1,691 1,533 582 373 221 2,263 2,505 56,789
Tot
He
Ed Soc
Tra
Co
Ag Ma
Dev
Pro
Pro
con
ass
Re
Dev
Re
Ho
Env
Ge
(inc
and
M:\MinShare\PublnsProd\CorpFin\OBM.PUBLNS-2020-21\B20_Fiscal-Plan_vol\10_FiscalPlan_TABLES_B20\source_docs_Tables\X-BUDGET-2020_TABLESPRINT.xlsx/Exp by Function p10 2/18/2020/3:25 PM
a Total expense includes a provision of $750 million for contingency and disaster assistance (Treasury Board and Finance).
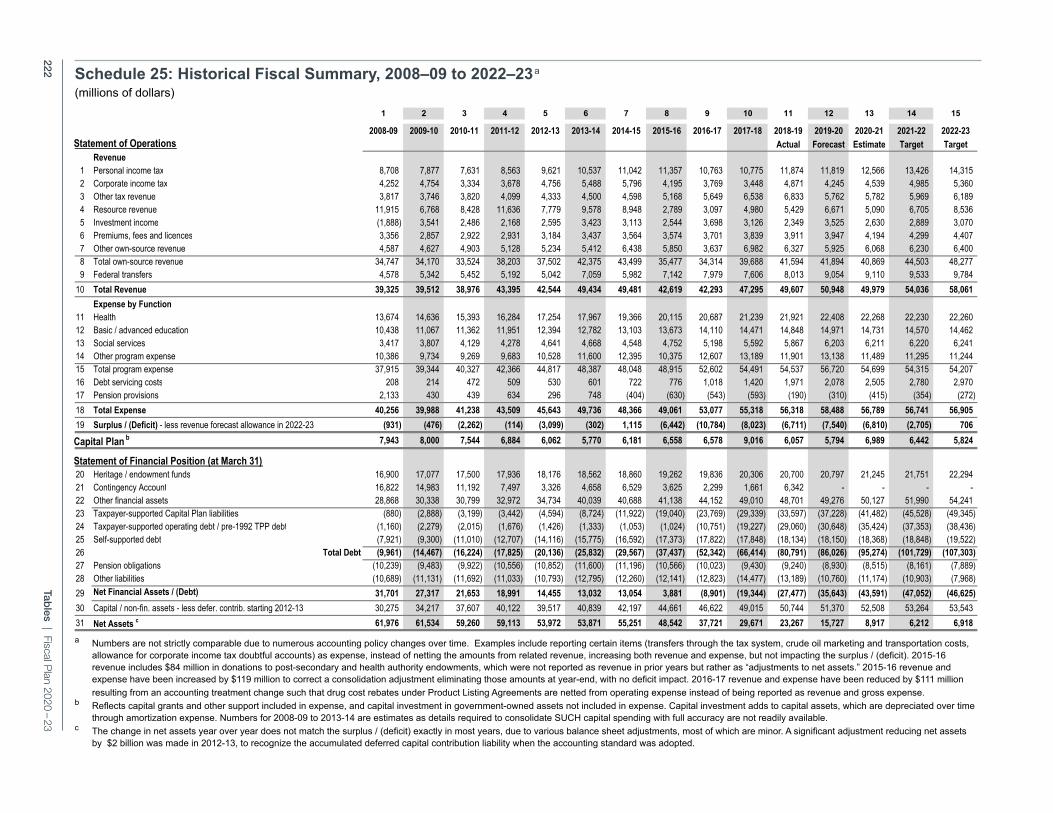
222Tab
les | Fiscal Plan 2020 – 23
pdf named: B19_FP-Tables_Historical_tb.pdf Budget 2019 - Tables section
Historical Fiscal Summary, 2008-09 to 2022-23 a (millions of dollars)
1 2 3 4 5 6 7 8 9 10 11 12 13 14 15
2008-09 2009-10 2010-11 2011-12 2012-13 2013-14 2014-15 2015-16 2016-17 2017-18 2018-19 2019-20 2020-21 2021-22 2022-23Statement of Operations Actual Forecast Estimate Target Target
Revenue1 Personal income tax 8,708 7,877 7,631 8,563 9,621 10,537 11,042 11,357 10,763 10,775 11,874 11,819 12,566 13,426 14,3152 Corporate income tax 4,252 4,754 3,334 3,678 4,756 5,488 5,796 4,195 3,769 3,448 4,871 4,245 4,539 4,985 5,3603 Other tax revenue 3,817 3,746 3,820 4,099 4,333 4,500 4,598 5,168 5,649 6,538 6,833 5,762 5,782 5,969 6,1894 Resource revenue 11,915 6,768 8,428 11,636 7,779 9,578 8,948 2,789 3,097 4,980 5,429 6,671 5,090 6,705 8,5365 Investment income (1,888) 3,541 2,486 2,168 2,595 3,423 3,113 2,544 3,698 3,126 2,349 3,525 2,630 2,889 3,0706 Premiums, fees and licences 3,356 2,857 2,922 2,931 3,184 3,437 3,564 3,574 3,701 3,839 3,911 3,947 4,194 4,299 4,4077 Other own-source revenue 4,587 4,627 4,903 5,128 5,234 5,412 6,438 5,850 3,637 6,982 6,327 5,925 6,068 6,230 6,4008 Total own-source revenue 34,747 34,170 33,524 38,203 37,502 42,375 43,499 35,477 34,314 39,688 41,594 41,894 40,869 44,503 48,2779 Federal transfers 4,578 5,342 5,452 5,192 5,042 7,059 5,982 7,142 7,979 7,606 8,013 9,054 9,110 9,533 9,784
10 Total Revenue 39,325 39,512 38,976 43,395 42,544 49,434 49,481 42,619 42,293 47,295 49,607 50,948 49,979 54,036 58,061Expense by Function
11 Health 13,674 14,636 15,393 16,284 17,254 17,967 19,366 20,115 20,687 21,239 21,921 22,408 22,268 22,230 22,26012 Basic / advanced education 10,438 11,067 11,362 11,951 12,394 12,782 13,103 13,673 14,110 14,471 14,848 14,971 14,731 14,570 14,46213 Social services 3,417 3,807 4,129 4,278 4,641 4,668 4,548 4,752 5,198 5,592 5,867 6,203 6,211 6,220 6,24114 Other program expense 10,386 9,734 9,269 9,683 10,528 11,600 12,395 10,375 12,607 13,189 11,901 13,138 11,489 11,295 11,24415 Total program expense 37,915 39,344 40,327 42,366 44,817 48,387 48,048 48,915 52,602 54,491 54,537 56,720 54,699 54,315 54,20716 Debt servicing costs 208 214 472 509 530 601 722 776 1,018 1,420 1,971 2,078 2,505 2,780 2,97017 Pension provisions 2,133 430 439 634 296 748 (404) (630) (543) (593) (190) (310) (415) (354) (272)18 Total Expense 40,256 39,988 41,238 43,509 45,643 49,736 48,366 49,061 53,077 55,318 56,318 58,488 56,789 56,741 56,90519 Surplus / (Deficit) - less revenue forecast allowance in 2022-23 (931) (476) (2,262) (114) (3,099) (302) 1,115 (6,442) (10,784) (8,023) (6,711) (7,540) (6,810) (2,705) 706
Capital Plan b 7,943 8,000 7,544 6,884 6,062 5,770 6,181 6,558 6,578 9,016 6,057 5,794 6,989 6,442 5,824
Statement of Financial Position (at March 31)20 Heritage / endowment funds 16,900 17,077 17,500 17,936 18,176 18,562 18,860 19,262 19,836 20,306 20,700 20,797 21,245 21,751 22,29421 Contingency Account 16,822 14,983 11,192 7,497 3,326 4,658 6,529 3,625 2,299 1,661 6,342 - - - -22 Other financial assets 28,868 30,338 30,799 32,972 34,734 40,039 40,688 41,138 44,152 49,010 48,701 49,276 50,127 51,990 54,24123 Taxpayer-supported Capital Plan liabilities (880) (2,888) (3,199) (3,442) (4,594) (8,724) (11,922) (19,040) (23,769) (29,339) (33,597) (37,228) (41,482) (45,528) (49,345)24 Taxpayer-supported operating debt / pre-1992 TPP debt (1,160) (2,279) (2,015) (1,676) (1,426) (1,333) (1,053) (1,024) (10,751) (19,227) (29,060) (30,648) (35,424) (37,353) (38,436)25 Self-supported debt (7,921) (9,300) (11,010) (12,707) (14,116) (15,775) (16,592) (17,373) (17,822) (17,848) (18,134) (18,150) (18,368) (18,848) (19,522)26 Total Debt (9,961) (14,467) (16,224) (17,825) (20,136) (25,832) (29,567) (37,437) (52,342) (66,414) (80,791) (86,026) (95,274) (101,729) (107,303)27 Pension obligations (10,239) (9,483) (9,922) (10,556) (10,852) (11,600) (11,196) (10,566) (10,023) (9,430) (9,240) (8,930) (8,515) (8,161) (7,889)28 Other liabilities (10,689) (11,131) (11,692) (11,033) (10,793) (12,795) (12,260) (12,141) (12,823) (14,477) (13,189) (10,760) (11,174) (10,903) (7,968)29 Net Financial Assets / (Debt) 31,701 27,317 21,653 18,991 14,455 13,032 13,054 3,881 (8,901) (19,344) (27,477) (35,643) (43,591) (47,052) (46,625)30 Capital / non-fin. assets - less defer. contrib. starting 2012-13 30,275 34,217 37,607 40,122 39,517 40,839 42,197 44,661 46,622 49,015 50,744 51,370 52,508 53,264 53,54331 Net Assets c 61,976 61,534 59,260 59,113 53,972 53,871 55,251 48,542 37,721 29,671 23,267 15,727 8,917 6,212 6,918
M:\MinShare\PublnsProd\CorpFin\OBM.PUBLNS-2020-21\B20_Fiscal-Plan_vol\10_FiscalPlan_TABLES_B20\source_docs_Tables\B20_Historical Fiscal Summary CFS Basis Bud 2020.xlsx/Bud 18_Hist Tbl 2/18/2020/3:26 PM
a Numbers are not strictly comparable due to numerous accounting policy changes over time. Examples include reporting certain items (transfers through the tax system, crude oil marketing and transportation costs, allowance for corporate income tax doubtful accounts) as expense, instead of netting the amounts from related revenue, increasing both revenue and expense, but not impacting the surplus / (deficit). 2015-16 revenue includes $84 million in donations to post-secondary and health authority endowments, which were not reported as revenue in prior years but rather as “adjustments to net assets.” 2015-16 revenue and expense have been increased by $119 million to correct a consolidation adjustment eliminating those amounts at year-end, with no deficit impact. 2016-17 revenue and expense have been reduced by $111 million resulting from an accounting treatment change such that drug cost rebates under Product Listing Agreements are netted from operating expense instead of being reported as revenue and gross expense.
b Reflects capital grants and other support included in expense, and capital investment in government-owned assets not included in expense. Capital investment adds to capital assets, which are depreciated over time through amortization expense. Numbers for 2008-09 to 2013-14 are estimates as details required to consolidate SUCH capital spending with full accuracy are not readily available.
c The change in net assets year over year does not match the surplus / (deficit) exactly in most years, due to various balance sheet adjustments, most of which are minor. A significant adjustment reducing net assets by $2 billion was made in 2012-13, to recognize the accumulated deferred capital contribution liability when the accounting standard was adopted.
Schedule 25: Historical Fiscal Summary, 2008–09 to 2022–23 a(millions of dollars)
223
BUDGET 2020
GOVERNMENT OF ALBERTA | 2020 – 23
Fiscal PlanResponse to the Auditor General• August 2019• October 2019• November 2019
224 Response to the Auditor General | Fiscal Plan 2020 – 23
August 2019 . . . . . . . . . . . . . . . . . . . . . . . . . . . . . . . . . . . . . . . . . . . . . . . . . . . . . . . . . . . . . . . . . . . . . . . . . . 225
October 2019 . . . . . . . . . . . . . . . . . . . . . . . . . . . . . . . . . . . . . . . . . . . . . . . . . . . . . . . . . . . . . . . . . . . . . . . . . 229
November 2019 . . . . . . . . . . . . . . . . . . . . . . . . . . . . . . . . . . . . . . . . . . . . . . . . . . . . . . . . . . . . . . . . . . . . . . . 230
Table of Contents
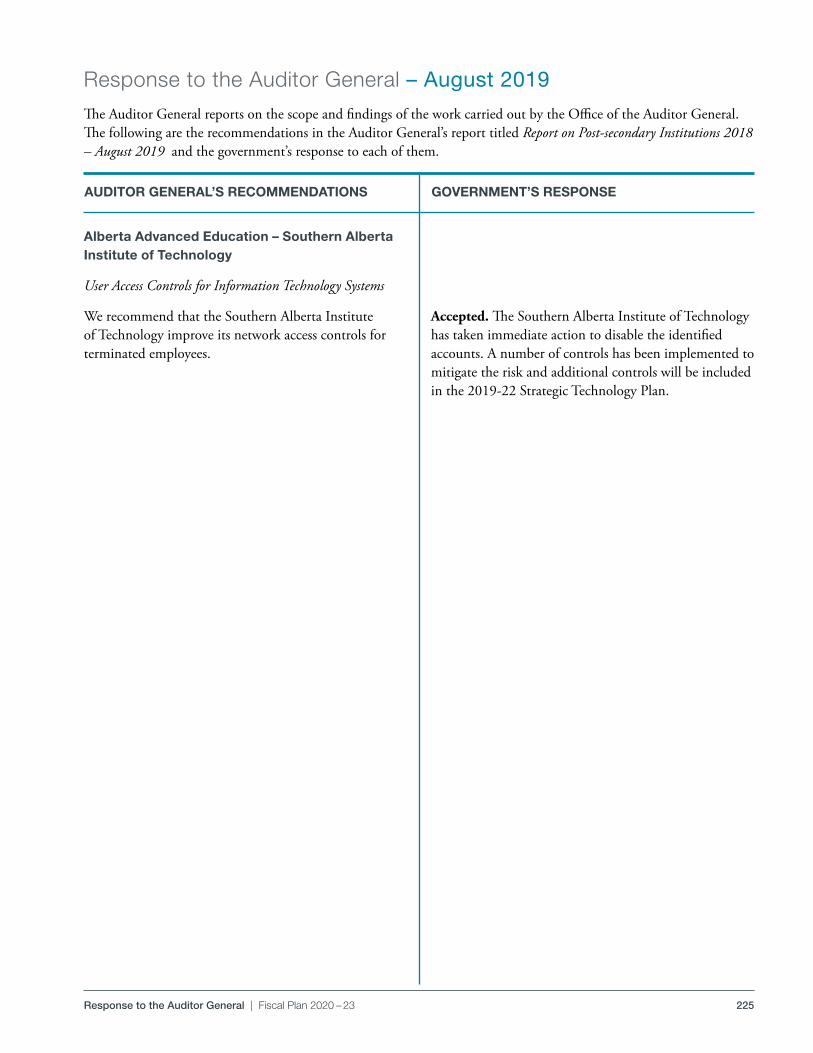
225Response to the Auditor General | Fiscal Plan 2020 – 23
The Auditor General reports on the scope and findings of the work carried out by the Office of the Auditor General . The following are the recommendations in the Auditor General’s report titled Report on Post-secondary Institutions 2018 – August 2019 and the government’s response to each of them .
AUDITOR GENERAL’S RECOMMENDATIONS GOVERNMENT’S RESPONSE
Response to the Auditor General – August 2019
Alberta Advanced Education – Southern Alberta Institute of Technology
User Access Controls for Information Technology Systems
We recommend that the Southern Alberta Institute of Technology improve its network access controls for terminated employees .
Accepted. The Southern Alberta Institute of Technology has taken immediate action to disable the identified accounts . A number of controls has been implemented to mitigate the risk and additional controls will be included in the 2019-22 Strategic Technology Plan .
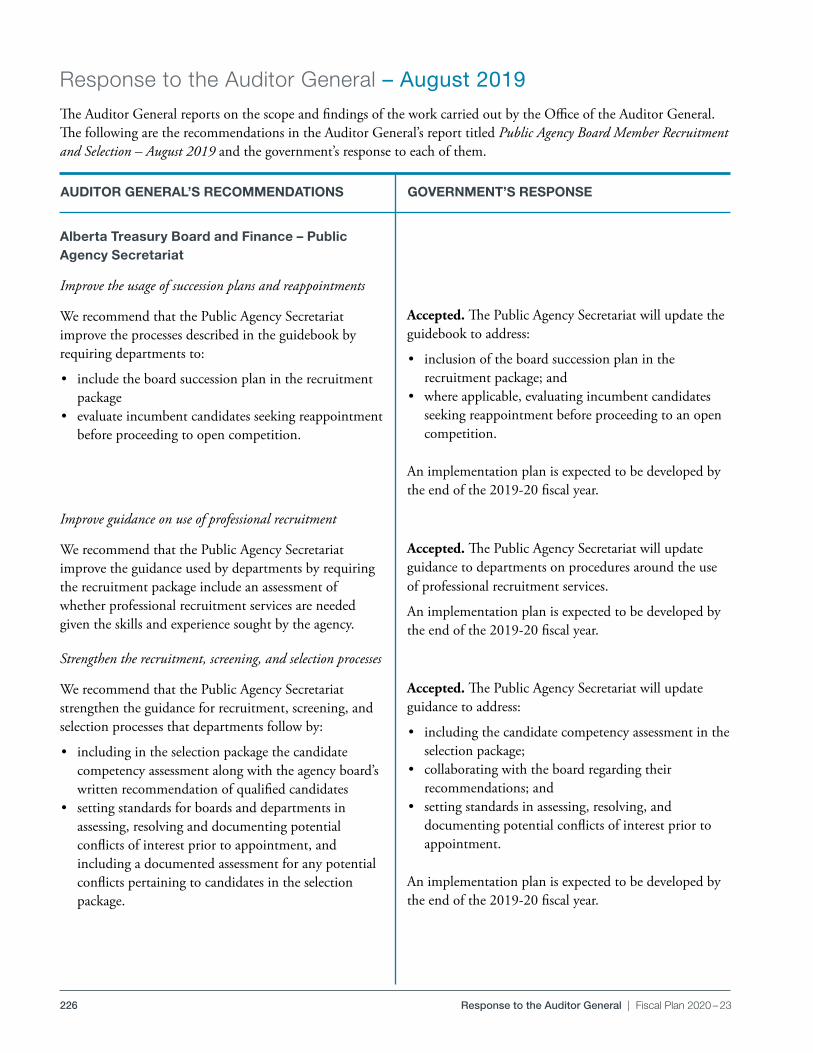
226 Response to the Auditor General | Fiscal Plan 2020 – 23
The Auditor General reports on the scope and findings of the work carried out by the Office of the Auditor General . The following are the recommendations in the Auditor General’s report titled Public Agency Board Member Recruitment and Selection – August 2019 and the government’s response to each of them .
AUDITOR GENERAL’S RECOMMENDATIONS GOVERNMENT’S RESPONSE
Response to the Auditor General – August 2019
Alberta Treasury Board and Finance – Public Agency Secretariat
Improve the usage of succession plans and reappointments
We recommend that the Public Agency Secretariat improve the processes described in the guidebook by requiring departments to:
• include the board succession plan in the recruitment package
• evaluate incumbent candidates seeking reappointment before proceeding to open competition .
Accepted. The Public Agency Secretariat will update the guidebook to address:
• inclusion of the board succession plan in the recruitment package; and
• where applicable, evaluating incumbent candidates seeking reappointment before proceeding to an open competition .
An implementation plan is expected to be developed by the end of the 2019-20 fiscal year .
Improve guidance on use of professional recruitment
We recommend that the Public Agency Secretariat improve the guidance used by departments by requiring the recruitment package include an assessment of whether professional recruitment services are needed given the skills and experience sought by the agency .
Accepted. The Public Agency Secretariat will update guidance to departments on procedures around the use of professional recruitment services .
An implementation plan is expected to be developed by the end of the 2019-20 fiscal year .
Strengthen the recruitment, screening, and selection processes
We recommend that the Public Agency Secretariat strengthen the guidance for recruitment, screening, and selection processes that departments follow by:
• including in the selection package the candidate competency assessment along with the agency board’s written recommendation of qualified candidates
• setting standards for boards and departments in assessing, resolving and documenting potential conflicts of interest prior to appointment, and including a documented assessment for any potential conflicts pertaining to candidates in the selection package .
Accepted. The Public Agency Secretariat will update guidance to address:
• including the candidate competency assessment in the selection package;
• collaborating with the board regarding their recommendations; and
• setting standards in assessing, resolving, and documenting potential conflicts of interest prior to appointment .
An implementation plan is expected to be developed by the end of the 2019-20 fiscal year .
227Response to the Auditor General | Fiscal Plan 2020 – 23
AUDITOR GENERAL’S RECOMMENDATIONS GOVERNMENT’S RESPONSE
Improve information systems to monitor process outcomes
We recommend that the Public Agency Secretariat:
• consolidate information systems used to track competitions and appointments
• develop reports that can be used by departments to measure and monitor upcoming and existing board vacancies, the status of open competitions, and metrics on board continuity .
Accepted. The Public Agency Secretariat will assess options to consolidate information systems and develop reports .
An implementation plan is expected to be developed by the end of the 2019-20 fiscal year .

228 Response to the Auditor General | Fiscal Plan 2020 – 23
The Auditor General reports on the scope and findings of the work carried out by the Office of the Auditor General . The following are the recommendations in the Auditor General’s report titled Reporting Performance Results to Albertans Follow-up – August 2019 and the government’s response to each of them .
AUDITOR GENERAL’S RECOMMENDATIONS GOVERNMENT’S RESPONSE
Response to the Auditor General – August 2019
Alberta Treasury Board and Finance
Results Analysis Performance – Repeated
We again recommend that the Department of Treasury Board and Finance improve:
• guidance and training for ministry management to identify, analyze and report on results in ministry annual reports
• processes to monitor ministry compliance with results analysis reporting standards .
Accepted. The Department of Treasury Board and Finance will improve guidance and training for ministry management to identify, analyze and report on results in ministry annual reports and processes to monitor ministry compliance with results analysis reporting standards .
229Response to the Auditor General | Fiscal Plan 2020 – 23
The Auditor General reports on the scope and findings of the work carried out by the Office of the Auditor General . The following are the recommendations in the Auditor General’s report titled Alberta Energy Regulator – An Examination of the International Centre of Regulatory Excellence (ICORE) – October 2019 and the government’s response to each of them .
AUDITOR GENERAL’S RECOMMENDATIONS GOVERNMENT’S RESPONSE
Response to the Auditor General – October 2019
Alberta Energy - Alberta Energy Regulator
We recommend that the AER Board improve its oversight by:
• ensuring the effectiveness of processes to evaluate corporate culture and senior executive performance
• obtaining formal and periodic assertions from management that activities comply with legislation and AER policies, including policies related to conflict of interest
• ensuring officers in key risk management, compliance and internal control roles are well-positioned and supported to provide complete information about AER activities
• reviewing and approving CEO travel and expenses• ensuring the primary channel of communication to
the responsible Ministers is through the Board• establishing processes to engage with executive staff,
and other staff within the organization, to gain comfort that all significant matters have been brought to the attention of the Board .
Accepted. The Alberta Energy Regulator (AER) Board is currently preparing a comprehensive plan . Implementation is expected to be in fiscal years 2019-20 and 2020-21 .
The AER has implemented changes in reviewing and approving CEO travel and expenses to ensure there is full board oversight .
We recommend that AER perform sufficient due diligence to assess the risk of further waste of public resources not already identified .
We recommend AER evaluate whether any additional funds expended on ICORE activities are recoverable .
Accepted. The AER Board is committed to assess the risk of waste of public resources not already identified as part of its implementation plan .
Accepted. The AER Board has retained legal counsel to provide an opinion . In addition, internal AER resources are undertaking further reviews .
The board is expected to finalize an implementation plan by Spring 2020 .
We recommend AER staff are made aware of, and are sufficiently trained on, AER’s whistleblowing process, consistent with Section 6 of Alberta’s Public Interest Disclosure (Whistleblower Protection) Act .
Accepted. Enhanced awareness and training for AER staff on the AER Whistleblower Policy will be in place by Spring 2020 .
230 Response to the Auditor General | Fiscal Plan 2020 – 23
The Auditor General reports on the scope and findings of the work carried out by the Office of the Auditor General . The following are the recommendations in the Auditor General’s report titled Report of the Auditor General – November 2019 and the government’s response to each of them .
AUDITOR GENERAL’S RECOMMENDATIONS GOVERNMENT’S RESPONSE
Response to the Auditor General – November 2019
Alberta Energy - Alberta Energy Regulator
Strengthen processes for its senior management compensation arrangements
We recommend the Alberta Energy Regulator implement processes to ensure senior management agreements, including compensation, distance work arrangements, and succession plans, are transparent, equitable, properly supported, approved and discussed with the AER Board .
Accepted. The Alberta Energy Regulator (AER) has taken the following actions:
• all senior management agreements have been reviewed to ensure compliance with the Reform of Agencies, Boards and Commissions Compensation Act .
• the Working Remotely policy has been revised and current arrangements were reviewed to ensure compliance with the policy and legislation .
• all changes and/or new senior management agreements will be reviewed by the AER Board to ensure compliance .
• a succession planning program will be developed and brought to the AER Board for review in April 2020 .
Identify and comply with the applicable laws
We recommend that the Board of the Alberta Energy Regulator seek assurance from management that they are in compliance with all withholding rules and regulations .
Accepted. The AER will assess taxable benefits to employees to ensure compliance with all withholding rules and regulations .
231Response to the Auditor General | Fiscal Plan 2020 – 23
AUDITOR GENERAL’S RECOMMENDATIONS GOVERNMENT’S RESPONSE
Strengthen expense claim policy and improve controls over expense claim processes
We recommend that the Alberta Energy Regulator improve controls over expense claim processes to ensure expenses are valid, supported and appropriately approved .
Accepted. The AER has:
• reviewed and updated the Travel and Subsistence policy to align with the best practices as a public agency . The updated policy is more prescriptive and provides the necessary framework for effective oversight of AER funds .
• implemented a new Expenditure Approval policy . This policy re-enforces approvers’ responsibility to ensure that all expenditures approved follow AER policies, including the Travel and Subsistence policy .
• enhanced a number of controls related to the review and approval of expense claims . Expense claims are now approved only upon the review of receipts, and payments are not made if no receipt is present .
Alberta Environment and Parks
Collect sufficient security
We recommend that the Department of Environment and Parks collect sufficient security to compel operators to reclaim the land and to cover reclamation costs if operators fail to do so .
Accepted. The Department of Environment and Parks has developed a proposed methodology to calculate sufficient reclamation security and will work with industry to address this issue in the 2020-21 fiscal year .
The department has launched an external engagement on demand forfeiture bonds . This additional financial instrument will be available in 2020 for industry to use when submitting reclamation security for pits on private lands .
Collect outstanding royalties
We recommend that the Department of Environment and Parks collect outstanding royalties for sand and gravel on oil sands sites .
Accepted. The Department of Environment and Parks is examining the best method to collect outstanding royalties .
232 Response to the Auditor General | Fiscal Plan 2020 – 23
AUDITOR GENERAL’S RECOMMENDATIONS GOVERNMENT’S RESPONSE
Improve reclamation monitoring and enforcement – Repeated
We again recommend that the Department of Environment and Parks improve the effectiveness and efficiency of reclamation monitoring and enforce reclamation requirements .
Accepted. The Department of Environment and Parks:
• has made progress on establishing updated inspection protocols for aggregate dispositions that includes inspection of active pit operations .
• will explore additional work on how to improve capturing the reclamation status of dispositions and to document enforcement efforts .
• is committed to continuous improvement and is developing a plan to address these findings, with expected completion in August 2020 . Based on approval of this plan, implementation will occur by April 2021, as part of the regulatory assurance program .
Service Alberta
Improve recovery of critical information technology applications – Repeated
We again recommend that the Department of Service Alberta:
• identify the most critical IT applications throughout all government departments
• identify the timelines, after a disaster, that critical IT applications must be recovered
• ensure that there are tested plans and adequate resources to recover critical IT applications within those timelines .
Accepted. The department of Service Alberta has implemented IT disaster recovery services .
There are 1,328 applications in use across government . 113 of 164 applications identified by ministries as being critical meet the required support criteria . The department is working with ministries to either downgrade the criticality status of the remaining 51 applications, or work towards meeting the critical support criteria by November 2020 .