Embed Size (px)
Citation preview

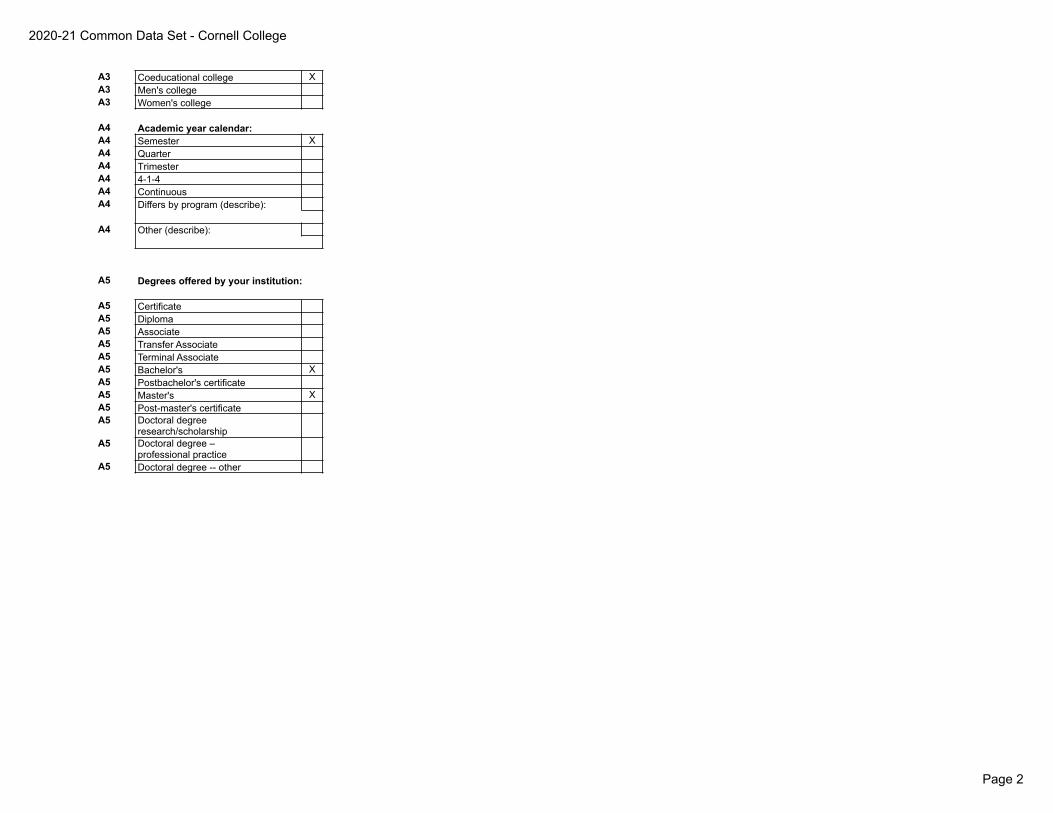
2020-21 Common Data Set - Cornell College
Page 1
A. General Information
A0 Respondent Information (Not for Publication)A0 Name: Angie Bauman PowerA0 Title: Director of Institutional EffectivenessA0 Office: Institutional EffectivenessA0 Mailing Address: 600 First Street SWA0 City/State/Zip/Country: Mount Vernon, IA, 52314A0 Phone: 319-895-4818A0 Fax: 319-895-5672A0 E-mail Address: [email protected] Are your responses to the CDS posted for reference on your institution's Web site? Yes No
A0 If yes, please provide the URL of the corresponding Web page:https://www.cornellcollege.edu/institutional-research/institutional-profile/Cornell%20College%202018-19%20Common%20Data%20Set.pdf
A0A We invite you to indicate if there are items on the CDS for which you cannot use the requested analytic convention, cannot provide data for the cohort requested, whose methodology is unclear, or about which you have questions or comments in general. This information will not be published but will help the publishers further refine CDS items.
A1 Address InformationA1 Name of College/University: Cornell CollegeA1 Mailing Address: 600 First Street SWA1 City/State/Zip/Country: Mount Vernon, IA 52314A1 Street Address (if different):A1 City/State/Zip/Country:A1 Main Phone Number: 319-895-4000A1 WWW Home Page Address: https://www.cornellcollege.edu/index.shtmlA1 Admissions Phone Number: 319-895-4477A1 Admissions Toll-Free Phone Number: 800 747-1112A1 Admissions Office Mailing Address: 600 First Street SWA1 City/State/Zip/Country: Mount Vernon, IA 52314A1 Admissions Fax Number: 319-895-4451A1 Admissions E-mail Address: [email protected] If there is a separate URL for your
school’s online application, please specify:
https://www.cornellcollege.edu/admissions/apply-to-cornell/index.shtml
A1 If you have a mailing address other than the above to which applications should be sent, please provide:
Peter Paul Luce Admission Center, 701 First Street NW, Mount Vernon, IA 52314-1098
A2 Source of institutional control (Check only one):A2 PublicA2 Private (nonprofit) XA2 Proprietary
A3 Classify your undergraduate institution:
2020-21 Common Data Set - Cornell College
Page 2
A3 Coeducational college XA3 Men's collegeA3 Women's college
A4 Academic year calendar:A4 Semester XA4 QuarterA4 TrimesterA4 4-1-4A4 ContinuousA4 Differs by program (describe):
A4 Other (describe):
A5 Degrees offered by your institution:
A5 CertificateA5 DiplomaA5 AssociateA5 Transfer AssociateA5 Terminal AssociateA5 Bachelor's XA5 Postbachelor's certificateA5 Master's XA5 Post-master's certificateA5 Doctoral degree
research/scholarshipA5 Doctoral degree –
professional practiceA5 Doctoral degree -- otherA5 Doctoral degree -- other

2020-21 Common Data Set - Cornell College
Page 3
B. ENROLLMENT AND PERSISTENCE
B1Institutional Enrollment - Men and Women Provide numbers of students for each of the following categories as of the institution's official fall reporting date or as of October 15, 2020. Note: Report students formerly designated as “first professional” in the graduate cells.
B1 FULL-TIME PART-TIMEB1 Men Women Men WomenB1 UndergraduatesB1 Degree-seeking, first-time freshmen 147 (143) (0) (0)B1 Other first-year, degree-seeking (14) (11) (0) (0)B1 All other degree-seeking (351) (325) (1) (4)B1 Total degree-seeking (512) (479) (1) (4)B1 All other undergraduates enrolled in credit
courses (1) (0) (0) (0)B1 Total undergraduates (513) (479) (1) (4)B1 GraduateB1 Degree-seeking, first-time 0 0 0 0B1 All other degree-seekingB1 All other graduates enrolled in credit courses 1 2 0 2B1 Total graduate 1 2 0 2B1 Total all undergraduates (997)B1 Total all graduate (5)B1 GRAND TOTAL ALL STUDENTS (1,002)
B2Enrollment by Racial/Ethnic Category. Provide numbers of undergraduate students for each of the following categories as of the institution's official fall reporting date or as of October 15, 2020. Include international students only in the category "Nonresident aliens." Complete the "Total Undergraduates" column only if you cannot provide data for the first two columns. Report as your institution reports to IPEDS: persons who are Hispanic should be reported only on the Hispanic line, not under any race, and persons who are non-Hispanic multi-racial should be reported only under "Two or more races."
B2Degree-Seeking
First-TimeFirst Year
Degree-SeekingUndergraduates (include first-time
first-year)
TotalUndergraduates (both degree-
and non-degree-seeking)
B2 Nonresident aliens (3) (45)B2 Hispanic/Latino (26) (73)B2 Black or African American, non-Hispanic (25) (64)B2 White, non-Hispanic (214) (738)B2 American Indian or Alaska Native, non-Hispanic (5) (10)B2 Asian, non-Hispanic (7) (23)B2
Native Hawaiian or other Pacific Islander, non-Hispanic(0) (2)
B2 Two or more races, non-Hispanic (5) (20)B2 Race and/or ethnicity unknown (5) (21)B2 TOTAL (290) (996)
PersistenceB3 Number of degrees awarded from July 1, 2019 to June 30, 2020B3 Certificate/diploma 0

2020-21 Common Data Set - Cornell College
Page 4
B3 Associate degrees 0B3 Bachelor's degrees 232B3 Postbachelor's certificates 0B3 Master's degrees 0B3 Post-Master's certificates 0B3 Doctoral degrees – research/scholarship 0B3 Doctoral degrees – professional practice 0B3 Doctoral degrees – other 0
Graduation Rates
The items in this section correspond to data elements collected by the IPEDS Web-based Data Collection System’s Graduation Rate Survey (GRS). For complete instructions and definitions of data elements, see the IPEDS GRS Forms and Instructions for the 2019-20Survey
For Bachelor's or Equivalent Institutions
In the following section for bachelor’s or equivalent programs, please disaggregate the Fall 2013 and Fall 2014 cohorts (formerly CDS B4-B11) into four groups:• Students who received a Federal Pell Grant*• Recipients of a subsidized Stafford Loan who did not receive a Pell Grant• Students who did not receive either a Pell Grant or a subsidized Stafford Loan• Total (all students, regardless of Pell Grant or subsidized loan status)*Students who received both a Federal Pell Grant and a subsidized Stafford Loan should be reported in the"Recipients of a Federal Pell Grant" column.For each graduation rate grid below, the numbers in the first three columns for Questions A-G should sum to thecohort total in the fourth column (formerly CDS B4-B11).
Fall 2014 Cohort
Recipients of a Federal
Pell Grant
Recipients of a Subsidized
Stafford Loan who did not
receive a Pell Grant
Students who did not receive
either a Pell Grant or a subsidized
Stafford Loan
Total (sum of 3 columes to
the left)
Formerly B4 A- Initital 2014 cohort of first-time, full-time bachelor's (or
equivalent) degree seeking undergraduate-students 72 79 111 262

2020-21 Common Data Set - Cornell College
Page 5
Formerly B5 B- Of the initial 2014 cohort, how many did not persist and did not
graduate for the following reasons: deceased, permanently disabled, armed forces, foreign aid service of the federal government, or official church missions; total allowable exclusions
0 0 1 1
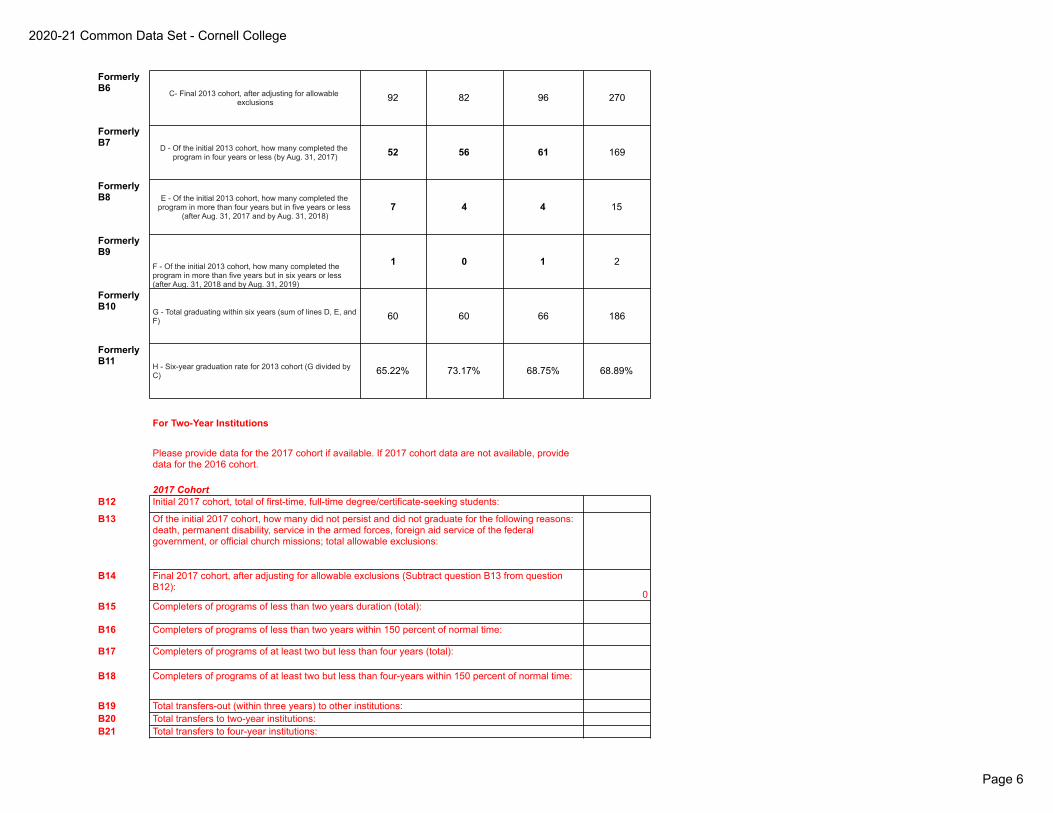
Formerly B6 C- Final 2014 cohort, after adjusting for allowable
exclusions 72 79 110 261
Formerly B7 D - Of the initial 2014 cohort, how many completed the
program in four years or less (by Aug. 31, 2018) 40 50 79 169
Formerly B8
E - Of the initial 2014 cohort, how many completed the program in more than four years but in five years or less (after Aug. 31, 2018 and by Aug. 31, 2019)
1 1 3 5
Formerly B9
F - Of the initial 2014 cohort, how many completed the program in more than five years but in six years or less (after Aug. 31, 2019 and by Aug. 31, 2020)
0 0 2 2
Formerly B10 G - Total graduating within six years (sum of lines D, E, and
F) 41 51 84 176
Formerly B11 H - Six-year graduation rate for 2014 cohort (G divided by
C) 56.94% 64.56% 76.36% 67.43%
Fall 2013 Cohort
Recipients of a Federal
Pell Grant
Recipients of a Subsidized
Stafford Loan who did not
receive a Pell Grant
Students who did not receive
either a Pell Grant or a subsidized
Stafford Loan
Total (sum of 3 columes to
the left)
Formerly B4 A- Initital 2013 cohort of first-time, full-time bachelor's (or
equivalent) degree seeking undergraduate-students 92 82 96 270
Formerly B5 B- Of the initial 2013 cohort, how many did not persist and did not
graduate for the following reasons: deceased, permanently disabled, armed forces, foreign aid service of the federal
government, or official church missions; total allowable exclusions0 0 0 0
2020-21 Common Data Set - Cornell College
Page 6
Formerly B6 C- Final 2013 cohort, after adjusting for allowable
exclusions 92 82 96 270
Formerly B7 D - Of the initial 2013 cohort, how many completed the
program in four years or less (by Aug. 31, 2017) 52 56 61 169
Formerly B8 E - Of the initial 2013 cohort, how many completed the
program in more than four years but in five years or less (after Aug. 31, 2017 and by Aug. 31, 2018)
7 4 4 15
Formerly B9
F - Of the initial 2013 cohort, how many completed the program in more than five years but in six years or less (after Aug. 31, 2018 and by Aug. 31, 2019)
1 0 1 2
Formerly B10 G - Total graduating within six years (sum of lines D, E, and
F) 60 60 66 186
Formerly B11 H - Six-year graduation rate for 2013 cohort (G divided by
C) 65.22% 73.17% 68.75% 68.89%
For Two-Year Institutions
Please provide data for the 2017 cohort if available. If 2017 cohort data are not available, provide data for the 2016 cohort.
2017 CohortB12 Initial 2017 cohort, total of first-time, full-time degree/certificate-seeking students:
B13 Of the initial 2017 cohort, how many did not persist and did not graduate for the following reasons: death, permanent disability, service in the armed forces, foreign aid service of the federal government, or official church missions; total allowable exclusions:
B14 Final 2017 cohort, after adjusting for allowable exclusions (Subtract question B13 from question B12):
0B15 Completers of programs of less than two years duration (total):
B16 Completers of programs of less than two years within 150 percent of normal time:
B17 Completers of programs of at least two but less than four years (total):
B18 Completers of programs of at least two but less than four-years within 150 percent of normal time:
B19 Total transfers-out (within three years) to other institutions: B20 Total transfers to two-year institutions: B21 Total transfers to four-year institutions:

2020-21 Common Data Set - Cornell College
Page 7
2016 CohortB12 Initial 2016 cohort, total of first-time, full-time degree/certificate-seeking students:
B13 Of the initial 2016 cohort, how many did not persist and did not graduate for the following reasons: death, permanent disability, service in the armed forces, foreign aid service of the federal government, or official church missions; total allowable exclusions:
B14 Final 2016 cohort, after adjusting for allowable exclusions (Subtract question B13 from question B12):
0B15 Completers of programs of less than two years duration (total): B16 Completers of programs of less than two years within 150 percent of normal time: B17 Completers of programs of at least two but less than four years (total):
B18 Completers of programs of at least two but less than four-years within 150 percent of normal time:
B19 Total transfers-out (within three years) to other institutions: B20 Total transfers to two-year institutions: B21 Total transfers to four-year institutions:
Retention RatesReport for the cohort of all full-time, first-time bachelor’s (or equivalent) degree-seeking undergraduate students who entered in Fall 2019 (or the preceding summer term). The initial cohort may be adjusted for students who departed for the following reasons: death, permanent disability, service in the armed forces, foreign aid service of the federal government or official church missions. No other adjustments to the initial cohort should be made.
B22 For the cohort of all full-time bachelor’s (or equivalent) degree-seeking undergraduate students who entered your institution as freshmen in Fall 2018 (or the preceding summer term), what percentage was enrolled at your institution as of the date your institution calculates its official enrollment in Fall 2020?
65%
74%

2020-21 Common Data Set - Cornell College
Page 8
D. FIRSTIME, FIRST YEAR (FRESHMAN) ADMISSIONC1-C2: Applications
C1 First-time, first-year (freshman) students: Provide the number of degree-seeking, first-time, first-year students who applied, were admitted, and enrolled (full- or part-time) in Fall 2020.
• Include early decision, early action, and students who began studies during summer in this cohort.• Applicants should include only those students who fulfilled the requirements for consideration for
admission (i.e., who completed actionable applications) and who have been notified of one of thefollowing actions: admission, non-admission, placement on waiting list, or application withdrawn (byapplicant or institution).
• Admitted applicants should include wait-listed students who were subsequently offered admission.Total first-time, first-year (freshman) men who applied 1165Total first-time, first-year (freshman) women who applied 1450
Total first-time, first-year (freshman) men who were admitted 920Total first-time, first-year (freshman) women who were admitted 1235
Total full-time, first-time, first-year (freshman) men who enrolled 148Total part-time, first-time, first-year (freshman) men who enrolled N/A
Total full-time, first-time, first-year (freshman) women who enrolled 142Total part-time, first-time, first-year (freshman) women who enrolled N/A
C2 Freshman wait-listed students
Students who met admission requirements but whose final admission was contingent on space availability
Yes NoDo you have a policy of placing students on a waiting list? X
If yes, please answer the questions below for Fall 2020 admissions:
WAITING LIST TOTALNumber of qualified applicants offered a place on waiting list: 0Number accepting a place on the waiting list:Number of wait-listed students admitted:
Yes NoIs your waiting list ranked? NoIf yes, do you release that information to students?
Do you release that information to school counselors?
C3-C5: Admission Requirements
C3 High school completion requirementCheck the appropriate box to identify your high school completion requirement for degree-seeking entering students:High school diploma is required and GED is accepted
2020-21 Common Data Set - Cornell College
Page 9
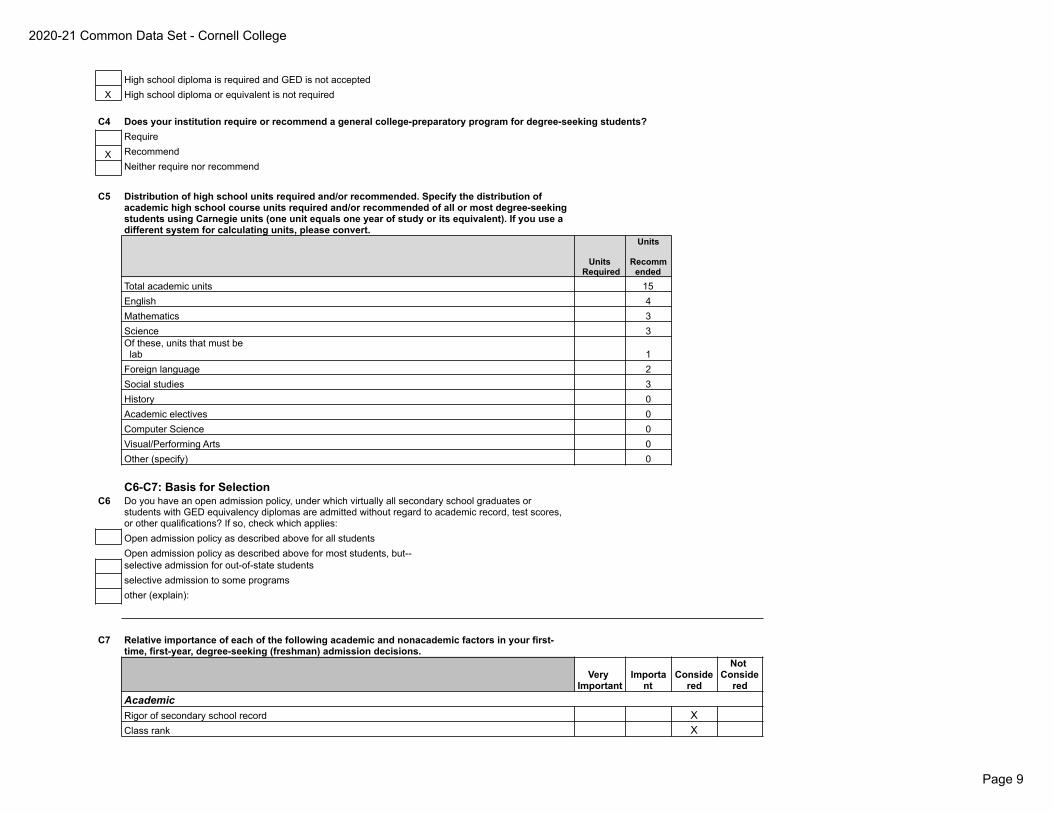
High school diploma is required and GED is not acceptedX High school diploma or equivalent is not required
C4 Does your institution require or recommend a general college-preparatory program for degree-seeking students?Require
X RecommendNeither require nor recommend
C5 Distribution of high school units required and/or recommended. Specify the distribution of academic high school course units required and/or recommended of all or most degree-seeking students using Carnegie units (one unit equals one year of study or its equivalent). If you use a different system for calculating units, please convert.
Units Required
Units
Recommended
Total academic units 15English 4Mathematics 3Science 3Of these, units that must be lab 1Foreign language 2Social studies 3History 0Academic electives 0Computer Science 0Visual/Performing Arts 0Other (specify) 0
C6-C7: Basis for SelectionC6 Do you have an open admission policy, under which virtually all secondary school graduates or
students with GED equivalency diplomas are admitted without regard to academic record, test scores, or other qualifications? If so, check which applies:Open admission policy as described above for all studentsOpen admission policy as described above for most students, but--selective admission for out-of-state studentsselective admission to some programsother (explain):
C7 Relative importance of each of the following academic and nonacademic factors in your first-time, first-year, degree-seeking (freshman) admission decisions.
Very Important
Important
Considered
Not Conside
redAcademicRigor of secondary school record XClass rank X

2020-21 Common Data Set - Cornell College
Page 10
Academic GPA XStandardized test scores XApplication Essay XRecommendation(s) XNonacademicInterview XExtracurricular activities XTalent/ability XCharacter/personal qualities XFirst generation XAlumni/ae relation XGeographical residence XState residency XReligious affiliation/commitment XRacial/ethnic status XVolunteer work XWork experience XLevel of applicant’s interest X
C8: SAT and ACT PoliciesEntrance exams
Yes NoDoes your institution make use of SAT, ACT, or SAT Subject Test scores in admission decisions for first-time, first-year, degree-seeking applicants? X
C8A If yes, place check marks in the appropriate boxes below to reflect your institution’s policies for use in admission for Fall 2022.ADMISSION
Require Recommend
Require for Some
Consider if
Submitted
Not Used
SAT or ACT XACT OnlySAT OnlySAT and SAT Subject Tests or ACT
SAT Subject Tests
C8B If your institution will make use of the ACT in admission decisions for first-time, first-year, degree-seeking applicants for Fall 2022 please indicate which ONE of the following applies (regardless of whether the writing score will be used in the admissions process):
ACT with writing requiredACT with writing recommended
X ACT with or without writing accepted

2020-21 Common Data Set - Cornell College
Page 11
C8B If your institution will make use of the SAT in admission decisions for first-time, first-year, degree-seeking applicants for Fall 2022 please indicate which ONE of the following applies (regardless of whether the Essay score will be used in the admissions process):
SAT with Essay component requiredSAT with Essay component recommended
X SAT with or without Essay component accepted
C8C Please indicate how your institution will use the SAT or ACT essay component; check all that apply.
SAT essay
ACT essay
For admissionFor placementFor advising
In place of an application essayAs a validity check on the application processNo college policy as of nowNot using essay component X X
C8D In addition, does your institution use applicants' test scores for academic advising?
X YesNo
C8E Latest date by which SAT or ACT scores must be received for fall-term admission August 1,2020Latest date by which SAT Subject Test scores must be received for fall-term admission N/A
C8F If necessary, use this space to clarify your test policies (e.g., if tests are recommended for some students, or if tests are not required of some students): Students may apply without a
test score. They must also submit 2 short answer questions and portfolio.
C8G Please indicate which tests your institution uses for placement (e.g., state tests):
SATACTSAT Subject TestsAPCLEPInstitutional ExamState Exam (specify):

2020-21 Common Data Set - Cornell College
Page 12
C9-C12: Freshman ProfileProvide information for ALL enrolled, degree-seeking, full-time and part-time, first-time, first-year (freshman) students enrolled in Fall 2020, including students who began studies during summer, international students/nonresident aliens, and students admitted under special arrangements.
C9 Percent and number of first-time, first-year (freshman) students enrolled in Fall 2020 who submitted national standardized (SAT/ACT) test scores.• Include information for ALL enrolled, degree-seeking, first-time, first-year (freshman) students
who submitted test scores.• Do not include partial test scores (e.g., mathematics scores but not critical reading for a category of
students) or combine other standardized test results (such as TOEFL) in this item.• Do not convert SAT scores to ACT scores and vice versa.• If a student submitted multiple sets of scores for a single test, report this information according to how
you use the data. For example:• If you consider the highest scores from either submission, use the highest combination of scores
(e.g., verbal from one submission, math from the other).• If you average the scores, use the average to report the scores.
Percent NumberSubmitting SAT Scores 35.89% 84Submitting ACT Scores 67.52% 158
For each assessment listed below, report the score that represents the 25th percentile (the score that 25 percent of the freshman population scored at or below) and the 75th percentile score (the score that 25 percent scored at or above).
Assessment
25th Percentil
e
75th Percenti
leSAT Composite 1080 1253SAT Evidence-Based Reading and Writing 548 650SAT Math 520 630ACT Composite 23 29ACT Math 22 27ACT English 21 30ACT Reading 24 33ACT Science 24 28ACT Writing N/A N/A
Percent of first-time, first-year (freshman) students with scores in each range:
Score Range
SAT Evidence-
Based Reading
and Writing
SAT Math

2020-21 Common Data Set - Cornell College
Page 13
700-800 8.33% 9.52%600-699 41.67% 28.60%500-599 38.09% 50%400-499 10.71% 11.88%300-399 1.20%200-299
Totals should = 100% 0.00% 0.00%
Score Range
SAT Composit
e1400-1600 7.14%
1200-1399 34.52%
1000-1199 46.43%
800-999 10.71%
600-799 1.20%
400-599Totals should = 100% 100.00%
Score Range
ACT Composit
eACT
EnglishACT Math
ACT Reading ACT Science
30-36 23.42% 31.01% 12.03% 50% 22.15%24-29 46.20% 28.48% 51.90% 27.85% 53.16%18-23 29.74% 32.28% 26.58% 18.99% 20.89%12-17 0.64% 8.23% 9.49% 3.16% 3.80%6-11
Below 6Totals should = 100% 0.00% 0.00% 0.00% 0.00% 0.00%
C10 Percent of all degree-seeking, first-time, first-year (freshman) students who had high school class rank within each of the following ranges (report information for those students from whom you collected high school rank information)
Assessment PercentPercent in top tenth of high school graduating class 19.75%Percent in top quarter of high school graduating class 46.21%Percent in top half of high school graduating class
81.06%Top half +
Percent in bottom half of high school graduating class 18.94% bottom half = 100%Percent in bottom quarter of high school graduating class 5.30%Percent of total first-time, first-year (freshmen) students who submitted high school class rank: 45.51%
C11 Percentage of all enrolled, degree-seeking, first-time, first-year (freshman) students who had high school grade-point averages within each of the following ranges (using 4.0 scale). Report information only for those students from whom you collected high school GPA.
Score Range Percent
Percent who had GPA of 4.0 37.24%Percent who had GPA between 3.75 and 3.99 18.28%Percent who had GPA between 3.50 and 3.74 16.55%

2020-21 Common Data Set - Cornell College
Page 14
Percent who had GPA between 3.25 and 3.49 13.45%Percent who had GPA between 3.00 and 3.24 12.76%Percent who had GPA between 2.50 and 2.99 1.72%Percent who had GPA between 2.0 and 2.49Percent who had GPA between 1.0 and 1.99Percent who had GPA below 1.0
Totals should = 100% 100.00%
C12 Average high school GPA of all degree-seeking, first-time, first-year (freshman) students who submitted GPA: 3.50Percent of total first-time, first-year (freshman) students who submitted high school GPA: 100.00%
C13-C20: Admission Policies
C13 Application FeeIf your institution has waived its application fee for the Fall 2021 admission cycle please select no.
Yes NoDoes your institution have an application fee? X
Amount of application fee:
Yes NoCan it be waived for applicants with financial need?
If you have an application fee and an on-line application option, please indicate policy for students who apply on-line:
Same feeFreeReduced
Yes NoCan on-line application fee be waived for applicants with financial need?
C14 Application closing dateYes No
Does your institution have an application closing date? X
Date
Application closing date (fall)Priority Date
Yes NoC15 Are first-time, first-year students accepted for terms other than the fall? X

2020-21 Common Data Set - Cornell College
Page 15
C16 Notification to applicants of admission decision sent (fill in one only)
X On a rolling basis beginning (date):
By (date):Other:
C17 Reply policy for admitted applicants (fill in one only)
Must reply by (date):
No set date
X Must reply by May 1st or within 2weeks if notified thereafter
Other:
Deadline for housing deposit (MMDD):Amount of housing deposit:
Refundable if student does not enroll?
Yes, in fullYes, in partNo
C18 Deferred admissionYes NoX
If yes, maximum period of postponement: 2
C19 Early admission of high school studentsYes No
Does your institution allow high school students to enroll as full-time, first-time, first-year (freshman) students one year or more before high school graduation? X
C20 Common Application: Question removed from CDS. (Initiated during 2006-2007 cycle)
C21-C22: Early Decision and Early Action Plans
C21 Early DecisionYes No
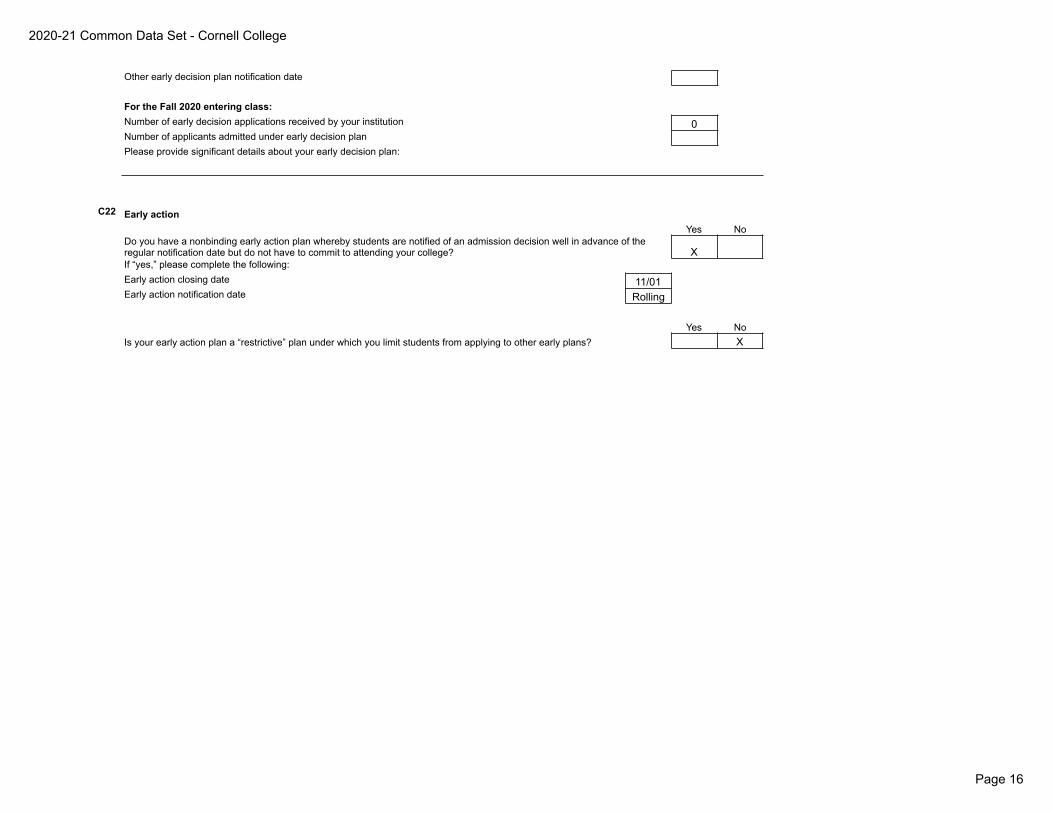
Does your institution offer an early decision plan (an admission plan that permits students to apply and be notified of an admission decision well in advance of the regular notification date and that asks students to commit to attending if accepted) for first-time, first-year (freshman) applicants for fall enrollment? XIf “yes,” please complete the following:First or only early decision plan closing dateFirst or only early decision plan notification dateOther early decision plan closing date
2020-21 Common Data Set - Cornell College
Page 16
Other early decision plan notification date
For the Fall 2020 entering class:Number of early decision applications received by your institution 0Number of applicants admitted under early decision planPlease provide significant details about your early decision plan:
C22 Early actionYes No
Do you have a nonbinding early action plan whereby students are notified of an admission decision well in advance of the regular notification date but do not have to commit to attending your college? XIf “yes,” please complete the following:Early action closing date 11/01Early action notification date Rolling
Yes NoIs your early action plan a “restrictive” plan under which you limit students from applying to other early plans? X

2020-21 Common Data Set - Cornell College
Page 17
D. TRANSFER ADMISSION
D1-D2: Fall ApplicantsYes No
D1 Does your institution enroll transfer students? (If no, please skip to Section E) XIf yes, may transfer students earn advanced standing credit by transferring credits earned from course work completed at other colleges/universities? X
D2 Provide the number of students who applied, were admitted, and enrolled as degree-seeking transfer students in Fall 2020.
ApplicantsAdmitted Applicants Enrolled Applicants
Men 47 35 14Women 51 45 11Total 98 80 25
D3-D11: Application for AdmissionD3 Indicate terms for which transfers may enroll:
X FallWinter
X SpringSummer
Yes NoD4 Must a transfer applicant have a minimum number of
credits completed or else must apply as an entering freshman? XIf yes, what is the minimum number of credits and the unit of measure?
D5 Indicate all items required of transfer students to apply for admission:
Required of AllRecommended
of AllRecommended
of Some Required of Some Not RequiredHigh school transcript XCollege transcript(s) XEssay or personal statement XInterview XStandardized test scores XStatement of good standing from prior institution(s) X

2020-21 Common Data Set - Cornell College
Page 18
D6 If a minimum high school grade point average is required of transfer applicants, specify (on a 4.0 scale):
D7 If a minimum college grade point average is required of transfer applicants, specify (on a 4.0 scale):
D8 List any other application requirements specific to transfer applicants:
D9 List application priority, closing, notification, and candidate reply dates for transfer students. If applications are reviewed on a continuous or rolling basis, place a check mark in the “Rolling admission” column.
D9 Priority Date Closing Date Notification Date Reply Date Rolling AdmissionD9 Fall 03/01 06/01 XD9 WinterD9 Spring 12/01 12/15D9 Summer
Yes NoD10 Does an open admission policy, if reported, apply to
transfer students? X
D11 Describe additional requirements for transfer admission, if applicable:
D12-D17: Transfer Credit Policies
D12 Report the lowest grade earned for any course that may be transferred for credit: C
Number Unit TypeD13 Maximum number of credits or courses that may be
transferred from a two-year institution: 64 sem hours
Number Unit TypeD14 Maximum number of credits or courses that may be
transferred from a four-year institution:
**see note semester
**note: no maximum- last 8 Cornell credits must be taken at Cornell
D15 Minimum number of credits that transfers must complete at your institution to earn an associate degree:
2020-21 Common Data Set - Cornell College
Page 19
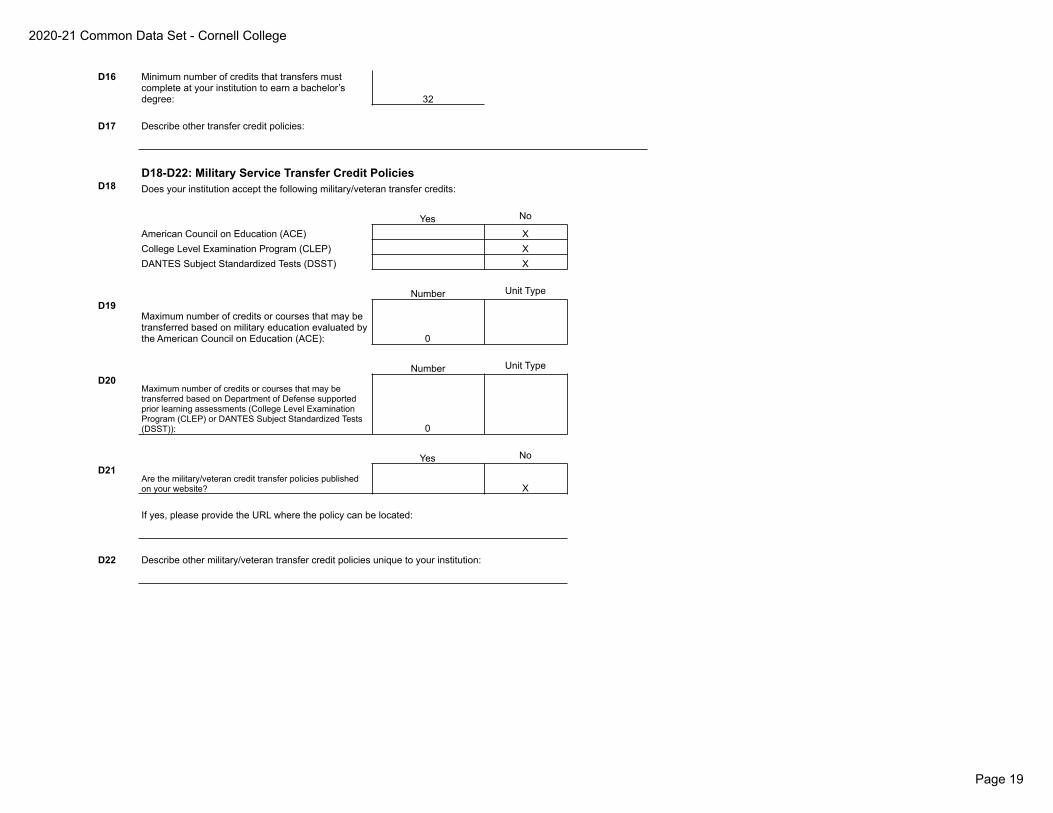
D16 Minimum number of credits that transfers must complete at your institution to earn a bachelor’s degree: 32
D17 Describe other transfer credit policies:
D18-D22: Military Service Transfer Credit PoliciesD18 Does your institution accept the following military/veteran transfer credits:
Yes No
American Council on Education (ACE) XCollege Level Examination Program (CLEP) XDANTES Subject Standardized Tests (DSST) X
Number Unit TypeD19
Maximum number of credits or courses that may be transferred based on military education evaluated by the American Council on Education (ACE): 0
Number Unit TypeD20
Maximum number of credits or courses that may be transferred based on Department of Defense supported prior learning assessments (College Level Examination Program (CLEP) or DANTES Subject Standardized Tests (DSST)): 0
Yes NoD21
Are the military/veteran credit transfer policies published on your website? X
If yes, please provide the URL where the policy can be located:
D22 Describe other military/veteran transfer credit policies unique to your institution:

2020-21 Common Data Set - Cornell College
Page 20
E. ACADEMIC OFFERINGS AND POLICIES
E1 Special study options: Identify those programs available at your institution. Refer to the glossary for definitions.
Accelerated programCooperative education programCross-registrationDistance learning
X Double majorDual enrollmentEnglish as a Second Language (ESL)Exchange student program (domestic)External degree programHonors Program
X Independent studyX Internships
Liberal arts/career combinationX Student-designed majorX Study abroadX Teacher certification program
Weekend collegeOther (specify):
E2 Has been removed from the CDS.
E3 Areas in which all or most students are required to complete some course work prior to graduation:
X Arts/fine artsComputer literacy
X English (including composition)X Foreign languages
HistoryX HumanitiesX Mathematics
PhilosophyX Sciences (biological or physical)X Social science
Other (describe):

2020-21 Common Data Set - Cornell College
Page 21
F. STUDENT LIFEF1 Percentages of first-time, first-year (freshman) degree-seeking students and degree-
seeking undergraduates enrolled in Fall 2020 who fit the following categories:
First-time, first-year (freshman)
studentsAdmitted
ApplicantsPercent who are from out of state (exclude international/nonresident aliens from the numerator and denominator) 76%Percent of men who join fraternities 0%Percent of women who join sororities 0%Percent who live in college-owned, -operated, or -affiliated housing 93%Percent who live off campus or commute 7%Percent of students age 25 and older 0%Average age of full-time students 20Average age of all students (full- and part-time) 20
F2 Activities offered. Identify those programs available at your institution.
X Campus MinistriesX Choral groupsX Concert bandX DanceX Drama/theaterX International Student OrganizationX Jazz bandX Literary magazine
Marching bandModel UN
X Music ensemblesX Musical theater
OperaPep band
X Radio stationX Student governmentX Student newspaper
Student-run film societyX Symphony orchestra
Television station
X Yearbook
F3 ROTC (program offered in cooperation with Reserve Officers' Training Corps)
On CampusAt Cooperating
InstitutionName of Cooperating
InstitutionArmy ROTC is offered:Naval ROTC is offered:Air Force ROTC is offered:

2020-21 Common Data Set - Cornell College
Page 22
F4 Housing: Check all types of college-owned, -operated, or -affiliated housing available for undergraduates at your institution.
X Coed dormsMen's dorms
X Women's dormsApartments for married students
XApartments for single students
Special housing for disabled studentsSpecial housing for international studentsFraternity/sorority housingCooperative housing
XTheme housing
X Wellness housing

2020-21 Common Data Set - Cornell College
Page 23
G. ANNUAL EXPENSES
G0 Please provide the URL of your institution’s net price calculator:
Provide 2021-2022 academic year costs of attendance for the following categories that are applicable to your institution.
Check here if your institution's 2021-2022 academic year costs of attendance are not available at this time and provide an approximate date (i.e., month/day) when your institution's final 2021-2022 academic year costs of attendance will be available:
G1 Undergraduate full-time tuition, required fees, room and board List the typical tuition, required fees, and room and board for a full-time undergraduate student for the FULL 2021-2022 academic year (30 semester or 45 quarter hours for institutions that derive annual tuition by multiplying credit hour cost by number of credits). A full academic year refers to the period of time generally extending from September to June; usually equated to two semesters, two trimesters, three quarters, or the period covered by a four-one-four plan. Room and board is defined as double occupancy and 19 meals per week or the maximum meal plan. Required fees include only charges that all full-time students must pay that are not included in tuition (e.g., registration, health, or activity fees.) Do not include optional fees (e.g., parking, laboratory use).
G1 First-Year UndergraduatesG1 PRIVATE INSTITUTIONS
Tuition: $47,100 $47,100G1 PUBLIC INSTITUTIONS
Tuition: In-district
G1 PUBLIC INSTITUTIONS In-state (out-of-district):
G1 PUBLIC INSTITUTIONS Out-of-state:
G1 NONRESIDENT ALIENSTuition:
G1 REQUIRED FEES: $626 $626
G1 ROOM AND BOARD:(on-campus) $10,556 $10,556
G1 ROOM ONLY:(on-campus) $4,868 $4,868
G1 BOARD ONLY:(on-campus meal plan) $5,688 $5,688
G1 Comprehensive tuition and room and board fee (if your college cannot provide separate tuition and room and board fees):
G1 Other:
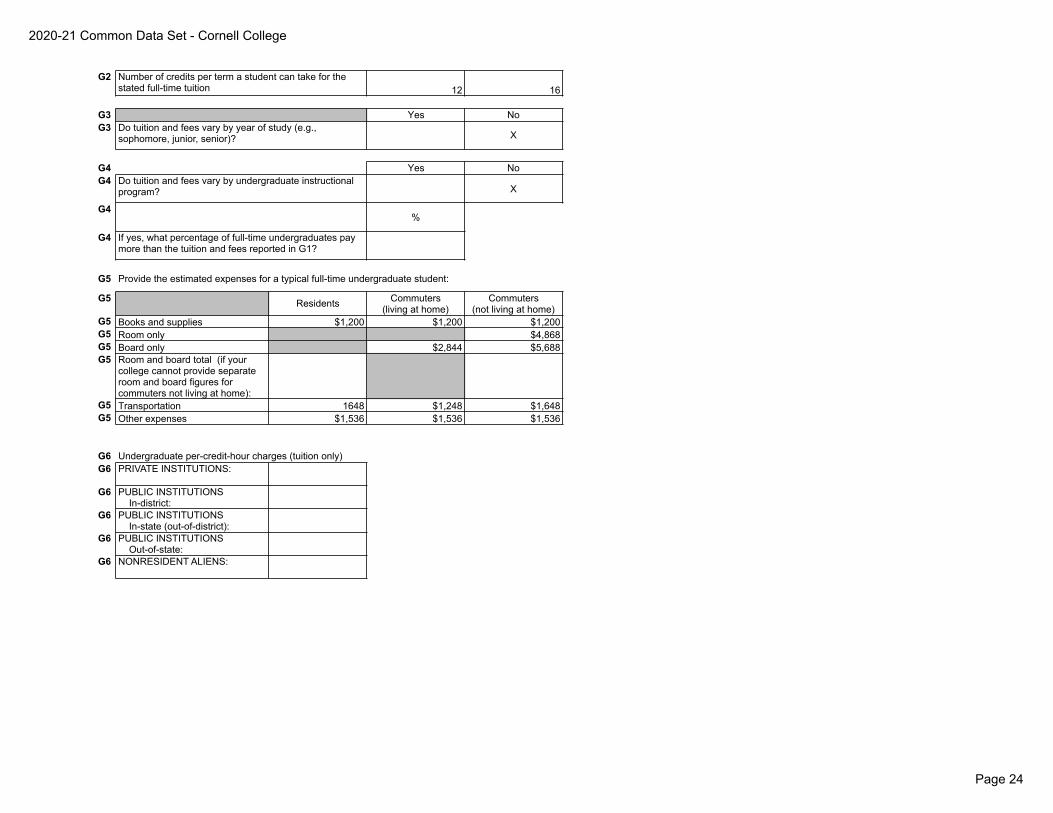
G2 Minimum Maximum
2020-21 Common Data Set - Cornell College
Page 24
G2 Number of credits per term a student can take for the stated full-time tuition 12 16
G3 Yes NoG3 Do tuition and fees vary by year of study (e.g.,
sophomore, junior, senior)? X
G4 Yes NoG4 Do tuition and fees vary by undergraduate instructional
program? X
G4%
G4 If yes, what percentage of full-time undergraduates pay more than the tuition and fees reported in G1?
G5 Provide the estimated expenses for a typical full-time undergraduate student:
G5 Residents Commuters(living at home)
Commuters(not living at home)
G5 Books and supplies $1,200 $1,200 $1,200G5 Room only $4,868G5 Board only $2,844 $5,688G5 Room and board total (if your
college cannot provide separate room and board figures for commuters not living at home):
G5 Transportation 1648 $1,248 $1,648G5 Other expenses $1,536 $1,536 $1,536
G6 Undergraduate per-credit-hour charges (tuition only)G6 PRIVATE INSTITUTIONS:
G6 PUBLIC INSTITUTIONS In-district:
G6 PUBLIC INSTITUTIONS In-state (out-of-district):
G6 PUBLIC INSTITUTIONS Out-of-state:
G6 NONRESIDENT ALIENS:

2020-21 Common Data Set - Cornell College
Page 25
H. FINANCIAL AID
Aid Awarded to Enrolled UndergraduatesEnter total dollar amounts awarded to enrolled full-time and less than full-time degree-seeking undergraduates (using the same cohort reported in CDS Question B1, “total degree-seeking” undergraduates) in the following categories. (Note: If the data being reported are final figures for the 2019-2020 academic year (see the next item below), use the 2019-2020 academic year's CDS Question B1 cohort.) Include aid awarded to international students (i.e., those not qualifying for federal aid). Aid that is non-need-based but that was used to meet need should be reported in the need-based aid columns. (For a suggested order of precedence in assigning categories of aid to cover need, see the entry for “non-need-based scholarship or grant aid” on the last page of the definitions section.)
H1 2020-2021 estimated
2019-2020final
H1 Indicate the academic year for which data are reported for items H1, H2, H2A, and H6 below: X
H3 Which needs-analysis methodology does your institution use in awarding institutional aid?H3 Federal methodology (FM) XH3 Institutional methodology (IM)H3 Both FM and IM
H1 Need-based $ (Include non-need-based aid used to
meet need.)
Non-need-based $ (Exclude non-
need-based aid used to meet need.)
H1 Scholarships/GrantsH1 Federal $1,291,333) $0)H1 State (i.e., all states, not only the state in which your institution is
located) $755,644) $13,200)H1 Institutional: Endowed scholarships, annual gifts and tuition funded
grants, awarded by the college, excluding athletic aid and tuition waivers (which are reported below). $18,762,317) $9,022,800)
H1 Scholarships/grants from external sources (e.g., Kiwanis, National Merit) not awarded by the college $306,074) $102,785)
H1 Total Scholarships/Grants $21,115,368 $9,138,785H1 Self-HelpH1 Student loans from all sources (excluding parent loans) $3,260,971 $2,118,731H1 Federal Work-Study $462,450H1 State and other (e.g., institutional) work-study/employment (Note:
Excludes Federal Work-Study captured above.) $129,550H1 Total Self-Help $3,723,421 $2,248,281H1 OtherH1 Parent Loans $633,424 $746,137H1 Tuition Waivers
Reporting is optional. Report tuition waivers in this row if you choose to report them. Do not report tuition waivers elsewhere. $965,962 $910,637
H1 Athletic Awards $0 $0

2020-21 Common Data Set - Cornell College
Page 26
H2 Number of Enrolled Students Awarded Aid: List the number of degree-seeking full-time and less-than-full-time undergraduates who applied for and were awarded financial aid from any source. Aid that is non-need-based but that was used to meet need should be counted as need-based aid. Numbers should reflect the cohort awarded the dollars reported in H1. Note: In the chart below, students may be counted in more than one row, and full-time freshmen should also be counted as full-time undergraduates.
H2 First-timeFull-time
Freshmen
Full-timeUndergraduate
(Incl. Fresh.)
Less ThanFull-time
UndergraduateH2 a) Number of degree-seeking undergraduate students
(CDS Item B1 if reporting on Fall 2018 cohort) 290 991 5
H2 b) Number of students in line a who applied for need-based financial aid 266 796
H2 c) Number of students in line b who were determined to have financial need 226 729 3
H2 d) Number of students in line c who were awarded any financial aid 226 702 3
H2 e) Number of students in line d who were awarded any need-based scholarship or grant aid 226 702 3
H2 f) Number of students in line d who were awarded any need-based self-help aid 142 491 2
H2 g) Number of students in line d who were awarded any non-need-based scholarship or grant aid 61 151 1
H2 h) Number of students in line d whose need was fully met (exclude PLUS loans, unsubsidized loans, and private alternative loans)
74 192 1
H2 i) On average, the percentage of need that was met of students who were awarded any need-based aid. Exclude any aid that was awarded in excess of need as well as any resources that were awarded to replace EFC (PLUS loans, unsubsidized loans, and private alternative loans)
87.77% 83.31% 75.75%
H2 j) The average financial aid package of those in line d. Exclude any resources that were awarded to replace EFC (PLUS loans, unsubsidized loans, and private alternative loans)
$38,042 $35,006 $10,208
H2 k) Average need-based scholarship and grant award of those in line e $35,387 $31,437 $7,708
H2 l) Average need-based self-help award (excluding PLUS loans, unsubsidized loans, and private alternative loans) of those in line f
$4,285 $4,960 $1,833
H2 m) Average need-based loan (excluding PLUS loans, unsubsidized loans, and private alternative loans) of those in line f who were awarded a need-based loan
$3,371 $4,424 $1,833
H2A Number of Enrolled Students Awarded Non-need-based Scholarships and Grants: List the number of degree-seeking full-time and less-than-full-time undergraduates who had no financial need and who were awarded institutional non-need-based scholarship or grant aid. Numbers should reflect the cohort awarded the dollars reported in H1. Note: In the chart below, students may be counted in more than one row, and full-time freshmen should also be counted as full-time undergraduates.
H2A First-timeFull-time
Freshmen
Full-timeUndergrad
(Incl. Fresh.)
Less ThanFull-time
UndergradH2A n) Number of students in line a who had no financial
need and who were awarded institutional non-need-based scholarship or grant aid (exclude those who were awarded athletic awards and tuition benefits)
64 281 0
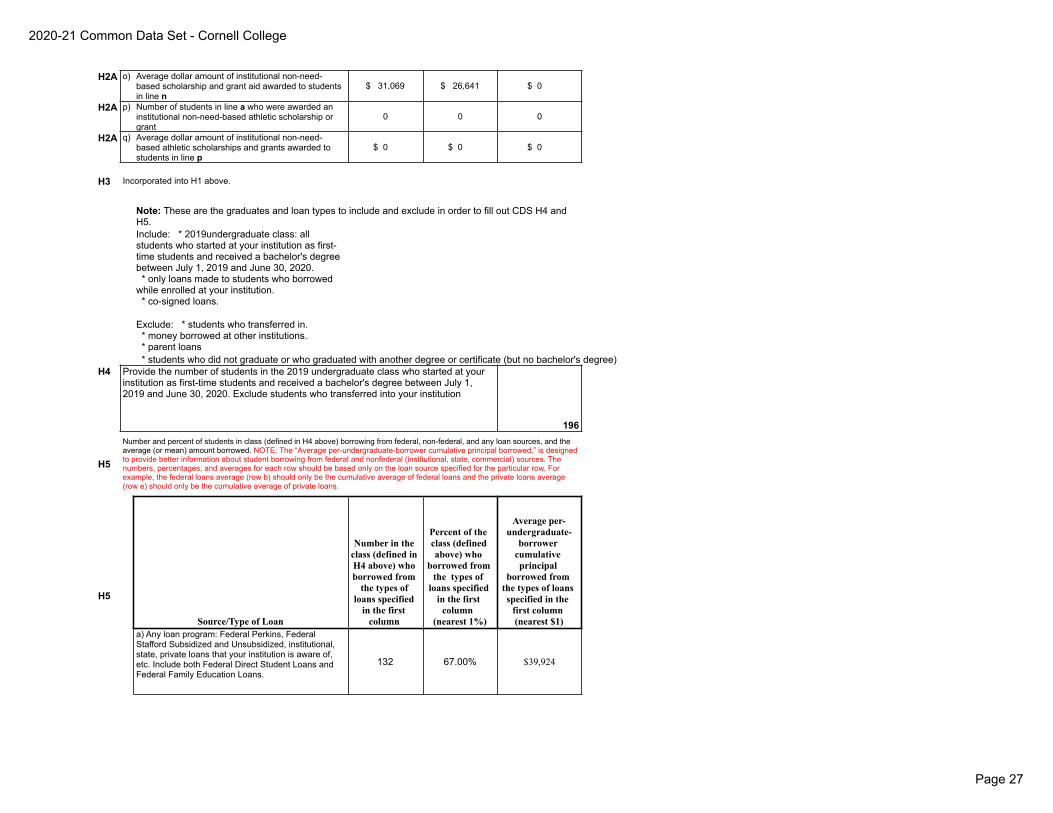
2020-21 Common Data Set - Cornell College
Page 27
H2A o) Average dollar amount of institutional non-need-based scholarship and grant aid awarded to students in line n
($ 31,069) ($ 26,641) ($ 0 )
H2A p) Number of students in line a who were awarded an institutional non-need-based athletic scholarship or grant
0 0 0
H2A q) Average dollar amount of institutional non-need-based athletic scholarships and grants awarded to students in line p
($ 0 ) ($ 0 ) ($ 0 )
H3 Incorporated into H1 above.
Note: These are the graduates and loan types to include and exclude in order to fill out CDS H4 and H5. Include: * 2019undergraduate class: all students who started at your institution as first- time students and received a bachelor's degree between July 1, 2019 and June 30, 2020.
* only loans made to students who borrowedwhile enrolled at your institution.
* co-signed loans.
Exclude: * students who transferred in.* money borrowed at other institutions.* parent loans* students who did not graduate or who graduated with another degree or certificate (but no bachelor's degree)
H4 Provide the number of students in the 2019 undergraduate class who started at your institution as first-time students and received a bachelor's degree between July 1, 2019 and June 30, 2020. Exclude students who transferred into your institution
196
H5
Number and percent of students in class (defined in H4 above) borrowing from federal, non-federal, and any loan sources, and the average (or mean) amount borrowed. NOTE: The “Average per-undergraduate-borrower cumulative principal borrowed,” is designed to provide better information about student borrowing from federal and nonfederal (institutional, state, commercial) sources. The numbers, percentages, and averages for each row should be based only on the loan source specified for the particular row. For example, the federal loans average (row b) should only be the cumulative average of federal loans and the private loans average (row e) should only be the cumulative average of private loans.
Source/Type of Loan
Number in the class (defined in H4 above) who borrowed from
the types of loans specified
in the first column
Percent of the class (defined above) who
borrowed from the types of
loans specified in the first
column (nearest 1%)
Average per-undergraduate-
borrower cumulative principal
borrowed from the types of loans specified in the
first column (nearest $1)
H5
a) Any loan program: Federal Perkins, Federal Stafford Subsidized and Unsubsidized, institutional, state, private loans that your institution is aware of, etc. Include both Federal Direct Student Loans and Federal Family Education Loans.
132 67.00% $39,924

2020-21 Common Data Set - Cornell College
Page 28
b) Federal loan programs: Federal Perkins, Federal Stafford Subsidized and Unsubsidized. Include both Federal Direct Student Loans and Federal Family Education Loans.
132 67.00% $26,297
c) Institutional loan programs. 23 12.00% $2,712
d) State loan programs. 0 0.00% $0
e) Private student loans made by a bank orlender. 38 19.00% $45,694
Aid to Undergraduate Degree-seeking Nonresident Aliens (Note: Report numbers anddollar amounts for the same academic year checked in item H1.)
H6 Indicate your institution’s policy regarding institutional scholarship and grant aid for undergraduate degree-seeking nonresident aliens:
H6 Institutional need-based scholarship or grant aid is availableH6 Institutional non-need-based scholarship or grant aid is available XH6 Institutional scholarship or grant aid is not available
H6 If institutional financial aid is available for undergraduate degree-seeking nonresident aliens, provide the number of undergraduate degree-seeking nonresident aliens who were awarded need-based or non-need-based aid: 44
H6 Average dollar amount of institutional financial aid awarded to undergraduate degree-seeking nonresident aliens: $24,159
H6 Total dollar amount of institutional financial aid awarded to undergraduate degree-seeking nonresident aliens: $1,062,986
H7 Check off all financial aid forms nonresident alien first-year financial aid applicants must submit:H7 Institution’s own financial aid formH7 CSS/Financial Aid PROFILEH7 International Student’s Financial Aid ApplicationH7 International Student’s Certification of Finances XH7 Other (specify):
Process for First-Year/Freshman Students

2020-21 Common Data Set - Cornell College
Page 29
H8 Check off all financial aid forms domestic first-year (freshman) financial aid applicants must submit:H8 FAFSA XH8 Institution's own financial aid formH8 CSS/Financial Aid PROFILEH8 State aid formH8 Noncustodial PROFILEH8 Business/Farm SupplementH8 Other (specify):
H9 Indicate filing dates for first-year (freshman) students:H9 Priority date for filing required financial aid forms: 3/1H9 Deadline for filing required financial aid forms:H9 No deadline for filing required forms (applications processed on a
rolling basis): X
H10 Indicate notification dates for first-year (freshman) students (answer a or b):H10 a) Students notified on or about (date): H10 Yes NoH10 b) Students notified on a rolling basis: XH10 If yes, starting date: 1/15
H11 Indicate reply dates:H11 Students must reply by (date): 5/1H11 or within _______ weeks of notification. 2.00
Types of Aid AvailablePlease check off all types of aid available to undergraduates at your institution:
H12 LoansH12 FEDERAL DIRECT STUDENT LOAN PROGRAM (DIRECT LOAN)H12 Direct Subsidized Stafford Loans XH12 Direct Unsubsidized Stafford Loans XH12 Direct PLUS Loans X
H12 Federal Perkins LoansH12 Federal Nursing LoansH12 State LoansH12 College/university loans from institutional funds XH12 Other (specify): X
McElroy, Sherman, and United Methodist Loans
H13 Scholarships and GrantsH13 NEED-BASED:H13 Federal Pell XH13 SEOG XH13 State scholarships/grants XH13 Private scholarshipsH13 College/university scholarship or grant aid from institutional funds XH13 United Negro College FundH13 Federal Nursing ScholarshipH13 Other (specify):

2020-21 Common Data Set - Cornell College
Page 30
H14 Check off criteria used in awarding institutional aid. Check all that apply. H14 Non-Need Based Need-BasedH14 Academics XH14 Alumni affiliation XH14 Art XH14 AthleticsH14 Job skillsH14 ROTCH14 Leadership XH14 Minority statusH14 Music/drama XH14 Religious affiliationH14 State/district residency X X
H15If your institution has recently implemented any major financial aid policy, program, or initiative to make your institution more affordable to incoming students such as replacing loans with grants, or waiving costs for families below a certain income level please provide details below:

2020-21 Common Data Set - Cornell College
Page 31
I. INSTRUCTIONAL FACULTY AND CLASS SIZE
I-1. Please report the number of instructional faculty members in each category for Fall 2020. Includefaculty who are on your institution’s payroll on the census date your institution uses for IPEDS/AAUP.
The following definition of full-time instructional faculty is used by the American Association of University Professors (AAUP) in its annual Faculty Compensation Survey (the part time definitions are not used by AAUP). Instructional Faculty is defined as those members of the instructional-research staff whose major regular assignment is instruction, including those with released time for research. Use the chart below to determine inclusions and exclusions:
Full-time Part-time
A
Instructional faculty in preclinical and clinical medicine, faculty who are not paid (e.g., those who donate their services or are in the military), or research-only faculty, post-doctoral fellows, or pre-doctoral fellows Exclude
Include only if they teach
one or more non-clinical
credit courses
B
Administrative officers with titles such as dean of students, librarian, registrar, coach, and the like, even though they may devote part of their time to classroom instruction and may have faculty status Exclude
Include if they teach
one or more non-clinical
credit courses
COther administrators/staff who teach one or more non-clinical credit courses even though they do not have faculty status Exclude Include
D
Undergraduate or graduate students who assist in the instruction of courses, but have titles such as teaching assistant, teaching fellow, and the like
Exclude Exclude
E Faculty on sabbatical or leave with pay Include Exclude
F Faculty on leave without pay Exclude Exclude
G Replacement faculty for faculty on sabbatical leave or leave with pay Exclude Include
Full-time instructional faculty: faculty employed on a full-time basis for instruction (including those with released time for research)
Part-time instructional faculty: Adjuncts and other instructors being paid solely for part-time classroom instruction. Also includes full-time faculty teaching less than two semesters, three quarters, two trimesters, or two four-month sessions. Employees who are not considered full-time instruction faculty but who teach one or more non-clinical credit courses may be counted as part-time faculty.
Minority faculty: includes faculty who designate themselves as Black, non-Hispanic; American Indian or Alaska Native; Asian, Native Hawaiian or other Pacific Islander, or Hispanic.
Doctorate: includes such degrees as Doctor of Philosophy, Doctor of Education, Doctor of Juridical Science, and Doctor of Public Health in any field such as arts, sciences, education, engineering, business, and public administration. Also includes terminal degrees formerly designated as “first professional,” including dentistry (DDS or DMD), medicine (MD), optometry (OD), osteopathic medicine (DO), pharmacy (DPharm or BPharm), podiatric medicine (DPM), veterinary medicine (DVM), chiropractic (DC or DCM), or law (JD).
Terminal master’s degree: a master’s degree that is considered the highest degree in a field: example, M. Arch (in architecture) and MFA (master of fine arts in art or theater).
I-1. Full-Time Part-Time TotalA Total number of instructional faculty 81 20 101B) Total number who are members of minority groups 12 1 13C) Total number who are women 41 14 55D) Total number who are men 37 6 43E) Total number who are nonresident aliens (international) 0 0 0F) Total number with doctorate, or other terminal degree 81 13 94

2020-21 Common Data Set - Cornell College
Page 32
G)Total number whose highest degree is a master’s but not a terminal master’s 0 6 6
H)Total number whose highest degree is a bachelor’s
0 0 0
I)Total number whose highest degree is unknown or other (Note: Items f, g, h, and i must sum up to item a.) 0 1 1
J)Total number in stand-alone graduate/professional programs in which faculty teach virtually only graduate-level students 0 0 0
I-2. Student to Faculty RatioReport the Fall 2020 ratio of full-time equivalent students (full-time plus 1/3 part time) to full-time equivalent instructional faculty (full time plus 1/3 part time). In the ratio calculations, exclude both faculty and students in stand-alone graduate or professional programs such as medicine, law, veterinary, dentistry, social work, business, or public health in which faculty teach virtually only graduate level students.• Do not count undergraduate or graduate student teaching assistants as faculty.
Fall 2020 Student to Faculty ratio12
to 1 (based on 993
students
and 81 faculty).I-3. Undergraduate Class Size
In the table below, please use the following definitions to report information about the size of classes and class sections offered in the Fall 2020 term.• Please include classes that have been moved online in response to the COVID-19 pandemic.
Class Sections: A class section is an organized course offered for credit, identified by discipline and number, meeting at a stated time or times in a classroom or similar setting, and not a subsection such as a laboratory or discussion session. Undergraduate class sections are defined as any sections in which at least one degree-seeking undergraduate student is enrolled for credit. Exclude distance learning classes and noncredit classes and individual instruction such as dissertation or thesis research, music instruction, or one-to-one readings. Exclude students in independent study, co-operative programs, internships, foreign language taped tutor sessions, practicums, and all students in one-on-one classes. Each class section should be counted only once and should not be duplicated because of course catalog cross-listings.
Class Subsections: A class subsection includes any subsection of a course, such as laboratory, recitation, and discussion subsections that are supplementary in nature and are scheduled to meet separately from the lecture portion of the course. Undergraduate subsections are defined as any subsections of courses in which degree-seeking undergraduate students enrolled for credit. As above, exclude noncredit classes and individual instruction such as dissertation or thesis research, music instruction, or one-to-one readings. Each class subsection should be counted only once and should not be duplicated because of cross-listings.

2020-21 Common Data Set - Cornell College
Page 33
Using the above definitions, please report for each of the following class-size intervals the number of class sections and class subsections offered in Fall 2020. For example, a lecture class with 800 students who met at another time in 40 separate labs with 20 students should be counted once in the “100+” column in the class section column and 40 times under the “20-29” column of the class subsections table.
Number of Class Sections with Undergraduates Enrolled
Undergraduate Class Size (provide numbers)2-9 10-19 20-29 30-39 40-49 50-99 100+ Total
CLASS SECTIONS 59 139 60 0 0 0 0 258
2-9 10-19 20-29 30-39 40-49 50-99 100+ TotalCLASS SUB-SECTIONS 0

2020-21 Common Data Set - Cornell College
Page 34
J. DEGREES CONFERRED
J1 Degrees conferred between July 1, 2019 and June 30, 2020J1 For each of the following discipline areas, provide the percentage of diplomas/certificates, associate, and bachelor’s degrees awarded.
To determine the percentage, use majors, not headcount (e.g., students with one degree but a double major will be represented twice). Calculate the percentage from your institution’s IPEDS Completions by using the sum of 1st and 2nd majors for each CIP code as the numerator and the sum of the Grand Total by 1st Majors and the Grand Total by 2nd major as the denominator. If you prefer, you can compute the percentages using 1st majors only.
J1 Category Diploma/Certificates Associate Bachelor’s CIP 2010 Categories to Include
J1 Agriculture 0.00% 1J1 Natural resources and conservation 2.66% 3J1 Architecture 0.00% 4J1 Area, ethnic, and gender studies 0.33% 5J1 Communication/journalism 0.00% 9J1 Communication technologies 0.00% 10J1 Computer and information sciences 3.65% 11J1 Personal and culinary services 0.00% 12J1 Education 8.31% 13J1 Engineering 1.66% 14J1 Engineering technologies 0.00% 15J1 Foreign languages, literatures, and linguistics 3.99% 16J1 Family and consumer sciences 0.00% 19J1 Law/legal studies 0.00% 22J1 English 5.32% 23J1 Liberal arts/general studies 2.99% 24J1 Library science 0.00% 25J1 Biological/life sciences 9.97% 26J1 Mathematics and statistics 1.33% 27J1 Military science and military technologies 0.00% 28 & 29J1 Interdisciplinary studies 2.99% 30J1 Parks and recreation 7.97% 31J1 Philosophy and religious studies 1.33% 38J1 Theology and religious vocations 0.00% 39J1 Physical sciences 5.65% 40J1 Science technologies 0.00% 41J1 Psychology 12.62% 42J1 Homeland Security, law enforcement, firefighting, and
protective services0.00% 43
J1 Public administration and social services 0.00% 44J1 Social sciences 7.31% 45J1 Construction trades 0.00% 46J1 Mechanic and repair technologies 0.00% 47J1 Precision production 0.00% 48J1 Transportation and materials moving 0.00% 49J1 Visual and performing arts 5.98% 50J1 Health professions and related programs 0.00% 51J1 Business/marketing 13.62% 52J1 History 2.33% 54J1 OtherJ1 TOTAL (should = 100%) 0.00% 0.00% 100.00%