Embed Size (px)
Citation preview

2020 – 2021 Tuition and Fee Planning

❖ This year, The Princeton Review named Texas State one of the
nation's best institutions for undergraduates – an honor given to only
13 percent of the nation’s four-year institutions.
❖ In the last two years, Forbes listed Texas State among:
• “America’s Best Employers” (2017)
• “Best Employers for Women” (2018)
• “Best Employers for Diversity” (2019)
• “America's Best Midsize Employers” (2019)
Recent Recognition
2

3
Texas State Undergraduates are Successful
Texas State is sixth highest among Texas public universities in six-year
graduation rate of undergraduates starting and finishing at the same school.
The total number of bachelor’s degrees awarded has increased by 22
percent over the past five years.
Graduation rates are strong across all ethnic groups. The number of
bachelor’s degrees awarded to Hispanic and African-American students has
increased by 59 and 118 percent, respectively, over the past five years.
6,020 6,276 6,525 7,061 7,175 7,344
-
1,000
2,000
3,000
4,000
5,000
6,000
7,000
8,000
2013-14 2014-15 2015-16 2016-17 2017-18 2018-19Nu
mb
er o
f B
ach
elor
Deg
rees
Academic Year

Texas State Does More with Less:
Five Key Areas of Efficiency
1. Texas State is an excellent steward of state resources with the highest
utilization of classrooms and labs among the Texas public universities.
2. Texas State is the third lowest out of 37 Texas public universities in
2018 in terms of state general revenue support for operations provided
per semester credit hour (SCH) of instruction.
3. Texas State spent $14,910 per full-time student equivalent in 2018.
That is 20 percent less than the average ($18,708) for ERUs.
4. Texas State has the second highest student-to-staff ratio and highest
student-to-faculty ratio among ERUs, meaning that our employees do
more work for more students than their peers at other ERUs across the
state.
5. Our faculty carry a teaching load 23 percent higher than the state
average while being paid 15 percent below the state average.
Sources: Texas Higher Education Coordinating Board and National Center for Education Statistics. 4

Texas State is Highly Efficient with
State Dollars Received: Key Area of
Efficiency
Source: 85th Legislature, Regular Session: General Appropriations Act. THECB Base Year SCH.
Base Total General Base Total General
Year General Revenue Year General Revenue
University SCH Revenue per SCH University SCH Revenue per SCH
Texas A&M-Texarkana 46,186 $19,930,568 431.5 Texas A&M-Corpus Christi 307,471 $48,065,037 156.3
Texas A&M-Galveston 67,231 $21,906,357 325.8 Midwestern State 142,411 $21,855,599 153.5
Univ. of North Texas-Dallas 71,260 $22,166,741 311.1 Univ. of Texas-El Paso 562,870 $83,055,003 147.6
Texas A&M-Central Texas 55,665 $16,441,596 295.4 Univ. of Houston 1,090,420 $160,050,973 146.8
Sul Ross-Rio Grande 19,549 $4,668,714 238.8 West Texas A&M 229,566 $33,133,215 144.3
Univ. of Texas-Permian Basin 132,319 $31,557,322 238.5 Univ. of Houston-Clear Lake 181,701 $26,042,477 143.3
Texas A&M-San Antonio 118,052 $27,964,402 236.9 Tarleton State 327,837 $46,030,599 140.4
Texas Southern 239,402 $55,474,393 231.7 Texas A&M-Commerce 296,147 $41,556,331 140.3
Sul Ross State 46,648 $10,715,176 229.7 Univ. of Texas-Dallas 641,769 $88,858,840 138.5
Univ. of Texas-Austin 1,335,229 $294,766,246 220.8 Lamar 348,153 $48,176,966 138.4
Prairie View A&M 237,452 $48,364,594 203.7 Univ. of Texas-San Antonio 727,722 $100,141,845 137.6
Texas A&M 1,544,029 $295,990,725 191.7 S.F. Austin State 329,309 $40,201,343 122.1
Texas A&M-Kingsville 220,368 $38,509,310 174.8 Angelo State 213,470 $25,798,016 120.9
Univ. of Texas-Rio Grande Valley 702,476 $119,121,526 169.6 Univ. of Texas-Arlington 924,587 $107,170,649 115.9
Univ. of Texas-Tyler 210,844 $35,671,551 169.2 Univ. of North Texas 940,124 $105,488,342 112.2
Texas A&M International 188,619 $31,362,470 166.3 Texas State University 975,157 $109,079,130 111.9
Texas Tech 966,370 $156,712,855 162.2 Sam Houston State 521,323 $56,608,700 108.6
Texas Woman's 343,624 $55,465,180 161.4 Univ. of Houston-Downtown 311,171 $24,775,208 79.6
Univ. of Houston-Victoria 87,539 $13,842,840 158.1
Fiscal Year 2019 Fiscal Year 2019
Texas State is the third lowest out of the 37 public universities in Texas in
terms of state support for operations provided per semester credit hour of
instruction, but has the sixth highest graduation rate.
5

Faculty Resources Lag Behind Other Emerging Research
Universities
Average Faculty Salaries in FY 2018 at
Emerging Research Universities and Texas State
Fall 2017 Associate Assistant
Institution Enrollment Professor Professor Professor
University of Texas at Dallas 27,642 $165,240 $123,426 $111,208
University of Houston 45,364 $151,773 $100,513 $93,215
University of Texas at San Antonio 30,674 $130,099 $89,995 $80,044
Texas Tech University 36,634 $123,218 $86,703 $77,155
University of Texas at Arlington 41,712 $125,378 $97,173 $80,957
University of North Texas 38,081 $119,190 $88,495 $76,982
University of Texas at El Paso 25,020 $112,955 $86,632 $78,668
Texas State University 38,666 $102,873 $81,739 $71,495
Sources: THECB Accountability and Faculty Salary Report
Institution Student : Faculty Ratio
University of Texas at Dallas 21 : 1
University of Texas as El Paso 21 : 1
Texas Tech University 23 : 1
University of Houston 23 : 1
University of Texas at San Antonio 24 : 1
University of Texas at Arlington 26 : 1
University of North Texas 26 : 1
Texas State University 27 : 1
Student-to-Faculty Ratios in Fall 2017
at Emerging Research Universities and Texas State
6

Student-to-Staff Ratios
7
Student-to-Staff Ratio 2012 Ratio 2013 Ratio 2014 Ratio 2015 Ratio 2016 Ratio 2017 Ratio
The University of Texas at Arlington 9.8 15.1 18.6 17.2
Texas State University 14.8 15.4 15.8 14.6 15.3 14.5
University of North Texas 13.0 13.4 13.5 13.5 13.3 13.8
The University of Texas at San Antonio 10.2 10.5 10.3 10.3 11.3
The University of Texas at Dallas 7.6 8.9 9.8 11.0 11.0
Texas Tech University 10.0 10.4 11.2 10.9 10.6 10.9
The University of Texas Rio Grande Valley 13.6 13.4 14.2 12.2 10.9 10.8
University of Houston 9.8 9.4 9.3 9.6 9.7 10.6
Texas A & M University-College Station 10.3 10.7 9.9 9.7 9.6 9.8
The University of Texas at Austin 3.7 4.9 4.8 4.6 4.5 4.5
Note: Student-to-Staff Ratio = Student Full-time Equivalents / Non-Instructional Staff Full-time Equivalents.
Source: IPEDS Database, National Center for Education Stat ist ics, U.S. Department of Education.
Prepared on 6-Sept-2019 by Off ice of Inst itut ional Research, Texas State University.
Texas State University is a member of The Texas State University System.
Texas State has the 2nd highest staff-to-student ratio among our Top 10 competitors.

❖ Texas State has been ranked #1 among Carnegie classified R2
Research Universities in militaryfriendly.com’s top 10 schools.
❖ Texas State has the second highest number of Hazlewood program
participants of any university in Texas.
❖ Total Hazlewood exemptions have increased 48 percent in the last
five years, from $14.1 million in 2014 to $20.8 million in 2019.
Texas State Fully Supports
the Spirit of the Hazlewood Act
Fiscal
Year
Hazlewood
Exemptions
Hazlewood
Reimbursements
Cost to
Texas State
2014 $14,092,037 $3,119,802 $10,972,235
2015 $14,671,408 $1,117,678 $13,553,730
2016 $17,225,237 $2,472,816 $14,752,421
2017 $17,998,561 $2,257,546 $15,741,015
2018 $19,663,597 $2,115,946 $17,547,651
2019* $20,843,327 $2,193,481 $18,649,846
Note. Hazlewood Reimbursements consist of funds from the Permanent Fund supporting
Military and Veterans Exemptions.
*Unofficial.
8

Health Insurance
9
Over the last 10 years the cost of health insurance has increased by 115%.
2008 2009 2010 2011 2012 2013 2014 2015 2016 2017 2018 2019 Est 2020 Est
University Paid $10,171, $11,966, $11,917, $14,179, $15,875, $18,253, $20,107, $20,805, $20,173, $25,534, $31,058, $29,804, $30,000,
State Paid $8,048,6 $6,713,2 $8,856,5 $8,739,7 $8,986,8 $10,420, $11,881, $13,211, $14,422, $15,456, $13,088, $13,685, $14,656,
$0
$5,000,000
$10,000,000
$15,000,000
$20,000,000
$25,000,000
$30,000,000
$35,000,000
$40,000,000
$45,000,000
$50,000,000
Health Insurance-State vs. University Paid
State Paid University Paid

Despite Seven Straight Years of Record Freshman Class
Size, Enrollment Growth Continues to be Challenged
Texas State is graduating more students – and doing so much faster. Between
Fall 2014 and Fall 2018, time to degree completion decreased from 4.3 to 3.9
years for native freshmen arriving in fall 2010 and fall 2014, respectively.
• Students are enrolling with more college credits from dual credit, Early
College High School, or Advance placement exams.
• Degree programs are reducing the number of student credit hours required.
• The PACE Center encourages freshmen to enroll in 15 hours per semester
for four years.
• Starting in summer 2018, students receiving year-round Federal Pell Grants
were able to use their funds for summer school.
• Starting in fall 2017, students receiving federal financial aid only received
funds for courses that counted toward their degree.
New transfer student and post-baccalaureate enrollment is shrinking.
• Texas economy is strong, unemployment rates have reached record lows.
• Nationwide, community college enrollment has declined.
• Free tuition programs are being launched in some Texas community
colleges.
• Texas removed the financial incentive for teachers to earn master’s
degrees, thus impacting post-baccalaureate enrollment.
10

Average Time to Degree
11
Our graduates who began as freshmen now take an
average time of 3.9 years to graduate, which dropped
from 4.3 years in 2016.
How was this accomplished?
➢ Concentrated effort by the PACE Academic Advising
to register students for 15 semester credit hours.
➢ Number of academic programs where the number of
hours to degree has been reduced.
2009 2010 2011 2012 2013 2014 2015 2016 2017 2018 2019
Degrees Awarded 2,046 1,957 2,057 2,065 2,238 2,411 2,622 2,817 3,098 3,323 3,513
Median Degree Time 4.3 4.3 4.3 4.3 4.3 4.3 4.3 4.3 3.9 3.9 3.9
Source: CBM 009 and CBM 001 reports to Texas Higher Education Coordinat ing Board.
Prepared on 26-Sept-2019 by Off ice of Inst itut ional Research, Texas State University.
Texas State University is a member of The Texas State University System.
TxSt Fiscal Year
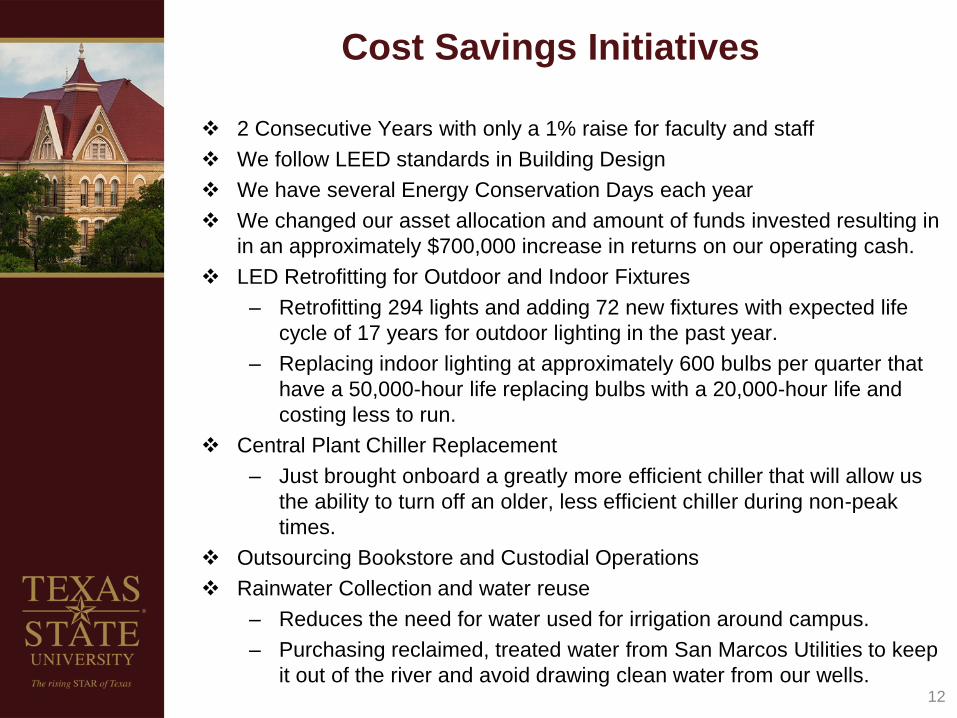
Cost Savings Initiatives
12
❖ 2 Consecutive Years with only a 1% raise for faculty and staff
❖ We follow LEED standards in Building Design
❖ We have several Energy Conservation Days each year
❖ We changed our asset allocation and amount of funds invested resulting in
in an approximately $700,000 increase in returns on our operating cash.
❖ LED Retrofitting for Outdoor and Indoor Fixtures
– Retrofitting 294 lights and adding 72 new fixtures with expected life
cycle of 17 years for outdoor lighting in the past year.
– Replacing indoor lighting at approximately 600 bulbs per quarter that
have a 50,000-hour life replacing bulbs with a 20,000-hour life and
costing less to run.
❖ Central Plant Chiller Replacement
– Just brought onboard a greatly more efficient chiller that will allow us
the ability to turn off an older, less efficient chiller during non-peak
times.
❖ Outsourcing Bookstore and Custodial Operations
❖ Rainwater Collection and water reuse
– Reduces the need for water used for irrigation around campus.
– Purchasing reclaimed, treated water from San Marcos Utilities to keep
it out of the river and avoid drawing clean water from our wells.

Tuition Planning Considerations
13
FY 2021 FY 2022
Inflation* $11.3 million $11.6 million
* Inflation calculated using 2018 Higher Education Price Index (HEPI) applied to budgeted
expenditures for the primary fund group (FY21 = E&G funds $239.5M + Designated Method fund
$162.5M * 2.8%).
FY 2021 FY 2022
Inflation* $11.3 million $11.6 million
New Academic Programs $2.1 million $1.8 million
Financial Aid & Scholarships $2.8 million
Total $16.2 million $13.4 million
Funding inflation alone would require a 3.35% increase in FY 2021 and a 3.33%
increase in FY 2022.
Funding inflation and previously identified commitments would require a 4.85%
increase in FY 2021 and 3.73% increase in FY 2022.

Proposed Tuition & Fee Increase
14
❖ Texas State is proposing a 3.95% overall tuition and fee increase for
both FY 2021 and FY 2022.
❖ This would result in a full-time student paying $222.45 more in FY
2021 and $231.30 more in FY 2022.
15 SCH $ Change % Change
FY 2020 $5,628.65
FY 2021 $5,851.10 $222.45 3.95%
FY 2022 $6,082.40 $231.30 3.95%

What Will it be Used For?
15
FY 2021 FY 2022
Merit Increases 2.25% & 2.75% $4.5 million $5.9 million
New Academic Programs $2.1 million $1.8 million
Financial Aid & Scholarships $2.8 million $200 thousand
Other Known Commitments $1.3 million $1.1 million
Employee Benefits & Fringe Costs $2.6 million $3.3 million
Student Service Fee $344 thousand $344 thousand
Total $13.6 million $12.4 million

Thank you for letting us tell you about
Texas State University
The 6,314 Freshman in the Class of 2023
16