Embed Size (px)
Citation preview
2020 1st Quarter Results
April 28, 2020
2012 ~2019 Top 30 of Excellence in CSR Award FROM Taiwan's CommonWealth Magazine2015 ~2019 Top 5% in the Corporate Governance Evaluation from TWSE2017 ~2019 Earned TCSA "Corporate Sustainability Report Awards-Gold Award"2018~2019 Earned TCSA "Transparency and Integrity Award-First Prize”
2019 Earned TCSA "Social Inclusion Award” and "Corporate Sustainability Award”
2013 ~2015 Earned A++ rating in Information Disclosure Evaluation from TWSE

Except for historical information contained herein, the matters set forth in this
presentation are forward-looking statements that are subject to significant risks and uncertainties and actual results may differ materially from those contained in any forward-looking statements.
The forward-looking statements in this release reflect the current belief of Coretronic as of the date of this release and Coretronic undertakes no
obligation to update these forward-looking statements for events or
circumstances that occur subsequent to such date.
Disclaimer

Agenda
2020 1st Quarter Financial Results (Franck Ho)
Visual Solutions Business Report (SY Chen)
Energy Saving Business Report (Sarah Lin)
Q & A (Franck Ho)

Statement of Comprehensive Income (Consolidated) - QoQ
Amount: NT$ Million Except Per Share Data
QoQ YoY
Net Sales 8,369 100% 13,084 100% (36.0%) 11,274 100% (25.8%)
Cost of Goods Sold (7,044) (84.2%) (10,697) (81.8%) 34.1% (9,433) (83.7%) 25.3%
Gross Profit 1,324 15.8% 2,388 18.2% (44.5%) 1,841 16.3% (28.1%)
Operating Expenses (1,514) (18.1%) (1,982) (15.1%) 23.6% (1,782) (15.8%) 15.1%
Operating Income (189) (2.3%) 405 3.1% (146.7%) 59 0.5% (419.8%)
Non-operating Income, Net 191 2.3% 96 0.7% 97.7% 122 1.1% 56.0%
Income Before Tax 1 0.0% 502 3.8% (99.8%) 181 1.6% (99.3%)
Net Income (58) (0.7%) 358 2.7% (116.3%) 101 0.9% (157.8%)
Shareholders of the Parent Company 5 0.1% 391 3.0% (98.7%) 94 0.8% (94.6%)
Minority Interests (63) (0.8%) (34) (0.2%) (88.6%) 7 0.1% (1,056%)
Basic EPS (NT$)(a) 0.01 0.90 0.22
EBITDA 307 3.7% 833 6.4% (63.1%) 533 4.7% (42.3%)
Prepared by Coretronic on a consolidated basis
(a) Basic EPS was calculated based on the total weighted average outstanding shares of each quarter (434m shares in 1Q'20, 4Q'19 and 1Q'19)
4Q'191Q'20 1Q'19

Balance Sheet Highlight (Consolidated)
Amount: NT$ Million
1Q'20 4Q'19 QoQ 1Q'19
Cash and Cash Equivalents 19,906 20,162 (1.3%) 19,145
Notes & Accounts Receivable, Net
(including related) 8,247 11,729 (29.7%) 10,973
Inventory 5,698 6,063 (6.0%) 7,415
Short Term Debt (a) 8,139 8,521 (4.5%) 6,875
Long Term Debt 183 183 (0.0%) 246
Equity 22,430 23,553 (4.8%) 25,009
Total Assets 45,336 49,323 (8.1%) 48,405
Inventory Turnover (Days)(b) 76 57 74
Debt to Assets 51% 52% 48%
Return on Equity(C) 0.1% 7% 2%
Net Worth Per Share (NT$)(d) 46.8 49.2 52.6
Prepared by Coretronic on a consolidated basis
(a) Short term debt = short term bank loan + current portion of long term loan
(b) Calculated by dividing the average inventory into the annualized cost of goods sold during such period, then multiplying by 365 days
(c) Calculated by dividing the average shareholders' equity of parent company into the annualized net income during such period
(d) Based on the outstanding shares of the balance sheet date: 1Q'20(434m shares), 4Q'19(434m shares), 1Q'19(434m shares)

Consolidated Sales Breakdown (By Revenue)
32%
17%16%
19%
7% 9% EMS BLU/MIB
ODM Business
Visual Solutions
Optoma
Young Optics
Others
4Q’19 Consolidated Sales : NT$13 Billion
1Q’20 Consolidated Sales : NT$8 Billion
28%
18%21%
18%
8% 7% EMS BLU/MIB
ODM Business
Visual Solutions
Optoma
Young Optics
Others

Visual Solutions Business Report
SY Chen
April 28, 2020

1Q20 Visual Solutions Business Review
� 1Q20 total sales of NT$2,102M with 49.6% QoQ
decrease and 35.9% YoY decline
� QoQ & YoY revenue decrease results from COVID-19
pandemics
� Dual manufacturing sites in Taiwan and China
� Production capacity restored at the end of Q1
� Embedded solutions and LED AiO opening new markets
and new applications, 1Q YoY shipping remains stable

Visual Solutions Sales Breakdown (By Revenue)
Sales(NT$ Million) $3,281 $3,374 $3,648 $4,172 $2,102
0%
20%
40%
60%
80%
100%
2019Q1 2019Q2 2019Q3 2019Q4 2020Q1
51%45% 44% 43%
49%
28%31% 31%
29%22%
16% 16% 12% 16%11%
4% 6% 10% 11%16%
1.2% 1.6% 1.7% 1.4% 1.8%
Lamp SSI Large Venue Solutions New Business
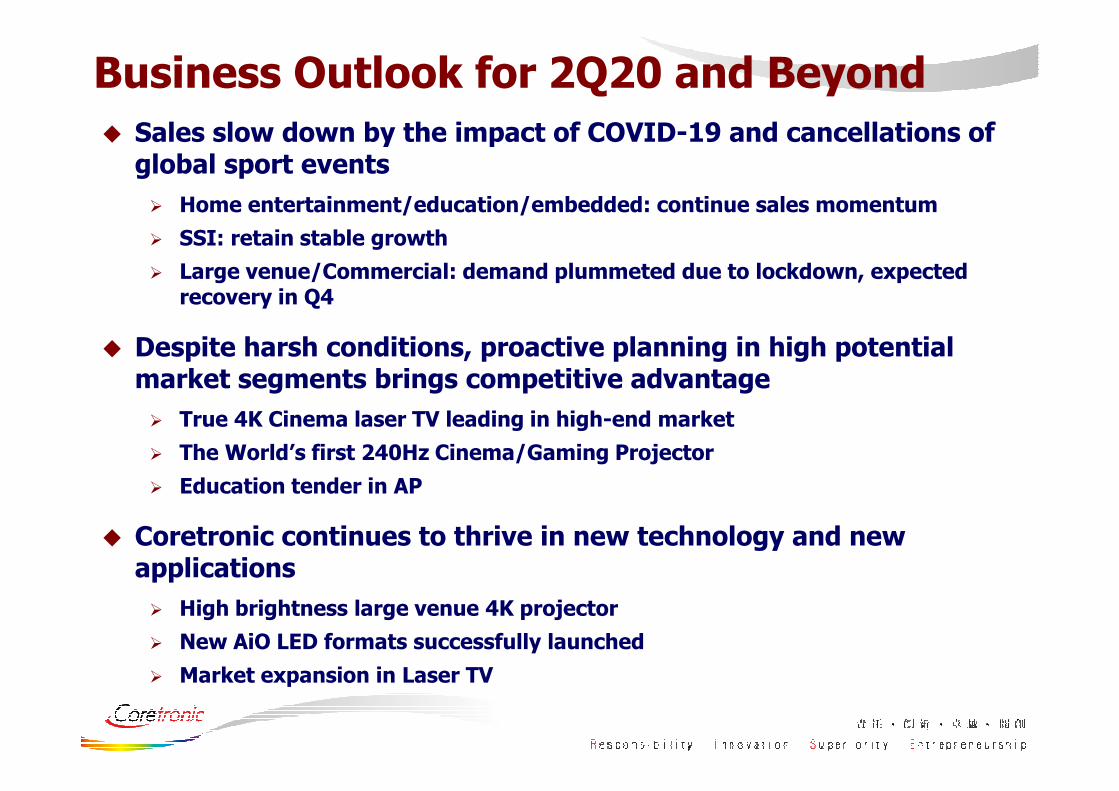
Business Outlook for 2Q20 and Beyond
� Sales slow down by the impact of COVID-19 and cancellations of global sport events
� Home entertainment/education/embedded: continue sales momentum
� SSI: retain stable growth
� Large venue/Commercial: demand plummeted due to lockdown, expected recovery in Q4
� Despite harsh conditions, proactive planning in high potential market segments brings competitive advantage
� True 4K Cinema laser TV leading in high-end market
� The World’s first 240Hz Cinema/Gaming Projector
� Education tender in AP
� Coretronic continues to thrive in new technology and new applications
� High brightness large venue 4K projector
� New AiO LED formats successfully launched
� Market expansion in Laser TV

The World’s first 240Hz Cinema/Gaming Projector

Energy Saving Business Report
Sarah Lin
April 28, 2020

1Q20 Energy Saving Business Review
� Originally estimated with 50% decrease YoY from
COVID-19 but Feb./March operation recovery better than
expectation.
� The overall sales revenue was NT$4,300 million in 1Q20,
decrease 31% QoQ and 21% YoY.
� The overall shipment was 8.41 million units, drop 22%
QoQ and 16% YoY.
� 1Q20 Shipment Summary:
- TV drop 15% QoQ.
- Monitor with 18% QoQ decrease.
- NB decrease 24% QoQ.

Prepared by Coretronic on a combined basis (Taiwan & China)
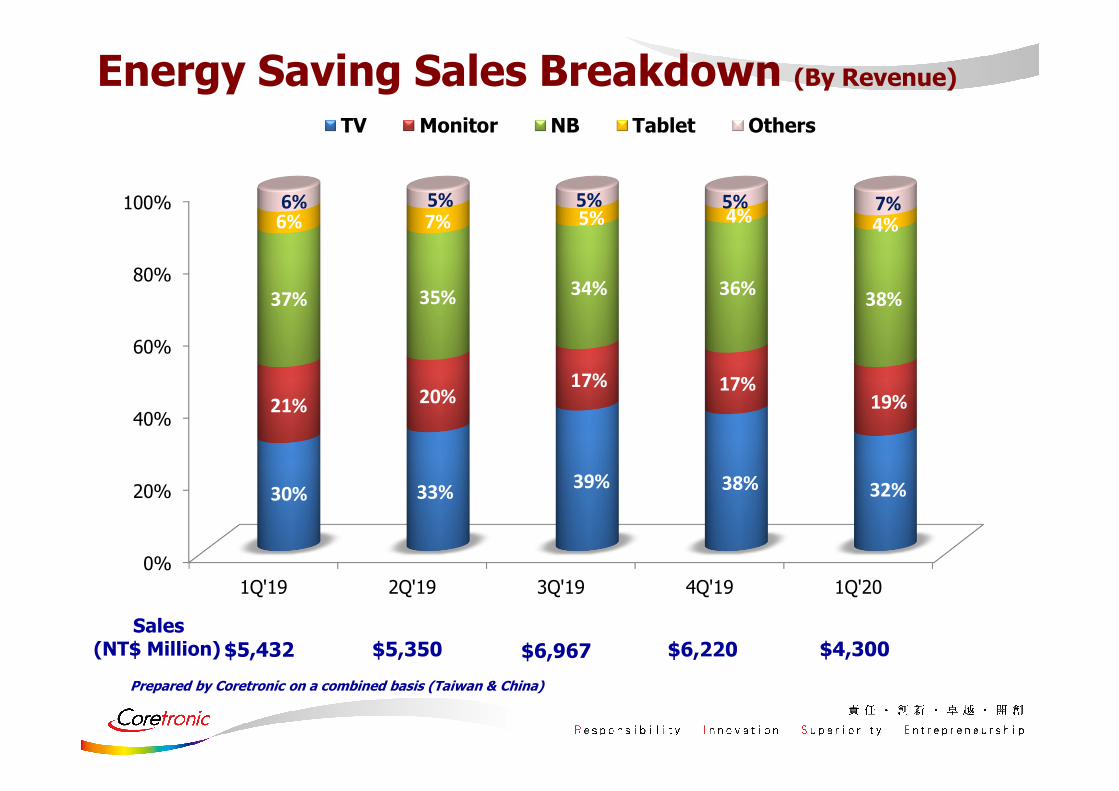
Energy Saving Sales Breakdown (By Revenue)
Sales(NT$ Million) $6,220 $4,300$6,967
0%
20%
40%
60%
80%
100%
1Q'19 2Q'19 3Q'19 4Q'19 1Q'20
59% 64% 59% 59% 63%
38% 33% 36% 38%33%
3% 3% 5% 3% 4%
EMS BLU/MIB ODM Business Components(Others)
$5,432 $5,350
- EMS BLU/MIB revenue drop 26% QoQ.
- ODM business with 40% QoQ decrease.
- Components revenue decrease 16% QoQ.
Prepared by Coretronic on a combined basis (Taiwan & China)
Energy Saving Sales Breakdown (By Revenue)
Sales(NT$ Million) $6,220 $4,300$6,967
0%
20%
40%
60%
80%
100%
1Q'19 2Q'19 3Q'19 4Q'19 1Q'20
30% 33%39% 38% 32%
21% 20%17% 17%
19%
37% 35% 34% 36%38%
6% 7% 5% 4% 4%6% 5% 5% 5% 7%
TV Monitor NB Tablet Others
$5,432 $5,350

2Q20 Business Outlook
� Strong demand with work from home and education, NB shipment will be with more than 30% growth. Monitor also has growth but less than 10%.
� Expect TV shipment will decrease in between 10-15% due to customers overseas facilities with temporary shut down impact and consumer market is slow.
� Q2 growth is mainly from TWN and China customers. While high demand for NB is Q2 driver, the shipment forecast is similar to the normal peak season of Q3 in the past.
� Mini LED BLU for gaming NB will MP from June.
� Overall Q2 shipment expect with 20% QoQ growth.
Market Update
� Q2 with high demand on PC/tablet due to COVID-19 impact but difficult to say it will continue with strong demand.
� At this moment, whether Q3 is peak season as usual is unclear due to conservative investment from enterprises and consumers.
� Korean LCD supplier exit does not mean the LCD supply will reduce since the factory will be taken and continue running. Could have more merger in the next 12 months.
� Has more discussion about the globalization, diversify manufacturing facility or how to shorten supply chain to avoid risk from COVID-19 experience.

Q&A
Franck HoCFO
SY ChenPresident
Sarah LinPresident