Embed Size (px)
Citation preview
Press release from Atlas Copco AB
Atlas Copco Group Center
Atlas Copco AB Visitors address: Telephone: +46 8 743 8000 A Public Company (publ)
SE-105 23 Stockholm Sickla Industriväg 19 www.atlascopcogroup.com Reg. No: 556014-2720
Sweden Nacka Reg. Office Nacka
July 15, 2019
Atlas Copco Second-quarter report 2019
Orders and revenue growth with sustained high profitability The figures for previous year in this report refer to continuing operations unless otherwise stated
Orders increased 6% to MSEK 26 565 (25 120), organic growth of 2%
Revenues were MSEK 25 580 (24 461), organic growth of 1%
Adjusted operating profit, excluding items affecting comparability, increased 2% to MSEK 5 622 (5 485), corresponding to a margin of 22.0% (22.4)
Reported operating profit was MSEK 5 379 (5 430), corresponding to a margin of 21.0% (22.2)
Profit before tax amounted to MSEK 5 315 (5 229)
Basic earnings per share were SEK 3.36 (3.21)
Operating cash flow at MSEK 2 369 (approx. 3 200)
Return on capital employed was 33% (31)
MSEK 2019 2018 2019 2018
Orders received 26 565 25 120 6% 53 377 49 950 7%
Revenues 25 580 24 461 5% 49 761 46 367 7%
Operating profi t 5 379 5 430 -1% 10 427 10 263 2%
– as a percentage of revenues 21.0 22.2 21.0 22.1
Profi t before tax 5 315 5 229 2% 10 222 9 742 5%
– as a percentage of revenues 20.8 21.4 20.5 21.0
Profi t for the period from
continuing operations 4 085 3 894 5% 7 788 7 234 8%
Profi t for the period from
discontinued operations - 89 139 - 90 220
Profi t for the period 4 085 93 033 7 788 97 454
Bas ic earnings per share, SEK 3.36 76.47 6.41 80.11
- of which continuing operations 3.36 3.21 6.41 5.96
Di luted earnings per share, SEK 3.36 76.33 6.41 79.74
- of which continuing operations 3.36 3.20 6.41 5.94
Return on capita l employed, % 33 31
Apri l - June January - June
Near-term demand outlook The demand for Atlas Copco’s products and services is expected to be somewhat lower than the level in the second quarter. Previous near-term demand outlook (published April 25, 2019): The demand for Atlas Copco’s products and services is expected to stay at current level.
Atlas Copco – Q2 2019 2 (20)
Summary of half-year resultsOrders received in the first six months of 2019 increased by 7% to MSEK 53 377 (49 950), corresponding to an organic growth of 2%. Currency effect was positive with 5%. Revenues were MSEK 49 761 (46 367), corresponding to a 2% organic increase.
Operating profit increased by 2% to MSEK 10 427 (10 263). The operating margin was 21.0% (22.1). Adjusted for items affecting comparability, the margin was 21.9% (22.1). In addition, there was a positive impact of changes in exchange rates for the first half-year of MSEK 915.
Profit before tax was MSEK 10 222 (9 742), corresponding to a margin of 20.5% (21.0). Profit for the period totaled MSEK 7 788 (7 234). Basic and diluted earnings per share were SEK 6.41 (5.96) and 6.41 (5.94) respectively.
Operating cash flow before acquisitions, divestments and dividends totaled MSEK 4 898 (previous year approx. 5 600 for continuing operations).
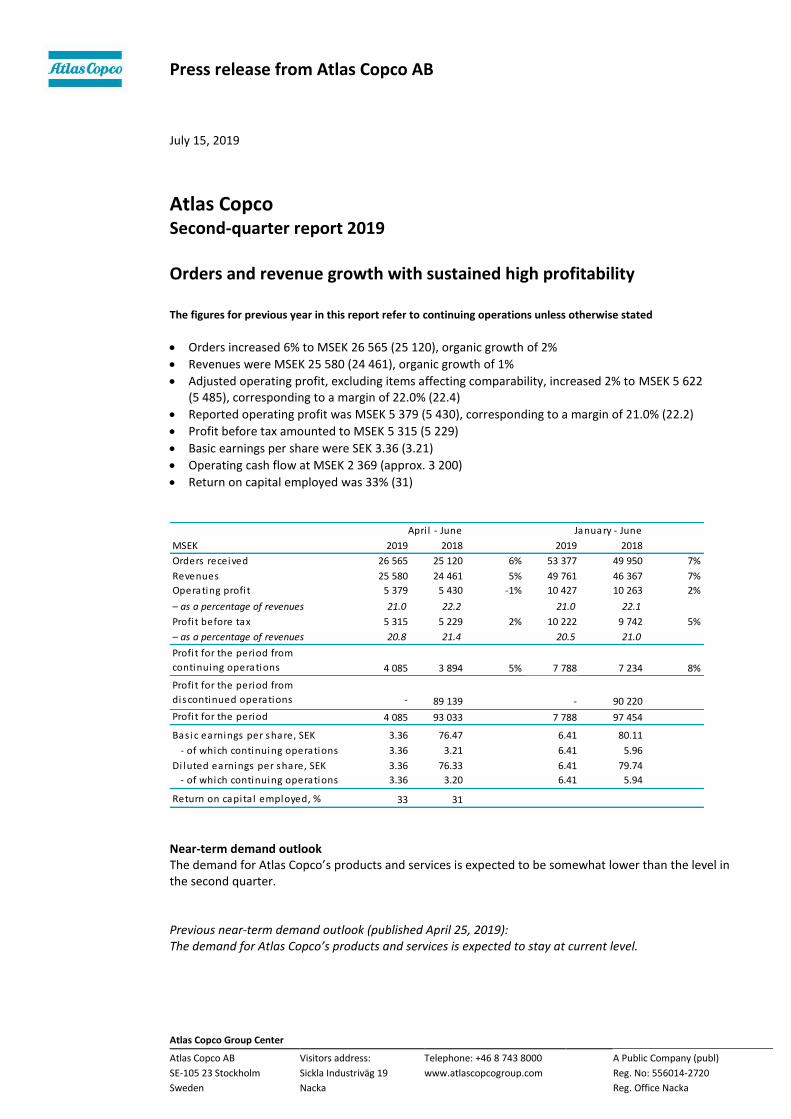
Review of the second quarter Market development The overall demand for Atlas Copco’s products and services continued at the recent high level and the order intake increased organically year-on-year. Sequentially, compared to the first quarter, order intake declined somewhat, mainly due to seasonal variations.
Equipment demand was mixed, but negatively affected by the uncertainties in the global economy. Year-on-year, the order volumes for compressors increased in the quarter, particularly for larger compressors. Orders for vacuum equipment, however, decreased mainly due to decreased demand from the semiconductor and flat panel display industry. The industrial assembly tools and solutions business saw a somewhat lower equipment demand from the motor vehicle industry, while the demand from the general industry was broadly flat. Order volumes for power equipment such as generators and pumps increased strongly. Solid order growth was also achieved for the specialty rental business.
The service business continued to grow in the quarter with growth in all business areas.
Geographic distribution of orders received
Apri l - June 2019 Orders Received, % Change*, %
North America 26 +6
South America 4 +11
Europe 31 +2
Africa/Middle East 5 +4
As ia/Oceania 34 -1
Atlas Copco Group 100 +2
Atlas Copco Group
*Change in orders received compared to the previous year in local currency.
Sales bridge
Orders
MSEK received Revenues
2018 25 120 24 461
Structura l change, % +0 +0
Currency, % +4 +4
Organic*, % +2 +1
Tota l , % +6 +5
2019 26 565 25 580
Apri l - June
*Volume, price and mix.
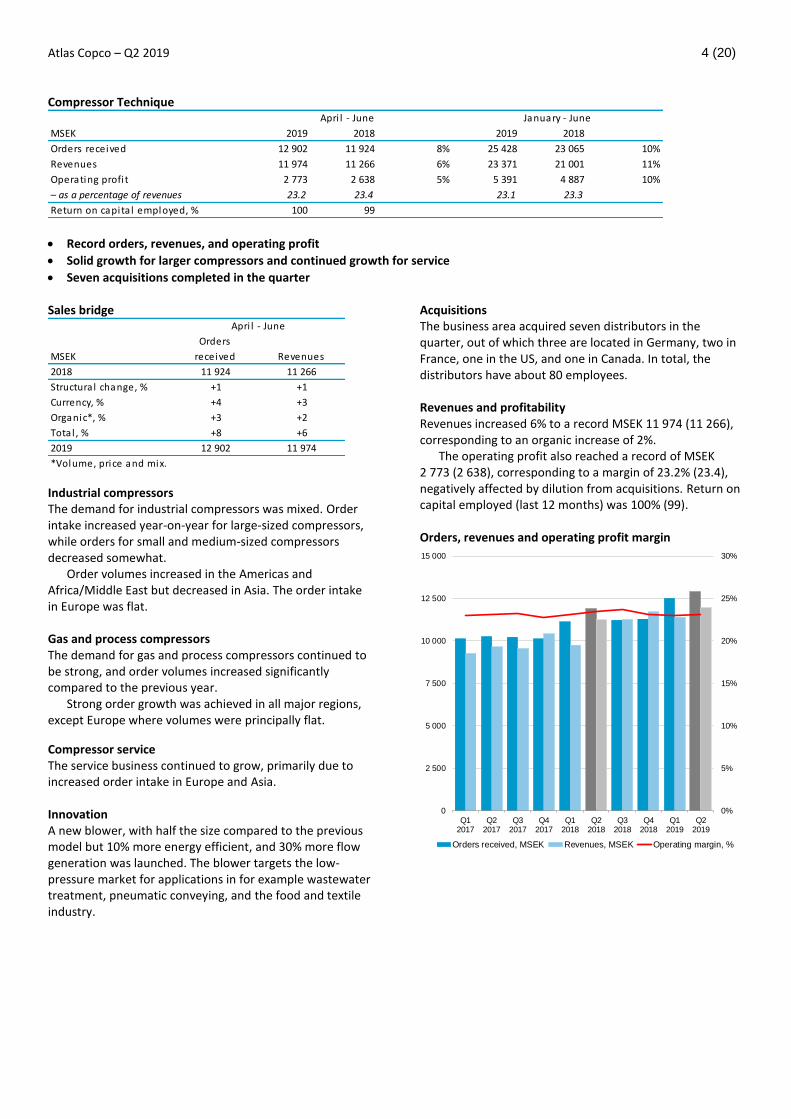
Orders, revenues and operating profit margin
0%
5%
10%
15%
20%
25%
30%
0
5 000
10 000
15 000
20 000
25 000
30 000
Q12017
Q22017
Q32017
Q42017
Q12018
Q22018
Q32018
Q42018
Q12019
Q22019
Orders received, MSEK Revenues, MSEK
Operating margin, % Adjusted operating margin, %
Geographic distribution, orders received and revenues Apri l - June 2019
Orders
received
Revenues Orders
received
Revenues Orders
received
Revenues Orders
received
Revenues Orders
received
Revenues
North America 22 23 27 24 32 31 28 23 26 24
South America 6 5 0 0 2 3 6 6 4 4
Europe 33 34 16 15 37 38 37 39 31 31
Africa/Middle East 7 7 1 2 2 1 8 11 5 5
As ia/Oceania 32 31 56 59 27 27 21 21 34 36
100 100 100 100 100 100 100 100 100 100
Atlas Copco, %Vacuum Technique, % Industria l Technique, % Power Technique, %Compressor Technique, %
Atlas Copco – Q2 2019 3 (20)
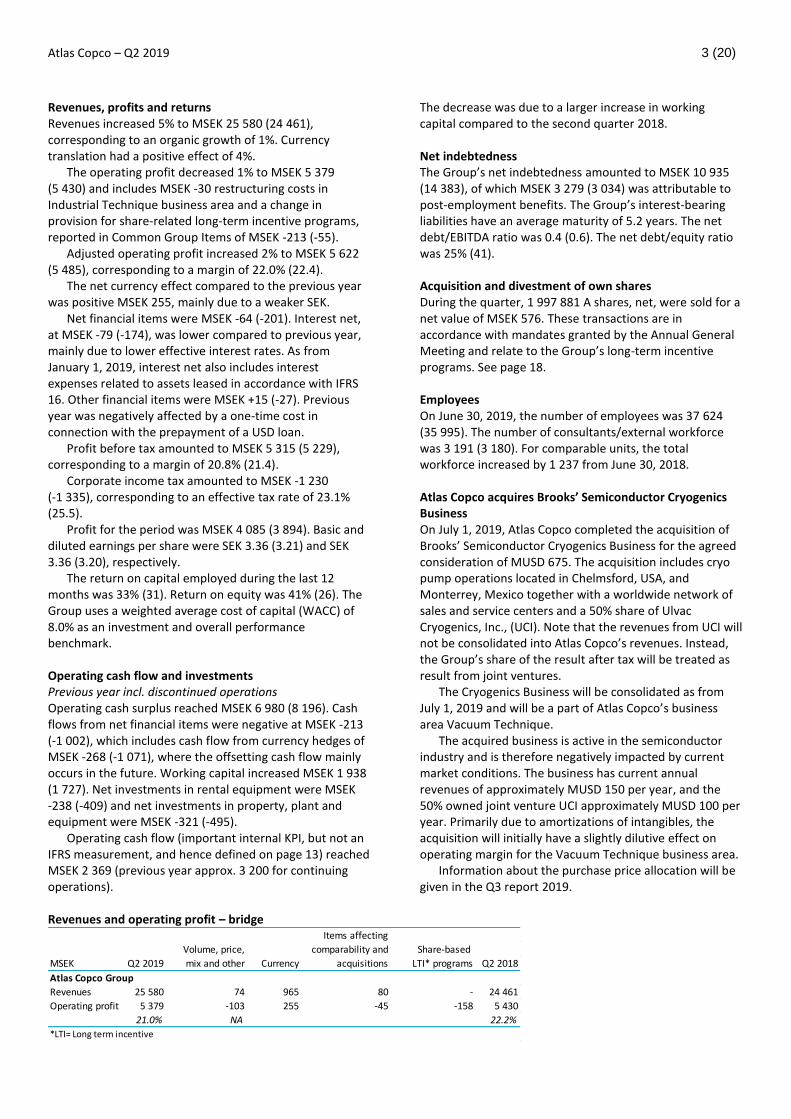
Revenues, profits and returns Revenues increased 5% to MSEK 25 580 (24 461), corresponding to an organic growth of 1%. Currency translation had a positive effect of 4%.
The operating profit decreased 1% to MSEK 5 379 (5 430) and includes MSEK -30 restructuring costs in Industrial Technique business area and a change in provision for share-related long-term incentive programs, reported in Common Group Items of MSEK -213 (-55).
Adjusted operating profit increased 2% to MSEK 5 622 (5 485), corresponding to a margin of 22.0% (22.4).
The net currency effect compared to the previous year was positive MSEK 255, mainly due to a weaker SEK.
Net financial items were MSEK -64 (-201). Interest net, at MSEK -79 (-174), was lower compared to previous year, mainly due to lower effective interest rates. As from January 1, 2019, interest net also includes interest expenses related to assets leased in accordance with IFRS 16. Other financial items were MSEK +15 (-27). Previous year was negatively affected by a one-time cost in connection with the prepayment of a USD loan.
Profit before tax amounted to MSEK 5 315 (5 229), corresponding to a margin of 20.8% (21.4).
Corporate income tax amounted to MSEK -1 230 (-1 335), corresponding to an effective tax rate of 23.1% (25.5).
Profit for the period was MSEK 4 085 (3 894). Basic and diluted earnings per share were SEK 3.36 (3.21) and SEK 3.36 (3.20), respectively.
The return on capital employed during the last 12 months was 33% (31). Return on equity was 41% (26). The Group uses a weighted average cost of capital (WACC) of 8.0% as an investment and overall performance benchmark.
Operating cash flow and investments Previous year incl. discontinued operations Operating cash surplus reached MSEK 6 980 (8 196). Cash flows from net financial items were negative at MSEK -213 (-1 002), which includes cash flow from currency hedges of MSEK -268 (-1 071), where the offsetting cash flow mainly occurs in the future. Working capital increased MSEK 1 938 (1 727). Net investments in rental equipment were MSEK -238 (-409) and net investments in property, plant and equipment were MSEK -321 (-495).
Operating cash flow (important internal KPI, but not an IFRS measurement, and hence defined on page 13) reached MSEK 2 369 (previous year approx. 3 200 for continuing operations).
The decrease was due to a larger increase in working capital compared to the second quarter 2018. Net indebtedness The Group’s net indebtedness amounted to MSEK 10 935 (14 383), of which MSEK 3 279 (3 034) was attributable to post-employment benefits. The Group’s interest-bearing liabilities have an average maturity of 5.2 years. The net debt/EBITDA ratio was 0.4 (0.6). The net debt/equity ratio was 25% (41). Acquisition and divestment of own shares During the quarter, 1 997 881 A shares, net, were sold for a net value of MSEK 576. These transactions are in accordance with mandates granted by the Annual General Meeting and relate to the Group’s long-term incentive programs. See page 18. Employees On June 30, 2019, the number of employees was 37 624 (35 995). The number of consultants/external workforce was 3 191 (3 180). For comparable units, the total workforce increased by 1 237 from June 30, 2018. Atlas Copco acquires Brooks’ Semiconductor Cryogenics Business On July 1, 2019, Atlas Copco completed the acquisition of Brooks’ Semiconductor Cryogenics Business for the agreed consideration of MUSD 675. The acquisition includes cryo pump operations located in Chelmsford, USA, and Monterrey, Mexico together with a worldwide network of sales and service centers and a 50% share of Ulvac Cryogenics, Inc., (UCI). Note that the revenues from UCI will not be consolidated into Atlas Copco’s revenues. Instead, the Group’s share of the result after tax will be treated as result from joint ventures.
The Cryogenics Business will be consolidated as from July 1, 2019 and will be a part of Atlas Copco’s business area Vacuum Technique.
The acquired business is active in the semiconductor industry and is therefore negatively impacted by current market conditions. The business has current annual revenues of approximately MUSD 150 per year, and the 50% owned joint venture UCI approximately MUSD 100 per year. Primarily due to amortizations of intangibles, the acquisition will initially have a slightly dilutive effect on operating margin for the Vacuum Technique business area.
Information about the purchase price allocation will be given in the Q3 report 2019.
Revenues and operating profit – bridge
Items affecting
Volume, price, comparability and Share-based
MSEK Q2 2019 mix and other Currency acquisitions LTI* programs Q2 2018
Atlas Copco Group
Revenues 25 580 74 965 80 - 24 461
Operating profit 5 379 -103 255 -45 -158 5 430
21.0% NA 22.2%
*LTI= Long term incentive
Atlas Copco – Q2 2019 4 (20)
Compressor Technique
MSEK 2019 2018 2019 2018
Orders received 12 902 11 924 8% 25 428 23 065 10%
Revenues 11 974 11 266 6% 23 371 21 001 11%
Operating profi t 2 773 2 638 5% 5 391 4 887 10%
– as a percentage of revenues 23.2 23.4 23.1 23.3
Return on capita l employed, % 100 99
Apri l - June January - June
Record orders, revenues, and operating profit
Solid growth for larger compressors and continued growth for service
Seven acquisitions completed in the quarter Sales bridge
Orders
MSEK received Revenues
2018 11 924 11 266
Structura l change, % +1 +1
Currency, % +4 +3
Organic*, % +3 +2
Tota l , % +8 +6
2019 12 902 11 974
*Volume, price and mix.
Apri l - June
Industrial compressors The demand for industrial compressors was mixed. Order intake increased year-on-year for large-sized compressors, while orders for small and medium-sized compressors decreased somewhat.
Order volumes increased in the Americas and Africa/Middle East but decreased in Asia. The order intake in Europe was flat. Gas and process compressors The demand for gas and process compressors continued to be strong, and order volumes increased significantly compared to the previous year.
Strong order growth was achieved in all major regions, except Europe where volumes were principally flat.
Compressor service The service business continued to grow, primarily due to increased order intake in Europe and Asia. Innovation A new blower, with half the size compared to the previous model but 10% more energy efficient, and 30% more flow generation was launched. The blower targets the low-pressure market for applications in for example wastewater treatment, pneumatic conveying, and the food and textile industry.
Acquisitions The business area acquired seven distributors in the quarter, out of which three are located in Germany, two in France, one in the US, and one in Canada. In total, the distributors have about 80 employees. Revenues and profitability Revenues increased 6% to a record MSEK 11 974 (11 266), corresponding to an organic increase of 2%.
The operating profit also reached a record of MSEK 2 773 (2 638), corresponding to a margin of 23.2% (23.4), negatively affected by dilution from acquisitions. Return on capital employed (last 12 months) was 100% (99). Orders, revenues and operating profit margin
0%
5%
10%
15%
20%
25%
30%
0
2 500
5 000
7 500
10 000
12 500
15 000
Q12017
Q22017
Q32017
Q42017
Q12018
Q22018
Q32018
Q42018
Q12019
Q22019
Orders received, MSEK Revenues, MSEK Operating margin, %
Atlas Copco – Q2 2019 5 (20)
Vacuum Technique
MSEK 2019 2018 2019 2018
Orders received 5 451 5 596 -3% 11 138 11 588 -4%
Revenues 5 650 5 740 -2% 10 903 10 995 -1%
Operating profi t 1 401 1 479 -5% 2 693 2 771 -3%
– as a percentage of revenues 24.8 25.8 24.7 25.2
Return on capita l employed, % 25 28
Apri l - June January - June
• Lower equipment demand • Service revenues continued to grow • Operating margin at 24.8% Sales bridge
Orders
MSEK received Revenues
2018 5 596 5 740
Structura l change, % +0 +0
Currency, % +4 +5
Organic*, % -7 -7
Tota l , % -3 -2
2019 5 451 5 650
*Volume, price and mix.
Apri l - June
Semiconductor and flat panel display equipment Order intake for equipment to the semiconductor and flat panel display industry decreased, but customer investments to support latest technology products remained at a high level.
Geographically, Asia and South Korea in particular, continued to be relatively weak. In North America, the order intake remained healthy, but below previous year’s record level.
Industrial and scientific vacuum equipment Equipment orders from the industrial and scientific vacuum markets were down compared to the previous year and broadly flat sequentially.
Compared to the previous year, order volumes increased in North America but decreased in Europe and Asia. Vacuum service The service business continued to grow with increased order intake from both industrial customers and the semiconductor industry. Innovation To meet the increased demand on the quality, shelf life, and resource efficiency in food and packaging processes, a new oil-free screw vacuum pump was launched. By transferring proven design principles from other pump
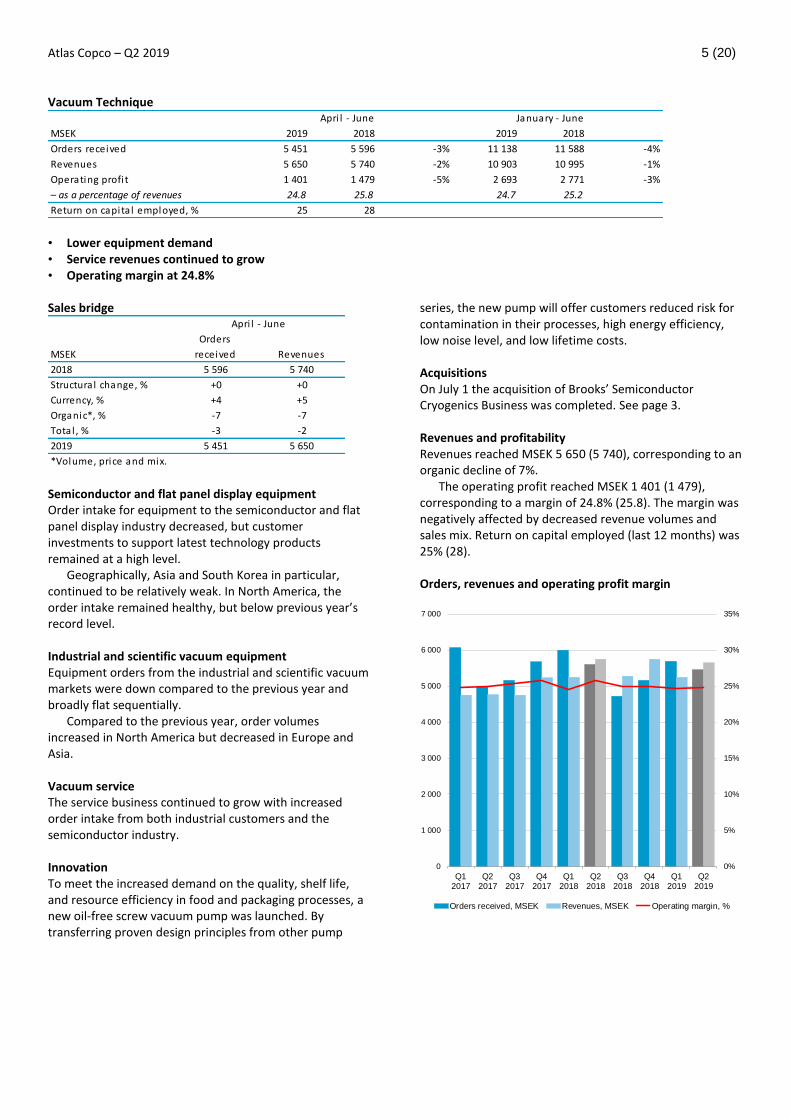
series, the new pump will offer customers reduced risk for contamination in their processes, high energy efficiency, low noise level, and low lifetime costs. Acquisitions On July 1 the acquisition of Brooks’ Semiconductor Cryogenics Business was completed. See page 3. Revenues and profitability Revenues reached MSEK 5 650 (5 740), corresponding to an organic decline of 7%.
The operating profit reached MSEK 1 401 (1 479), corresponding to a margin of 24.8% (25.8). The margin was negatively affected by decreased revenue volumes and sales mix. Return on capital employed (last 12 months) was 25% (28). Orders, revenues and operating profit margin
0%
5%
10%
15%
20%
25%
30%
35%
0
1 000
2 000
3 000
4 000
5 000
6 000
7 000
Q12017
Q22017
Q32017
Q42017
Q12018
Q22018
Q32018
Q42018
Q12019
Q22019
Orders received, MSEK Revenues, MSEK Operating margin, %
Atlas Copco – Q2 2019 6 (20)
Industrial Technique
MSEK 2019 2018 2019 2018
Orders received 4 868 4 713 3% 9 554 9 291 3%
Revenues 4 576 4 519 1% 9 123 8 697 5%
Operating profi t 1 016 1 056 -4% 2 024 2 030 0%
– as a percentage of revenues 22.2 23.4 22.2 23.3
Return on capita l employed, % 37 44
Apri l - June January - June
Lower demand for equipment to the motor vehicle industry
Service continued to grow
Adjusted operating margin at 22.9% Sales bridge
Orders
MSEK received Revenues
2018 4 713 4 519
Structura l change, % +0 +0
Currency, % +4 +4
Organic*, % -1 -3
Tota l , % +3 +1
2019 4 868 4 576
*Volume, price and mix.
Apri l - June
Motor vehicle industry The order volumes from the motor vehicle industry for advanced power tools decreased while orders for other fastening technologies, e.g. adhesives and riveting, increased compared to the previous year. Sequentially, the order intake remained on the same level as the previous quarter.
Geographically, and compared to the previous year, the order intake was unchanged in North America and Europe but decreased in Asia. General industry The order intake for industrial power tools from the general industry remained at about the same level as the previous year. The demand was mixed from different customer applications, with order growth from, for example, aerospace, and off-road customers, while order volumes from customers in the electronics industry decreased.
Geographically, order volumes increased in Asia and North America but decreased in Europe.
Service The service business, including maintenance and calibration services, continued to grow in the quarter, mainly thanks to strong growth in Europe.
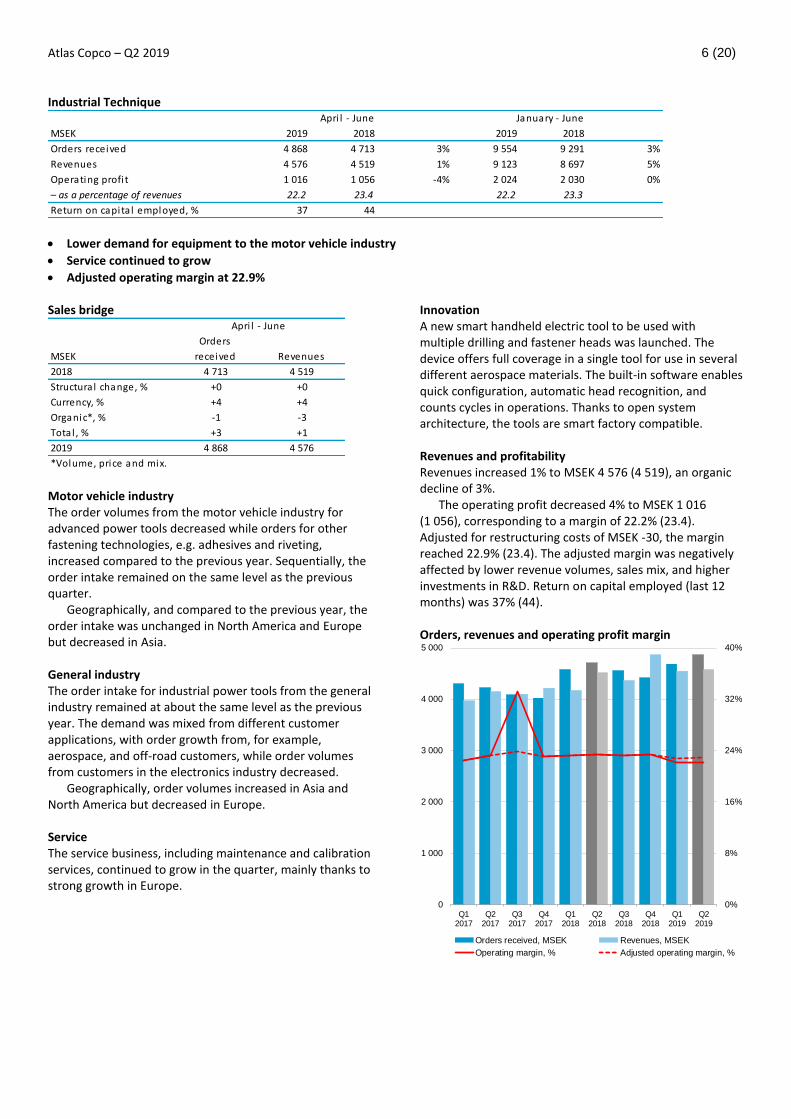
Innovation A new smart handheld electric tool to be used with multiple drilling and fastener heads was launched. The device offers full coverage in a single tool for use in several different aerospace materials. The built-in software enables quick configuration, automatic head recognition, and counts cycles in operations. Thanks to open system architecture, the tools are smart factory compatible. Revenues and profitability Revenues increased 1% to MSEK 4 576 (4 519), an organic decline of 3%.
The operating profit decreased 4% to MSEK 1 016 (1 056), corresponding to a margin of 22.2% (23.4). Adjusted for restructuring costs of MSEK -30, the margin reached 22.9% (23.4). The adjusted margin was negatively affected by lower revenue volumes, sales mix, and higher investments in R&D. Return on capital employed (last 12 months) was 37% (44). Orders, revenues and operating profit margin
0%
8%
16%
24%
32%
40%
0
1 000
2 000
3 000
4 000
5 000
Q12017
Q22017
Q32017
Q42017
Q12018
Q22018
Q32018
Q42018
Q12019
Q22019
Orders received, MSEK Revenues, MSEK
Operating margin, % Adjusted operating margin, %
Atlas Copco – Q2 2019 7 (20)
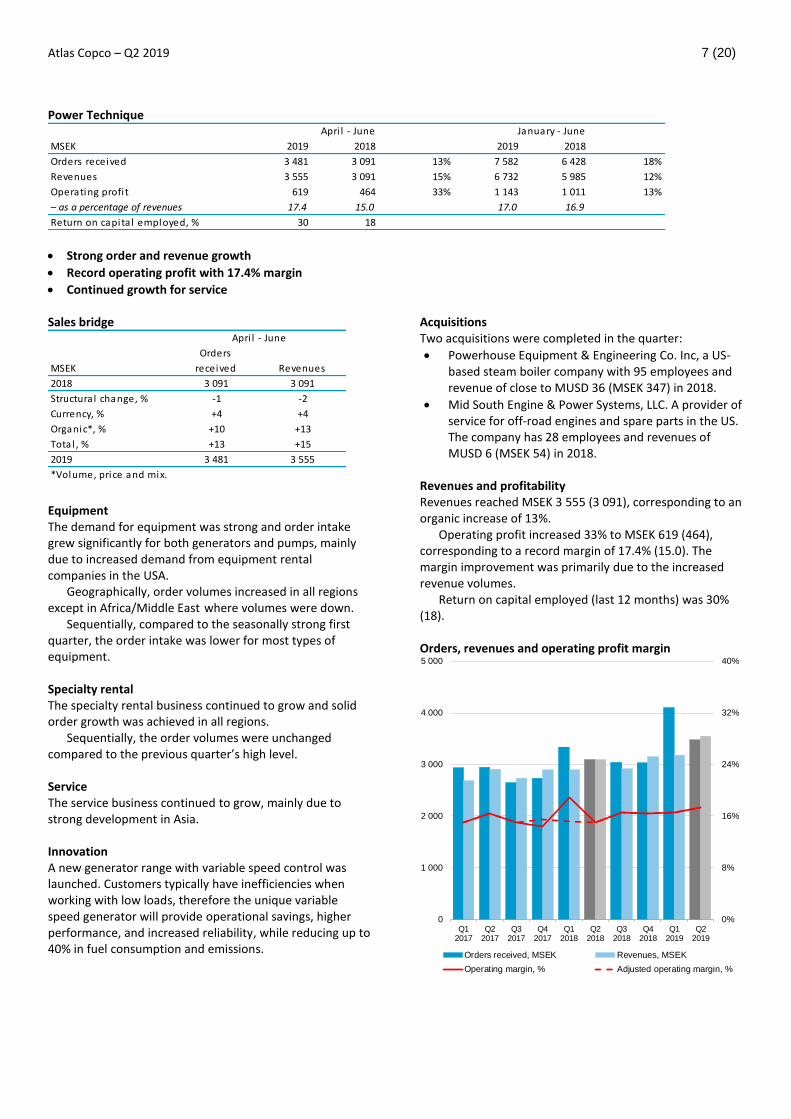
Power Technique
MSEK 2019 2018 2019 2018
Orders received 3 481 3 091 13% 7 582 6 428 18%
Revenues 3 555 3 091 15% 6 732 5 985 12%
Operating profi t 619 464 33% 1 143 1 011 13%
– as a percentage of revenues 17.4 15.0 17.0 16.9
Return on capita l employed, % 30 18
Apri l - June January - June
Strong order and revenue growth
Record operating profit with 17.4% margin
Continued growth for service Sales bridge
Orders
MSEK received Revenues
2018 3 091 3 091
Structura l change, % -1 -2
Currency, % +4 +4
Organic*, % +10 +13
Tota l , % +13 +15
2019 3 481 3 555
*Volume, price and mix.
Apri l - June
Equipment The demand for equipment was strong and order intake grew significantly for both generators and pumps, mainly due to increased demand from equipment rental companies in the USA.
Geographically, order volumes increased in all regions except in Africa/Middle East where volumes were down.
Sequentially, compared to the seasonally strong first quarter, the order intake was lower for most types of equipment. Specialty rental The specialty rental business continued to grow and solid order growth was achieved in all regions.
Sequentially, the order volumes were unchanged compared to the previous quarter’s high level. Service The service business continued to grow, mainly due to strong development in Asia.
Innovation A new generator range with variable speed control was launched. Customers typically have inefficiencies when working with low loads, therefore the unique variable speed generator will provide operational savings, higher performance, and increased reliability, while reducing up to 40% in fuel consumption and emissions.
Acquisitions Two acquisitions were completed in the quarter:
Powerhouse Equipment & Engineering Co. Inc, a US-based steam boiler company with 95 employees and revenue of close to MUSD 36 (MSEK 347) in 2018.
Mid South Engine & Power Systems, LLC. A provider of service for off-road engines and spare parts in the US. The company has 28 employees and revenues of MUSD 6 (MSEK 54) in 2018.
Revenues and profitability Revenues reached MSEK 3 555 (3 091), corresponding to an organic increase of 13%.
Operating profit increased 33% to MSEK 619 (464), corresponding to a record margin of 17.4% (15.0). The margin improvement was primarily due to the increased revenue volumes.
Return on capital employed (last 12 months) was 30% (18). Orders, revenues and operating profit margin
0%
8%
16%
24%
32%
40%
0
1 000
2 000
3 000
4 000
5 000
Q12017
Q22017
Q32017
Q42017
Q12018
Q22018
Q32018
Q42018
Q12019
Q22019
Orders received, MSEK Revenues, MSEK
Operating margin, % Adjusted operating margin, %
Atlas Copco – Q2 2019 8 (20)
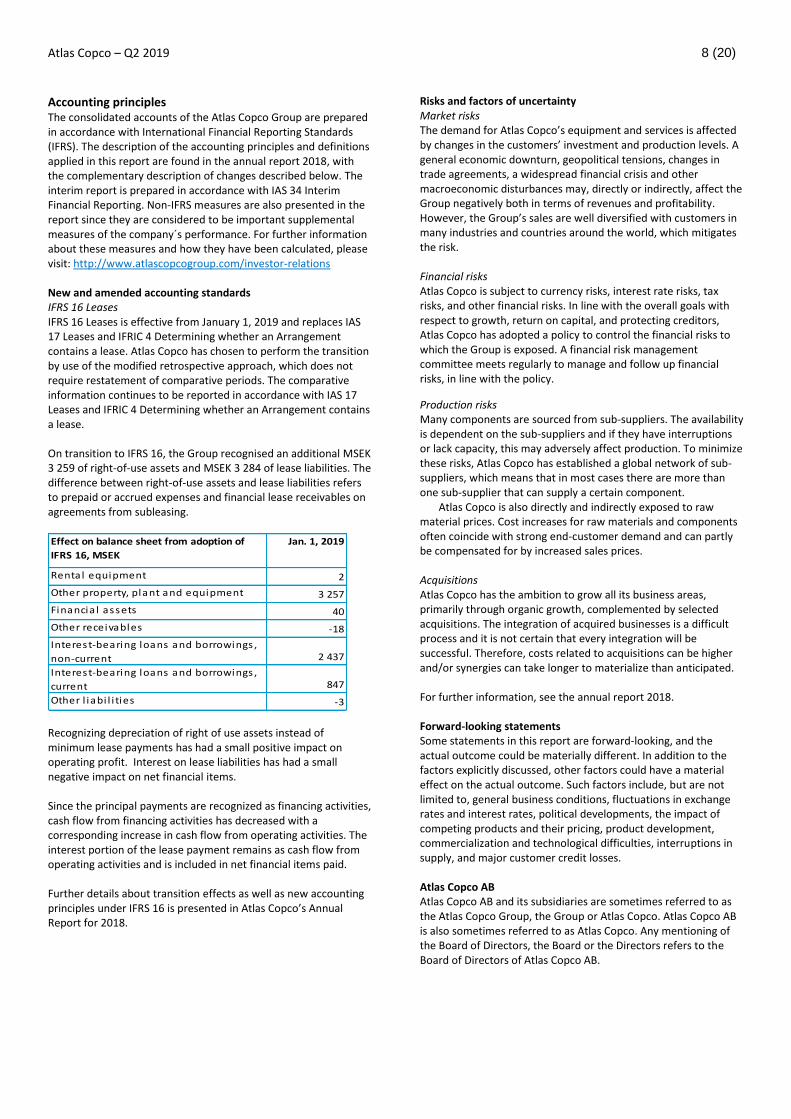
Accounting principles The consolidated accounts of the Atlas Copco Group are prepared in accordance with International Financial Reporting Standards (IFRS). The description of the accounting principles and definitions applied in this report are found in the annual report 2018, with the complementary description of changes described below. The interim report is prepared in accordance with IAS 34 Interim Financial Reporting. Non-IFRS measures are also presented in the report since they are considered to be important supplemental measures of the company´s performance. For further information about these measures and how they have been calculated, please visit: http://www.atlascopcogroup.com/investor-relations New and amended accounting standards IFRS 16 Leases IFRS 16 Leases is effective from January 1, 2019 and replaces IAS 17 Leases and IFRIC 4 Determining whether an Arrangement contains a lease. Atlas Copco has chosen to perform the transition by use of the modified retrospective approach, which does not require restatement of comparative periods. The comparative information continues to be reported in accordance with IAS 17 Leases and IFRIC 4 Determining whether an Arrangement contains a lease. On transition to IFRS 16, the Group recognised an additional MSEK 3 259 of right-of-use assets and MSEK 3 284 of lease liabilities. The difference between right-of-use assets and lease liabilities refers to prepaid or accrued expenses and financial lease receivables on agreements from subleasing. Effect on balance sheet from adoption of
IFRS 16, MSEK
Jan. 1, 2019
Renta l equipment 2
Other property, plant and equipment 3 257
Financia l assets 40
Other receivables -18
Interest-bearing loans and borrowings ,
non-current 2 437
Interest-bearing loans and borrowings ,
current 847
Other l iabi l i ties -3 Recognizing depreciation of right of use assets instead of minimum lease payments has had a small positive impact on operating profit. Interest on lease liabilities has had a small negative impact on net financial items. Since the principal payments are recognized as financing activities, cash flow from financing activities has decreased with a corresponding increase in cash flow from operating activities. The interest portion of the lease payment remains as cash flow from operating activities and is included in net financial items paid. Further details about transition effects as well as new accounting principles under IFRS 16 is presented in Atlas Copco’s Annual Report for 2018.
Risks and factors of uncertainty Market risks The demand for Atlas Copco’s equipment and services is affected by changes in the customers’ investment and production levels. A general economic downturn, geopolitical tensions, changes in trade agreements, a widespread financial crisis and other macroeconomic disturbances may, directly or indirectly, affect the Group negatively both in terms of revenues and profitability. However, the Group’s sales are well diversified with customers in many industries and countries around the world, which mitigates the risk. Financial risks Atlas Copco is subject to currency risks, interest rate risks, tax risks, and other financial risks. In line with the overall goals with respect to growth, return on capital, and protecting creditors, Atlas Copco has adopted a policy to control the financial risks to which the Group is exposed. A financial risk management committee meets regularly to manage and follow up financial risks, in line with the policy.
Production risks Many components are sourced from sub-suppliers. The availability is dependent on the sub-suppliers and if they have interruptions or lack capacity, this may adversely affect production. To minimize these risks, Atlas Copco has established a global network of sub-suppliers, which means that in most cases there are more than one sub-supplier that can supply a certain component.
Atlas Copco is also directly and indirectly exposed to raw material prices. Cost increases for raw materials and components often coincide with strong end-customer demand and can partly be compensated for by increased sales prices. Acquisitions Atlas Copco has the ambition to grow all its business areas, primarily through organic growth, complemented by selected acquisitions. The integration of acquired businesses is a difficult process and it is not certain that every integration will be successful. Therefore, costs related to acquisitions can be higher and/or synergies can take longer to materialize than anticipated. For further information, see the annual report 2018. Forward-looking statements Some statements in this report are forward-looking, and the actual outcome could be materially different. In addition to the factors explicitly discussed, other factors could have a material effect on the actual outcome. Such factors include, but are not limited to, general business conditions, fluctuations in exchange rates and interest rates, political developments, the impact of competing products and their pricing, product development, commercialization and technological difficulties, interruptions in supply, and major customer credit losses. Atlas Copco AB Atlas Copco AB and its subsidiaries are sometimes referred to as the Atlas Copco Group, the Group or Atlas Copco. Atlas Copco AB is also sometimes referred to as Atlas Copco. Any mentioning of the Board of Directors, the Board or the Directors refers to the Board of Directors of Atlas Copco AB.
Atlas Copco – Q2 2019 9 (20)
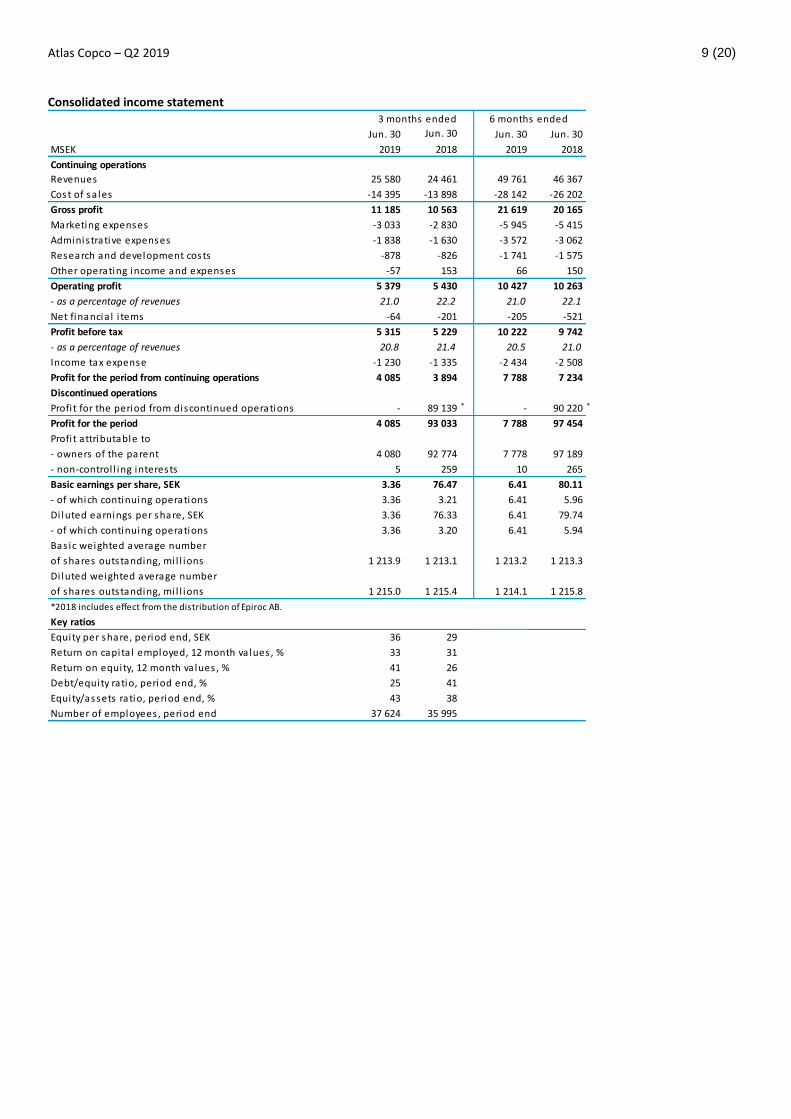
Consolidated income statement
Jun. 30 Jun. 30 Jun. 30 Jun. 30
MSEK 2019 2018 2019 2018
Continuing operations
Revenues 25 580 24 461 49 761 46 367
Cost of sa les -14 395 -13 898 -28 142 -26 202
Gross profit 11 185 10 563 21 619 20 165
Marketing expenses -3 033 -2 830 -5 945 -5 415
Adminis trative expenses -1 838 -1 630 -3 572 -3 062
Research and development costs -878 -826 -1 741 -1 575
Other operating income and expenses -57 153 66 150
Operating profit 5 379 5 430 10 427 10 263
- as a percentage of revenues 21.0 22.2 21.0 22.1
Net financia l i tems -64 -201 -205 -521
Profit before tax 5 315 5 229 10 222 9 742
- as a percentage of revenues 20.8 21.4 20.5 21.0
Income tax expense -1 230 -1 335 -2 434 -2 508
Profit for the period from continuing operations 4 085 3 894 7 788 7 234
Discontinued operations
Profi t for the period from discontinued operations - 89 139 * - 90 220 *
Profit for the period 4 085 93 033 7 788 97 454
Profi t attributable to
- owners of the parent 4 080 92 774 7 778 97 189
- non-control l ing interests 5 259 10 265
Basic earnings per share, SEK 3.36 76.47 6.41 80.11
- of which continuing operations 3.36 3.21 6.41 5.96
Di luted earnings per share, SEK 3.36 76.33 6.41 79.74
- of which continuing operations 3.36 3.20 6.41 5.94
Bas ic weighted average number
of shares outstanding, mi l l ions 1 213.9 1 213.1 1 213.2 1 213.3
Di luted weighted average number
of shares outstanding, mi l l ions 1 215.0 1 215.4 1 214.1 1 215.8
*2018 includes effect from the distribution of Epiroc AB.
Key ratios
Equity per share, period end, SEK 36 29
Return on capita l employed, 12 month va lues , % 33 31
Return on equity, 12 month va lues , % 41 26
Debt/equity ratio, period end, % 25 41
Equity/assets ratio, period end, % 43 38
Number of employees , period end 37 624 35 995
3 months ended 6 months ended
Atlas Copco – Q2 2019 10 (20)
Consolidated statement of comprehensive income, including discontinued operations
Jun. 30 Jun. 30 Jun. 30 Jun. 30
MSEK 2019 2018 2019 2018
Profit for the period 4 085 93 033 7 788 97 454
Other comprehensive income
Items that will not be reclassified to profit or loss
Remeasurements of defined benefi t pens ion plans 111 -29 -198 141
Income tax relating to i tems that wi l l not be reclass i fied -27 17 79 -18
84 -12 -119 123
Items that may be reclassified subsequently to profit or loss
Trans lation di fferences on foreign operations -101 1 509 1 576 4 699
- rea l ized and reclass i fied to income statement - -934 - -946
Hedge of net investments in foreign operations -223 -227 -447 -1 034
Cash flow hedges -8 -25 -6 45
Income tax relating to i tems that may be reclass i fied 68 146 135 634
-264 469 1 258 3 398
Other comprehensive income for the period, net of tax -180 457 1 139 3 521
Total comprehensive income for the period 3 905 93 490 8 927 100 975
Total comprehens ive income attributable to
- owners of the parent 3 900 93 230 8 915 100 708
- non-control l ing interests 5 260 12 267
3 months ended 6 months ended
Atlas Copco – Q2 2019 11 (20)
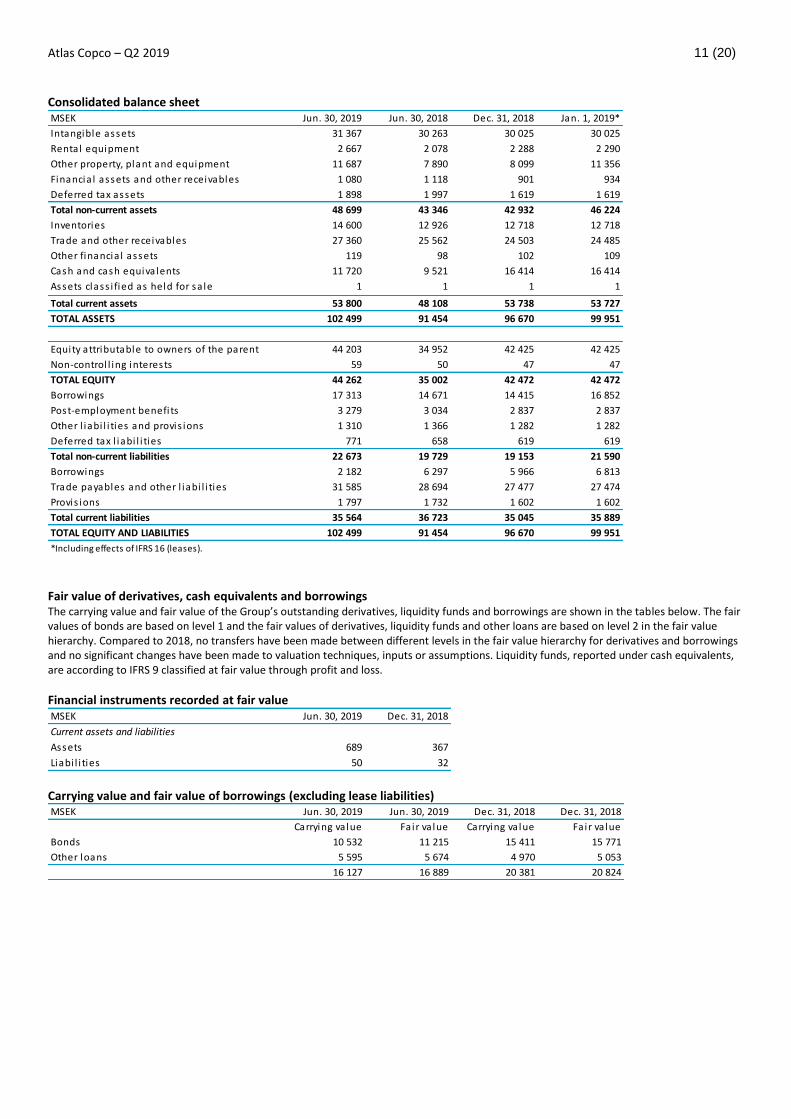
Consolidated balance sheet MSEK Jun. 30, 2019 Jun. 30, 2018 Dec. 31, 2018 Jan. 1, 2019*
Intangible assets 31 367 30 263 30 025 30 025
Rental equipment 2 667 2 078 2 288 2 290
Other property, plant and equipment 11 687 7 890 8 099 11 356
Financia l assets and other receivables 1 080 1 118 901 934
Deferred tax assets 1 898 1 997 1 619 1 619
Total non-current assets 48 699 43 346 42 932 46 224
Inventories 14 600 12 926 12 718 12 718
Trade and other receivables 27 360 25 562 24 503 24 485
Other financia l assets 119 98 102 109
Cash and cash equiva lents 11 720 9 521 16 414 16 414
Assets class i fied as held for sa le 1 1 1 1
Total current assets 53 800 48 108 53 738 53 727
TOTAL ASSETS 102 499 91 454 96 670 99 951
Equity attributable to owners of the parent 44 203 34 952 42 425 42 425
Non-control l ing interests 59 50 47 47
TOTAL EQUITY 44 262 35 002 42 472 42 472
Borrowings 17 313 14 671 14 415 16 852
Post-employment benefi ts 3 279 3 034 2 837 2 837
Other l iabi l i ties and provis ions 1 310 1 366 1 282 1 282
Deferred tax l iabi l i ties 771 658 619 619
Total non-current liabilities 22 673 19 729 19 153 21 590
Borrowings 2 182 6 297 5 966 6 813
Trade payables and other l iabi l i ties 31 585 28 694 27 477 27 474
Provis ions 1 797 1 732 1 602 1 602
Total current liabilities 35 564 36 723 35 045 35 889
TOTAL EQUITY AND LIABILITIES 102 499 91 454 96 670 99 951
*Including effects of IFRS 16 (leases).
Fair value of derivatives, cash equivalents and borrowings The carrying value and fair value of the Group’s outstanding derivatives, liquidity funds and borrowings are shown in the tables below. The fair values of bonds are based on level 1 and the fair values of derivatives, liquidity funds and other loans are based on level 2 in the fair value hierarchy. Compared to 2018, no transfers have been made between different levels in the fair value hierarchy for derivatives and borrowings and no significant changes have been made to valuation techniques, inputs or assumptions. Liquidity funds, reported under cash equivalents, are according to IFRS 9 classified at fair value through profit and loss.
Financial instruments recorded at fair value MSEK Jun. 30, 2019 Dec. 31, 2018
Current assets and liabilities
Assets 689 367
Liabi l i ties 50 32 Carrying value and fair value of borrowings (excluding lease liabilities) MSEK Jun. 30, 2019 Jun. 30, 2019 Dec. 31, 2018 Dec. 31, 2018
Carrying value Fair value Carrying value Fair value
Bonds 10 532 11 215 15 411 15 771
Other loans 5 595 5 674 4 970 5 053
16 127 16 889 20 381 20 824
Atlas Copco – Q2 2019 12 (20)
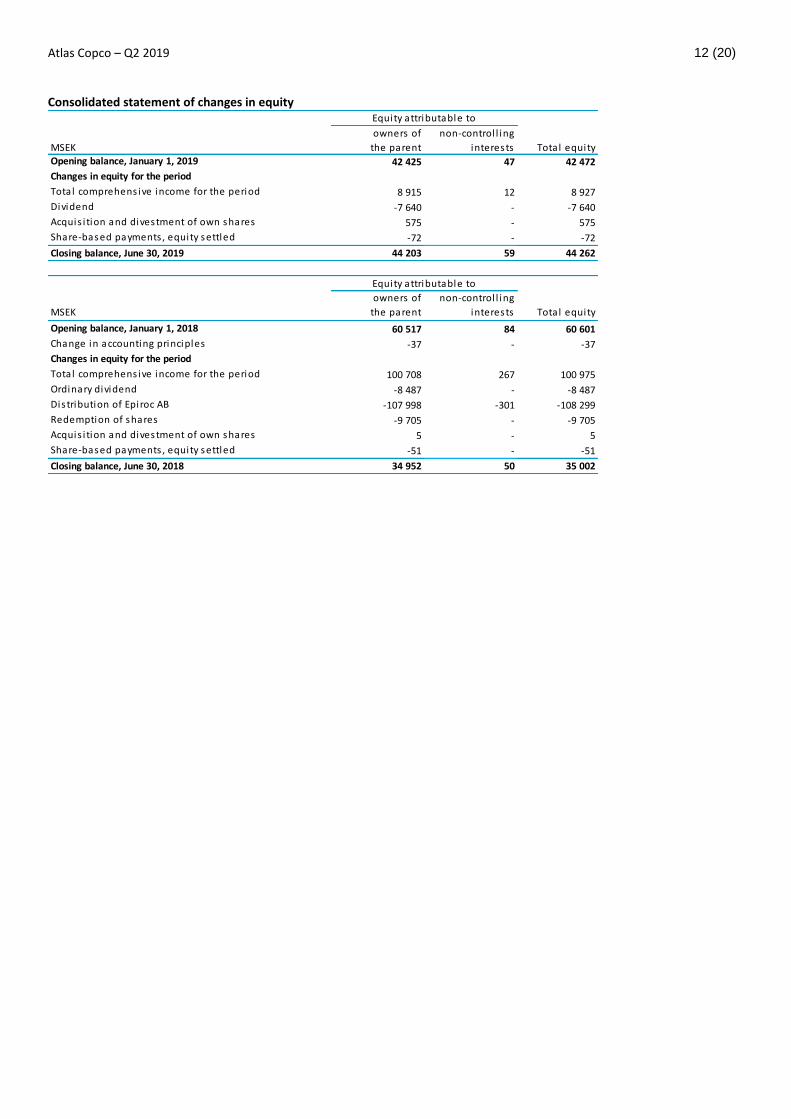
Consolidated statement of changes in equity
MSEK
owners of
the parent
non-control l ing
interests Total equity
Opening balance, January 1, 2019 42 425 47 42 472
Changes in equity for the period
Total comprehens ive income for the period 8 915 12 8 927
Dividend -7 640 - -7 640
Acquis i tion and divestment of own shares 575 - 575
Share-based payments , equity settled -72 - -72
Closing balance, June 30, 2019 44 203 59 44 262
MSEK
owners of
the parent
non-control l ing
interests Total equity
Opening balance, January 1, 2018 60 517 84 60 601
Change in accounting principles -37 - -37
Changes in equity for the period
Total comprehens ive income for the period 100 708 267 100 975
Ordinary dividend -8 487 - -8 487
Distribution of Epiroc AB -107 998 -301 -108 299
Redemption of shares -9 705 - -9 705
Acquis i tion and divestment of own shares 5 - 5
Share-based payments , equity settled -51 - -51
Closing balance, June 30, 2018 34 952 50 35 002
Equity attributable to
Equity attributable to
Atlas Copco – Q2 2019 13 (20)
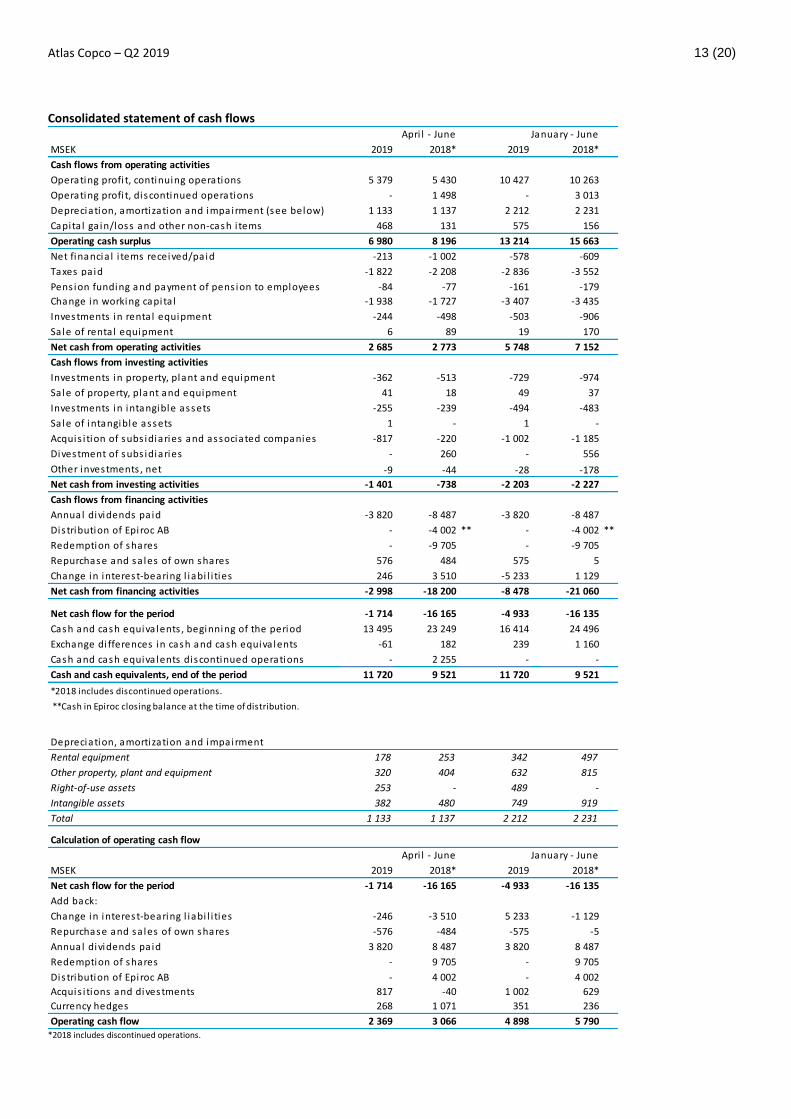
Consolidated statement of cash flows
MSEK 2019 2018* 2019 2018*
Cash flows from operating activities
Operating profi t, continuing operations 5 379 5 430 10 427 10 263
Operating profi t, discontinued operations - 1 498 - 3 013
Depreciation, amortization and impairment (see below) 1 133 1 137 2 212 2 231
Capita l ga in/loss and other non-cash i tems 468 131 575 156
Operating cash surplus 6 980 8 196 13 214 15 663
Net financia l i tems received/paid -213 -1 002 -578 -609
Taxes pa id -1 822 -2 208 -2 836 -3 552
Pens ion funding and payment of pens ion to employees -84 -77 -161 -179
Change in working capita l -1 938 -1 727 -3 407 -3 435
Investments in renta l equipment -244 -498 -503 -906
Sale of renta l equipment 6 89 19 170
Net cash from operating activities 2 685 2 773 5 748 7 152
Cash flows from investing activities
Investments in property, plant and equipment -362 -513 -729 -974
Sale of property, plant and equipment 41 18 49 37
Investments in intangible assets -255 -239 -494 -483
Sale of intangible assets 1 - 1 -
Acquis i tion of subs idiaries and associated companies -817 -220 -1 002 -1 185
Divestment of subs idiaries - 260 - 556
Other investments , net -9 -44 -28 -178
Net cash from investing activities -1 401 -738 -2 203 -2 227
Cash flows from financing activities
Annual dividends pa id -3 820 -8 487 -3 820 -8 487
Distribution of Epiroc AB - -4 002 ** - -4 002 **
Redemption of shares - -9 705 - -9 705
Repurchase and sa les of own shares 576 484 575 5
Change in interest-bearing l iabi l i ties 246 3 510 -5 233 1 129
Net cash from financing activities -2 998 -18 200 -8 478 -21 060
Net cash flow for the period -1 714 -16 165 -4 933 -16 135
Cash and cash equiva lents , beginning of the period 13 495 23 249 16 414 24 496
Exchange di fferences in cash and cash equiva lents -61 182 239 1 160
Cash and cash equiva lents discontinued operations - 2 255 - -
Cash and cash equivalents, end of the period 11 720 9 521 11 720 9 521
*2018 includes discontinued operations.
**Cash in Epiroc closing balance at the time of distribution.
Depreciation, amortization and impairment
Rental equipment 178 253 342 497
Other property, plant and equipment 320 404 632 815
Right-of-use assets 253 - 489 -
Intangible assets 382 480 749 919
Total 1 133 1 137 2 212 2 231
Calculation of operating cash flow
MSEK 2019 2018* 2019 2018*
Net cash flow for the period -1 714 -16 165 -4 933 -16 135
Add back:
Change in interest-bearing l iabi l i ties -246 -3 510 5 233 -1 129
Repurchase and sa les of own shares -576 -484 -575 -5
Annual dividends pa id 3 820 8 487 3 820 8 487
Redemption of shares - 9 705 - 9 705
Distribution of Epiroc AB - 4 002 - 4 002
Acquis i tions and divestments 817 -40 1 002 629
Currency hedges 268 1 071 351 236
Operating cash flow 2 369 3 066 4 898 5 790
Apri l - June January - June
Apri l - June January - June
*2018 includes discontinued operations.
Atlas Copco – Q2 2019 14 (20)
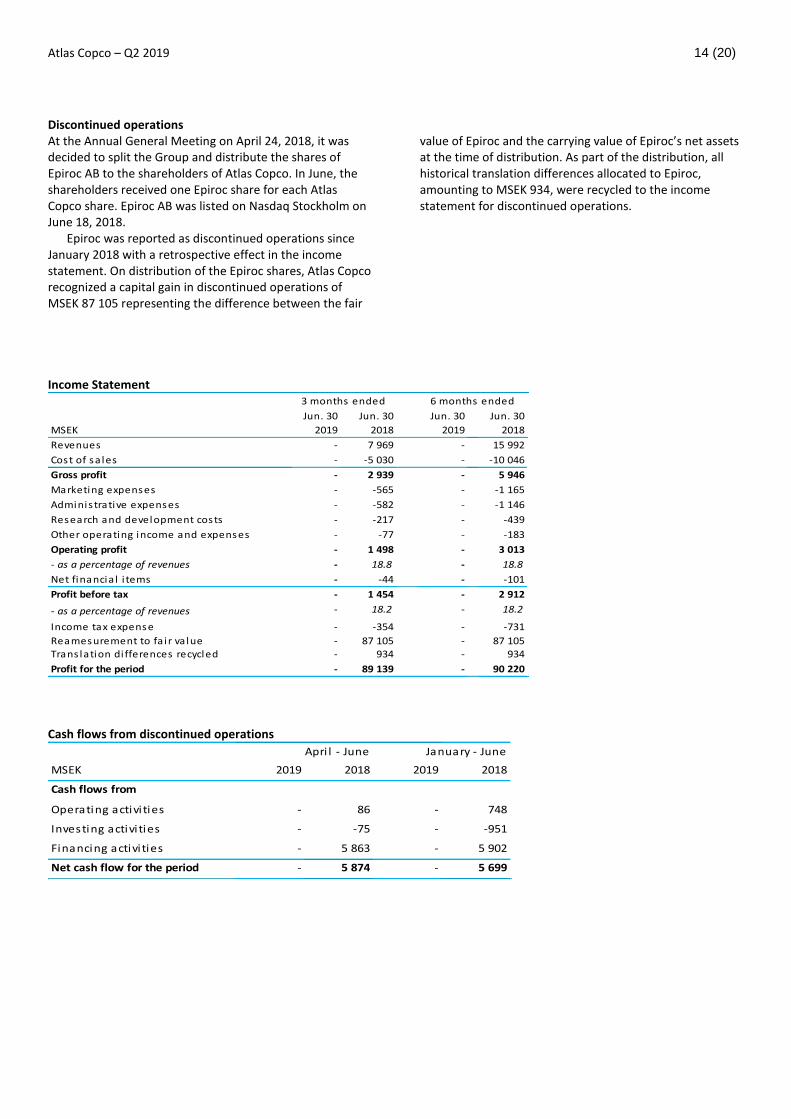
Discontinued operations
At the Annual General Meeting on April 24, 2018, it was decided to split the Group and distribute the shares of Epiroc AB to the shareholders of Atlas Copco. In June, the shareholders received one Epiroc share for each Atlas Copco share. Epiroc AB was listed on Nasdaq Stockholm on June 18, 2018.
Epiroc was reported as discontinued operations since January 2018 with a retrospective effect in the income statement. On distribution of the Epiroc shares, Atlas Copco recognized a capital gain in discontinued operations of MSEK 87 105 representing the difference between the fair
value of Epiroc and the carrying value of Epiroc’s net assets at the time of distribution. As part of the distribution, all historical translation differences allocated to Epiroc, amounting to MSEK 934, were recycled to the income statement for discontinued operations.
Income Statement
Jun. 30 Jun. 30 Jun. 30 Jun. 30
MSEK 2019 2018 2019 2018
Revenues - 7 969 - 15 992
Cost of sa les - -5 030 - -10 046
Gross profit - 2 939 - 5 946
Marketing expenses - -565 - -1 165
Adminis trative expenses - -582 - -1 146
Research and development costs - -217 - -439
Other operating income and expenses - -77 - -183
Operating profit - 1 498 - 3 013
- as a percentage of revenues - 18.8 - 18.8
Net financia l i tems - -44 - -101
Profit before tax - 1 454 - 2 912
- as a percentage of revenues - 18.2 - 18.2
Income tax expense - -354 - -731
Reamesurement to fa i r va lue - 87 105 - 87 105Trans lation di fferences recycled - 934 - 934
Profit for the period - 89 139 - 90 220
6 months ended3 months ended
Cash flows from discontinued operations
MSEK 2019 2018 2019 2018
Cash flows from
Operating activi ties - 86 - 748
Investing activi ties - -75 - -951
Financing activi ties - 5 863 - 5 902
Net cash flow for the period - 5 874 - 5 699
Apri l - June January - June
Atlas Copco – Q2 2019 15 (20)
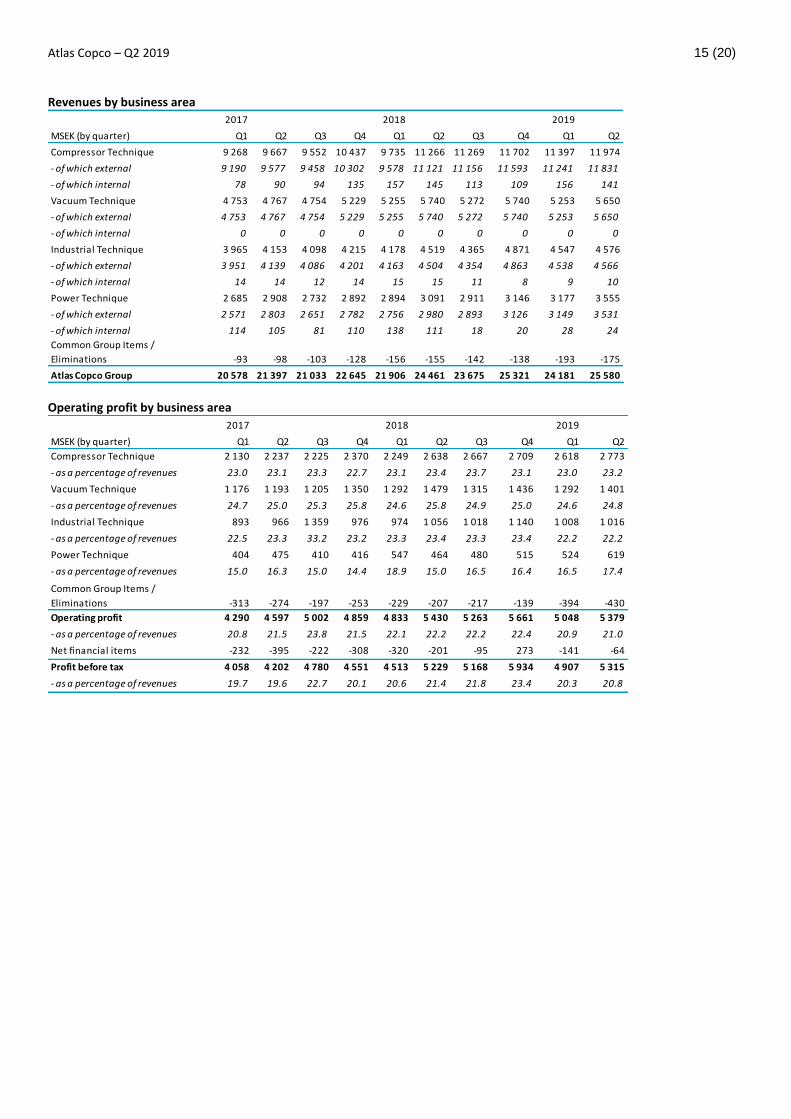
Revenues by business area
2017 2018 2019
MSEK (by quarter) Q1 Q2 Q3 Q4 Q1 Q2 Q3 Q4 Q1 Q2
Compressor Technique 9 268 9 667 9 552 10 437 9 735 11 266 11 269 11 702 11 397 11 974
- of which external 9 190 9 577 9 458 10 302 9 578 11 121 11 156 11 593 11 241 11 831
- of which internal 78 90 94 135 157 145 113 109 156 141
Vacuum Technique 4 753 4 767 4 754 5 229 5 255 5 740 5 272 5 740 5 253 5 650
- of which external 4 753 4 767 4 754 5 229 5 255 5 740 5 272 5 740 5 253 5 650
- of which internal 0 0 0 0 0 0 0 0 0 0
Industrial Technique 3 965 4 153 4 098 4 215 4 178 4 519 4 365 4 871 4 547 4 576
- of which external 3 951 4 139 4 086 4 201 4 163 4 504 4 354 4 863 4 538 4 566
- of which internal 14 14 12 14 15 15 11 8 9 10
Power Technique 2 685 2 908 2 732 2 892 2 894 3 091 2 911 3 146 3 177 3 555
- of which external 2 571 2 803 2 651 2 782 2 756 2 980 2 893 3 126 3 149 3 531
- of which internal 114 105 81 110 138 111 18 20 28 24
Common Group Items /
Eliminations -93 -98 -103 -128 -156 -155 -142 -138 -193 -175
Atlas Copco Group 20 578 21 397 21 033 22 645 21 906 24 461 23 675 25 321 24 181 25 580 Operating profit by business area
2017 2018 2019
MSEK (by quarter) Q1 Q2 Q3 Q4 Q1 Q2 Q3 Q4 Q1 Q2
Compressor Technique 2 130 2 237 2 225 2 370 2 249 2 638 2 667 2 709 2 618 2 773
- as a percentage of revenues 23.0 23.1 23.3 22.7 23.1 23.4 23.7 23.1 23.0 23.2
Vacuum Technique 1 176 1 193 1 205 1 350 1 292 1 479 1 315 1 436 1 292 1 401
- as a percentage of revenues 24.7 25.0 25.3 25.8 24.6 25.8 24.9 25.0 24.6 24.8
Industrial Technique 893 966 1 359 976 974 1 056 1 018 1 140 1 008 1 016
- as a percentage of revenues 22.5 23.3 33.2 23.2 23.3 23.4 23.3 23.4 22.2 22.2
Power Technique 404 475 410 416 547 464 480 515 524 619
- as a percentage of revenues 15.0 16.3 15.0 14.4 18.9 15.0 16.5 16.4 16.5 17.4
Common Group Items /
Eliminations -313 -274 -197 -253 -229 -207 -217 -139 -394 -430
Operating profit 4 290 4 597 5 002 4 859 4 833 5 430 5 263 5 661 5 048 5 379
- as a percentage of revenues 20.8 21.5 23.8 21.5 22.1 22.2 22.2 22.4 20.9 21.0
Net financial items -232 -395 -222 -308 -320 -201 -95 273 -141 -64
Profit before tax 4 058 4 202 4 780 4 551 4 513 5 229 5 168 5 934 4 907 5 315
- as a percentage of revenues 19.7 19.6 22.7 20.1 20.6 21.4 21.8 23.4 20.3 20.8
Atlas Copco – Q2 2019 16 (20)
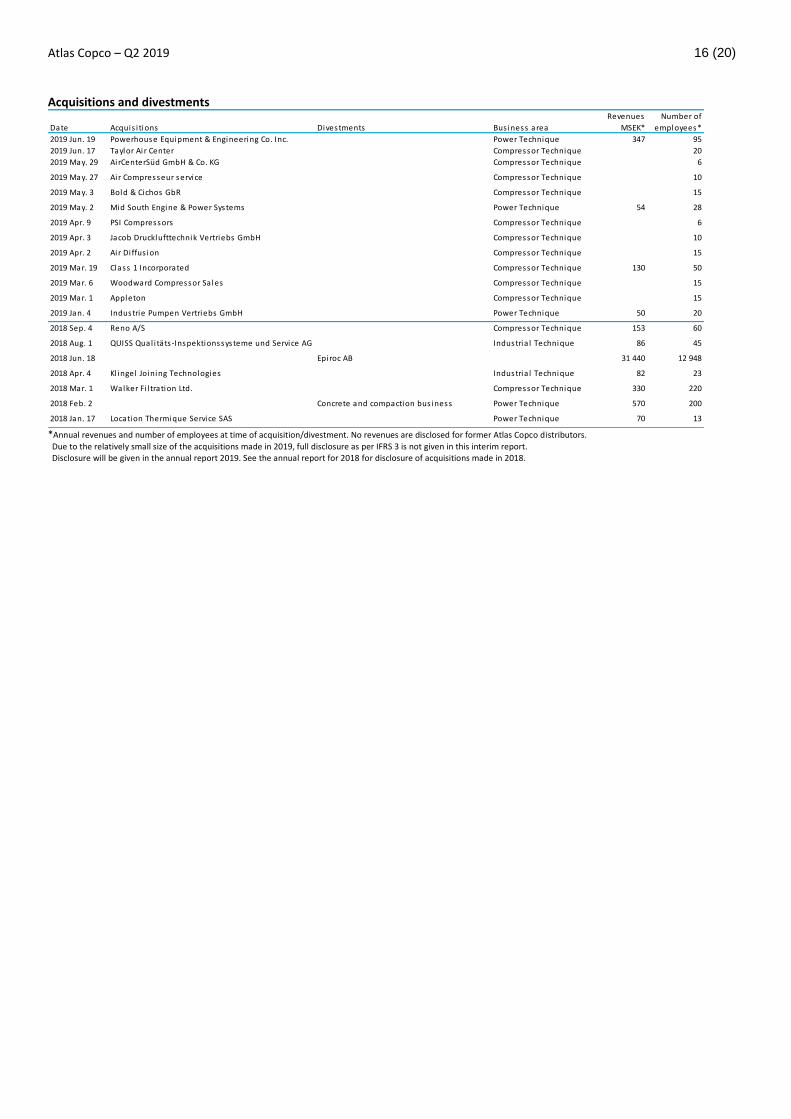
Acquisitions and divestments Revenues Number of
Date Acquis i tions Divestments Bus iness area MSEK* employees*
2019 Jun. 19 Powerhouse Equipment & Engineering Co. Inc. Power Technique 347 95
2019 Jun. 17 Taylor Ai r Center Compressor Technique 20
2019 May. 29 AirCenterSüd GmbH & Co. KG Compressor Technique 6
2019 May. 27 Air Compresseur service Compressor Technique 10
2019 May. 3 Bold & Cichos GbR Compressor Technique 15
2019 May. 2 Mid South Engine & Power Systems Power Technique 54 28
2019 Apr. 9 PSI Compressors Compressor Technique 6
2019 Apr. 3 Jacob Drucklufttechnik Vertriebs GmbH Compressor Technique 10
2019 Apr. 2 Ai r Di ffus ion Compressor Technique 15
2019 Mar. 19 Class 1 Incorporated Compressor Technique 130 50
2019 Mar. 6 Woodward Compressor Sa les Compressor Technique 15
2019 Mar. 1 Appleton Compressor Technique 15
2019 Jan. 4 Industrie Pumpen Vertriebs GmbH Power Technique 50 20
2018 Sep. 4 Reno A/S Compressor Technique 153 60
2018 Aug. 1 QUISS Qual i täts -Inspektionssysteme und Service AG Industria l Technique 86 45
2018 Jun. 18 Epiroc AB 31 440 12 948
2018 Apr. 4 Kl ingel Joining Technologies Industria l Technique 82 23
2018 Mar. 1 Walker Fi l tration Ltd. Compressor Technique 330 220
2018 Feb. 2 Concrete and compaction bus iness Power Technique 570 200
2018 Jan. 17 Location Thermique Service SAS Power Technique 70 13 *Annual revenues and number of employees at time of acquisition/divestment. No revenues are disclosed for former Atlas Copco distributors.
Due to the relatively small size of the acquisitions made in 2019, full disclosure as per IFRS 3 is not given in this interim report. Disclosure will be given in the annual report 2019. See the annual report for 2018 for disclosure of acquisitions made in 2018.
Atlas Copco – Q2 2019 17 (20)
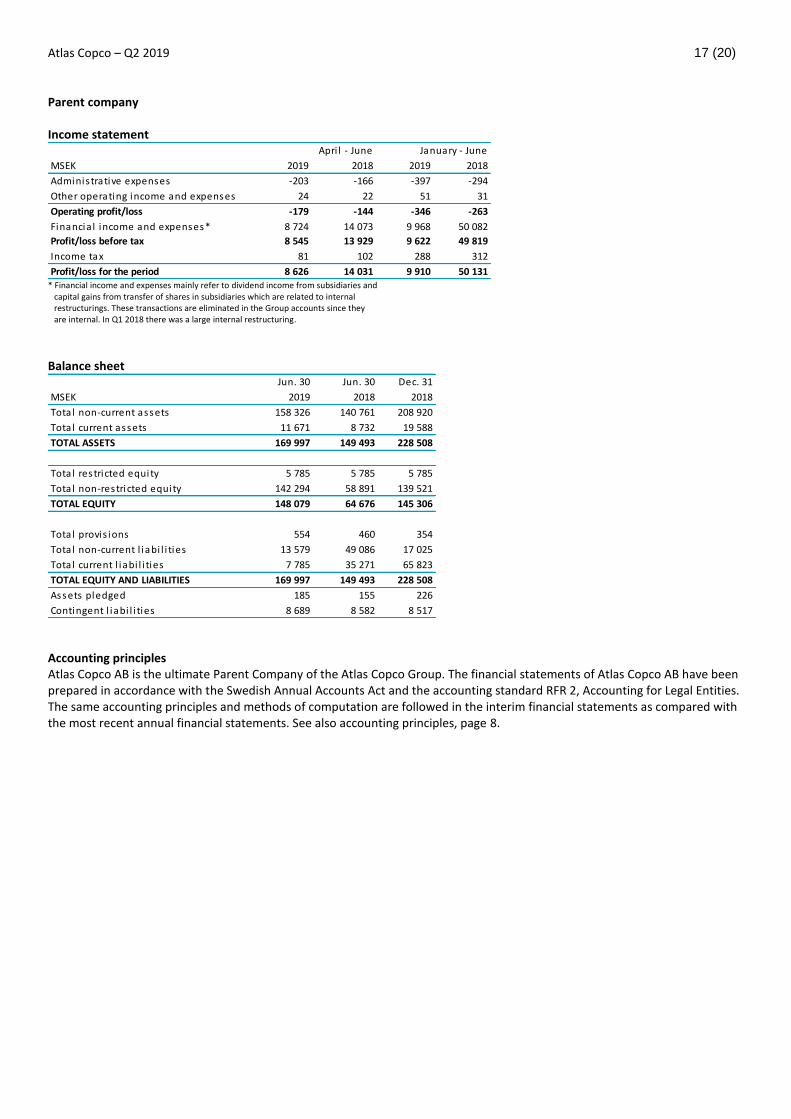
Parent company Income statement
MSEK 2019 2018 2019 2018
Administrative expenses -203 -166 -397 -294
Other operating income and expenses 24 22 51 31
Operating profit/loss -179 -144 -346 -263
Financia l income and expenses* 8 724 14 073 9 968 50 082
Profit/loss before tax 8 545 13 929 9 622 49 819
Income tax 81 102 288 312
Profit/loss for the period 8 626 14 031 9 910 50 131
Apri l - June January - June
* Financial income and expenses mainly refer to dividend income from subsidiaries and capital gains from transfer of shares in subsidiaries which are related to internal restructurings. These transactions are eliminated in the Group accounts since they are internal. In Q1 2018 there was a large internal restructuring.
Balance sheet
Jun. 30 Jun. 30 Dec. 31
MSEK 2019 2018 2018
Total non-current assets 158 326 140 761 208 920
Total current assets 11 671 8 732 19 588
TOTAL ASSETS 169 997 149 493 228 508
Total restricted equity 5 785 5 785 5 785
Total non-restricted equity 142 294 58 891 139 521
TOTAL EQUITY 148 079 64 676 145 306
Total provis ions 554 460 354
Total non-current l iabi l i ties 13 579 49 086 17 025
Total current l iabi l i ties 7 785 35 271 65 823
TOTAL EQUITY AND LIABILITIES 169 997 149 493 228 508
Assets pledged 185 155 226
Contingent l iabi l i ties 8 689 8 582 8 517
Accounting principles Atlas Copco AB is the ultimate Parent Company of the Atlas Copco Group. The financial statements of Atlas Copco AB have been prepared in accordance with the Swedish Annual Accounts Act and the accounting standard RFR 2, Accounting for Legal Entities. The same accounting principles and methods of computation are followed in the interim financial statements as compared with the most recent annual financial statements. See also accounting principles, page 8.
Atlas Copco – Q2 2019 18 (20)
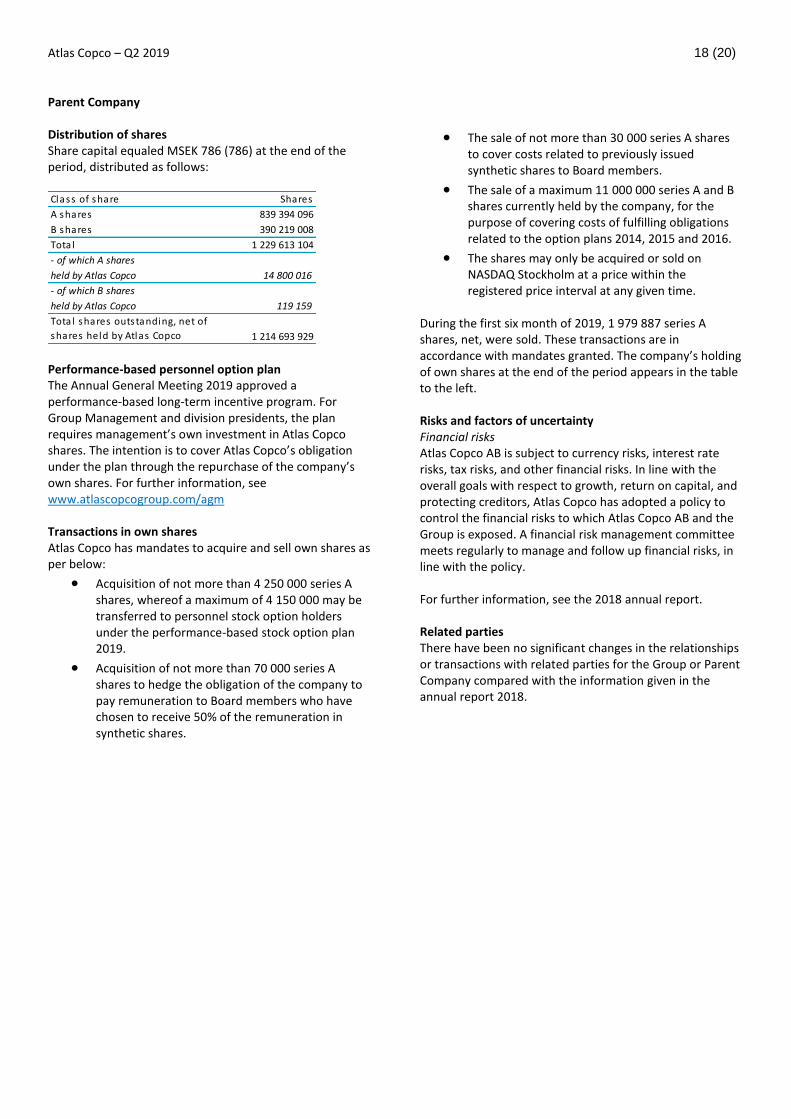
Parent Company Distribution of shares Share capital equaled MSEK 786 (786) at the end of the period, distributed as follows: Class of share Shares
A shares 839 394 096
B shares 390 219 008
Tota l 1 229 613 104
- of which A shares
held by Atlas Copco 14 800 016
- of which B shares
held by Atlas Copco 119 159
1 214 693 929
Tota l shares outstanding, net of
shares held by Atlas Copco Performance-based personnel option plan The Annual General Meeting 2019 approved a performance-based long-term incentive program. For Group Management and division presidents, the plan requires management’s own investment in Atlas Copco shares. The intention is to cover Atlas Copco’s obligation under the plan through the repurchase of the company’s own shares. For further information, see www.atlascopcogroup.com/agm Transactions in own shares Atlas Copco has mandates to acquire and sell own shares as per below:
Acquisition of not more than 4 250 000 series A shares, whereof a maximum of 4 150 000 may be transferred to personnel stock option holders under the performance-based stock option plan 2019.
Acquisition of not more than 70 000 series A shares to hedge the obligation of the company to pay remuneration to Board members who have chosen to receive 50% of the remuneration in synthetic shares.
The sale of not more than 30 000 series A shares to cover costs related to previously issued synthetic shares to Board members.
The sale of a maximum 11 000 000 series A and B shares currently held by the company, for the purpose of covering costs of fulfilling obligations related to the option plans 2014, 2015 and 2016.
The shares may only be acquired or sold on NASDAQ Stockholm at a price within the registered price interval at any given time.
During the first six month of 2019, 1 979 887 series A shares, net, were sold. These transactions are in accordance with mandates granted. The company’s holding of own shares at the end of the period appears in the table to the left. Risks and factors of uncertainty Financial risks Atlas Copco AB is subject to currency risks, interest rate risks, tax risks, and other financial risks. In line with the overall goals with respect to growth, return on capital, and protecting creditors, Atlas Copco has adopted a policy to control the financial risks to which Atlas Copco AB and the Group is exposed. A financial risk management committee meets regularly to manage and follow up financial risks, in line with the policy. For further information, see the 2018 annual report. Related parties There have been no significant changes in the relationships or transactions with related parties for the Group or Parent Company compared with the information given in the annual report 2018.
Atlas Copco – Q2 2019 19 (20)
This is Atlas Copco Atlas Copco Group is a world-leading provider of sustainable productivity solutions. The Group offers customers innovative compressors, air treatment systems, vacuum solutions, industrial power tools and assembly systems, and power and flow solutions. Atlas Copco develops products and services focused on productivity, energy efficiency, safety and ergonomics. The company was founded in 1873, is based in Stockholm, Sweden, and has a global reach spanning more than 180 countries. In 2018, Atlas Copco had revenues of BSEK 95 (BEUR 9) and approximately 37 000 employees. Business areas Atlas Copco has four business areas. The business areas are responsible for developing their respective operations by implementing and following up on strategies and objectives to achieve sustainable, profitable growth. The Compressor Technique business area provides compressed air solutions; industrial compressors, gas and process compressors and expanders, air and gas treatment equipment and air management systems. The business area has a global service network and innovates for sustainable productivity in the manufacturing, oil and gas, and process industries. Principal product development and manufacturing units are located in Belgium, the United States, China, India, Germany and Italy. The Vacuum Technique business area provides vacuum products, exhaust management systems, valves and related products mainly under the Edwards, Leybold and Atlas Copco brands. The main markets served are semiconductor and scientific as well as a wide range of industrial segments including chemical process industries, food packaging and paper handling. The business area has a global service network and innovates for sustainable productivity in order to further improve its customers’ performance. Principal product development and manufacturing units are located in the United Kingdom, Czech Republic, Germany, South Korea, China and Japan. The Industrial Technique business area provides, through a global network, industrial power tools and assembly solutions, including tightening, bolting, riveting, adhesive dispensing, quality assurance products, material removal, software and service. The business area innovates for sustainable productivity for customers in the automotive and general industries, maintenance and vehicle service. Principal product development and manufacturing units are located in Sweden, Germany, United States, United Kingdom, France, Japan and Hungary. The Power Technique business area provides air, power and flow solutions through products such as mobile compressors, pumps, light towers and generators, along with a number of complementary products. It also offers specialty rental and provides services through a dedicated, global network. Guided by a forward-thinking approach to innovation, Power Technique provides sustainable productivity solutions across multiple industries, including construction, manufacturing, oil and gas and exploration drilling. Principal product development and manufacturing units are located in Belgium, Spain, the United States, China and India.
Vision, mission and strategy The Atlas Copco Group’s vision is to become and remain First in Mind—First in Choice of its customers and other principal stakeholders. The mission is to achieve sustainable, profitable growth. Sustainability plays an important role in Atlas Copco’s vision and it is an integral aspect of the Group’s mission. An integrated sustainability strategy, backed by ambitious goals, helps the company deliver greater value to all its stakeholders in a way that is economically, environmentally and socially responsible. For further information
• Analysts and investors Daniel Althoff, Vice President Investor Relations Phone: +46 8 743 95 97 or +46 768 99 95 97 [email protected]
• Media
Sara Liljedal, Media Relations Manager Phone: +46 8 743 80 60 or +46 72 144 10 38 [email protected]
Conference call A presentation for investors, analysts and media will be held on July 15, 2019 at 2.00 PM CEST. The dial-in numbers are:
Sweden: +46 8 505 583 68
United Kingdom: +44 33 330 092 71
United States: +1 833 526 8382
The conference call will be broadcasted. Please see our website for link and presentation material: http://www.atlascopcogroup.com/investor-relations The recorded audio presentation will be available on our homepage following the conference call. Third-quarter report 2019 The Q3 2019 report will be published on October 21, 2019. (Silent period starts September 23, 2019) Capital Markets Day 2019 Atlas Copco will host its annual Capital Markets Day on November 26, 2019 in the Brighton area in the United Kingdom. Fourth-quarter report 2019 The Q4 2019 report will be published on January 28, 2020. (Silent period starts December 31, 2019)
This information is information that Atlas Copco AB is obliged to make public pursuant to the EU Market Abuse Regulation and the Securities Markets Act. The information was submitted for publication, through the contact person set out above, at 12.00 CEST on July 15, 2019.
Atlas Copco – Q2 2019 20 (20)
The Board of Directors and President declare that the interim report gives a fair view of the business development, financial position and result of operation of the Parent Company and the consolidated Group, and describes significant risks and uncertainties that the parent company and its subsidiaries are facing.
Nacka, July 15, 2019
Atlas Copco AB
Hans Stråberg Chairman
Gunilla Berg Director
Staffan Bohman Director
Tina Donikowski Director
Johan Forssell Director
Sabine Neuß Director
Mats Rahmström Director
President and CEO
Anders Ullberg Director
Peter Wallenberg Jr Director
Mikael Bergstedt Director
Union representative
Benny Larsson Director
Union representative
Auditors’ Review Report Introduction We have reviewed the interim report for Atlas Copco AB for the period January 1 - June 30, 2019. The Board of Directors and the President are responsible for the preparation and presentation of this interim report in accordance with IAS 34 and the Annual Accounts Act. Our responsibility is to express a conclusion on this interim report based on our review. Scope of Review We conducted our review in accordance with International Standard on Review Engagements ISRE 2410, Review of Interim Financial Information Performed by the Independent Auditor of the Entity. A review consists of making inquiries, primarily of persons responsible for financial and accounting matters, and applying analytical and other review procedures. A review has a different focus
and is substantially less in scope than an audit conducted in accordance with ISA and other generally accepted auditing practices. The procedures performed in a review do not enable us to obtain a level of assurance that would make us aware of all significant matters that might be identified in an audit. Therefore, the conclusion expressed based on a review does not give the same level of assurance as a conclusion expressed based on an audit. Conclusion Based on our review, nothing has come to our attention that causes us to believe that the interim report is not, in all material respects, prepared for the Group in accordance with IAS 34 and the Annual Accounts Act, and for the Parent Company in accordance with the Annual Accounts Act.
Nacka, July 15, 2019
Deloitte AB
Thomas Strömberg Authorized Public Accountant


![Atlas Copco (India) Limited · 3. Atlas Copco International B.V. ACO0101339 4. Atlas Copco AB ACO0101595, ACO0101097, A 0005191 and 10177354 5. Atlas Copco [I] Ltd Charitable Foundation](https://img.pdfslide.us/doc/110x75/5ec4197bfe534e04f779e397/atlas-copco-india-limited-3-atlas-copco-international-bv-aco0101339-4-atlas.jpg)