Embed Size (px)
Citation preview
OUR VISIONA progressive region creating opportunities for all
OUR MISSIONWe are a council committed to continuous improvement, a sustainable
future and efficient investment in our communities
OUR VALUESRespect and Integrity
Accountability and TransparencyProviding Value
Commitment and Teamwork
OUR PRIORITIESStrong, vibrant communities
Building and maintaining quality infrastructureSupporting our local economy
Protecting our people and our environmentLeadership and governance
Our organisation
Finance and Infrastructure Standing Committee Meeting
Notice is hereby given pursuant to the provisions of the Local Government Regulation 2012, that the next Meeting of the Central Highlands Regional Council will be held in the Council Chambers, 65 Egerton Street, Emerald on
Tuesday, 9 July 2019At 8.30 am
For the purpose of considering the items included on the Agenda.
Rodney FergusonActing Chief Executive Officer
CO
UN
CIL
AG
END
A
20190709 - Finance and Infrastructure Standing Committee Meeting - Agenda
Central Highlands Regional Council 2 of 84
AGENDA CONTENTS1 PRESENT ..................................................................................................................................................32 APOLOGIES..............................................................................................................................................33 LEAVE OF ABSENCE...............................................................................................................................34 CONFIRMATION OF MINUTES OF PREVIOUS MEETING .....................................................................34.1 Minutes - Finance and Infrastructure Standing Committee Meeting - 11 June 2019 ................................35 BUSINESS ARISING OUT OF MINUTES ...............................................................................................126 REVIEW OF OUTSTANDING MEETING ACTIONS ...............................................................................127 REVIEW OF UPCOMING AGENDA ITEMS............................................................................................128 MATERIAL PERSONAL INTEREST, CONFLICT OF INTEREST, PERSONAL GIFTS AND BENEFITS
.................................................................................................................................................................129 INFORMATION REPORTS .....................................................................................................................139.1 Customer and Commercial Services.......................................................................................................13
9.1.1 Emerald Airport Advisory Committee Meeting Minutes - 3 June 2019 ..... approx 5 mins ...............139.1.2 Customer and Commercial Services Departmental Update ..... approx 10 mins .............................23
9.2 Infrastructure and Utilities .......................................................................................................................439.2.1 Infrastructure and Utilities - Departmental Update .... approx 10 mins.............................................43
10 GENERAL BUSINESS ............................................................................................................................8411 CLOSURE OF MEETING ........................................................................................................................84
20190709 - Finance and Infrastructure Standing Committee Meeting - Agenda
Central Highlands Regional Council 3 of 84
1 PRESENT
2 APOLOGIES
3 LEAVE OF ABSENCE
4 CONFIRMATION OF MINUTES OF PREVIOUS MEETING
4.1 Minutes - Finance and Infrastructure Standing Committee Meeting - 11 June 2019
Finance and Infrastructure Standing Committee Meeting
Meeting of the Central Highlands Regional Council Finance and Infrastructure Standing Committee Meeting held in the Council Chambers, 65 Egerton Street, Emerald on
Tuesday, 11 June 2019
Commenced at 8.30am
CO
UN
CIL
MIN
UT
ES
20190709 - Finance and Infrastructure Standing Committee Meeting - Agenda
Central Highlands Regional Council 4 of 84
CENTRAL HIGHLANDS REGIONAL COUNCIL
FINANCE AND INFRASTRUCTURE STANDING COMMITTEE MEETING
TUESDAY 11 JUNE 2019
MINUTES CONTENTS
PRESENT .................................................................................................................................................... 2
APOLOGIES ................................................................................................................................................ 2
LEAVE OF ABSENCE ................................................................................................................................. 2
CONFIRMATION OF MINUTES OF PREVIOUS MEETING ......................................................................... 2
Finance and Infrastructure Standing Committee Meeting: 14 May 2019 ....................................................... 2
Business Arising Out Of Minutes .................................................................................................................. 2
Outstanding Meeting Actions ........................................................................................................................ 2
Review of Upcoming Agenda Items .............................................................................................................. 2
MATERIAL PERSONAL INTEREST, CONFLICT OF INTEREST, PERSONAL GIFTS AND BENEFITS .... 2
PETITIONS (IF ANY) ................................................................................................................................... 2
DECISION ACTION REPORT ...................................................................................................................... 3
Customer and Commercial Services ............................................................................................................. 3
Australian Airports Association National Conference – Gold Coast............................................................... 3
INFORMATION REPORT ............................................................................................................................ 3
Customer and Commercial Services ............................................................................................................. 3
Emerald Airport Advisory Committee Meeting Minutes – 17 April 2019 ........................................................ 3
Customer and Commercial Services ............................................................................................................. 4
Emerald Saleyards Coordination Committee Meeting Minutes – 22 May 2019 ............................................. 4
Customer and Commercial Services – Departmental Update ....................................................................... 4
CLOSED SESSION ...................................................................................................................................... 5
Procurement Exception - Engagement GQI Consulting - Radio Communications Network Advisory ............ 6
Services ....................................................................................................................................................... 6
GENERAL BUSINESS ................................................................................................................................. 6
Investigate flood boat accessibility on the Comet River and Panorama Creek to support the township ........ 6
of Rolleston in flood situations ...................................................................................................................... 6
CLOSURE OF MEETING ............................................................................................................................. 7
20190709 - Finance and Infrastructure Standing Committee Meeting - Agenda
Central Highlands Regional Council 5 of 84
MINUTES – FINANCE AND INFRASTRUCTURE STANDING COMMITTEE MEETING – TUESDAY 11 JUNE 2019 – PAGE 2
MINUTES – FINANCE AND INFRASTRUCTURE STANDING COMMITTEE MEETING HELD AT 8.30AM TUESDAY 11 JUNE 2019 IN THE CENTRAL HIGHLANDS REGIONAL COUNCIL CHAMBERS, EMERALD OFFICE
PRESENT Councillors Councillor (Crs) K. Hayes (Mayor), G. Godwin-Smith (Deputy Mayor / Chair) Councillors C. Brimblecombe, M. Daniels, G. Nixon and C. Rolfe Officers General Manager Corporate Services M. Gatt, General Manager Infrastructure and Utilities G. Joubert, General Manager Commercial Services M. Webster, Minute Secretary L. Pugh. Observer(s) Nil APOLOGIES Nil LEAVE OF ABSENCE Nil CONFIRMATION OF MINUTES OF PREVIOUS MEETING Finance and Infrastructure Standing Committee Meeting: 14 May 2019 Resolution:
Cr Brimblecombe moved and seconded by Cr Rolfe “That the minutes of the previous Finance and Infrastructure Standing Committee Meeting held on 14 May 2019 be confirmed.” FISC 2019 / 06 / 11 / 001 Carried (5-0)
Attendance Information Technology Trainee L. Verrall attended the meeting at 8:33am. Executive Assistant (Mayor and Councillors) M. Wills attended the meeting at 8:33am. Executive Assistant (Mayor and Councillors) M. Wills left the meeting at 8:34am. Cr M. Daniels attended the meeting at 8:35am. Information Technology Trainee L. Verrall left the meeting at 8:36am. Business Arising Out Of Minutes Nil Outstanding Meeting Actions Nil Review of Upcoming Agenda Items Nil MATERIAL PERSONAL INTEREST, CONFLICT OF INTEREST, PERSONAL GIFTS AND BENEFITS Nil PETITIONS (IF ANY) Nil
20190709 - Finance and Infrastructure Standing Committee Meeting - Agenda
Central Highlands Regional Council 6 of 84
MINUTES – FINANCE AND INFRASTRUCTURE STANDING COMMITTEE MEETING – TUESDAY 11 JUNE 2019 – PAGE 3
DECISION ACTION REPORT Customer and Commercial Services Australian Airports Association National Conference – Gold Coast Executive Summary: The Australian Airports Associations’ National Conference will be held on the Gold Coast from Tuesday 19 to Friday 22 November 2019. The National Conference provides an opportunity to hear the latest innovations in airport technology, learn about the latest developments in best practice principles and discover ways to increase non-aeronautical revenue. As per previous years, there is a dedicated Regional Airport Stream on day two.
Resolution:
Cr Rolfe moved and seconded by Cr Nixon “That the Central Highlands Regional Council endorse Councillor A. McIndoe, subject to availability, to attend the Australian Airports Associations’ National Conference which is being held on the Gold Coast from 19 to 22 November 2019. FISC 2019 / 06 / 11 / 002 Carried (6-0)
Attendance Manager Airport S. Kloppers attended the meeting at 8:40am.
INFORMATION REPORT Customer and Commercial Services
Emerald Airport Advisory Committee Meeting Minutes – 17 April 2019 Executive Summary: The Emerald Airport Advisory Committee held their quarterly meeting on 17 April 2019. Items discussed during the committee meeting included Workplace Health and Safety, Financial Update, Operational Matters and Capital Works Projects.
Resolution:
Cr Brimblecombe moved and seconded by Cr Nixon “That Central Highlands Regional Council receive the minutes of the Emerald Airport Advisory Committee meeting held on 17 April 2019.”
FISC 2019 / 06 / 11 / 003 Carried (6-0)
20190709 - Finance and Infrastructure Standing Committee Meeting - Agenda
Central Highlands Regional Council 7 of 84
MINUTES – FINANCE AND INFRASTRUCTURE STANDING COMMITTEE MEETING – TUESDAY 11 JUNE 2019 – PAGE 4
Customer and Commercial Services
Emerald Saleyards Coordination Committee Meeting Minutes – 22 May 2019
Executive Summary: The Emerald Saleyards Coordination Committee held their quarterly meeting on 22 May 2019. Items discussed during the committee meeting included Workplace Health and Safety, Financial Update, Saleyards Stakeholder Engagement, Operational Matters and Capital Works Projects.
Resolution:
Cr Rolfe moved and seconded by Cr Daniels “That Central Highlands Regional Council receive the minutes
of the Emerald Saleyards Coordination Committee meeting held on 22 May 2019.”
FISC 2019 / 06 / 11 / 004 Carried (6-0)
Attendance Business Systems Trainee D. Walters attended the meeting at 8:55am. Customer and Commercial Services – Departmental Update
Executive Summary: The following report provides an update on key activities for the Customer and Commercial Services department.
Airport Quarry Saleyards Property Services General Manager
Resolution:
Cr Rolfe moved and seconded by Cr Nixon “That Central Highlands Regional Council receive the Customer and Commercial Services departmental update report, highlighting key activities for the month of May 2019”
FISC 2019 / 06 / 11 / 005 Carried (6-0)
Attendance Manager Airport S. Kloppers left the meeting at 9:05am. General Manager Corporate Services M. Gatt left the meeting at 9:13am. General Manager Corporate Services M. Gatt attended the meeting at 9:14am. General Manager Customer and Commercial Services M. Webster left the meeting at 9:15am. General Manager Customer and Commercial Services M. Webster attended the meeting at 9:16am. Manager Infrastructure J. Hoolihan, Manager Water Utilities P. Manning and Manager Project Development and Contract Delivery K. Downey attended the meeting at 9:16am.
20190709 - Finance and Infrastructure Standing Committee Meeting - Agenda
Central Highlands Regional Council 8 of 84
MINUTES – FINANCE AND INFRASTRUCTURE STANDING COMMITTEE MEETING – TUESDAY 11 JUNE 2019 – PAGE 5
Infrastructure and Utilities – Departmental Update Executive Summary: The following report provides an update on key activities for the Infrastructure and Utilities department.
Monthly Capex Update
Tenders for passing lanes – Capricorn Highway
OzWater’19 Regional Scholarship
Water Skills Partnership
Central Queensland Bushfires Flexible Funding Grant
Central Queensland University Diploma Program – Diploma of public safety
SES Volunteer Karen Peters - SES Award presented by Governor General Resolution:
Cr Daniels moved and seconded by Cr Brimblecombe “That Central Highlands Regional Council receive the Infrastructure and Utilities departmental update report, highlighting key activities for the month of May 2019.” FISC 2019 / 06 / 11 / 006 Carried (6-0)
Attendance Business Systems Trainee D. Walters left the meeting at 9:21am. Manager Infrastructure J. Hoolihan, Manager Water Utilities P. Manning and Manager Project Development and Contract Delivery K. Downey left the meeting at 9:34am.
CLOSED SESSION Into Closed Session Resolution:
Cr Nixon moved and seconded by Cr Brimblecombe “That Council close its meeting to the public in accordance with Section 275 (1) (e) of the Local Government Regulation 2012 and that Council staff involved in the closed discussions remain in the room.”
FISC 2019 / 06 / 11 / 007 Carried (6-0)
The meeting was closed at 9:35am. Procurement Exception - Engagement GQI Consulting - Radio Communications Network Advisory Services Out of Closed Session Resolution:
Cr Brimblecombe moved and seconded by Cr Rolfe “That the meeting now be re-opened to the public.” FISC 2019 / 06 / 11 / 008 Carried (6-0)
The meeting was opened at 9:48am.
20190709 - Finance and Infrastructure Standing Committee Meeting - Agenda
Central Highlands Regional Council 9 of 84
MINUTES – FINANCE AND INFRASTRUCTURE STANDING COMMITTEE MEETING – TUESDAY 11 JUNE 2019 – PAGE 6
Procurement Exception - Engagement GQI Consulting - Radio Communications Network Advisory Services EXECUTIVE SUMMARY: Approval is sought from Council to engage GQI Consulting Pty Ltd to provide Radio Communication Networks Technical Advisory Services, without inviting tenders as required by The Local Government Act 2009 (the Act) and the Local Government Regulation 2012 (the Regulation). Section 235(b) of the Local Government Regulation 2012 provides for an exception to the requirements to invite quotes or tenders where the local government resolves that it is satisfied there is only one supplier reasonably available or where it would be impractical or disadvantageous to request quotes because of the specialised or confidential nature of the services.
Council is satisfied that GQI Consulting Pty Ltd has extensive specialist experience to impartially and strategically provide Radio Communication Networks Technical Advisory Services, given they have provided the same strategic service to other local governments, are currently undertaking an audit of all agencies and providing strategic advice to state government. Resolution:
Cr Brimblecombe moved and seconded by Cr Rolfe “That Central Highlands Regional Council enter into a contract with GQI Consulting Pty Ltd under Section 235(b) of the Local Government Regulation 2012 without first inviting written quotes or tenders, because of the specialised nature of the services that are sought and that it would be inefficient, impractical or disadvantageous to invite quotes or tenders.
And further That the Central Highlands Regional Council is satisfied that GQI Consulting Pty Ltd can deliver value for money, quality work and have the expertise to carry out and complete the various tasks assigned to them.” FISC 2019 / 06 / 11 / 009 Carried (6-0)
GENERAL BUSINESS
Investigate flood boat accessibility on the Comet River and Panorama Creek to support the township of Rolleston in flood situations Resolution:
Cr Nixon moved and seconded by Cr Daniels “That Central Highlands Regional Council investigate flood boat accessibility on the Comet River and Panorama Creek to support the township of Rolleston in flood situations and report back to Council on options and cost.” FISC 2019 / 06 / 11 / 010 Carried (6-0) Infrastructure and Utilities department to report back to Finance and Infrastructure Standing Committee with details regarding Federal Government funding commitment to the proposed upgrade of Willies Creek Road, guidelines for project and co-contribution requirements of Council or local ratepayers.
20190709 - Finance and Infrastructure Standing Committee Meeting - Agenda
Central Highlands Regional Council 10 of 84
MINUTES – FINANCE AND INFRASTRUCTURE STANDING COMMITTEE MEETING – TUESDAY 11 JUNE 2019 – PAGE 7
CLOSURE OF MEETING There being no further business, the Chair closed the meeting at 10:01am. CONFIRMED CHAIR DATE
20190709 - Finance and Infrastructure Standing Committee Meeting - Agenda
Central Highlands Regional Council 11 of 84

20190709 - Finance and Infrastructure Standing Committee Meeting - Agenda
Central Highlands Regional Council 12 of 84
5 BUSINESS ARISING OUT OF MINUTES
6 REVIEW OF OUTSTANDING MEETING ACTIONS
7 REVIEW OF UPCOMING AGENDA ITEMS
8 MATERIAL PERSONAL INTEREST, CONFLICT OF INTEREST, PERSONAL GIFTS AND BENEFITS
20190709 - Finance and Infrastructure Standing Committee Meeting - Agenda
Central Highlands Regional Council 13 of 84
9 INFORMATION REPORTS
9.1 Customer and Commercial Services
9.1.1 Emerald Airport Advisory Committee Meeting Minutes - 3 June 2019 ..... approx 5 mins
INFORMATION REPORT
Date: 9 July 2019 Presentation Duration: Approx. 5 minutes
To: Finance and Infrastructure Standing Committee
Author: Aimee Carson, Executive Assistant Customer and Commercial Services
Authorising Officer: Salomon Kloppers, Acting General Manager Customer and Commercial Services
File Reference: Nil
EXECUTIVE SUMMARY:
The Emerald Airport Advisory Committee held their quarterly meeting on 3 June 2019. Items discussed during the committee meeting included a security presentation, workplace health and safety, financial update, operational matters and capital works projects, terminal concept design and a general aviation update.
OFFICER RECOMMENDATION:
That Central Highlands Regional Council receive the minutes of the Emerald Airport Advisory Committee meeting held on 3 June 2019.
REPORT:
The Emerald Airport Advisory Committee held their quarterly meeting on 3 June 2019. Items discussed during the committee meeting included a security presentation, workplace health and safety, financial update, operational matters and capital works projects, terminal concept design and a general aviation update.
CONSIDERATIONS / IMPLICATIONS:
Corporate/Operational Plan Reference: 5. Leadership and Governance;5.4.1 - Optimise management of council’s commercial business units.
Budget/Financial/Resourcing: Nil
Legal/Policy/Delegations:Sections 264 and 265 – Local Government Regulation 2012Terms of Reference – Emerald Airport Advisory Committee
Communication/Engagement:Committee members include Emerald Airport Stakeholders.
Risk Assessment: Nil

20190709 - Finance and Infrastructure Standing Committee Meeting - Agenda
Central Highlands Regional Council 14 of 84
Timings/Deadlines:Nil
Alternatives considered:Nil
ATTACHMENTS:
1. Unconfirmed Minutes - Emerald Airport Advisory Committee - 3 June 2019 [9.1.1.1 - 8 pages]
– END OF REPORT –
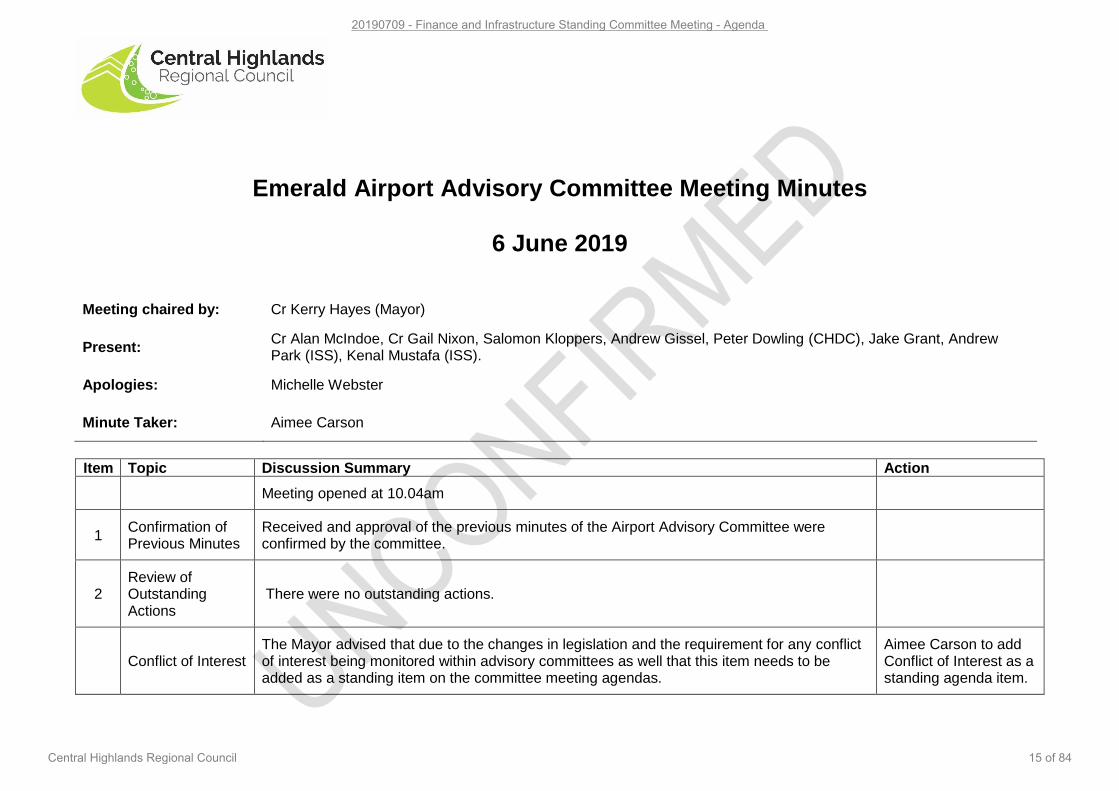
Emerald Airport Advisory Committee Meeting Minutes
6 June 2019
Meeting chaired by: Cr Kerry Hayes (Mayor)
Present: Cr Alan McIndoe, Cr Gail Nixon, Salomon Kloppers, Andrew Gissel, Peter Dowling (CHDC), Jake Grant, Andrew Park (ISS), Kenal Mustafa (ISS).
Apologies: Michelle Webster
Minute Taker: Aimee Carson
Item Topic Discussion Summary Action
Meeting opened at 10.04am
1 Confirmation of Previous Minutes
Received and approval of the previous minutes of the Airport Advisory Committee were confirmed by the committee.
2 Review of Outstanding Actions
There were no outstanding actions.
Conflict of Interest The Mayor advised that due to the changes in legislation and the requirement for any conflict of interest being monitored within advisory committees as well that this item needs to be added as a standing item on the committee meeting agendas.
Aimee Carson to add Conflict of Interest as a standing agenda item.
20190709 - Finance and Infrastructure Standing Committee Meeting - Agenda
Central Highlands Regional Council 15 of 84
Emerald Airport Advisory Committee Meeting Page 2 3 June 2019
Cr Alan McIndoe potentially item #8
3 Workplace Health and Safety
The Manager Airport reported that currently there are no Workplace Health and Safety action items open.
4 Security Update Presentation
Andrew Park, ISS General Manager Queensland thanked the committee for the opportunity to provide this presentation and introduced Kenal Mustafa, ISS Training Manager.
Kenal Mustafa provided a presentation to the committee in relation to security changes in the industry including:
• Industry Developments;
• Training and Compliance Initiatives; and
• Shared Learnings – trials and post implementation feedback.
The Mayor thanked both Kenal Mustafa and Andrew Park for the presentation.
5 Financial Update Andrew Gissel advised the committee that for the period ending May 2019:
Operational
• Net earnings surplus for the year of $1,457K which is $54K or 4% shy of budget ($1,511K).
• Operating revenue ($6,832) is $54K or 1% shy of budget ($6,886K) with a $112K shortfall in passenger head tax offset by the other revenue streams.
• Operating expenses ($3,634K) are on budget with a $175K spend on backfill staff offset by an underspend on salaries, wages, materials, services, office admin and utilities. The overspend on plant hire ($12K) is due to a change in the way plant hire is charged to the Airport (fixed rather than actual).
• Passenger numbers for May are unknown at the time of writing, but April (16,463) was down by 102 PAX or 0.6% on the same period last year (16,565), but up by 143 PAX or 0.9% on budget (16,320). YTD passenger numbers (169,003) are down by 3,046 (1.8%) on last year (172,049), and down by 4,097 (2.4%) on budget (173,100). Full year budget is 208,000 PAX and phasing is based on PAX number distribution over the past 3 years (2015/16 -2017/18).
• Parking numbers for May are unknown as at the time of writing, but parking numbers for April (3,858) were up by 170 (4.6%) on previous month (3,688), and up by 81 (2.1%) on the same period last year (3,777). Short term parking numbers appear to be recovering following the re-introduction of 1-hour free parking. Long term parking
20190709 - Finance and Infrastructure Standing Committee Meeting - Agenda
Central Highlands Regional Council 16 of 84
Emerald Airport Advisory Committee Meeting Page 3 3 June 2019
numbers that dropped since peaking in October last year have started to recover in the New Year.
• Financial ratios are healthy with only the Asset Sustainability Ratio dragging. This ratio; however, does not take investment timing into account, and given that nearly half of all capital expenditure is scheduled for Q4, there is no cause for concern.
• Aged debtors are down by $77K to $504K in May with $14K in 90 days and nothing in 60 days.
• Capital expenditure is on track with 85% of budget ($1.83M) now spent or committed following a $117K budget adjustment at the budget review in March (BR3). The cashflow forecast completion rate was 153% as at 28 May.
6 Airport Manager Update
Solomon Kloppers advised the committee that:
Safety Matters
• CASA Audit completed in December covering the period 2015 to 2018.
• There were 9 observations/safety findings.
• The six items that had a direct link to safety have been closed out.
• The three outstanding items are document updates relating to the Aerodrome
Operating Manual and Emergency plan.
• The changes have been made just require the approval/sign off to complete the items.
• All matters need to be closed out with CASA by 30 June 2019.
Risk Matters
Airport Reporting Officers
• Last month the airport commissioned a piece of work where an experienced Airport
Reporting Officer (ARO) spent time with each of the ARO’s to ensure they are
following safe work practices and have required skills, knowledge and experience
required to complete their tasks.
• This was completed as we are a little bit different to other airports due to being unable
to go out and work on items as a team when completing tasks.
• The report advised that all staff are working safely and have basic knowledge to
complete their required tasks.
• The report was returned with eleven recommendations including:
20190709 - Finance and Infrastructure Standing Committee Meeting - Agenda
Central Highlands Regional Council 17 of 84
Emerald Airport Advisory Committee Meeting Page 4 3 June 2019
o Changes to be made to Standard Operating Procedures that are either missing
or insufficient;
o Items for discussion in toolbox meetings; and
o Some staff require refresher training.
• The outcome was that the staff are safe out in the field and even new employees do
have the basic knowledge to complete their work safely and efficiently.
• The report identified that the airport had the same provider providing the same training
to the same people with limited follow up sessions.
• As a result, the airport will endeavour to utilise other providers in the future to continue
the learnings for the AROs.
• Five of the eleven recommendations have been completed to date.
QFES Non-Compliance
• An inspection from Queensland Fire and Emergency Services identified items they are
concerned about airport fire systems.
• The airport have had these items cross checked with other providers to compare
points with the legal requirements.
• A request for quote (RFQ) has been issued for fire engineers to look at the various
pieces of equipment and comparing it with the legal requirements.
• Their deliverable is to prepare engineering drawings based on the changes required to
rectify the areas of concern in preparation to go out to tender when budget is
available.
• There was no budget for this financial year as the project was unforeseen. CHRC
have provided monies in BR3 to allow for the RFQ and design stage to be completed.
• The aim is to have the next stage completed by August.
Operational Matters
Carpark
• The airport is continuing to have issues with the car parking equipment.
• The proposed 2019/20 budget includes funds to upgrade/renew the carpark
equipment.
• There are a few issues with the current system. These include:
20190709 - Finance and Infrastructure Standing Committee Meeting - Agenda
Central Highlands Regional Council 18 of 84
Emerald Airport Advisory Committee Meeting Page 5 3 June 2019
o The machines and electronics are old and have been weather exposed for
many years.;
o The cash deposit, rollers and copper cables, don’t work very well with the heat
and humidity;
o The age of equipment and the fact that some of the components were second
hand when purchased/installed is making an impact now;
o Issues with servicing.
• Proposed 2020 capital budget includes $400K to replace equipment – which will
include new machines, new warranty period and servicing contract.
Master plan
• The draft 1.0 Masterplan was received a week ago.
• The document has been reviewed and have sent some questions back to be
addressed by the consultant.
• Hoping to have a final draft 2 .0 by mid-June.
Capital Works Projects
Rolleston and Springsure Airport Landing Areas
• Resealing works are almost completed.
• Resurfacing is completed, are currently awaiting the completion of the markings.
• Requires a week after the resurfacing prior to the markings with the chalking paint to
ensure the best finish.
• Expected to be reopened on 9 June 2019.
Project Denison
• Tenders are now closed.
• Panel took an extra week to worked through the options.
• Will be presented to council for endorsement on 11 June 2019.
General Aviation Upgrade
• Request for quote issued.
• Closes in a week or two.
20190709 - Finance and Infrastructure Standing Committee Meeting - Agenda
Central Highlands Regional Council 19 of 84
Emerald Airport Advisory Committee Meeting Page 6 3 June 2019
• An update will be sent to council when finalised.
Garden Entrance
• The garden entrance is being constructed as we speak.
• Hoping for completion construction within the next week or two.
• There will be some delay in the plantings due to the implementation of water
restrictions at the time of kicking off the project which delayed the ordering of plants.
AirHub
• Working with Carol Vertigan and the masterplan consultant.
• GHD has included three options for the location of the AirHub have been included in
the masterplan.
7 New Terminal Concept
Salomon Kloppers provided two plans to the committee for their review and advised that:
• This project is a concept at this stage and thought it was a good time to obtain feedback from the committee for any additions or recommendations that may have been overlooked.
• The project commenced when the changes in security requirements were announced.
• Other issues with terminal toilets and freight issues when it rains were considered in the design.
• Engaged with terminal users (car rentals, ISS, café, Freight, air lines) to assist with the design.
• Brought in the original engineer to ensure that the knowledge of electrical, structural details etc are available and to draw up the new design plans.
• Provided an A3 of the current terminal and asked them to come up with a solution that all agreed with.
• The group met on and off for four months to assist with the creation of this draft.
• The preliminary costings for the construction is $1M.
• The proposed budget has $100K for 2019/20 to enable the architectural drawings to be drawn and an additional $2M for the 2020/21 for construction.
The proposed footprint changes including all the current issues that would be rectified and the incorporation of the security changes that need to be were discussed with the committee.
Feedback provided by the committee included:
If there are any additional ideas/feedback and suggestions, please send them through to Salomon Kloppers.
20190709 - Finance and Infrastructure Standing Committee Meeting - Agenda
Central Highlands Regional Council 20 of 84
Emerald Airport Advisory Committee Meeting Page 7 3 June 2019
• The drop off area.
• Kitchen staff and supplies.
• Security screening.
• Freight cargo screening.
• Disabled and parent car parks.
• Consideration of the generator locations.
Cr Hayes commented that:
• This design provides short to medium term resolution to address the required changes.
• No sooner have built and it will change.
• It will make the terminal operationally better to run.
• The concept has been seen by committee, need to go back to terminal working group to further update the design.
8 General Aviation Update
It was noted that Cr McIndoe provided a perceived conflict of interest due to a property his wife owns backs onto the 15/33 runway.
Solomon Kloppers advised the committee that:
• A report went to Council earlier during 2019 to decommission the 15/33 runway.
• Held a meeting with stakeholders on 14 March 2019 which provided a list of items for action.
• Have continued to have discussions with CASA whether we can get a grandfathering clause in place or to look at a safety case.
• A meeting was held with CASA on Friday feedback was that we need to fix or close the runway.
• They will not accept a safety case for the continuation of use of the runway due to money being able to fix the issue of non-conformance.
• Advised that the matter will be discussed with the committee and user group consultations to be held in subsequent weeks.
• Due to the work that has been completed in the background to try and keep the runway, the focus has not been to continue the communication regarding the decommissioning of the runway. The Airport will require additional time to ensure that all parties have been advised of the decommissioning of the runway if this is the direction taken.
• CASA is not opposed to the date of closure as 1 July 2019, they have stated that we would need a plan for the decommissioning.
20190709 - Finance and Infrastructure Standing Committee Meeting - Agenda
Central Highlands Regional Council 21 of 84
Emerald Airport Advisory Committee Meeting Page 8 3 June 2019
• The intention is to provide another decision report to Council providing detail of all actions taken by the airport staff with a proposal to either provide the monies to repair the issues or to decommission the runway by end of September. This would provide the additional time to allow for the relevant communications to be provided.
Cr Hayes advised that at the user meeting it was agreed that we would go down the CASA road which has been completed so it would then need to become a decision of Council.
9 General Business Australian Airports Association National Conference
Aimee Carson advised the committee that the 2019 program for the AAA National Conference has been released today. A report will be sent to Council 11 June 2019 to allow for Councillor attendance.
Meeting Closed at 11.59am
20190709 - Finance and Infrastructure Standing Committee Meeting - Agenda
Central Highlands Regional Council 22 of 84
20190709 - Finance and Infrastructure Standing Committee Meeting - Agenda
Central Highlands Regional Council 23 of 84
9.1.2 Customer and Commercial Services Departmental Update ..... approx 10 minsDEPARTMENT UPDATE REPORT
Date: 9 July 2019 Presentation Duration: Approx. 10 minutes
To: Finance and Infrastructure Standing Committee Meeting
Author: Lane Dechaineux, Acting Manager AirportTim Maguire, Saleyards ManagerJoe Newman, Coordinator QuarriesSteven Williams, Coordinator Property ServicesAndrew Gissel, Commercial Analyst
Authorising Officer: Salomon Kloppers, Acting General Manager Customer and Commercial Services
File Reference: Nil
EXECUTIVE SUMMARY:
The following report provides an update on key activities for the Customer and Commercial Services department. AIRPORT Operational Matters Capital Projects Financial Performance
QUARRY Operational Matters Capital Projects Financial Performance Efficiencies / Business Improvements
SALEYARDS Operational Matters Capital Projects Financial Performance Efficiencies / Business Improvements
PROPERTY SERVICES Staff and Community Housing
o Operational Matterso Capital Projects
Leasing and Licensingo Operational Matters
OFFICER RECOMMENDATION:
That Central Highlands Regional Council receive the Infrastructure and Utilities departmental update report, highlighting key activities for the month of June 2019.
REPORT:
1. AIRPORTOperational MattersAirport routine maintenance inspections and activities: Conducted in accordance with the airport operational regulatory standards. Airport lighting – PAPI
tested and cleaned. Intermittent runway lighting failures due to condensation in the LED lamps. A new design lens
cover will be progressively introduced as a remedial action. All systems reported as fully operational.
20190709 - Finance and Infrastructure Standing Committee Meeting - Agenda
Central Highlands Regional Council 24 of 84
Airport Landing Areas (ALAs): All ALAs have been visited this month. Continued effort being spent on ensuring the growth of weeds and grass does not compromise the
sealed surfaces or obscure runway markers.
Runway 06/24 strip:The runway strip is the natural surface portion extending away from the runway edge. The surface grading regulatory standards are compromised in localised areas transition from the sealed surface (runway) to the graded portion, and around lighting pits. Works continuing during the month in these areas to ensure ongoing compliance.
Runway 15/33 strip:The runway has been reduced in length to exclude the gravelled portion as there is significant loose stone that could damage aircraft.
Aircraft Parking Apron:The pavement serviceability standards apply to aircraft parking bays 1 and 2 causing those positions to be unavailable until reconstructed in the proposed works programme.
Safety: The routine Terminal evacuation exercise was completed. The Airport Operations Manual and Airport Emergency Procedures have been updated following the
CASA Audit findings. There is an emerging issue anticipated in the new CASA standards due for release next month, for
runway strip widening and apron lighting. The effects will need to be assessed by a technical team, however, relocating the aircraft parking bays towards the terminal may be necessary, along with lowering or relocating flood light poles, and the terminal roofline, to be under the clearance surface applying to the new standards. (To be considered for inclusion in the Master Plan).
Car Park: The airport car parking system is continuing to require frequent intervention. There is a proposal to replace several components that have recurring faults. This should reduce
frequent fault finding, maintenance, parts replacement costs, employee time and user frustration.
Security: All security audit items from the Aviation and Maritime Security Office have been closed out. An architectural consultant is currently working on drafting plans for the proposed changes to the
Terminal to accommodate the infrastructure required. A Special Event Zone is proposed for the Fun Flight event on 28 July.
Airport Master Plan Review: GHD has submitted a draft of the Emerald Airport Master Plan 2019. A presentation by the consultant to Council, of the draft plan, was conducted on 25 June 2019
(Strategic and Briefing Forum). Further amendment is in progress.
Capital ProjectsGarden Entrance to Emerald Airport: Work commenced and plants have been ordered. The project grant funded portion of the project is
now complete.
AirHub Project An AirHub concept review meeting was held with Councillors and the architects on 24 June 2019. Subsequent to the Master Plan presentation to Council on 25 June 2019 a session it was decided
that the Airhub, Master Plan and Disaster Coordination centre projects will be discussed in a single forum to ensure alignment.
Airport Fire systems review: The airport has received several reports and audit results on the firefighting systems.
20190709 - Finance and Infrastructure Standing Committee Meeting - Agenda
Central Highlands Regional Council 25 of 84
Some of the actions require further investigation, planning and design. The airport moved the project forward by approaching the market with a Request for Tender for the
engineering services required. A Fire Engineering Consultant has been appointed to provide engineering drawings and technical
documents for works aimed to ensure full compliance to the relevant codes, practices and regulations.
The Consultant commenced investigating all airport fire service infrastructure on 17th & 18th June. The resultant report will be used to approach Council for funds.
Resurfacing of Rolleston and Springsure aerodromes:o The bitumen resealing works are completed.o Works were completed on time and budget.
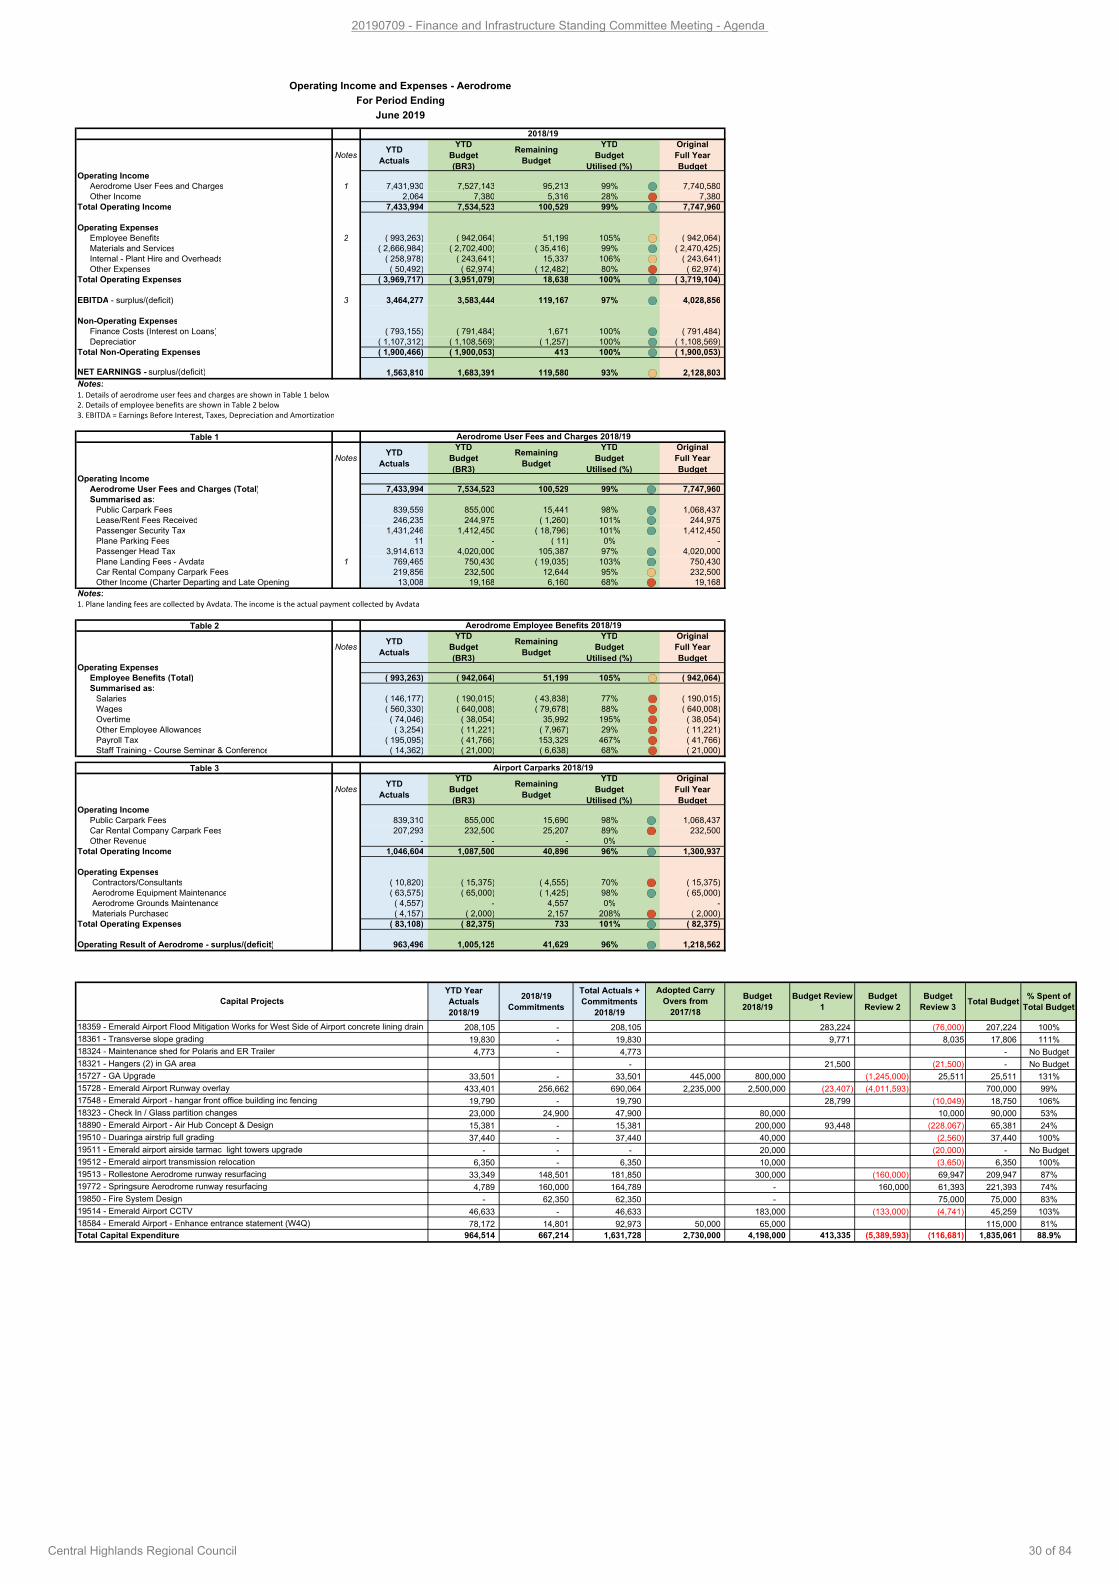
Financial Performance Net earnings surplus for the year of $1,564K* which is $120K or 7% shy of budget ($1,683K). Operating revenue ($7,435K) is $101K or 1% shy of budget ($7,535K) with the main contributing
factor being a shortfall in passenger head tax. Operating expenses ($3,970K) are on budget. Passenger numbers for June are unknown at the time of writing, but May (17,865) was up by 40
PAX or 0.2% on the same period last year (17,825), and up by 225 PAX or 1.3% on budget (17,640). YTD passenger numbers (186,868) are down by 3,006 (1.6%) on last year (189,874), and down by 3,872 (2.0%) on budget (190,740). Full year budget is 208,000 PAX and phasing is based on PAX number distribution over the past 3 years (2015/16 -2017/18).
Parking numbers for June are unknown as at the time of writing, but parking numbers for May (3,600) were down by 258 (6.7%) on previous month (3,858), and down by 40 (1.1%) on the same period last year (3,640). YTD parking numbers (40,979) are down by 1,539 (3.6%) on last year (42,518). Short term parking numbers continue to retract despite the re-introduction of 1-hour free parking. Long term parking numbers that dropped since peaking in October have recovered strongly since January.
Capital expenditure is on track with 88.9% of budget ($1.83M) spent or committed.
Reports were produced 6 days before the end-of-month with potentially one week of trading not captured, and although due care has been taken to address this via accruals, the final results will undoubtedly vary from those reported herein.
2. QUARRY
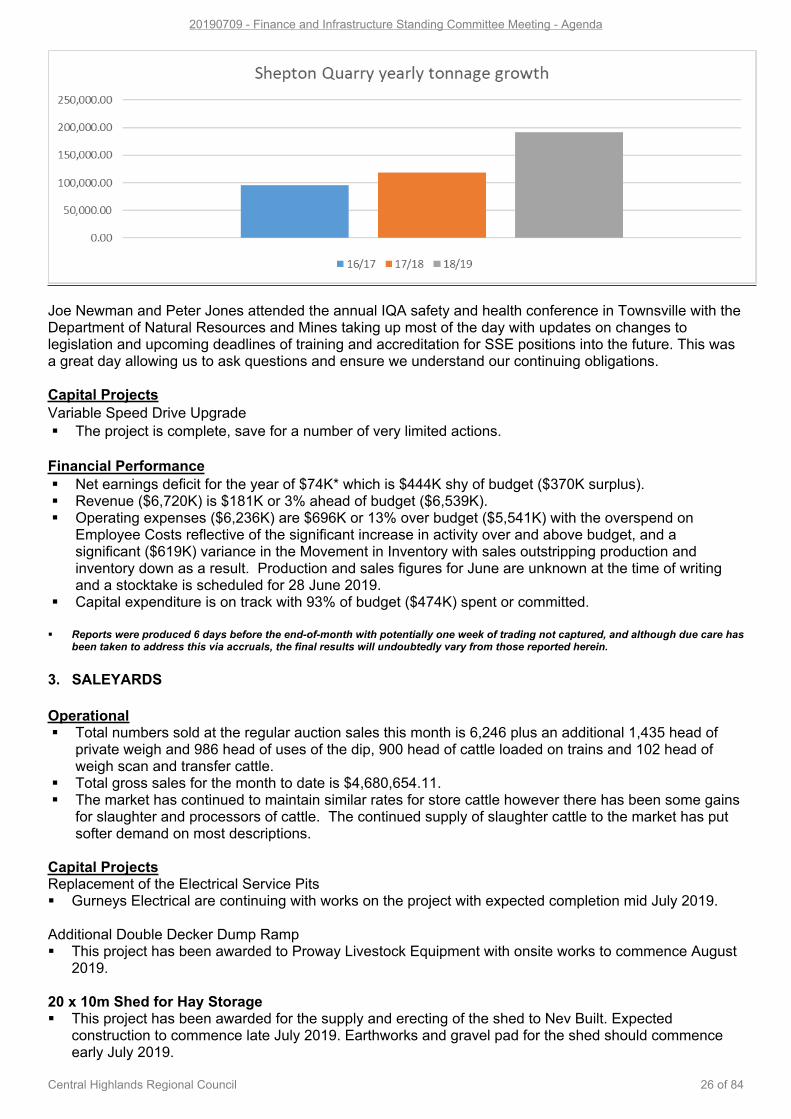
Operational Shepton has continued with strong sales for the month of June with 19,439 tonnes sold up until the
26 June 2019 bringing the total tonnage for the 2018/19 financial year to 190,981 tonnes out of Shepton Quarry. As you can see form the graph below (Graph 1) Shepton has continued to show growth in sales year on year.
Mungabunda has sold 10,789 tonnes for this financial year and we have also completed several crushing projects throughout the region for use on local road network.
This year has been a good year for Shepton Quarry and I would like to thank the staff not only at Shepton but the outsiders such as Andrew Gissel and the wider Customer and Commercial Services team for their help and support throughout the year and I look forward to a bigger and better financial year in 2019/20.
20190709 - Finance and Infrastructure Standing Committee Meeting - Agenda
Central Highlands Regional Council 26 of 84
Joe Newman and Peter Jones attended the annual IQA safety and health conference in Townsville with the Department of Natural Resources and Mines taking up most of the day with updates on changes to legislation and upcoming deadlines of training and accreditation for SSE positions into the future. This was a great day allowing us to ask questions and ensure we understand our continuing obligations.
Capital ProjectsVariable Speed Drive Upgrade The project is complete, save for a number of very limited actions.
Financial Performance Net earnings deficit for the year of $74K* which is $444K shy of budget ($370K surplus). Revenue ($6,720K) is $181K or 3% ahead of budget ($6,539K). Operating expenses ($6,236K) are $696K or 13% over budget ($5,541K) with the overspend on
Employee Costs reflective of the significant increase in activity over and above budget, and a significant ($619K) variance in the Movement in Inventory with sales outstripping production and inventory down as a result. Production and sales figures for June are unknown at the time of writing and a stocktake is scheduled for 28 June 2019.
Capital expenditure is on track with 93% of budget ($474K) spent or committed.
Reports were produced 6 days before the end-of-month with potentially one week of trading not captured, and although due care has been taken to address this via accruals, the final results will undoubtedly vary from those reported herein.
3. SALEYARDS
Operational Total numbers sold at the regular auction sales this month is 6,246 plus an additional 1,435 head of
private weigh and 986 head of uses of the dip, 900 head of cattle loaded on trains and 102 head of weigh scan and transfer cattle.
Total gross sales for the month to date is $4,680,654.11. The market has continued to maintain similar rates for store cattle however there has been some gains
for slaughter and processors of cattle. The continued supply of slaughter cattle to the market has put softer demand on most descriptions.
Capital ProjectsReplacement of the Electrical Service Pits Gurneys Electrical are continuing with works on the project with expected completion mid July 2019.
Additional Double Decker Dump Ramp This project has been awarded to Proway Livestock Equipment with onsite works to commence August
2019.
20 x 10m Shed for Hay Storage This project has been awarded for the supply and erecting of the shed to Nev Built. Expected
construction to commence late July 2019. Earthworks and gravel pad for the shed should commence early July 2019.
20190709 - Finance and Infrastructure Standing Committee Meeting - Agenda
Central Highlands Regional Council 27 of 84
Light Pole Replacement Gurney Electrical have now completed work on the installation LED lighting in the buyer catwalk areas
and the overhead lighting for the individual sale pens on the western side of the saleyards. With all of the eastern side under construction now. Completion of this is expected in mid-July 2019.
Additional drafting facility The new Proway Draft is now fully operational with additional works now completed which provides the
additional catwalk areas and automation of the two gates on the lead to the scales.
Financial Performance Net earnings surplus for the year of $29K* which is $2K or 8% over budget ($27K surplus). Operating revenue ($1,346) is $39K or 3% over budget ($1,308K). Operating expenses ($1,039K) are $56K or 6% over budget ($984K) with an overspend on Employee
Costs and External Service Providers reflective of a significant increase in activity during the first three quarters of the financial year.
Cattle numbers for June are unknown at the time of writing, but numbers for May (6,232) were down significantly on last year (12,181) as well as on revised budget (9,285). YTD throughput (100,662) is up by 9,890 head on the same time last year (90,772) and 917 head or 1% on revised budget (99,745). Throughput estimate was increased by 17,000 head at budget review in January from 96,000 head to 113,000 head.
Capital expenditure is on track with 96% of the budget ($479K) spent or committed.
* Reports were produced 6 days before the end-of-month with potentially one week of trading not captured, and although due care has been taken to address this via accruals, the final results will undoubtedly vary from those reported herein.
Efficiencies / Business Improvements GBA Consultants have now been briefed on the spelling paddock projects and the first process is now underway with approaches to Aurizon for Wayleave over the rail corridor. Pre lodgement meeting was held with the Principal Planner Development Assessment and the Coordinator Development & Planning on 12
June 2019.
4. PROPERTY SERVICES
Staff and Community Housing
Operational Matters: Matters concluded for the month: Completed Routine Inspections for Emerald senior tenants
o Twenty-five (25) inspections were completed at 17-21 Martin Place on 17 and 18 June 2019. Out of the 25 inspections completed twenty-four (24) were considered satisfactory.
Community Housing tenant consultation - Springsureo Property Services have met with the majority of senior tenants within Springsure to discuss
tenancy and property issues and to get feedback on Council’s management of the properties. This forms part of ongoing consultation with all Community Housing tenants. Information and feedback will be used to inform the Community Housing Strategy
Fatigue Housing – 13 King Street, Duaringao Property Services are establishing a fatigue house in Duaringa. The intention is that the property
can also be used by managers in an effort to further activate the Duaringa administration offices.
Rent Review for Community Housing tenants o A rent review for Community Housing is in process. A requirement of the Department of Housing
is for Council to reassess the eligibility of tenants placed through the Department of Housing programs. Staff are liaising with the Department of Housing to ensure that all legislative and policy requirements are met through this process.
Capella Community Housing Routine tenancy inspectionso Routine tenancy inspections are due to commence on 26 June 2019.
20190709 - Finance and Infrastructure Standing Committee Meeting - Agenda
Central Highlands Regional Council 28 of 84
Tenancy movement for June Properties Vacated
o 24 MacKenzie Street, Blackwatero 2/11 Alice Street, Duaringao 2 Moriarty Street, Emerald
New tenancieso 36 Gordon Street, Capellao 2/17 O’Brien Street, Capellao 2 Nogoa Court, Emeraldo 2 Moriarty Street, Emerald
New Community Housing tenancyo 8/33 Woodbine Street, Springsure
Capital Works 42 Porphyry Street, Springsure – kitchen and ensuite renovation completed. 29 Topaz Street, Emerald – Bathroom and toilet renovation completed and replacement flooring in
remainder of house in progress. Upon the existing flooring being removed, type A asbestos was identified and is being managed by the Facilities team.
21 Gordon Street, Capella – Bathroom, kitchen and flooring renovations completed. Unit 1 and 2 at 110 Harris Street, Emerald – Back yard levelling to rectify water drain blockage has
been completed. 2 Nogoa Court, Emerald – Flooring throughout premise has been completed. 39 Littlefield Street, Blackwater – engaged contractor has advised that work will be completed by 30
June 2019.
Leasing and Licencing:Matters concluded for the month: Telstra Lease over Margaret Street, Duaringa – Lot 11 on RP619065 – Lease registered Confirmation of Auction Period for twelve (12) lots within Nogoa Rise Estate
Marketing 5 July 2019 – 16 August 2019Auction date: 16 August 201916 August 2019 – 20 September 2019 (for any private treaty sales)
Land Tenure Matter at Comet – Lot 36 on SP127166Adjoining landowner seeks to lease part of the land for grazing. Council has previously resolved to grant a lease for this purpose. Property Services are now in the process of liaising with the Department of Natural Resources Mines and Energy to determine if the lease will either be a lease directly with the state or a trustee lease.
Transfer of Lease from Blackwater Mineworkers Club to Council - Lot 1 and 2 on SP181608Council applied for Ministers Approval for the transfer of the lease from Blackwater Mineworkers Club on 4 June 2019 and the Minister provided consent on 14 June 2019. Property Services are now in the process of preparing the documents to be lodged with the Titles Office for the official transfer. Upon registration of the Transfer Council will apply to the Department of Natural Resources Mines and Energy for an extension of the existing lease over the property (which expires on 31 July 2019) to enable time to finalise future land tenure arrangements.
Matters in progress for the month: Assistance with purchase of properties and renewal of leases within the region
o Purchase of a portion of vacant land at Sapphire for development as a future caravan dump point
o Renewal of licence from Queensland Rail for Botanic Gardens accesso Request for use of 20 Planet Street, Rolleston
Council received a request from a community member to utilise this property for storage. The property was previously used as the SES station but has stood vacant since the SES transferred to its new facility. Staff are investigating the potential to licence the use of the shed as a means of activating the property whilst remaining compliant with the Lands Act.
20190709 - Finance and Infrastructure Standing Committee Meeting - Agenda
Central Highlands Regional Council 29 of 84
A licence would need to be approved by DNRME as the proposed use is not consistent with the gazetted purpose of the reserve.
o Sojitz Land Tenure for Selma PipelineProperty Services is working with Infrastructure and Utilities to formalise an agreement with Sojitz to utilise Council’s road reserve for the Selma pipeline.
o Ensham land purchaseCouncil has resolved to acquire the property from Ensham Resources. Contact has been made with Ensham officers advising Council position and requesting the Contract for Sale for Councils approval.
Actions within the Vacant Land Management Strategyo Land Parcels at Bogantungan: All land parcels at Bogantungan have been recorded and
confirmed and Property Services are in the process of investigating options for either amalgamation or sale to adjoining property owners.
Referrals Completed (Council comments to DNRME): Total number: five (5)
o Comments were for either a renewal of the lease or conversion to freehold within the shire. Council had no objections however notes that certain sites are located within an active claim area and town planning comments were mentioned.
Referrals Pending or of Intertest: Total number pending: Nil
Leases for Renewal in the second (April to June 2019) Quarter: Total number: One (1) Term lease for the Rubyvale Tip (Lot 1 on SP114679)
New Leases Requests received this month: Total number: Nil
Financial Performance Net earnings deficit for the year of $833K* which is $139K or 14% better than expected ($972K deficit).
Result includes $978K of depreciation. Revenue ($1,042K) is $72K or 7% ahead of budget ($971K) with occupancy rates up and higher than
expected. Operating expenses ($897K) are $106K or 11% shy of budget ($1,003K). At the time of writing, there is
an additional $36K committed to repairs and maintenance following an influx of emergency repair requests.
Capital expenditure is on track with 90% of budget ($250K) now spent or committed.
* Reports were produced 6 days before the end-of-month with potentially one week of trading not captured, and although due care has been taken to address this via accruals, the final results will undoubtedly vary from those reported herein.
ATTACHMENTS:
1. Financial Management Report - Airport - June 2019 [9.1.2.1 - 5 pages]2. Financial Management Report - Quarry - June 2019 [9.1.2.2 - 2 pages]3. Financial Management Report - Saleyards - June 2019 [9.1.2.3 - 3 pages]4. Financial Management Report - Housing Services - June 2019 [9.1.2.4 - 2 pages]5. Customer and Commercial Services Capex Delivery Report June 2019 [9.1.2.5 - 1 page]
– END OF REPORT –
NotesYTD
Actuals
YTD
Budget
(BR3)
Remaining
Budget
YTD
Budget
Utilised (%)
Original
Full Year
BudgetOperating Income
Aerodrome User Fees and Charges 1 7,431,930 7,527,143 95,213 99% 7,740,580
Other Income 2,064 7,380 5,316 28% 7,380
Total Operating Income 7,433,994 7,534,523 100,529 99% 7,747,960
Operating Expenses
Employee Benefits 2 ( 993,263) ( 942,064) 51,199 105% ( 942,064)
Materials and Services ( 2,666,984) ( 2,702,400) ( 35,416) 99% ( 2,470,425)
Internal - Plant Hire and Overheads ( 258,978) ( 243,641) 15,337 106% ( 243,641)
Other Expenses ( 50,492) ( 62,974) ( 12,482) 80% ( 62,974)
Total Operating Expenses ( 3,969,717) ( 3,951,079) 18,638 100% ( 3,719,104)
EBITDA - surplus/(deficit) 3 3,464,277 3,583,444 119,167 97% 4,028,856
Non-Operating Expenses
Finance Costs (Interest on Loans) ( 793,155) ( 791,484) 1,671 100% ( 791,484)
Depreciation ( 1,107,312) ( 1,108,569) ( 1,257) 100% ( 1,108,569)
Total Non-Operating Expenses ( 1,900,466) ( 1,900,053) 413 100% ( 1,900,053)
NET EARNINGS - surplus/(deficit) 1,563,810 1,683,391 119,580 93% 2,128,803
Notes:
1. Details of aerodrome user fees and charges are shown in Table 1 below
2. Details of employee benefits are shown in Table 2 below
3. EBITDA = Earnings Before Interest, Taxes, Depreciation and Amortization
Table 1
NotesYTD
Actuals
YTD
Budget
(BR3)
Remaining
Budget
YTD
Budget
Utilised (%)
Original
Full Year
BudgetOperating Income
Aerodrome User Fees and Charges (Total) 7,433,994 7,534,523 100,529 99% 7,747,960
Summarised as:
Public Carpark Fees 839,559 855,000 15,441 98% 1,068,437
Lease/Rent Fees Received 246,235 244,975 ( 1,260) 101% 244,975
Passenger Security Tax 1,431,246 1,412,450 ( 18,796) 101% 1,412,450
Plane Parking Fees 11 - ( 11) 0% -
Passenger Head Tax 3,914,613 4,020,000 105,387 97% 4,020,000
Plane Landing Fees - Avdata 1 769,465 750,430 ( 19,035) 103% 750,430
Car Rental Company Carpark Fees 219,856 232,500 12,644 95% 232,500
Other Income (Charter Departing and Late Opening) 13,008 19,168 6,160 68% 19,168
Notes:
1. Plane landing fees are collected by Avdata. The income is the actual payment collected by Avdata.
Table 2
NotesYTD
Actuals
YTD
Budget
(BR3)
Remaining
Budget
YTD
Budget
Utilised (%)
Original
Full Year
BudgetOperating Expenses
Employee Benefits (Total) ( 993,263) ( 942,064) 51,199 105% ( 942,064)
Summarised as:
Salaries ( 146,177) ( 190,015) ( 43,838) 77% ( 190,015)
Wages ( 560,330) ( 640,008) ( 79,678) 88% ( 640,008)
Overtime ( 74,046) ( 38,054) 35,992 195% ( 38,054)
Other Employee Allowances ( 3,254) ( 11,221) ( 7,967) 29% ( 11,221)
Payroll Tax ( 195,095) ( 41,766) 153,329 467% ( 41,766)
Staff Training - Course Seminar & Conference ( 14,362) ( 21,000) ( 6,638) 68% ( 21,000)
Table 3
NotesYTD
Actuals
YTD
Budget
(BR3)
Remaining
Budget
YTD
Budget
Utilised (%)
Original
Full Year
BudgetOperating Income
Public Carpark Fees 839,310 855,000 15,690 98% 1,068,437
Car Rental Company Carpark Fees 207,293 232,500 25,207 89% 232,500
Other Revenue - - - 0%
Total Operating Income 1,046,604 1,087,500 40,896 96% 1,300,937
Operating Expenses
Contractors/Consultants ( 10,820) ( 15,375) ( 4,555) 70% ( 15,375)
Aerodrome Equipment Maintenance ( 63,575) ( 65,000) ( 1,425) 98% ( 65,000)
Aerodrome Grounds Maintenance ( 4,557) - 4,557 0% -
Materials Purchased ( 4,157) ( 2,000) 2,157 208% ( 2,000)
Total Operating Expenses ( 83,108) ( 82,375) 733 101% ( 82,375)
Operating Result of Aerodrome - surplus/(deficit) 963,496 1,005,125 41,629 96% 1,218,562
YTD Year
Actuals
2018/19
2018/19
Commitments
Total Actuals +
Commitments
2018/19
Budget
2018/19
Budget Review
1
Budget
Review 2
Budget
Review 3Total Budget
% Spent of
Total Budget
18359 - Emerald Airport Flood Mitigation Works for West Side of Airport concrete lining drain 208,105 - 208,105 283,224 (76,000) 207,224 100%
18361 - Transverse slope grading 19,830 - 19,830 9,771 8,035 17,806 111%
18324 - Maintenance shed for Polaris and ER Trailer 4,773 - 4,773 - No Budget
18321 - Hangers (2) in GA area - 21,500 (21,500) - No Budget
15727 - GA Upgrade 33,501 - 33,501 445,000 800,000 (1,245,000) 25,511 25,511 131%
15728 - Emerald Airport Runway overlay 433,401 256,662 690,064 2,235,000 2,500,000 (23,407) (4,011,593) 700,000 99%
17548 - Emerald Airport - hangar front office building inc fencing 19,790 - 19,790 28,799 (10,049) 18,750 106%
18323 - Check In / Glass partition changes 23,000 24,900 47,900 80,000 10,000 90,000 53%
18890 - Emerald Airport - Air Hub Concept & Design 15,381 - 15,381 200,000 93,448 (228,067) 65,381 24%
19510 - Duaringa airstrip full grading 37,440 - 37,440 40,000 (2,560) 37,440 100%
19511 - Emerald airport airside tarmac light towers upgrade - - - 20,000 (20,000) - No Budget
19512 - Emerald airport transmission relocation 6,350 - 6,350 10,000 (3,650) 6,350 100%
19513 - Rollestone Aerodrome runway resurfacing 33,349 148,501 181,850 300,000 (160,000) 69,947 209,947 87%
19772 - Springsure Aerodrome runway resurfacing 4,789 160,000 164,789 - 160,000 61,393 221,393 74%
19850 - Fire System Design - 62,350 62,350 - 75,000 75,000 83%
19514 - Emerald Airport CCTV 46,633 - 46,633 183,000 (133,000) (4,741) 45,259 103%
18584 - Emerald Airport - Enhance entrance statement (W4Q) 78,172 14,801 92,973 50,000 65,000 115,000 81%
964,514 667,214 1,631,728 2,730,000 4,198,000 413,335 (5,389,593) (116,681) 1,835,061 88.9%Total Capital Expenditure
Capital Projects
Aerodrome Employee Benefits 2018/19
Airport Carparks 2018/19
Operating Income and Expenses - Aerodrome
For Period Ending
June 2019
Aerodrome User Fees and Charges 2018/19
2018/19
Adopted Carry
Overs from
2017/18
20190709 - Finance and Infrastructure Standing Committee Meeting - Agenda
Central Highlands Regional Council 30 of 84
ASSETS & LIABILITIES AS AT 30 JUNE 2018
Replacement
Value
Accumulated
Depreciation
Written Down
Value 30/06/18
Closing Balance
30/06/18
4,345,000 - 4,345,000 4,345,000
WIP (Capex) - - - -
4,345,000 - 4,345,000 4,345,000
8,634,227 1,770,376- 6,863,851 6,863,851
25,905,213 7,923,602- 17,981,610 17,981,610
10,127,856 1,988,022- 8,139,834 8,139,834
Stormwater Pipes 16,335 966- 15,369 15,369
Motor Vehicles 23,213 2,371- 20,842 20,842
44,706,843 11,685,337- 33,021,506 33,021,506
49,051,843 11,685,337- 37,366,506 37,366,506
n/a n/a n/a 14,490,864
n/a n/a n/a 14,490,864
RECONCILIATION OF RESERVES AS AT 30 JUNE 2018
Aerodrome Fund
Opening Reserve
Balance
01/07/2017
Actual
Transfers From
Reserves
Actual Reserve
Balance
30/06/2018
6,628,875 (1,335,866) 7,085,163
187,471 187,471
608,206 1,720,877
7,424,552 (1,335,866) 8,993,511
62,111 (108,692) 25,000
-
-
62,111 (108,692) 25,000 71,581
1,112,671
71,581
2,904,825
Aerodrome Business Unit
Carry Over Capital Projects
Actual Transfers
To Reserves
1,792,154
TOTAL LIABILITIES
Site Improvements
Total Depreciating Assets
ASSETS
Existing Non-Depreciating Assets
Land & Improvements (Excluding Land Held as Inventory)
Total Non-Depreciating Assets
Existing Depreciating Assets
Buildings
Roads, Drainage and Bridge Network
TOTAL ASSETS
LIABILITIES
Loans
Loan Balance
Internally Allocated ReservesFuture Capital Sustainability - Unspent Depreciation
Total
Externally Restricted Reserves
Constrained Grants & Subsidies
Total
20190709 - Finance and Infrastructure Standing Committee Meeting - Agenda
Central Highlands Regional Council 31 of 84
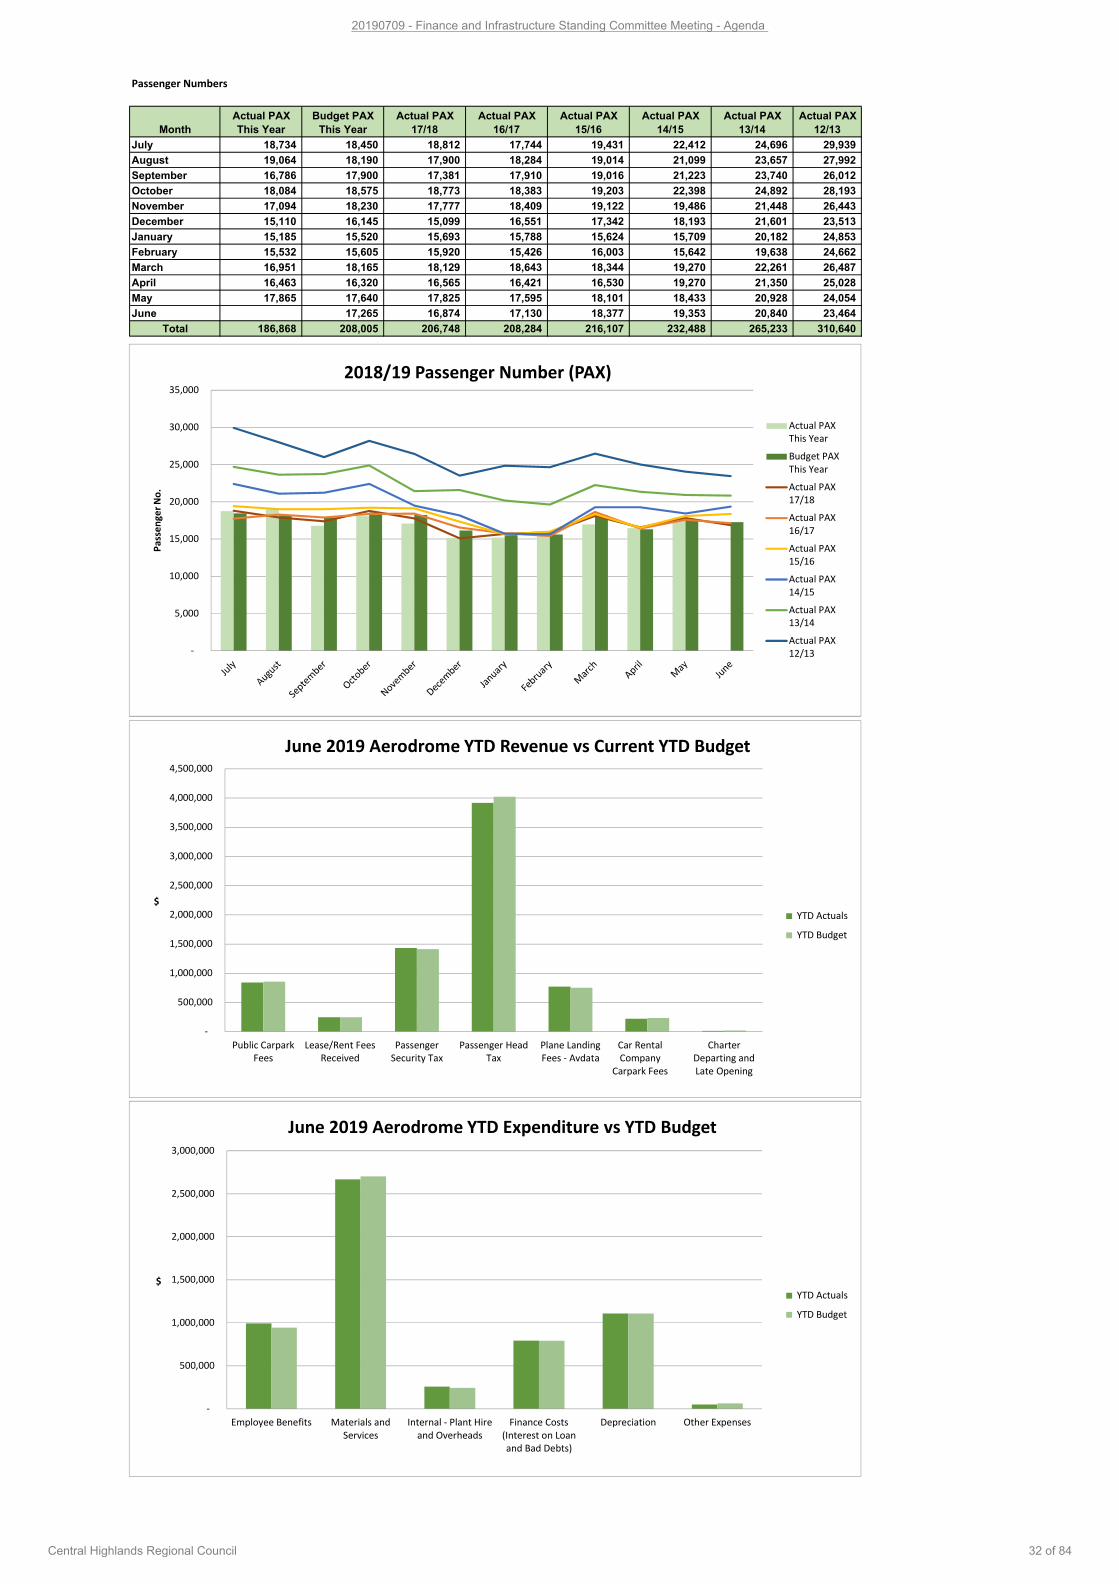
Passenger Numbers
July 18,734 18,450 18,812 17,744 19,431 22,412 24,696 29,939
August 19,064 18,190 17,900 18,284 19,014 21,099 23,657 27,992
September 16,786 17,900 17,381 17,910 19,016 21,223 23,740 26,012
October 18,084 18,575 18,773 18,383 19,203 22,398 24,892 28,193
November 17,094 18,230 17,777 18,409 19,122 19,486 21,448 26,443
December 15,110 16,145 15,099 16,551 17,342 18,193 21,601 23,513
January 15,185 15,520 15,693 15,788 15,624 15,709 20,182 24,853
February 15,532 15,605 15,920 15,426 16,003 15,642 19,638 24,662
March 16,951 18,165 18,129 18,643 18,344 19,270 22,261 26,487
April 16,463 16,320 16,565 16,421 16,530 19,270 21,350 25,028
May 17,865 17,640 17,825 17,595 18,101 18,433 20,928 24,054
June 17,265 16,874 17,130 18,377 19,353 20,840 23,464
Total 186,868 208,005 206,748 208,284 216,107 232,488 265,233 310,640
Actual PAX
13/14
Actual PAX
12/13Month
Actual PAX
This Year
Budget PAX
This Year
Actual PAX
16/17
Actual PAX
15/16
Actual PAX
14/15
Actual PAX
17/18
-
5,000
10,000
15,000
20,000
25,000
30,000
35,000
Pa
sse
ng
er
No
.
2018/19 Passenger Number (PAX)
Actual PAX
This Year
Budget PAX
This Year
Actual PAX
17/18
Actual PAX
16/17
Actual PAX
15/16
Actual PAX
14/15
Actual PAX
13/14
Actual PAX
12/13
-
500,000
1,000,000
1,500,000
2,000,000
2,500,000
3,000,000
3,500,000
4,000,000
4,500,000
Public Carpark
Fees
Lease/Rent Fees
Received
Passenger
Security Tax
Passenger Head
Tax
Plane Landing
Fees - Avdata
Car Rental
Company
Carpark Fees
Charter
Departing and
Late Opening
$
June 2019 Aerodrome YTD Revenue vs Current YTD Budget
YTD Actuals
YTD Budget
-
500,000
1,000,000
1,500,000
2,000,000
2,500,000
3,000,000
Employee Benefits Materials and
Services
Internal - Plant Hire
and Overheads
Finance Costs
(Interest on Loan
and Bad Debts)
Depreciation Other Expenses
$
June 2019 Aerodrome YTD Expenditure vs YTD Budget
YTD Actuals
YTD Budget
20190709 - Finance and Infrastructure Standing Committee Meeting - Agenda
Central Highlands Regional Council 32 of 84
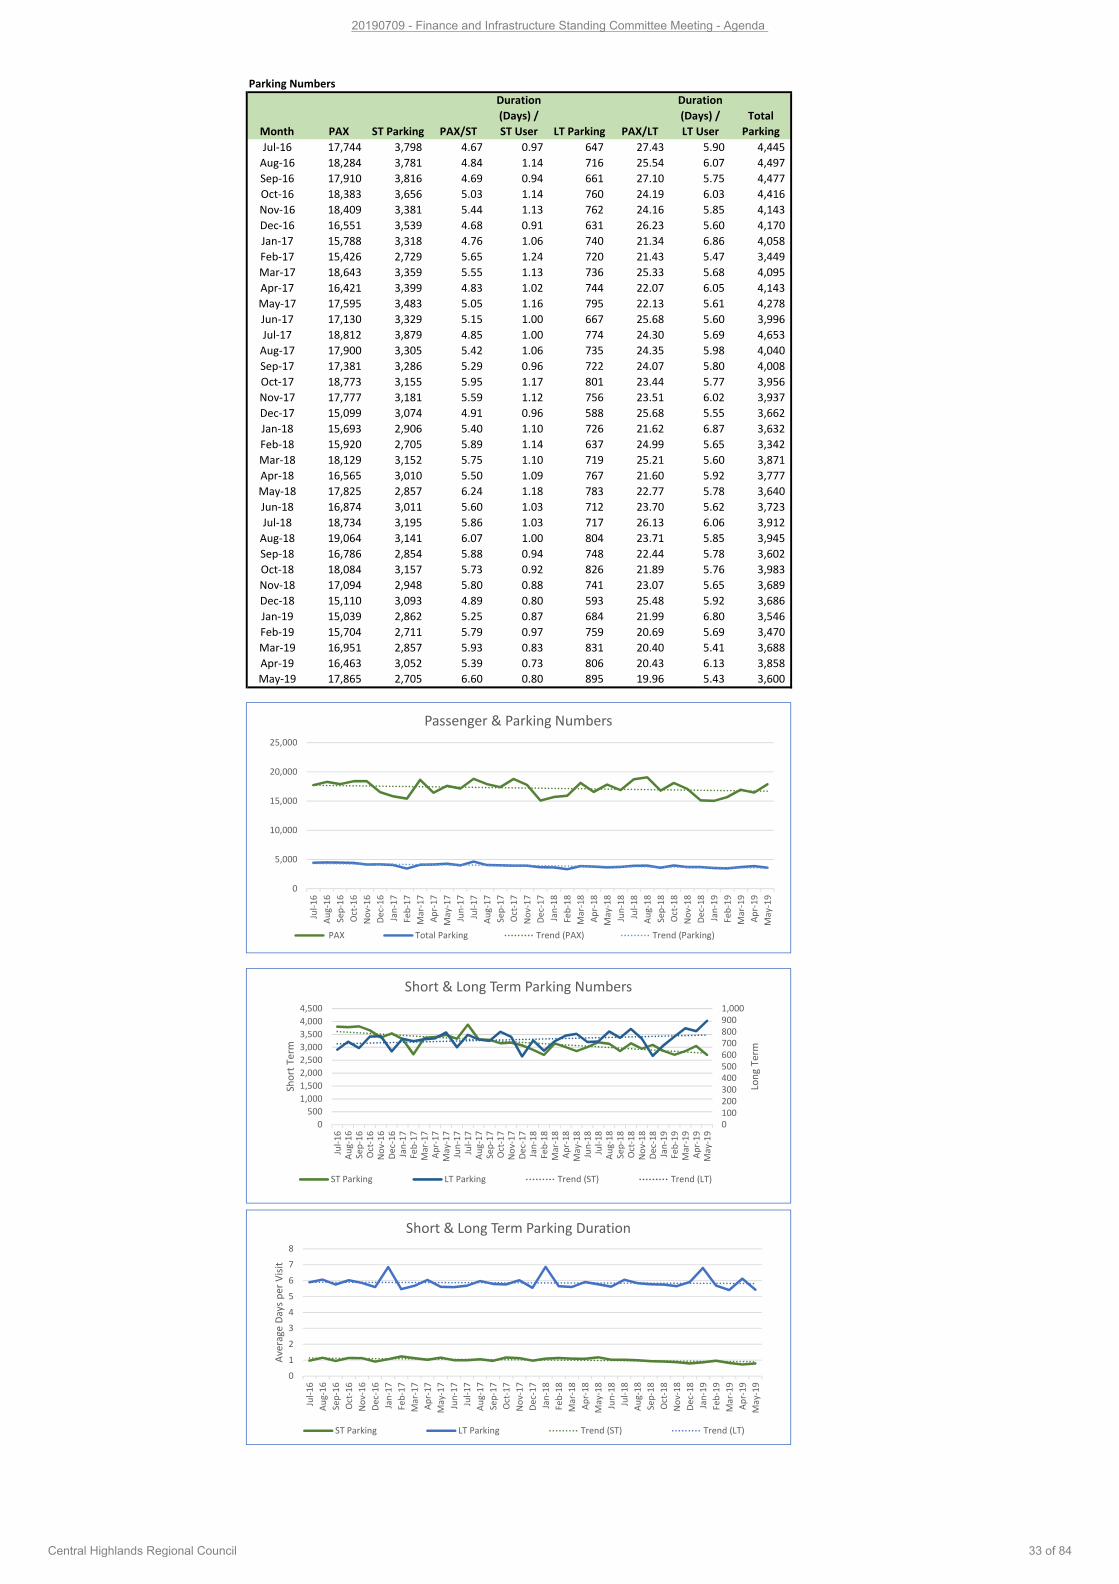
Parking Numbers
Month PAX ST Parking PAX/ST
Duration
(Days) /
ST User LT Parking PAX/LT
Duration
(Days) /
LT User
Total
Parking
Jul-16 17,744 3,798 4.67 0.97 647 27.43 5.90 4,445
Aug-16 18,284 3,781 4.84 1.14 716 25.54 6.07 4,497
Sep-16 17,910 3,816 4.69 0.94 661 27.10 5.75 4,477
Oct-16 18,383 3,656 5.03 1.14 760 24.19 6.03 4,416
Nov-16 18,409 3,381 5.44 1.13 762 24.16 5.85 4,143
Dec-16 16,551 3,539 4.68 0.91 631 26.23 5.60 4,170
Jan-17 15,788 3,318 4.76 1.06 740 21.34 6.86 4,058
Feb-17 15,426 2,729 5.65 1.24 720 21.43 5.47 3,449
Mar-17 18,643 3,359 5.55 1.13 736 25.33 5.68 4,095
Apr-17 16,421 3,399 4.83 1.02 744 22.07 6.05 4,143
May-17 17,595 3,483 5.05 1.16 795 22.13 5.61 4,278
Jun-17 17,130 3,329 5.15 1.00 667 25.68 5.60 3,996
Jul-17 18,812 3,879 4.85 1.00 774 24.30 5.69 4,653
Aug-17 17,900 3,305 5.42 1.06 735 24.35 5.98 4,040
Sep-17 17,381 3,286 5.29 0.96 722 24.07 5.80 4,008
Oct-17 18,773 3,155 5.95 1.17 801 23.44 5.77 3,956
Nov-17 17,777 3,181 5.59 1.12 756 23.51 6.02 3,937
Dec-17 15,099 3,074 4.91 0.96 588 25.68 5.55 3,662
Jan-18 15,693 2,906 5.40 1.10 726 21.62 6.87 3,632
Feb-18 15,920 2,705 5.89 1.14 637 24.99 5.65 3,342
Mar-18 18,129 3,152 5.75 1.10 719 25.21 5.60 3,871
Apr-18 16,565 3,010 5.50 1.09 767 21.60 5.92 3,777
May-18 17,825 2,857 6.24 1.18 783 22.77 5.78 3,640
Jun-18 16,874 3,011 5.60 1.03 712 23.70 5.62 3,723
Jul-18 18,734 3,195 5.86 1.03 717 26.13 6.06 3,912
Aug-18 19,064 3,141 6.07 1.00 804 23.71 5.85 3,945
Sep-18 16,786 2,854 5.88 0.94 748 22.44 5.78 3,602
Oct-18 18,084 3,157 5.73 0.92 826 21.89 5.76 3,983
Nov-18 17,094 2,948 5.80 0.88 741 23.07 5.65 3,689
Dec-18 15,110 3,093 4.89 0.80 593 25.48 5.92 3,686
Jan-19 15,039 2,862 5.25 0.87 684 21.99 6.80 3,546
Feb-19 15,704 2,711 5.79 0.97 759 20.69 5.69 3,470
Mar-19 16,951 2,857 5.93 0.83 831 20.40 5.41 3,688
Apr-19 16,463 3,052 5.39 0.73 806 20.43 6.13 3,858
May-19 17,865 2,705 6.60 0.80 895 19.96 5.43 3,600
0
5,000
10,000
15,000
20,000
25,000
Jul-
16
Au
g-1
6
Se
p-1
6
Oct
-16
No
v-1
6
De
c-1
6
Jan
-17
Fe
b-1
7
Ma
r-1
7
Ap
r-1
7
Ma
y-1
7
Jun
-17
Jul-
17
Au
g-1
7
Se
p-1
7
Oct
-17
No
v-1
7
De
c-1
7
Jan
-18
Fe
b-1
8
Ma
r-1
8
Ap
r-1
8
Ma
y-1
8
Jun
-18
Jul-
18
Au
g-1
8
Se
p-1
8
Oct
-18
No
v-1
8
De
c-1
8
Jan
-19
Fe
b-1
9
Ma
r-1
9
Ap
r-1
9
Ma
y-1
9
Passenger & Parking Numbers
PAX Total Parking Trend (PAX) Trend (Parking)
0
100
200
300
400
500
600
700
800
900
1,000
0
500
1,000
1,500
2,000
2,500
3,000
3,500
4,000
4,500
Jul-
16
Au
g-1
6S
ep
-16
Oct
-16
No
v-1
6D
ec-
16
Jan
-17
Fe
b-1
7M
ar-
17
Ap
r-1
7M
ay-
17
Jun
-17
Jul-
17
Au
g-1
7S
ep
-17
Oct
-17
No
v-1
7D
ec-
17
Jan
-18
Fe
b-1
8M
ar-
18
Ap
r-1
8M
ay-
18
Jun
-18
Jul-
18
Au
g-1
8S
ep
-18
Oct
-18
No
v-1
8D
ec-
18
Jan
-19
Fe
b-1
9M
ar-
19
Ap
r-1
9M
ay-
19
Lon
g T
erm
Sh
ort
Te
rm
Short & Long Term Parking Numbers
ST Parking LT Parking Trend (ST) Trend (LT)
0
1
2
3
4
5
6
7
8
Jul-
16
Au
g-1
6
Se
p-1
6
Oct
-16
No
v-1
6
De
c-1
6
Jan
-17
Fe
b-1
7
Ma
r-1
7
Ap
r-1
7
Ma
y-1
7
Jun
-17
Jul-
17
Au
g-1
7
Se
p-1
7
Oct
-17
No
v-1
7
De
c-1
7
Jan
-18
Fe
b-1
8
Ma
r-1
8
Ap
r-1
8
Ma
y-1
8
Jun
-18
Jul-
18
Au
g-1
8
Se
p-1
8
Oct
-18
No
v-1
8
De
c-1
8
Jan
-19
Fe
b-1
9
Ma
r-1
9
Ap
r-1
9
Ma
y-1
9
Ave
rag
e D
ays
pe
r V
isit
Short & Long Term Parking Duration
ST Parking LT Parking Trend (ST) Trend (LT)
20190709 - Finance and Infrastructure Standing Committee Meeting - Agenda
Central Highlands Regional Council 33 of 84
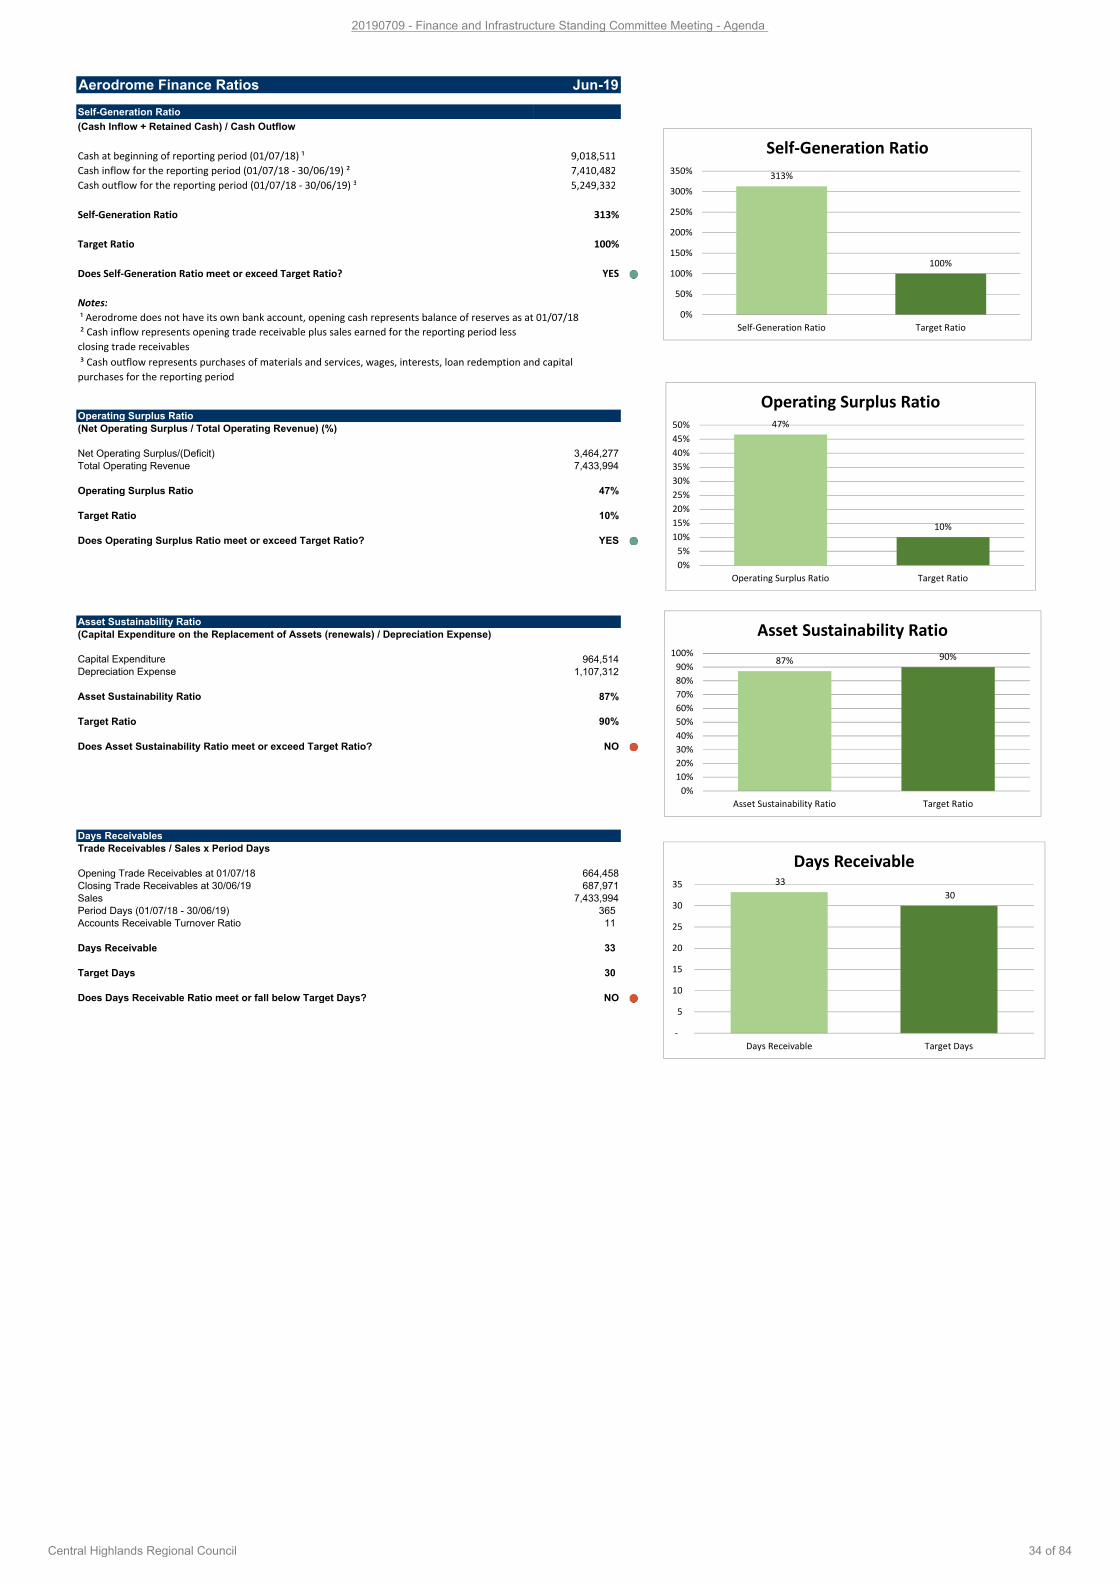
Aerodrome Finance Ratios Jun-19
Self-Generation Ratio
(Cash Inflow + Retained Cash) / Cash Outflow
Cash at beginning of reporting period (01/07/18) ¹ 9,018,511
Cash inflow for the reporting period (01/07/18 - 30/06/19) ² 7,410,482
Cash outflow for the reporting period (01/07/18 - 30/06/19) ³ 5,249,332
Self-Generation Ratio 313%
Target Ratio 100%
Does Self-Generation Ratio meet or exceed Target Ratio? YES
Notes:
² Cash inflow represents opening trade receivable plus sales earned for the reporting period less
closing trade receivables
Operating Surplus Ratio
(Net Operating Surplus / Total Operating Revenue) (%)
Net Operating Surplus/(Deficit) 3,464,277
Total Operating Revenue 7,433,994
Operating Surplus Ratio 47%
Target Ratio 10%
Does Operating Surplus Ratio meet or exceed Target Ratio? YES
Asset Sustainability Ratio
(Capital Expenditure on the Replacement of Assets (renewals) / Depreciation Expense)
Capital Expenditure 964,514
Depreciation Expense 1,107,312
Asset Sustainability Ratio 87%
Target Ratio 90%
Does Asset Sustainability Ratio meet or exceed Target Ratio? NO
Days Receivables
Trade Receivables / Sales x Period Days
Opening Trade Receivables at 01/07/18 664,458
Closing Trade Receivables at 30/06/19 687,971
Sales 7,433,994
Period Days (01/07/18 - 30/06/19) 365
Accounts Receivable Turnover Ratio 11
Days Receivable 33
Target Days 30
Does Days Receivable Ratio meet or fall below Target Days? NO
¹ Aerodrome does not have its own bank account, opening cash represents balance of reserves as at 01/07/18
³ Cash outflow represents purchases of materials and services, wages, interests, loan redemption and capital
purchases for the reporting period
313%
100%
0%
50%
100%
150%
200%
250%
300%
350%
Self-Generation Ratio Target Ratio
Self-Generation Ratio
47%
10%
0%
5%
10%
15%
20%
25%
30%
35%
40%
45%
50%
Operating Surplus Ratio Target Ratio
Operating Surplus Ratio
87% 90%
0%
10%
20%
30%
40%
50%
60%
70%
80%
90%
100%
Asset Sustainability Ratio Target Ratio
Asset Sustainability Ratio
33
30
-
5
10
15
20
25
30
35
Days Receivable Target Days
Days Receivable
20190709 - Finance and Infrastructure Standing Committee Meeting - Agenda
Central Highlands Regional Council 34 of 84
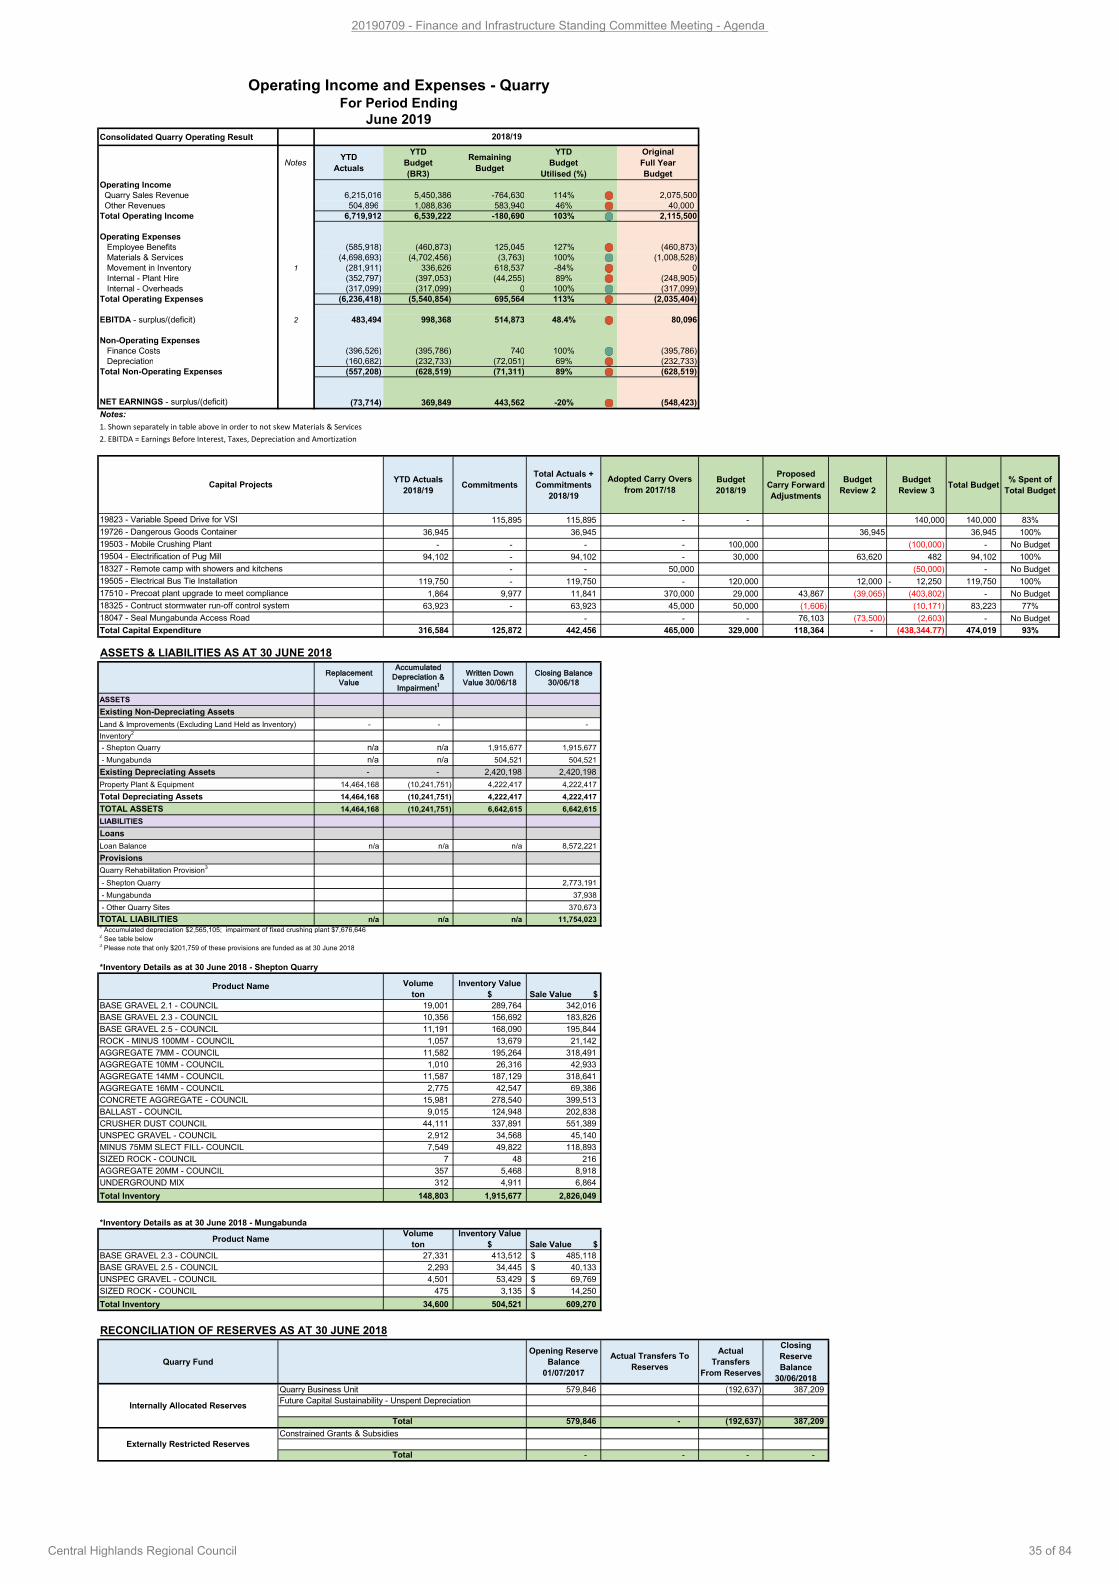
Consolidated Quarry Operating Result
NotesYTD
Actuals
YTD
Budget
(BR3)
Remaining
Budget
YTD
Budget
Utilised (%)
Original
Full Year
Budget
Operating Income Quarry Sales Revenue 6,215,016 5,450,386 -764,630 114% 2,075,500 Other Revenues 504,896 1,088,836 583,940 46% 40,000 Total Operating Income 6,719,912 6,539,222 -180,690 103% 2,115,500
Operating Expenses Employee Benefits (585,918) (460,873) 125,045 127% (460,873) Materials & Services (4,698,693) (4,702,456) (3,763) 100% (1,008,528) Incl $1,007 extraordinary (Marrawah Law - quarry lease amendment)
Movement in Inventory 1 (281,911) 336,626 618,537 -84% 0 Internal - Plant Hire (352,797) (397,053) (44,255) 89% (248,905) Internal - Overheads (317,099) (317,099) 0 100% (317,099)Total Operating Expenses (6,236,418) (5,540,854) 695,564 113% (2,035,404)
EBITDA - surplus/(deficit) 2 483,494 998,368 514,873 48.4% 80,096
Non-Operating Expenses Finance Costs (396,526) (395,786) 740 100% (395,786) Depreciation (160,682) (232,733) (72,051) 69% (232,733)Total Non-Operating Expenses (557,208) (628,519) (71,311) 89% (628,519)
NET EARNINGS - surplus/(deficit) (73,714) 369,849 443,562 -20% (548,423)
Notes:
1. Shown separately in table above in order to not skew Materials & Services
2. EBITDA = Earnings Before Interest, Taxes, Depreciation and Amortization
YTD Actuals
2018/19Commitments
Total Actuals +
Commitments
2018/19
Budget
2018/19
Proposed
Carry Forward
Adjustments
Budget
Review 2
Budget
Review 3Total Budget
% Spent of
Total Budget
115,895 115,895 - 140,000 140,000 83%
36,945 36,945 36,945 36,945 100%
- - - 100,000 (100,000) - No Budget
94,102 - 94,102 30,000 63,620 482 94,102 100%
- - (50,000) - No Budget
119,750 - 119,750 120,000 12,000 12,250- 119,750 100%
1,864 9,977 11,841 29,000 43,867 (39,065) (403,802) - No Budget
63,923 - 63,923 50,000 (1,606) (10,171) 83,223 77%
- - 76,103 (73,500) (2,603) - No Budget
316,584 125,872 442,456 329,000 118,364 - (438,344.77) 474,019 93%
ASSETS & LIABILITIES AS AT 30 JUNE 2018
Replacement
Value
Accumulated
Depreciation &
Impairment1
Written Down
Value 30/06/18
Closing Balance
30/06/18
- - -
n/a n/a 1,915,677 1,915,677
n/a n/a 504,521 504,521
- - 2,420,198 2,420,198
14,464,168 (10,241,751) 4,222,417 4,222,417
14,464,168 (10,241,751) 4,222,417 4,222,417
14,464,168 (10,241,751) 6,642,615 6,642,615
n/a n/a n/a 8,572,221
2,773,191
37,938
370,673
n/a n/a n/a 11,754,023 1 Accumulated depreciation $2,565,105; impairment of fixed crushing plant $7,676,6462 See table below3 Please note that only $201,759 of these provisions are funded as at 30 June 2018
*Inventory Details as at 30 June 2018 - Shepton Quarry
Volume
ton
Inventory Value
$ Sale Value $
BASE GRAVEL 2.1 - COUNCIL 19,001 289,764 342,016
BASE GRAVEL 2.3 - COUNCIL 10,356 156,692 183,826
BASE GRAVEL 2.5 - COUNCIL 11,191 168,090 195,844
ROCK - MINUS 100MM - COUNCIL 1,057 13,679 21,142
AGGREGATE 7MM - COUNCIL 11,582 195,264 318,491
AGGREGATE 10MM - COUNCIL 1,010 26,316 42,933
AGGREGATE 14MM - COUNCIL 11,587 187,129 318,641
AGGREGATE 16MM - COUNCIL 2,775 42,547 69,386
CONCRETE AGGREGATE - COUNCIL 15,981 278,540 399,513
BALLAST - COUNCIL 9,015 124,948 202,838
CRUSHER DUST COUNCIL 44,111 337,891 551,389
UNSPEC GRAVEL - COUNCIL 2,912 34,568 45,140
MINUS 75MM SLECT FILL- COUNCIL 7,549 49,822 118,893
SIZED ROCK - COUNCIL 7 48 216
AGGREGATE 20MM - COUNCIL 357 5,468 8,918
UNDERGROUND MIX 312 4,911 6,864
148,803 1,915,677 2,826,049
*Inventory Details as at 30 June 2018 - Mungabunda
Volume
ton
Inventory Value
$ Sale Value $
BASE GRAVEL 2.3 - COUNCIL 27,331 413,512 485,118$
BASE GRAVEL 2.5 - COUNCIL 2,293 34,445 40,133$
UNSPEC GRAVEL - COUNCIL 4,501 53,429 69,769$
SIZED ROCK - COUNCIL 475 3,135 14,250$
34,600 504,521 609,270
RECONCILIATION OF RESERVES AS AT 30 JUNE 2018
Quarry Fund
Opening Reserve
Balance
01/07/2017
Actual
Transfers
From Reserves
Closing
Reserve
Balance
30/06/2018
579,846 (192,637) 387,209
579,846 (192,637) 387,209
- - -
45,000
-
465,000
Product Name
18325 - Contruct stormwater run-off control system
ASSETS
LIABILITIES
TOTAL ASSETS
TOTAL LIABILITIES
Existing Non-Depreciating Assets
Existing Depreciating Assets
Provisions
Land & Improvements (Excluding Land Held as Inventory)
Inventory2
- Shepton Quarry
Externally Restricted Reserves
Constrained Grants & Subsidies
Total
Capital Projects
17510 - Precoat plant upgrade to meet compliance
Operating Income and Expenses - QuarryFor Period Ending
June 20192018/19
Adopted Carry Overs
from 2017/18
-
-
50,000
-
370,000
Quarry Rehabilitation Provision3
- Shepton Quarry
19503 - Mobile Crushing Plant
18047 - Seal Mungabunda Access Road
Total Capital Expenditure
19504 - Electrification of Pug Mill
19505 - Electrical Bus Tie Installation
18327 - Remote camp with showers and kitchens
Total Depreciating Assets
Loans
- Mungabunda
Property Plant & Equipment
Loan Balance
Future Capital Sustainability - Unspent Depreciation
Total
Product Name
- Mungabunda
- Other Quarry Sites
19726 - Dangerous Goods Container
19823 - Variable Speed Drive for VSI -
-
Actual Transfers To
Reserves
-
Total Inventory
Total Inventory
Internally Allocated Reserves
Quarry Business Unit
20190709 - Finance and Infrastructure Standing Committee Meeting - Agenda
Central Highlands Regional Council 35 of 84
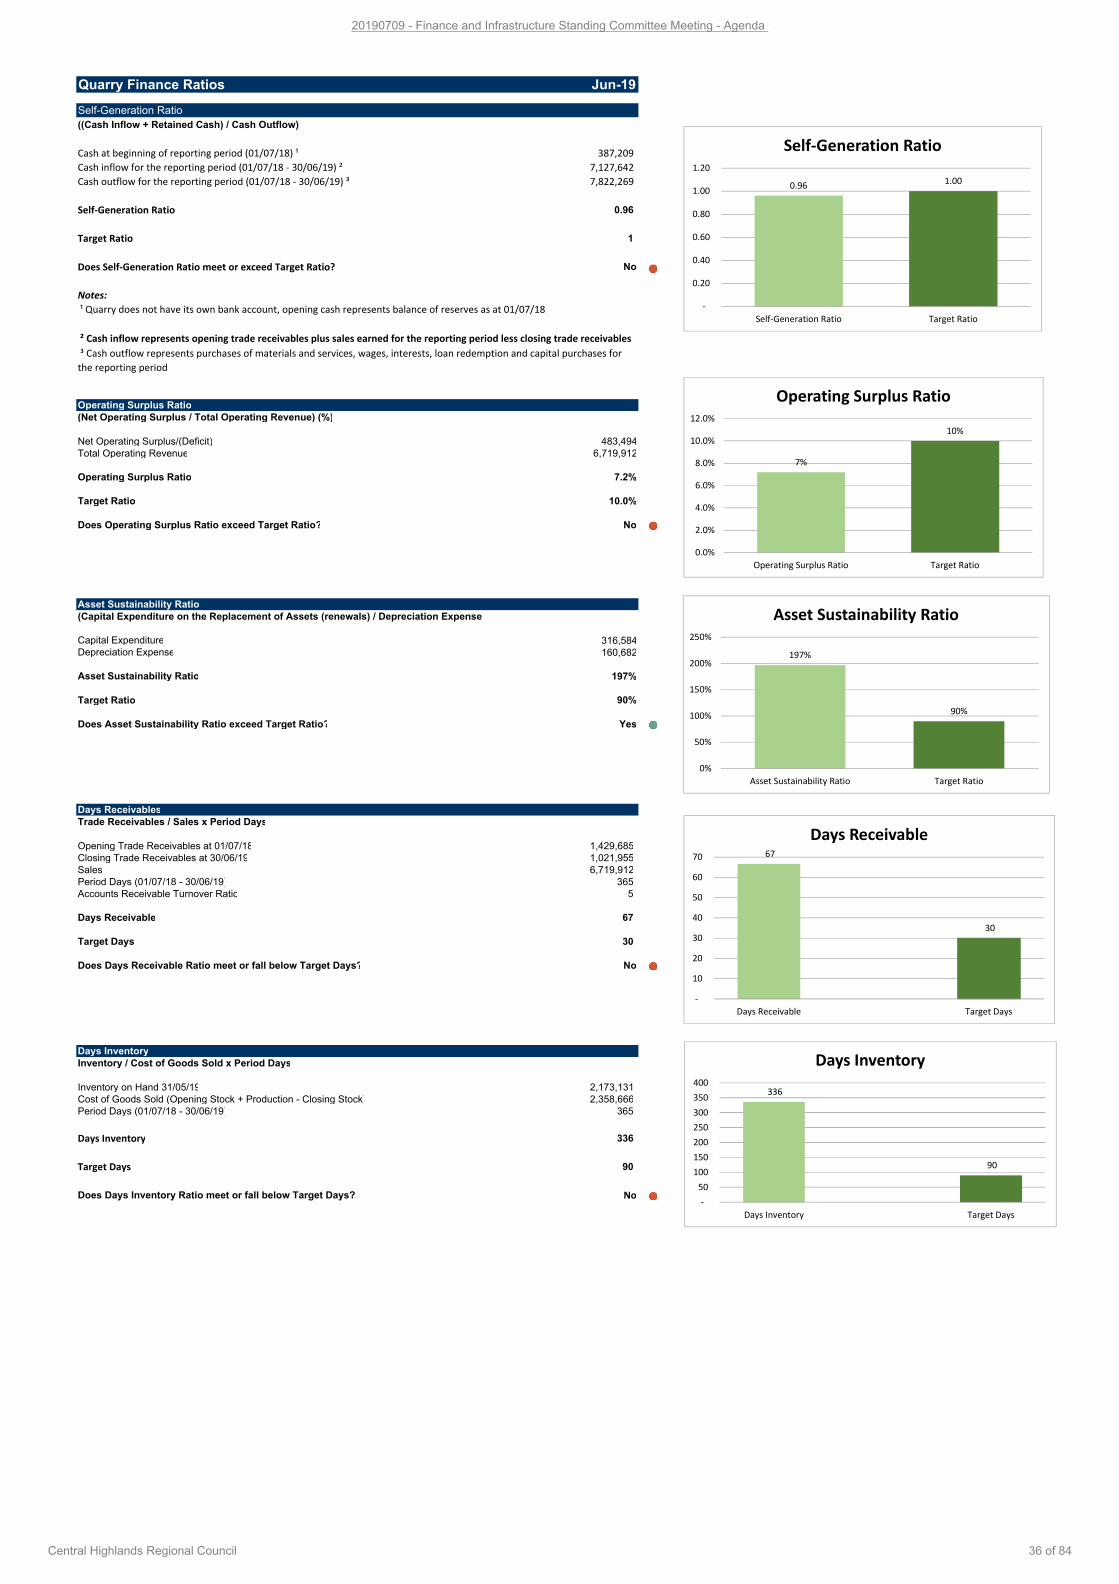
Quarry Finance Ratios Jun-19
Self-Generation Ratio
((Cash Inflow + Retained Cash) / Cash Outflow)
Cash at beginning of reporting period (01/07/18) ¹ 387,209
Cash inflow for the reporting period (01/07/18 - 30/06/19) ² 7,127,642
Cash outflow for the reporting period (01/07/18 - 30/06/19) ³ 7,822,269
Self-Generation Ratio 0.96
Target Ratio 1
Does Self-Generation Ratio meet or exceed Target Ratio? No
Notes:
² Cash inflow represents opening trade receivables plus sales earned for the reporting period less closing trade receivables
Operating Surplus Ratio(Net Operating Surplus / Total Operating Revenue) (%)
Net Operating Surplus/(Deficit) 483,494Total Operating Revenue 6,719,912
Operating Surplus Ratio 7.2%
Target Ratio 10.0%
Does Operating Surplus Ratio exceed Target Ratio? No
Asset Sustainability Ratio (Capital Expenditure on the Replacement of Assets (renewals) / Depreciation Expense)
Capital Expenditure 316,584Depreciation Expense 160,682
Asset Sustainability Ratio 197%
Target Ratio 90%
Does Asset Sustainability Ratio exceed Target Ratio? Yes
Days ReceivablesTrade Receivables / Sales x Period Days
Opening Trade Receivables at 01/07/18 1,429,685 Closing Trade Receivables at 30/06/19 1,021,955 Sales 6,719,912 Period Days (01/07/18 - 30/06/19) 365 Accounts Receivable Turnover Ratio 5
Days Receivable 67
Target Days 30
Does Days Receivable Ratio meet or fall below Target Days? No
Days InventoryInventory / Cost of Goods Sold x Period Days
Inventory on Hand 31/05/19 2,173,131 Cost of Goods Sold (Opening Stock + Production - Closing Stock) 2,358,666 Period Days (01/07/18 - 30/06/19) 365
Days Inventory 336
Target Days 90
Does Days Inventory Ratio meet or fall below Target Days? No
¹ Quarry does not have its own bank account, opening cash represents balance of reserves as at 01/07/18
³ Cash outflow represents purchases of materials and services, wages, interests, loan redemption and capital purchases for
the reporting period
0.961.00
-
0.20
0.40
0.60
0.80
1.00
1.20
Self-Generation Ratio Target Ratio
Self-Generation Ratio
7%
10%
0.0%
2.0%
4.0%
6.0%
8.0%
10.0%
12.0%
Operating Surplus Ratio Target Ratio
Operating Surplus Ratio
197%
90%
0%
50%
100%
150%
200%
250%
Asset Sustainability Ratio Target Ratio
Asset Sustainability Ratio
67
30
-
10
20
30
40
50
60
70
Days Receivable Target Days
Days Receivable
336
90
-
50
100
150
200
250
300
350
400
Days Inventory Target Days
Days Inventory
20190709 - Finance and Infrastructure Standing Committee Meeting - Agenda
Central Highlands Regional Council 36 of 84
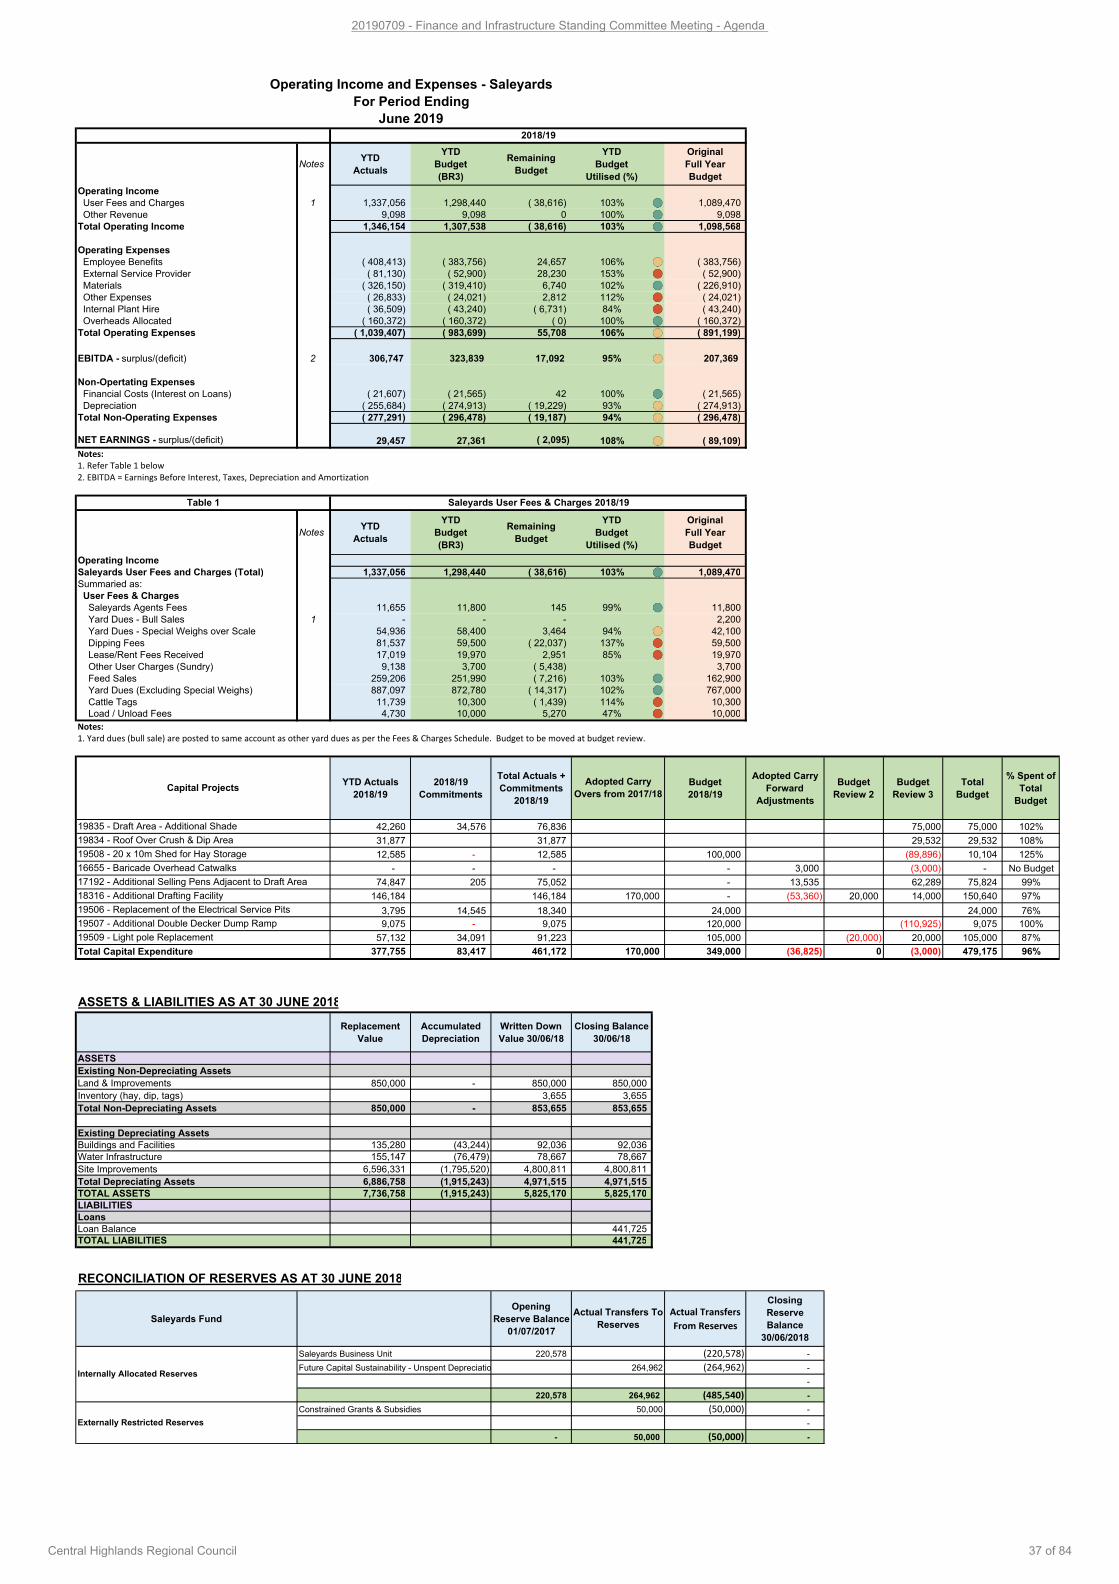
NotesYTD
Actuals
YTD
Budget
(BR3)
Remaining
Budget
YTD
Budget
Utilised (%)
Original
Full Year
Budget
Operating Income
User Fees and Charges 1 1,337,056 1,298,440 ( 38,616) 103% 1,089,470
Other Revenue 9,098 9,098 0 100% 9,098
Total Operating Income 1,346,154 1,307,538 ( 38,616) 103% 1,098,568
Operating Expenses
Employee Benefits ( 408,413) ( 383,756) 24,657 106% ( 383,756)
External Service Provider ( 81,130) ( 52,900) 28,230 153% ( 52,900)
Materials ( 326,150) ( 319,410) 6,740 102% ( 226,910)
Other Expenses ( 26,833) ( 24,021) 2,812 112% ( 24,021)
Internal Plant Hire ( 36,509) ( 43,240) ( 6,731) 84% ( 43,240)
Overheads Allocated ( 160,372) ( 160,372) ( 0) 100% ( 160,372)
Total Operating Expenses ( 1,039,407) ( 983,699) 55,708 106% ( 891,199)
EBITDA - surplus/(deficit) 2 306,747 323,839 17,092 95% 207,369
Non-Opertating Expenses
Financial Costs (Interest on Loans) ( 21,607) ( 21,565) 42 100% ( 21,565)
Depreciation ( 255,684) ( 274,913) ( 19,229) 93% ( 274,913)
Total Non-Operating Expenses ( 277,291) ( 296,478) ( 19,187) 94% ( 296,478)
NET EARNINGS - surplus/(deficit) 29,457 27,361 ( 2,095) 108% ( 89,109)
Notes:
1. Refer Table 1 below
2. EBITDA = Earnings Before Interest, Taxes, Depreciation and Amortization
NotesYTD
Actuals
YTD
Budget
(BR3)
Remaining
Budget
YTD
Budget
Utilised (%)
Original
Full Year
Budget
Operating Income
Saleyards User Fees and Charges (Total) 1,337,056 1,298,440 ( 38,616) 103% 1,089,470
Summaried as:
User Fees & Charges
Saleyards Agents Fees 11,655 11,800 145 99% 11,800
Yard Dues - Bull Sales 1 - - - 2,200
Yard Dues - Special Weighs over Scale 54,936 58,400 3,464 94% 42,100
Dipping Fees 81,537 59,500 ( 22,037) 137% 59,500
Lease/Rent Fees Received 17,019 19,970 2,951 85% 19,970
Other User Charges (Sundry) 9,138 3,700 ( 5,438) 3,700
Feed Sales 259,206 251,990 ( 7,216) 103% 162,900
Yard Dues (Excluding Special Weighs) 887,097 872,780 ( 14,317) 102% 767,000
Cattle Tags 11,739 10,300 ( 1,439) 114% 10,300
Load / Unload Fees 4,730 10,000 5,270 47% 10,000
Notes:
1. Yard dues (bull sale) are posted to same account as other yard dues as per the Fees & Charges Schedule. Budget to be moved at budget review.
YTD Actuals
2018/19
2018/19
Commitments
Total Actuals +
Commitments
2018/19
Budget
2018/19
Adopted Carry
Forward
Adjustments
Budget
Review 2
Budget
Review 3
Total
Budget
% Spent of
Total
Budget
42,260 34,576 76,836 75,000 75,000 102%
31,877 31,877 29,532 29,532 108%
12,585 - 12,585 100,000 (89,896) 10,104 125%
- - - - 3,000 (3,000) - No Budget
74,847 205 75,052 - 13,535 62,289 75,824 99%
146,184 146,184 - (53,360) 20,000 14,000 150,640 97%
3,795 14,545 18,340 24,000 24,000 76%
9,075 - 9,075 120,000 (110,925) 9,075 100%
57,132 34,091 91,223 105,000 (20,000) 20,000 105,000 87%
377,755 83,417 461,172 349,000 (36,825) 0 (3,000) 479,175 96%
ASSETS & LIABILITIES AS AT 30 JUNE 2018
Replacement
Value
Accumulated
Depreciation
Written Down
Value 30/06/18
Closing Balance
30/06/18
ASSETS
Existing Non-Depreciating Assets
Land & Improvements 850,000 - 850,000 850,000
Inventory (hay, dip, tags) 3,655 3,655
Total Non-Depreciating Assets 850,000 - 853,655 853,655
Existing Depreciating Assets
Buildings and Facilities 135,280 (43,244) 92,036 92,036
Water Infrastructure 155,147 (76,479) 78,667 78,667
Site Improvements 6,596,331 (1,795,520) 4,800,811 4,800,811
Total Depreciating Assets 6,886,758 (1,915,243) 4,971,515 4,971,515
TOTAL ASSETS 7,736,758 (1,915,243) 5,825,170 5,825,170
LIABILITIES
Loans
Loan Balance 441,725
TOTAL LIABILITIES 441,725
RECONCILIATION OF RESERVES AS AT 30 JUNE 2018
Saleyards Fund
Opening
Reserve Balance
01/07/2017
Actual Transfers
From Reserves
Closing
Reserve
Balance
30/06/2018
220,578 (220,578) -
(264,962) -
-
220,578 (485,540) -
(50,000) -
-
- (50,000) -
Total Capital Expenditure
16655 - Baricade Overhead Catwalks
17192 - Additional Selling Pens Adjacent to Draft Area
18316 - Additional Drafting Facility
19506 - Replacement of the Electrical Service Pits
19507 - Additional Double Decker Dump Ramp
19509 - Light pole Replacement
Saleyards Business Unit
Externally Restricted Reserves
Internally Allocated Reserves
Constrained Grants & Subsidies
Future Capital Sustainability - Unspent Depreciation
50,000
170,000
Actual Transfers To
Reserves
264,962
50,000
264,962
Saleyards User Fees & Charges 2018/19
2018/19
Adopted Carry
Overs from 2017/18
Operating Income and Expenses - Saleyards
For Period Ending
June 2019
Table 1
Capital Projects
170,000
19834 - Roof Over Crush & Dip Area
19508 - 20 x 10m Shed for Hay Storage
19835 - Draft Area - Additional Shade
20190709 - Finance and Infrastructure Standing Committee Meeting - Agenda
Central Highlands Regional Council 37 of 84
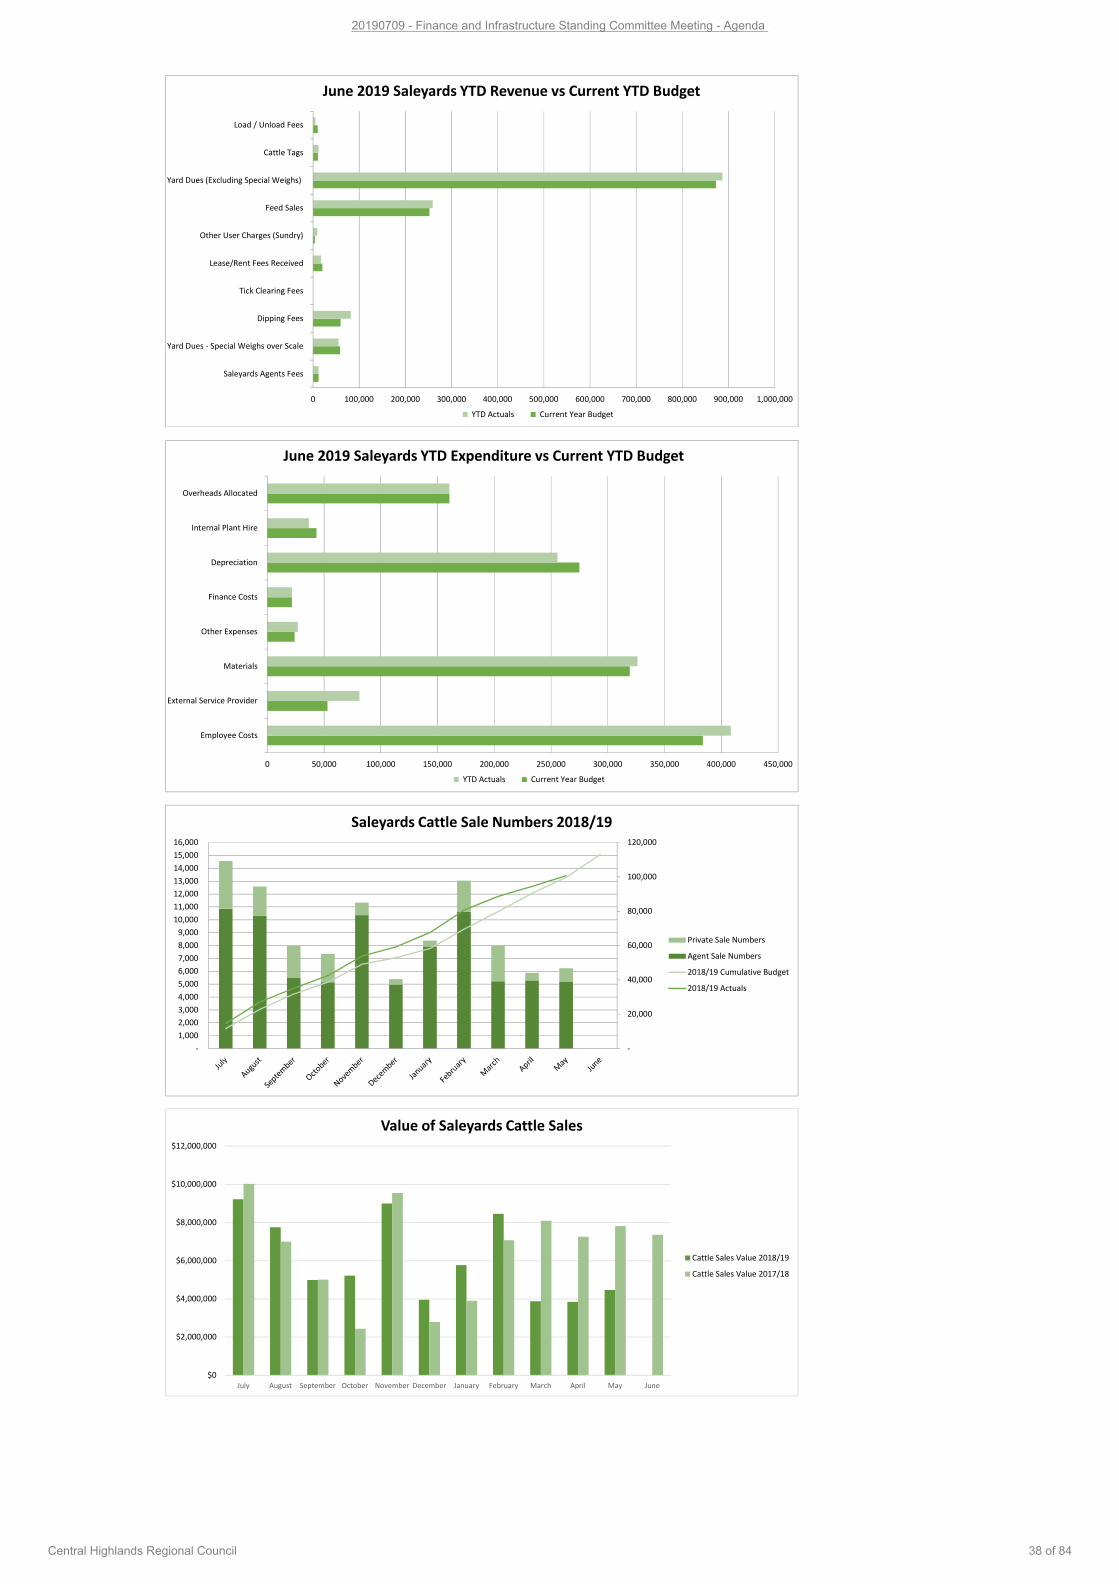
0 100,000 200,000 300,000 400,000 500,000 600,000 700,000 800,000 900,000 1,000,000
Saleyards Agents Fees
Yard Dues - Special Weighs over Scale
Dipping Fees
Tick Clearing Fees
Lease/Rent Fees Received
Other User Charges (Sundry)
Feed Sales
Yard Dues (Excluding Special Weighs)
Cattle Tags
Load / Unload Fees
June 2019 Saleyards YTD Revenue vs Current YTD Budget
YTD Actuals Current Year Budget
-
20,000
40,000
60,000
80,000
100,000
120,000
-
1,000
2,000
3,000
4,000
5,000
6,000
7,000
8,000
9,000
10,000
11,000
12,000
13,000
14,000
15,000
16,000
Saleyards Cattle Sale Numbers 2018/19
Private Sale Numbers
Agent Sale Numbers
2018/19 Cumulative Budget
2018/19 Actuals
$0
$2,000,000
$4,000,000
$6,000,000
$8,000,000
$10,000,000
$12,000,000
July August September October November December January February March April May June
Value of Saleyards Cattle Sales
Cattle Sales Value 2018/19
Cattle Sales Value 2017/18
0 50,000 100,000 150,000 200,000 250,000 300,000 350,000 400,000 450,000
Employee Costs
External Service Provider
Materials
Other Expenses
Finance Costs
Depreciation
Internal Plant Hire
Overheads Allocated
June 2019 Saleyards YTD Expenditure vs Current YTD Budget
YTD Actuals Current Year Budget
20190709 - Finance and Infrastructure Standing Committee Meeting - Agenda
Central Highlands Regional Council 38 of 84
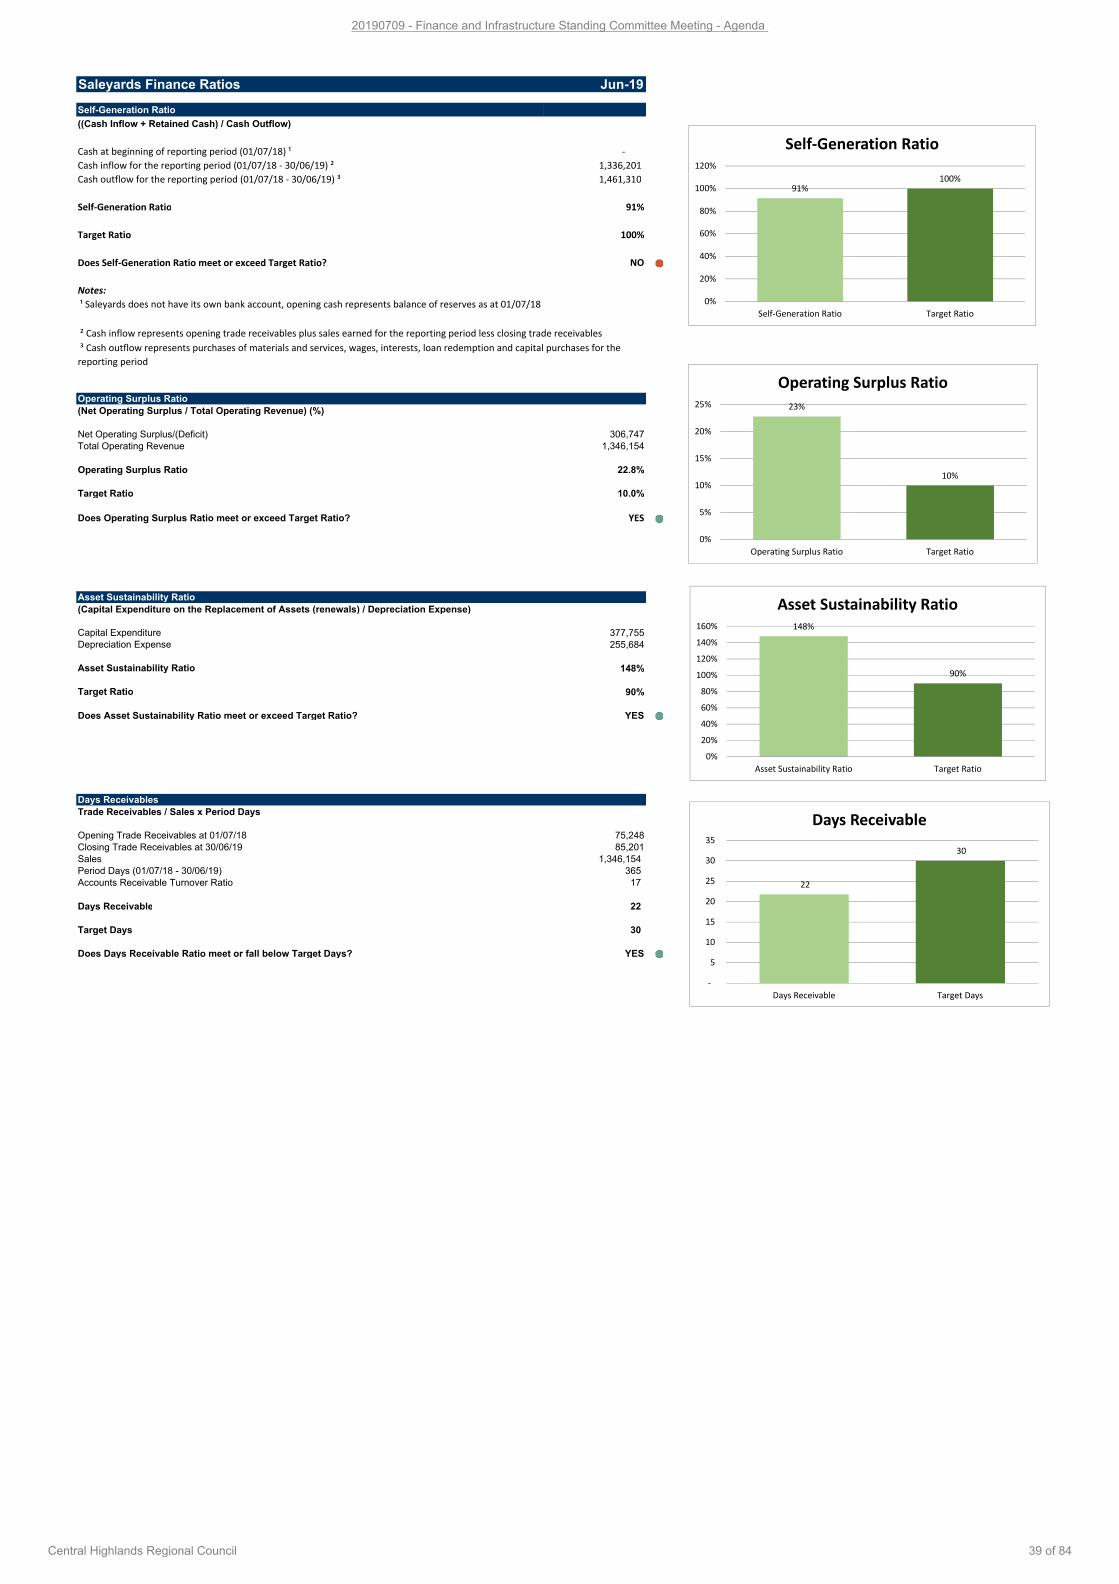
Saleyards Finance Ratios Jun-19
Self-Generation Ratio
((Cash Inflow + Retained Cash) / Cash Outflow)
Cash at beginning of reporting period (01/07/18) ¹ -
Cash inflow for the reporting period (01/07/18 - 30/06/19) ² 1,336,201
Cash outflow for the reporting period (01/07/18 - 30/06/19) ³ 1,461,310
Self-Generation Ratio 91%
Target Ratio 100%
Does Self-Generation Ratio meet or exceed Target Ratio? NO
Notes:
Operating Surplus Ratio
(Net Operating Surplus / Total Operating Revenue) (%)
Net Operating Surplus/(Deficit) 306,747
Total Operating Revenue 1,346,154
Operating Surplus Ratio 22.8%
Target Ratio 10.0%
Does Operating Surplus Ratio meet or exceed Target Ratio? YES
Asset Sustainability Ratio
(Capital Expenditure on the Replacement of Assets (renewals) / Depreciation Expense)
Capital Expenditure 377,755
Depreciation Expense 255,684
Asset Sustainability Ratio 148%
Target Ratio 90%
Does Asset Sustainability Ratio meet or exceed Target Ratio? YES
Days Receivables
Trade Receivables / Sales x Period Days
Opening Trade Receivables at 01/07/18 75,248
Closing Trade Receivables at 30/06/19 85,201
Sales 1,346,154
Period Days (01/07/18 - 30/06/19) 365
Accounts Receivable Turnover Ratio 17
Days Receivable 22
Target Days 30
Does Days Receivable Ratio meet or fall below Target Days? YES
¹ Saleyards does not have its own bank account, opening cash represents balance of reserves as at 01/07/18
² Cash inflow represents opening trade receivables plus sales earned for the reporting period less closing trade receivables
³ Cash outflow represents purchases of materials and services, wages, interests, loan redemption and capital purchases for the
reporting period
91%100%
0%
20%
40%
60%
80%
100%
120%
Self-Generation Ratio Target Ratio
Self-Generation Ratio
23%
10%
0%
5%
10%
15%
20%
25%
Operating Surplus Ratio Target Ratio
Operating Surplus Ratio
148%
90%
0%
20%
40%
60%
80%
100%
120%
140%
160%
Asset Sustainability Ratio Target Ratio
Asset Sustainability Ratio
22
30
-
5
10
15
20
25
30
35
Days Receivable Target Days
Days Receivable
20190709 - Finance and Infrastructure Standing Committee Meeting - Agenda
Central Highlands Regional Council 39 of 84
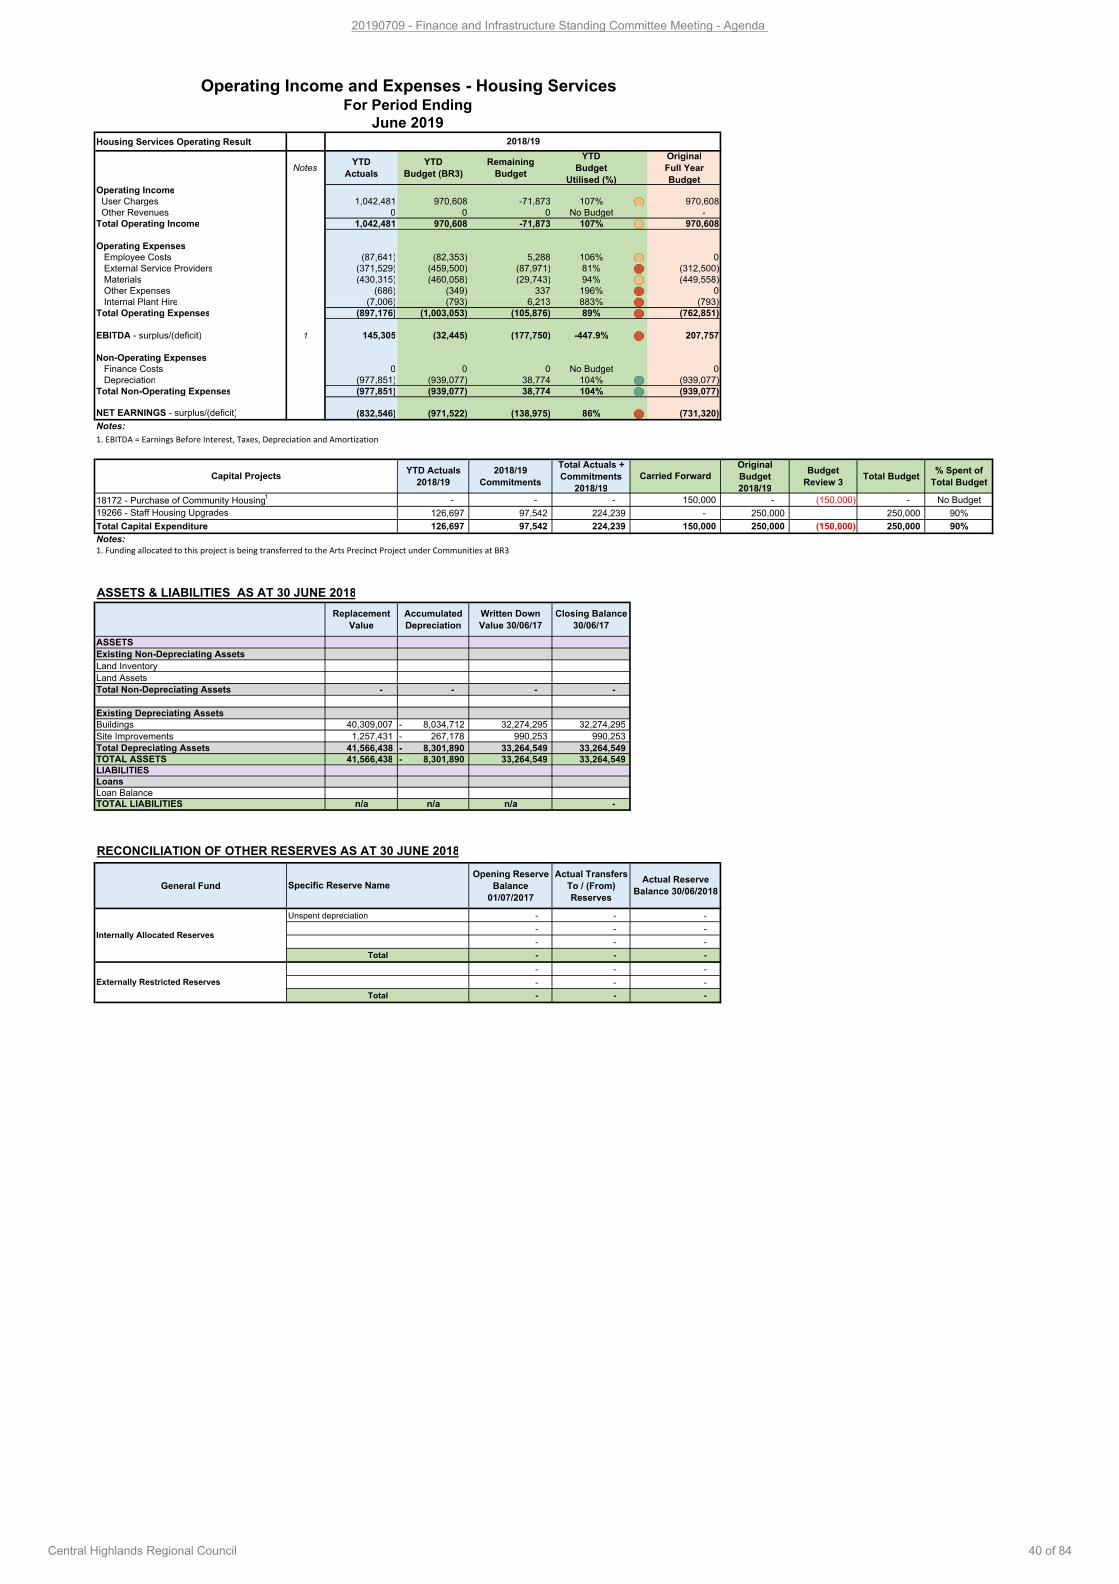
Housing Services Operating Result
NotesYTD
Actuals
YTD
Budget (BR3)
Remaining
Budget
YTD
Budget
Utilised (%)
Original
Full Year
BudgetOperating Income
User Charges 1,042,481 970,608 -71,873 107% 970,608
Other Revenues 0 0 0 No Budget -
Total Operating Income 1,042,481 970,608 -71,873 107% 970,608
Operating Expenses
Employee Costs (87,641) (82,353) 5,288 106% 0
External Service Providers (371,529) (459,500) (87,971) 81% (312,500)
Materials (430,315) (460,058) (29,743) 94% (449,558)
Other Expenses (686) (349) 337 196% 0
Internal Plant Hire (7,006) (793) 6,213 883% (793)
Total Operating Expenses (897,176) (1,003,053) (105,876) 89% (762,851)
EBITDA - surplus/(deficit) 1 145,305 (32,445) (177,750) -447.9% 207,757
Non-Operating Expenses
Finance Costs 0 0 0 No Budget 0
Depreciation (977,851) (939,077) 38,774 104% (939,077)
Total Non-Operating Expenses (977,851) (939,077) 38,774 104% (939,077)
NET EARNINGS - surplus/(deficit) (832,546) (971,522) (138,975) 86% (731,320)
Notes:
1. EBITDA = Earnings Before Interest, Taxes, Depreciation and Amortization
YTD Actuals
2018/19
2018/19
Commitments
Total Actuals +
Commitments
2018/19
Original
Budget
2018/19
Budget
Review 3Total Budget
% Spent of
Total Budget
- - - - (150,000) - No Budget
126,697 97,542 224,239 250,000 250,000 90%
126,697 97,542 224,239 250,000 (150,000) 250,000 90%
Notes:
1. Funding allocated to this project is being transferred to the Arts Precinct Project under Communities at BR3.
ASSETS & LIABILITIES AS AT 30 JUNE 2018
Replacement
Value
Accumulated
Depreciation
Written Down
Value 30/06/17
Closing Balance
30/06/17
- - - -
40,309,007 8,034,712- 32,274,295 32,274,295
1,257,431 267,178- 990,253 990,253
41,566,438 8,301,890- 33,264,549 33,264,549
41,566,438 8,301,890- 33,264,549 33,264,549
n/a n/a n/a -
RECONCILIATION OF OTHER RESERVES AS AT 30 JUNE 2018
General Fund
Opening Reserve
Balance
01/07/2017
Actual Transfers
To / (From)
Reserves
- -
- -
- -
- -
- -
- -
- -
Externally Restricted Reserves
-
-
Total -
-
Total -
TOTAL LIABILITIES
Specific Reserve NameActual Reserve
Balance 30/06/2018
Internally Allocated Reserves
Unspent depreciation -
LIABILITIES
Loans
Loan Balance
-
Existing Depreciating Assets
Buildings
Site Improvements
Total Depreciating Assets
TOTAL ASSETS
Existing Non-Depreciating Assets
Land Inventory
Land Assets
Total Non-Depreciating Assets
ASSETS
Operating Income and Expenses - Housing ServicesFor Period Ending
June 2019
Total Capital Expenditure
Carried Forward
-
150,000
Capital Projects
19266 - Staff Housing Upgrades
18172 - Purchase of Community Housing1 150,000
2018/19
20190709 - Finance and Infrastructure Standing Committee Meeting - Agenda
Central Highlands Regional Council 40 of 84
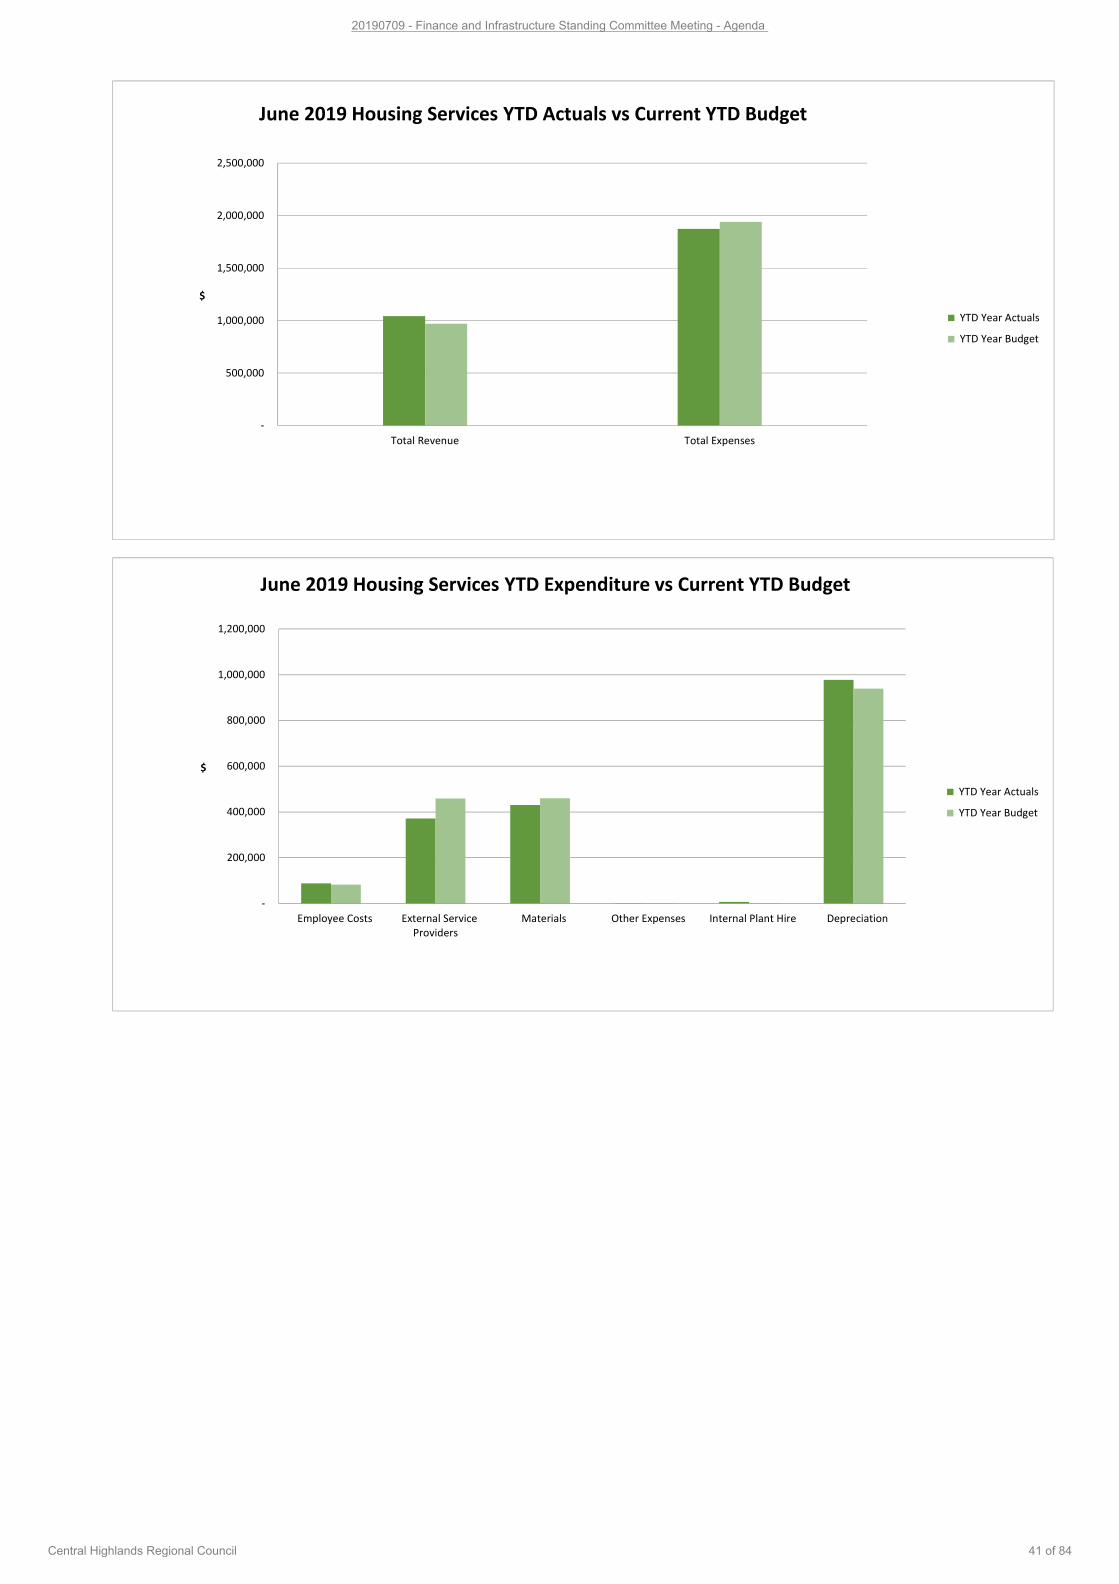
-
500,000
1,000,000
1,500,000
2,000,000
2,500,000
Total Revenue Total Expenses
$
June 2019 Housing Services YTD Actuals vs Current YTD Budget
YTD Year Actuals
YTD Year Budget
-
200,000
400,000
600,000
800,000
1,000,000
1,200,000
Employee Costs External Service
Providers
Materials Other Expenses Internal Plant Hire Depreciation
$
June 2019 Housing Services YTD Expenditure vs Current YTD Budget
YTD Year Actuals
YTD Year Budget
20190709 - Finance and Infrastructure Standing Committee Meeting - Agenda
Central Highlands Regional Council 41 of 84
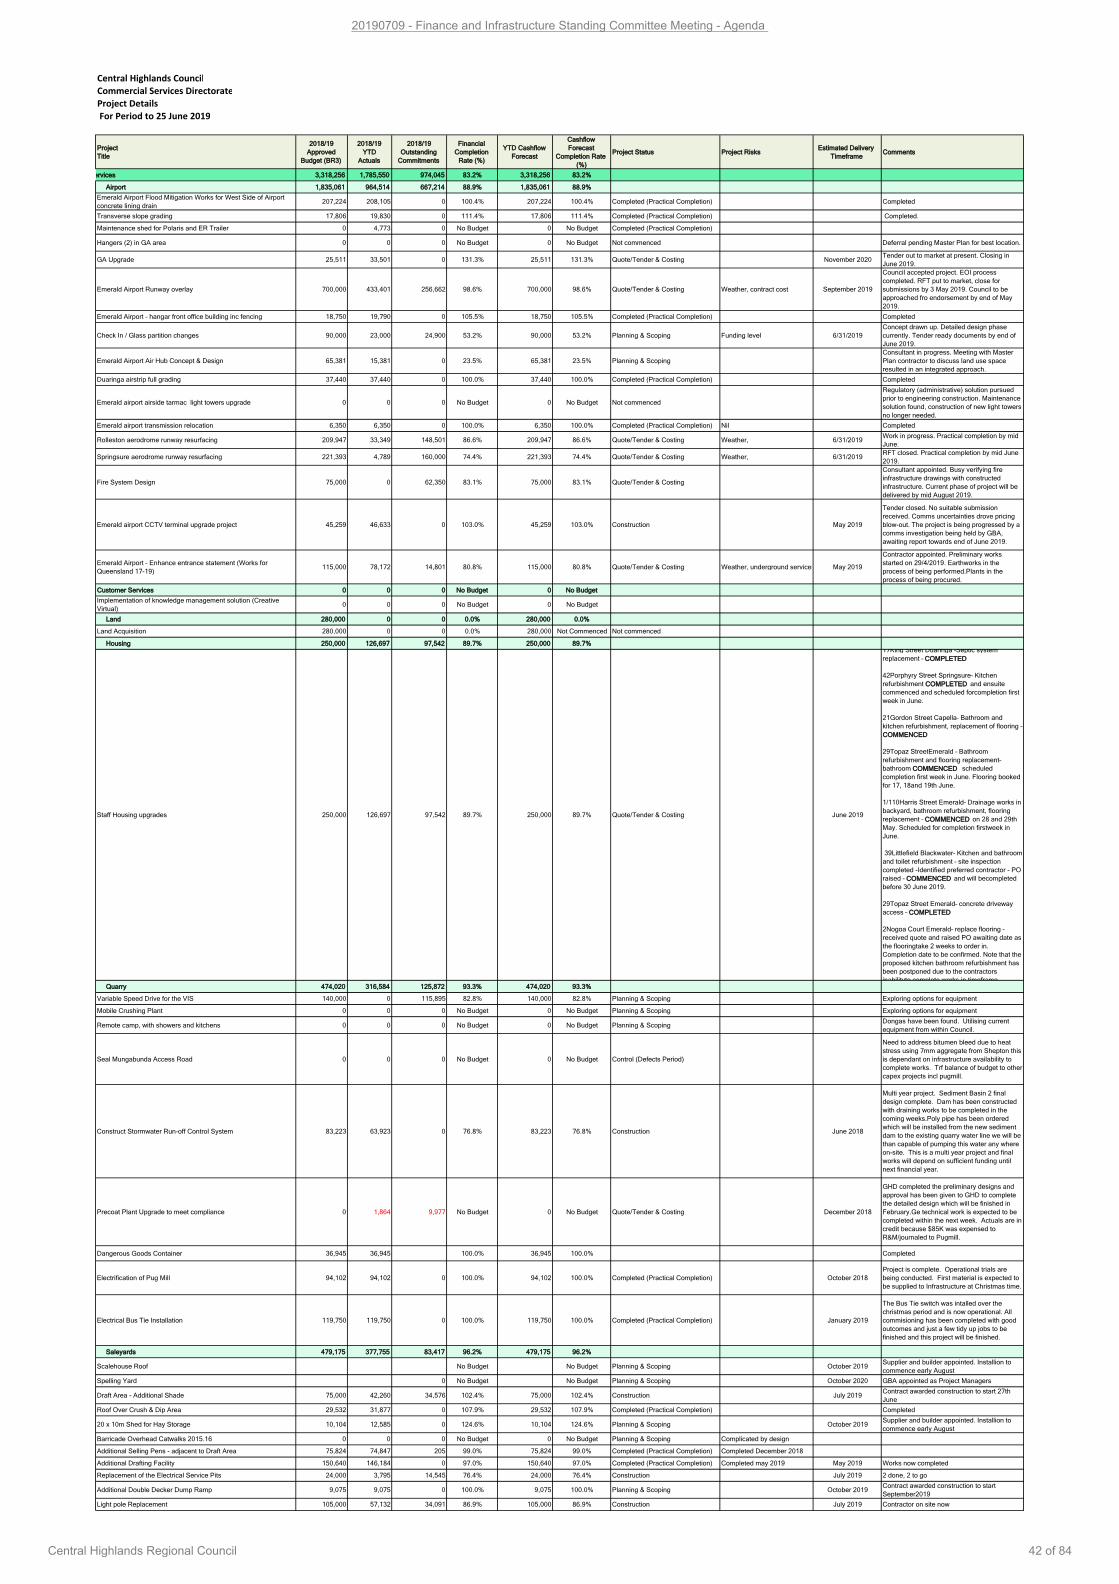
Central Highlands Council
Commercial Services Directorate
Project Details
For Period to 25 June 2019
ProjectTitle
2018/19 Approved
Budget (BR3)
2018/19YTD
Actuals
2018/19 Outstanding
Commitments
Financial Completion
Rate (%)
YTD Cashflow Forecast
Cashflow Forecast
Completion Rate (%)
Project Status Project RisksEstimated Delivery
TimeframeComments
Commercial Services 3,318,256 1,785,550 974,045 83.2% 3,318,256 83.2%
Airport 1,835,061 964,514 667,214 88.9% 1,835,061 88.9%
Emerald Airport Flood Mitigation Works for West Side of Airport concrete lining drain
207,224 208,105 0 100.4% 207,224 100.4% Completed (Practical Completion) Completed
Transverse slope grading 17,806 19,830 0 111.4% 17,806 111.4% Completed (Practical Completion) Completed.
Maintenance shed for Polaris and ER Trailer 0 4,773 0 No Budget 0 No Budget Completed (Practical Completion)
Hangers (2) in GA area 0 0 0 No Budget 0 No Budget Not commenced Deferral pending Master Plan for best location.
GA Upgrade 25,511 33,501 0 131.3% 25,511 131.3% Quote/Tender & Costing November 2020Tender out to market at present. Closing in June 2019.
Emerald Airport Runway overlay 700,000 433,401 256,662 98.6% 700,000 98.6% Quote/Tender & Costing Weather, contract cost September 2019
Council accepted project. EOI process completed. RFT put to market, close for submissions by 3 May 2019. Council to be approached fro endorsement by end of May 2019.
Emerald Airport - hangar front office building inc fencing 18,750 19,790 0 105.5% 18,750 105.5% Completed (Practical Completion) Completed
Check In / Glass partition changes 90,000 23,000 24,900 53.2% 90,000 53.2% Planning & Scoping Funding level 6/31/2019Concept drawn up. Detailed design phase currently. Tender ready documents by end of June 2019.
Emerald Airport Air Hub Concept & Design 65,381 15,381 0 23.5% 65,381 23.5% Planning & ScopingConsultant in progress. Meeting with Master Plan contractor to discuss land use space resulted in an integrated approach.
Duaringa airstrip full grading 37,440 37,440 0 100.0% 37,440 100.0% Completed (Practical Completion) Completed
Emerald airport airside tarmac light towers upgrade 0 0 0 No Budget 0 No Budget Not commenced
Regulatory (administrative) solution pursued prior to engineering construction. Maintenance solution found, construction of new light towers no longer needed.
Emerald airport transmission relocation 6,350 6,350 0 100.0% 6,350 100.0% Completed (Practical Completion) Nil Completed
Rolleston aerodrome runway resurfacing 209,947 33,349 148,501 86.6% 209,947 86.6% Quote/Tender & Costing Weather, 6/31/2019Work in progress. Practical completion by mid June.
Springsure aerodrome runway resurfacing 221,393 4,789 160,000 74.4% 221,393 74.4% Quote/Tender & Costing Weather, 6/31/2019RFT closed. Practical completion by mid June 2019.
Fire System Design 75,000 0 62,350 83.1% 75,000 83.1% Quote/Tender & Costing
Consultant appointed. Busy verifying fire infrastructure drawings with constructed infrastructure. Current phase of project will be delivered by mid August 2019.
Emerald airport CCTV terminal upgrade project 45,259 46,633 0 103.0% 45,259 103.0% Construction May 2019
Tender closed. No suitable submission received. Comms uncertainties drove pricing blow-out. The project is being progressed by a comms investigation being held by GBA, awaiting report towards end of June 2019.
Emerald Airport - Enhance entrance statement (Works for Queensland 17-19)
115,000 78,172 14,801 80.8% 115,000 80.8% Quote/Tender & Costing Weather, underground services May 2019
Contractor appointed. Preliminary works started on 29/4/2019. Earthworks in the process of being performed.Plants in the process of being procured.
Customer Services 0 0 0 No Budget 0 No Budget
Implementation of knowledge management solution (Creative Virtual)
0 0 0 No Budget 0 No Budget
Land 280,000 0 0 0.0% 280,000 0.0%
Land Acquisition 280,000 0 0 0.0% 280,000 Not Commenced Not commenced
Housing 250,000 126,697 97,542 89.7% 250,000 89.7%
Staff Housing upgrades 250,000 126,697 97,542 89.7% 250,000 89.7% Quote/Tender & Costing June 2019
17King Street Duaringa –Septic system replacement – COMPLETED
42Porphyry Street Springsure– Kitchen refurbishment COMPLETED and ensuite commenced and scheduled forcompletion first week in June.
21Gordon Street Capella– Bathroom and kitchen refurbishment, replacement of flooring –
COMMENCED
29Topaz StreetEmerald – Bathroom refurbishment and flooring replacement– bathroom COMMENCED scheduled completion first week in June. Flooring booked for 17, 18and 19th June.
1/110Harris Street Emerald– Drainage works in backyard, bathroom refurbishment, flooring replacement – COMMENCED on 28 and 29th May. Scheduled for completion firstweek in June.
39Littlefield Blackwater– Kitchen and bathroom and toilet refurbishment – site inspection completed -Identified preferred contractor - PO raised – COMMENCED and will becompleted before 30 June 2019.
29Topaz Street Emerald– concrete driveway access – COMPLETED
2Nogoa Court Emerald– replace flooring – received quote and raised PO awaiting date as the flooringtake 2 weeks to order in. Completion date to be confirmed. Note that the proposed kitchen bathroom refurbishment has been postponed due to the contractors inabilityto complete works in timeframe
Quarry 474,020 316,584 125,872 93.3% 474,020 93.3%
Variable Speed Drive for the VIS 140,000 0 115,895 82.8% 140,000 82.8% Planning & Scoping Exploring options for equipment
Mobile Crushing Plant 0 0 0 No Budget 0 No Budget Planning & Scoping Exploring options for equipment
Remote camp, with showers and kitchens 0 0 0 No Budget 0 No Budget Planning & ScopingDongas have been found. Utilising current equipment from within Council.
Seal Mungabunda Access Road 0 0 0 No Budget 0 No Budget Control (Defects Period)
Need to address bitumen bleed due to heat stress using 7mm aggregate from Shepton this is dependant on infrastructure availability to complete works. Trf balance of budget to other capex projects incl pugmill.
Construct Stormwater Run-off Control System 83,223 63,923 0 76.8% 83,223 76.8% Construction June 2018
Multi year project. Sediment Basin 2 final design complete. Dam has been constructed with draining works to be completed in the coming weeks.Poly pipe has been ordered which will be installed from the new sediment dam to the existing quarry water line we will be than capable of pumping this water any where on-site. This is a multi year project and final works will depend on sufficient funding until next financial year.
Precoat Plant Upgrade to meet compliance 0 1,864 9,977 No Budget 0 No Budget Quote/Tender & Costing December 2018
GHD completed the preliminary designs and approval has been given to GHD to complete the detailed design which will be finished in February.Ge technical work is expected to be completed within the next week. Actuals are in credit because $85K was expensed to R&M/journaled to Pugmill.
Dangerous Goods Container 36,945 36,945 100.0% 36,945 100.0% Completed
Electrification of Pug Mill 94,102 94,102 0 100.0% 94,102 100.0% Completed (Practical Completion) October 2018Project is complete. Operational trials are being conducted. First material is expected to be supplied to Infrastructure at Christmas time.
Electrical Bus Tie Installation 119,750 119,750 0 100.0% 119,750 100.0% Completed (Practical Completion) January 2019
The Bus Tie switch was intalled over the christmas period and is now operational. All commisioning has been completed with good outcomes and just a few tidy up jobs to be finished and this project will be finished.
Saleyards 479,175 377,755 83,417 96.2% 479,175 96.2%
Scalehouse Roof No Budget No Budget Planning & Scoping October 2019Supplier and builder appointed. Installion to commence early August
Spelling Yard 0 No Budget No Budget Planning & Scoping October 2020 GBA appointed as Project Managers
Draft Area - Additional Shade 75,000 42,260 34,576 102.4% 75,000 102.4% Construction July 2019Contract awarded construction to start 27th June
Roof Over Crush & Dip Area 29,532 31,877 0 107.9% 29,532 107.9% Completed (Practical Completion) Completed
20 x 10m Shed for Hay Storage 10,104 12,585 0 124.6% 10,104 124.6% Planning & Scoping October 2019Supplier and builder appointed. Installion to commence early August
Barricade Overhead Catwalks 2015.16 0 0 0 No Budget 0 No Budget Planning & Scoping Complicated by design
Additional Selling Pens - adjacent to Draft Area 75,824 74,847 205 99.0% 75,824 99.0% Completed (Practical Completion) Completed December 2018
Additional Drafting Facility 150,640 146,184 0 97.0% 150,640 97.0% Completed (Practical Completion) Completed may 2019 May 2019 Works now completed
Replacement of the Electrical Service Pits 24,000 3,795 14,545 76.4% 24,000 76.4% Construction July 2019 2 done, 2 to go
Additional Double Decker Dump Ramp 9,075 9,075 0 100.0% 9,075 100.0% Planning & Scoping October 2019Contract awarded construction to start September2019
Light pole Replacement 105,000 57,132 34,091 86.9% 105,000 86.9% Construction July 2019 Contractor on site now
20190709 - Finance and Infrastructure Standing Committee Meeting - Agenda
Central Highlands Regional Council 42 of 84
20190709 - Finance and Infrastructure Standing Committee Meeting - Agenda
Central Highlands Regional Council 43 of 84
9.2 Infrastructure and Utilities
9.2.1 Infrastructure and Utilities - Departmental Update .... approx 10 minsDEPARTMENT UPDATE REPORT
Date: 9 July 2019 Presentation Duration: Approx. 10 minutes
To: Finance and Infrastructure Standing Committee Meeting
Author: Tyronne Meredith, Acting Manager InfrastructurePeter Manning, Manager Water UtilitiesKym Downey, Project Development and Contract DeliveryJason Hoolihan, Acting General Manager Infrastructure & Utilities
Authorising Officer: Jason Hoolihan, Acting General Manager Infrastructure and Utilities
File Reference: Nil
EXECUTIVE SUMMARY:
The following report provides an update on key activities for the Infrastructure and Utilities department. INFRASTRUCTURE
Infrastructure Monthly Capital Update Infrastructure Maintenance Update National Heavy Vehicle Regulator – Central Highlands Regional Council Pilot Project
WATER UTILITIES Qldwater Technical Reference Group Central Highlands and Isaac Regional Councils Water and Waste Networking Queensland Urban Water Industry Workforce Snapshot Report 2018
PROJECT DEVELOPMENT AND PROJECT DELIVERY Capricorn Highway (Codenwarra Road to Opal Street) Upgrade - Detailed Business Case
OFFICER RECOMMENDATION:
That Central Highlands Regional Council receive the Infrastructure and Utilities departmental update report, highlighting key activities for the month of June 2019.
REPORT:
1. INFRASTRUCTUREInfrastructure Monthly Capex Update Bonnie-Doon Road completed. Central Queensland Inland Port continuing. Subgrade and drainage works complete. Additional
internal resources being deployed to accelerate completion. Springsure Tambo Road completed Ruddlea Road Deferred, Grant funding allocated to overbudget R2R projects. Deferral due to no
availability of traditional owners to progress cultural heritage investigations and approvals. Silica Road continuing, Subgrade and drainage slabs complete. Culvert structures and pavement
remaining. Physical Completion ~75%. Estimated completion date 14 July. Comet Drainage Upgrade, complete. Fairbairn Dam Road, continuing. Material replacement and subgrade complete. Full expenditure of
grant funding for 18/19 financial year achieved. Estimated completion date 14 July Akubra Drive complete Floodway program construction/reconstruction projects complete some minor clean up remaining
under operational.
20190709 - Finance and Infrastructure Standing Committee Meeting - Agenda
Central Highlands Regional Council 44 of 84
Footpath construction/reconstruction projects complete
Infrastructure Maintenance UpdateCompleted Works for June 2019:South and East Resheet – Buckland Road, Wealwandangie Road Maintenance Grading – Mourindilla Road, Burkan Road, Willies Alsace, Willies Royles Central and North Maintenance Grading – Lochington area, Gemfields area, Cullin La Ringo Road Heavy Formation Grading – Lawrence Lane, Wyuna Road, Retro Corry Resheet – Cotherstone Road Rehabilitation – Crinum Road
Planned Works for July 2019:South and East Maintenance Grading – Wealwandangie Road, Arizona Road, Willies Creek – Alsace Road, Rewan
Road Central and North Maintenance Grading – Gemfields area, Medway Duccabrook Road, Olivevale Road Heavy Formation Grading – The Lawrence Lane, Crescendo Road
Operational Initiatives:A gravel additive from Reynolds Soil Technologies (RST) was used whilst grading approximately 6km of the Kielembete Road. This road has historically corrugated quickly after grading. The surface will be monitored closely after the application to determine its effectiveness in these conditions.
National Heavy Vehicle Regulator – Central Highlands Regional Council Pilot ProjectOn 11 April 2019 Manager Infrastructure, Jason Hoolihan attended a Study Tour with the National Heavy Vehicle Regulator (NHVR) in Hobart. The Tasmanian Department of State Growth (DSG) and the Local Government Association of Queensland (LGAQ) facilitated an Information Sharing Workshop attended by representatives from the Local Government Association of Tasmania (LGAT), the LGAQ, Hobart City Council, Meander Valley Council, Circular Head Council, the Queensland Department of Transport and Main Roads (TMR), the Crane Industry Council of Australia (CICA), the National Heavy Vehicle Regulator (NHVR), Goondiwindi Regional Council, Mackay Regional Council, Central Highlands Regional Council and Logan City Council.
The objective of the tour was to experience the new Tasmanian Assess Model for heavy vehicles and discuss the benefits and difficulties associated with implementing a system such as this within Queensland. The system is designed to give industry users greater certainty around transporting over size and over mass vehicles. The model which is still under final stages of development can be viewed at https://hvav.stategrowth.tas.gov.au/spv
Key learnings relating to the success of the Tasmanian Access Model include: The importance of the communication between the State Road Authority, Local Government road
managers, the NHVR and the OSOM/SPV industries. The importance of road managers understanding heavy vehicle activity against road transport
infrastructure to enable safe and efficient access whilst responsibly managing the road transport asset for all
Departing from Standards without compromising intent through the application of measured risk and state/regional consolidated approach.
Granularity in describing the heavy vehicle fleet and its activities (i.e. why disadvantage a less onerous vehicle by grouping it with the worst performer within an envelope).
Importance of working with industry in regard to the imposition of road and travel conditions. GIS – Accurate base road data and road ownership. The importance of being clear about requirements with consultants.
20190709 - Finance and Infrastructure Standing Committee Meeting - Agenda
Central Highlands Regional Council 45 of 84
As an outcome of the study tour Central Highlands Regional Council has been invited to participate in the Qld Pilot Project. This project seeks to understand the various resourcing and costs for each of the four pilot councils to complete the minimum data requirements for the Tasmanian system and will produce basic networks for a number of heavy vehicle activities.
Central Highland Regional Council position within the Bowen Basin and high number of mine related heavy loads make it a perfect case study. Funding is available to assist Councils in this pilot and updates will be provided to Council as the project proceeds.
Attached Queensland Local Government - Heavy Vehicle Network Development - Study TourThe Tasmanian Heavy Vehicle Access Management Methodology Pilot
2. WATER UTILITIES
Qldwater Technical Reference GroupManager Water Utilities, Peter Manning attended the qldwater Technical Reference Group meeting on 14 June and presented an update on the urban water pricing process with Sunwater. Other topics covered during the workshop included:
A debrief on the asset management workshop held on the previous day An update to the group on activities undertaken since the previous meeting such as the March
regional conference in Biloela and the annual Water Connections Week (when qldwater representatives and representatives of the regulators) visited SW Queensland Councils
Design and construction codes – it was noted that some organisations such as Water Services Association of Australia (WSAA) are transitioning their codes to ebooks (with fee basis still to be resolved)
Planning for the annual forum An update on emerging contaminant issues such as PFAS, and input into the Queensland End
of Waste Code (which may influence the reuse of biosolids).
Central Highlands and Isaac Regional Councils Water and Waste Networking Manager Water Utilities, Peter Manning and Manager Planning and Environment, Kirstin Byrne, attending a meeting with Isaac Regional Council on 21 June to discuss opportunities for knowledge sharing and collaboration in the Waste and Water areas. The meeting was also attended by LGAQ and qldwater representatives.At this initial meeting the two shared current planned works (such as recent capital works completed) and challenges we currently face. In the waste area this included collaborating on the new kerbside collection contract and readiness of the two councils for the waste levy.
Two additional presentations were included: Landfill care – a presentation from a consultant using drones for methane detection at landfills to
give better targeted data for remediation Solar power – an initial feasibility being undertaken for a floating solar array on a raw water dam
which could give other benefits such as reduced evaporation.
Queensland Urban Water Industry Workforce Snapshot Report 2018The latest copy of the Queensland Urban Water Industry Workforce Composition Snapshot Report was released at the end of June. This report is prepared every two years, and CHRC is one of the councils which contributes to the report.The report shows a continuation of the trends shown in previous reports that the water industry in Queensland has an aging workforce, with declines in the number of employees under the age of 30, and increases in the 31-40, and over 60 age bands. The report also highlights the shortage and difficulty in recruiting qualified treatment operators, not just in Queensland but also nationally. .
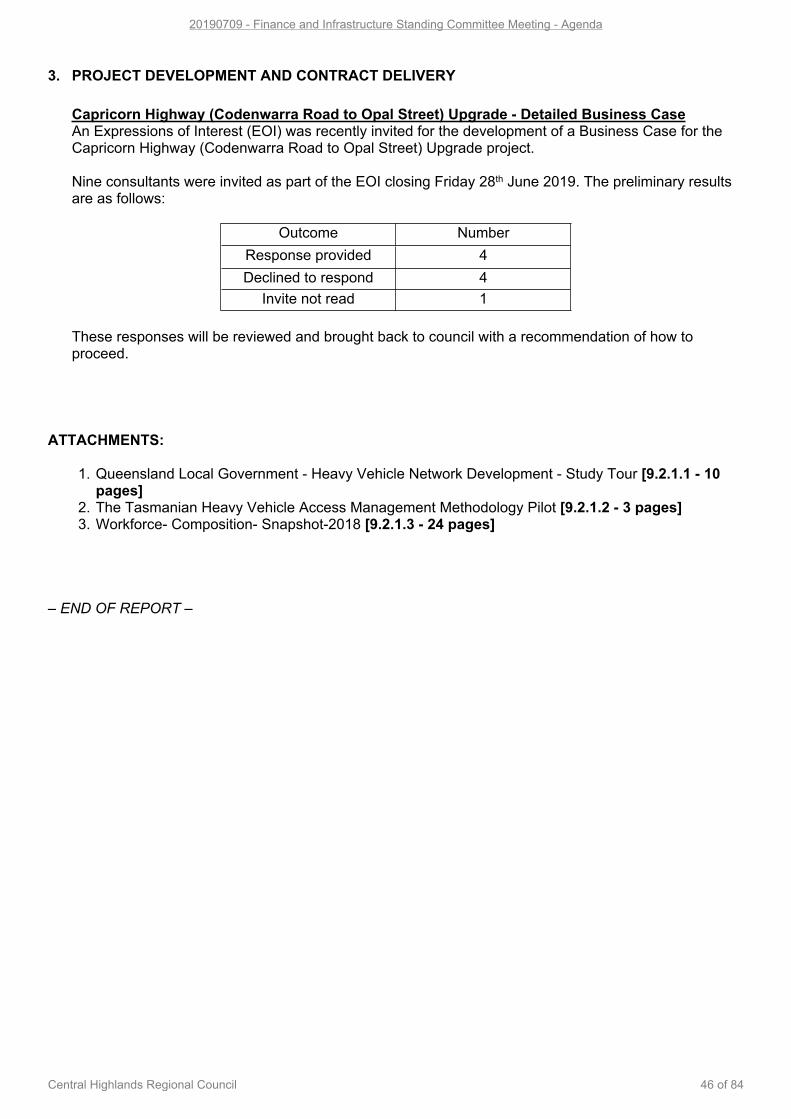
20190709 - Finance and Infrastructure Standing Committee Meeting - Agenda
Central Highlands Regional Council 46 of 84
3. PROJECT DEVELOPMENT AND CONTRACT DELIVERY
Capricorn Highway (Codenwarra Road to Opal Street) Upgrade - Detailed Business CaseAn Expressions of Interest (EOI) was recently invited for the development of a Business Case for the Capricorn Highway (Codenwarra Road to Opal Street) Upgrade project.
Nine consultants were invited as part of the EOI closing Friday 28th June 2019. The preliminary results are as follows:
Outcome NumberResponse provided 4Declined to respond 4
Invite not read 1
These responses will be reviewed and brought back to council with a recommendation of how to proceed.
ATTACHMENTS:
1. Queensland Local Government - Heavy Vehicle Network Development - Study Tour [9.2.1.1 - 10 pages]
2. The Tasmanian Heavy Vehicle Access Management Methodology Pilot [9.2.1.2 - 3 pages]3. Workforce- Composition- Snapshot-2018 [9.2.1.3 - 24 pages]
– END OF REPORT –
July 19 Click or tap here to enter text.
Queensland Local Government - Heavy Vehicle Network Development Study Tour Report
20190709 - Finance and Infrastructure Standing Committee Meeting - Agenda
Central Highlands Regional Council 47 of 84
July 19
2
1 INTRODUCTION
1.1 Objective This report outlines the steps to deliver the development of Class 1 Heavy Vehicle Networks in Queensland. The report also outlines the basis for a collaborative work program between the LGAQ, NHVR, TMR, DIRDC and will consider utilising a similar methodology adopted by the Department of State Growth, Tasmania (State Growth) to streamline the permitting process in Tasmania.
1.2 Background OSOM Review On 29 June 2018, the Deputy Prime Minister, the Hon Michael McCormack MP announced the commencement of an independent review of current Oversize Overmass (OSOM) access arrangements, to consider the regulatory framework and the system processes for ensuring safe, productive and critical access by OSOM vehicles to Australia's road network. The report provided 38 recommendations including the following: Transport and Infrastructure Council agree to develop and implement an
industry-centric triaging system for bridge assessments, within 12 months. Reduction of permit volumes by 30% by 2020, through pre-approvals and
notices. Transport and Infrastructure Council agree an envelope approach is taken for
low risk OSOM vehicles, with NHVR and road managers to agree a common envelope within 6 months.
Transport and Infrastructure Council to agree low risk OSOM vehicles within envelope be provided a 48-hour turnaround time (on average), within 3 years.
Return of Delegation Project Since March 2014, the NHVR have delegated the permitting provisions for all intrastate class 1 heavy vehicles in Queensland to the Department of Transport and Main Roads (TMR). This represents about 75% of all permits in Queensland. TMR currently issue twenty thousand permits each year, 8000 of which are “Period Permits” which gives certain categories of Special Purpose Vehicles and Oversize Overmass Vehicles access to all state-controlled roads (excluding some restricted structures). These period permits often do not include local government roads and present a risk to not just the local infrastructure that may not be suitable, but to the NHVR and local government if the delegations were to return.
20190709 - Finance and Infrastructure Standing Committee Meeting - Agenda
Central Highlands Regional Council 48 of 84
July 19
3
1.3 LGAQ Work to date A conference motion in 2015 and a subsequent understand activity coordinated by the LGAQ identified the need for assistance for local government in relation to their responsibilities as road managers under the Heavy Vehicle National Law (HVNL). In 2016 the LGAQ and the NHVR signed a Memorandum of Agreement to work collaboratively in achieving joint objectives in increasing efficiencies for industry whilst ensuring road infrastructure and public safety are effectively managed. In July 2016, the LGAQ created the position of Heavy Vehicle Access Liaison Officer to assist local government in relation to heavy vehicle access matters. Since 2016 the LGAQ has assisted QLD local government on a range of heavy vehicle access related matters, some of the achievements include:
Collaboration with CICA and NHVR to ensure all QLD councils have consented to the SPV Notice (the only state to successfully have all councils consent)
All QLD councils provide consent to the B-double Notice All QLD councils provide access under pre-approval for new Australian Defence
Force vehicles utilising depots and training facilities Increased pre-approvals for all classes of vehicles (saving council and transport
operators time) All councils currently using the NHVR Portal (20 workshops facilitated in 2018) Representation on behalf of councils in the OSOM Review
As part of the OSOM Review, the LGAQ has facilitated a further 15 workshops across Queensland with the aim of providing councils with the information required to make informed access decisions around future OSOM and SPV Notices. Limitations There are two key limitations to increasing the effectiveness of Queensland councils regarding heavy vehicle access:
Structural Assessment methodology/framework – The LGAQ have engaged with the state jurisdiction and ARRB, but due to financial constraints were unable to provide technical assistance to local government with structural assessment methodology
System – There is no widely used system in Queensland to consistently capture and map structural assessments/conditions/load effects.
1.4 Case Study – Tasmanian Approach to Access
20190709 - Finance and Infrastructure Standing Committee Meeting - Agenda
Central Highlands Regional Council 49 of 84
July 19
4
Department of State Growth (State Growth) presented to the LGAQ’s, Roads and Transport Advisory Group on how they provide access to the state and local road network for class 1 heavy vehicles. In 2015 State Growth commenced a large project to create ‘pre-consented’ State and Local road networks for oversize overmass (OSOM) vehicles under a Gazetted Notice (Notice). The purpose of this project was to maximise safe and efficient access for these vehicles and to minimise permits. The OSOM access project resulted in approximately 80% of OSOM activity operating under Notice. State Growth has also completed a similar project for Special Purpose Vehicles (SPVs). The SPV access project aims to have approximately 95% of SPV activity operating under Notice. Benefits realised through this approach include:
80% reduction in permit administration Transparency for industry and road managers Captures structural pinch points on the network and integrates the state and
local government to give a fully integrated network. certainty of access for operators of existing SPVs and the ability for industry to
instantaneously view road access for SPVs they are seeking to purchase to add to their fleet.
Infrastructure owners can use the data to inform and prioritise future bridge strengthening and capital infrastructure programs to enhance levels of access.
No additional actions required resulting from the OSOM Review
2 STUDY TOUR – HOBART
On 12 April 2019, State Growth and the LGAQ facilitated an Information Sharing Workshop attended by representatives from the Local Government Association of Tasmania (LGAT), the LGAQ, Hobart City Council, TMR, the NHVR, Goondiwindi Regional Council, Mackay Regional Council, Central Highlands Regional Council and Logan City Council. The following council participants were selected to represent Queensland councils:
Graeme Hawes, Manager – Infrastructure at Mackay Regional Council was selected due to the high level of SPV and OSOM consents and high number of culverts in the region.
Jason Hoolihan, Manager – Infrastructure at Central Highlands Regional Council was selected due to a high number of mining related OSOM/SPV movements.
Antony Andradi, Senior Engineer at Logan City Council was selected as a representative of an urban city council and to represent South East QLD.
20190709 - Finance and Infrastructure Standing Committee Meeting - Agenda
Central Highlands Regional Council 50 of 84
July 19
5
Luke Tanner, Manager of Infrastructure at Goondiwindi Regional Council was selected as a representative of a regional council
The workshop covered the key steps and frameworks to successfully develop networks for certain types of OSOM and SPV vehicles. The agenda included the following:
Governance and Culture Vehicle Parameters and Granulation Standards and Guidelines – Intent and Interpretation Asset information and Data Assessment Methods Travel Conditions and Mitigations Engineering/GIS Interface GIS Web Map Viewer and the Front End
Key learnings relating to the success of the Tasmanian Access Model include:
The importance of the communication between State Road Authority, local government road managers and the OSOM/SPV industry.
The importance of road managers understanding the freight task and enabling efficient but safe access.
Departure for AS5100 Bridge Assessment Standards through the application of measured risk and state/regional consolidated approach.
Granularity of bridge assessments (i.e. why punish a mess onerous vehicle by grouping it with the worst performer within an envelope).
Importance of working with industry in regard to the imposition of road and travel conditions.
GIS – Accurate base road data and road ownership The importance of being clear about requirements with consultants
20190709 - Finance and Infrastructure Standing Committee Meeting - Agenda
Central Highlands Regional Council 51 of 84
July 19
6
3 COUNCIL FEEDBACK General feedback from all Queensland council attendees was positive. The Tasmanian council participants had very positive feedback on their relationship with State Growth. Logan City Council
Thank you very much inviting us to participate the NHVR workshop in Hobart. Please convey my sincere thanks for all colleagues in State Growth who were with us on 11 April 2019. Currently, Logan City Council (LCC) is working towards to establish a robust process to approve the NHVR Heavy Vehicle Applications. This includes to purchase a software to undertake Structural Capacity Assessment of some of the Logan vulnerable bridges. This workshop may assist us to allow LCC to potentially improve processing time significantly for Heavy Vehicle Applications while managing risk for some of the key LCC infrastructure. Given Council’s priority to support business and jobs in Logan this project to improve the LCC processes should assist to reduce some application turnaround times, manage work and support efficient freight movement which a the critical part of the Logan economy. A more thorough risk management process will also assist in managing the bridge asset class in line with large organisations. Following are the some of the items which boosted my knowledge during this workshop:
To build a positive corporate culture between all local authorities and TMR. Understanding about vehicle parameters and Granulation – Current and future
common heavy vehicle fleet in Australia. Asset data (Bridges and road alignment & pavement structure) improvement
and verification. Assessment method – Structural Assessment of Bridge Structures.
Mackay Regional Council Overall system very impressive but data capture and assessment is the key and could be a significant $ investment which may be outside of the ability of LG solely without assistance to fund and resource. Data Capture & Assessment/ Bridge Asset data – Comprehensive information may not be available for all structures Bridge Assessment – Consultant costs from Tas were significantly below that locally found. Need to understand the method and standards being used to assess. Range of vehicle combinations and critical load effects will be greater in Qld because of wider
20190709 - Finance and Infrastructure Standing Committee Meeting - Agenda
Central Highlands Regional Council 52 of 84
July 19
7
range of configurations so expect costs to be higher. Need also to understand how component condition scores are used to build in load reduction on bridge structures. A 4-step range of assessments appear to have been used but need to understand the criteria as to how these were applied. Lowest order appeared to do simple BM/Sf assessments through to the highest order for full structural and substructure assessments LIDAR assessment slope & curvature – Can be extracted and plotted – Imagine significant costs on large network Vehicle envelope assessment and obstructions – Will have to be considered and assessed locally Culverts – appears that culvert assessments were included but unsure how condition state scores were considered as part of load reduction factors. Again, assessment cost for structural standards need to be understood as costs appear in Tas significantly lower than that experienced in Qld Need to consider establishing structural assessment framework so that system can be reassessed when alternate vehicle configurations are requested for specific routes e.g. inclusion of a load effect generator which can be part of the assessment process. Tas system focussed on limited vehicle combinations so this will need to be enlarged for the Qld scenario A state-wide consideration of risk assessment needed in relation to acceptance of bridge/Culvert standards below the current AS5100 requirements LG alone would be more risk adverse but if a consolidated approach with justification via structural assessment is needed to allow higher levels of risk to be accepted This also includes state-wide acceptance of modified load factors in AS5100 to reflect known practices and inclusion of standard mitigation practices to limit these factors in travel conditions • Engagement with HV operators a mandatory item to bring system into play Goondiwindi Regional Council Thanks for the opportunity to attend the study tour to Hobart a couple of weeks ago. The workshop hosted by the Tasmanian Department of State Growth was very informative & the concept appears to have the potential to be applied in other jurisdictions. Below are a couple of points from my observations:
20190709 - Finance and Infrastructure Standing Committee Meeting - Agenda
Central Highlands Regional Council 53 of 84
July 19
8
The work done in Tasmania was very much focussed on OSOM & SPVs. We receive a very low volume of requests on our local roads for these vehicle types. From our point of view, I think focusing on Freight vehicles as the first priority would provide a much more significant return on investment.
Our council has reasonably good records & knowledge of the condition of our structures, but the design standards are less well known. I’ll need some time to try & populate the required data in the template you provided on Wednesday last week.
Consultation with council & local industry would benefit in determining priority routes.
I would be reluctant to issue notices with conditions relating to speed or other vehicles on structures unless it could be monitored.
The variety of large heavy vehicles in Queensland would require a more detailed look at geometric considerations at intersections. This is particularly relevant when considering notices for freight vehicles rather than one off movements of SPVs
Massaging load factors in the design standards may be appropriate for SPVs where masses are generally well known, but this approach carries much more risk when considering freight vehicles which can be significantly overloaded.
The culture at the Department of State Growth appears to be very progressive & cooperative.
Central Highlands Regional Council Thank you for the opportunity to attend the study tour to Hobart to explore the Tasmania Access Model. We see a great benefit in the system and look forward to working with the NHVR to investigate possibilities of implementing a similar system in Queensland. As a shire within the Bowen Basin our road network plays a critic role in supporting industries in both the mining sector and agriculture. With increased loads and performance-based vehicles entering fleets across the state, adopting a similar system will give industry confidence that they can run their businesses efficiently. Central Highlands Regional Council recognises the importance of a safe efficient road network. Learnings from the workshop include:
The focus on OSOM and Special Purpose Vehicles (SPVs) within the Tasmanian Model could be expanded to include Performance Based Vehicles that will benefit local producers.
A detailed knowledge of Council assets including structures is required, this may take a significant investment of time and $’s.
Cooperation with neighbouring shire and Transport and Main Roads is critical to the success of this type of project.
20190709 - Finance and Infrastructure Standing Committee Meeting - Agenda
Central Highlands Regional Council 54 of 84
July 19
9
4 WORK IN PROGRESS Forming part of the latest round of Heavy Vehicle Access Workshops (February – June 2019), is the development of local government networks for certain categories of OSOM and SPV vehicle To assist the LGAQ and the NHVR in the development of local government networks, the LGAQ, and the NHVR are collaborating with CICA. A CICA officer will follow up with attendees of the Heavy Vehicle Access Workshops to develop a network of access by exclusion or restriction for low risk categories of SPV, whilst the LGAQ will follow up regarding OSOM access. Restrictions would include:
- Timber bridges - Load limited bridges - Structures in poor condition - Unknown structures
As a result of the workshops, councils are now considering network access for categories of SPV and OSOM. This model will provide a resolution for several of the OSOM recommendations and will mitigate any risks that may occur as a result of the return of delegations. The State Growth framework and system will further enhance this work by providing a more granular vehicle-based network rather than a worst performing vehicle / envelope approach. Action – The LGAQ and NHVR steering committee in collaboration with TMR (as a standing invitee), consider the integration of the State Growth access model as a part of Queensland specific work program.
5 PROPOSED PILOT
State Growth has offered to add the four councils that attended the ‘study tour’ into their system State Growth have provided the LGAQ and the four councils with a ‘Bridge Data Template’ with provides the minimum data requirements for the State Growth system to be able process the load capacities for each structure. Each council will have varying levels of data sophistication and understanding of their structural assets, so the trial will provide insights into costs, resource requirements and the time required based on each council’s current circumstance.
20190709 - Finance and Infrastructure Standing Committee Meeting - Agenda
Central Highlands Regional Council 55 of 84
July 19
10
To start the four councils will need to provide the minimum data required for each structure to enable the system to produce load effects and load capacities for each structure. This pilot will test the replicability of the State Growth access model and quantify the costs, resourcing and data requirements.
6 BENEFITS FOR LOCAL GOVERNMENT Replication of State Growths approach to OSOM and SPV access provides numerous opportunities for improvements to the current access arrangements for Class 1 OSOM and SPV. For example, the opportunity for delivery of the following outcomes: Administrative savings through reduction in permits and assessments Transparency for industry and for local government Ease of access for industry. Road manager confidence that assets are protected. Expedited access for key infrastructure and construction projects. Better targeted applications for funding and grants. Better industry compliance.
20190709 - Finance and Infrastructure Standing Committee Meeting - Agenda
Central Highlands Regional Council 56 of 84
Project Brief May 2019
Project Title and Location Details
Title of Project: The Tasmanian Heavy Vehicle Access Management Methodology Pilot
Location / Region: Four Queensland local government areas, namely Mackay Regional Council, Logan City
Council, Goondiwindi Regional Council and Central Highlands Regional Council
Project Overview
Project Drivers
OSOM Review
On 29 June 2018, the Deputy Prime Minister, the Hon Michael McCormack MP announced the commencement of an independent review of current Oversize Overmass (OSOM) access arrangements, to consider the regulatory framework and the system processes for ensuring safe, productive and critical access by OSOM vehicles to Australia's road network. The report provided 38 recommendations including the following:
Transport and Infrastructure Council agree to develop and implement an industry-centric triaging system for bridge
assessments, within 12 months.
Reduction of permit volumes by 30% by 2020, through pre-approvals and notices.
Transport and Infrastructure Council agree an envelope approach is taken for low risk OSOM vehicles, with NHVR
and road managers to agree a common envelope within 6 months.
Transport and Infrastructure Council to agree low risk OSOM vehicles within envelope be provided a 48-hour
turnaround time (on average), within 3 years.
In March 2019 as part of the federal budget, $8 million dollars was announced to be allocated towards the development
of an asset management tool, project management costs and to undertake bridge assessments for certain Local Govt
roads across Australia.
LGAQ Study Tour to Tasmania
On 12 April 2019, the Tasmanian Department of State Growth (DSG) and the Local Government Association of Queensland (LGAQ) facilitated an Information Sharing Workshop attended by representatives from the Local Government Association of Tasmania (LGAT), the LGAQ, Hobart City Council, Meander Valley Council, Circular Head Council, the Queensland Department of Transport and Main Roads (TMR), the Crane Industry Council of Australia (CICA), the National Heavy Vehicle Regulator (NHVR), Goondiwindi Regional Council, Mackay Regional Council, Central Highlands Regional Council and Logan City Council. The following council participants were selected to represent Queensland councils:
Graeme Hawes, Manager – Infrastructure at Mackay Regional Council (high level of SPV and OSOM consents and
high number of culverts in the region)
Jason Hoolihan, Manager – Infrastructure at Central Highlands Regional Council (high number of mining related
OSOM/SPV movements)
Antony Andradi, Senior Engineer at Logan City Council (urban city council in South East QLD)
Luke Tanner, Manager - Infrastructure at Goondiwindi Regional Council (mid-sized regional council).
The workshop covered the key steps undertaken and frameworks developed to successfully provide networks for the significant majority of OSOM and SPV heavy vehicle activity, being some 80 to 90% of that activity. The agenda included the following:
Governance and Culture
Vehicle Parameters and Granulation
Standards and Guidelines – Intent and Interpretation
20190709 - Finance and Infrastructure Standing Committee Meeting - Agenda
Central Highlands Regional Council 57 of 84
Page 2 of 3
Asset information and Data
Assessment Methods
Travel Conditions and Mitigations
Engineering/GIS Interface
GIS
Web Map Viewer and the Front End
Key learnings relating to the success of the Tasmanian Access Model include:
The importance of the communication between the State Road Authority, Local Government road managers, the
NHVR and the OSOM/SPV industries.
The importance of road managers understanding heavy vehicle activity against road transport infrastructure to enable
safe and efficient access whilst responsibly managing the road transport asset for all
Departing from Standards without compromising intent through the application of measured risk and state/regional
consolidated approach.
Granularity in describing the heavy vehicle fleet and its activities (i.e. why disadvantage a less onerous vehicle by
grouping it with the worst performer within an envelope).
Importance of working with industry in regard to the imposition of road and travel conditions.
GIS – Accurate base road data and road ownership.
The importance of being clear about requirements with consultants.
Project Aim
To test the suitability replicability of the DSG access management methodology with Local Government road networks in
Queensland.
Project Scope
This project seeks to understand the various resourcing and costs for each of the four pilot councils to complete the
minimum data requirements for the Tasmanian system and will produce basic networks for a number of heavy vehicle
activities.
Project Deliverables
A report detailing the extent of data each council has and the level of data missing to complete the template provided
by State Growth
Findings and lessons from the pilot.
Access maps for the four pilot councils.
The potential cost associated and resources required in delivering the methodology within the nominated councils.
Project Staging
Stage 1: Data and Infrastructure assessments
Stage 1a (June 2019): Councils to complete pilot preparedness assessment
Provide councils with template to undertake preparedness assessment
Identify data quality (what’s required vs what each council has already captured)
Scope possible cost and resourcing requirements based on data gaps
Outputs: completed preparedness assessment and confirmation of progression to future stages (four pilot councils)
Stage 1b (July 2019): Strategic route identification and assessment
Identify strategic routes through local knowledge and historical application data
Review data completeness against identified strategic routes / complete BAL 1 assessments on strategic routes
20190709 - Finance and Infrastructure Standing Committee Meeting - Agenda
Central Highlands Regional Council 58 of 84
Page 3 of 3
Outputs: Stage 1 assessment report
Stage 2: Report findings to Project Steering Committee
Provide reporting on stage 1 of the pilot at the Project Steering Committee
Identify what data is missing to complete the initial assessment (scope costs and resources to complete data
requirements)
Investigate use of consultants
Stage 3: Final report and next steps
Final report outlining learnings, resource requirements and recommendations how to potentially include other
councils.
Pilot councils that have completed the minimum data requirements can be included within the DSG Network Access
Project Governance & Management
Governance
A Project Steering Committee will be convened with membership of the Steering Committee including (but not be limited
at this stage to):
NHVR – Executive Director; Peter Caprioli
DSG – Manager Network Access; Simon Buxton
DSG – Asset Engineer Bridges; Aaron Percy
LGAQ – Lead – Roads, Transport and Infrastructure; Scott Britton
LGAQ Project Manager, Heavy Vehicle Access; Robert Chow
TMR: Executive Director – Access; Karl Frank
CICA: State Representative - Damien Hense
The Steering Committee will provide oversight to ensure that deliverables are developed to an acceptable standard.
Teleconferencing will be held at a regular frequency, with additional meetings or teleconferences as required.
Key Milestone Points
Confirmation of Pilot Arrangements June 2019
Project Commences June 2019
Stage One completed August 2019
Stage Two completed September 2019??
Stage Three completed End 2019??
Project Owners
The Project Owners is NHVR Executive Director - Freight and Supply Chain Productivity, Peter Caprioli
20190709 - Finance and Infrastructure Standing Committee Meeting - Agenda
Central Highlands Regional Council 59 of 84
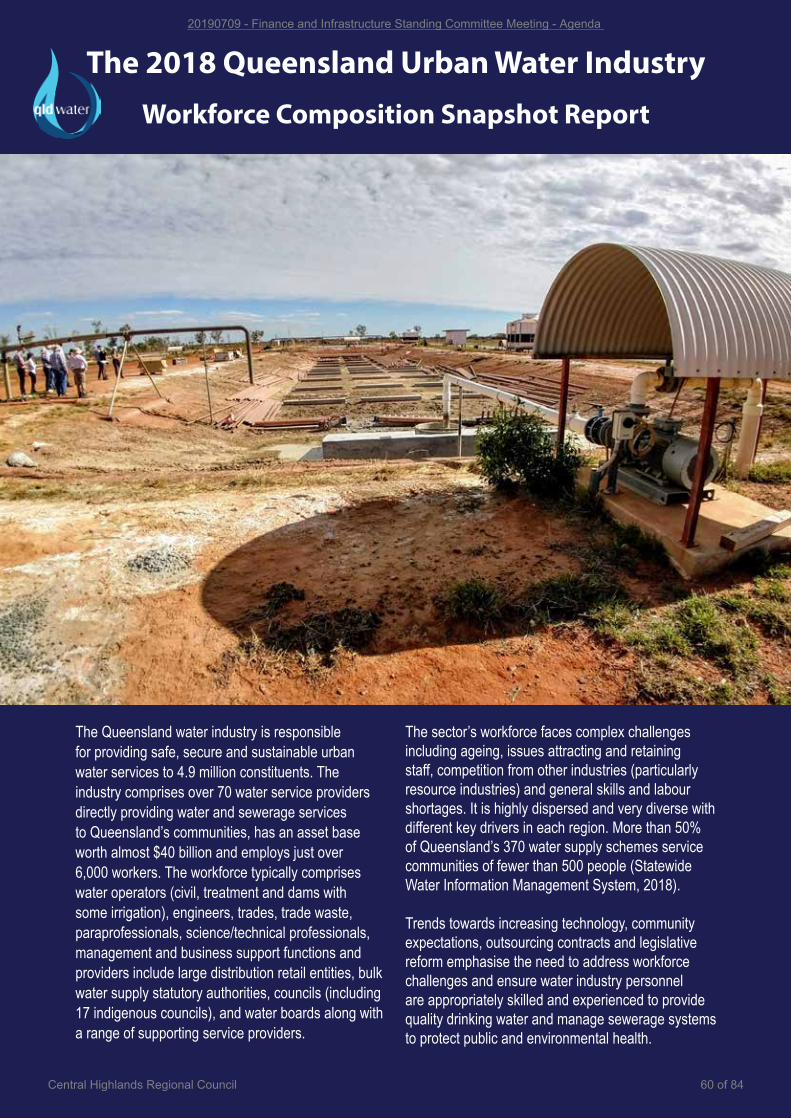
The 2018 Queensland Urban Water Industry Workforce Composition Snapshot Report
The Queensland water industry is responsible for providing safe, secure and sustainable urban water services to 4.9 million constituents. The industry comprises over 70 water service providers directly providing water and sewerage services to Queensland’s communities, has an asset base worth almost $40 billion and employs just over 6,000 workers. The workforce typically comprises water operators (civil, treatment and dams with some irrigation), engineers, trades, trade waste, paraprofessionals, science/technical professionals, management and business support functions and providers include large distribution retail entities, bulk water supply statutory authorities, councils (including 17 indigenous councils), and water boards along with a range of supporting service providers.
The sector’s workforce faces complex challenges including ageing, issues attracting and retaining staff, competition from other industries (particularly resource industries) and general skills and labour shortages. It is highly dispersed and very diverse with different key drivers in each region. More than 50% of Queensland’s 370 water supply schemes service communities of fewer than 500 people (Statewide Water Information Management System, 2018).
Trends towards increasing technology, community expectations, outsourcing contracts and legislative reform emphasise the need to address workforce challenges and ensure water industry personnel are appropriately skilled and experienced to provide quality drinking water and manage sewerage systems to protect public and environmental health.
20190709 - Finance and Infrastructure Standing Committee Meeting - Agenda
Central Highlands Regional Council 60 of 84
20190709 - Finance and Infrastructure Standing Committee Meeting - Agenda
Central Highlands Regional Council 61 of 84
is a business unit of the Institute of Public Works Engineering Australasia Queensland (IPWEAQ) and an initiative of the Institute of Public Works Engineering Australasia Queensland, Local Government Association of QLD, Local Government Managers Australia and the Australian Water Association.
This document can be referenced as the ‘Queensland Urban Water Industry Workforce Snapshot Report 2018’
Contents1. Overview & Summary ..................................................................................................................................................... 1
1.1 Snapshot Report Background ............................................................................................................................ 1
1.2 The Queensland Water Skills Partnership ....................................................................................................... 1
1.3 Key differences among the last five Snapshot Reports .............................................................................. 2
1.4 Methodology ............................................................................................................................................................. 3
2. Size and Scope of the Qld Water Industry ............................................................................................................... 4
2.1 Queensland Urban Water Industry Employers .............................................................................................. 4
2.2 Total Size of the Queensland Urban Water Industry .................................................................................... 5
2.3 Queensland Water and Sewerage Schemes ................................................................................................... 6
3. Workforce Statistics & Trends ........................................................................................................................................ 8
3.1 Job Families and trends ......................................................................................................................................... 8
3.2 Age Profile ................................................................................................................................................................... 10
3.3 Age Profile and Job Role Category..................................................................................................................... 11
Specialised occupations – a more detailed consideration of key occupations ......................................... 12
3.4 Gender Profile ............................................................................................................................................................ 14
3.5 Job Categories and Qualification Levels .......................................................................................................... 16
3.6 Outsourced roles ..................................................................................................................................................... 18
4. Conclusion ......................................................................................................................................................................... 19
References .............................................................................................................................................................................. 19
Queensland Water Skills Partnership Subscribers 2018/19 ................................................................................... 20
About qldwater ......................................................................................................................................................................21
20190709 - Finance and Infrastructure Standing Committee Meeting - Agenda
Central Highlands Regional Council 62 of 84
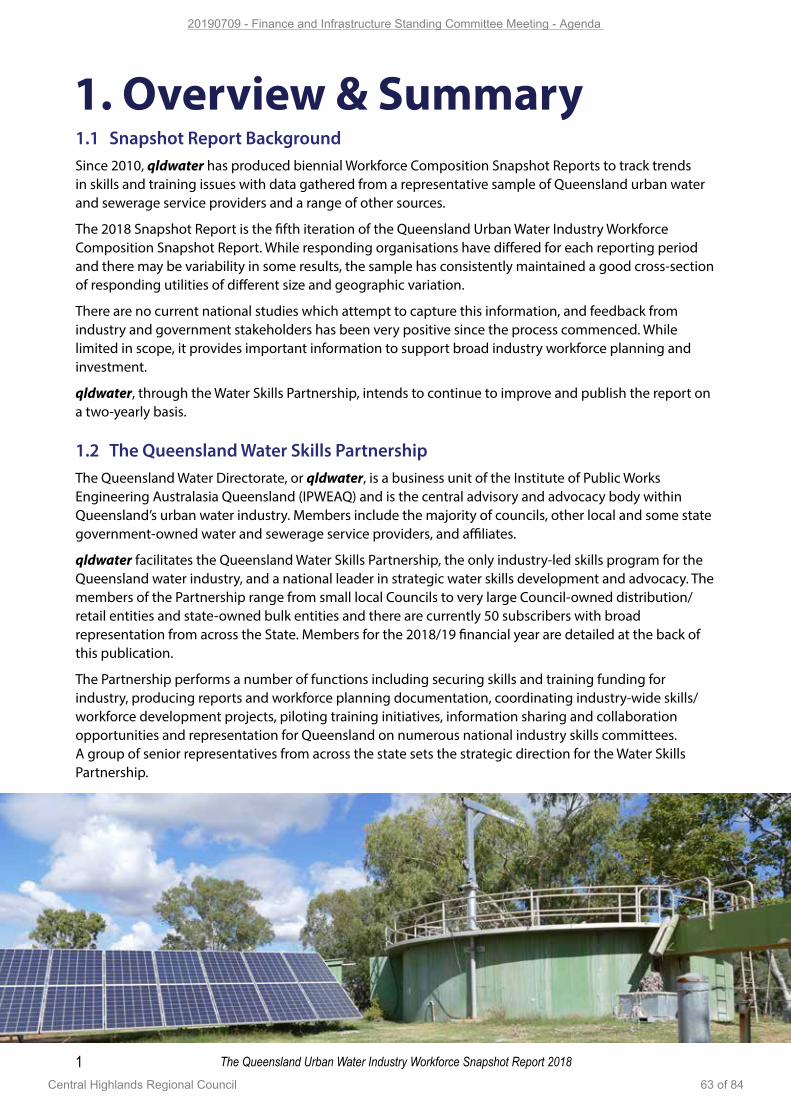
1 The Queensland Urban Water Industry Workforce Snapshot Report 2018
1. Overview & Summary1.1 Snapshot Report Background Since 2010, qldwater has produced biennial Workforce Composition Snapshot Reports to track trends in skills and training issues with data gathered from a representative sample of Queensland urban water and sewerage service providers and a range of other sources.
The 2018 Snapshot Report is the fifth iteration of the Queensland Urban Water Industry Workforce Composition Snapshot Report. While responding organisations have differed for each reporting period and there may be variability in some results, the sample has consistently maintained a good cross-section of responding utilities of different size and geographic variation.
There are no current national studies which attempt to capture this information, and feedback from industry and government stakeholders has been very positive since the process commenced. While limited in scope, it provides important information to support broad industry workforce planning and investment.
qldwater, through the Water Skills Partnership, intends to continue to improve and publish the report on a two-yearly basis.
1.2 The Queensland Water Skills Partnership The Queensland Water Directorate, or qldwater, is a business unit of the Institute of Public Works Engineering Australasia Queensland (IPWEAQ) and is the central advisory and advocacy body within Queensland’s urban water industry. Members include the majority of councils, other local and some state government-owned water and sewerage service providers, and affiliates.
qldwater facilitates the Queensland Water Skills Partnership, the only industry-led skills program for the Queensland water industry, and a national leader in strategic water skills development and advocacy. The members of the Partnership range from small local Councils to very large Council-owned distribution/retail entities and state-owned bulk entities and there are currently 50 subscribers with broad representation from across the State. Members for the 2018/19 financial year are detailed at the back of this publication.
The Partnership performs a number of functions including securing skills and training funding for industry, producing reports and workforce planning documentation, coordinating industry-wide skills/workforce development projects, piloting training initiatives, information sharing and collaboration opportunities and representation for Queensland on numerous national industry skills committees. A group of senior representatives from across the state sets the strategic direction for the Water Skills Partnership.
20190709 - Finance and Infrastructure Standing Committee Meeting - Agenda
Central Highlands Regional Council 63 of 84
2The Queensland Urban Water Industry Workforce Snapshot Report 2018
2017-2018 Water Skills Partnership Projects
• A small contract to provide water industry advice on vocational education and training-related activities to the Department of Employment, Small Business and Training (DESBT). The Department has been very proactive in seeking opportunities to support the industry, through targeted investment, strategic planning, and assistance with national Vocational Education and Training (VET) issues.
• Support of second chance training for Operator Certification.
• The first Water Skills Forum held in February 2018 to discuss critical workforce and skilling issues for the Queensland water industry. The forums are now held annually.
• A report to Jobs Queensland about the skilling and training needs for the water industry over the next 3-5 years.
• Submissions to State and Federal Government reviews of the Vocational Education and Training (VET) Sector.
• Representation on the Technical Advisory Committee for the Diploma of Water Industry Operations and assistance to industry to prepare for its implementation.
• Representation on the Water Industry Reference Committee that oversees the training package.
• Development of the Aqua Card, an online training course for people working on or around water infrastructure. It provides a simple overview of what contaminants are, the risks they pose, how they can enter a drinking water system and the responsibilities of those working on infrastructure to reduce that risk.
• Secretariat and Chair roles for the Water Industry Operator Certification Taskforce (previously the Water Industry Skills Taskforce).
• Regional Hub Training – coordination of collaborative training arrangements.
• Regular Water Skills Partnership and Water Industry Worker Technical Reference Group meetings.
• Ongoing partnerships with key agencies and organisations, such as the Water Industry Operators Association of Australia.
1.3 Key differences among the last five Snapshot ReportsKey differences among the 2018, 2016, 2014, 2012 and 2010 Snapshots of note are:
The data collection template for 2018 was modified to include additional indicators as requested by members of the Water Skills Partnership. Almost 70% of respondents included responses to the new indicators.
The final report data analysis including graphs have focussed on job categories rather than individual job roles, to assist with comparisons against previous Snapshot Reports.
There have been some changes to the participating organisations for each report, however there is reasonable consistency in the overall participant profile (particularly diversity - organisation size/ total number of employees) and overall the number of participating organisations has increased from previous reports. 2018 participants are noted under section 1.4.
20190709 - Finance and Infrastructure Standing Committee Meeting - Agenda
Central Highlands Regional Council 64 of 84
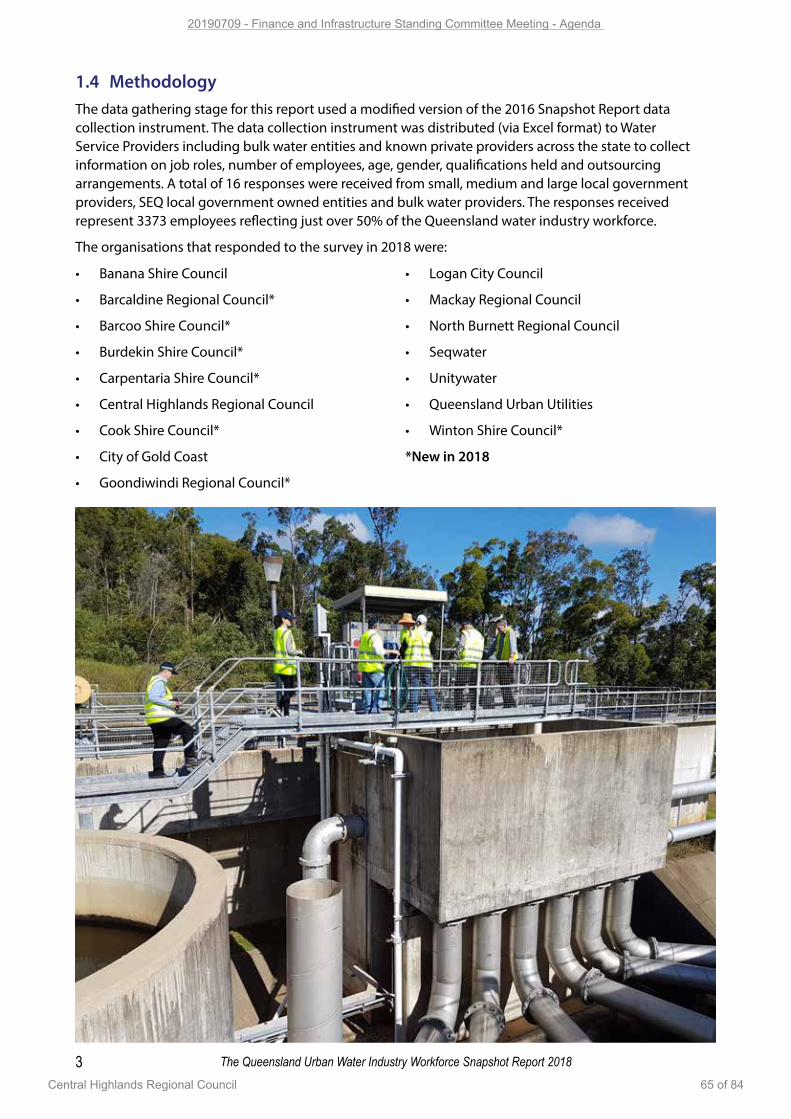
3 The Queensland Urban Water Industry Workforce Snapshot Report 2018
1.4 MethodologyThe data gathering stage for this report used a modified version of the 2016 Snapshot Report data collection instrument. The data collection instrument was distributed (via Excel format) to Water Service Providers including bulk water entities and known private providers across the state to collect information on job roles, number of employees, age, gender, qualifications held and outsourcing arrangements. A total of 16 responses were received from small, medium and large local government providers, SEQ local government owned entities and bulk water providers. The responses received represent 3373 employees reflecting just over 50% of the Queensland water industry workforce.
The organisations that responded to the survey in 2018 were:
• Banana Shire Council
• Barcaldine Regional Council*
• Barcoo Shire Council*
• Burdekin Shire Council*
• Carpentaria Shire Council*
• Central Highlands Regional Council
• Cook Shire Council*
• City of Gold Coast
• Goondiwindi Regional Council*
• Logan City Council
• Mackay Regional Council
• North Burnett Regional Council
• Seqwater
• Unitywater
• Queensland Urban Utilities
• Winton Shire Council*
*New in 2018
20190709 - Finance and Infrastructure Standing Committee Meeting - Agenda
Central Highlands Regional Council 65 of 84
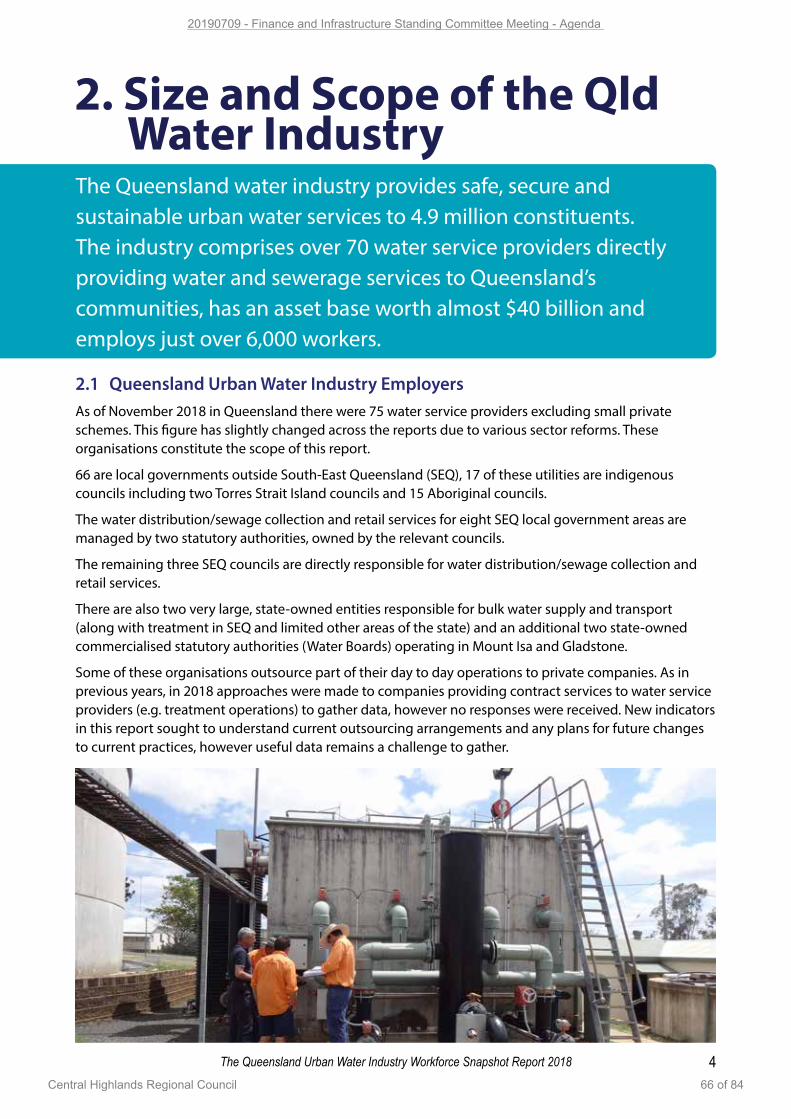
4The Queensland Urban Water Industry Workforce Snapshot Report 2018
2.1 Queensland Urban Water Industry EmployersAs of November 2018 in Queensland there were 75 water service providers excluding small private schemes. This figure has slightly changed across the reports due to various sector reforms. These organisations constitute the scope of this report.
66 are local governments outside South-East Queensland (SEQ), 17 of these utilities are indigenous councils including two Torres Strait Island councils and 15 Aboriginal councils.
The water distribution/sewage collection and retail services for eight SEQ local government areas are managed by two statutory authorities, owned by the relevant councils.
The remaining three SEQ councils are directly responsible for water distribution/sewage collection and retail services.
There are also two very large, state-owned entities responsible for bulk water supply and transport (along with treatment in SEQ and limited other areas of the state) and an additional two state-owned commercialised statutory authorities (Water Boards) operating in Mount Isa and Gladstone.
Some of these organisations outsource part of their day to day operations to private companies. As in previous years, in 2018 approaches were made to companies providing contract services to water service providers (e.g. treatment operations) to gather data, however no responses were received. New indicators in this report sought to understand current outsourcing arrangements and any plans for future changes to current practices, however useful data remains a challenge to gather.
The Queensland water industry provides safe, secure and sustainable urban water services to 4.9 million constituents. The industry comprises over 70 water service providers directly providing water and sewerage services to Queensland’s communities, has an asset base worth almost $40 billion and employs just over 6,000 workers.
2. Size and Scope of the Qld Water Industry
20190709 - Finance and Infrastructure Standing Committee Meeting - Agenda
Central Highlands Regional Council 66 of 84
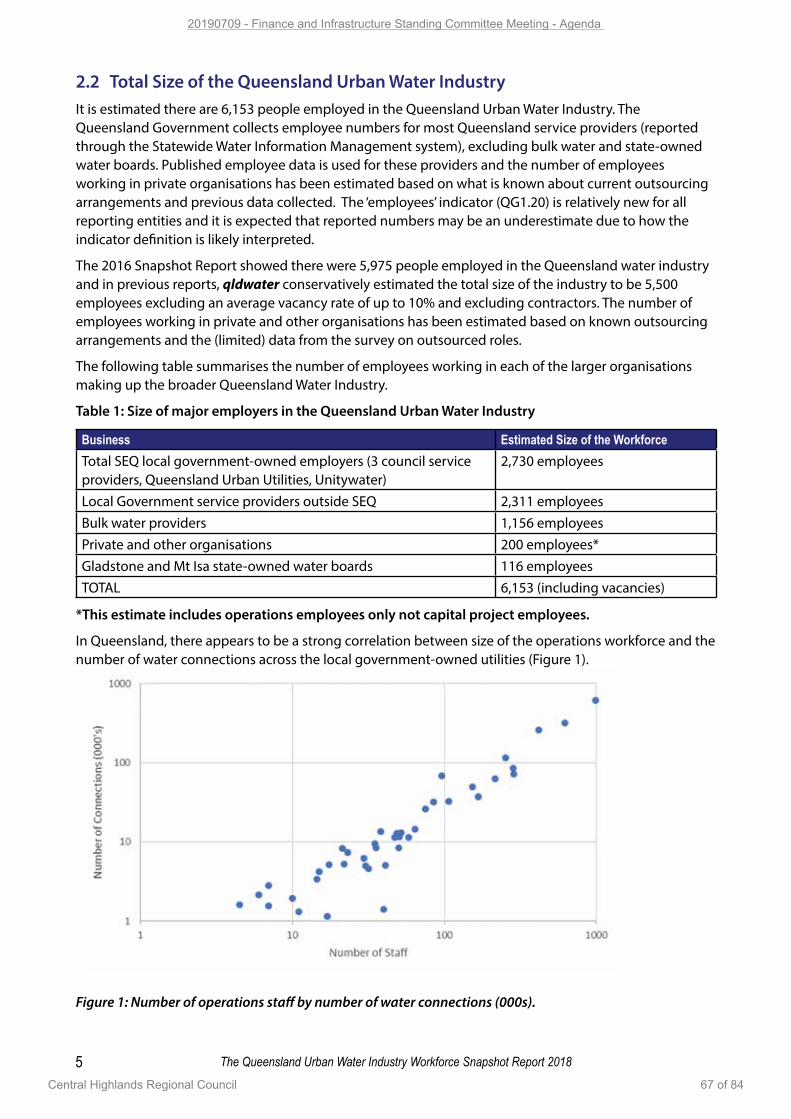
5 The Queensland Urban Water Industry Workforce Snapshot Report 2018
2.2 Total Size of the Queensland Urban Water IndustryIt is estimated there are 6,153 people employed in the Queensland Urban Water Industry. The Queensland Government collects employee numbers for most Queensland service providers (reported through the Statewide Water Information Management system), excluding bulk water and state-owned water boards. Published employee data is used for these providers and the number of employees working in private organisations has been estimated based on what is known about current outsourcing arrangements and previous data collected. The ‘employees’ indicator (QG1.20) is relatively new for all reporting entities and it is expected that reported numbers may be an underestimate due to how the indicator definition is likely interpreted.
The 2016 Snapshot Report showed there were 5,975 people employed in the Queensland water industry and in previous reports, qldwater conservatively estimated the total size of the industry to be 5,500 employees excluding an average vacancy rate of up to 10% and excluding contractors. The number of employees working in private and other organisations has been estimated based on known outsourcing arrangements and the (limited) data from the survey on outsourced roles.
The following table summarises the number of employees working in each of the larger organisations making up the broader Queensland Water Industry.
Table 1: Size of major employers in the Queensland Urban Water Industry
Business Estimated Size of the WorkforceTotal SEQ local government-owned employers (3 council service providers, Queensland Urban Utilities, Unitywater)
2,730 employees
Local Government service providers outside SEQ 2,311 employees Bulk water providers 1,156 employeesPrivate and other organisations 200 employees*Gladstone and Mt Isa state-owned water boards 116 employeesTOTAL 6,153 (including vacancies)
*This estimate includes operations employees only not capital project employees.
In Queensland, there appears to be a strong correlation between size of the operations workforce and the number of water connections across the local government-owned utilities (Figure 1).
Figure 1: Number of operations staff by number of water connections (000s).
20190709 - Finance and Infrastructure Standing Committee Meeting - Agenda
Central Highlands Regional Council 67 of 84
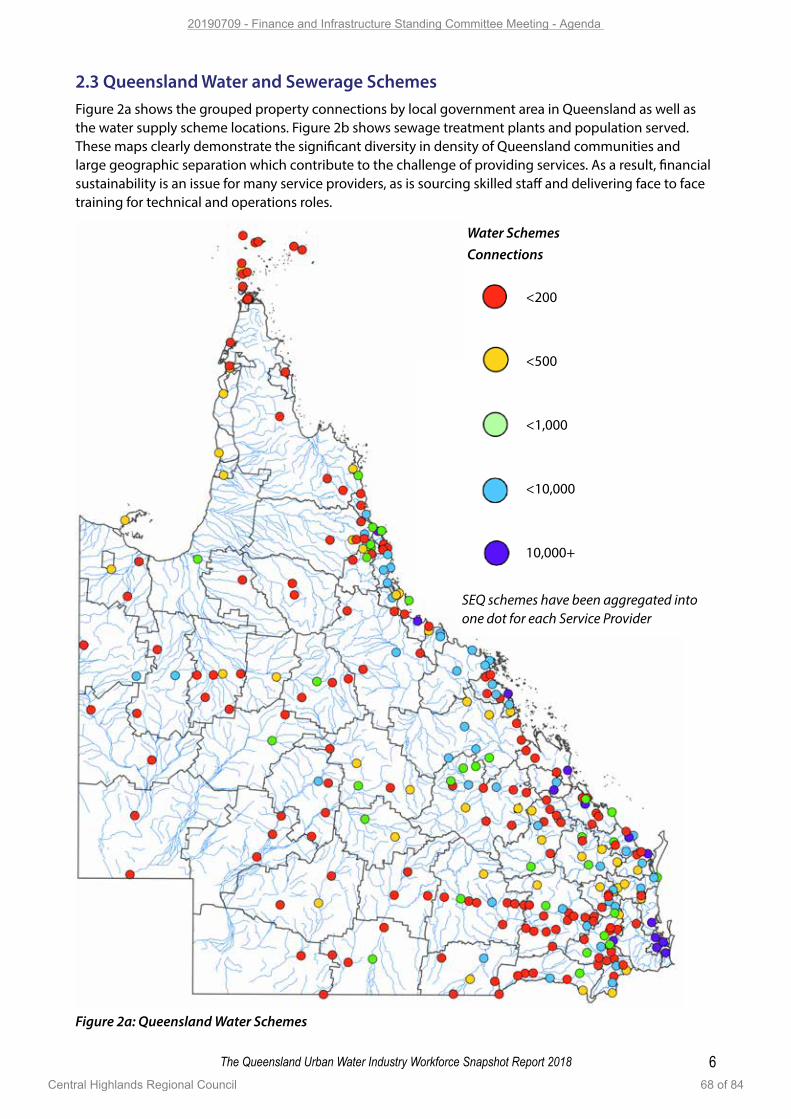
6The Queensland Urban Water Industry Workforce Snapshot Report 2018
2.3 Queensland Water and Sewerage SchemesFigure 2a shows the grouped property connections by local government area in Queensland as well as the water supply scheme locations. Figure 2b shows sewage treatment plants and population served. These maps clearly demonstrate the significant diversity in density of Queensland communities and large geographic separation which contribute to the challenge of providing services. As a result, financial sustainability is an issue for many service providers, as is sourcing skilled staff and delivering face to face training for technical and operations roles.
Figure 2a: Queensland Water Schemes
Water SchemesConnections
<200
<500
<1,000
<10,000
10,000+
SEQ schemes have been aggregated into one dot for each Service Provider
20190709 - Finance and Infrastructure Standing Committee Meeting - Agenda
Central Highlands Regional Council 68 of 84
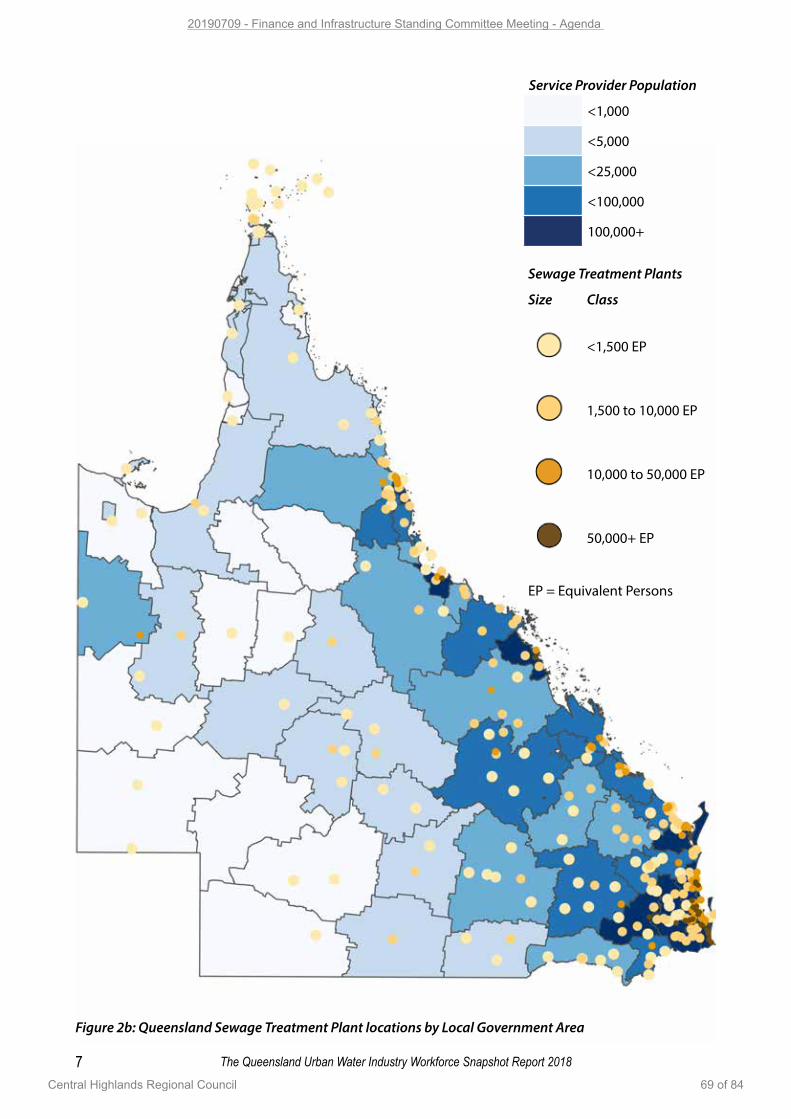
7 The Queensland Urban Water Industry Workforce Snapshot Report 2018
Figure 2b: Queensland Sewage Treatment Plant locations by Local Government Area
Service Provider Population
<1,000
<5,000
<25,000
<100,000
100,000+
Sewage Treatment Plants
Size Class
<1,500 EP
1,500 to 10,000 EP
10,000 to 50,000 EP
50,000+ EP
EP = Equivalent Persons
20190709 - Finance and Infrastructure Standing Committee Meeting - Agenda
Central Highlands Regional Council 69 of 84
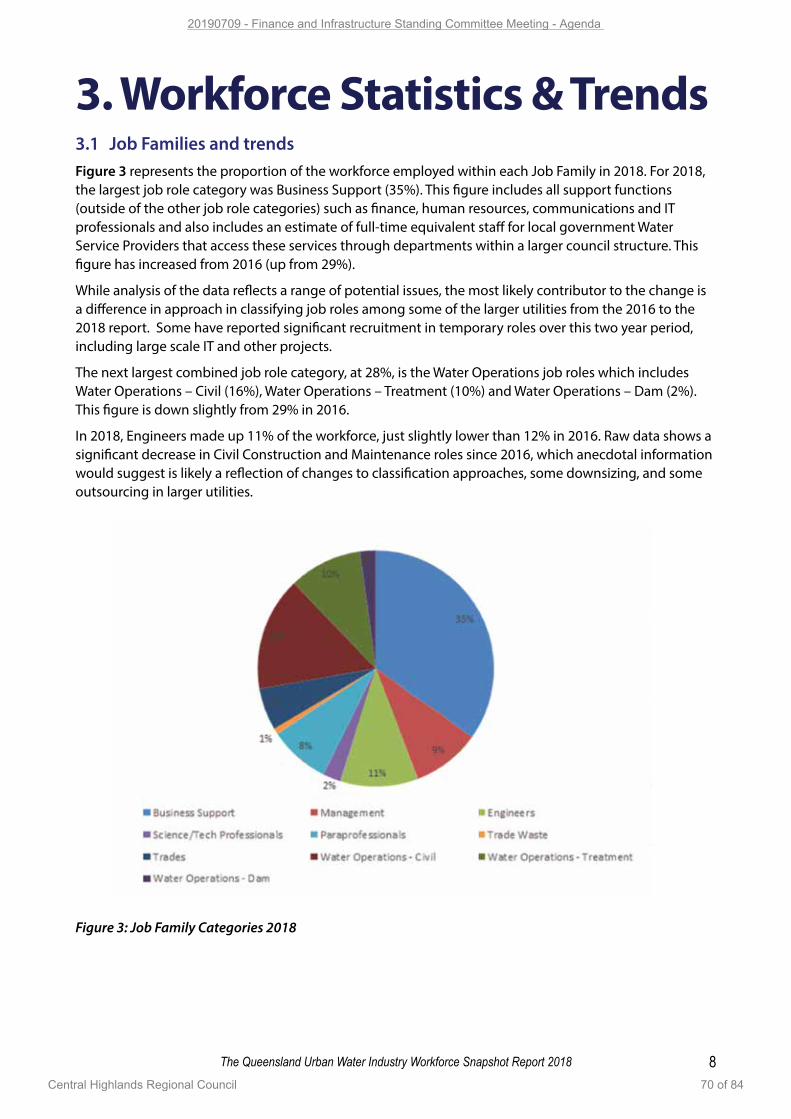
8The Queensland Urban Water Industry Workforce Snapshot Report 2018
3. Workforce Statistics & Trends3.1 Job Families and trendsFigure 3 represents the proportion of the workforce employed within each Job Family in 2018. For 2018, the largest job role category was Business Support (35%). This figure includes all support functions (outside of the other job role categories) such as finance, human resources, communications and IT professionals and also includes an estimate of full-time equivalent staff for local government Water Service Providers that access these services through departments within a larger council structure. This figure has increased from 2016 (up from 29%).
While analysis of the data reflects a range of potential issues, the most likely contributor to the change is a difference in approach in classifying job roles among some of the larger utilities from the 2016 to the 2018 report. Some have reported significant recruitment in temporary roles over this two year period, including large scale IT and other projects.
The next largest combined job role category, at 28%, is the Water Operations job roles which includes Water Operations – Civil (16%), Water Operations – Treatment (10%) and Water Operations – Dam (2%). This figure is down slightly from 29% in 2016.
In 2018, Engineers made up 11% of the workforce, just slightly lower than 12% in 2016. Raw data shows a significant decrease in Civil Construction and Maintenance roles since 2016, which anecdotal information would suggest is likely a reflection of changes to classification approaches, some downsizing, and some outsourcing in larger utilities.
Figure 3: Job Family Categories 2018
20190709 - Finance and Infrastructure Standing Committee Meeting - Agenda
Central Highlands Regional Council 70 of 84
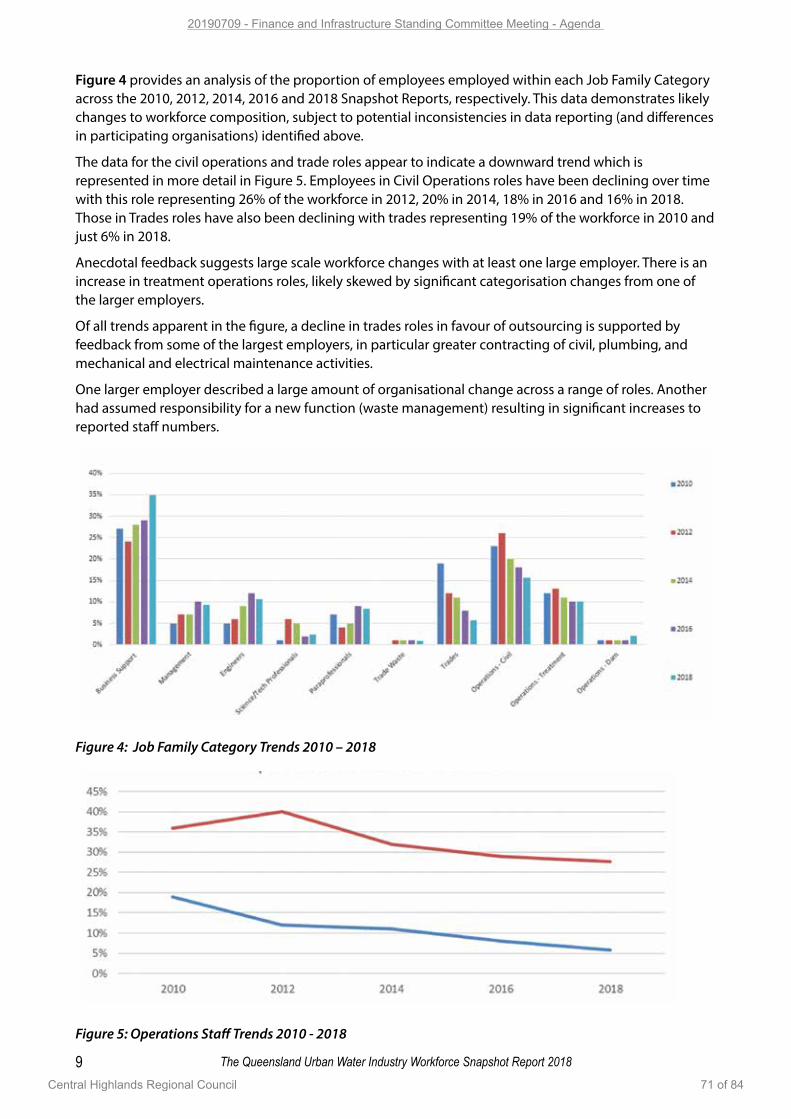
9 The Queensland Urban Water Industry Workforce Snapshot Report 2018
Figure 4 provides an analysis of the proportion of employees employed within each Job Family Category across the 2010, 2012, 2014, 2016 and 2018 Snapshot Reports, respectively. This data demonstrates likely changes to workforce composition, subject to potential inconsistencies in data reporting (and differences in participating organisations) identified above.
The data for the civil operations and trade roles appear to indicate a downward trend which is represented in more detail in Figure 5. Employees in Civil Operations roles have been declining over time with this role representing 26% of the workforce in 2012, 20% in 2014, 18% in 2016 and 16% in 2018. Those in Trades roles have also been declining with trades representing 19% of the workforce in 2010 and just 6% in 2018.
Anecdotal feedback suggests large scale workforce changes with at least one large employer. There is an increase in treatment operations roles, likely skewed by significant categorisation changes from one of the larger employers.
Of all trends apparent in the figure, a decline in trades roles in favour of outsourcing is supported by feedback from some of the largest employers, in particular greater contracting of civil, plumbing, and mechanical and electrical maintenance activities.
One larger employer described a large amount of organisational change across a range of roles. Another had assumed responsibility for a new function (waste management) resulting in significant increases to reported staff numbers.
Figure 4: Job Family Category Trends 2010 – 2018
Figure 5: Operations Staff Trends 2010 - 2018
20190709 - Finance and Infrastructure Standing Committee Meeting - Agenda
Central Highlands Regional Council 71 of 84
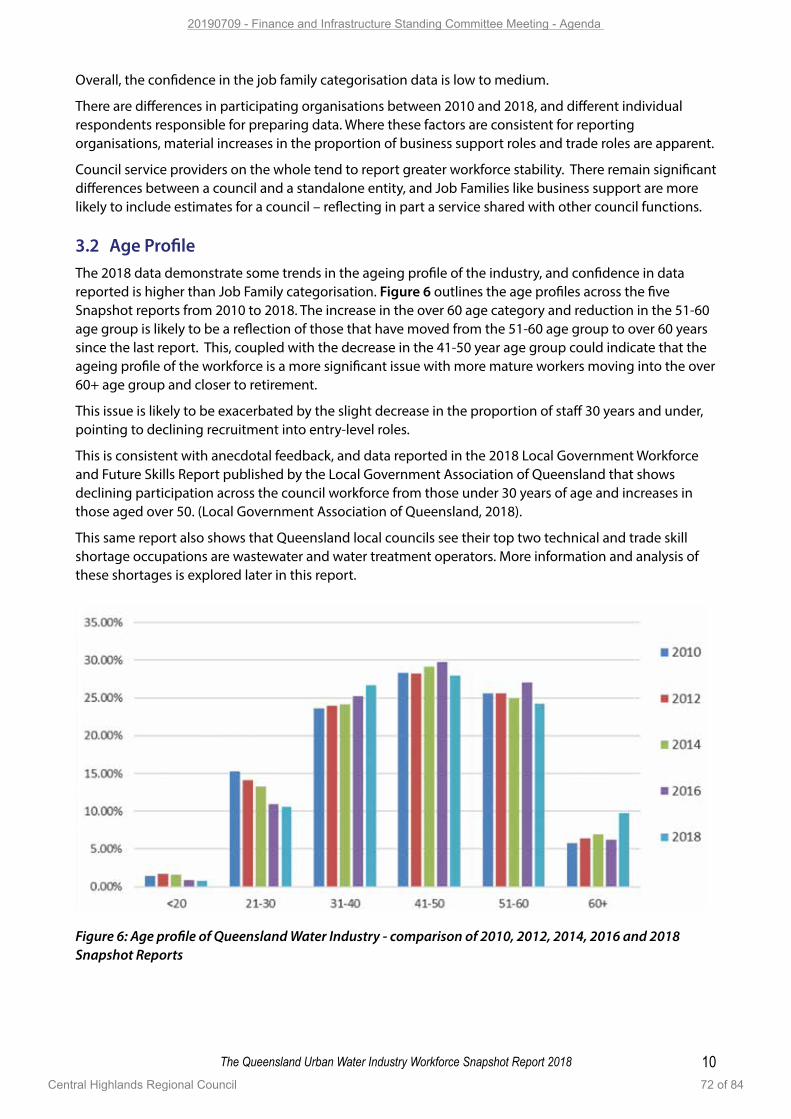
10The Queensland Urban Water Industry Workforce Snapshot Report 2018
Overall, the confidence in the job family categorisation data is low to medium.
There are differences in participating organisations between 2010 and 2018, and different individual respondents responsible for preparing data. Where these factors are consistent for reporting organisations, material increases in the proportion of business support roles and trade roles are apparent.
Council service providers on the whole tend to report greater workforce stability. There remain significant differences between a council and a standalone entity, and Job Families like business support are more likely to include estimates for a council – reflecting in part a service shared with other council functions.
3.2 Age ProfileThe 2018 data demonstrate some trends in the ageing profile of the industry, and confidence in data reported is higher than Job Family categorisation. Figure 6 outlines the age profiles across the five Snapshot reports from 2010 to 2018. The increase in the over 60 age category and reduction in the 51-60 age group is likely to be a reflection of those that have moved from the 51-60 age group to over 60 years since the last report. This, coupled with the decrease in the 41-50 year age group could indicate that the ageing profile of the workforce is a more significant issue with more mature workers moving into the over 60+ age group and closer to retirement.
This issue is likely to be exacerbated by the slight decrease in the proportion of staff 30 years and under, pointing to declining recruitment into entry-level roles.
This is consistent with anecdotal feedback, and data reported in the 2018 Local Government Workforce and Future Skills Report published by the Local Government Association of Queensland that shows declining participation across the council workforce from those under 30 years of age and increases in those aged over 50. (Local Government Association of Queensland, 2018).
This same report also shows that Queensland local councils see their top two technical and trade skill shortage occupations are wastewater and water treatment operators. More information and analysis of these shortages is explored later in this report.
Figure 6: Age profile of Queensland Water Industry - comparison of 2010, 2012, 2014, 2016 and 2018 Snapshot Reports
20190709 - Finance and Infrastructure Standing Committee Meeting - Agenda
Central Highlands Regional Council 72 of 84
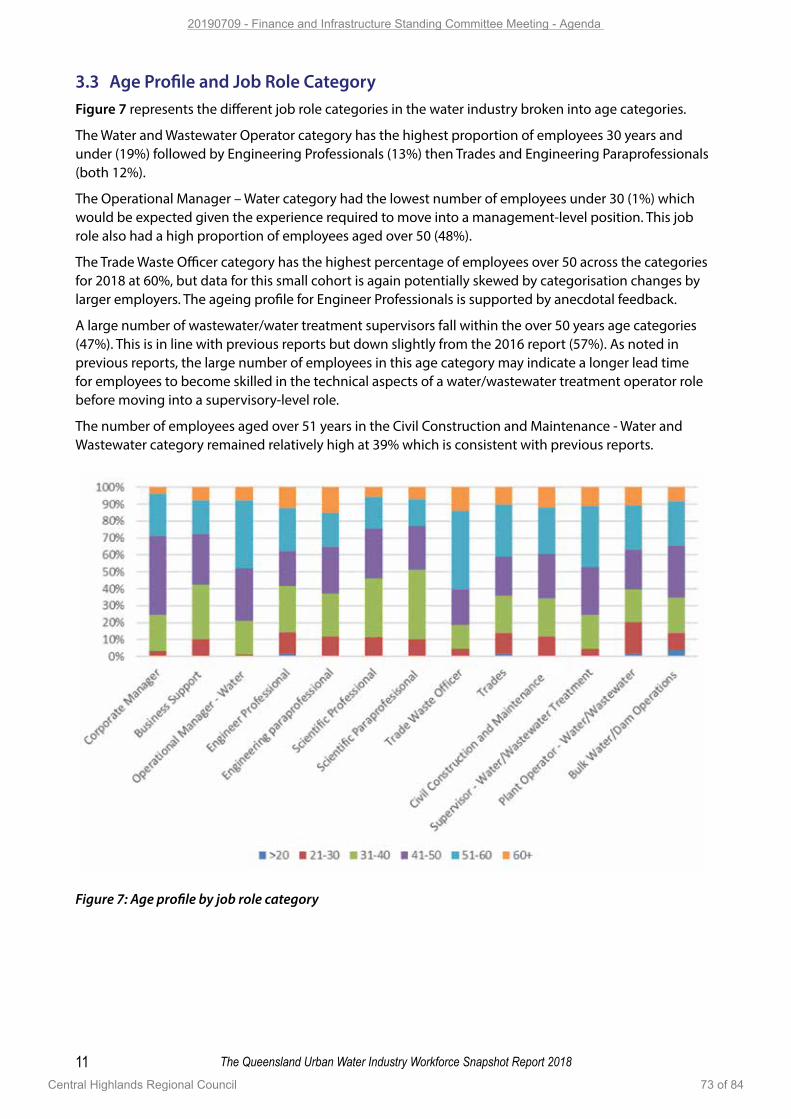
11 The Queensland Urban Water Industry Workforce Snapshot Report 2018
3.3 Age Profile and Job Role CategoryFigure 7 represents the different job role categories in the water industry broken into age categories.
The Water and Wastewater Operator category has the highest proportion of employees 30 years and under (19%) followed by Engineering Professionals (13%) then Trades and Engineering Paraprofessionals (both 12%).
The Operational Manager – Water category had the lowest number of employees under 30 (1%) which would be expected given the experience required to move into a management-level position. This job role also had a high proportion of employees aged over 50 (48%).
The Trade Waste Officer category has the highest percentage of employees over 50 across the categories for 2018 at 60%, but data for this small cohort is again potentially skewed by categorisation changes by larger employers. The ageing profile for Engineer Professionals is supported by anecdotal feedback.
A large number of wastewater/water treatment supervisors fall within the over 50 years age categories (47%). This is in line with previous reports but down slightly from the 2016 report (57%). As noted in previous reports, the large number of employees in this age category may indicate a longer lead time for employees to become skilled in the technical aspects of a water/wastewater treatment operator role before moving into a supervisory-level role.
The number of employees aged over 51 years in the Civil Construction and Maintenance - Water and Wastewater category remained relatively high at 39% which is consistent with previous reports.
Figure 7: Age profile by job role category
20190709 - Finance and Infrastructure Standing Committee Meeting - Agenda
Central Highlands Regional Council 73 of 84
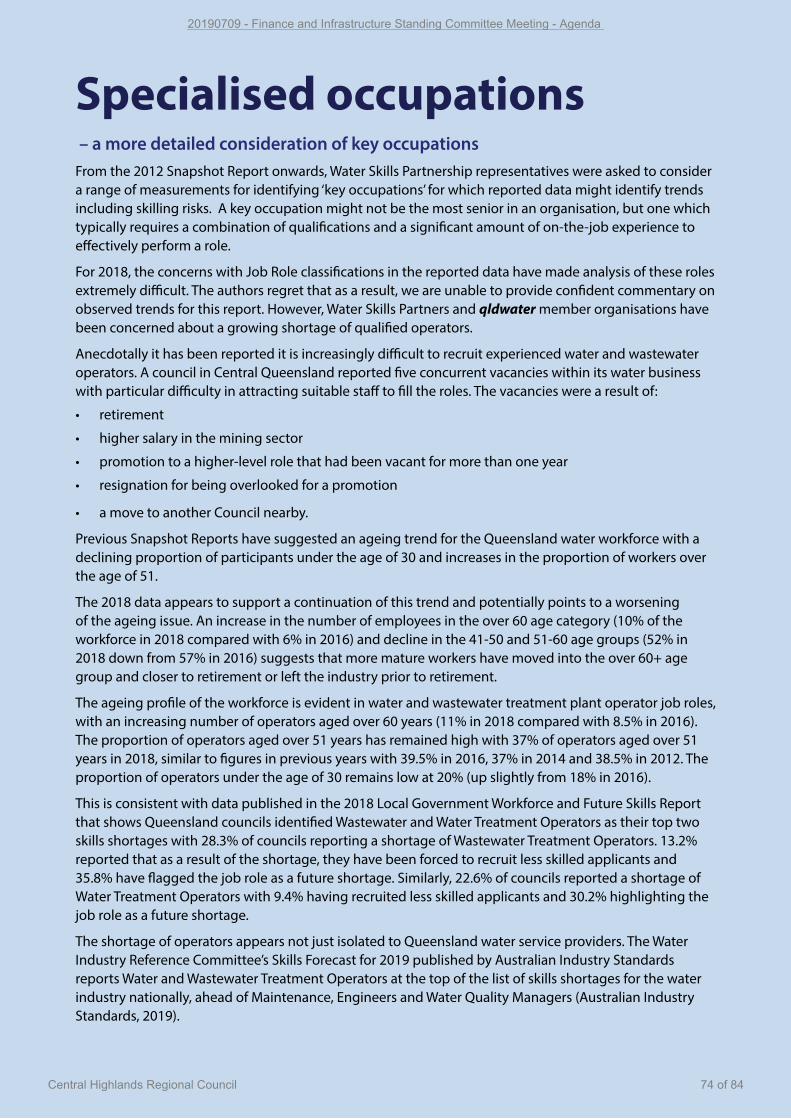
12The Queensland Urban Water Industry Workforce Snapshot Report 2018
Specialised occupations – a more detailed consideration of key occupationsFrom the 2012 Snapshot Report onwards, Water Skills Partnership representatives were asked to consider a range of measurements for identifying ‘key occupations’ for which reported data might identify trends including skilling risks. A key occupation might not be the most senior in an organisation, but one which typically requires a combination of qualifications and a significant amount of on-the-job experience to effectively perform a role.
For 2018, the concerns with Job Role classifications in the reported data have made analysis of these roles extremely difficult. The authors regret that as a result, we are unable to provide confident commentary on observed trends for this report. However, Water Skills Partners and qldwater member organisations have been concerned about a growing shortage of qualified operators.
Anecdotally it has been reported it is increasingly difficult to recruit experienced water and wastewater operators. A council in Central Queensland reported five concurrent vacancies within its water business with particular difficulty in attracting suitable staff to fill the roles. The vacancies were a result of:
• retirement
• higher salary in the mining sector
• promotion to a higher-level role that had been vacant for more than one year
• resignation for being overlooked for a promotion
• a move to another Council nearby.
Previous Snapshot Reports have suggested an ageing trend for the Queensland water workforce with a declining proportion of participants under the age of 30 and increases in the proportion of workers over the age of 51.
The 2018 data appears to support a continuation of this trend and potentially points to a worsening of the ageing issue. An increase in the number of employees in the over 60 age category (10% of the workforce in 2018 compared with 6% in 2016) and decline in the 41-50 and 51-60 age groups (52% in 2018 down from 57% in 2016) suggests that more mature workers have moved into the over 60+ age group and closer to retirement or left the industry prior to retirement.
The ageing profile of the workforce is evident in water and wastewater treatment plant operator job roles, with an increasing number of operators aged over 60 years (11% in 2018 compared with 8.5% in 2016). The proportion of operators aged over 51 years has remained high with 37% of operators aged over 51 years in 2018, similar to figures in previous years with 39.5% in 2016, 37% in 2014 and 38.5% in 2012. The proportion of operators under the age of 30 remains low at 20% (up slightly from 18% in 2016).
This is consistent with data published in the 2018 Local Government Workforce and Future Skills Report that shows Queensland councils identified Wastewater and Water Treatment Operators as their top two skills shortages with 28.3% of councils reporting a shortage of Wastewater Treatment Operators. 13.2% reported that as a result of the shortage, they have been forced to recruit less skilled applicants and 35.8% have flagged the job role as a future shortage. Similarly, 22.6% of councils reported a shortage of Water Treatment Operators with 9.4% having recruited less skilled applicants and 30.2% highlighting the job role as a future shortage.
The shortage of operators appears not just isolated to Queensland water service providers. The Water Industry Reference Committee’s Skills Forecast for 2019 published by Australian Industry Standards reports Water and Wastewater Treatment Operators at the top of the list of skills shortages for the water industry nationally, ahead of Maintenance, Engineers and Water Quality Managers (Australian Industry Standards, 2019).
20190709 - Finance and Infrastructure Standing Committee Meeting - Agenda
Central Highlands Regional Council 74 of 84
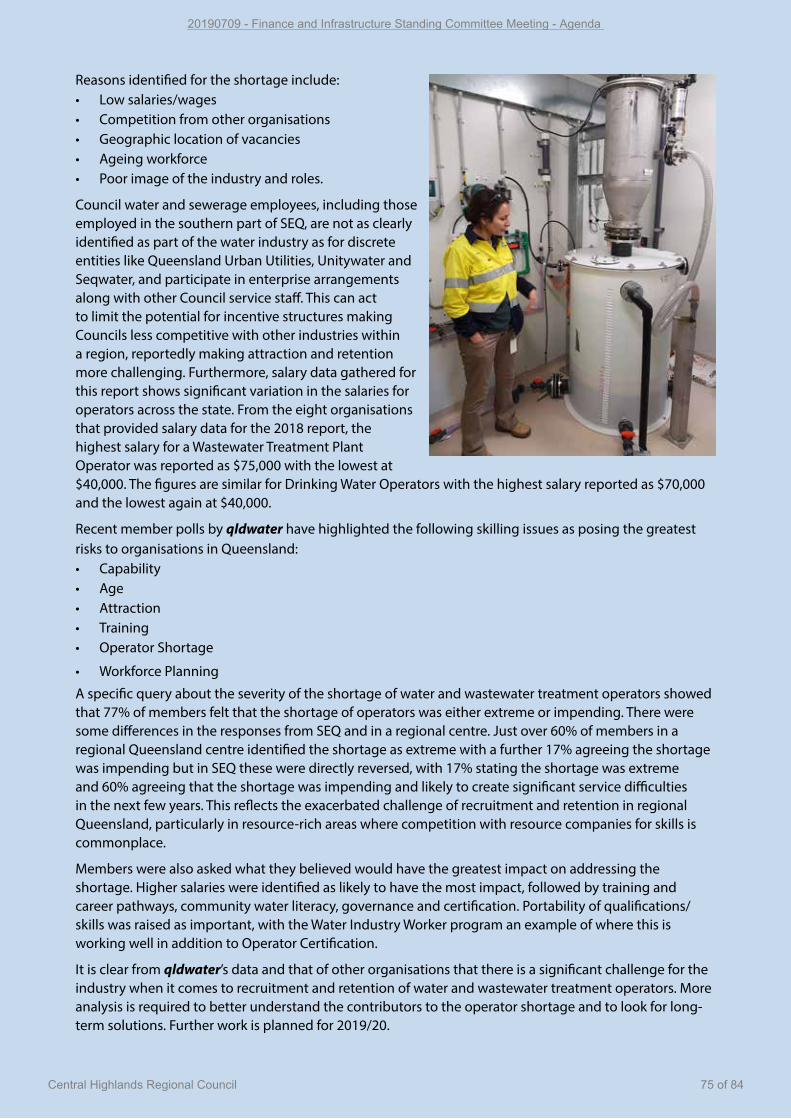
13 The Queensland Urban Water Industry Workforce Snapshot Report 2018
Reasons identified for the shortage include: • Low salaries/wages• Competition from other organisations• Geographic location of vacancies• Ageing workforce• Poor image of the industry and roles.
Council water and sewerage employees, including those employed in the southern part of SEQ, are not as clearly identified as part of the water industry as for discrete entities like Queensland Urban Utilities, Unitywater and Seqwater, and participate in enterprise arrangements along with other Council service staff. This can act to limit the potential for incentive structures making Councils less competitive with other industries within a region, reportedly making attraction and retention more challenging. Furthermore, salary data gathered for this report shows significant variation in the salaries for operators across the state. From the eight organisations that provided salary data for the 2018 report, the highest salary for a Wastewater Treatment Plant Operator was reported as $75,000 with the lowest at $40,000. The figures are similar for Drinking Water Operators with the highest salary reported as $70,000 and the lowest again at $40,000.
Recent member polls by qldwater have highlighted the following skilling issues as posing the greatest risks to organisations in Queensland: • Capability• Age• Attraction• Training• Operator Shortage
• Workforce Planning
A specific query about the severity of the shortage of water and wastewater treatment operators showed that 77% of members felt that the shortage of operators was either extreme or impending. There were some differences in the responses from SEQ and in a regional centre. Just over 60% of members in a regional Queensland centre identified the shortage as extreme with a further 17% agreeing the shortage was impending but in SEQ these were directly reversed, with 17% stating the shortage was extreme and 60% agreeing that the shortage was impending and likely to create significant service difficulties in the next few years. This reflects the exacerbated challenge of recruitment and retention in regional Queensland, particularly in resource-rich areas where competition with resource companies for skills is commonplace.
Members were also asked what they believed would have the greatest impact on addressing the shortage. Higher salaries were identified as likely to have the most impact, followed by training and career pathways, community water literacy, governance and certification. Portability of qualifications/skills was raised as important, with the Water Industry Worker program an example of where this is working well in addition to Operator Certification.
It is clear from qldwater’s data and that of other organisations that there is a significant challenge for the industry when it comes to recruitment and retention of water and wastewater treatment operators. More analysis is required to better understand the contributors to the operator shortage and to look for long-term solutions. Further work is planned for 2019/20.
20190709 - Finance and Infrastructure Standing Committee Meeting - Agenda
Central Highlands Regional Council 75 of 84
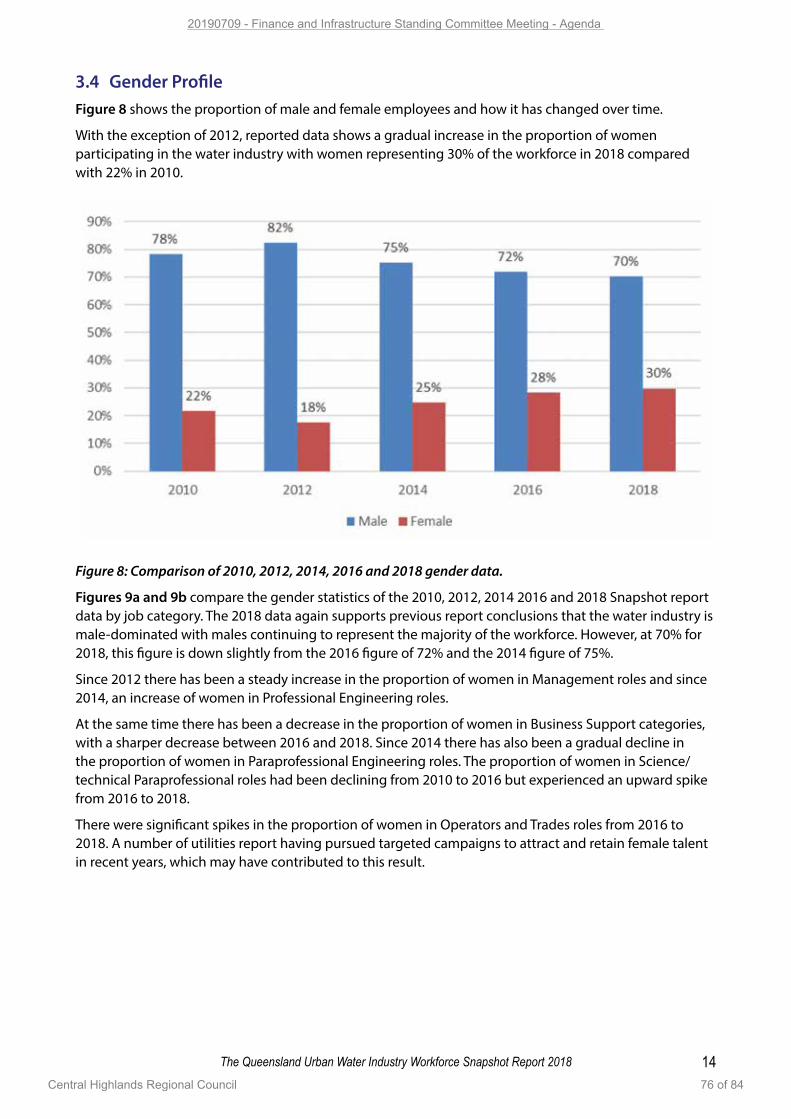
14The Queensland Urban Water Industry Workforce Snapshot Report 2018
3.4 Gender ProfileFigure 8 shows the proportion of male and female employees and how it has changed over time.
With the exception of 2012, reported data shows a gradual increase in the proportion of women participating in the water industry with women representing 30% of the workforce in 2018 compared with 22% in 2010.
Figure 8: Comparison of 2010, 2012, 2014, 2016 and 2018 gender data.
Figures 9a and 9b compare the gender statistics of the 2010, 2012, 2014 2016 and 2018 Snapshot report data by job category. The 2018 data again supports previous report conclusions that the water industry is male-dominated with males continuing to represent the majority of the workforce. However, at 70% for 2018, this figure is down slightly from the 2016 figure of 72% and the 2014 figure of 75%.
Since 2012 there has been a steady increase in the proportion of women in Management roles and since 2014, an increase of women in Professional Engineering roles.
At the same time there has been a decrease in the proportion of women in Business Support categories, with a sharper decrease between 2016 and 2018. Since 2014 there has also been a gradual decline in the proportion of women in Paraprofessional Engineering roles. The proportion of women in Science/technical Paraprofessional roles had been declining from 2010 to 2016 but experienced an upward spike from 2016 to 2018.
There were significant spikes in the proportion of women in Operators and Trades roles from 2016 to 2018. A number of utilities report having pursued targeted campaigns to attract and retain female talent in recent years, which may have contributed to this result.
20190709 - Finance and Infrastructure Standing Committee Meeting - Agenda
Central Highlands Regional Council 76 of 84
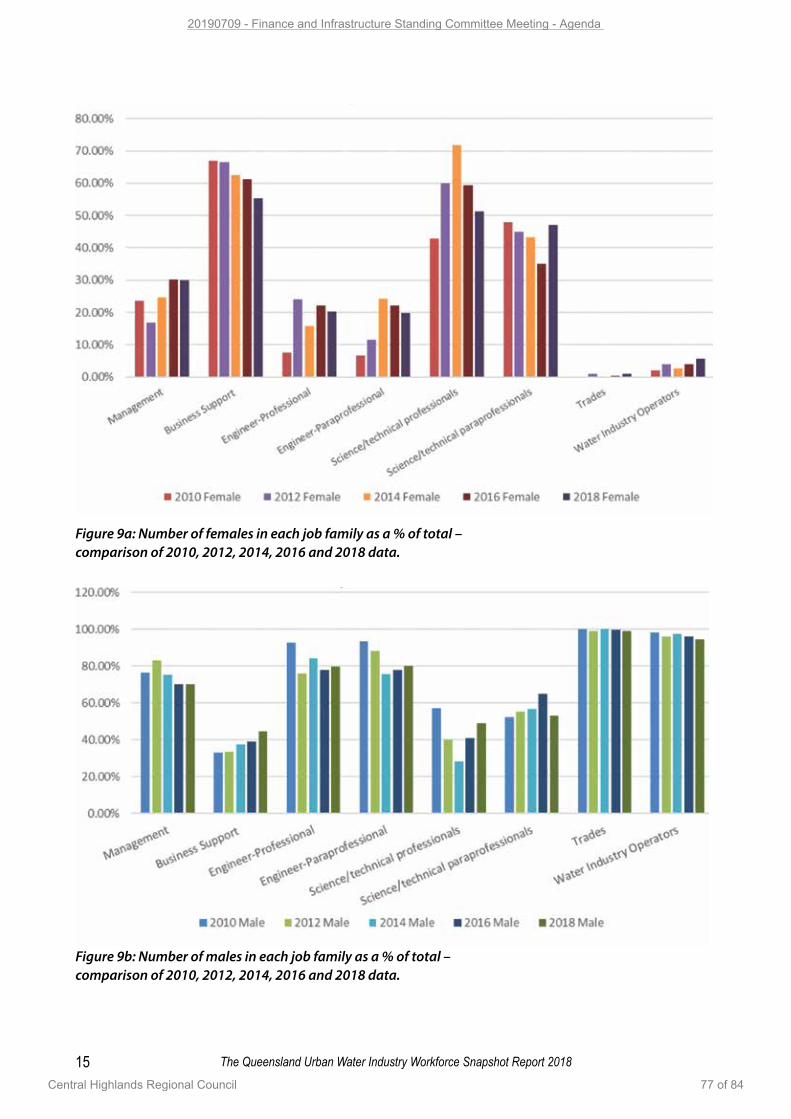
15 The Queensland Urban Water Industry Workforce Snapshot Report 2018
Figure 9a: Number of females in each job family as a % of total – comparison of 2010, 2012, 2014, 2016 and 2018 data.
Figure 9b: Number of males in each job family as a % of total – comparison of 2010, 2012, 2014, 2016 and 2018 data.
20190709 - Finance and Infrastructure Standing Committee Meeting - Agenda
Central Highlands Regional Council 77 of 84
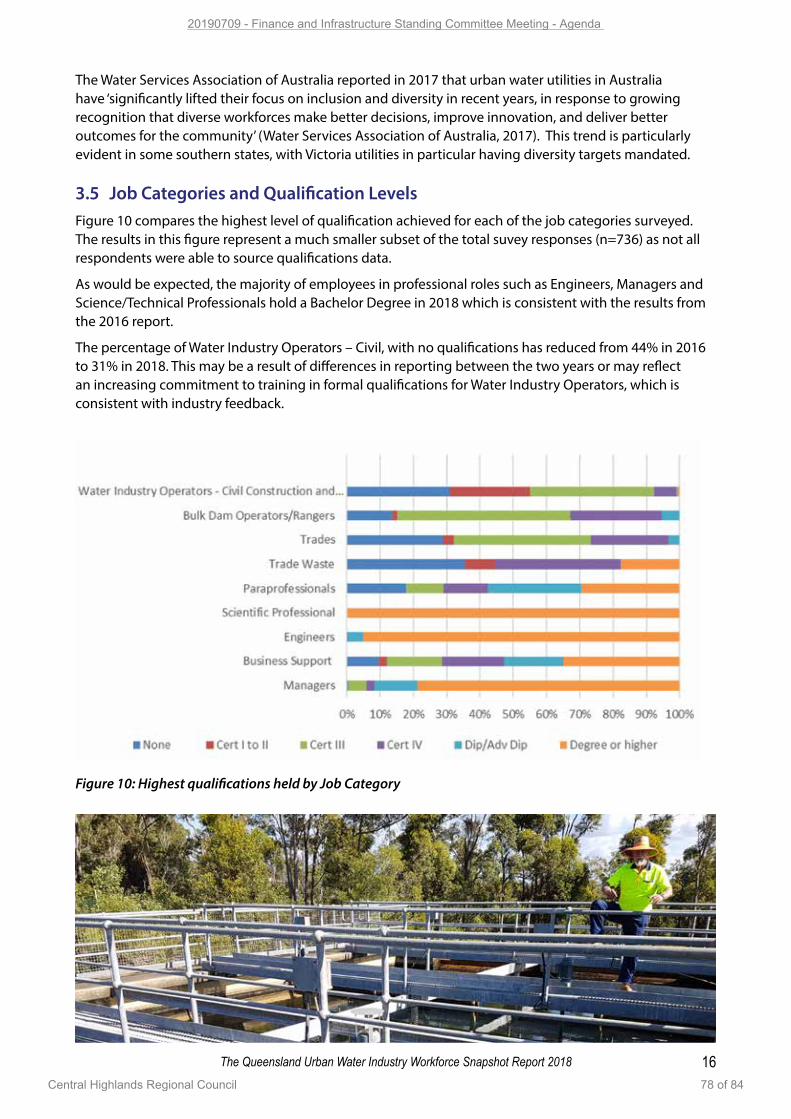
16The Queensland Urban Water Industry Workforce Snapshot Report 2018
The Water Services Association of Australia reported in 2017 that urban water utilities in Australia have ‘significantly lifted their focus on inclusion and diversity in recent years, in response to growing recognition that diverse workforces make better decisions, improve innovation, and deliver better outcomes for the community’ (Water Services Association of Australia, 2017). This trend is particularly evident in some southern states, with Victoria utilities in particular having diversity targets mandated.
3.5 Job Categories and Qualification LevelsFigure 10 compares the highest level of qualification achieved for each of the job categories surveyed. The results in this figure represent a much smaller subset of the total suvey responses (n=736) as not all respondents were able to source qualifications data.
As would be expected, the majority of employees in professional roles such as Engineers, Managers and Science/Technical Professionals hold a Bachelor Degree in 2018 which is consistent with the results from the 2016 report.
The percentage of Water Industry Operators – Civil, with no qualifications has reduced from 44% in 2016 to 31% in 2018. This may be a result of differences in reporting between the two years or may reflect an increasing commitment to training in formal qualifications for Water Industry Operators, which is consistent with industry feedback.
Figure 10: Highest qualifications held by Job Category
20190709 - Finance and Infrastructure Standing Committee Meeting - Agenda
Central Highlands Regional Council 78 of 84
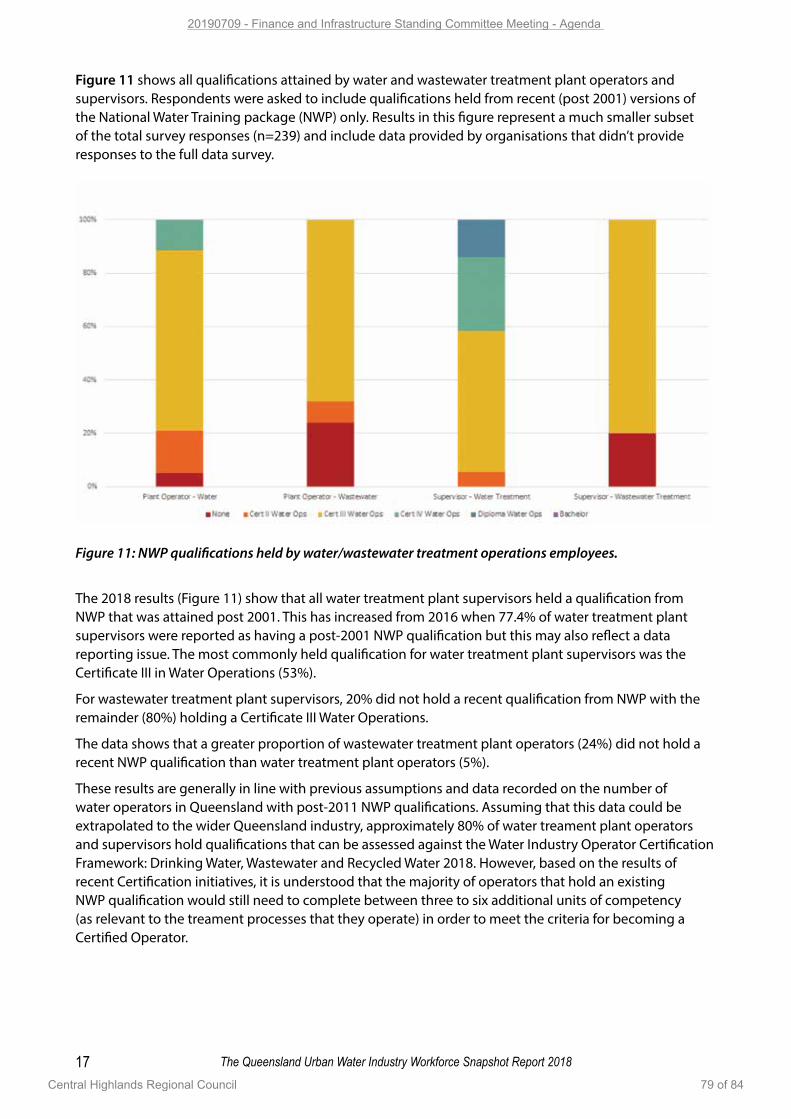
17 The Queensland Urban Water Industry Workforce Snapshot Report 2018
Figure 11 shows all qualifications attained by water and wastewater treatment plant operators and supervisors. Respondents were asked to include qualifications held from recent (post 2001) versions of the National Water Training package (NWP) only. Results in this figure represent a much smaller subset of the total survey responses (n=239) and include data provided by organisations that didn’t provide responses to the full data survey.
Figure 11: NWP qualifications held by water/wastewater treatment operations employees.
The 2018 results (Figure 11) show that all water treatment plant supervisors held a qualification from NWP that was attained post 2001. This has increased from 2016 when 77.4% of water treatment plant supervisors were reported as having a post-2001 NWP qualification but this may also reflect a data reporting issue. The most commonly held qualification for water treatment plant supervisors was the Certificate III in Water Operations (53%).
For wastewater treatment plant supervisors, 20% did not hold a recent qualification from NWP with the remainder (80%) holding a Certificate III Water Operations.
The data shows that a greater proportion of wastewater treatment plant operators (24%) did not hold a recent NWP qualification than water treatment plant operators (5%).
These results are generally in line with previous assumptions and data recorded on the number of water operators in Queensland with post-2011 NWP qualifications. Assuming that this data could be extrapolated to the wider Queensland industry, approximately 80% of water treament plant operators and supervisors hold qualifications that can be assessed against the Water Industry Operator Certification Framework: Drinking Water, Wastewater and Recycled Water 2018. However, based on the results of recent Certification initiatives, it is understood that the majority of operators that hold an existing NWP qualification would still need to complete between three to six additional units of competency (as relevant to the treament processes that they operate) in order to meet the criteria for becoming a Certified Operator.
20190709 - Finance and Infrastructure Standing Committee Meeting - Agenda
Central Highlands Regional Council 79 of 84
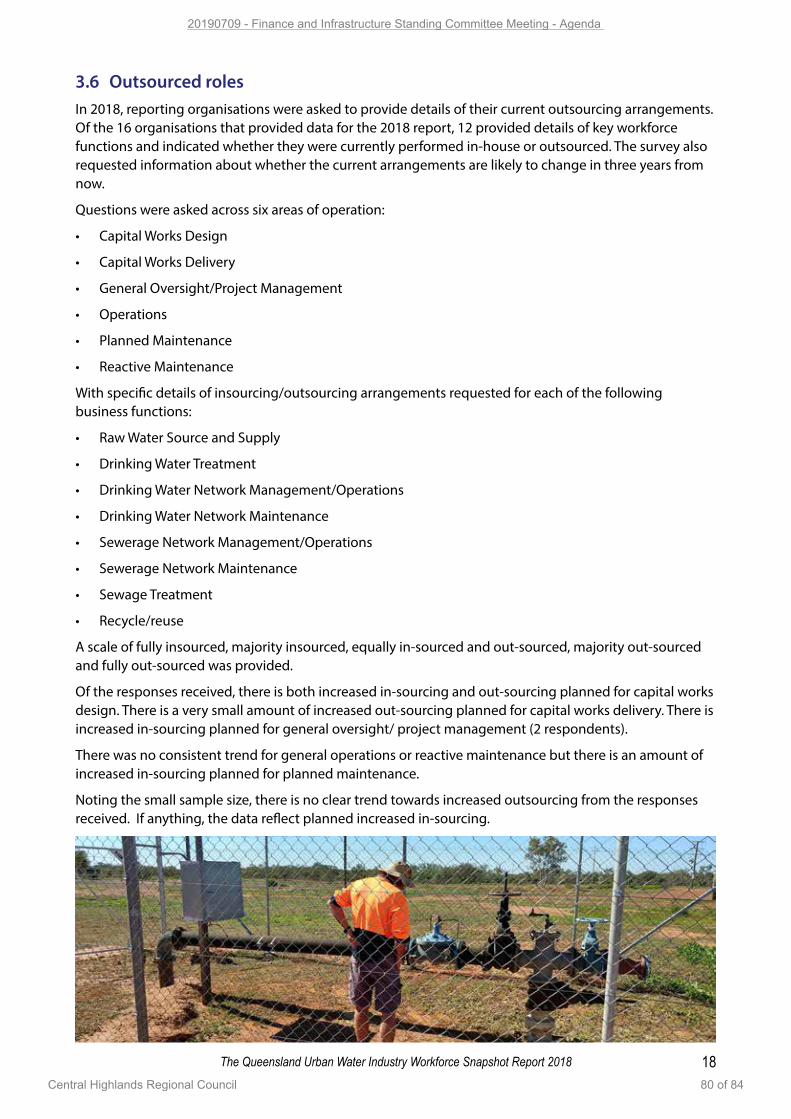
18The Queensland Urban Water Industry Workforce Snapshot Report 2018
3.6 Outsourced roles In 2018, reporting organisations were asked to provide details of their current outsourcing arrangements. Of the 16 organisations that provided data for the 2018 report, 12 provided details of key workforce functions and indicated whether they were currently performed in-house or outsourced. The survey also requested information about whether the current arrangements are likely to change in three years from now.
Questions were asked across six areas of operation:
• Capital Works Design
• Capital Works Delivery
• General Oversight/Project Management
• Operations
• Planned Maintenance
• Reactive Maintenance
With specific details of insourcing/outsourcing arrangements requested for each of the following business functions:
• Raw Water Source and Supply
• Drinking Water Treatment
• Drinking Water Network Management/Operations
• Drinking Water Network Maintenance
• Sewerage Network Management/Operations
• Sewerage Network Maintenance
• Sewage Treatment
• Recycle/reuse
A scale of fully insourced, majority insourced, equally in-sourced and out-sourced, majority out-sourced and fully out-sourced was provided.
Of the responses received, there is both increased in-sourcing and out-sourcing planned for capital works design. There is a very small amount of increased out-sourcing planned for capital works delivery. There is increased in-sourcing planned for general oversight/ project management (2 respondents).
There was no consistent trend for general operations or reactive maintenance but there is an amount of increased in-sourcing planned for planned maintenance.
Noting the small sample size, there is no clear trend towards increased outsourcing from the responses received. If anything, the data reflect planned increased in-sourcing.
20190709 - Finance and Infrastructure Standing Committee Meeting - Agenda
Central Highlands Regional Council 80 of 84
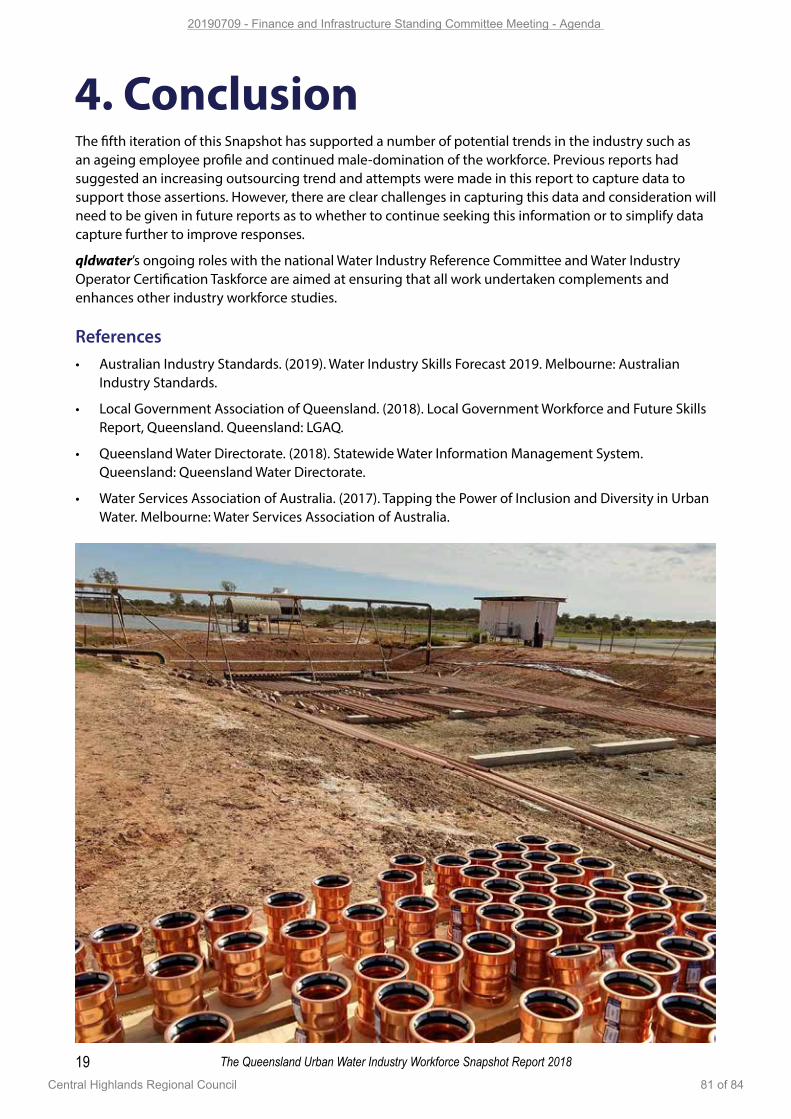
19 The Queensland Urban Water Industry Workforce Snapshot Report 2018
The fifth iteration of this Snapshot has supported a number of potential trends in the industry such as an ageing employee profile and continued male-domination of the workforce. Previous reports had suggested an increasing outsourcing trend and attempts were made in this report to capture data to support those assertions. However, there are clear challenges in capturing this data and consideration will need to be given in future reports as to whether to continue seeking this information or to simplify data capture further to improve responses.
qldwater’s ongoing roles with the national Water Industry Reference Committee and Water Industry Operator Certification Taskforce are aimed at ensuring that all work undertaken complements and enhances other industry workforce studies.
References • Australian Industry Standards. (2019). Water Industry Skills Forecast 2019. Melbourne: Australian
Industry Standards.
• Local Government Association of Queensland. (2018). Local Government Workforce and Future Skills Report, Queensland. Queensland: LGAQ.
• Queensland Water Directorate. (2018). Statewide Water Information Management System. Queensland: Queensland Water Directorate.
• Water Services Association of Australia. (2017). Tapping the Power of Inclusion and Diversity in Urban Water. Melbourne: Water Services Association of Australia.
4. Conclusion
20190709 - Finance and Infrastructure Standing Committee Meeting - Agenda
Central Highlands Regional Council 81 of 84
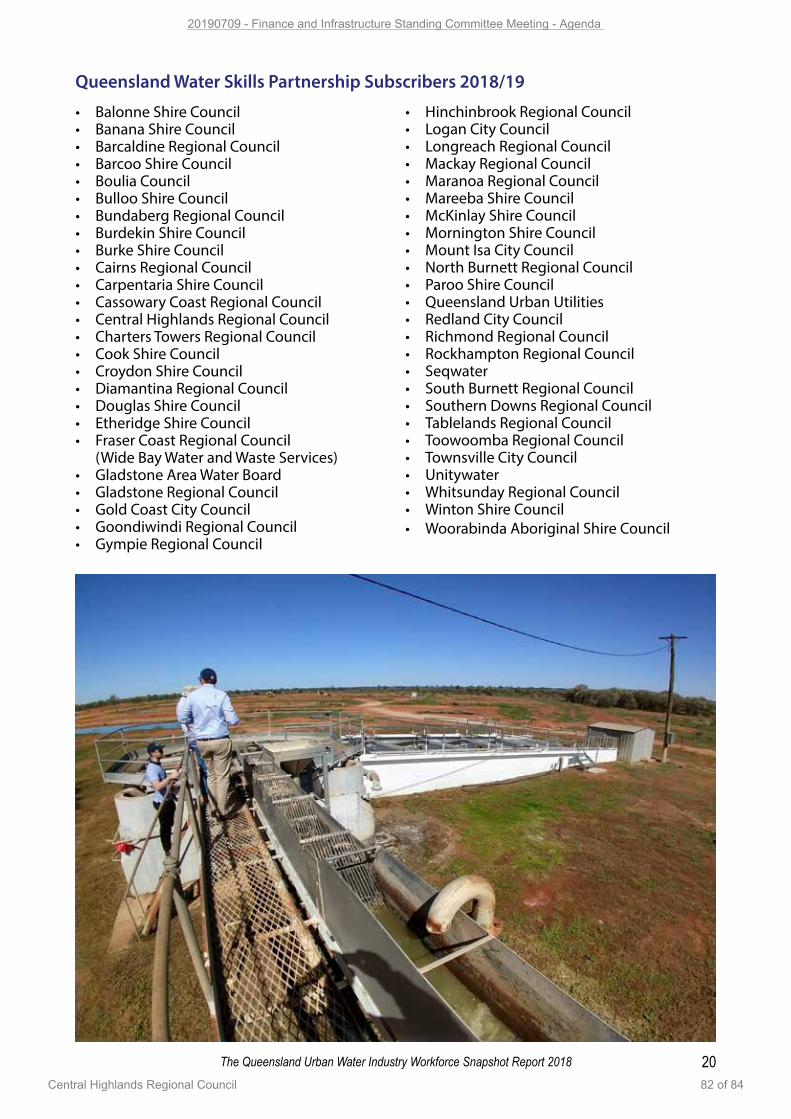
20The Queensland Urban Water Industry Workforce Snapshot Report 2018
• BalonneShireCouncil• BananaShireCouncil• BarcaldineRegionalCouncil• BarcooShireCouncil• BouliaCouncil• BullooShireCouncil• BundabergRegionalCouncil• BurdekinShireCouncil• BurkeShireCouncil• CairnsRegionalCouncil• CarpentariaShireCouncil• CassowaryCoastRegionalCouncil• CentralHighlandsRegionalCouncil• ChartersTowersRegionalCouncil• CookShireCouncil• CroydonShireCouncil• DiamantinaRegionalCouncil• DouglasShireCouncil• EtheridgeShireCouncil• FraserCoastRegionalCouncil (Wide Bay Water and Waste Services)• GladstoneAreaWaterBoard• GladstoneRegionalCouncil• GoldCoastCityCouncil• GoondiwindiRegionalCouncil• GympieRegionalCouncil
• HinchinbrookRegionalCouncil• LoganCityCouncil• LongreachRegionalCouncil• MackayRegionalCouncil• MaranoaRegionalCouncil• MareebaShireCouncil• McKinlayShireCouncil• MorningtonShireCouncil• MountIsaCityCouncil• NorthBurnettRegionalCouncil• ParooShireCouncil• QueenslandUrbanUtilities• RedlandCityCouncil• RichmondRegionalCouncil• RockhamptonRegionalCouncil• Seqwater• SouthBurnettRegionalCouncil• SouthernDownsRegionalCouncil• TablelandsRegionalCouncil• ToowoombaRegionalCouncil• TownsvilleCityCouncil• Unitywater• WhitsundayRegionalCouncil• WintonShireCouncil• WoorabindaAboriginalShireCouncil
Queensland Water Skills Partnership Subscribers 2018/19
20190709 - Finance and Infrastructure Standing Committee Meeting - Agenda
Central Highlands Regional Council 82 of 84
21 The Queensland Urban Water Industry Workforce Snapshot Report 2018
The Queensland Water Directorate (qldwater) is the central advisory and advocacy body within Queensland’s urban water industry and represents members from Local Government and other water service providers across Queensland.
The Directorate actively promotes collaboration and development across the industry. One major area of focus for qldwater has been to help identify and understand as well as guide the development of industry-wide strategies to aid the industry’s significant skill development, attraction and retention challenges across the state.
qldwater will continue to work with industry to further develop its workforce and improve and retain valuable skills unique to the industry.
Further information about this and other programs is available at www.qldwater.com.au.
About qldwater
43-49 Sandgate Road Albion, QLD, 4010
PO Box 2100 Fortitude Valley, BC, 4006
phone: 07 3632 6853
email: [email protected]
www.qldwater.com.au
Special thanks to each of the organisations who contributed data to this study
including the time taken in following up queries in interpreting reported data.
20190709 - Finance and Infrastructure Standing Committee Meeting - Agenda
Central Highlands Regional Council 83 of 84

20190709 - Finance and Infrastructure Standing Committee Meeting - Agenda
Central Highlands Regional Council 84 of 84
10 GENERAL BUSINESS
11 CLOSURE OF MEETING