Embed Size (px)
Citation preview
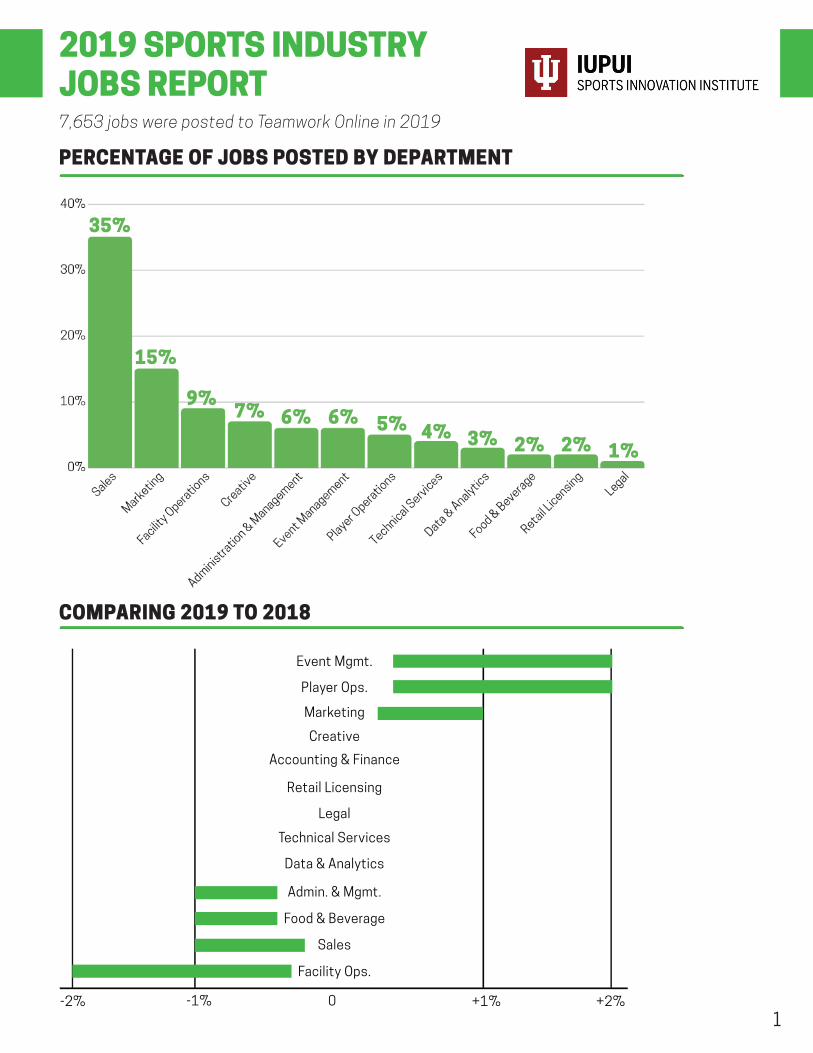
Sales
Marketing
Facility Ops.
Creative
Admin. & Mgmt.
Accounting & Finance
Technical Services
Data & Analytics
Food & Beverage
Retail Licensing
Legal
-2% -1% 0 +1% +2%
1
2019 SPORTS INDUSTRYJOBS REPORT
COMPARING 2019 TO 2018
PERCENTAGE OF JOBS POSTED BY DEPARTMENT
35%
15%
9%7% 6% 6% 5% 4% 3% 2% 2% 1%
7,653 jobs were posted to Teamwork Online in 2019
Event Mgmt.
Player Ops.
2
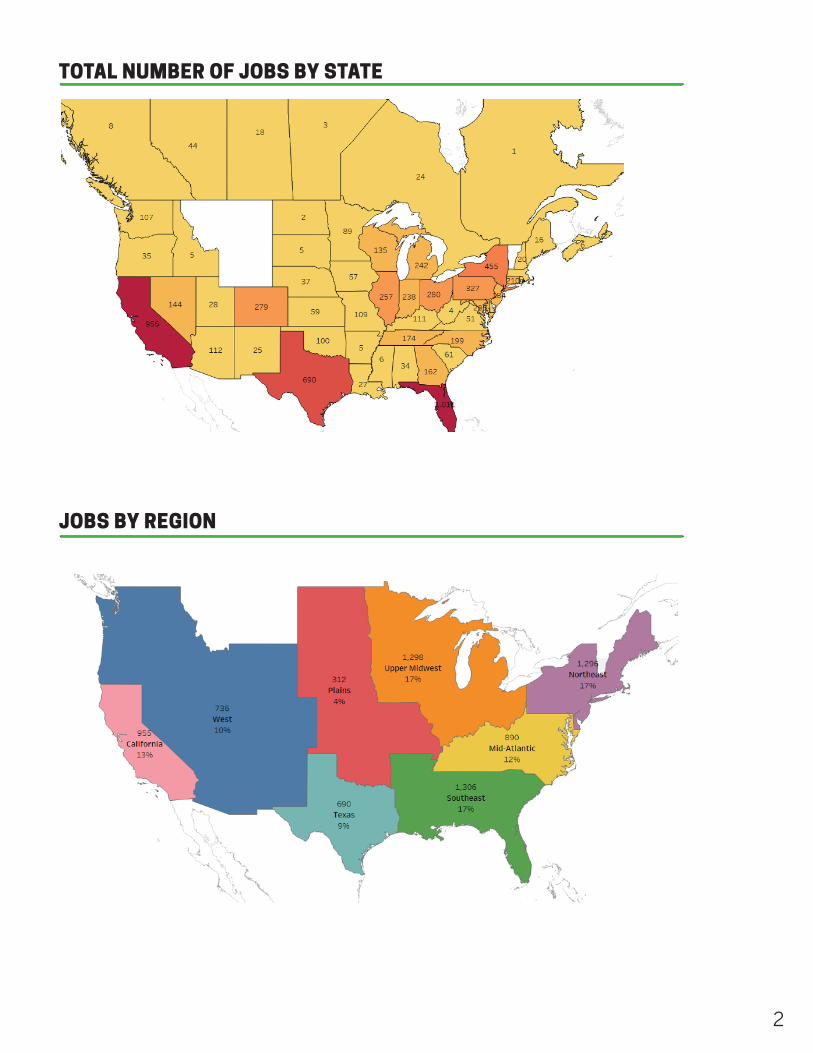
TOTAL NUMBER OF JOBS BY STATE
JOBS BY REGION
3
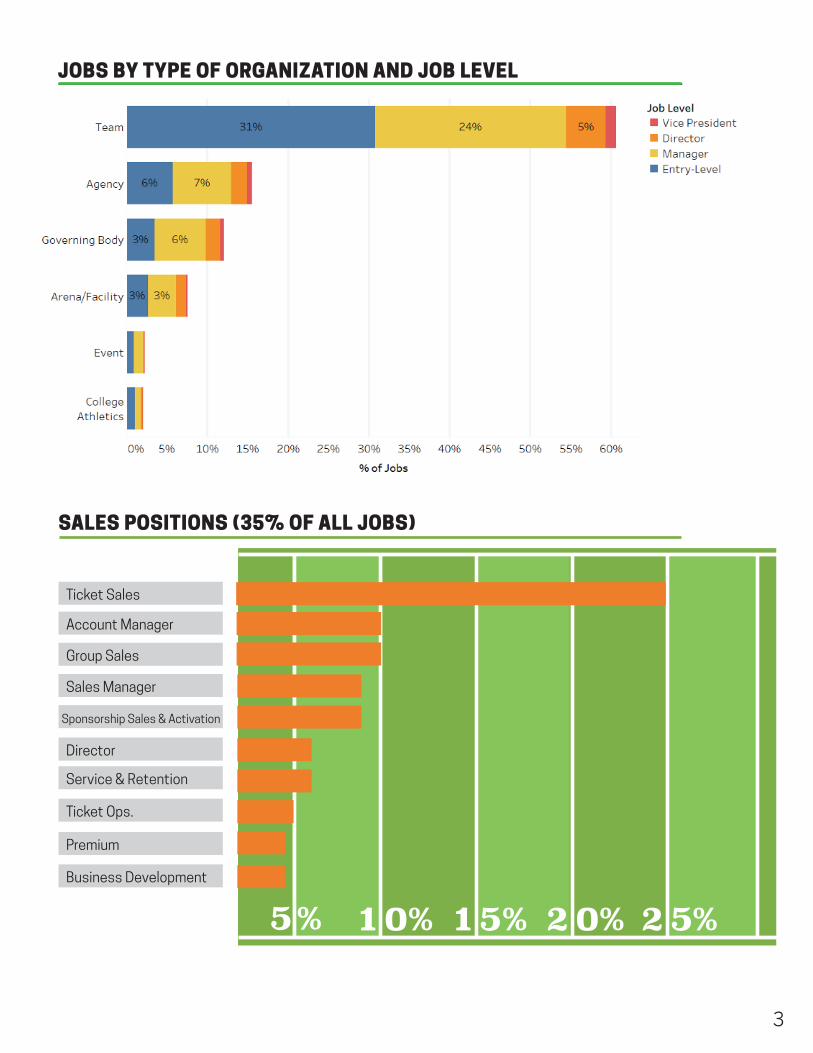
SALES POSITIONS (35% OF ALL JOBS)
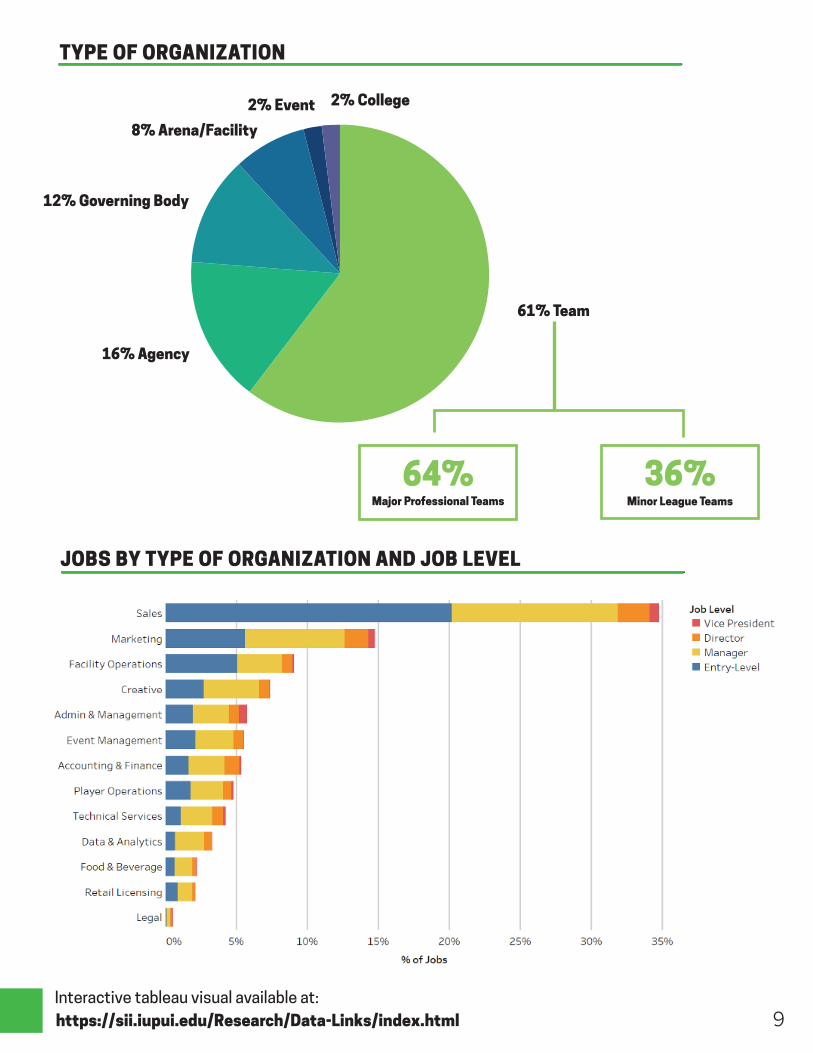
JOBS BY TYPE OF ORGANIZATION AND JOB LEVEL
1 0%5% 1 5% 2 0% 2 5%
Ticket Sales
Account Manager
Group Sales
Sales Manager
Sponsorship Sales & Activation
Director
Service & Retention
Ticket Ops.
Premium
Business Development
4
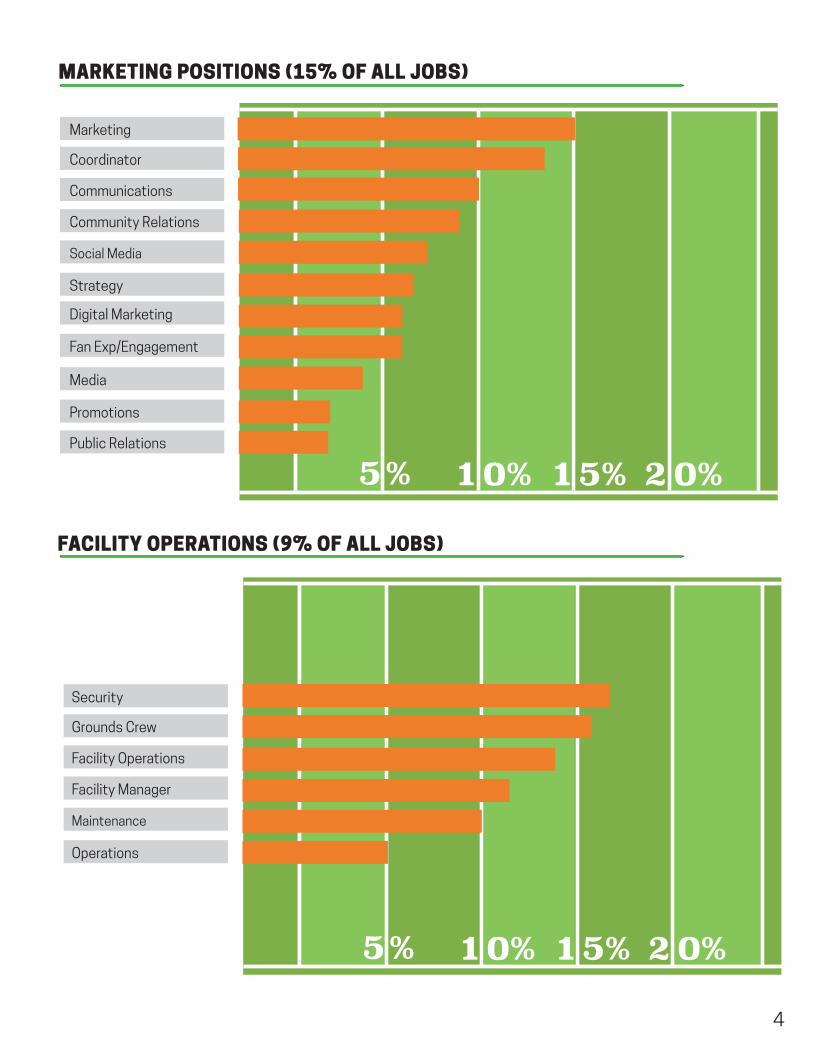
MARKETING POSITIONS (15% OF ALL JOBS)
FACILITY OPERATIONS (9% OF ALL JOBS)
1 0%5% 1 5% 2 0%
Marketing
Coordinator
Communications
Community Relations
Social Media
Strategy
Digital Marketing
Fan Exp/Engagement
Media
Promotions
Public Relations
1 0%5% 1 5% 2 0%
Security
Grounds Crew
Facility Operations
Facility Manager
Maintenance
Operations
5
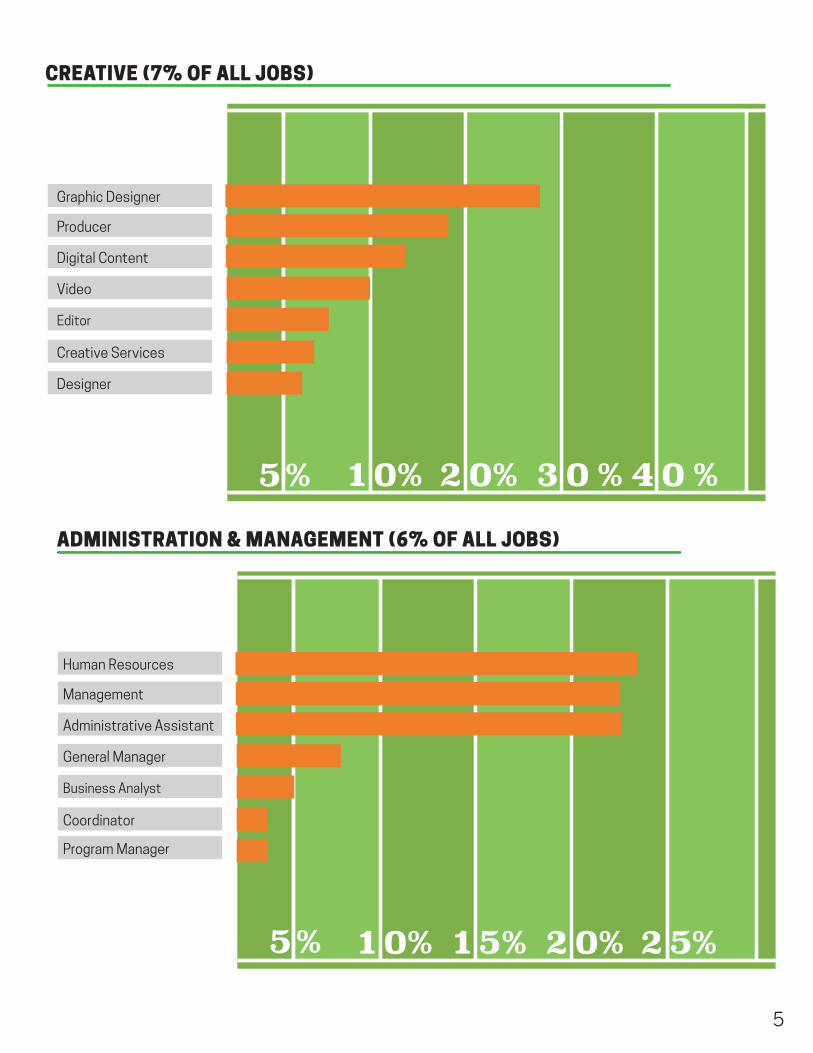
CREATIVE (7% OF ALL JOBS)
ADMINISTRATION & MANAGEMENT (6% OF ALL JOBS)
1 0%5% 1 5% 2 0% 2 5%
Human Resources
Management
Administrative Assistant
General Manager
Business Analyst
Coordinator
Program Manager
1 0% 2 0% 3 0 % 4 0 %
Graphic Designer
Producer
Digital Content
Video
Editor
Creative Services
Designer
5%
6
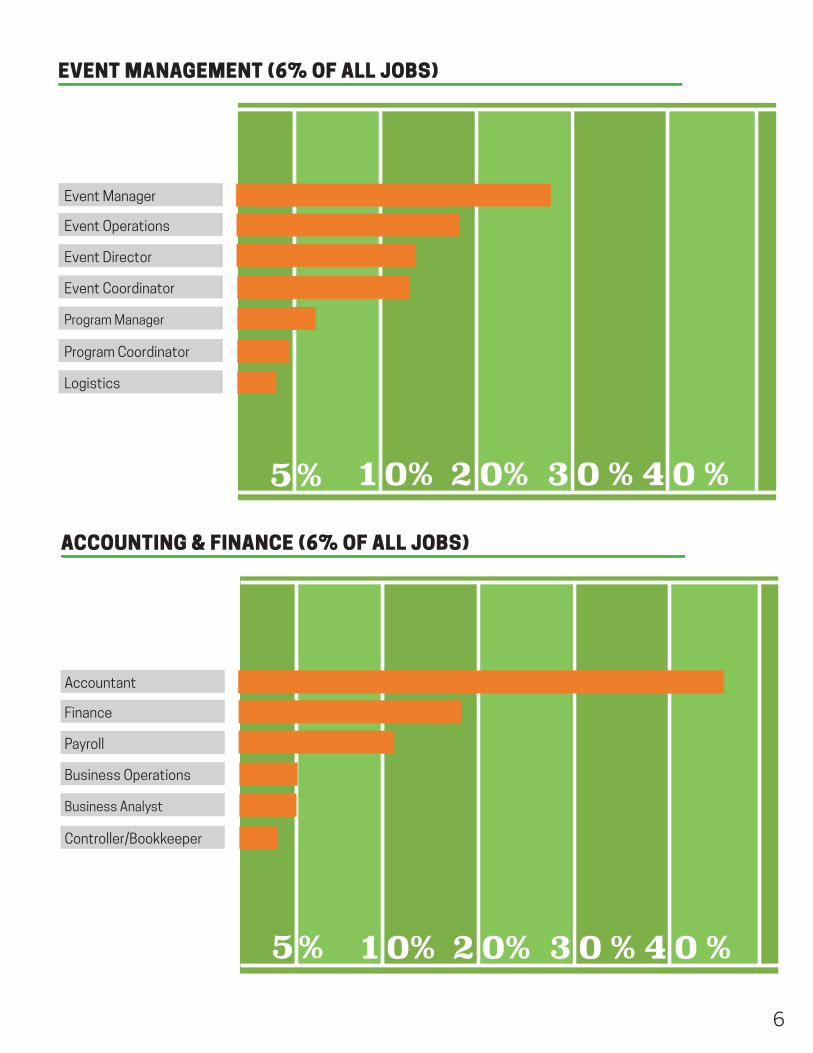
EVENT MANAGEMENT (6% OF ALL JOBS)
ACCOUNTING & FINANCE (6% OF ALL JOBS)
1 0% 2 0% 3 0 % 4 0 %
Accountant
Finance
Payroll
Business Operations
Business Analyst
Controller/Bookkeeper
1 0% 2 0% 3 0 % 4 0 %
Event Manager
Event Operations
Event Director
Event Coordinator
Program Manager
Program Coordinator
Logistics
5%
5%
7
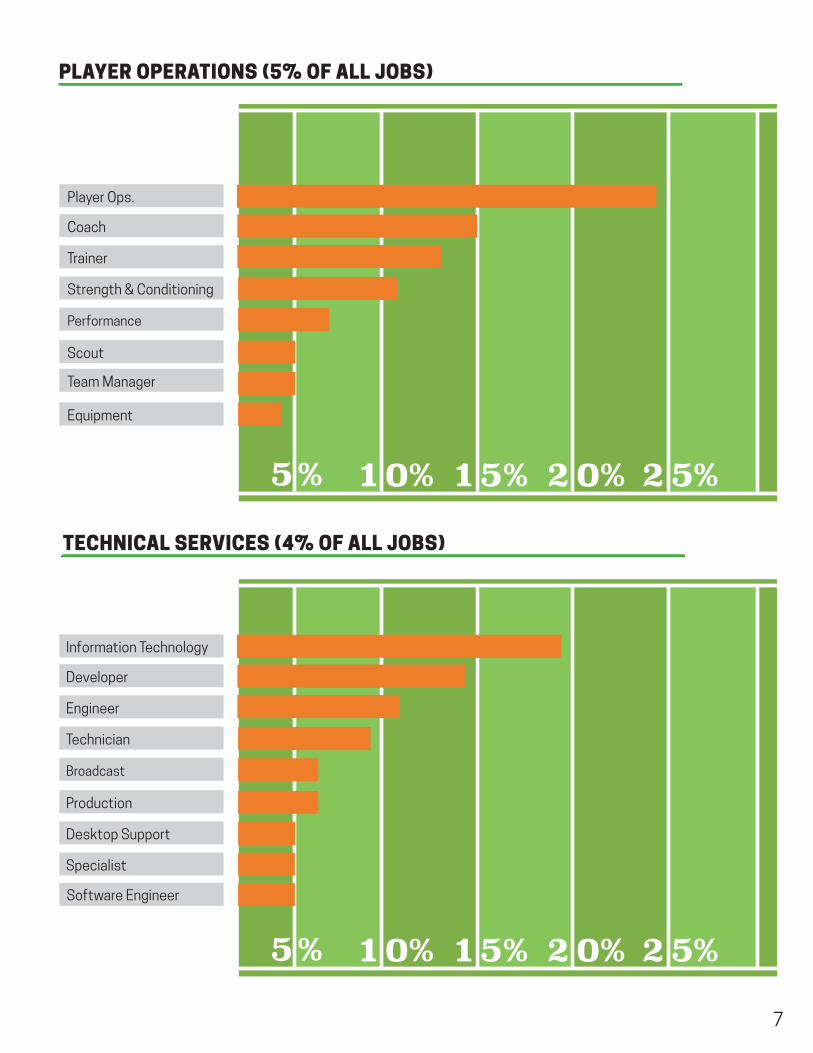
PLAYER OPERATIONS (5% OF ALL JOBS)
TECHNICAL SERVICES (4% OF ALL JOBS)
1 0%5% 1 5% 2 0% 2 5%
Player Ops.
Coach
Trainer
Strength & Conditioning
Performance
Scout
Team Manager
Equipment
1 0%5% 1 5% 2 0% 2 5%
Information Technology
Developer
Engineer
Technician
Broadcast
Production
Desktop Support
Specialist
Software Engineer
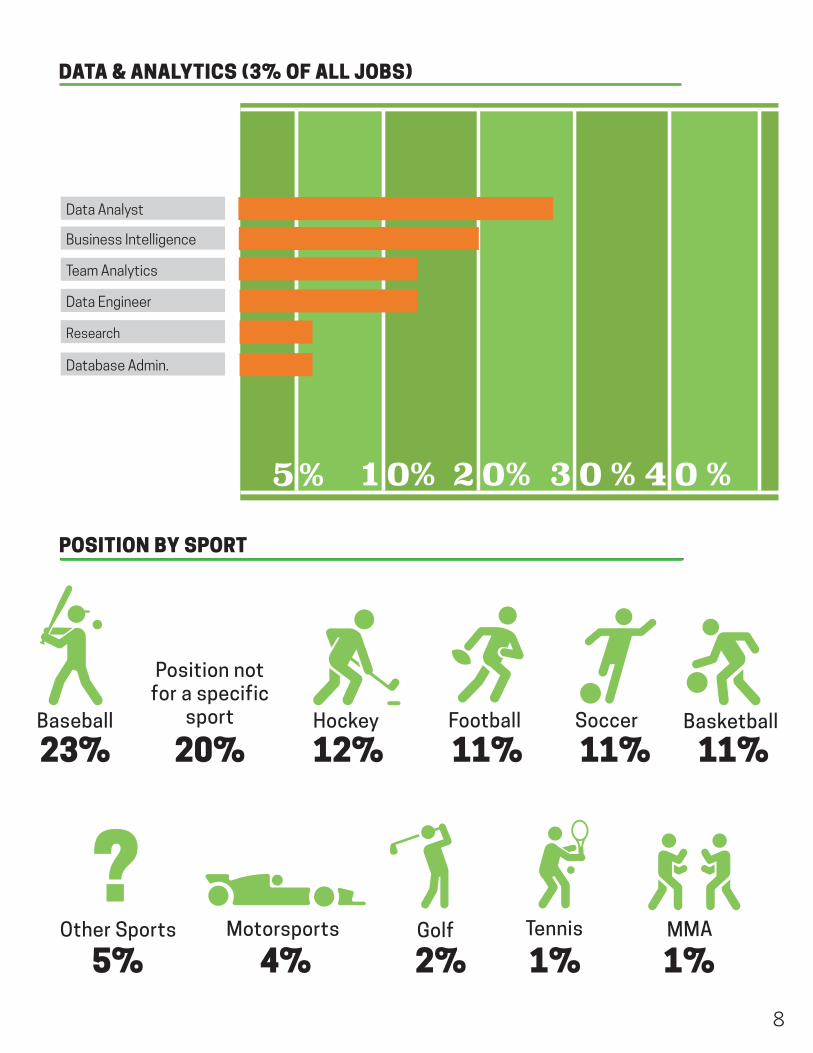
DATA & ANALYTICS (3% OF ALL JOBS)
8
POSITION BY SPORT
1 0% 2 0% 3 0 % 4 0 %
Data Analyst
Business Intelligence
Team Analytics
Data Engineer
Research
Database Admin.
5%
Tennis
HockeyBaseball
Position notfor a specific
sport
Other Sports
Football Soccer
Golf
Basketball
Motorsports MMA
23%
5% 4% 2% 1% 1%
20% 12% 11% 11% 11%
?
9
61% Team
16% Agency
12% Governing Body
8% Arena/Facility
2% Event 2% College
TYPE OF ORGANIZATION
Major Professional Teams
64%Minor League Teams
36%
JOBS BY TYPE OF ORGANIZATION AND JOB LEVEL
https://sii.iupui.edu/Research/Data-Links/index.htmlInteractive tableau visual available at:


![Social Media 4 Business Promotions [Compatibility Mode]](https://img.pdfslide.us/doc/110x75/54bb78cc4a7959c4418b4587/social-media-4-business-promotions-compatibility-mode.jpg)