Embed Size (px)
Citation preview
1
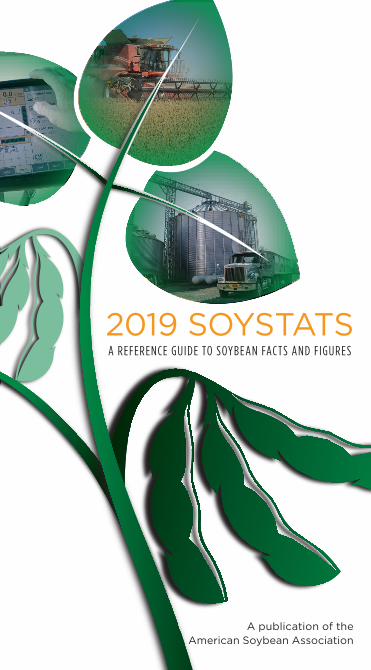
A publication of the American Soybean Association
A REFERENCE GUIDE TO SOY BE AN FAC T S AND F IGURE S
®
2019 SOYSTATS
A publication of the American Soybean Association
Welcome to the 2019 edition of SoyStats®, your comprehensive resource for statistical information about the U.S. soybean industry and its relationship to global oilseed production.
Soybean Highlights From 2018: � U.S. soybean farmers planted 89.2 million acres.
� Average yield in the U.S. was 51.6 bushels per acre.
� U.S. soybean production was 4.54 billion bushels.
� Total value of the U.S. soybean crop was $39.13 billion.
� The U.S. exported 1.87 billion bushels of soybeans, or 41 percent of total production.
� The U.S. was first in world soybean production with 4.54 billion bushels, followed by Brazil at 4.29 billion bushels.
� Soybeans represented 61 percent of the world’s oilseed production.
Soybean Facts: � A bushel of soybeans weighs 60 lbs. (27.22 kg) and produces about 11 pounds of oil and 48 pounds of protein-rich meal.
� The soybean plant is a legume related to peas, clover and alfalfa.
� Each soybean plant generally produces 60 to 80 pods, each holding three pea-sized beans.
GET SOYSTATS® ON THE WEB AT SOYSTATS.COM
Information in this publication is compiled and prepared by the American Soybean Association from U.S. Department of Agriculture data and various other sources. “SoyStats” and “Soy Stats” are registered trademarks of the American Soybean Association. All rights reserved. ©2019 American Soybean Association
2019 SOYSTATS
2
3
TABLE OF CONTENTS
Soybean Highlights and Facts ................................................... 2
Table of Contents ...................................................................... 3
Composition of a Soybean ......................................................... 4
Source Guide ............................................................................ 5
U.S. Crop Area Planted ............................................................. 5
U.S. Soybean Area Planted ....................................................... 6
U.S. Soybean Area Planted by State .......................................... 7
U.S. Soybean Yield ................................................................... 8
U.S. Soybean Yield by State ...................................................... 9
U.S. Soybean Production .........................................................10
U.S. Soybean Production by State ............................................11
Soybean Price Paid to Farmers ............................................... 12
Soybean Price Paid to Farmers by State .................................. 13
U.S. Soybean Crop Value .........................................................14
U.S. Soybean Crop Value by State ........................................... 15
U.S. Soybean Production Costs & Returns ......................... 16
U.S. Soybean Crush .................................................................17
U.S. Soybean Ending Stocks ................................................... 18
U.S. Biodiesel Production ....................................................... 19
Adoption of Biotech-Enhanced Seedstock ............................... 20
U.S. Soybean Exports ............................................................. 22
U.S. Soybean & Soy Product Exports ...................................... 23
World Oilseed Production ........................................................ 24
World Soybean Production ...................................................... 25
Brazil & Argentina Soybean Production ................................... 26
World Soybean Exports ........................................................... 27
U.S. Soybean Meal Production ................................................ 28
World Protein Meal Consumption ............................................ 29
U.S. Soybean Meal Use by Livestock ....................................... 30
World Soybean Meal Exports................................................... 31
U.S. Soybean Oil Production ................................................... 32
World Vegetable Oil Consumption ............................................ 33
U.S. Vegetable Oil Consumption .............................................. 34
About the American Soybean Association ............................... 35
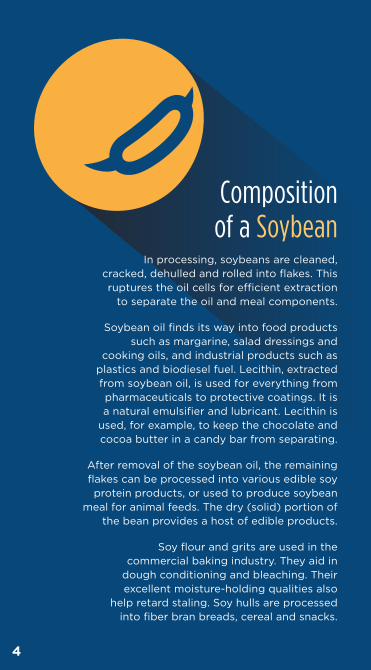
Composition of a Soybean
In processing, soybeans are cleaned, cracked, dehulled and rolled into flakes. This ruptures the oil cells for efficient extraction
to separate the oil and meal components.
Soybean oil finds its way into food products such as margarine, salad dressings and
cooking oils, and industrial products such as plastics and biodiesel fuel. Lecithin, extracted from soybean oil, is used for everything from pharmaceuticals to protective coatings. It is a natural emulsifier and lubricant. Lecithin is
used, for example, to keep the chocolate and cocoa butter in a candy bar from separating.
After removal of the soybean oil, the remaining flakes can be processed into various edible soy protein products, or used to produce soybean
meal for animal feeds. The dry (solid) portion of the bean provides a host of edible products.
Soy flour and grits are used in the commercial baking industry. They aid in
dough conditioning and bleaching. Their excellent moisture-holding qualities also
help retard staling. Soy hulls are processed into fiber bran breads, cereal and snacks.
4
5
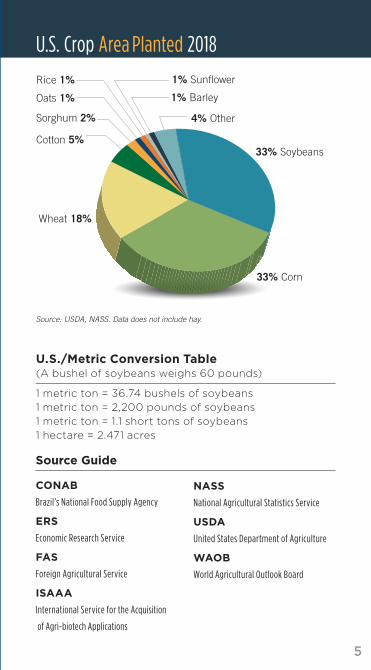
Wheat 18%
U.S. Crop Area Planted 2018
33% Soybeans
1% Sunflower
1% Barley
4% Other
Cotton 5%
Rice 1%
Oats 1%
Source: USDA, NASS. Data does not include hay.
U.S./Metric Conversion Table(A bushel of soybeans weighs 60 pounds)
1 metric ton = 36.74 bushels of soybeans1 metric ton = 2,200 pounds of soybeans1 metric ton = 1.1 short tons of soybeans1 hectare = 2.471 acres
Sorghum 2%
Source Guide
CONAB
Brazil’s National Food Supply Agency
ERS
Economic Research Service
FAS
Foreign Agricultural Service
ISAAA
International Service for the Acquisition
of Agri-biotech Applications
NASS
National Agricultural Statistics Service
USDA
United States Department of Agriculture
WAOB
World Agricultural Outlook Board
33% Corn
6
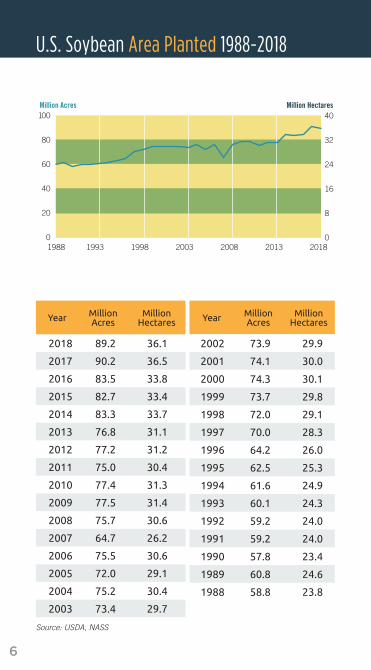
U.S. Soybean Area Planted 1988-2018
Year Million Acres
Million Hectares
2018 89.2 36.1
2017 90.2 36.5
2016 83.5 33.8
2015 82.7 33.4
2014 83.3 33.7
2013 76.8 31.1
2012 77.2 31.2
2011 75.0 30.4
2010 77.4 31.3
2009 77.5 31.4
2008 75.7 30.6
2007 64.7 26.2
2006 75.5 30.6
2005 72.0 29.1
2004 75.2 30.4
2003 73.4 29.7
Year Million Acres
Million Hectares
2002 73.9 29.9
2001 74.1 30.0
2000 74.3 30.1
1999 73.7 29.8
1998 72.0 29.1
1997 70.0 28.3
1996 64.2 26.0
1995 62.5 25.3
1994 61.6 24.9
1993 60.1 24.3
1992 59.2 24.0
1991 59.2 24.0
1990 57.8 23.4
1989 60.8 24.6
1988 58.8 23.8
Source: USDA, NASS
Million Acres Million Hectares
80
100
0
20
40
60
32
8
16
24
40
01988 1993 1998 2003 2008 2013 2018 1988 1992 1997 2002 2007 2012 2017
U.S.Soybean Area Planted 1988-2018 - Page 6
Million Bushels Million Metric Tons
4,000
5,000
0
1,000
2,000
3,000
108
27
54
81
135
0
U.S.Soybean Production 1988-2018- Page 10
$/Bushel $/Metric Ton560
0
140
280
420
4
8
12
16
0
U.S.SoybeanPrices Paid to Farmers 1988-2018 - Page 12
Bushels/Acre
40
50
60
0
10
20
30
U.S.SoybeanYield1988-2017 - Page 8
Billion Pounds Million Metric Tons25
0
5
10
15
20
4.52
6.78
9.04
11.3
2.26
0
U.S. Soybean Oil Production 1991-2017- Page 32
Million Dollars
40,000
50,000
0
10,000
20,000
30,000
U.S.Soybean Crop Value 1988-2018 - Page 14
Million Bushels Metric Tons2,000
0
500
1,000
1,500
13.6
27.2
40.8
54.4
0
U.S. Soybean Crush 1988-2017- Page 17
Million Gallons Million Liters
2,000
2,500
0
500
1,000
1,500
1,890
3,780
5,670
7,560
9,450
02001 2005 2009 2013 2017
U.S. Biodiesel Production 2000-2017- Page 19
Million Bushels Million Metric Tons
U.S. Soybean Ending Stocks 1988-2017 - Page 18
800
0
200
400
600
5.4
10.9
16.3
21.8
0
Million Bushels Million Metric Tons2,500
0
500
1,000
1,500
2,000
27.2
13.6
40.8
54.4
68.0
0
U.S. Soybean Exports 1988-2017- Page 22
Million Bushels Million Metric Tons
4,000
5,000
0
1,000
2,000
3,000
27
54
81
108
135
0
Brazil & Agrentina Soybean Production 1994-2018- Page 26
Million Short Tons Million Metric Tons
40
50
0
20
10
30
36
45
9
0
18
27
1993 1997 2001 2005 2009 2013 2017
1993 1997 2001 2005 2009 2013 2017
U.S. Soybean Meal Production 1991-2017 - Page 28
1988 1992 1997 2002 2007 2012 2017
1988 1992 1997 2002 2007 2012 20171994 1998 2002 2006 2010 2014 20181988 1993 1998 2003 2008 2013 2018
1988 1993 1998 2003 2008 2013 2018
1988 1993 1998 2003 2008 2013 2018
1988 1993 1998 2003 2008 2013 2018
7
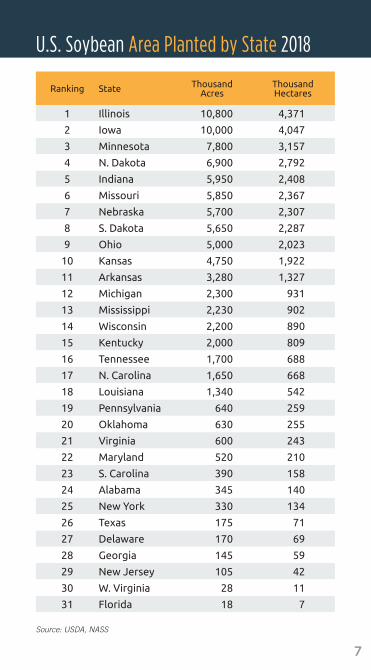
U.S. Soybean Area Planted by State 2018
Ranking State Thousand Acres
Thousand Hectares
1 Illinois 10,800 4,371
2 Iowa 10,000 4,047
3 Minnesota 7,800 3,157
4 N. Dakota 6,900 2,792
5 Indiana 5,950 2,408
6 Missouri 5,850 2,367
7 Nebraska 5,700 2,307
8 S. Dakota 5,650 2,287
9 Ohio 5,000 2,023
10 Kansas 4,750 1,922
11 Arkansas 3,280 1,327
12 Michigan 2,300 931
13 Mississippi 2,230 902
14 Wisconsin 2,200 890
15 Kentucky 2,000 809
16 Tennessee 1,700 688
17 N. Carolina 1,650 668
18 Louisiana 1,340 542
19 Pennsylvania 640 259
20 Oklahoma 630 255
21 Virginia 600 243
22 Maryland 520 210
23 S. Carolina 390 158
24 Alabama 345 140
25 New York 330 134
26 Texas 175 71
27 Delaware 170 69
28 Georgia 145 59
29 New Jersey 105 42
30 W. Virginia 28 11
31 Florida 18 7
Source: USDA, NASS
8
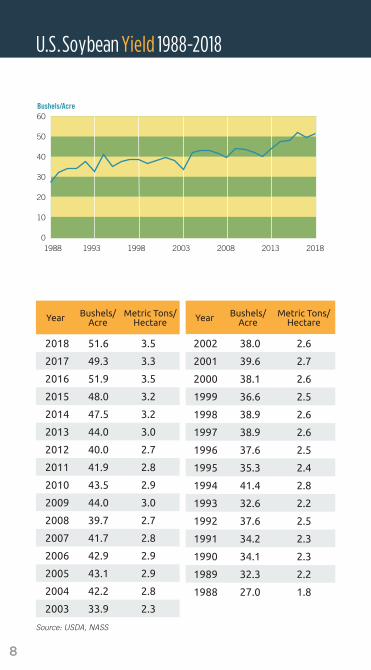
U.S.Soybean Yield 1988-2018
Source: USDA, NASS
Million Acres Million Hectares
80
100
0
20
40
60
32
8
16
24
40
01988 1993 1998 2003 2008 2013 2018 1988 1992 1997 2002 2007 2012 2017
U.S.Soybean Area Planted 1988-2018 - Page 6
Million Bushels Million Metric Tons
4,000
5,000
0
1,000
2,000
3,000
108
27
54
81
135
0
U.S.Soybean Production 1988-2018- Page 10
$/Bushel $/Metric Ton560
0
140
280
420
4
8
12
16
0
U.S.SoybeanPrices Paid to Farmers 1988-2018 - Page 12
Bushels/Acre
40
50
60
0
10
20
30
U.S.SoybeanYield1988-2017 - Page 8
Billion Pounds Million Metric Tons25
0
5
10
15
20
4.52
6.78
9.04
11.3
2.26
0
U.S. Soybean Oil Production 1991-2017- Page 32
Million Dollars
40,000
50,000
0
10,000
20,000
30,000
U.S.Soybean Crop Value 1988-2018 - Page 14
Million Bushels Metric Tons2,000
0
500
1,000
1,500
13.6
27.2
40.8
54.4
0
U.S. Soybean Crush 1988-2017- Page 17
Million Gallons Million Liters
2,000
2,500
0
500
1,000
1,500
1,890
3,780
5,670
7,560
9,450
02001 2005 2009 2013 2017
U.S. Biodiesel Production 2000-2017- Page 19
Million Bushels Million Metric Tons
U.S. Soybean Ending Stocks 1988-2017 - Page 18
800
0
200
400
600
5.4
10.9
16.3
21.8
0
Million Bushels Million Metric Tons2,500
0
500
1,000
1,500
2,000
27.2
13.6
40.8
54.4
68.0
0
U.S. Soybean Exports 1988-2017- Page 22
Million Bushels Million Metric Tons
4,000
5,000
0
1,000
2,000
3,000
27
54
81
108
135
0
Brazil & Agrentina Soybean Production 1994-2018- Page 26
Million Short Tons Million Metric Tons
40
50
0
20
10
30
36
45
9
0
18
27
1993 1997 2001 2005 2009 2013 2017
1993 1997 2001 2005 2009 2013 2017
U.S. Soybean Meal Production 1991-2017 - Page 28
1988 1992 1997 2002 2007 2012 2017
1988 1992 1997 2002 2007 2012 20171994 1998 2002 2006 2010 2014 20181988 1993 1998 2003 2008 2013 2018
1988 1993 1998 2003 2008 2013 2018
1988 1993 1998 2003 2008 2013 2018
1988 1993 1998 2003 2008 2013 2018
Year Bushels/Acre
Metric Tons/Hectare
2018 51.6 3.5
2017 49.3 3.3
2016 51.9 3.5
2015 48.0 3.2
2014 47.5 3.2
2013 44.0 3.0
2012 40.0 2.7
2011 41.9 2.8
2010 43.5 2.9
2009 44.0 3.0
2008 39.7 2.7
2007 41.7 2.8
2006 42.9 2.9
2005 43.1 2.9
2004 42.2 2.8
2003 33.9 2.3
Year Bushels/Acre
Metric Tons/Hectare
2002 38.0 2.6
2001 39.6 2.7
2000 38.1 2.6
1999 36.6 2.5
1998 38.9 2.6
1997 38.9 2.6
1996 37.6 2.5
1995 35.3 2.4
1994 41.4 2.8
1993 32.6 2.2
1992 37.6 2.5
1991 34.2 2.3
1990 34.1 2.3
1989 32.3 2.2
1988 27.0 1.8
9
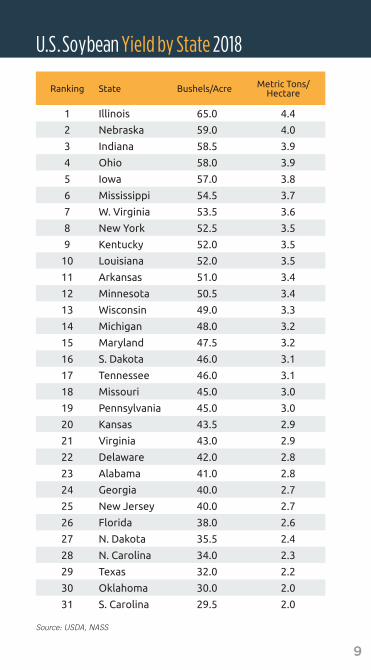
U.S.Soybean Yield by State 2018
Source: USDA, NASS
Ranking State Bushels/Acre Metric Tons/ Hectare
1 Illinois 65.0 4.4
2 Nebraska 59.0 4.0
3 Indiana 58.5 3.9
4 Ohio 58.0 3.9
5 Iowa 57.0 3.8
6 Mississippi 54.5 3.7
7 W. Virginia 53.5 3.6
8 New York 52.5 3.5
9 Kentucky 52.0 3.5
10 Louisiana 52.0 3.5
11 Arkansas 51.0 3.4
12 Minnesota 50.5 3.4
13 Wisconsin 49.0 3.3
14 Michigan 48.0 3.2
15 Maryland 47.5 3.2
16 S. Dakota 46.0 3.1
17 Tennessee 46.0 3.1
18 Missouri 45.0 3.0
19 Pennsylvania 45.0 3.0
20 Kansas 43.5 2.9
21 Virginia 43.0 2.9
22 Delaware 42.0 2.8
23 Alabama 41.0 2.8
24 Georgia 40.0 2.7
25 New Jersey 40.0 2.7
26 Florida 38.0 2.6
27 N. Dakota 35.5 2.4
28 N. Carolina 34.0 2.3
29 Texas 32.0 2.2
30 Oklahoma 30.0 2.0
31 S. Carolina 29.5 2.0
10
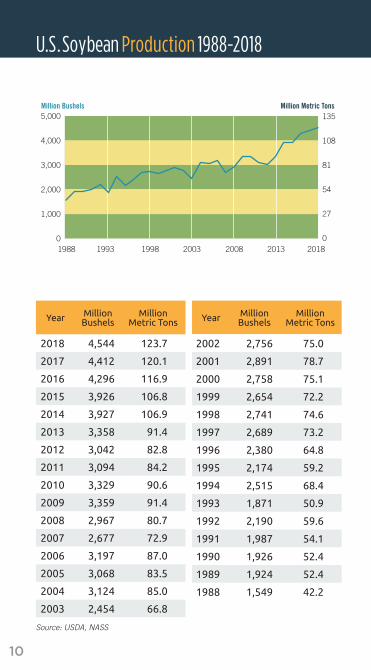
U.S.Soybean Production 1988-2018
Million Acres Million Hectares
80
100
0
20
40
60
32
8
16
24
40
01988 1993 1998 2003 2008 2013 2018 1988 1992 1997 2002 2007 2012 2017
U.S.Soybean Area Planted 1988-2018 - Page 6
Million Bushels Million Metric Tons
4,000
5,000
0
1,000
2,000
3,000
108
27
54
81
135
0
U.S.Soybean Production 1988-2018- Page 10
$/Bushel $/Metric Ton560
0
140
280
420
4
8
12
16
0
U.S.SoybeanPrices Paid to Farmers 1988-2018 - Page 12
Bushels/Acre
40
50
60
0
10
20
30
U.S.SoybeanYield1988-2017 - Page 8
Billion Pounds Million Metric Tons25
0
5
10
15
20
4.52
6.78
9.04
11.3
2.26
0
U.S. Soybean Oil Production 1991-2017- Page 32
Million Dollars
40,000
50,000
0
10,000
20,000
30,000
U.S.Soybean Crop Value 1988-2018 - Page 14
Million Bushels Metric Tons2,000
0
500
1,000
1,500
13.6
27.2
40.8
54.4
0
U.S. Soybean Crush 1988-2017- Page 17
Million Gallons Million Liters
2,000
2,500
0
500
1,000
1,500
1,890
3,780
5,670
7,560
9,450
02001 2005 2009 2013 2017
U.S. Biodiesel Production 2000-2017- Page 19
Million Bushels Million Metric Tons
U.S. Soybean Ending Stocks 1988-2017 - Page 18
800
0
200
400
600
5.4
10.9
16.3
21.8
0
Million Bushels Million Metric Tons2,500
0
500
1,000
1,500
2,000
27.2
13.6
40.8
54.4
68.0
0
U.S. Soybean Exports 1988-2017- Page 22
Million Bushels Million Metric Tons
4,000
5,000
0
1,000
2,000
3,000
27
54
81
108
135
0
Brazil & Agrentina Soybean Production 1994-2018- Page 26
Million Short Tons Million Metric Tons
40
50
0
20
10
30
36
45
9
0
18
27
1993 1997 2001 2005 2009 2013 2017
1993 1997 2001 2005 2009 2013 2017
U.S. Soybean Meal Production 1991-2017 - Page 28
1988 1992 1997 2002 2007 2012 2017
1988 1992 1997 2002 2007 2012 20171994 1998 2002 2006 2010 2014 20181988 1993 1998 2003 2008 2013 2018
1988 1993 1998 2003 2008 2013 2018
1988 1993 1998 2003 2008 2013 2018
1988 1993 1998 2003 2008 2013 2018
Source: USDA, NASS
Year Million Bushels
Million Metric Tons
2018 4,544 123.7
2017 4,412 120.1
2016 4,296 116.9
2015 3,926 106.8
2014 3,927 106.9
2013 3,358 91.4
2012 3,042 82.8
2011 3,094 84.2
2010 3,329 90.6
2009 3,359 91.4
2008 2,967 80.7
2007 2,677 72.9
2006 3,197 87.0
2005 3,068 83.5
2004 3,124 85.0
2003 2,454 66.8
Year Million Bushels
Million Metric Tons
2002 2,756 75.0
2001 2,891 78.7
2000 2,758 75.1
1999 2,654 72.2
1998 2,741 74.6
1997 2,689 73.2
1996 2,380 64.8
1995 2,174 59.2
1994 2,515 68.4
1993 1,871 50.9
1992 2,190 59.6
1991 1,987 54.1
1990 1,926 52.4
1989 1,924 52.4
1988 1,549 42.2
11
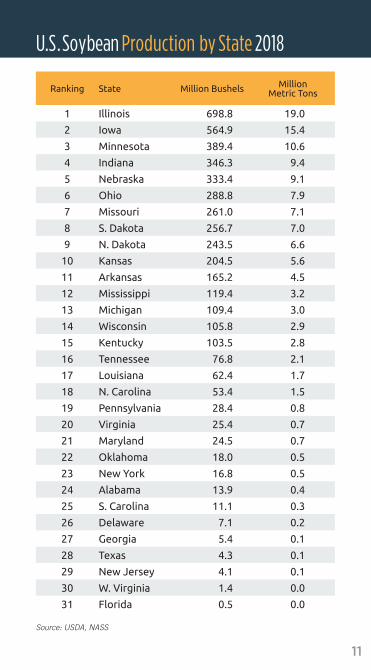
U.S.Soybean Production by State 2018
Source: USDA, NASS
Ranking State Million Bushels MillionMetric Tons
1 Illinois 698.8 19.0
2 Iowa 564.9 15.4
3 Minnesota 389.4 10.6
4 Indiana 346.3 9.4
5 Nebraska 333.4 9.1
6 Ohio 288.8 7.9
7 Missouri 261.0 7.1
8 S. Dakota 256.7 7.0
9 N. Dakota 243.5 6.6
10 Kansas 204.5 5.6
11 Arkansas 165.2 4.5
12 Mississippi 119.4 3.2
13 Michigan 109.4 3.0
14 Wisconsin 105.8 2.9
15 Kentucky 103.5 2.8
16 Tennessee 76.8 2.1
17 Louisiana 62.4 1.7
18 N. Carolina 53.4 1.5
19 Pennsylvania 28.4 0.8
20 Virginia 25.4 0.7
21 Maryland 24.5 0.7
22 Oklahoma 18.0 0.5
23 New York 16.8 0.5
24 Alabama 13.9 0.4
25 S. Carolina 11.1 0.3
26 Delaware 7.1 0.2
27 Georgia 5.4 0.1
28 Texas 4.3 0.1
29 New Jersey 4.1 0.1
30 W. Virginia 1.4 0.0
31 Florida 0.5 0.0
12
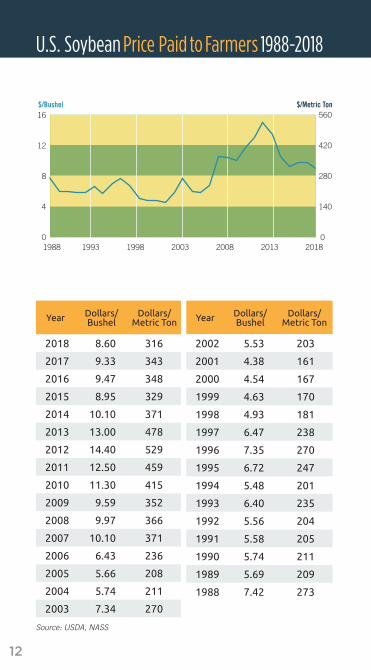
U.S. Soybean Price Paid to Farmers 1988-2018
Million Acres Million Hectares
80
100
0
20
40
60
32
8
16
24
40
01988 1993 1998 2003 2008 2013 2018 1988 1992 1997 2002 2007 2012 2017
U.S.Soybean Area Planted 1988-2018 - Page 6
Million Bushels Million Metric Tons
4,000
5,000
0
1,000
2,000
3,000
108
27
54
81
135
0
U.S.Soybean Production 1988-2018- Page 10
$/Bushel $/Metric Ton560
0
140
280
420
4
8
12
16
0
U.S.SoybeanPrices Paid to Farmers 1988-2018 - Page 12
Bushels/Acre
40
50
60
0
10
20
30
U.S.SoybeanYield1988-2017 - Page 8
Billion Pounds Million Metric Tons25
0
5
10
15
20
4.52
6.78
9.04
11.3
2.26
0
U.S. Soybean Oil Production 1991-2017- Page 32
Million Dollars
40,000
50,000
0
10,000
20,000
30,000
U.S.Soybean Crop Value 1988-2018 - Page 14
Million Bushels Metric Tons2,000
0
500
1,000
1,500
13.6
27.2
40.8
54.4
0
U.S. Soybean Crush 1988-2017- Page 17
Million Gallons Million Liters
2,000
2,500
0
500
1,000
1,500
1,890
3,780
5,670
7,560
9,450
02001 2005 2009 2013 2017
U.S. Biodiesel Production 2000-2017- Page 19
Million Bushels Million Metric Tons
U.S. Soybean Ending Stocks 1988-2017 - Page 18
800
0
200
400
600
5.4
10.9
16.3
21.8
0
Million Bushels Million Metric Tons2,500
0
500
1,000
1,500
2,000
27.2
13.6
40.8
54.4
68.0
0
U.S. Soybean Exports 1988-2017- Page 22
Million Bushels Million Metric Tons
4,000
5,000
0
1,000
2,000
3,000
27
54
81
108
135
0
Brazil & Agrentina Soybean Production 1994-2018- Page 26
Million Short Tons Million Metric Tons
40
50
0
20
10
30
36
45
9
0
18
27
1993 1997 2001 2005 2009 2013 2017
1993 1997 2001 2005 2009 2013 2017
U.S. Soybean Meal Production 1991-2017 - Page 28
1988 1992 1997 2002 2007 2012 2017
1988 1992 1997 2002 2007 2012 20171994 1998 2002 2006 2010 2014 20181988 1993 1998 2003 2008 2013 2018
1988 1993 1998 2003 2008 2013 2018
1988 1993 1998 2003 2008 2013 2018
1988 1993 1998 2003 2008 2013 2018
Source: USDA, NASS
Year Dollars/Bushel
Dollars/ Metric Ton
2018 8.60 316
2017 9.33 343
2016 9.47 348
2015 8.95 329
2014 10.10 371
2013 13.00 478
2012 14.40 529
2011 12.50 459
2010 11.30 415
2009 9.59 352
2008 9.97 366
2007 10.10 371
2006 6.43 236
2005 5.66 208
2004 5.74 211
2003 7.34 270
Year Dollars/Bushel
Dollars/ Metric Ton
2002 5.53 203
2001 4.38 161
2000 4.54 167
1999 4.63 170
1998 4.93 181
1997 6.47 238
1996 7.35 270
1995 6.72 247
1994 5.48 201
1993 6.40 235
1992 5.56 204
1991 5.58 205
1990 5.74 211
1989 5.69 209
1988 7.42 273
13
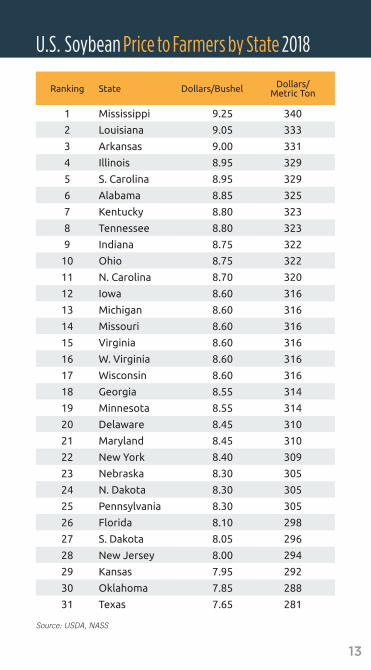
U.S. Soybean Price to Farmers by State 2018
Source: USDA, NASS
Ranking State Dollars/Bushel Dollars/ Metric Ton
1 Mississippi 9.25 340
2 Louisiana 9.05 333
3 Arkansas 9.00 331
4 Illinois 8.95 329
5 S. Carolina 8.95 329
6 Alabama 8.85 325
7 Kentucky 8.80 323
8 Tennessee 8.80 323
9 Indiana 8.75 322
10 Ohio 8.75 322
11 N. Carolina 8.70 320
12 Iowa 8.60 316
13 Michigan 8.60 316
14 Missouri 8.60 316
15 Virginia 8.60 316
16 W. Virginia 8.60 316
17 Wisconsin 8.60 316
18 Georgia 8.55 314
19 Minnesota 8.55 314
20 Delaware 8.45 310
21 Maryland 8.45 310
22 New York 8.40 309
23 Nebraska 8.30 305
24 N. Dakota 8.30 305
25 Pennsylvania 8.30 305
26 Florida 8.10 298
27 S. Dakota 8.05 296
28 New Jersey 8.00 294
29 Kansas 7.95 292
30 Oklahoma 7.85 288
31 Texas 7.65 281
14
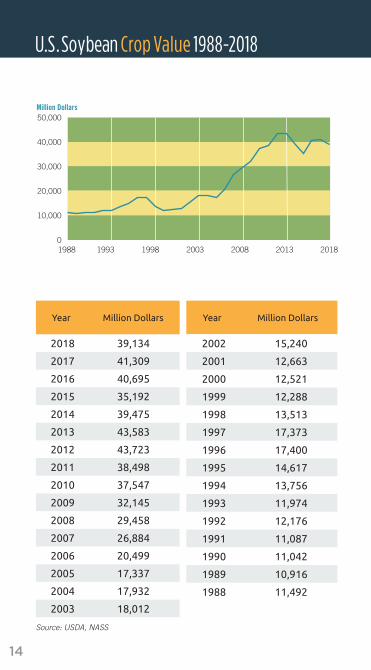
U.S.Soybean Crop Value 1988-2018
Million Acres Million Hectares
80
100
0
20
40
60
32
8
16
24
40
01988 1993 1998 2003 2008 2013 2018 1988 1992 1997 2002 2007 2012 2017
U.S.Soybean Area Planted 1988-2018 - Page 6
Million Bushels Million Metric Tons
4,000
5,000
0
1,000
2,000
3,000
108
27
54
81
135
0
U.S.Soybean Production 1988-2018- Page 10
$/Bushel $/Metric Ton560
0
140
280
420
4
8
12
16
0
U.S.SoybeanPrices Paid to Farmers 1988-2018 - Page 12
Bushels/Acre
40
50
60
0
10
20
30
U.S.SoybeanYield1988-2017 - Page 8
Billion Pounds Million Metric Tons25
0
5
10
15
20
4.52
6.78
9.04
11.3
2.26
0
U.S. Soybean Oil Production 1991-2017- Page 32
Million Dollars
40,000
50,000
0
10,000
20,000
30,000
U.S.Soybean Crop Value 1988-2018 - Page 14
Million Bushels Metric Tons2,000
0
500
1,000
1,500
13.6
27.2
40.8
54.4
0
U.S. Soybean Crush 1988-2017- Page 17
Million Gallons Million Liters
2,000
2,500
0
500
1,000
1,500
1,890
3,780
5,670
7,560
9,450
02001 2005 2009 2013 2017
U.S. Biodiesel Production 2000-2017- Page 19
Million Bushels Million Metric Tons
U.S. Soybean Ending Stocks 1988-2017 - Page 18
800
0
200
400
600
5.4
10.9
16.3
21.8
0
Million Bushels Million Metric Tons2,500
0
500
1,000
1,500
2,000
27.2
13.6
40.8
54.4
68.0
0
U.S. Soybean Exports 1988-2017- Page 22
Million Bushels Million Metric Tons
4,000
5,000
0
1,000
2,000
3,000
27
54
81
108
135
0
Brazil & Agrentina Soybean Production 1994-2018- Page 26
Million Short Tons Million Metric Tons
40
50
0
20
10
30
36
45
9
0
18
27
1993 1997 2001 2005 2009 2013 2017
1993 1997 2001 2005 2009 2013 2017
U.S. Soybean Meal Production 1991-2017 - Page 28
1988 1992 1997 2002 2007 2012 2017
1988 1992 1997 2002 2007 2012 20171994 1998 2002 2006 2010 2014 20181988 1993 1998 2003 2008 2013 2018
1988 1993 1998 2003 2008 2013 2018
1988 1993 1998 2003 2008 2013 2018
1988 1993 1998 2003 2008 2013 2018
Source: USDA, NASS
Year Million Dollars
2018 39,134
2017 41,309
2016 40,695
2015 35,192
2014 39,475
2013 43,583
2012 43,723
2011 38,498
2010 37,547
2009 32,145
2008 29,458
2007 26,884
2006 20,499
2005 17,337
2004 17,932
2003 18,012
Year Million Dollars
2002 15,240
2001 12,663
2000 12,521
1999 12,288
1998 13,513
1997 17,373
1996 17,400
1995 14,617
1994 13,756
1993 11,974
1992 12,176
1991 11,087
1990 11,042
1989 10,916
1988 11,492
15
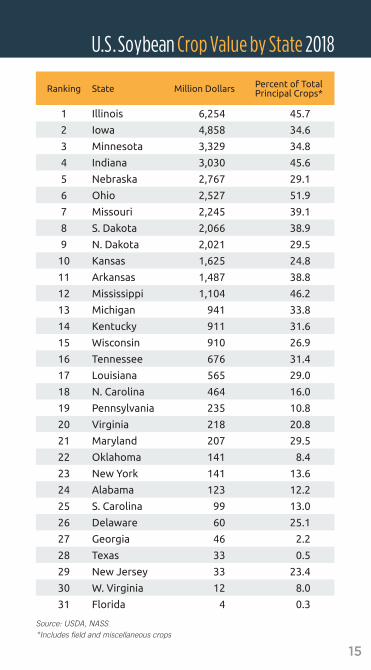
U.S.Soybean Crop Value by State 2018
*Includes field and miscellaneous crops Source: USDA, NASS
Ranking State Million Dollars Percent of Total Principal Crops*
1 Illinois 6,254 45.7
2 Iowa 4,858 34.6
3 Minnesota 3,329 34.8
4 Indiana 3,030 45.6
5 Nebraska 2,767 29.1
6 Ohio 2,527 51.9
7 Missouri 2,245 39.1
8 S. Dakota 2,066 38.9
9 N. Dakota 2,021 29.5
10 Kansas 1,625 24.8
11 Arkansas 1,487 38.8
12 Mississippi 1,104 46.2
13 Michigan 941 33.8
14 Kentucky 911 31.6
15 Wisconsin 910 26.9
16 Tennessee 676 31.4
17 Louisiana 565 29.0
18 N. Carolina 464 16.0
19 Pennsylvania 235 10.8
20 Virginia 218 20.8
21 Maryland 207 29.5
22 Oklahoma 141 8.4
23 New York 141 13.6
24 Alabama 123 12.2
25 S. Carolina 99 13.0
26 Delaware 60 25.1
27 Georgia 46 2.2
28 Texas 33 0.5
29 New Jersey 33 23.4
30 W. Virginia 12 8.0
31 Florida 4 0.3
16
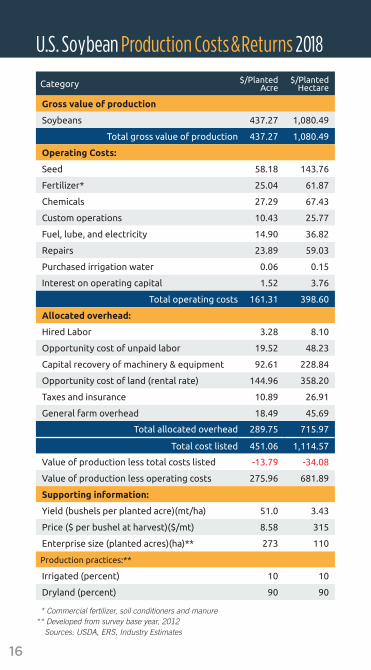
Category $/Planted Acre
$/Planted Hectare
Gross value of production
Soybeans 437.27 1,080.49
Total gross value of production 437.27 1,080.49
Operating Costs:
Seed 58.18 143.76
Fertilizer* 25.04 61.87
Chemicals 27.29 67.43
Custom operations 10.43 25.77
Fuel, lube, and electricity 14.90 36.82
Repairs 23.89 59.03
Purchased irrigation water 0.06 0.15
Interest on operating capital 1.52 3.76
Total operating costs 161.31 398.60
Allocated overhead:
Hired Labor 3.28 8.10
Opportunity cost of unpaid labor 19.52 48.23
Capital recovery of machinery & equipment 92.61 228.84
Opportunity cost of land (rental rate) 144.96 358.20
Taxes and insurance 10.89 26.91
General farm overhead 18.49 45.69
Total allocated overhead 289.75 715.97
Total cost listed 451.06 1,114.57
Value of production less total costs listed -13.79 -34.08
Value of production less operating costs 275.96 681.89
Supporting information:
Yield (bushels per planted acre)(mt/ha) 51.0 3.43
Price ($ per bushel at harvest)($/mt) 8.58 315
Enterprise size (planted acres)(ha)** 273 110
Production practices:**
Irrigated (percent) 10 10
Dryland (percent) 90 90
U.S. Soybean Production Costs&Returns 2018
* Commercial fertilizer, soil conditioners and manure ** Developed from survey base year, 2012 Sources: USDA, ERS, Industry Estimates
17
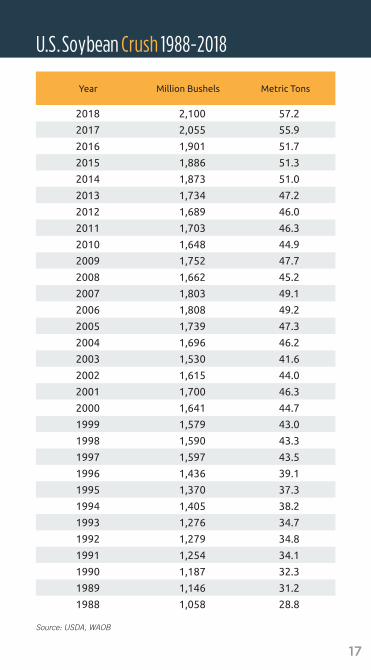
U.S.Soybean Crush 1988-2018
Source: USDA, WAOB
Year Million Bushels Metric Tons
2018 2,100 57.2
2017 2,055 55.9
2016 1,901 51.7
2015 1,886 51.3
2014 1,873 51.0
2013 1,734 47.2
2012 1,689 46.0
2011 1,703 46.3
2010 1,648 44.9
2009 1,752 47.7
2008 1,662 45.2
2007 1,803 49.1
2006 1,808 49.2
2005 1,739 47.3
2004 1,696 46.2
2003 1,530 41.6
2002 1,615 44.0
2001 1,700 46.3
2000 1,641 44.7
1999 1,579 43.0
1998 1,590 43.3
1997 1,597 43.5
1996 1,436 39.1
1995 1,370 37.3
1994 1,405 38.2
1993 1,276 34.7
1992 1,279 34.8
1991 1,254 34.1
1990 1,187 32.3
1989 1,146 31.2
1988 1,058 28.8
18
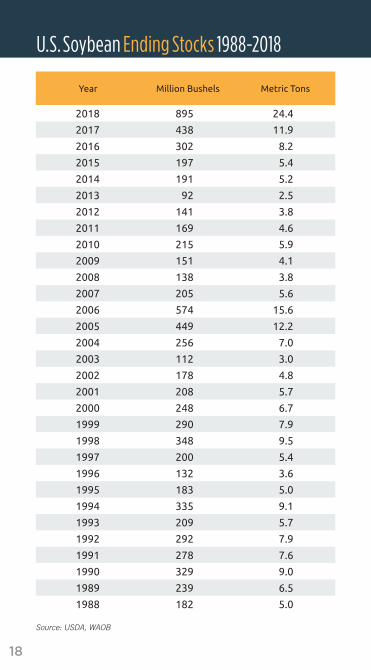
U.S. Soybean Ending Stocks 1988-2018
Source: USDA, WAOB
Year Million Bushels Metric Tons
2018 895 24.4
2017 438 11.9
2016 302 8.2
2015 197 5.4
2014 191 5.2
2013 92 2.5
2012 141 3.8
2011 169 4.6
2010 215 5.9
2009 151 4.1
2008 138 3.8
2007 205 5.6
2006 574 15.6
2005 449 12.2
2004 256 7.0
2003 112 3.0
2002 178 4.8
2001 208 5.7
2000 248 6.7
1999 290 7.9
1998 348 9.5
1997 200 5.4
1996 132 3.6
1995 183 5.0
1994 335 9.1
1993 209 5.7
1992 292 7.9
1991 278 7.6
1990 329 9.0
1989 239 6.5
1988 182 5.0
19
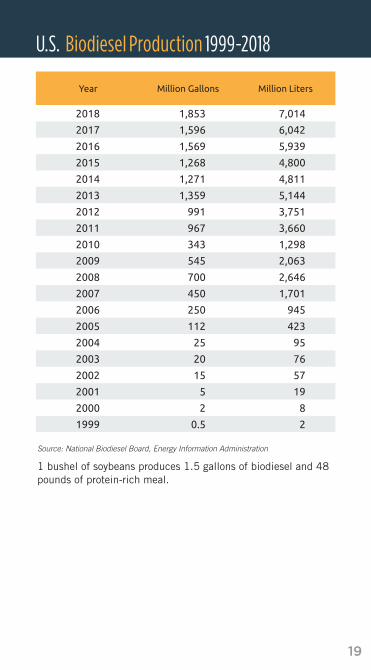
U.S. Biodiesel Production 1999-2018
Source: National Biodiesel Board, Energy Information Administration
1 bushel of soybeans produces 1.5 gallons of biodiesel and 48 pounds of protein-rich meal.
Year Million Gallons Million Liters
2018 1,853 7,014
2017 1,596 6,042
2016 1,569 5,939
2015 1,268 4,800
2014 1,271 4,811
2013 1,359 5,144
2012 991 3,751
2011 967 3,660
2010 343 1,298
2009 545 2,063
2008 700 2,646
2007 450 1,701
2006 250 945
2005 112 423
2004 25 95
2003 20 76
2002 15 57
2001 5 19
2000 2 8
1999 0.5 2
20
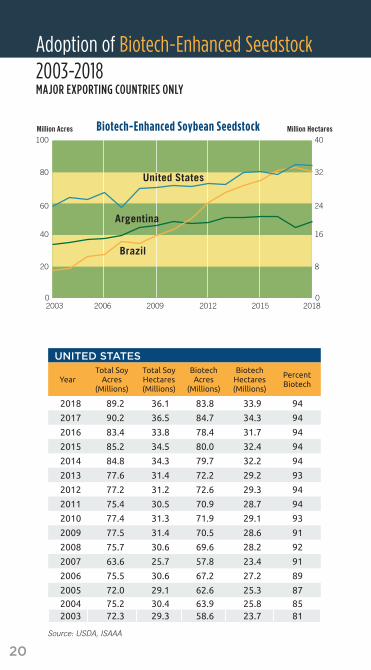
Adoption of Biotech-Enhanced Seedstock 2003-2018
UNITED STATES
YearTotal Soy
Acres (Millions)
Total Soy Hectares (Millions)
Biotech Acres
(Millions)
Biotech Hectares (Millions)
Percent Biotech
2018 89.2 36.1 83.8 33.9 94
2017 90.2 36.5 84.7 34.3 94
2016 83.4 33.8 78.4 31.7 94
2015 85.2 34.5 80.0 32.4 94
2014 84.8 34.3 79.7 32.2 94
2013 77.6 31.4 72.2 29.2 93
2012 77.2 31.2 72.6 29.3 94
2011 75.4 30.5 70.9 28.7 94
2010 77.4 31.3 71.9 29.1 93
2009 77.5 31.4 70.5 28.6 91
2008 75.7 30.6 69.6 28.2 92
2007 63.6 25.7 57.8 23.4 91
2006 75.5 30.6 67.2 27.2 89
2005 72.0 29.1 62.6 25.3 87
2004 75.2 30.4 63.9 25.8 852003 72.3 29.3 58.6 23.7 81
Million Acres Million Hectares
32
8
16
24
02003 2006 2009 2012 2015 2018
Adoption of Biotech-Enhanced Seedstock 2003-2018 - Page 20/21
40
80
20
40
60
0
100
United States
Brazil
Argentina
Biotech-Enhanced Soybean Seedstock
Source: USDA, ISAAA
MAJOR EXPORTING COUNTRIES ONLY
21
* Estimate | Source: USDA, ISAAA
* Estimate | Source: USDA, ISAAA
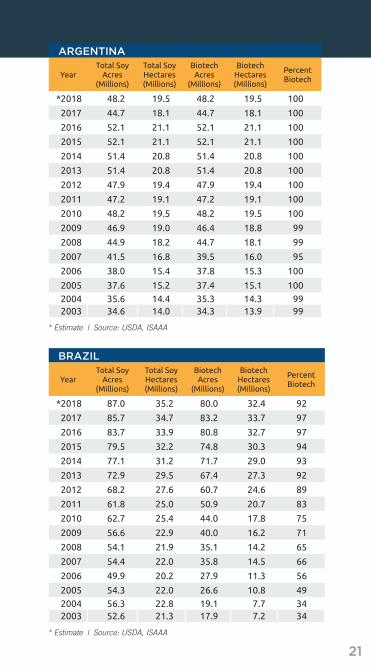
ARGENTINA
YearTotal Soy
Acres (Millions)
Total Soy Hectares (Millions)
Biotech Acres
(Millions)
Biotech Hectares (Millions)
Percent Biotech
*2018 48.2 19.5 48.2 19.5 100
2017 44.7 18.1 44.7 18.1 100
2016 52.1 21.1 52.1 21.1 100
2015 52.1 21.1 52.1 21.1 100
2014 51.4 20.8 51.4 20.8 100
2013 51.4 20.8 51.4 20.8 100
2012 47.9 19.4 47.9 19.4 100
2011 47.2 19.1 47.2 19.1 100
2010 48.2 19.5 48.2 19.5 100
2009 46.9 19.0 46.4 18.8 99
2008 44.9 18.2 44.7 18.1 99
2007 41.5 16.8 39.5 16.0 95
2006 38.0 15.4 37.8 15.3 100
2005 37.6 15.2 37.4 15.1 100
2004 35.6 14.4 35.3 14.3 992003 34.6 14.0 34.3 13.9 99
BRAZIL
YearTotal Soy
Acres (Millions)
Total Soy Hectares (Millions)
Biotech Acres
(Millions)
Biotech Hectares (Millions)
PercentBiotech
*2018 87.0 35.2 80.0 32.4 92
2017 85.7 34.7 83.2 33.7 97
2016 83.7 33.9 80.8 32.7 97
2015 79.5 32.2 74.8 30.3 94
2014 77.1 31.2 71.7 29.0 93
2013 72.9 29.5 67.4 27.3 92
2012 68.2 27.6 60.7 24.6 89
2011 61.8 25.0 50.9 20.7 83
2010 62.7 25.4 44.0 17.8 75
2009 56.6 22.9 40.0 16.2 71
2008 54.1 21.9 35.1 14.2 65
2007 54.4 22.0 35.8 14.5 66
2006 49.9 20.2 27.9 11.3 56
2005 54.3 22.0 26.6 10.8 49
2004 56.3 22.8 19.1 7.7 342003 52.6 21.3 17.9 7.2 34
22
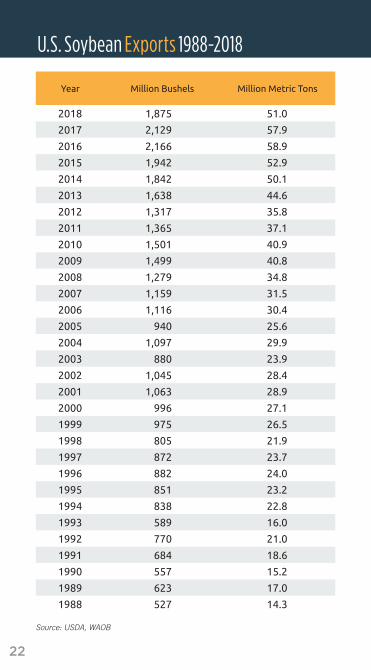
U.S. Soybean Exports 1988-2018
Source: USDA, WAOB
Year Million Bushels Million Metric Tons
2018 1,875 51.0
2017 2,129 57.9
2016 2,166 58.9
2015 1,942 52.9
2014 1,842 50.1
2013 1,638 44.6
2012 1,317 35.8
2011 1,365 37.1
2010 1,501 40.9
2009 1,499 40.8
2008 1,279 34.8
2007 1,159 31.5
2006 1,116 30.4
2005 940 25.6
2004 1,097 29.9
2003 880 23.9
2002 1,045 28.4
2001 1,063 28.9
2000 996 27.1
1999 975 26.5
1998 805 21.9
1997 872 23.7
1996 882 24.0
1995 851 23.2
1994 838 22.8
1993 589 16.0
1992 770 21.0
1991 684 18.6
1990 557 15.2
1989 623 17.0
1988 527 14.3
23
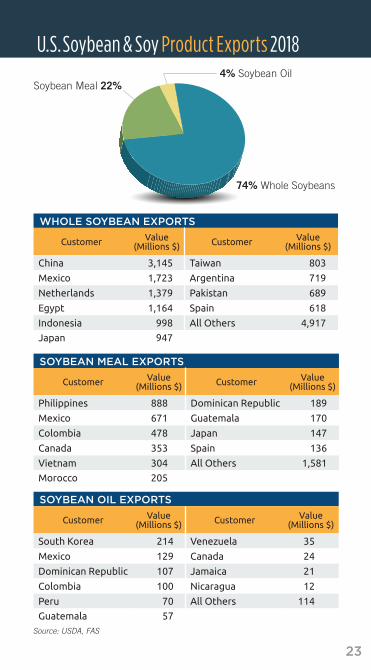
WHOLE SOYBEAN EXPORTS
Customer Value(Millions $) Customer Value
(Millions $)
China 3,145 Taiwan 803
Mexico 1,723 Argentina 719
Netherlands 1,379 Pakistan 689
Egypt 1,164 Spain 618
Indonesia 998 All Others 4,917
Japan 947
SOYBEAN MEAL EXPORTS
Customer Value(Millions $) Customer Value
(Millions $)
Philippines 888 Dominican Republic 189
Mexico 671 Guatemala 170
Colombia 478 Japan 147
Canada 353 Spain 136
Vietnam 304 All Others 1,581
Morocco 205
SOYBEAN OIL EXPORTS
Customer Value(Millions $) Customer Value
(Millions $)
South Korea 214 Venezuela 35
Mexico 129 Canada 24
Dominican Republic 107 Jamaica 21
Colombia 100 Nicaragua 12
Peru 70 All Others 114
Guatemala 57 Source: USDA, FAS
U.S.Soybean & Soy Product Exports 20184% Soybean Oil
Soybean Meal 22%
74% Whole Soybeans
24
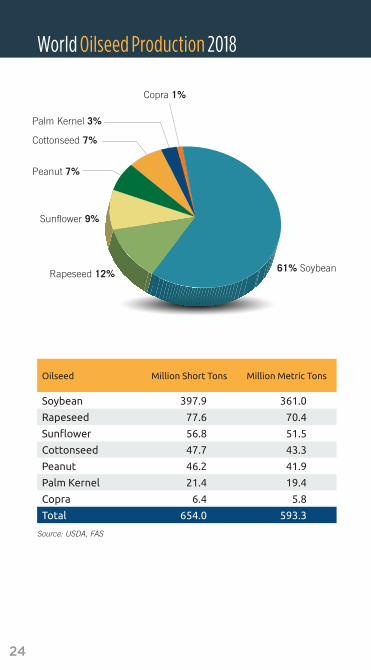
World Oilseed Production 2018
Copra 1%
61% Soybean
Palm Kernel 3%
Peanut 7%
Cottonseed 7%
Sunflower 9%
Rapeseed 12%
Source: USDA, FAS
Oilseed Million Short Tons Million Metric Tons
Soybean 397.9 361.0
Rapeseed 77.6 70.4
Sunflower 56.8 51.5
Cottonseed 47.7 43.3
Peanut 46.2 41.9
Palm Kernel 21.4 19.4
Copra 6.4 5.8
Total 654.0 593.3
25
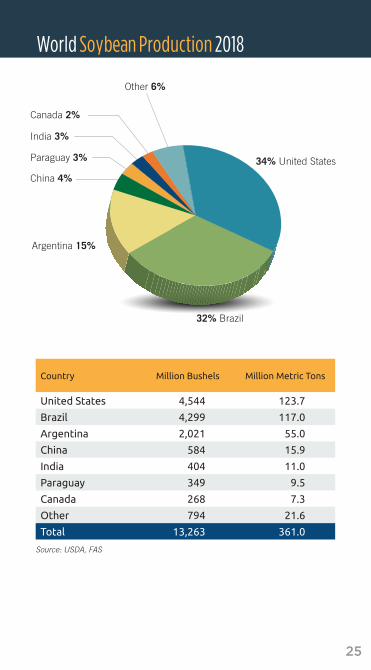
World Soybean Production 2018
34% United States
Canada 2%
Paraguay 3%
India 3%
China 4%
Argentina 15%
32% Brazil
Other 6%
Source: USDA, FAS
Country Million Bushels Million Metric Tons
United States 4,544 123.7
Brazil 4,299 117.0
Argentina 2,021 55.0
China 584 15.9
India 404 11.0
Paraguay 349 9.5
Canada 268 7.3
Other 794 21.6
Total 13,263 361.0

26
BRAZIL ARGENTINA
Year Million Bushels
Million Metric Tons Year Million
BushelsMillion
Metric Tons
2018 4,299 117.0 2018 2,021 55.02017 4,439 120.8 2017 1,389 37.82016 4,211 114.6 2016 2,021 55.02015 3,546 96.5 2015 2,161 58.82014 3,571 97.2 2014 2,258 61.52013 3,186 86.7 2013 1,962 53.42012 3,013 82.0 2012 1,811 49.32011 2,443 66.5 2011 1,473 40.12010 2,767 75.3 2010 1,800 49.02009 2,535 69.0 2009 2,003 54.52008 2,124 57.8 2008 1,176 32.02007 2,241 61.0 2007 1,698 46.22006 2,168 59.0 2006 1,793 48.82005 2,094 57.0 2005 1,488 40.52004 1,947 53.0 2004 1,433 39.02003 1,874 51.0 2003 1,213 33.02002 1,911 52.0 2002 1,304 35.52001 1,598 43.5 2001 1,102 30.02000 1,433 39.0 2000 1,021 27.81999 1,257 34.2 1999 779 21.21998 1,150 31.3 1998 735 20.01997 1,194 32.5 1997 716 19.51996 1,003 27.3 1996 412 11.21995 887 24.2 1995 457 12.41994 952 25.9 1994 459 12.5
Brazil & Argentina Soybean Production 1994-2018
Source: USDA, FAS
Million Acres Million Hectares
80
100
0
20
40
60
32
8
16
24
40
01988 1993 1998 2003 2008 2013 2018 1988 1992 1997 2002 2007 2012 2017
U.S.Soybean Area Planted 1988-2018 - Page 6
Million Bushels Million Metric Tons
4,000
5,000
0
1,000
2,000
3,000
108
27
54
81
135
0
U.S.Soybean Production 1988-2018- Page 10
$/Bushel $/Metric Ton560
0
140
280
420
4
8
12
16
0
U.S.SoybeanPrices Paid to Farmers 1988-2018 - Page 12
Bushels/Acre
40
50
60
0
10
20
30
U.S.SoybeanYield1988-2017 - Page 8
Billion Pounds Million Metric Tons25
0
5
10
15
20
4.52
6.78
9.04
11.3
2.26
0
U.S. Soybean Oil Production 1991-2017- Page 32
Million Dollars
40,000
50,000
0
10,000
20,000
30,000
U.S.Soybean Crop Value 1988-2018 - Page 14
Million Bushels Metric Tons2,000
0
500
1,000
1,500
13.6
27.2
40.8
54.4
0
U.S. Soybean Crush 1988-2017- Page 17
Million Gallons Million Liters
2,000
2,500
0
500
1,000
1,500
1,890
3,780
5,670
7,560
9,450
02001 2005 2009 2013 2017
U.S. Biodiesel Production 2000-2017- Page 19
Million Bushels Million Metric Tons
U.S. Soybean Ending Stocks 1988-2017 - Page 18
800
0
200
400
600
5.4
10.9
16.3
21.8
0
Million Bushels Million Metric Tons2,500
0
500
1,000
1,500
2,000
27.2
13.6
40.8
54.4
68.0
0
U.S. Soybean Exports 1988-2017- Page 22
Million Bushels Million Metric Tons
4,000
5,000
0
1,000
2,000
3,000
27
54
81
108
135
0
Brazil & Agrentina Soybean Production 1994-2018- Page 26
Million Short Tons Million Metric Tons
40
50
0
20
10
30
36
45
9
0
18
27
1993 1997 2001 2005 2009 2013 2017
1993 1997 2001 2005 2009 2013 2017
U.S. Soybean Meal Production 1991-2017 - Page 28
1988 1992 1997 2002 2007 2012 2017
1988 1992 1997 2002 2007 2012 20171994 1998 2002 2006 2010 2014 20181988 1993 1998 2003 2008 2013 2018
1988 1993 1998 2003 2008 2013 2018
1988 1993 1998 2003 2008 2013 2018
1988 1993 1998 2003 2008 2013 2018
Argentina
Brazil
27
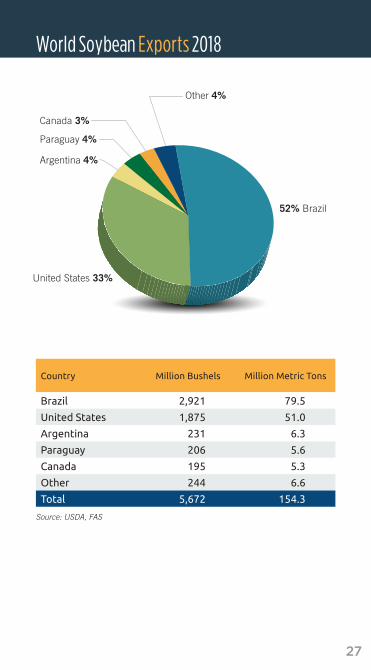
World Soybean Exports 2018
United States 33%
Paraguay 4%
Canada 3%
Argentina 4%
52% Brazil
Other 4%
Source: USDA, FAS
Country Million Bushels Million Metric Tons
Brazil 2,921 79.5
United States 1,875 51.0
Argentina 231 6.3
Paraguay 206 5.6
Canada 195 5.3
Other 244 6.6
Total 5,672 154.3
28
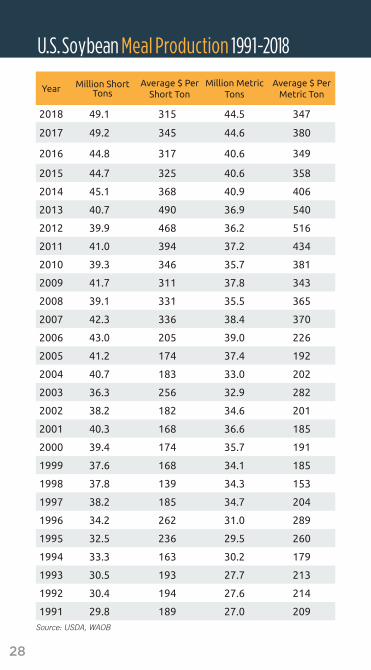
U.S.Soybean Meal Production 1991-2018
Source: USDA, WAOB
Year Million Short Tons
Average $ Per Short Ton
Million Metric Tons
Average $ Per Metric Ton
2018 49.1 315 44.5 347
2017 49.2 345 44.6 380
2016 44.8 317 40.6 349
2015 44.7 325 40.6 358
2014 45.1 368 40.9 406
2013 40.7 490 36.9 540
2012 39.9 468 36.2 516
2011 41.0 394 37.2 434
2010 39.3 346 35.7 381
2009 41.7 311 37.8 343
2008 39.1 331 35.5 365
2007 42.3 336 38.4 370
2006 43.0 205 39.0 226
2005 41.2 174 37.4 192
2004 40.7 183 33.0 202
2003 36.3 256 32.9 282
2002 38.2 182 34.6 201
2001 40.3 168 36.6 185
2000 39.4 174 35.7 191
1999 37.6 168 34.1 185
1998 37.8 139 34.3 153
1997 38.2 185 34.7 204
1996 34.2 262 31.0 289
1995 32.5 236 29.5 260
1994 33.3 163 30.2 179
1993 30.5 193 27.7 213
1992 30.4 194 27.6 214
1991 29.8 189 27.0 209
29
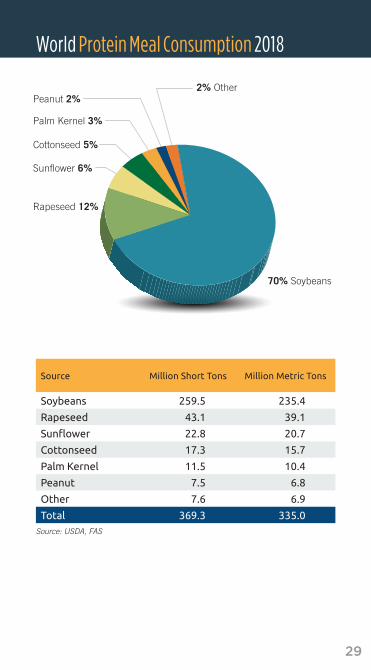
U.S.Soybean Meal Production 1991-2018 World Protein Meal Consumption 2018
70% Soybeans
Palm Kernel 3%
Sunflower 6%
Cottonseed 5%
Rapeseed 12%
Peanut 2%2% Other
Source: USDA, FAS
Source Million Short Tons Million Metric Tons
Soybeans 259.5 235.4
Rapeseed 43.1 39.1
Sunflower 22.8 20.7
Cottonseed 17.3 15.7
Palm Kernel 11.5 10.4
Peanut 7.5 6.8
Other 7.6 6.9
Total 369.3 335.0
30
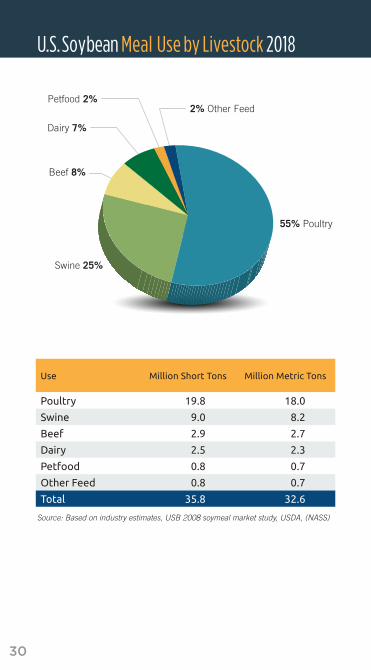
Source: Based on industry estimates, USB 2008 soymeal market study, USDA, (NASS)
U.S.Soybean Meal Use by Livestock 2018
55% Poultry
Petfood 2% 2% Other Feed
Dairy 7%
Beef 8%
Swine 25%
Use Million Short Tons Million Metric Tons
Poultry 19.8 18.0
Swine 9.0 8.2
Beef 2.9 2.7
Dairy 2.5 2.3
Petfood 0.8 0.7
Other Feed 0.8 0.7
Total 35.8 32.6
31
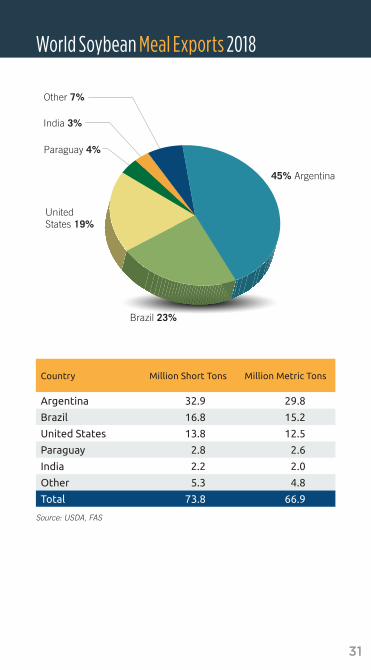
Source: USDA, FAS
World Soybean Meal Exports 2018
45% Argentina
India 3%
Paraguay 4%
United States 19%
Other 7%
Brazil 23%
Country Million Short Tons Million Metric Tons
Argentina 32.9 29.8
Brazil 16.8 15.2
United States 13.8 12.5
Paraguay 2.8 2.6
India 2.2 2.0
Other 5.3 4.8
Total 73.8 66.9
32
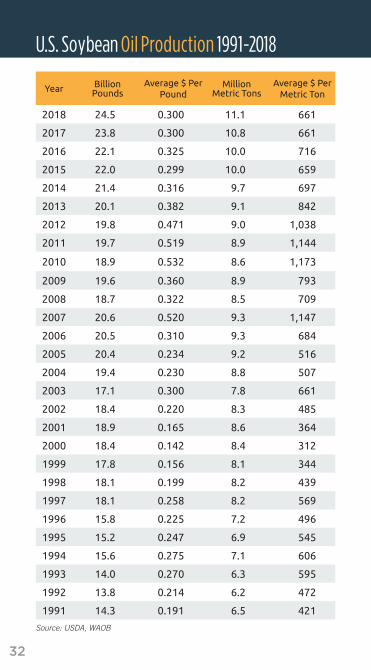
U.S. Soybean Oil Production 1991-2018
Source: USDA, WAOB
Year BillionPounds
Average $ Per Pound
Million Metric Tons
Average $ Per Metric Ton
2018 24.5 0.300 11.1 661
2017 23.8 0.300 10.8 661
2016 22.1 0.325 10.0 716
2015 22.0 0.299 10.0 659
2014 21.4 0.316 9.7 697
2013 20.1 0.382 9.1 842
2012 19.8 0.471 9.0 1,038
2011 19.7 0.519 8.9 1,144
2010 18.9 0.532 8.6 1,173
2009 19.6 0.360 8.9 793
2008 18.7 0.322 8.5 709
2007 20.6 0.520 9.3 1,147
2006 20.5 0.310 9.3 684
2005 20.4 0.234 9.2 516
2004 19.4 0.230 8.8 507
2003 17.1 0.300 7.8 661
2002 18.4 0.220 8.3 485
2001 18.9 0.165 8.6 364
2000 18.4 0.142 8.4 312
1999 17.8 0.156 8.1 344
1998 18.1 0.199 8.2 439
1997 18.1 0.258 8.2 569
1996 15.8 0.225 7.2 496
1995 15.2 0.247 6.9 545
1994 15.6 0.275 7.1 606
1993 14.0 0.270 6.3 595
1992 13.8 0.214 6.2 472
1991 14.3 0.191 6.5 421
33
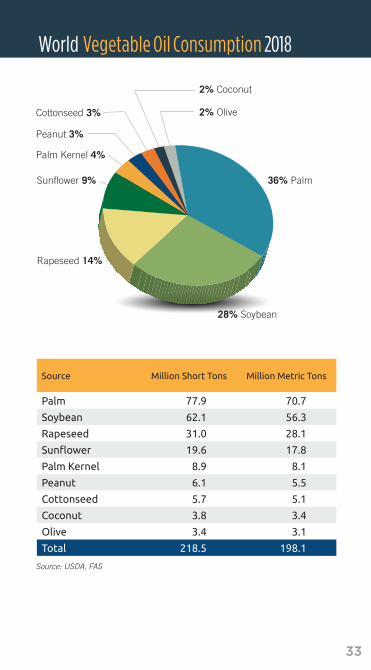
World Vegetable Oil Consumption 2018
36% Palm
Palm Kernel 4%
Sunflower 9%
Rapeseed 14%
Cottonseed 3%
Source: USDA, FAS
28% Soybean
Peanut 3%
2% Coconut
2% Olive
Source Million Short Tons Million Metric Tons
Palm 77.9 70.7
Soybean 62.1 56.3
Rapeseed 31.0 28.1
Sunflower 19.6 17.8
Palm Kernel 8.9 8.1
Peanut 6.1 5.5
Cottonseed 5.7 5.1
Coconut 3.8 3.4
Olive 3.4 3.1
Total 218.5 198.1
34
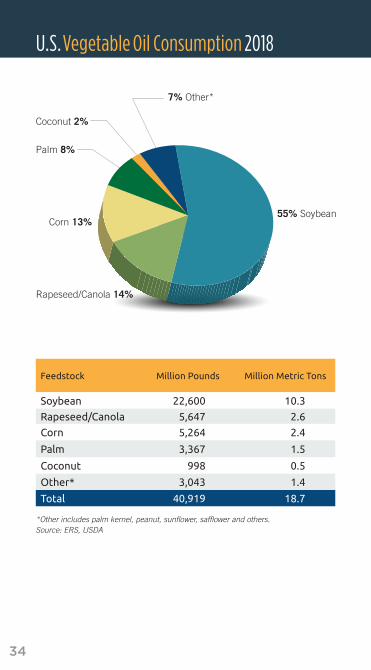
U.S.Vegetable Oil Consumption 2018
55% Soybean
Palm 8%
7% Other*
Rapeseed/Canola 14%
Coconut 2%
*Other includes palm kernel, peanut, sunflower, safflower and others. Source: ERS, USDA
Corn 13%
Feedstock Million Pounds Million Metric Tons
Soybean 22,600 10.3
Rapeseed/Canola 5,647 2.6
Corn 5,264 2.4
Palm 3,367 1.5
Coconut 998 0.5
Other* 3,043 1.4
Total 40,919 18.7
55% Soybean
ABOUT THE AMERICAN SOYBEAN ASSOCIATION
The mission of the American Soybean
Association (ASA) is to advocate for U.S.
soy farmers on policy and trade.
ASA represents U.S. soybean farmers
on domestic and international policy
issues important to the soybean industry.
ASA has 26 affiliated state associations
representing 30 soybean-producing states
and more than 300,000 soybean farmers.
In support of ASA’s mission to advocate
for U.S. soy farmers on policy and trade,
ASA invests cost-share funding provided
by the U.S. Department of Agriculture’s
Foreign Agricultural Service in the U.S.
Soybean Export Council to operate global
offices and conduct activities to maximize
the use of U.S. soy internationally.
Visit SoyGrowers.com or contact the
American Soybean Association at
800.688.7692.
35
Visit Soygrowers.com for more about the American Soybean Association
19ASA-015_0418_XXM
SOYSTATS INVESTORS PREMIER LEVEL
GOLD LEVELIllinois Soybean Association
Iowa Soybean Association
South Dakota Soybean Research & Promotion Council
SILVER LEVELIndiana Soybean Alliance
Kentucky Soybean Board
Minnesota Soybean Research & Promotion Council
Ohio Soybean Council
BRONZE LEVELKansas Soybean Commission
Michigan Soybean Promotion Committee
Mississippi Soybean Promotion Board
New York Corn & Soybean Growers Association
North Carolina Soybean Producers Association
North Dakota Soybean Council
Tennessee Soybean Promotion Council