Embed Size (px)
Citation preview
1
2019FULL YEARPROPERTY ANALYSIS REPORT
2
ABOUT SEGRO
3 Overview
4 Combined property portfolio and yield reconciliation
5 Combined property portfolio
6 Top 10 Assets
7 Analysis of completed portfolio
12 Supplementary data
15 Customer types
16 Development pipeline
19 Glossary of terms
SEGRO is a leading owner, asset manager and developer of modern
warehousing and light industrial properties, with £12.2 billion of assets
under management (£10.3 billion including SEGRO’s share of joint
ventures). The assets are principally concentrated in key conurbations
and major distribution hubs in nine European countries.
The Group serves customers spread across a diverse range of industry
sectors. It has 7.8 million square metres of built space under
management and annual rental income of £378 million at share.
3
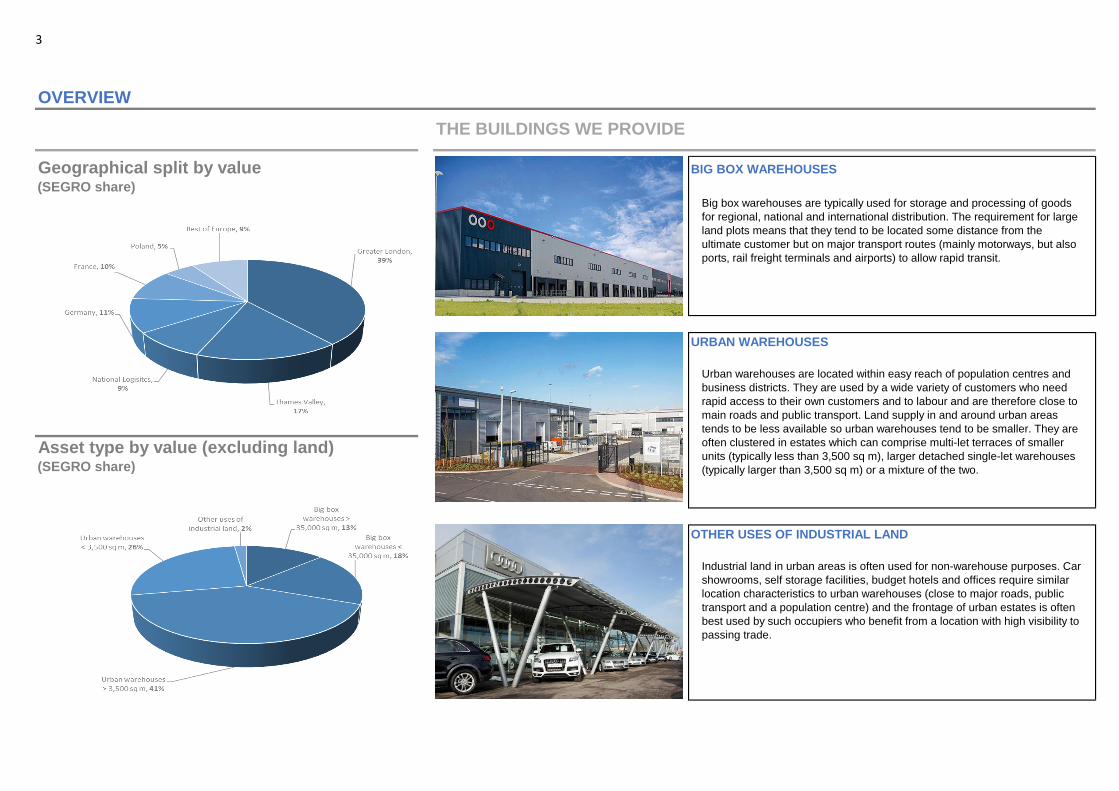
OVERVIEW
THE BUILDINGS WE PROVIDE
Geographical split by value BIG BOX WAREHOUSES
(SEGRO share)
URBAN WAREHOUSES
Asset type by value (excluding land)(SEGRO share)
OTHER USES OF INDUSTRIAL LAND
Big box warehouses are typically used for storage and processing of goods
for regional, national and international distribution. The requirement for large
land plots means that they tend to be located some distance from the
ultimate customer but on major transport routes (mainly motorways, but also
ports, rail freight terminals and airports) to allow rapid transit.
Urban warehouses are located within easy reach of population centres and
business districts. They are used by a wide variety of customers who need
rapid access to their own customers and to labour and are therefore close to
main roads and public transport. Land supply in and around urban areas
tends to be less available so urban warehouses tend to be smaller. They are
often clustered in estates which can comprise multi-let terraces of smaller
units (typically less than 3,500 sq m), larger detached single-let warehouses
(typically larger than 3,500 sq m) or a mixture of the two.
Industrial land in urban areas is often used for non-warehouse purposes. Car
showrooms, self storage facilities, budget hotels and offices require similar
location characteristics to urban warehouses (close to major roads, public
transport and a population centre) and the frontage of urban estates is often
best used by such occupiers who benefit from a location with high visibility to
passing trade.
4
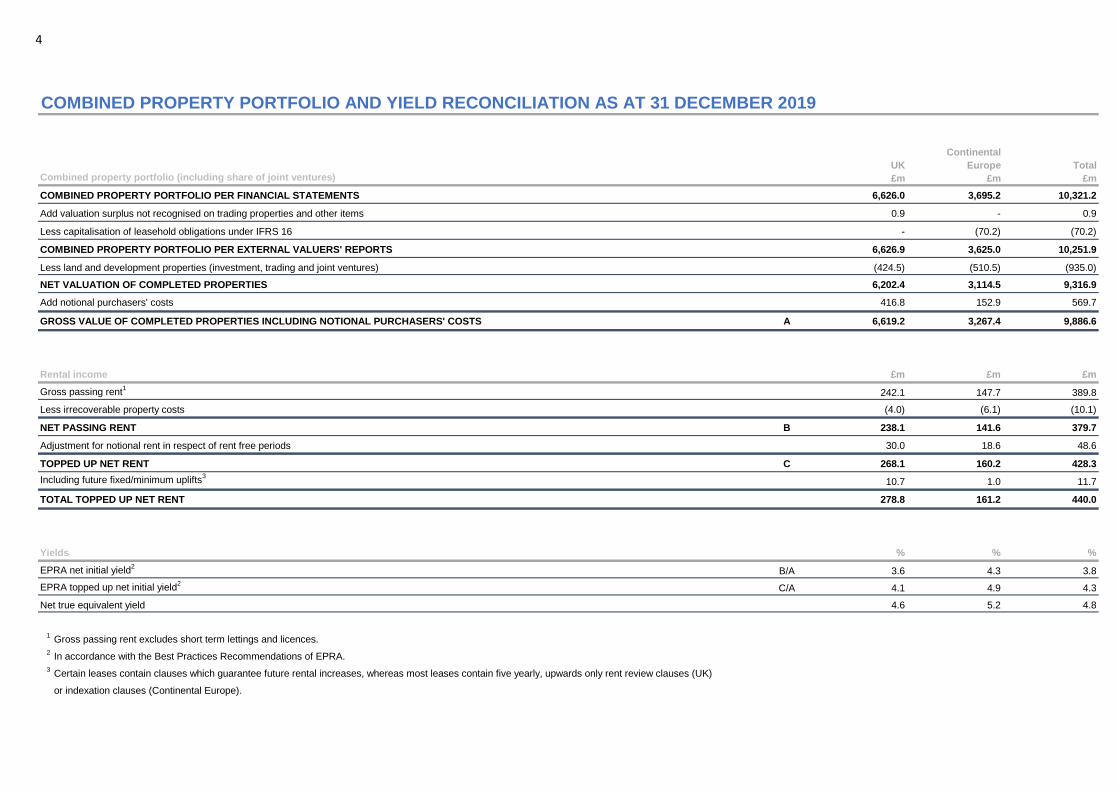
COMBINED PROPERTY PORTFOLIO AND YIELD RECONCILIATION AS AT 31 DECEMBER 2019
Combined property portfolio (including share of joint ventures)
COMBINED PROPERTY PORTFOLIO PER FINANCIAL STATEMENTS 6,626.0 3,695.2 10,321.2
Add valuation surplus not recognised on trading properties and other items 0.9 - 0.9
Less capitalisation of leasehold obligations under IFRS 16 - (70.2) (70.2)
COMBINED PROPERTY PORTFOLIO PER EXTERNAL VALUERS' REPORTS 6,626.9 3,625.0 10,251.9
Less land and development properties (investment, trading and joint ventures) (424.5) (510.5) (935.0)
NET VALUATION OF COMPLETED PROPERTIES 6,202.4 3,114.5 9,316.9
Add notional purchasers' costs 416.8 152.9 569.7
GROSS VALUE OF COMPLETED PROPERTIES INCLUDING NOTIONAL PURCHASERS' COSTS A 6,619.2 3,267.4 9,886.6
Rental income £m £m £m
Gross passing rent1
242.1 147.7 389.8
Less irrecoverable property costs (4.0) (6.1) (10.1)
NET PASSING RENT B 238.1 141.6 379.7
Adjustment for notional rent in respect of rent free periods 30.0 18.6 48.6
TOPPED UP NET RENT C 268.1 160.2 428.3
Including future fixed/minimum uplifts3
10.7 1.0 11.7
TOTAL TOPPED UP NET RENT 278.8 161.2 440.0
Yields % % %
EPRA net initial yield2
B/A 3.6 4.3 3.8
EPRA topped up net initial yield2
C/A 4.1 4.9 4.3
Net true equivalent yield 4.6 5.2 4.8
1Gross passing rent excludes short term lettings and licences.
2In accordance with the Best Practices Recommendations of EPRA.
3Certain leases contain clauses which guarantee future rental increases, whereas most leases contain five yearly, upwards only rent review clauses (UK)
or indexation clauses (Continental Europe).
Total
£m
UK
£m
Continental
Europe
£m
5
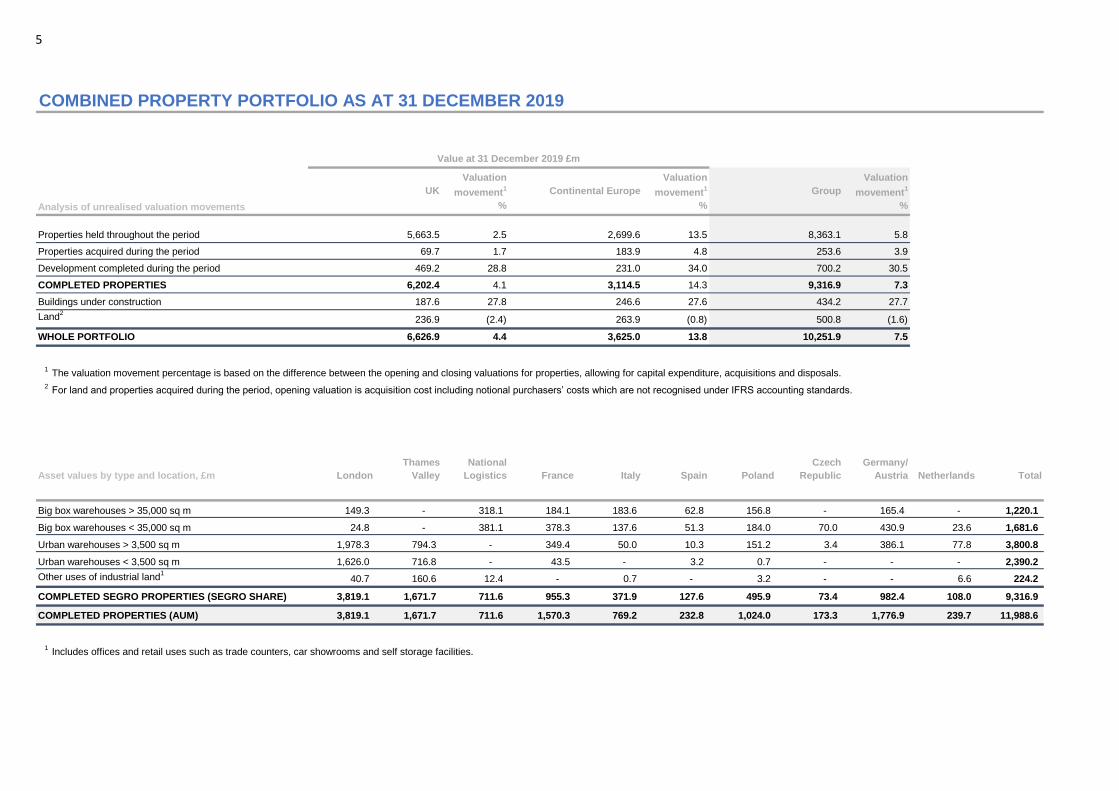
COMBINED PROPERTY PORTFOLIO AS AT 31 DECEMBER 2019
Analysis of unrealised valuation movements
Valuation
movement1
%
Valuation
movement1
%
Valuation
movement1
%
Properties held throughout the period 2.5 13.5 5.8
Properties acquired during the period 1.7 4.8 3.9
Development completed during the period 28.8 34.0 30.5
COMPLETED PROPERTIES 4.1 14.3 7.3
Buildings under construction 27.8 27.6 27.7
Land2
(2.4) (0.8) (1.6)
WHOLE PORTFOLIO 4.4 13.8 7.5
1The valuation movement percentage is based on the difference between the opening and closing valuations for properties, allowing for capital expenditure, acquisitions and disposals.
2For land and properties acquired during the period, opening valuation is acquisition cost including notional purchasers’ costs which are not recognised under IFRS accounting standards.
Asset values by type and location, £m
Big box warehouses > 35,000 sq m 149.3 - 318.1 184.1 183.6 62.8 156.8 - 165.4 - 1,220.1
Big box warehouses < 35,000 sq m 24.8 - 381.1 378.3 137.6 51.3 184.0 70.0 430.9 23.6 1,681.6
Urban warehouses > 3,500 sq m 1,978.3 794.3 - 349.4 50.0 10.3 151.2 3.4 386.1 77.8 3,800.8
Urban warehouses < 3,500 sq m 1,626.0 716.8 - 43.5 - 3.2 0.7 - - - 2,390.2
Other uses of industrial land1
40.7 160.6 12.4 - 0.7 - 3.2 - - 6.6 224.2
COMPLETED SEGRO PROPERTIES (SEGRO SHARE) 3,819.1 1,671.7 711.6 955.3 371.9 127.6 495.9 73.4 982.4 108.0 9,316.9
COMPLETED PROPERTIES (AUM) 3,819.1 1,671.7 711.6 1,570.3 769.2 232.8 1,024.0 173.3 1,776.9 239.7 11,988.6
1Includes offices and retail uses such as trade counters, car showrooms and self storage facilities.
Germany/
Austria Netherlands TotalSpain
236.9 263.9 500.8
6,626.9 3,625.0 10,251.9
London
Thames
Valley
National
Logistics France Italy Poland
Czech
Republic
6,202.4 3,114.5 9,316.9
187.6 246.6 434.2
69.7 183.9 253.6
469.2 231.0 700.2
5,663.5 2,699.6 8,363.1
Value at 31 December 2019 £m
UK Continental Europe Group
6
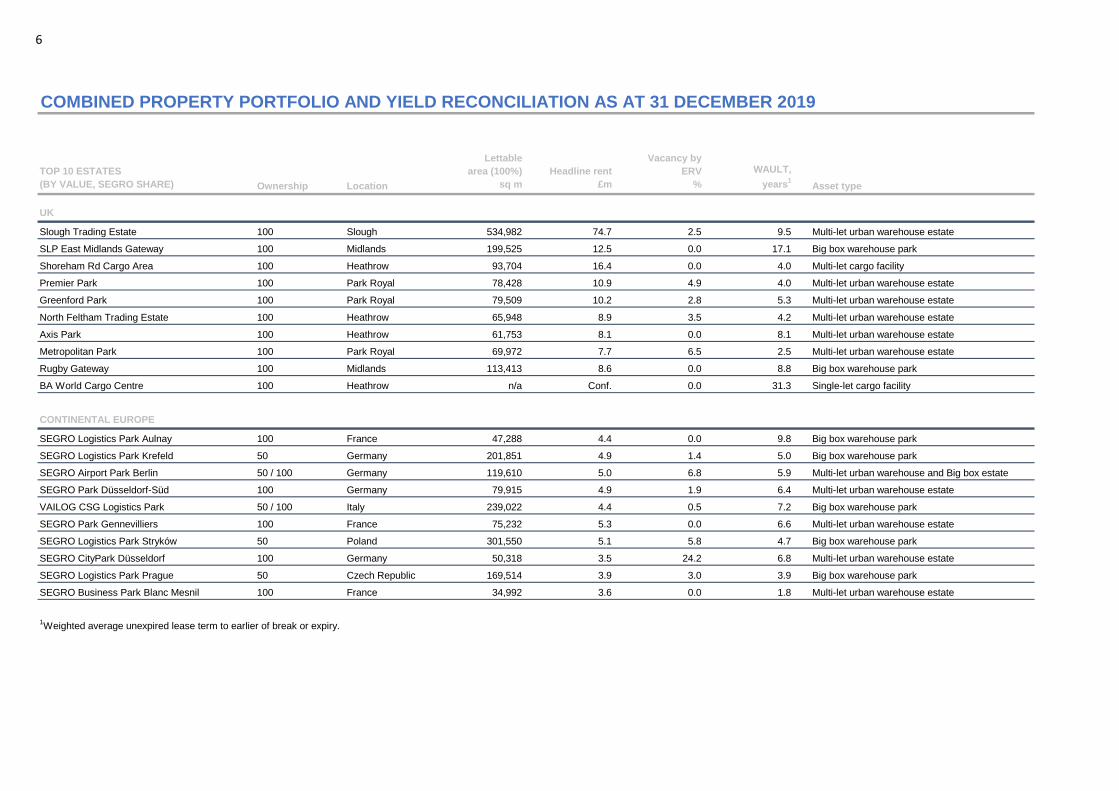
COMBINED PROPERTY PORTFOLIO AND YIELD RECONCILIATION AS AT 31 DECEMBER 2019
TOP 10 ESTATES
(BY VALUE, SEGRO SHARE) Ownership Location
Lettable
area (100%)
sq m
Headline rent
£m
Vacancy by
ERV
%
WAULT,
years1
Asset type
UK
Slough Trading Estate 100 Slough 534,982 74.7 2.5 9.5 Multi-let urban warehouse estate
SLP East Midlands Gateway 100 Midlands 199,525 12.5 0.0 17.1 Big box warehouse park
Shoreham Rd Cargo Area 100 Heathrow 93,704 16.4 0.0 4.0 Multi-let cargo facility
Premier Park 100 Park Royal 78,428 10.9 4.9 4.0 Multi-let urban warehouse estate
Greenford Park 100 Park Royal 79,509 10.2 2.8 5.3 Multi-let urban warehouse estate
North Feltham Trading Estate 100 Heathrow 65,948 8.9 3.5 4.2 Multi-let urban warehouse estate
Axis Park 100 Heathrow 61,753 8.1 0.0 8.1 Multi-let urban warehouse estate
Metropolitan Park 100 Park Royal 69,972 7.7 6.5 2.5 Multi-let urban warehouse estate
Rugby Gateway 100 Midlands 113,413 8.6 0.0 8.8 Big box warehouse park
BA World Cargo Centre 100 Heathrow n/a Conf. 0.0 31.3 Single-let cargo facility
CONTINENTAL EUROPE
SEGRO Logistics Park Aulnay 100 France 47,288 4.4 0.0 9.8 Big box warehouse park
SEGRO Logistics Park Krefeld 50 Germany 201,851 4.9 1.4 5.0 Big box warehouse park
SEGRO Airport Park Berlin 50 / 100 Germany 119,610 5.0 6.8 5.9 Multi-let urban warehouse and Big box estate
SEGRO Park Düsseldorf-Süd 100 Germany 79,915 4.9 1.9 6.4 Multi-let urban warehouse estate
VAILOG CSG Logistics Park 50 / 100 Italy 239,022 4.4 0.5 7.2 Big box warehouse park
SEGRO Park Gennevilliers 100 France 75,232 5.3 0.0 6.6 Multi-let urban warehouse estate
SEGRO Logistics Park Stryków 50 Poland 301,550 5.1 5.8 4.7 Big box warehouse park
SEGRO CityPark Düsseldorf 100 Germany 50,318 3.5 24.2 6.8 Multi-let urban warehouse estate
SEGRO Logistics Park Prague 50 Czech Republic 169,514 3.9 3.0 3.9 Big box warehouse park
SEGRO Business Park Blanc Mesnil 100 France 34,992 3.6 0.0 1.8 Multi-let urban warehouse estate
1Weighted average unexpired lease term to earlier of break or expiry.
7
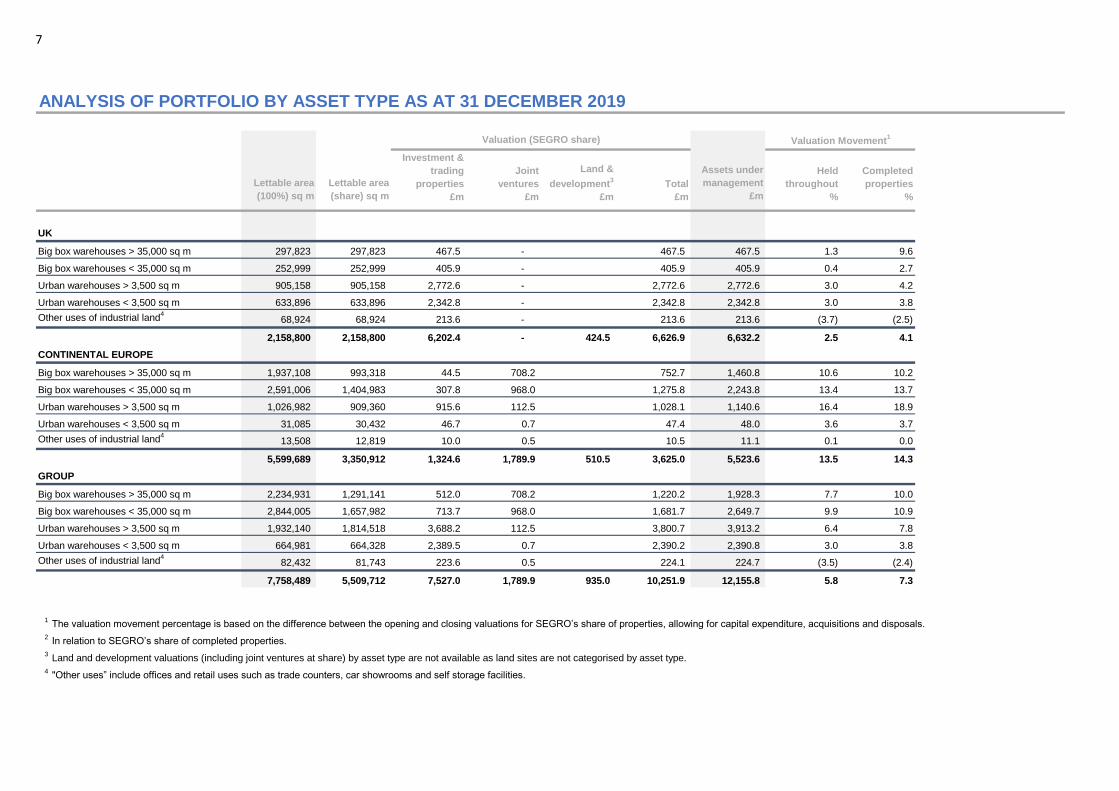
ANALYSIS OF PORTFOLIO BY ASSET TYPE AS AT 31 DECEMBER 2019
Investment &
trading
properties
£m
Joint
ventures
£m
Land &
development3
£m
Total
£m
Held
throughout
%
Completed
properties
%
UK
Big box warehouses > 35,000 sq m 297,823 297,823 467.5 - 467.5 467.5 1.3 9.6
Big box warehouses < 35,000 sq m 252,999 252,999 405.9 - 405.9 405.9 0.4 2.7
Urban warehouses > 3,500 sq m 905,158 905,158 2,772.6 - 2,772.6 2,772.6 3.0 4.2
Urban warehouses < 3,500 sq m 633,896 633,896 2,342.8 - 2,342.8 2,342.8 3.0 3.8
Other uses of industrial land4
68,924 68,924 213.6 - 213.6 213.6 (3.7) (2.5)
2,158,800 2,158,800 6,202.4 - 424.5 6,626.9 6,632.2 2.5 4.1
CONTINENTAL EUROPE
Big box warehouses > 35,000 sq m 1,937,108 993,318 44.5 708.2 752.7 1,460.8 10.6 10.2
Big box warehouses < 35,000 sq m 2,591,006 1,404,983 307.8 968.0 1,275.8 2,243.8 13.4 13.7
Urban warehouses > 3,500 sq m 1,026,982 909,360 915.6 112.5 1,028.1 1,140.6 16.4 18.9
Urban warehouses < 3,500 sq m 31,085 30,432 46.7 0.7 47.4 48.0 3.6 3.7
Other uses of industrial land4
13,508 12,819 10.0 0.5 10.5 11.1 0.1 0.0
5,599,689 3,350,912 1,324.6 1,789.9 510.5 3,625.0 5,523.6 13.5 14.3
GROUP
Big box warehouses > 35,000 sq m 2,234,931 1,291,141 512.0 708.2 1,220.2 1,928.3 7.7 10.0
Big box warehouses < 35,000 sq m 2,844,005 1,657,982 713.7 968.0 1,681.7 2,649.7 9.9 10.9
Urban warehouses > 3,500 sq m 1,932,140 1,814,518 3,688.2 112.5 3,800.7 3,913.2 6.4 7.8
Urban warehouses < 3,500 sq m 664,981 664,328 2,389.5 0.7 2,390.2 2,390.8 3.0 3.8
Other uses of industrial land4
82,432 81,743 223.6 0.5 224.1 224.7 (3.5) (2.4)
7,758,489 5,509,712 7,527.0 1,789.9 935.0 10,251.9 12,155.8 5.8 7.3
1The valuation movement percentage is based on the difference between the opening and closing valuations for SEGRO’s share of properties, allowing for capital expenditure, acquisitions and disposals.
2In relation to SEGRO’s share of completed properties.
3Land and development valuations (including joint ventures at share) by asset type are not available as land sites are not categorised by asset type.
4"Other uses” include offices and retail uses such as trade counters, car showrooms and self storage facilities.
Lettable area
(100%) sq m
Lettable area
(share) sq m
Valuation (SEGRO share)
Assets under
management
£m
Valuation Movement1
8
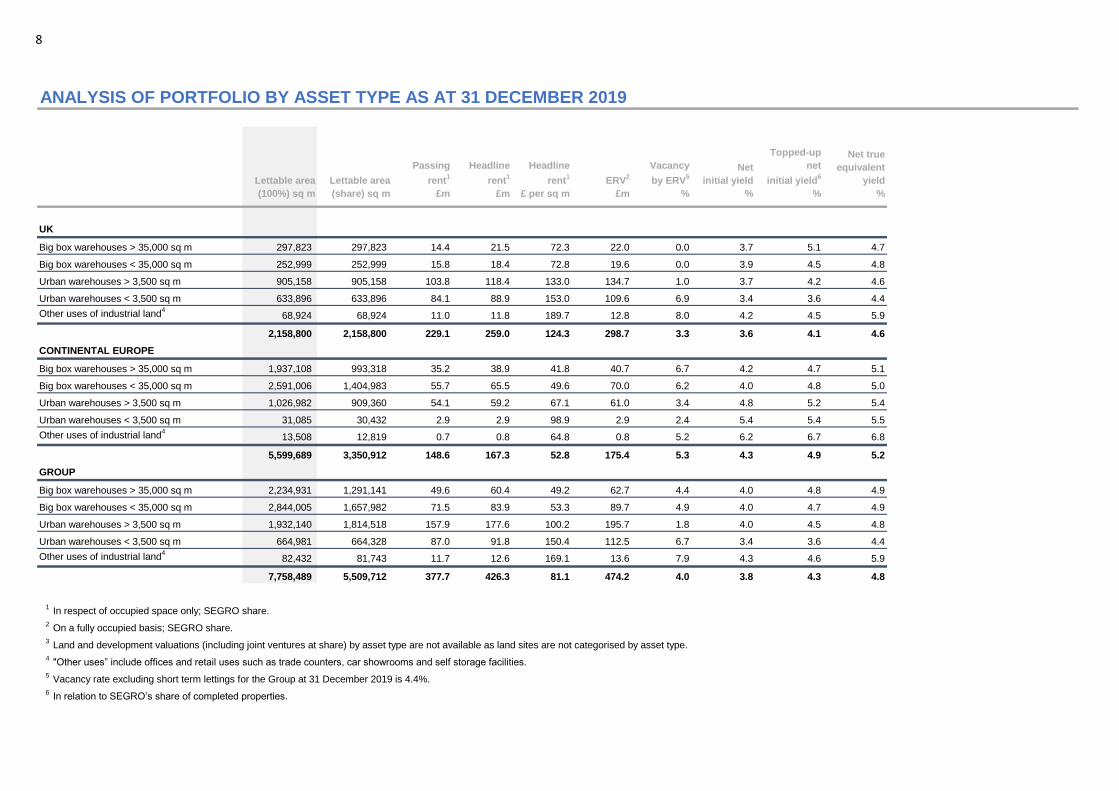
ANALYSIS OF PORTFOLIO BY ASSET TYPE AS AT 31 DECEMBER 2019
UK
Big box warehouses > 35,000 sq m 297,823 297,823 14.4 21.5 72.3 22.0 0.0 3.7 5.1 4.7
Big box warehouses < 35,000 sq m 252,999 252,999 15.8 18.4 72.8 19.6 0.0 3.9 4.5 4.8
Urban warehouses > 3,500 sq m 905,158 905,158 103.8 118.4 133.0 134.7 1.0 3.7 4.2 4.6
Urban warehouses < 3,500 sq m 633,896 633,896 84.1 88.9 153.0 109.6 6.9 3.4 3.6 4.4
Other uses of industrial land4
68,924 68,924 11.0 11.8 189.7 12.8 8.0 4.2 4.5 5.9
2,158,800 2,158,800 229.1 259.0 124.3 298.7 3.3 3.6 4.1 4.6
CONTINENTAL EUROPE
Big box warehouses > 35,000 sq m 1,937,108 993,318 35.2 38.9 41.8 40.7 6.7 4.2 4.7 5.1
Big box warehouses < 35,000 sq m 2,591,006 1,404,983 55.7 65.5 49.6 70.0 6.2 4.0 4.8 5.0
Urban warehouses > 3,500 sq m 1,026,982 909,360 54.1 59.2 67.1 61.0 3.4 4.8 5.2 5.4
Urban warehouses < 3,500 sq m 31,085 30,432 2.9 2.9 98.9 2.9 2.4 5.4 5.4 5.5
Other uses of industrial land4
13,508 12,819 0.7 0.8 64.8 0.8 5.2 6.2 6.7 6.8
5,599,689 3,350,912 148.6 167.3 52.8 175.4 5.3 4.3 4.9 5.2
GROUP
Big box warehouses > 35,000 sq m 2,234,931 1,291,141 49.6 60.4 49.2 62.7 4.4 4.0 4.8 4.9
Big box warehouses < 35,000 sq m 2,844,005 1,657,982 71.5 83.9 53.3 89.7 4.9 4.0 4.7 4.9
Urban warehouses > 3,500 sq m 1,932,140 1,814,518 157.9 177.6 100.2 195.7 1.8 4.0 4.5 4.8
Urban warehouses < 3,500 sq m 664,981 664,328 87.0 91.8 150.4 112.5 6.7 3.4 3.6 4.4
Other uses of industrial land4
82,432 81,743 11.7 12.6 169.1 13.6 7.9 4.3 4.6 5.9
7,758,489 5,509,712 377.7 426.3 81.1 474.2 4.0 3.8 4.3 4.8
1In respect of occupied space only; SEGRO share.
2On a fully occupied basis; SEGRO share.
3Land and development valuations (including joint ventures at share) by asset type are not available as land sites are not categorised by asset type.
4"Other uses” include offices and retail uses such as trade counters, car showrooms and self storage facilities.
5Vacancy rate excluding short term lettings for the Group at 31 December 2019 is 4.4%.
6In relation to SEGRO’s share of completed properties.
Net
initial yield
%
Topped-up
net
initial yield6
%
Net true
equivalent
yield
%
Lettable area
(100%) sq m
Lettable area
(share) sq m
Vacancy
by ERV5
%
Passing
rent1
£m
Headline
rent1
£m
Headline
rent1
£ per sq m
ERV2
£m
9
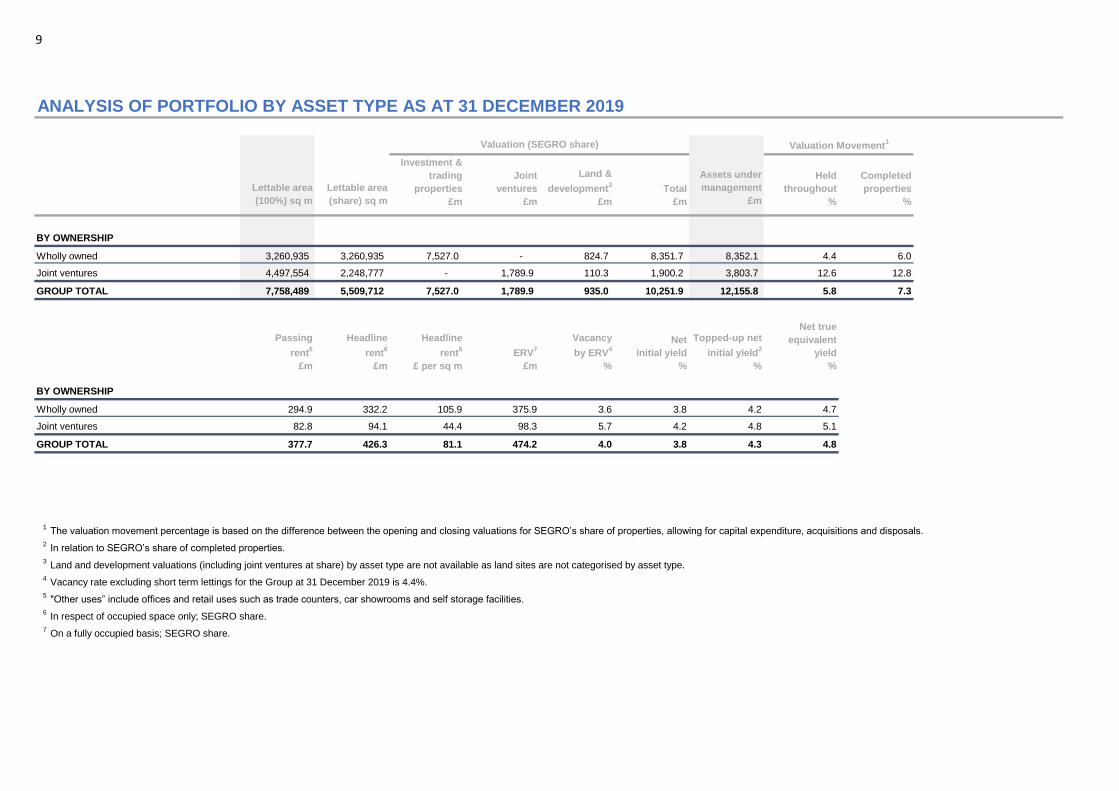
ANALYSIS OF PORTFOLIO BY ASSET TYPE AS AT 31 DECEMBER 2019
Investment &
trading
properties
£m
Joint
ventures
£m
Land &
development3
£m
Total
£m
Held
throughout
%
Completed
properties
%
BY OWNERSHIP
Wholly owned 3,260,935 3,260,935 7,527.0 - 824.7 8,351.7 8,352.1 4.4 6.0
Joint ventures 4,497,554 2,248,777 - 1,789.9 110.3 1,900.2 3,803.7 12.6 12.8
GROUP TOTAL 7,758,489 5,509,712 7,527.0 1,789.9 935.0 10,251.9 12,155.8 5.8 7.3
BY OWNERSHIP
Wholly owned 294.9 332.2 105.9 375.9 3.6 3.8 4.2 4.7
Joint ventures 82.8 94.1 44.4 98.3 5.7 4.2 4.8 5.1
GROUP TOTAL 377.7 426.3 81.1 474.2 4.0 3.8 4.3 4.8
1The valuation movement percentage is based on the difference between the opening and closing valuations for SEGRO’s share of properties, allowing for capital expenditure, acquisitions and disposals.
2In relation to SEGRO’s share of completed properties.
3Land and development valuations (including joint ventures at share) by asset type are not available as land sites are not categorised by asset type.
4Vacancy rate excluding short term lettings for the Group at 31 December 2019 is 4.4%.
5"Other uses” include offices and retail uses such as trade counters, car showrooms and self storage facilities.
6In respect of occupied space only; SEGRO share.
7On a fully occupied basis; SEGRO share.
Net
initial yield
%
Topped-up net
initial yield2
%
Net true
equivalent
yield
%
Headline
rent6
£m
Headline
rent6
£ per sq m
ERV7
£m
Vacancy
by ERV4
%
Passing
rent6
£m
Lettable area
(100%) sq m
Lettable area
(share) sq m
Valuation (SEGRO share)
Assets under
management
£m
Valuation Movement1
10
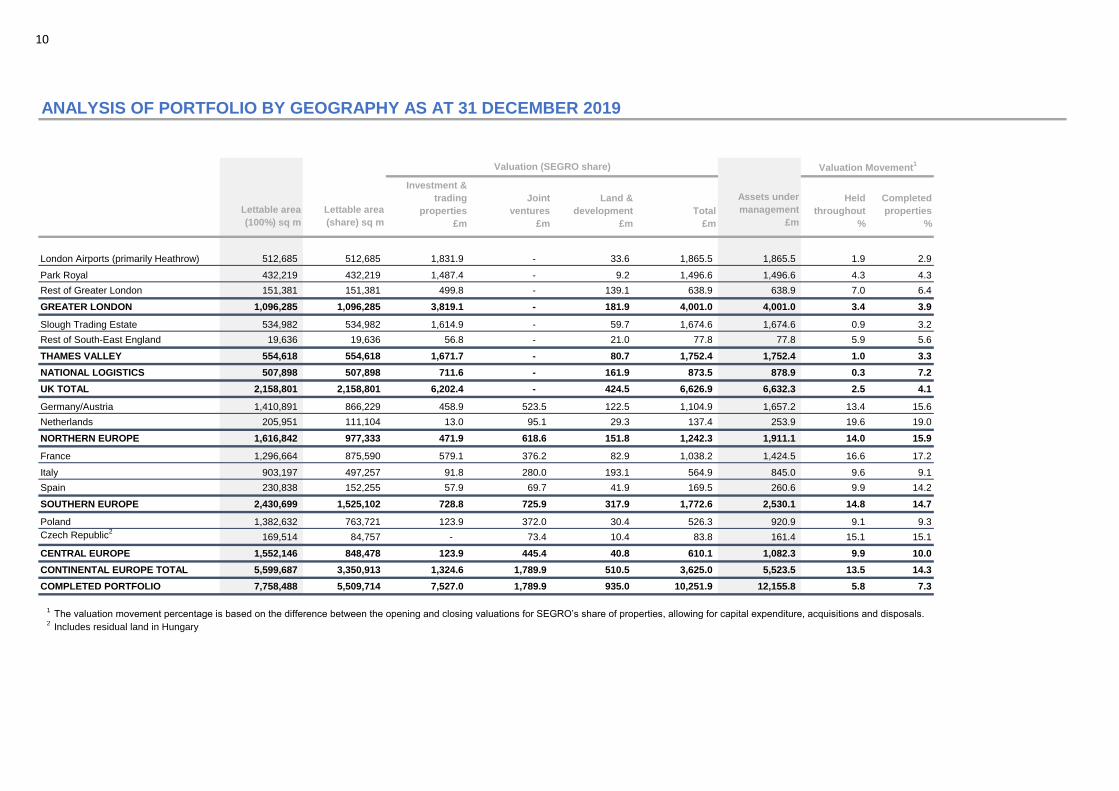
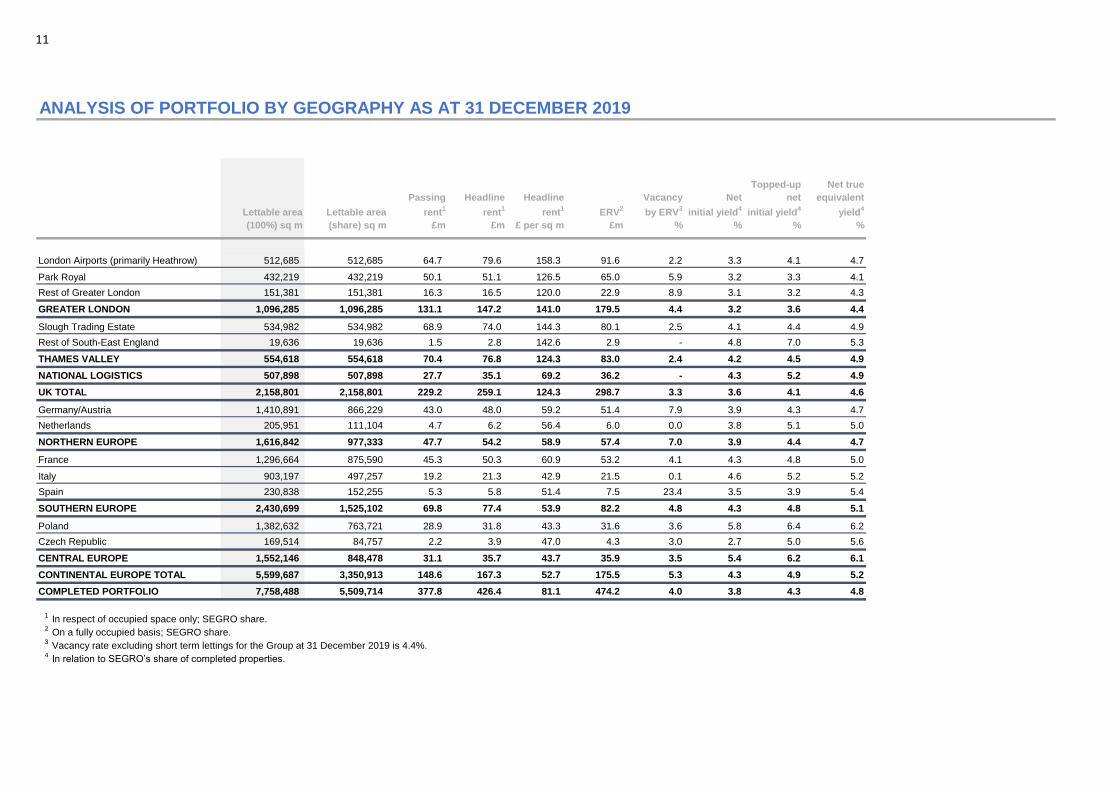
ANALYSIS OF PORTFOLIO BY GEOGRAPHY AS AT 31 DECEMBER 2019
Investment &
trading
properties
£m
Joint
ventures
£m
Land &
development
£m
Total
£m
Held
throughout
%
Completed
properties
%
London Airports (primarily Heathrow) 512,685 512,685 1,831.9 - 33.6 1,865.5 1,865.5 1.9 2.9
Park Royal 432,219 432,219 1,487.4 - 9.2 1,496.6 1,496.6 4.3 4.3
Rest of Greater London 151,381 151,381 499.8 - 139.1 638.9 638.9 7.0 6.4
GREATER LONDON 1,096,285 1,096,285 3,819.1 - 181.9 4,001.0 4,001.0 3.4 3.9
Slough Trading Estate 534,982 534,982 1,614.9 - 59.7 1,674.6 1,674.6 0.9 3.2
Rest of South-East England 19,636 19,636 56.8 - 21.0 77.8 77.8 5.9 5.6
THAMES VALLEY 554,618 554,618 1,671.7 - 80.7 1,752.4 1,752.4 1.0 3.3
NATIONAL LOGISTICS 507,898 507,898 711.6 - 161.9 873.5 878.9 0.3 7.2
UK TOTAL 2,158,801 2,158,801 6,202.4 - 424.5 6,626.9 6,632.3 2.5 4.1
Germany/Austria 1,410,891 866,229 458.9 523.5 122.5 1,104.9 1,657.2 13.4 15.6
Netherlands 205,951 111,104 13.0 95.1 29.3 137.4 253.9 19.6 19.0
NORTHERN EUROPE 1,616,842 977,333 471.9 618.6 151.8 1,242.3 1,911.1 14.0 15.9
France 1,296,664 875,590 579.1 376.2 82.9 1,038.2 1,424.5 16.6 17.2
Italy 903,197 497,257 91.8 280.0 193.1 564.9 845.0 9.6 9.1
Spain 230,838 152,255 57.9 69.7 41.9 169.5 260.6 9.9 14.2
SOUTHERN EUROPE 2,430,699 1,525,102 728.8 725.9 317.9 1,772.6 2,530.1 14.8 14.7
Poland 1,382,632 763,721 123.9 372.0 30.4 526.3 920.9 9.1 9.3
Czech Republic2
169,514 84,757 - 73.4 10.4 83.8 161.4 15.1 15.1
CENTRAL EUROPE 1,552,146 848,478 123.9 445.4 40.8 610.1 1,082.3 9.9 10.0
CONTINENTAL EUROPE TOTAL 5,599,687 3,350,913 1,324.6 1,789.9 510.5 3,625.0 5,523.5 13.5 14.3
COMPLETED PORTFOLIO 7,758,488 5,509,714 7,527.0 1,789.9 935.0 10,251.9 12,155.8 5.8 7.3
1The valuation movement percentage is based on the difference between the opening and closing valuations for SEGRO’s share of properties, allowing for capital expenditure, acquisitions and disposals.
2Includes residual land in Hungary
Lettable area
(100%) sq m
Lettable area
(share) sq m
Valuation (SEGRO share)
Assets under
management
£m
Valuation Movement1
11
ANALYSIS OF PORTFOLIO BY GEOGRAPHY AS AT 31 DECEMBER 2019
London Airports (primarily Heathrow) 512,685 512,685 64.7 79.6 158.3 91.6 2.2 3.3 4.1 4.7
Park Royal 432,219 432,219 50.1 51.1 126.5 65.0 5.9 3.2 3.3 4.1
Rest of Greater London 151,381 151,381 16.3 16.5 120.0 22.9 8.9 3.1 3.2 4.3
GREATER LONDON 1,096,285 1,096,285 131.1 147.2 141.0 179.5 4.4 3.2 3.6 4.4
Slough Trading Estate 534,982 534,982 68.9 74.0 144.3 80.1 2.5 4.1 4.4 4.9
Rest of South-East England 19,636 19,636 1.5 2.8 142.6 2.9 - 4.8 7.0 5.3
THAMES VALLEY 554,618 554,618 70.4 76.8 124.3 83.0 2.4 4.2 4.5 4.9
NATIONAL LOGISTICS 507,898 507,898 27.7 35.1 69.2 36.2 - 4.3 5.2 4.9
UK TOTAL 2,158,801 2,158,801 229.2 259.1 124.3 298.7 3.3 3.6 4.1 4.6
Germany/Austria 1,410,891 866,229 43.0 48.0 59.2 51.4 7.9 3.9 4.3 4.7
Netherlands 205,951 111,104 4.7 6.2 56.4 6.0 0.0 3.8 5.1 5.0
NORTHERN EUROPE 1,616,842 977,333 47.7 54.2 58.9 57.4 7.0 3.9 4.4 4.7
France 1,296,664 875,590 45.3 50.3 60.9 53.2 4.1 4.3 4.8 5.0
Italy 903,197 497,257 19.2 21.3 42.9 21.5 0.1 4.6 5.2 5.2
Spain 230,838 152,255 5.3 5.8 51.4 7.5 23.4 3.5 3.9 5.4
SOUTHERN EUROPE 2,430,699 1,525,102 69.8 77.4 53.9 82.2 4.8 4.3 4.8 5.1
Poland 1,382,632 763,721 28.9 31.8 43.3 31.6 3.6 5.8 6.4 6.2
Czech Republic 169,514 84,757 2.2 3.9 47.0 4.3 3.0 2.7 5.0 5.6
CENTRAL EUROPE 1,552,146 848,478 31.1 35.7 43.7 35.9 3.5 5.4 6.2 6.1
CONTINENTAL EUROPE TOTAL 5,599,687 3,350,913 148.6 167.3 52.7 175.5 5.3 4.3 4.9 5.2
COMPLETED PORTFOLIO 7,758,488 5,509,714 377.8 426.4 81.1 474.2 4.0 3.8 4.3 4.8
1In respect of occupied space only; SEGRO share.
2On a fully occupied basis; SEGRO share.
3Vacancy rate excluding short term lettings for the Group at 31 December 2019 is 4.4%.
4In relation to SEGRO’s share of completed properties.
Net
initial yield4
%
Topped-up
net
initial yield4
%
Net true
equivalent
yield4
%
Lettable area
(100%) sq m
Lettable area
(share) sq m
Vacancy
by ERV3
%
Passing
rent1
£m
Headline
rent1
£m
Headline
rent1
£ per sq m
ERV2
£m
12
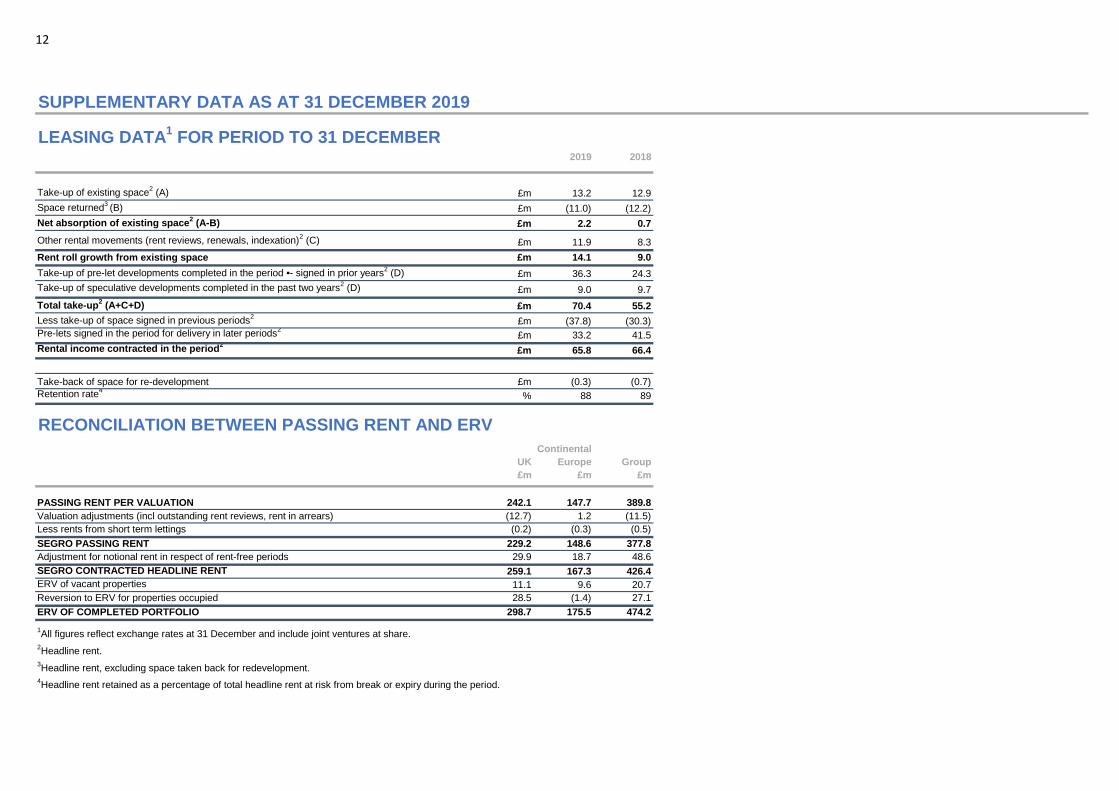
SUPPLEMENTARY DATA AS AT 31 DECEMBER 2019
LEASING DATA1 FOR PERIOD TO 31 DECEMBER
2019 2018
Take-up of existing space2 (A) £m 13.2 12.9
Space returned3 (B) £m (11.0) (12.2)
Net absorption of existing space2 (A-B) £m 2.2 0.7
Other rental movements (rent reviews, renewals, indexation)2 (C) £m 11.9 8.3
Rent roll growth from existing space £m 14.1 9.0
Take-up of pre-let developments completed in the period •-- signed in prior years2 (D) £m 36.3 24.3
Take-up of speculative developments completed in the past two years2 (D) £m 9.0 9.7
Total take-up2 (A+C+D) £m 70.4 55.2
Less take-up of space signed in previous periods2
£m (37.8) (30.3)
Pre-lets signed in the period for delivery in later periods2
£m 33.2 41.5
Rental income contracted in the period2
£m 65.8 66.4
Take-back of space for re-development £m (0.3) (0.7)
Retention rate4
% 88 89
RECONCILIATION BETWEEN PASSING RENT AND ERV
PASSING RENT PER VALUATION 242.1 147.7 389.8
Valuation adjustments (incl outstanding rent reviews, rent in arrears) (12.7) 1.2 (11.5)
Less rents from short term lettings (0.2) (0.3) (0.5)
SEGRO PASSING RENT 229.2 148.6 377.8
Adjustment for notional rent in respect of rent-free periods 29.9 18.7 48.6
SEGRO CONTRACTED HEADLINE RENT 259.1 167.3 426.4
ERV of vacant properties 11.1 9.6 20.7
Reversion to ERV for properties occupied 28.5 (1.4) 27.1
ERV OF COMPLETED PORTFOLIO 298.7 175.5 474.2
1All figures reflect exchange rates at 31 December and include joint ventures at share.
2Headline rent.
3Headline rent, excluding space taken back for redevelopment.
4Headline rent retained as a percentage of total headline rent at risk from break or expiry during the period.
UK
£m
Continental
Europe
£m
Group
£m
13
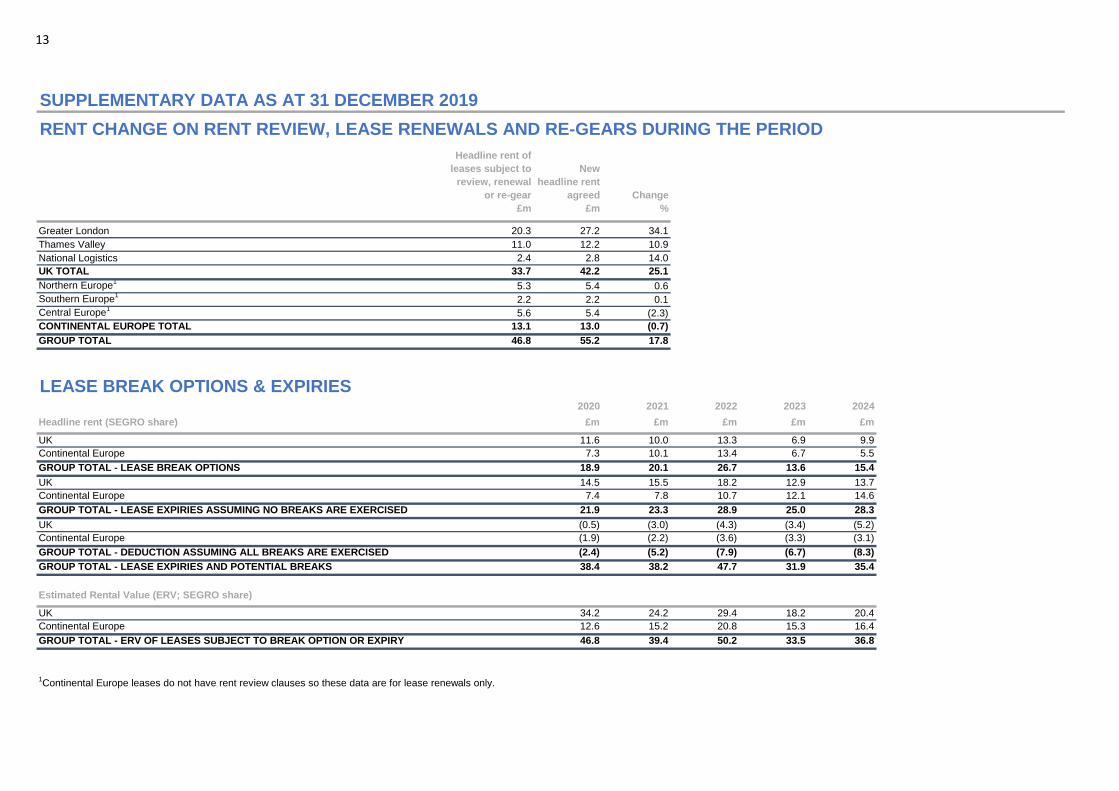
SUPPLEMENTARY DATA AS AT 31 DECEMBER 2019
RENT CHANGE ON RENT REVIEW, LEASE RENEWALS AND RE-GEARS DURING THE PERIOD
Greater London 20.3 27.2 34.1
Thames Valley 11.0 12.2 10.9
National Logistics 2.4 2.8 14.0
UK TOTAL 33.7 42.2 25.1
Northern Europe1
5.3 5.4 0.6
Southern Europe1
2.2 2.2 0.1
Central Europe1
5.6 5.4 (2.3)
CONTINENTAL EUROPE TOTAL 13.1 13.0 (0.7)
GROUP TOTAL 46.8 55.2 17.8
LEASE BREAK OPTIONS & EXPIRIES2020 2021 2022 2023 2024
Headline rent (SEGRO share) £m £m £m £m £m
UK 11.6 10.0 13.3 6.9 9.9
Continental Europe 7.3 10.1 13.4 6.7 5.5
GROUP TOTAL - LEASE BREAK OPTIONS 18.9 20.1 26.7 13.6 15.4
UK 14.5 15.5 18.2 12.9 13.7
Continental Europe 7.4 7.8 10.7 12.1 14.6
GROUP TOTAL - LEASE EXPIRIES ASSUMING NO BREAKS ARE EXERCISED 21.9 23.3 28.9 25.0 28.3
UK (0.5) (3.0) (4.3) (3.4) (5.2)
Continental Europe (1.9) (2.2) (3.6) (3.3) (3.1)
GROUP TOTAL - DEDUCTION ASSUMING ALL BREAKS ARE EXERCISED (2.4) (5.2) (7.9) (6.7) (8.3)
GROUP TOTAL - LEASE EXPIRIES AND POTENTIAL BREAKS 38.4 38.2 47.7 31.9 35.4
Estimated Rental Value (ERV; SEGRO share)
UK 34.2 24.2 29.4 18.2 20.4
Continental Europe 12.6 15.2 20.8 15.3 16.4
GROUP TOTAL - ERV OF LEASES SUBJECT TO BREAK OPTION OR EXPIRY 46.8 39.4 50.2 33.5 36.8
1Continental Europe leases do not have rent review clauses so these data are for lease renewals only.
Headline rent of
leases subject to
review, renewal
or re-gear
£m
New
headline rent
agreed
£m
Change
%
14
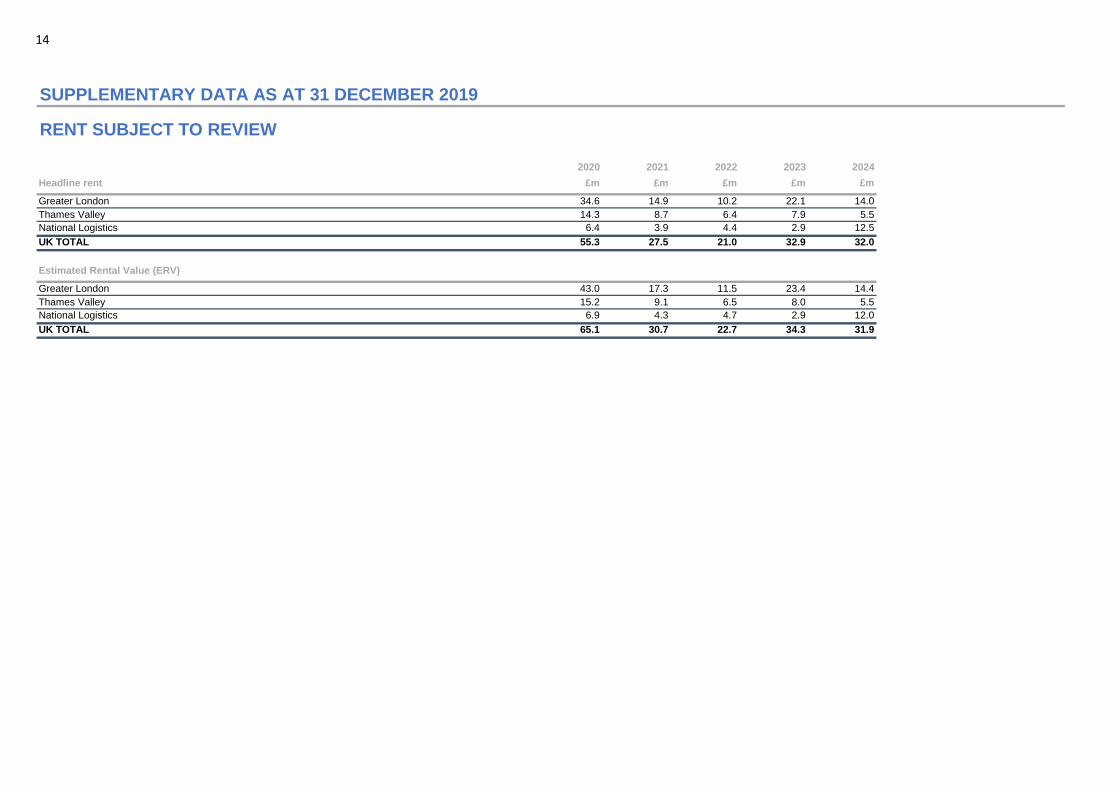
SUPPLEMENTARY DATA AS AT 31 DECEMBER 2019
RENT SUBJECT TO REVIEW
2020 2021 2022 2023 2024
Headline rent £m £m £m £m £m
Greater London 34.6 14.9 10.2 22.1 14.0
Thames Valley 14.3 8.7 6.4 7.9 5.5
National Logistics 6.4 3.9 4.4 2.9 12.5
UK TOTAL 55.3 27.5 21.0 32.9 32.0
Estimated Rental Value (ERV)
Greater London 43.0 17.3 11.5 23.4 14.4
Thames Valley 15.2 9.1 6.5 8.0 5.5
National Logistics 6.9 4.3 4.7 2.9 12.0
UK TOTAL 65.1 30.7 22.7 34.3 31.9
15
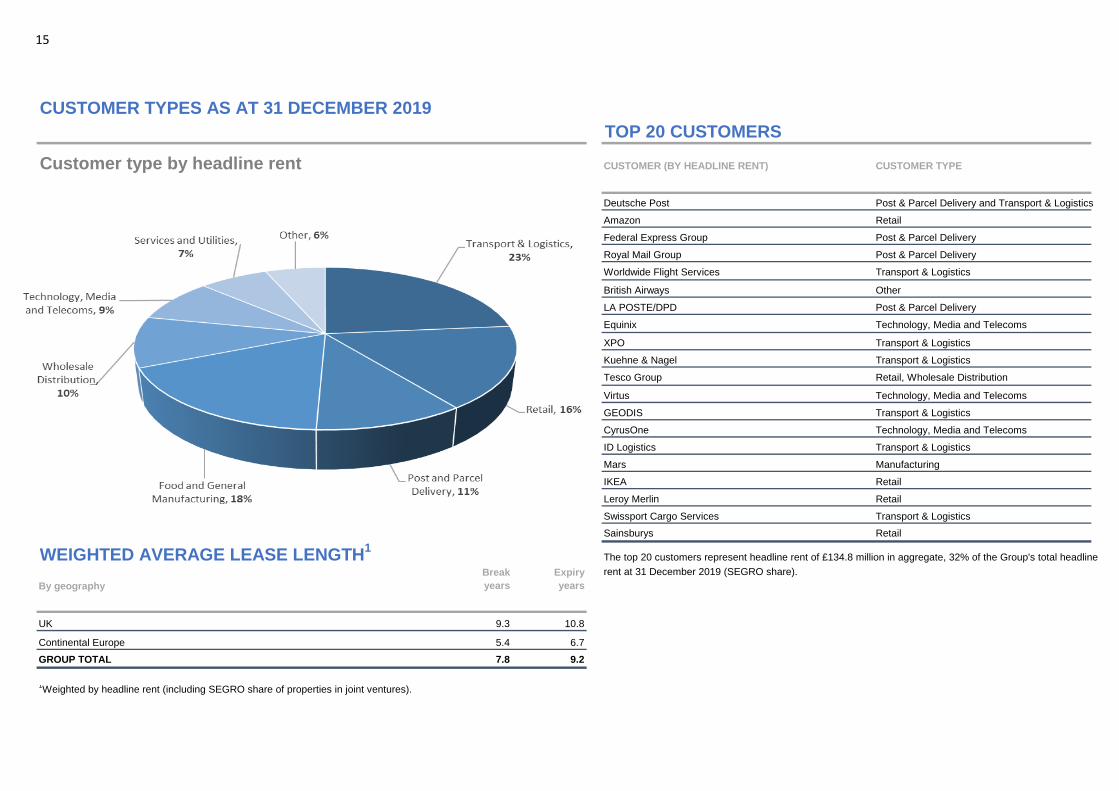
CUSTOMER TYPES AS AT 31 DECEMBER 2019
TOP 20 CUSTOMERS
Customer type by headline rent CUSTOMER (BY HEADLINE RENT) CUSTOMER TYPE
Deutsche Post Post & Parcel Delivery and Transport & Logistics
Amazon Retail
Federal Express Group Post & Parcel Delivery
Royal Mail Group Post & Parcel Delivery
Worldwide Flight Services Transport & Logistics
British Airways Other
LA POSTE/DPD Post & Parcel Delivery
Equinix Technology, Media and Telecoms
XPO Transport & Logistics
Kuehne & Nagel Transport & Logistics
Tesco Group Retail, Wholesale Distribution
Virtus Technology, Media and Telecoms
GEODIS Transport & Logistics
CyrusOne Technology, Media and Telecoms
ID Logistics Transport & Logistics
Mars Manufacturing
IKEA Retail
Leroy Merlin Retail
Swissport Cargo Services Transport & Logistics
Sainsburys Retail
WEIGHTED AVERAGE LEASE LENGTH1
The top 20 customers represent headline rent of £134.8 million in aggregate, 32% of the Group's total headline
By geography
Break
years
Expiry
years
rent at 31 December 2019 (SEGRO share).
UK 9.3 10.8
Continental Europe 5.4 6.7
GROUP TOTAL 7.8 9.2
1Weighted by headline rent (including SEGRO share of properties in joint ventures).
16
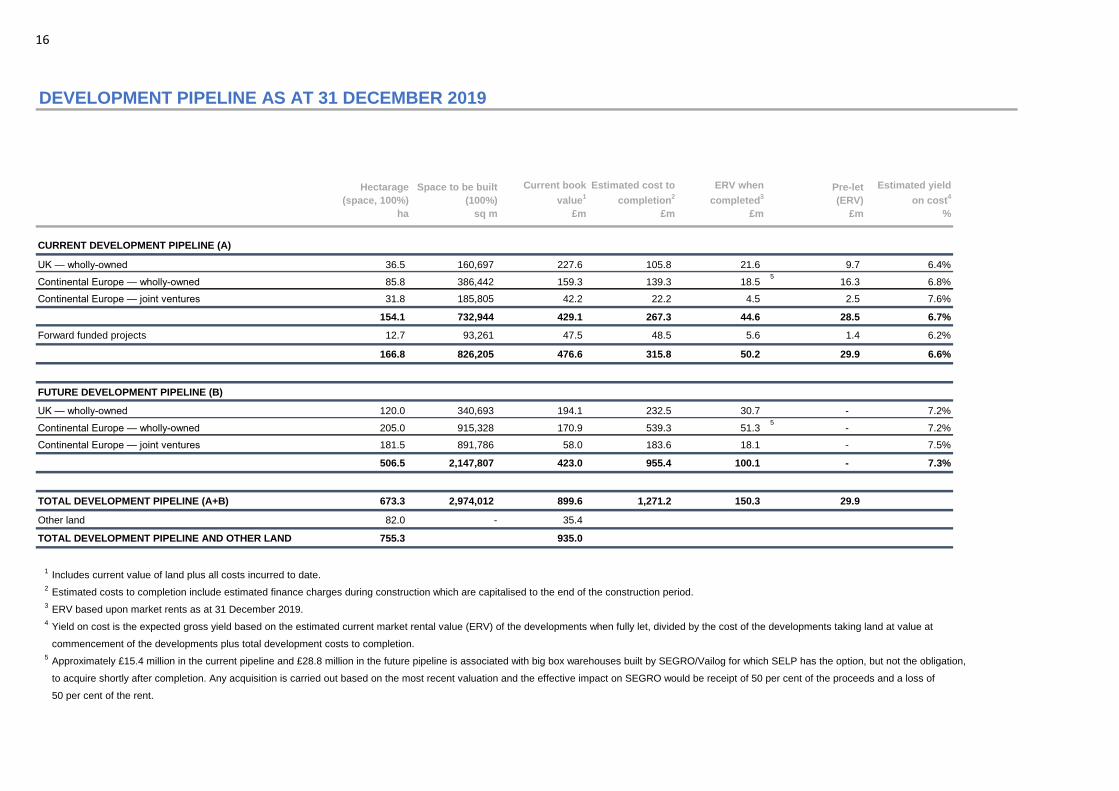
DEVELOPMENT PIPELINE AS AT 31 DECEMBER 2019
Hectarage
(space, 100%)
ha
Space to be built
(100%)
sq m
Current book
value1
£m
Estimated cost to
completion2
£m
ERV when
completed3
£m
Pre-let
(ERV)
£m
Estimated yield
on cost4
%
CURRENT DEVELOPMENT PIPELINE (A)
UK — wholly-owned 36.5 160,697 227.6 105.8 21.6 9.7 6.4%
Continental Europe — wholly-owned 85.8 386,442 159.3 139.3 18.5 5
16.3 6.8%
Continental Europe — joint ventures 31.8 185,805 42.2 22.2 4.5 2.5 7.6%
154.1 732,944 429.1 267.3 44.6 28.5 6.7%
Forward funded projects 12.7 93,261 47.5 48.5 5.6 1.4 6.2%
166.8 826,205 476.6 315.8 50.2 29.9 6.6%
FUTURE DEVELOPMENT PIPELINE (B)
UK — wholly-owned 120.0 340,693 194.1 232.5 30.7 - 7.2%
Continental Europe — wholly-owned 205.0 915,328 170.9 539.3 51.3 5
- 7.2%
Continental Europe — joint ventures 181.5 891,786 58.0 183.6 18.1 - 7.5%
506.5 2,147,807 423.0 955.4 100.1 - 7.3%
TOTAL DEVELOPMENT PIPELINE (A+B) 673.3 2,974,012 899.6 1,271.2 150.3 29.9
Other land 82.0 - 35.4
TOTAL DEVELOPMENT PIPELINE AND OTHER LAND 755.3 935.0
1Includes current value of land plus all costs incurred to date.
2Estimated costs to completion include estimated finance charges during construction which are capitalised to the end of the construction period.
3ERV based upon market rents as at 31 December 2019.
4Yield on cost is the expected gross yield based on the estimated current market rental value (ERV) of the developments when fully let, divided by the cost of the developments taking land at value at
commencement of the developments plus total development costs to completion.
5Approximately £15.4 million in the current pipeline and £28.8 million in the future pipeline is associated with big box warehouses built by SEGRO/Vailog for which SELP has the option, but not the obligation,
to acquire shortly after completion. Any acquisition is carried out based on the most recent valuation and the effective impact on SEGRO would be receipt of 50 per cent of the proceeds and a loss of
50 per cent of the rent.
17
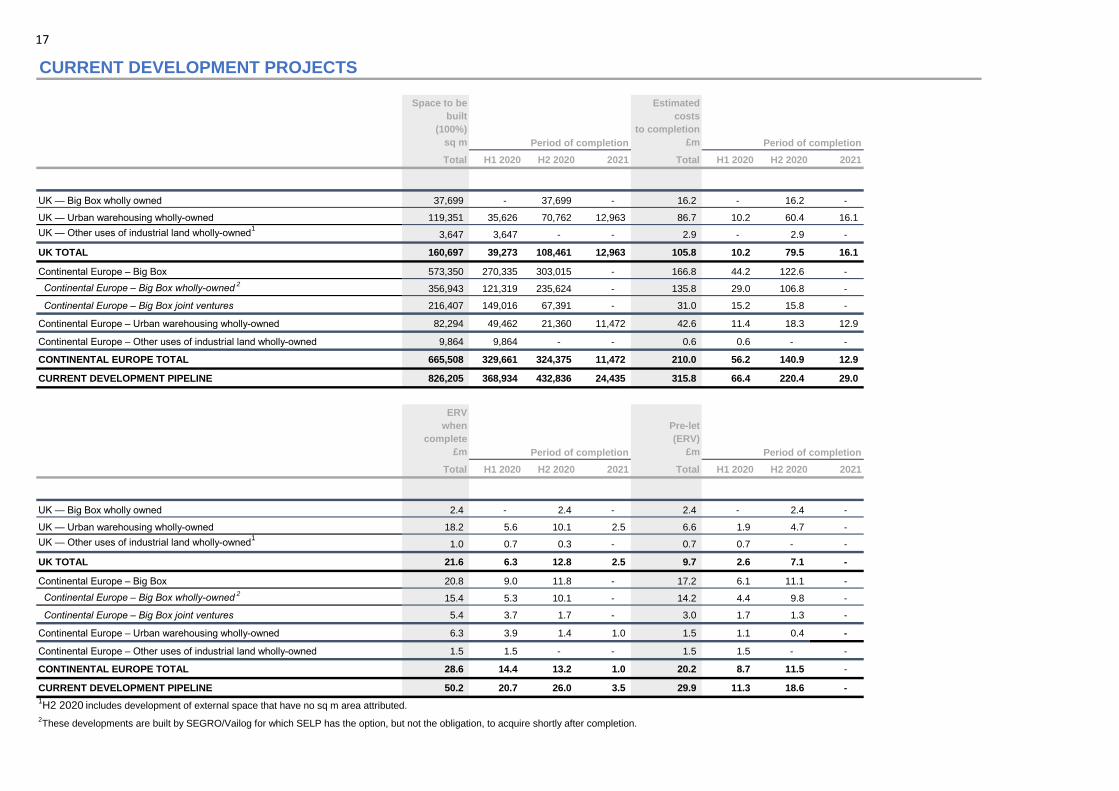
CURRENT DEVELOPMENT PROJECTS
Space to be
built
(100%)
sq m Period of completion
Estimated
costs
to completion
£m Period of completion
Total H1 2020 H2 2020 2021 Total H1 2020 H2 2020 2021
UK — Big Box wholly owned 37,699 - 37,699 - 16.2 - 16.2 -
UK — Urban warehousing wholly-owned 119,351 35,626 70,762 12,963 86.7 10.2 60.4 16.1
UK — Other uses of industrial land wholly-owned1
3,647 3,647 - - 2.9 - 2.9 -
UK TOTAL 160,697 39,273 108,461 12,963 105.8 10.2 79.5 16.1
Continental Europe – Big Box 573,350 270,335 303,015 - 166.8 44.2 122.6 -
Continental Europe – Big Box wholly-owned2
356,943 121,319 235,624 - 135.8 29.0 106.8 -
Continental Europe – Big Box joint ventures 216,407 149,016 67,391 - 31.0 15.2 15.8 -
Continental Europe – Urban warehousing wholly-owned 82,294 49,462 21,360 11,472 42.6 11.4 18.3 12.9
Continental Europe – Other uses of industrial land wholly-owned 9,864 9,864 - - 0.6 0.6 - -
CONTINENTAL EUROPE TOTAL 665,508 329,661 324,375 11,472 210.0 56.2 140.9 12.9
CURRENT DEVELOPMENT PIPELINE 826,205 368,934 432,836 24,435 315.8 66.4 220.4 29.0
ERV
when
complete
£m Period of completion
Pre-let
(ERV)
£m Period of completion
Total H1 2020 H2 2020 2021 Total H1 2020 H2 2020 2021
UK — Big Box wholly owned 2.4 - 2.4 - 2.4 - 2.4 -
UK — Urban warehousing wholly-owned 18.2 5.6 10.1 2.5 6.6 1.9 4.7 -
UK — Other uses of industrial land wholly-owned1
1.0 0.7 0.3 - 0.7 0.7 - -
UK TOTAL 21.6 6.3 12.8 2.5 9.7 2.6 7.1 -
Continental Europe – Big Box 20.8 9.0 11.8 - 17.2 6.1 11.1 -
Continental Europe – Big Box wholly-owned2
15.4 5.3 10.1 - 14.2 4.4 9.8 -
Continental Europe – Big Box joint ventures 5.4 3.7 1.7 - 3.0 1.7 1.3 -
Continental Europe – Urban warehousing wholly-owned 6.3 3.9 1.4 1.0 1.5 1.1 0.4 -
Continental Europe – Other uses of industrial land wholly-owned 1.5 1.5 - - 1.5 1.5 - -
CONTINENTAL EUROPE TOTAL 28.6 14.4 13.2 1.0 20.2 8.7 11.5 -
CURRENT DEVELOPMENT PIPELINE 50.2 20.7 26.0 3.5 29.9 11.3 18.6 -
1H2 2020
includes development of external space that have no sq m area attributed.
2These developments are built by SEGRO/Vailog for which SELP has the option, but not the obligation, to acquire shortly after completion.
18
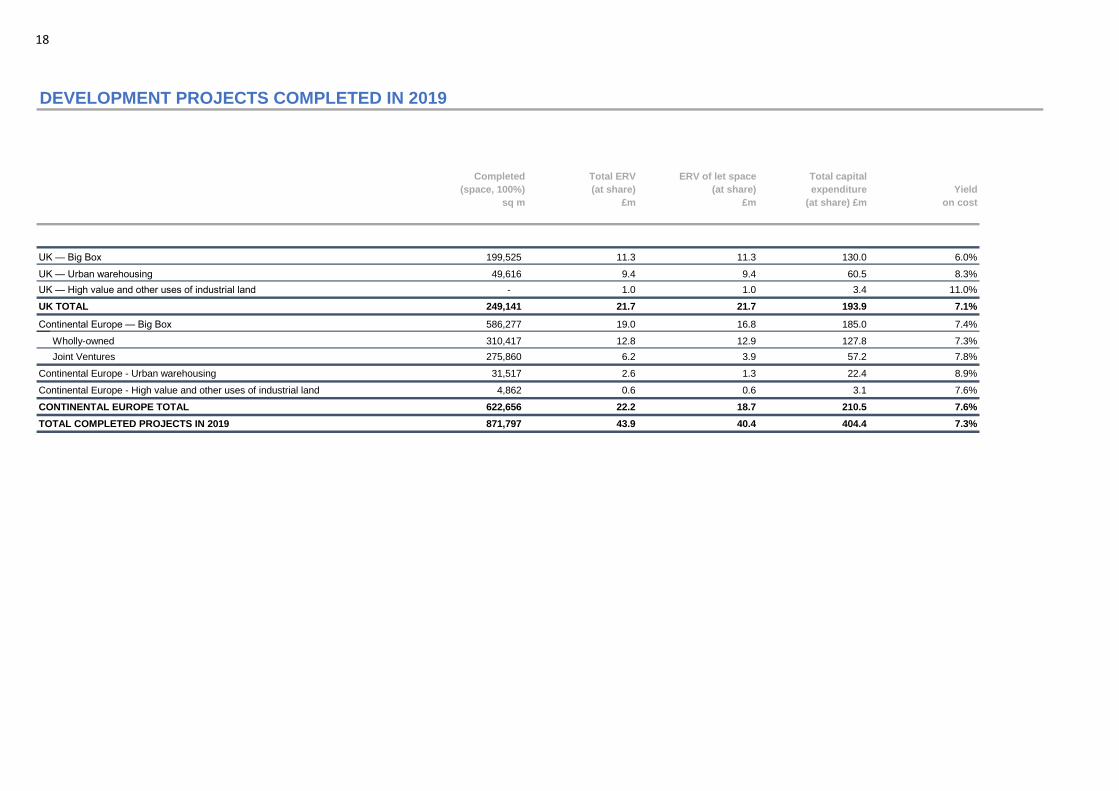
DEVELOPMENT PROJECTS COMPLETED IN 2019
Completed
(space, 100%)
sq m
Total ERV
(at share)
£m
ERV of let space
(at share)
£m
Total capital
expenditure
(at share) £m
Yield
on cost
UK — Big Box 199,525 11.3 11.3 130.0 6.0%
UK — Urban warehousing 49,616 9.4 9.4 60.5 8.3%
UK — High value and other uses of industrial land - 1.0 1.0 3.4 11.0%
UK TOTAL 249,141 21.7 21.7 193.9 7.1%
Continental Europe — Big Box 586,277 19.0 16.8 185.0 7.4%
Wholly-owned 310,417 12.8 12.9 127.8 7.3%
Joint Ventures 275,860 6.2 3.9 57.2 7.8%
Continental Europe - Urban warehousing 31,517 2.6 1.3 22.4 8.9%
Continental Europe - High value and other uses of industrial land 4,862 0.6 0.6 3.1 7.6%
CONTINENTAL EUROPE TOTAL 622,656 22.2 18.7 210.5 7.6%
TOTAL COMPLETED PROJECTS IN 2019 871,797 43.9 40.4 404.4 7.3%
19
GLOSSARY OF TERMS
Completed portfolio Headline rent Net rental income
Development pipeline Hectares (Ha) Net true equivalent yield
EPRA Investment property Passing rent
Estimated cost to completion Joint venture Pre-let
Estimated rental value (ERV) Net initial yield REIT
Rent-free period Square metres (sq m) Total capital expenditure
The estimated annual market rental value of lettable space
as determined biannually by the Group’s valuers. This will
normally be different from the rent being paid.
Passing rent less non–recoverable property expenses such as
empty rates, divided by the property valuation plus notional
purchasers’ costs. This is in accordance with EPRA’s Best
Practices Recommendations.
A qualifying entity which has elected to be treated as a Real
Estate Investment Trust for tax purposes. In the UK, such
entities must be listed on a recognised stock exchange, must be
predominantly engaged in property investment activities and
must meet certain ongoing qualifications. SEGRO plc and its UK
subsidiaries achieved REIT status with effect from 1 January
2007.
An incentive provided usually at commencement of a lease
during which a customer pays no rent. The amount of rent
free is the difference between passing rent and headline
rent.
The area of buildings measurements used in this analysis. The
conversion factor used, where appropriate, is 1 square metre =
10.7639 square feet.
Total capital expenditure excluding land value.
The European Public Real Estate Association, a real estate
industry body, which has issued Best Practices
Recommendations in order to provide consistency and
transparency in real estate reporting across Europe.
Completed land and buildings held for rental income return and/or
capital appreciation.
The annual rental income currently receivable on a property as
at the balance sheet date (which may be more or less than the
ERV). Excludes rental income where a rent free period is in
operation. Excludes service charge income (which is netted off
against service charge expenses).
Costs still to be expended on a development or
redevelopment to practical completion, including notional
finance costs.
An entity in which the Group holds an interest and which is jointly
controlled by the Group and one or more partners under a
contractual arrangement whereby decisions on financial and
operating policies essential to the operation, performance and
financial position of the venture require each partner’s consent.
A lease signed with an occupier prior to commencing
construction of a building.
The completed investment properties and the Group’s share
of joint ventures’ completed investment properties. Includes
properties held throughout the period, completed
developments and properties acquired during the period.
The annual rental income currently receivable on a property as at
the balance sheet date (which may be more or less than the ERV)
ignoring any rent-free period.
Gross Rental Income less ground rents paid, net service charge
expenses and property operating expenses.
The Group’s current programme of developments authorised
or in the course of construction at the balance sheet date
(Current Pipeline), together with potential schemes not yet
commenced on land owned or controlled by the Group
(Future Pipeline).
The area of land measurement used in this analysis. The
conversion factor used, where appropriate, is 1 hectare = 2.471
acres.
The internal rate of return from an investment property, based on
the value of the property assuming the current passing rent
reverts to ERV and assuming the property becomes fully
occupied over time. Rent is assumed to be paid quarterly in
advance, in line with standard UK lease terms.
20
GLOSSARY OF TERMS
Rent roll Take-back Trading property
Topped up net initial yield Yield on cost
See Passing Rent. Rental income lost due to lease expiry, exercise of break option,
surrender or insolvency.
Property being developed for sale or one which is being held for
sale after development is complete.
Speculative development
Where a development has commenced prior to a lease
agreement being signed in relation to that development.
Net initial yield adjusted to include notional rent in respect of let
properties which are subject to a rent free period at the valuation
date. This is in accordance with EPRA’s Best Practices
Recommendations.
Yield on cost is the expected gross yield based on the estimated
current market rental value (ERV) of the developments when
fully let, divided by the book value of the developments at the
earlier of commencement of the development or the balance
sheet date plus future development costs and estimated finance
costs to completion.
21
SEGRO plc
1 New Burlington Place T +44 (0) 20 7451 9100London F +44 (0) 20 7451 9150W1S 2HR SEGRO.com/investors