Embed Size (px)
Citation preview
FINANCIAL STATEMENTS AND REPORT BY THE BOARD OF DIRECTORS2019

CONTENT Year 2019 in brief 2
CEO's review 3
REPORT BY THE BOARD OF DIRECTORS 5
Shares and shareholders 12
Key financial figures, IFRS 19
Quarterly information (unaudited) 21
Share-related key figures 22
Definitions of key financial figures 23
CONSOLIDATED FINANCIAL STATEMENTS, IFRS 24
Consolidated statement of comprehensive income 25
Consolidated statement of financial position 26
Consolidated statement of cash flows 27
Consolidated statement of changes in equity 28
Notes to the consolidated financial statements 29
Basis of preparation 30
Adoption of new and amended standards 31
Business operations 33
1. Operating performance 34
1.1 Operating segments and geographical areas 35
1.2 Customer contracts 38
1.3 Function expenses by nature 40
1.4 Employee benefit expenses 40
1.5 Other income and expenses 41
1.6 Earnings per share 42
1.7 Income taxes 43
2. Net working capital 46
2.1 Inventories 47
2.2 Trade and other receivables 47
2.3 Trade and other payables 48
2.4 Provisions 49
Capital structure 50
3. Fixed assets and other investments 51
3.1 Business combinations 51
3.2 Intangible assets and property, plant and equipment 51
3.3 Goodwill 55
3.4 Associated companies 56
3.5 Other shares and securities 57
4. Financing 58
4.1 Equity 58
4.2 Interest-bearing receivables and liabilities 59
4.3 Cash and cash equivalents 61
4.4 Finance income and expenses 61
4.5 Financial risk management 62
4.6 Derivative instruments 67
4.7 Fair values of financial assets and liabilities 69
5. Other notes 72
5.1 Discontinued operations and disposal group classified as held for sale 72
5.2 Share-based payments 74
5.3 Pension obligations 76
5.4 Leases 78
5.5 Commitments and contingent liabilities 79
5.6 Related party transactions 80
5.7 Disputes and litigations 80
5.8 Events after the balance sheet date 80
5.9 Subsidaries 81
PARENT COMPANY FINANCIAL STATEMENTS, FAS 83
Income statement of the parent company 83
Balance sheet of the parent company 84
Cash flow statement of the parent company 85
Notes of the parent company 86
Auditor's report 100
Board of Directors 106
Executive Board 107
Investor information 108
Consolidated Financial statements and Parent
company Financial statements are audited
1
20
16
12
8
4
0
-4
-8
-12
* Excluding restructuring and acquisitions-related items and PPA amortizations** Excluding all amortizations, as well as adjustment items consisting of restructuring and capacity adjustment costs, costs related to mergers and acquisitions, outcome of material intellectual rights property disputes, gains and losses on business disposals and goodwill impairments
0.8 0.6 0.4 0.2 0.0 -0.2 -0.4 -0.6 -0.8
1 500
1 200
900
600
300
0
160 140 120 100 60 40 20 0 -20 -40 -60 -80
5 000
4 000
3 000
2 000
1 000
0
1515
15
1919
19
1818
18
1717
17
161615 19181716
Sales Service sales
Continuing and discontinued operations Continuing operations
16
EARNINGS PER SHARE, EUR
RETURN ON INVESTMENT, % ORDER INTAKE BY REGION, %
SALES BY MATERIAL, %SALES, EUR MILLION ADJUSTED EBIT* AND ADJUSTED EBITA**, EUR MILLION
PERSONNEL
15 19181716
EMEA 57 (48) Americas 24 (30) APAC 19 (22)
Copper 38 (37) Nickel 8 (5) Zinc 5 (3) Ferroalloys 6 (3) Aluminium 4 (3) Iron 7 (12) Precious metals 17 (18) Lithium 3 (4) Other metals 3 (3) Energy and environmental solutions
(incl. water, sulfuric acid and off-gas) 4 (5) Others 6 (7)
ORDER BACKLOG, EUR MILLION
1 200
900
600
300
015 19181716
EMEA Americas APAC
–––– Adjusted EBIT–––– Adjusted EBITA aEBIT excluding ilmenite smelter provision
YEAR 2019 IN BRIEF
2 YEAR 2019 IN BRIEF
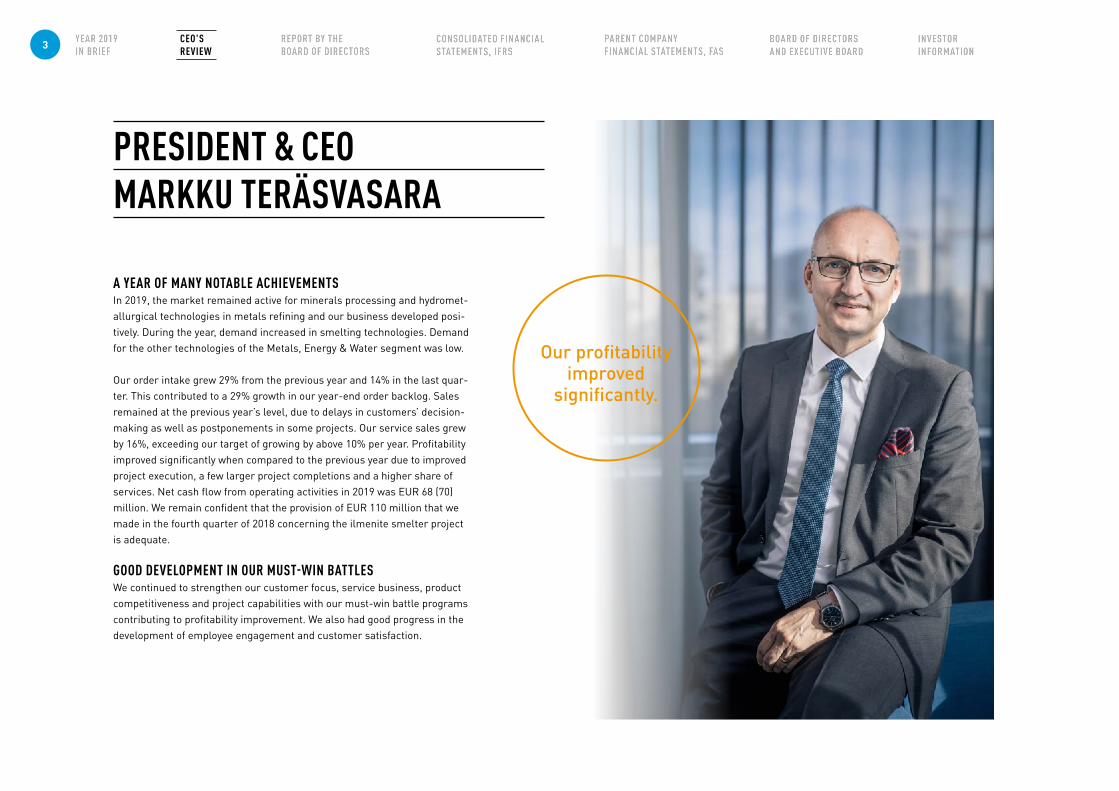
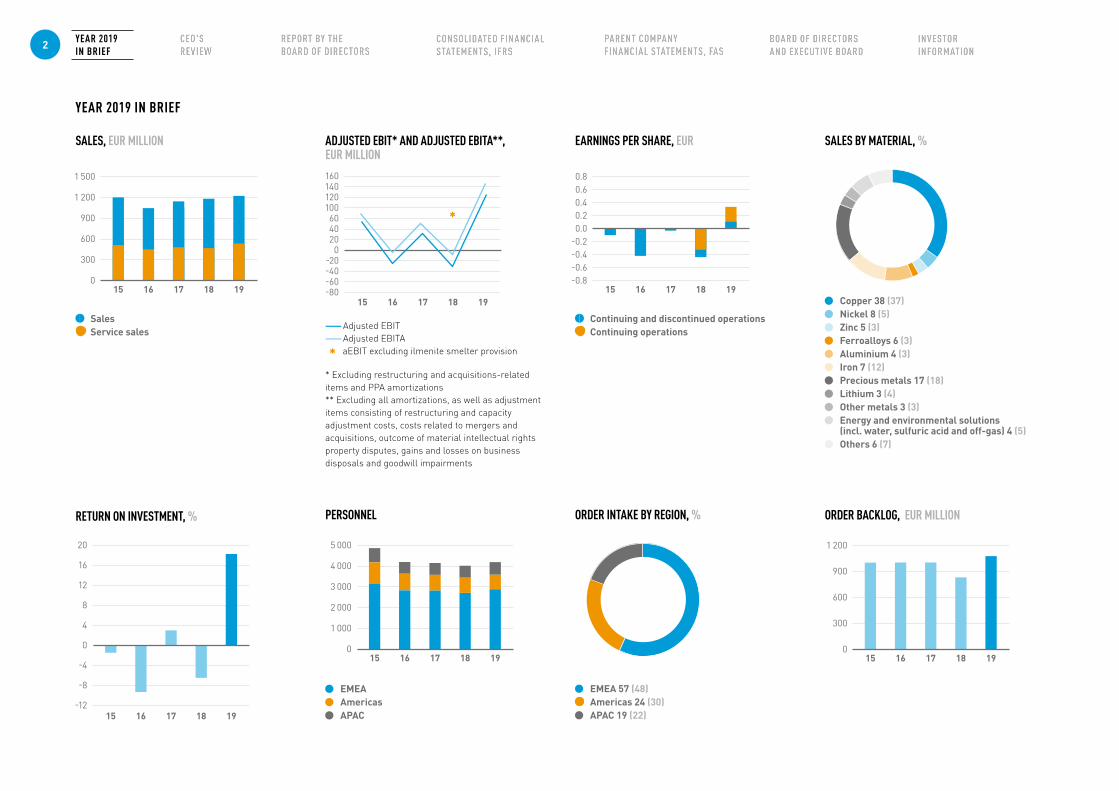
A YEAR OF MANY NOTABLE ACHIEVEMENTS In 2019, the market remained active for minerals processing and hydromet-allurgical technologies in metals refining and our business developed posi-tively. During the year, demand increased in smelting technologies. Demand for the other technologies of the Metals, Energy & Water segment was low. Our order intake grew 29% from the previous year and 14% in the last quar-ter. This contributed to a 29% growth in our year-end order backlog. Sales remained at the previous year’s level, due to delays in customers’ decision-making as well as postponements in some projects. Our service sales grew by 16%, exceeding our target of growing by above 10% per year. Profitability improved significantly when compared to the previous year due to improved project execution, a few larger project completions and a higher share of services. Net cash flow from operating activities in 2019 was EUR 68 (70) million. We remain confident that the provision of EUR 110 million that we made in the fourth quarter of 2018 concerning the ilmenite smelter project is adequate.
GOOD DEVELOPMENT IN OUR MUST-WIN BATTLES We continued to strengthen our customer focus, service business, product competitiveness and project capabilities with our must-win battle programs contributing to profitability improvement. We also had good progress in the development of employee engagement and customer satisfaction.
PRESIDENT & CEO MARKKU TERÄSVASARA
Our profitability improved
significantly.
3 CEO'S REVIEW
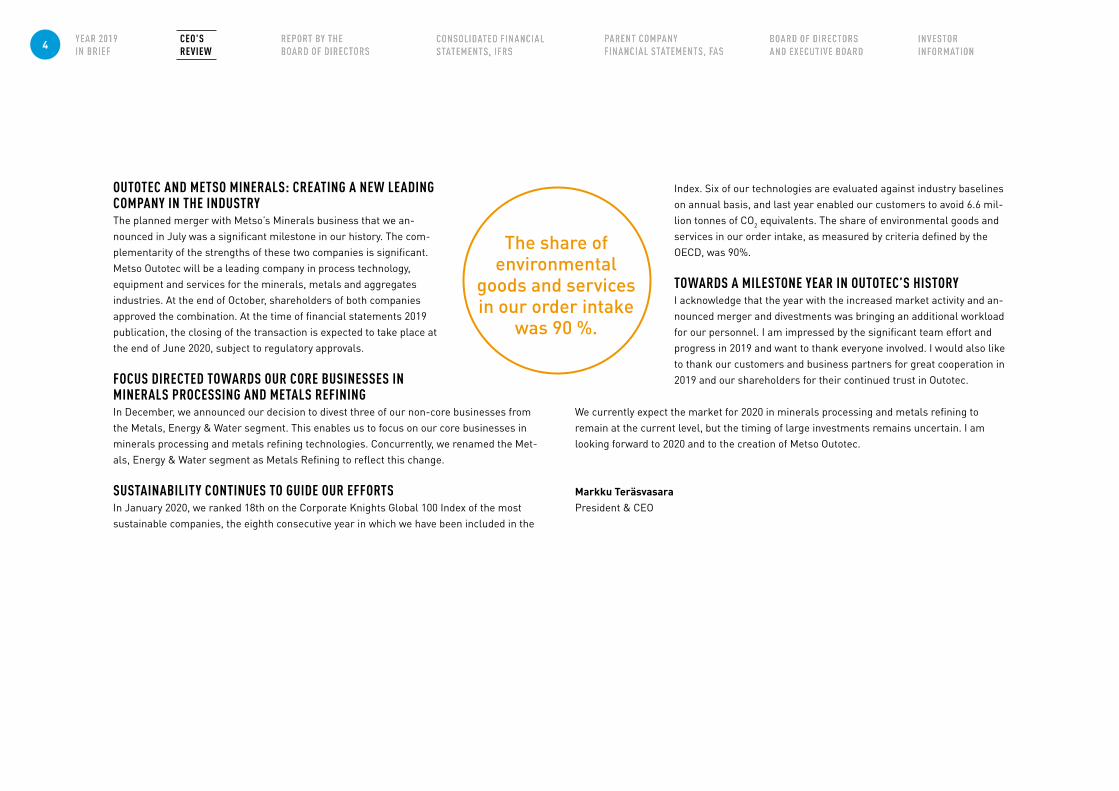
OUTOTEC AND METSO MINERALS: CREATING A NEW LEADING COMPANY IN THE INDUSTRYThe planned merger with Metso’s Minerals business that we an-nounced in July was a significant milestone in our history. The com-plementarity of the strengths of these two companies is significant. Metso Outotec will be a leading company in process technology, equipment and services for the minerals, metals and aggregates industries. At the end of October, shareholders of both companies approved the combination. At the time of financial statements 2019 publication, the closing of the transaction is expected to take place at the end of June 2020, subject to regulatory approvals.
FOCUS DIRECTED TOWARDS OUR CORE BUSINESSES IN MINERALS PROCESSING AND METALS REFININGIn December, we announced our decision to divest three of our non-core businesses from the Metals, Energy & Water segment. This enables us to focus on our core businesses in minerals processing and metals refining technologies. Concurrently, we renamed the Met-als, Energy & Water segment as Metals Refining to reflect this change.
SUSTAINABILITY CONTINUES TO GUIDE OUR EFFORTSIn January 2020, we ranked 18th on the Corporate Knights Global 100 Index of the most sustainable companies, the eighth consecutive year in which we have been included in the
Index. Six of our technologies are evaluated against industry baselines on annual basis, and last year enabled our customers to avoid 6.6 mil-lion tonnes of CO2 equivalents. The share of environmental goods and services in our order intake, as measured by criteria defined by the OECD, was 90%.
TOWARDS A MILESTONE YEAR IN OUTOTEC’S HISTORYI acknowledge that the year with the increased market activity and an-nounced merger and divestments was bringing an additional workload for our personnel. I am impressed by the significant team effort and progress in 2019 and want to thank everyone involved. I would also like to thank our customers and business partners for great cooperation in 2019 and our shareholders for their continued trust in Outotec.
We currently expect the market for 2020 in minerals processing and metals refining to remain at the current level, but the timing of large investments remains uncertain. I am looking forward to 2020 and to the creation of Metso Outotec.
Markku TeräsvasaraPresident & CEO
The share of environmental
goods and services in our order intake
was 90 %.
4 CEO'S REVIEW

REPORT BY THE BOARD OF DIRECTORS 2019DISCONTINUED OPERATIONS IN 2019The figures related to the income statement, order intake and order backlog presented in the financial statements relate to continuing operations and the corresponding figures for the comparison period have been restated ac-cordingly. Financial information related to the business divestments in the Metals, Energy & Water segment classified as assets held for sale and discontinued operations (December 10, 2019) is presented in note 5.1. The Metals, Energy & Water segment has been renamed as ‘Metals Refining’ (MR) to reflect the changes in the continuing business.
MARKET DEVELOPMENT 2019The market sentiment continued to be stable throughout 2019. Brownfield investments con-tinued at the previous year’s level and a few large greenfield investments materialized in minerals processing and metals refining. The Services market continued to develop favora-bly, both in spare parts and service projects.
The demand for the Minerals Processing segment’s equipment as well as related ser-vices continued to be solid. Copper, gold and nickel continued to be the most active metals. In the Metals Refining segment, demand in hydrometallurgical technologies for base and precious metals continued to be solid. The activity level improved also in smelting technologies during the year. There were some projects materializing in iron ore pelletizing and sulfuric acid plant solutions. Recurring services continued to be at a good level, and
some larger plant service inquiries as well as modernizations also increased when com-pared to the previous year.
Project financing, environmental permitting and political circumstances continue to delay investments. The competitive environment continued to be intense.
ORDER INTAKE AND BACKLOGThe order intake in 2019 was EUR 1,501 (1,166) million, up 29% from the comparison period. The majority of the increase in 2019 came from two large greenfield orders: a gold processing plant order to Saudi Arabia (approximately EUR 140 million) as well as a copper concentrator and hydrometallurgical plant order to Russia (approximately EUR 250 million).
The service order intake in 2019 was EUR 586 (513) million, up 14% from the compari-son period. The growth came mainly from spare parts, long-term service agreements and service projects, including a pellet plant modernization project.
Order intake by region, % 2019Restated
2018
EMEA 57 48Americas 24 30APAC 19 22Total 100 100
ORDER BACKLOG, EUR MILLION
1 600
1 200
800
400
015 19
1,008 1,205
18
1,190
1716
ORDER INTAKE, EUR MILLION
1,166
1,501
1 600
1 200
800
400
015 19
1,103 1,002 1,005830
18
1,070
1716
5 REPORT BY THE BOARD OF DIRECTORS
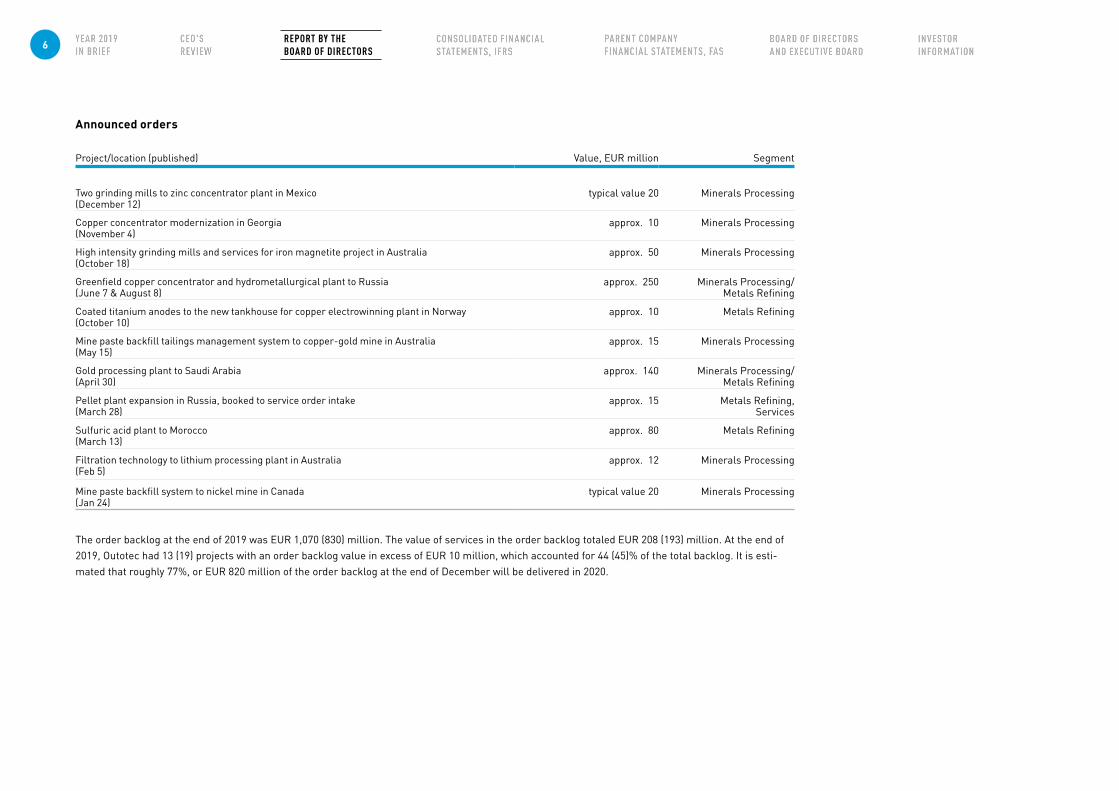
Announced orders
Project/location (published) Value, EUR million Segment
Two grinding mills to zinc concentrator plant in Mexico(December 12)
typical value 20 Minerals Processing
Copper concentrator modernization in Georgia(November 4)
approx. 10 Minerals Processing
High intensity grinding mills and services for iron magnetite project in Australia(October 18)
approx. 50 Minerals Processing
Greenfield copper concentrator and hydrometallurgical plant to Russia(June 7 & August 8)
approx. 250 Minerals Processing/Metals Refining
Coated titanium anodes to the new tankhouse for copper electrowinning plant in Norway (October 10)
approx. 10 Metals Refining
Mine paste backfill tailings management system to copper-gold mine in Australia(May 15)
approx. 15 Minerals Processing
Gold processing plant to Saudi Arabia(April 30)
approx. 140 Minerals Processing/Metals Refining
Pellet plant expansion in Russia, booked to service order intake(March 28)
approx. 15 Metals Refining, Services
Sulfuric acid plant to Morocco(March 13)
approx. 80 Metals Refining
Filtration technology to lithium processing plant in Australia(Feb 5)
approx. 12 Minerals Processing
Mine paste backfill system to nickel mine in Canada(Jan 24)
typical value 20 Minerals Processing
The order backlog at the end of 2019 was EUR 1,070 (830) million. The value of services in the order backlog totaled EUR 208 (193) million. At the end of 2019, Outotec had 13 (19) projects with an order backlog value in excess of EUR 10 million, which accounted for 44 (45)% of the total backlog. It is esti-mated that roughly 77%, or EUR 820 million of the order backlog at the end of December will be delivered in 2020.
6 REPORT BY THE BOARD OF DIRECTORS
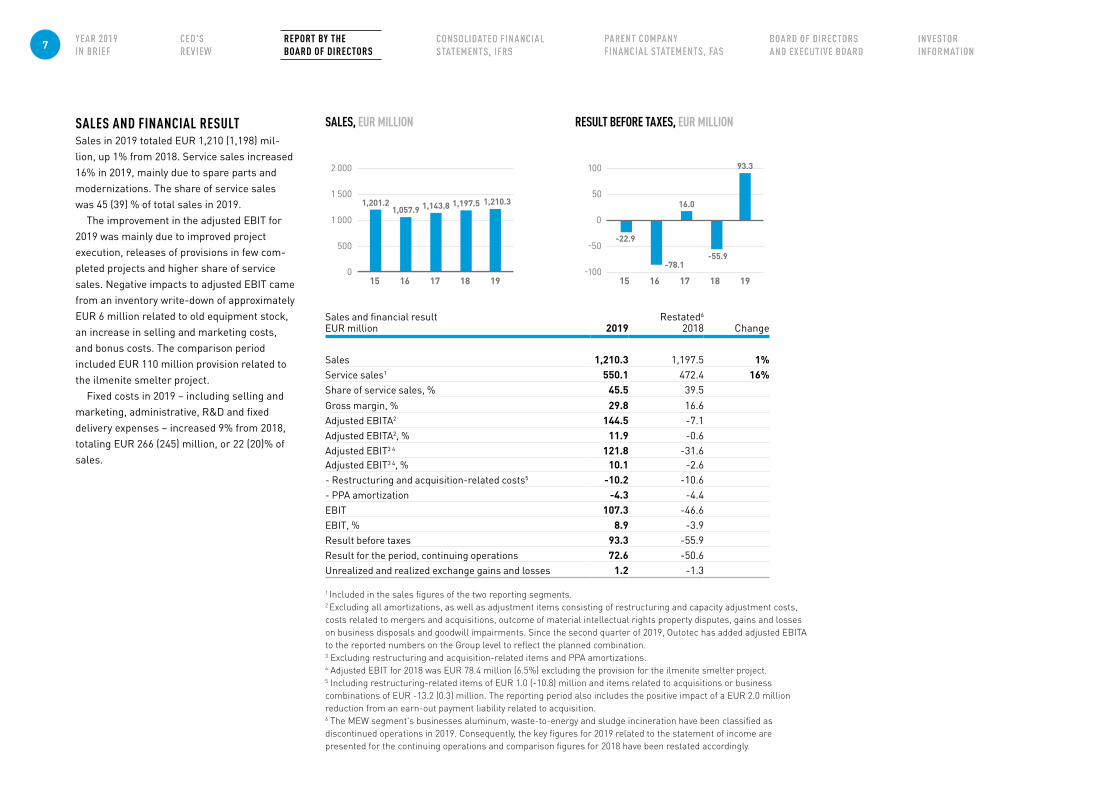
SALES AND FINANCIAL RESULTSales in 2019 totaled EUR 1,210 (1,198) mil-lion, up 1% from 2018. Service sales increased 16% in 2019, mainly due to spare parts and modernizations. The share of service sales was 45 (39) % of total sales in 2019.
The improvement in the adjusted EBIT for 2019 was mainly due to improved project execution, releases of provisions in few com-pleted projects and higher share of service sales. Negative impacts to adjusted EBIT came from an inventory write-down of approximately EUR 6 million related to old equipment stock, an increase in selling and marketing costs, and bonus costs. The comparison period included EUR 110 million provision related to the ilmenite smelter project.
Fixed costs in 2019 – including selling and marketing, administrative, R&D and fixed delivery expenses – increased 9% from 2018, totaling EUR 266 (245) million, or 22 (20)% of sales.
Sales and financial resultEUR million 2019
Restated6 2018 Change
Sales 1,210.3 1,197.5 1%Service sales1 550.1 472.4 16%Share of service sales, % 45.5 39.5Gross margin, % 29.8 16.6Adjusted EBITA2 144.5 -7.1 Adjusted EBITA2, % 11.9 -0.6 Adjusted EBIT3 4 121.8 -31.6Adjusted EBIT3 4, % 10.1 -2.6- Restructuring and acquisition-related costs5 -10.2 -10.6- PPA amortization -4.3 -4.4EBIT 107.3 -46.6EBIT, % 8.9 -3.9Result before taxes 93.3 -55.9Result for the period, continuing operations 72.6 -50.6Unrealized and realized exchange gains and losses 1.2 -1.3
1 Included in the sales figures of the two reporting segments.2 Excluding all amortizations, as well as adjustment items consisting of restructuring and capacity adjustment costs, costs related to mergers and acquisitions, outcome of material intellectual rights property disputes, gains and losses on business disposals and goodwill impairments. Since the second quarter of 2019, Outotec has added adjusted EBITA to the reported numbers on the Group level to reflect the planned combination.3 Excluding restructuring and acquisition-related items and PPA amortizations.4 Adjusted EBIT for 2018 was EUR 78.4 million (6.5%) excluding the provision for the ilmenite smelter project. 5 Including restructuring-related items of EUR 1.0 (-10.8) million and items related to acquisitions or business combinations of EUR -13.2 (0.3) million. The reporting period also includes the positive impact of a EUR 2.0 million reduction from an earn-out payment liability related to acquisition.6 The MEW segment's businesses aluminum, waste-to-energy and sludge incineration have been classified as discontinued operations in 2019. Consequently, the key figures for 2019 related to the statement of income are presented for the continuing operations and comparison figures for 2018 have been restated accordingly.
SALES, EUR MILLION RESULT BEFORE TAXES, EUR MILLION
2 000
1 500
1 000
500
0 15 19
1,201.21,057.9 1,143.8 1,197.5
18
1,210.3
1716
100
50
0
-50
-100
16.0
-55.9
15 1918
93.3
1716
-22.9
-78.1
7 REPORT BY THE BOARD OF DIRECTORS
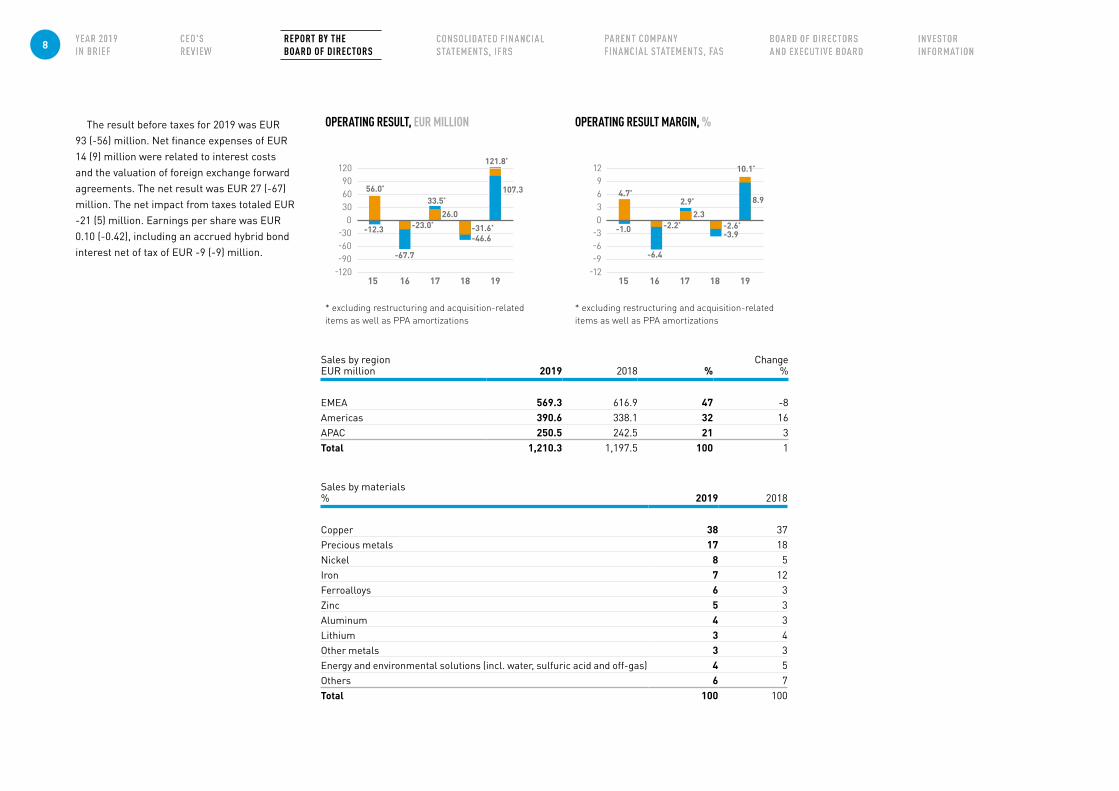
The result before taxes for 2019 was EUR 93 (-56) million. Net finance expenses of EUR 14 (9) million were related to interest costs and the valuation of foreign exchange forward agreements. The net result was EUR 27 (-67) million. The net impact from taxes totaled EUR -21 (5) million. Earnings per share was EUR 0.10 (-0.42), including an accrued hybrid bond interest net of tax of EUR -9 (-9) million.
* excluding restructuring and acquisition-related items as well as PPA amortizations
* excluding restructuring and acquisition-related items as well as PPA amortizations
OPERATING RESULT, EUR MILLION OPERATING RESULT MARGIN, %
Sales by regionEUR million 2019 2018 %
Change %
EMEA 569.3 616.9 47 -8Americas 390.6 338.1 32 16APAC 250.5 242.5 21 3Total 1,210.3 1,197.5 100 1
Sales by materials% 2019 2018
Copper 38 37Precious metals 17 18Nickel 8 5Iron 7 12Ferroalloys 6 3Zinc 5 3Aluminum 4 3Lithium 3 4Other metals 3 3Energy and environmental solutions (incl. water, sulfuric acid and off-gas) 4 5Others 6 7Total 100 100
120 90 60 30 0 -30 -60 -90 -120
12 9 6 3 0 -3 -6 -9 -12
15 1519 19
56.0*
-23.0*
26.0
-31.6*
2.3-2.6*
33.5*
-46.6
2.9*
-3.9
4.7*
-2.2*
18 18
121.8*
10.1*
17 1716 16
-12.3
-67.7
-1.0
-6.4
107.38.9
8 REPORT BY THE BOARD OF DIRECTORS
SEGMENTS
Minerals Processing
Reporting segment – Minerals ProcessingEUR million 2019 2018 Change
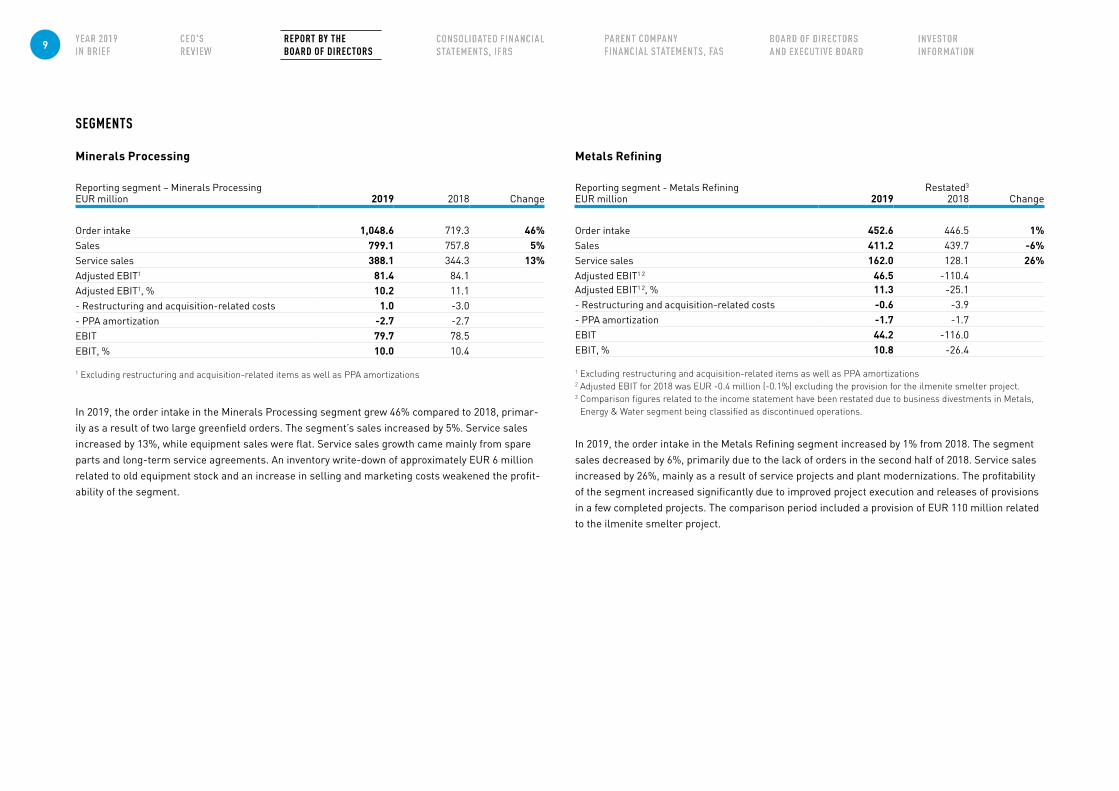
Order intake 1,048.6 719.3 46%Sales 799.1 757.8 5%Service sales 388.1 344.3 13%Adjusted EBIT1 81.4 84.1Adjusted EBIT1, % 10.2 11.1- Restructuring and acquisition-related costs 1.0 -3.0- PPA amortization -2.7 -2.7EBIT 79.7 78.5EBIT, % 10.0 10.4
1 Excluding restructuring and acquisition-related items as well as PPA amortizations
In 2019, the order intake in the Minerals Processing segment grew 46% compared to 2018, primar-ily as a result of two large greenfield orders. The segment’s sales increased by 5%. Service sales increased by 13%, while equipment sales were flat. Service sales growth came mainly from spare parts and long-term service agreements. An inventory write-down of approximately EUR 6 million related to old equipment stock and an increase in selling and marketing costs weakened the profit-ability of the segment.
Metals Refining
Reporting segment - Metals RefiningEUR million 2019
Restated3
2018 Change
Order intake 452.6 446.5 1%Sales 411.2 439.7 -6%Service sales 162.0 128.1 26%Adjusted EBIT1 2 46.5 -110.4Adjusted EBIT1 2, % 11.3 -25.1- Restructuring and acquisition-related costs -0.6 -3.9- PPA amortization -1.7 -1.7EBIT 44.2 -116.0EBIT, % 10.8 -26.4
1 Excluding restructuring and acquisition-related items as well as PPA amortizations2 Adjusted EBIT for 2018 was EUR -0.4 million (-0.1%) excluding the provision for the ilmenite smelter project. 3 Comparison figures related to the income statement have been restated due to business divestments in Metals,
Energy & Water segment being classified as discontinued operations.
In 2019, the order intake in the Metals Refining segment increased by 1% from 2018. The segment sales decreased by 6%, primarily due to the lack of orders in the second half of 2018. Service sales increased by 26%, mainly as a result of service projects and plant modernizations. The profitability of the segment increased significantly due to improved project execution and releases of provisions in a few completed projects. The comparison period included a provision of EUR 110 million related to the ilmenite smelter project.
9 REPORT BY THE BOARD OF DIRECTORS
Balance sheet, financing and cash flowEUR million 2019 2018
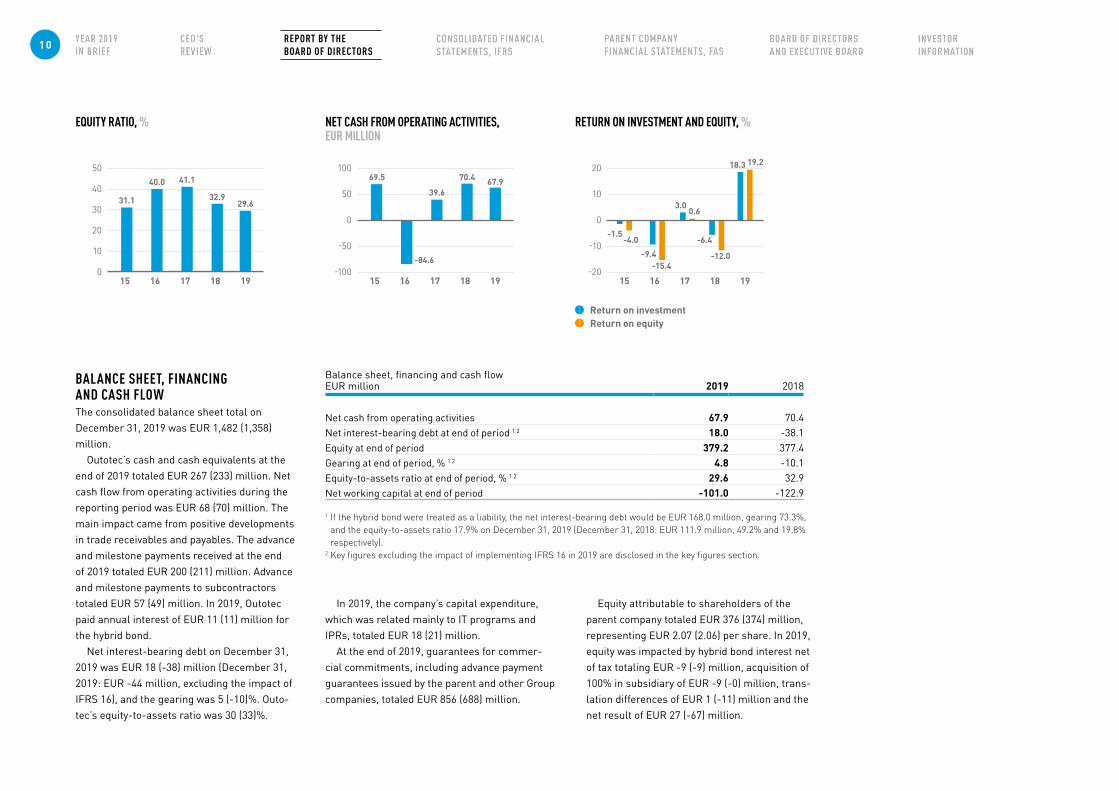
Net cash from operating activities 67.9 70.4Net interest-bearing debt at end of period 1 2 18.0 -38.1Equity at end of period 379.2 377.4Gearing at end of period, % 1 2 4.8 -10.1Equity-to-assets ratio at end of period, % 1 2 29.6 32.9Net working capital at end of period -101.0 -122.9
1 If the hybrid bond were treated as a liability, the net interest-bearing debt would be EUR 168.0 million, gearing 73.3%, and the equity-to-assets ratio 17.9% on December 31, 2019 (December 31, 2018: EUR 111.9 million, 49.2% and 19.8% respectively).
2 Key figures excluding the impact of implementing IFRS 16 in 2019 are disclosed in the key figures section.
BALANCE SHEET, FINANCING AND CASH FLOWThe consolidated balance sheet total on December 31, 2019 was EUR 1,482 (1,358) million.
Outotec’s cash and cash equivalents at the end of 2019 totaled EUR 267 (233) million. Net cash flow from operating activities during the reporting period was EUR 68 (70) million. The main impact came from positive developments in trade receivables and payables. The advance and milestone payments received at the end of 2019 totaled EUR 200 (211) million. Advance and milestone payments to subcontractors totaled EUR 57 (49) million. In 2019, Outotec paid annual interest of EUR 11 (11) million for the hybrid bond.
Net interest-bearing debt on December 31, 2019 was EUR 18 (-38) million (December 31, 2019: EUR -44 million, excluding the impact of IFRS 16), and the gearing was 5 (-10)%. Outo-tec’s equity-to-assets ratio was 30 (33)%.
In 2019, the company’s capital expenditure, which was related mainly to IT programs and IPRs, totaled EUR 18 (21) million.
At the end of 2019, guarantees for commer-cial commitments, including advance payment guarantees issued by the parent and other Group companies, totaled EUR 856 (688) million.
Equity attributable to shareholders of the parent company totaled EUR 376 (374) million, representing EUR 2.07 (2.06) per share. In 2019, equity was impacted by hybrid bond interest net of tax totaling EUR -9 (-9) million, acquisition of 100% in subsidiary of EUR -9 (-0) million, trans-lation differences of EUR 1 (-11) million and the net result of EUR 27 (-67) million.
EQUITY RATIO, % NET CASH FROM OPERATING ACTIVITIES, EUR MILLION
Return on investment Return on equity
RETURN ON INVESTMENT AND EQUITY, %
20
10
0
-10
-20
100
50
0
-50
-100
50
40
30
20
10
015 19
31.1
40.0 67.969.5
-84.6
41.1
32.93.0
0.6
18
29.6
1716 15 19181716 15 19181716
18.3
-1.5
-9.4
19.2
-4.0
-15.4
39.6
70.4
-6.4
-12.0
10 REPORT BY THE BOARD OF DIRECTORS
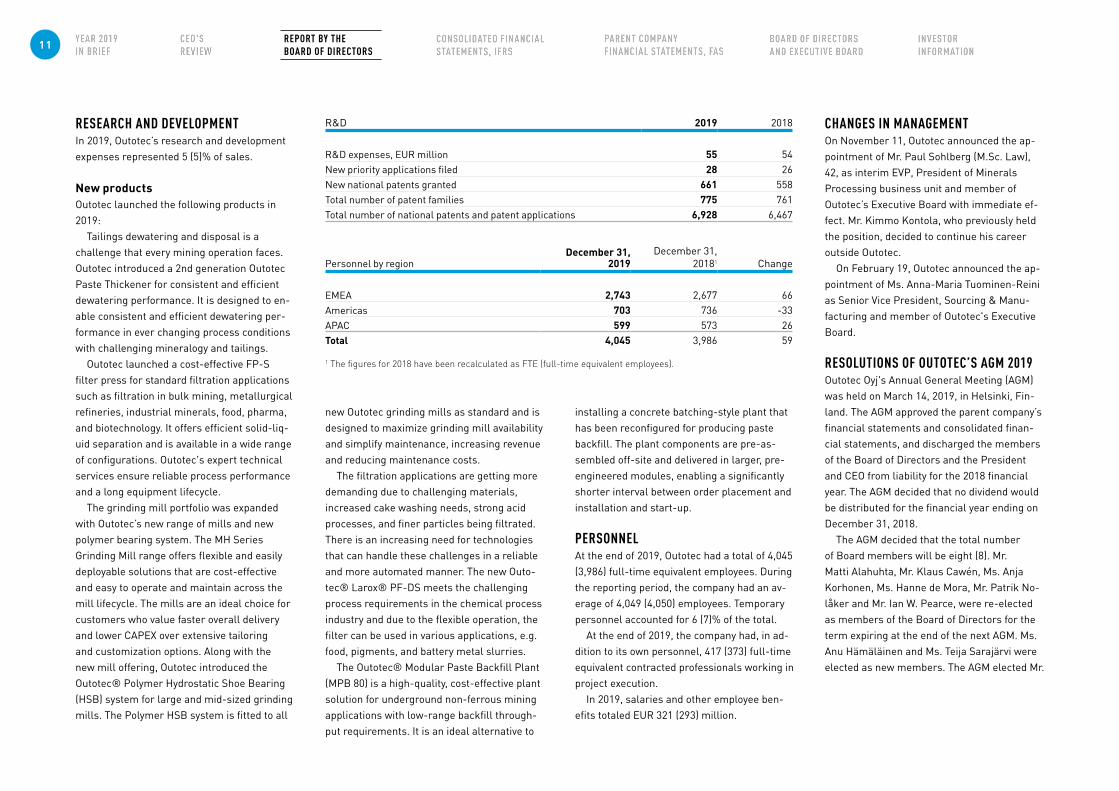
RESEARCH AND DEVELOPMENTIn 2019, Outotec’s research and development expenses represented 5 (5)% of sales.
New productsOutotec launched the following products in 2019:
Tailings dewatering and disposal is a challenge that every mining operation faces. Outotec introduced a 2nd generation Outotec Paste Thickener for consistent and efficient dewatering performance. It is designed to en-able consistent and efficient dewatering per-formance in ever changing process conditions with challenging mineralogy and tailings.
Outotec launched a cost-effective FP-S filter press for standard filtration applications such as filtration in bulk mining, metallurgical refineries, industrial minerals, food, pharma, and biotechnology. It offers efficient solid-liq-uid separation and is available in a wide range of configurations. Outotec's expert technical services ensure reliable process performance and a long equipment lifecycle.
The grinding mill portfolio was expanded with Outotec’s new range of mills and new polymer bearing system. The MH Series Grinding Mill range offers flexible and easily deployable solutions that are cost-effective and easy to operate and maintain across the mill lifecycle. The mills are an ideal choice for customers who value faster overall delivery and lower CAPEX over extensive tailoring and customization options. Along with the new mill offering, Outotec introduced the Outotec® Polymer Hydrostatic Shoe Bearing (HSB) system for large and mid-sized grinding mills. The Polymer HSB system is fitted to all
Personnel by regionDecember 31,
2019December 31,
20181 Change
EMEA 2,743 2,677 66Americas 703 736 -33APAC 599 573 26Total 4,045 3,986 59
1 The figures for 2018 have been recalculated as FTE (full-time equivalent employees).
new Outotec grinding mills as standard and is designed to maximize grinding mill availability and simplify maintenance, increasing revenue and reducing maintenance costs.
The filtration applications are getting more demanding due to challenging materials, increased cake washing needs, strong acid processes, and finer particles being filtrated. There is an increasing need for technologies that can handle these challenges in a reliable and more automated manner. The new Outo-tec® Larox® PF-DS meets the challenging process requirements in the chemical process industry and due to the flexible operation, the filter can be used in various applications, e.g. food, pigments, and battery metal slurries.
The Outotec® Modular Paste Backfill Plant (MPB 80) is a high-quality, cost-effective plant solution for underground non-ferrous mining applications with low-range backfill through-put requirements. It is an ideal alternative to
installing a concrete batching-style plant that has been reconfigured for producing paste backfill. The plant components are pre-as-sembled off-site and delivered in larger, pre-engineered modules, enabling a significantly shorter interval between order placement and installation and start-up.
PERSONNELAt the end of 2019, Outotec had a total of 4,045 (3,986) full-time equivalent employees. During the reporting period, the company had an av-erage of 4,049 (4,050) employees. Temporary personnel accounted for 6 (7)% of the total.
At the end of 2019, the company had, in ad-dition to its own personnel, 417 (373) full-time equivalent contracted professionals working in project execution.
In 2019, salaries and other employee ben-efits totaled EUR 321 (293) million.
R&D 2019 2018
R&D expenses, EUR million 55 54New priority applications filed 28 26New national patents granted 661 558Total number of patent families 775 761Total number of national patents and patent applications 6,928 6,467
CHANGES IN MANAGEMENT On November 11, Outotec announced the ap-pointment of Mr. Paul Sohlberg (M.Sc. Law), 42, as interim EVP, President of Minerals Processing business unit and member of Outotec’s Executive Board with immediate ef-fect. Mr. Kimmo Kontola, who previously held the position, decided to continue his career outside Outotec.
On February 19, Outotec announced the ap-pointment of Ms. Anna-Maria Tuominen-Reini as Senior Vice President, Sourcing & Manu-facturing and member of Outotec's Executive Board.
RESOLUTIONS OF OUTOTEC’S AGM 2019Outotec Oyj's Annual General Meeting (AGM) was held on March 14, 2019, in Helsinki, Fin-land. The AGM approved the parent company’s financial statements and consolidated finan-cial statements, and discharged the members of the Board of Directors and the President and CEO from liability for the 2018 financial year. The AGM decided that no dividend would be distributed for the financial year ending on December 31, 2018.
The AGM decided that the total number of Board members will be eight (8). Mr. Matti Alahuhta, Mr. Klaus Cawén, Ms. Anja Korhonen, Ms. Hanne de Mora, Mr. Patrik No-låker and Mr. Ian W. Pearce, were re-elected as members of the Board of Directors for the term expiring at the end of the next AGM. Ms. Anu Hämäläinen and Ms. Teija Sarajärvi were elected as new members. The AGM elected Mr.
11 REPORT BY THE BOARD OF DIRECTORS
MAJOR SHAREHOLDERS BY DISTRIBUTION OF SHARES 31.12.2019
Number of sharesNumber
of holdings% of
shareholders Shares % of shares
1–100 6,426 22.87 343,889 0.19101–1,000 15,216 54.14 6,856,029 3.741,001–10,000 5,998 21.34 16,867,070 9.2110,001–100,000 400 1.42 9,426,907 5.15100,001–1,000,000 46 0.16 14,532,865 7.941,000,001+ 18 0.06 135,094,732 73.77
Total 28,104 100.00 183,121,492 100.00In the joint book-entry account - - - -In special accounts - - - -Number of shares issued - - 183,121,492 100.00Nominee registered 11 0.04 68,069,003 37.17
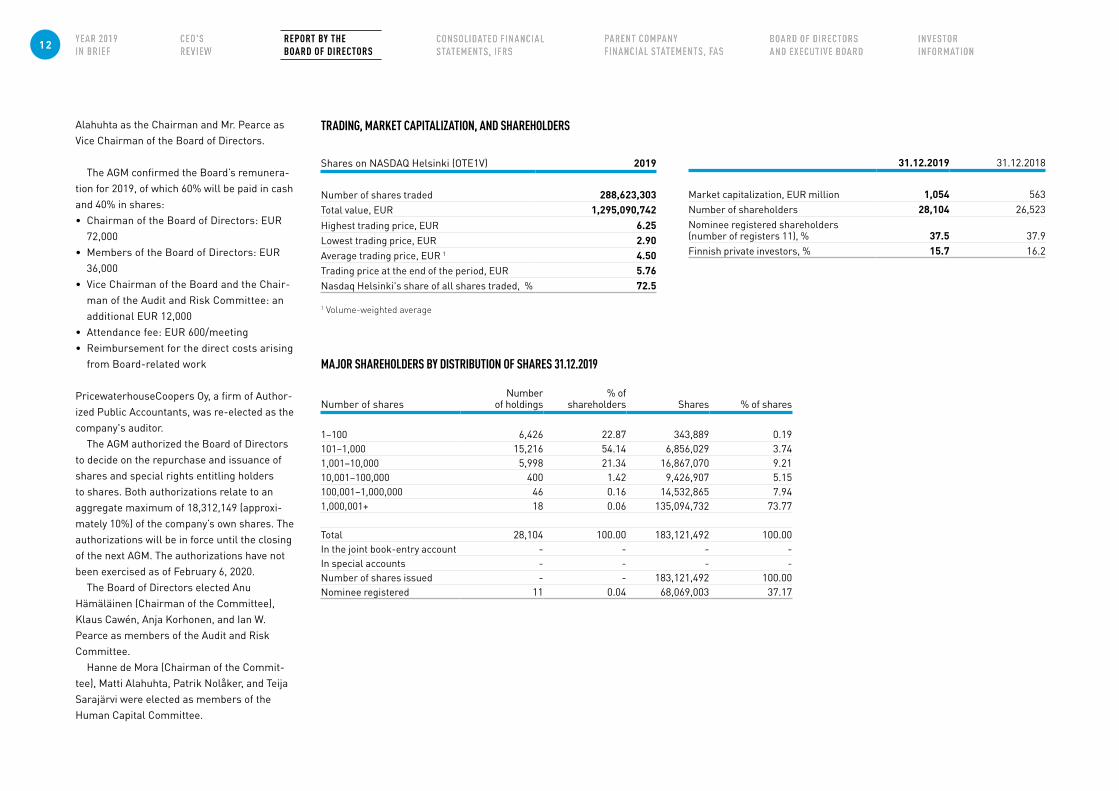
TRADING, MARKET CAPITALIZATION, AND SHAREHOLDERS
Shares on NASDAQ Helsinki (OTE1V) 2019
Number of shares traded 288,623,303Total value, EUR 1,295,090,742Highest trading price, EUR 6.25Lowest trading price, EUR 2.90Average trading price, EUR 1 4.50Trading price at the end of the period, EUR 5.76Nasdaq Helsinki's share of all shares traded, % 72.5
1 Volume-weighted average
31.12.2019 31.12.2018
Market capitalization, EUR million 1,054 563Number of shareholders 28,104 26,523Nominee registered shareholders (number of registers 11), % 37.5 37.9Finnish private investors, % 15.7 16.2
Alahuhta as the Chairman and Mr. Pearce as Vice Chairman of the Board of Directors.
The AGM confirmed the Board’s remunera-tion for 2019, of which 60% will be paid in cash and 40% in shares: • Chairman of the Board of Directors: EUR
72,000 • Members of the Board of Directors: EUR
36,000• Vice Chairman of the Board and the Chair-
man of the Audit and Risk Committee: an additional EUR 12,000
• Attendance fee: EUR 600/meeting • Reimbursement for the direct costs arising
from Board-related work
PricewaterhouseCoopers Oy, a firm of Author-ized Public Accountants, was re-elected as the company's auditor.
The AGM authorized the Board of Directors to decide on the repurchase and issuance of shares and special rights entitling holders to shares. Both authorizations relate to an aggregate maximum of 18,312,149 (approxi-mately 10%) of the company’s own shares. The authorizations will be in force until the closing of the next AGM. The authorizations have not been exercised as of February 6, 2020.
The Board of Directors elected Anu Hämäläinen (Chairman of the Committee), Klaus Cawén, Anja Korhonen, and Ian W. Pearce as members of the Audit and Risk Committee.
Hanne de Mora (Chairman of the Commit-tee), Matti Alahuhta, Patrik Nolåker, and Teija Sarajärvi were elected as members of the Human Capital Committee.
12 REPORT BY THE BOARD OF DIRECTORS

MAJOR SHAREHOLDERS BY SECTORS 31.12.2019
SectorsNumber
of holdings % of shares
Non-Finnish holders 382 1.73Finnish institutions, companies and foundations 1,174 82.53Finnish private investors 26,548 15.74
Total 28,104 100.00On common and special accounts - -Of which nominee registered 11 37.17
MAJOR SHAREHOLDERS 31.12.2019, AS SORTED BY NUMBER OF SHARES
Shareholders Shares % of shares
Solidium Oy 27,265,232 14.89Varma Mutual Pension Insurance Company 12,209,960 6.67Ilmarinen Mutual Pension Insurance Company 4,815,000 2.63OP-Finland Fund 4,622,484 2.52The State Pension Fund 4,500,000 2.46Keva 2,650,120 1.45Holding Manutas Oy 1,800,000 0.98Investment fund Aktia Capital 1,550 751 0.85Mandatum Life Insurance Company Limited 1,516 378 0.83Foundation of Brita Maria Renlunds minne 1,380 000 0.75Total 62,309,925 34.00
RESOLUTIONS OF OUTOTEC’S EGM 2019
Combination of Outotec and Metso Minerals On October 29, 2019, the Extraordinary General Meetings (EGMs) of both Metso Corporation and Outotec Oyj approved the proposed partial demerger of Metso and the plan to combine Metso’s Minerals business and the Outotec Group to create Metso Ou-totec Corporation. In the partial demerger of Metso, all assets and liabilities of Metso that relate to, or primarily serve, Metso’s Miner-als business will transfer without liquidation to Outotec.
Timing of the mergerOutotec and Metso have previously commu-nicated that the completion of the combina-tion of Outotec and Metso’s Minerals busi-ness is expected to take place in the second quarter of 2020, subject to the receipt of all required regulatory and other approvals, including competition clearances. Consider-ing the progress of the regulatory approval process, Outotec and Metso currently expect the completion of the combination of Outotec and Metso’s Minerals business to take place on June 30, 2020, subject to the receipt of all required regulatory and other approvals, including competition clearances.
SHARES AND SHARE CAPITALOutotec's shares are listed on the Nasdaq Helsinki exchange (OTE1V). At the end of the reporting period, Outotec’s share capital was EUR 17,186,442.52, consisting of 183,121,492
shares. Each share entitles its holder to one vote at the company’s general meetings.
OUTOTEC OYJ OWN SHAREHOLDINGAt the end of the reporting period, the com-pany directly held a total of 1,271,628 Outotec shares, representing 0.69% of Outotec Oyj’s shares and votes.
SHARE-BASED INCENTIVES Outotec has a Share-based Incentive Pro-gram for the company’s key personnel as well as an Employee Share Savings Program for all employees globally. All shares related to the programs are acquired through public trading. More detailed information about pre-sent and past programs is available at www.outotec.com/cg.
LEGAL DISPUTESOutotec has no ongoing material litigations or arbitration proceedings.
OTHER MAIN ANNOUNCEMENTS AND EVENTS IN 2019December 10: Outotec lowered its sales guidance for 2019 due to announced inten-tion to divest three businesses, and delays in certain already received and anticipated orders.
November 29: Outotec and Metso received a clearance from the United States De-partment of Justice for the combination of Outotec and Metso Minerals.
13 REPORT BY THE BOARD OF DIRECTORS
October 29: Outotec’s Extraordinary General Meeting approved the combination of the busi-ness operations of Outotec and Metso through a partial demerger of Metso (announced July 4).
October 8: Moody’s Investor Service assigns a ‘Baa2’ and S&P Global Ratings assigns a ‘BBB-’ credit rating to the future Metso Outotec.
October 7: Outotec signs a EUR 50 million Revolving Credit Facility with OP Corporate Bank as well as a EUR 120 million Forward Start Term Facility with Nordea Bank. Further, Outotec and lenders sign amendment and re-statement agreements to the existing EUR 100 million and EUR 60 million RCFs to agree on an extension of the maturity dates to August 31, 2020 at the latest.
October 7: The Finnish Financial Supervisory Authority approves the prospectus prepared for the combination of Outotec and the Metso Minerals Business. October 4: Outotec an-nounced the members of its Nomination Board.• Annareetta Lumme-Timonen (Solidium Oy)• Pekka Pajamo (Varma Mutual Pension
Insurance Company)• Mikko Mursula (Ilmarinen Mutual Pension
Insurance Company)• Matti Alahuhta (Chairman of the Board of
Directors of Outotec)
July 4: Combination of Outotec and Metso Minerals to create a leading company in process technology, equipment and services
serving the minerals, metals and aggregates industries.
June 24: Outotec and Central South University from China to agree on scientific cooperation.
May 10: Outotec sold its fabrication and manufacturing businesses in South Africa and Mozambique.
March 12: Outotec's sustainability report 2018 highlights co-creation for future plants.
January 22: Outotec ranked 12th in the Cor-porate Knights 2019 Global 100 Index of most sustainable companies in the world.
STATEMENT OF NON-FINANCIAL INFORMATIONOutotec, headquartered in Finland, operates globally with subsidiaries and branch offices in 41 countries. The company develops and deliv-ers leading technologies and services for the sustainable use of Earth’s natural resources in the mining, metal and chemical industries. Outotec’s deliveries vary from a single piece of equipment to entire processes and plants. The scope typically includes raw material testing, engineering, sourcing, commissioning, train-ing, and life-cycle services.
Sustainable technologies and innovations, Engaged experts, Responsible supply chain, and Health and safety, as well as Ethics, com-pliance, and governance, which includes work-ing against corruption and respecting human rights, are the most material non-financial topics for Outotec. Outotec has established targets and key performance indicators for
each of the material topics in order to steer its sustainability activities.
Outotec reports its economic, social and en-vironmental performance annually in accord-ance with the Global Reporting Initiative (GRI) Standards: Core option. The Sustainability Report 2019 will be published in March 2020.
Value creationThe key resources for value creation are the deep know-how of Outotec’s 4,045 experts, 6,928 national technology patents, and three research and development centers, as well as the Outotec brand, which has been established over the past 150 years serving the industry. In addition, long customer and supplier relation-ships are essential for the company.
Outotec generates employment and wealth in local communities as an employer and buyer of goods and services. The company also contributes to local communities through university cooperation and subcontract-ing project as well as R&D work. Outotec technologies often improve the environmental conditions surrounding customers’ plants.
Outotec is a compliant tax payer in each country where it operates. The company pursues transparency and non-discrimination in its tax practices and does not engage in ag-gressive tax planning. In 2019, Outotec’s cur-rent income taxes were EUR 9.1 million. Outo-tec neither paid dividends nor contributions to charities in 2019, due to negative earnings per share in 2018. To enhance its ability to create value over the cycle, Outotec aims to maintain its leadership in sustainable technologies and grow its service business.
Policies and risk management system Outotec’s Code of Conduct, approved by the Board of Directors, sets the company’s busi-ness conduct for all employees. The Code of Conduct, Supplier Policy, HR policies and Do-nation & Employee Volunteering Policy, as well as Quality, Environment, Health and Safety (QEHS) Policy, all define the basic require-ments for Outotec’s environmental, social and economic sustainability.
The non-financial risks in this statement have been identified in accordance with the Finnish Accounting Act, separately to the financial risks identified in the Financial State-ment section 4.5 Financial Risk Management. Outotec’s risk management is based on its Corporate Governance and Enterprise Risk Management policies. Environmental, social and economic sustainability-related risks are covered in the operational risk assessment tool, which is used to assess all projects worth at least EUR one million. Appropriate follow-up actions are defined based on these find-ings. The company is globally certified to ISO 9001 (quality), ISO 14001 (environment) and ISO 45001 (safety) standards. In addition, the locations in Finland and Germany are certified to ISO 50001 (energy). Internal and external audits are performed regularly.
The Board of Directors’ diversity principles are detailed in Outotec’s Corporate Govern-ance Statement 2019.
Environmental responsibilityOutotec’s most significant environmental impact materializes through its products and services delivered for customers. In line with its Technology Policy, Outotec continuously in-
14 REPORT BY THE BOARD OF DIRECTORS
novates new technologies as well as develops its existing technologies so that they become increasingly resource efficient.
In the metallurgical industry, emissions and eco-toxic substances can cause negative environmental impacts unless appropriately controlled. In Outotec’s value chain, environ-mental risks lie mainly in the defective use of Outotec technologies and product quality in the supply chain. To mitigate these risks, Outotec offers training and other services to customers, as well as regularly trains and audits its key suppliers.
Sustainable technologies and innovationsOutotec reduces the global metallurgical industry's carbon dioxide (CO2) and other emissions, by delivering advanced technolo-gies for its customers’ industrial processes. The company measures the reduction of CO2
emissions as its positive impact on the envi-ronment (carbon handprint), by the amount of CO2 emissions avoided by using Outotec technologies. Six of Outotec’s technologies are measured against industry baseline on an an-nual basis. Outotec has two long-term targets related to the environmental performance of its products and services: 1) customers generate 20% less CO2 when using six Outotec technologies compared to annual industry baselines; and 2) to permantely keep the share of environ-mental goods and services in the order intake, as measured by OECD defined criteria, above 90%.
In 2019, Outotec’s customers generated 6.6 million tonnes less of CO2 equivalents in the six technology areas, representing a reduc-
tion of 16%. The amount of emissions avoided depend on the actual production volumes of the technologies involved. The share of environmental goods and services in the order intake was 90%. Outotec ranked 18th on the Corporate Knights 2020 Global 100 Index of most sustainable companies. This marks the eighth consecutive year Outotec has been included in the list.
Environmental impact of Outotec’s own operationsTo a lesser degree, the company’s environ-mental impact arises from its own opera-tions. Outotec continuously aims to reduce the impacts of its operations and has annual targets related to CO2 emissions, energy con-sumption and waste production. The company also monitors its personnel flight emissions. Only a few of Outotec’s operations require an environmental permit, and the risks related to these operations are managed by certified environmental management systems.
Social responsibility and employees As an international company with global pres-ence, Outotec values diversity at the work-place and treats all employees with integrity. Fair and equal treatment of people regardless of their ethnic origin, nationality, religion, political views, gender, sexual orientation, disability, family status or age is enforced globally. Outotec follows the principle of equal opportunities. Fair and equal treatment is expected from all Outotec employees towards every person in the company and this extends to contractors, vendors, customers and others with whom Outotec interacts with.
Outotec’s aim is to develop its organization in a sustainable manner, and strive for the joint benefit of Outotec, as well as its custom-ers and employees. All employees are entitled to good leadership and the opportunity to grow professionally.
Outotec Code of Conduct, QEHS and HR pol-icies (including equality and anti-harassment policy) and HR handbook define the principles for human capital management at Outotec.
Engaged expertsOutotec aims to employ and retain the best experts in the industry. A positive trend in em-ployee engagement is one of the key perfor-mance indicators and targets; engagement in-dex and attrition rate are measured regularly. Losing talented and competent employees is a risk, as they are key in maintaining Outotec’s position as the leading technology provider.
Outotec implemented a new tool for meas-uring employee engagement in November 2019. 2019 scores are not directly comparable with the previous employee engagement index, but results indicate that employee engage-ment has continued to develop positively. The employee engagement score was 7.5/10 (2018: 61%).
Outotec mitigates employee retention risks through various culture and leadership development programs, fair and competi-tive compensation, talent management and internal job rotation as well as different types of programs designed to support professional growth. Special emphasis is put on support-ing the career development of women. The Human Capital Committee of the Board of
Directors follows actively the development of job grades and salary equality.
Skill development is important in imple-menting company strategy. Outotec’s global training offering consists of training modules and development programs for different target groups as well a wide variety of technical train-ings. The main initiatives in 2019 were continu-ation of services and project management certification programs, as well as initiation of second rounds in junior metallurgist com-petence development program and women’s mentoring program. In addition, a new supply development program was launched. Outotec’s onboarding modules have also been devel-oped actively in 2019. All Outotec managers also participate in leadership development programs and their development in leadership capabilities is actively followed-up.
Health and safety Outotec targets zero harm in occupational health and safety as well as product safety. There are considerable occupational health and safety risks in the mining and metals processing industry. The safety of prod-ucts directly impacts the health and safety of employees, contractors and customers. In addition to working at project sites and manufacturing units, commuting to and from sites which often are located in areas that are difficult to access, and have different driving cultures, impose significant health and safety risks for Outotec employees.
Outotec’s key indicator for safety, lost-time injuries per million working hours (LTIR), was 0.6 in 2019 (2018: 2.0). For Outotec safety comes first, and the company has focused on
15 REPORT BY THE BOARD OF DIRECTORS
safety activities, such as campaigns, hazard management and communication at all levels of organization in 2019. The LTIR reporting covers Outotec’s premises, employees and contractors working under Outotec’s direct supervision, as well as project sites. All employees and contractors have the right to refuse work that would expose them or other people to a hazard or an incident.
The Product Compliance Management process ensures that the products and services designed and supplied by Outotec worldwide reliably meet all applicable safety requirements during all phases of the product life-cycle. The company follows incidents, haz-ards and development initiatives through its QEHS management and product compliance management systems, as well as through customer feedback collected after each major delivery and in customer surveys.
Human rightsOutotec respects internationally proclaimed human rights in line with the company’s com-mitment to the United Nations (UN) Guiding Principles on Business and Human Rights. Outotec joined the UN Global Compact Initia-tive in 2010 and is committed to its principles, as well as to the principles of the Universal Declaration of Human Rights. These commit-ments are re-iterated in Outotec’s Code of Conduct and substantiated in the company’s HR, QEHS and Supplier policies.
Potential risks and human rights impacts in Outotec’s business relate to project site work in high-risk countries. Outotec has assessed the human rights risks in its own operations,
with the focus on service and manufacturing sites. As a result, no significant human rights risks were identified. Outotec has implement-ed guidelines on working conditions regarding blue collar workers, which were aligned with the UN Guiding Principles.
Responsible supply chain As the majority of Outotec’s manufacturing is sourced from external suppliers, there are potentially more human rights-related risks in the supply chain than in Outotec’s own opera-tions. Suppliers are assessed and audited based on risk categorization. Country risk is one criterion in determining the scope of the supplier assessment. To mitigate sustainabil-ity risks, suppliers are required to commit to Outotec’s Supplier Policy, which reflects the principles of the company’s Code of Conduct.
Outotec regularly audits its key suppliers on quality, health and safety as well as human rights-related issues. Supplier development actions are drawn up according to audit find-ings. Outotec audited 34% of its key suppliers in 2019 (2018: 15%). The long-term target is to audit all key suppliers regularly according to this criteria, with supplier development ac-tions drawn up according to audit findings.
Anti-corruption and briberyOutotec endorses responsible business prac-tices and complies with national and inter-national laws and regulations. The company has zero tolerance against corruption, works against corruption in all its forms and requires its suppliers and business partners to follow the same principles and fully comply with
all applicable anti-corruption laws. Outotec’s Code of Conduct, Anti-Corruption Policy, Anti-Money Laundering Policy, Export Control Policy, Agent Policy, and Operational Risk Man-agement Policy are the key policies that define the anti-corruption measures required from Outotec’s employees, agents and suppliers.
To mitigate risks related to corruption and bribery, all employees have to participate in e-learning on the Code of Conduct or attend related classroom training on a regular basis. During 2019, updated Code of Conduct training material was distributed to all employees and contractors with daily access to a computer for self-study. A new Code of Conduct e-learning campaign is planned for 2020. In addition, all Outotec’s senior managers are required to confirm their compliance with Outotec’s Code of Conduct requirements, and the senior man-agers with business responsibilities are also required to complete an e-learning module of internal controls.
The company conducts compliance checks on new customers, suppliers and selected other third parties through a newly estab-lished third-party screening tool, a portal that is linked to Outotec’s customer relationship management and supplier data management systems. All sales agents are further required to confirm their compliance with the com-pany’s Code of Conduct requirements.
Outotec’s Compliance helpline, which is ac-cessible through Outotec’s dedicated internal Compliance portal, intranet, and externally through Outotec’s website is available for anyone to raise concerns related to corruption, human rights, or any illegal and/or unethi-
cal behavior. All concerns raised are treated confidentially, and there is a clear no-retaliation policy. The Chief Compliance Officer reports compliance cases and actions taken quarterly to the Audit and Risk Committee of Outotec’s Board of Directors. Compliance investigations led to the termination of twelve (2018: six) employment contracts during 2019. Outotec did not have to pay any fines or fulfil any non-monetary sanctions for non-compliance with compliance laws in 2019.
SHORT-TERM RISKS AND UNCERTAINTIES Major investments continue to develop slowly, and new investments may either be delayed or existing projects placed on hold or canceled. There is also the continued risk of credit loss, especially in receivables from emerging markets. The supply situation may tighten, which may cause delays or price increases. Any uncertainty in the global macroeconomic environment, especially China’s economic out-look and the recent outbreak of coronavirus, may impact the demand for metals, as well as Outotec’s operations and financial results.
Outotec has a risk that disputes related to project execution, may result in extra costs and/or penalties. In the contracts related to the delivery of major projects, the liquidated damages attributable to, for instance, delayed delivery or non-performance may be signifi-cant. In particular, Outotec has identified a significant risk of claims related to a few large projects. This could in turn lead to decreas-ing headroom under the financial covenants related to capital structure and liquidity.
16 REPORT BY THE BOARD OF DIRECTORS
Outotec has made a EUR 110 million provi-sion for possible costs relating to the ilmenite smelter project in Saudi Arabia (Stock Ex-change Releases on May 31, 2012; October 26, 2018; October 30, 2018 and February 8, 2019). The current estimated provision was based on the progress made with the analysis of the fur-nace. The provision was recorded in Outotec’s fourth quarter 2018 result. The outcome of the analysis, together with other factors such as Outotec's contractual position, will determine the eventual liability and financial impact of this incident for Outotec.
Risks related to Outotec’s business opera-tions are high in certain markets, such as the Middle East, Russia, the Democratic Republic of Congo and Turkey. The geopolitical situation, including risk of trade wars, Brexit, sanctions, security situations, economic conditions, and regulatory environments may change rapidly, causing ongoing business to be delayed, sus-pended or canceled; or may completely prevent Outotec from operating in these areas. This may result in a material impact on Outotec’s financial results and valuation of its assets.
Outotec is involved in a few disputes that may lead to arbitration and court proceedings. Dif-fering interpretations of international contracts and laws may cause uncertainty in estimating the outcome of these disputes. The enforce-ability of contracts in certain market areas may be challenging or difficult to foresee. Moreover, Outotec is subject to local laws and regula-tions and is committed to conducting business in a legal and ethical manner in compliance with the laws and regulations applicable to its
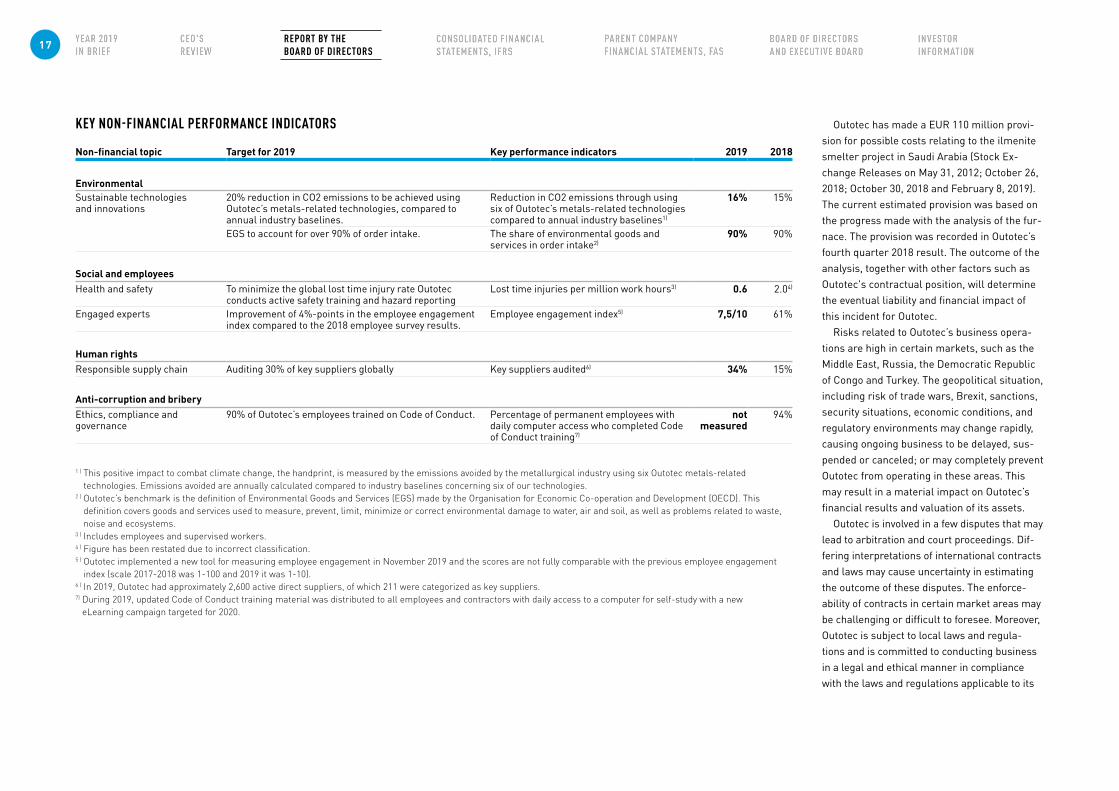
KEY NON-FINANCIAL PERFORMANCE INDICATORS
Non-financial topic Target for 2019 Key performance indicators 2019 2018
EnvironmentalSustainable technologies and innovations
20% reduction in CO2 emissions to be achieved using Outotec’s metals-related technologies, compared to annual industry baselines.
Reduction in CO2 emissions through using six of Outotec’s metals-related technologies compared to annual industry baselines1)
16% 15%
EGS to account for over 90% of order intake. The share of environmental goods and services in order intake2)
90% 90%
Social and employeesHealth and safety To minimize the global lost time injury rate Outotec
conducts active safety training and hazard reportingLost time injuries per million work hours3) 0.6 2.04)
Engaged experts Improvement of 4%-points in the employee engagement index compared to the 2018 employee survey results.
Employee engagement index5) 7,5/10 61%
Human rightsResponsible supply chain Auditing 30% of key suppliers globally Key suppliers audited6) 34% 15%
Anti-corruption and briberyEthics, compliance and governance
90% of Outotec’s employees trained on Code of Conduct. Percentage of permanent employees with daily computer access who completed Code of Conduct training7)
not measured
94%
1 ) This positive impact to combat climate change, the handprint, is measured by the emissions avoided by the metallurgical industry using six Outotec metals-related technologies. Emissions avoided are annually calculated compared to industry baselines concerning six of our technologies.
2 ) Outotec’s benchmark is the definition of Environmental Goods and Services (EGS) made by the Organisation for Economic Co-operation and Development (OECD). This definition covers goods and services used to measure, prevent, limit, minimize or correct environmental damage to water, air and soil, as well as problems related to waste, noise and ecosystems.
3 ) Includes employees and supervised workers.4 ) Figure has been restated due to incorrect classification.5 ) Outotec implemented a new tool for measuring employee engagement in November 2019 and the scores are not fully comparable with the previous employee engagement
index (scale 2017-2018 was 1-100 and 2019 it was 1-10).6 ) In 2019, Outotec had approximately 2,600 active direct suppliers, of which 211 were categorized as key suppliers.7) During 2019, updated Code of Conduct training material was distributed to all employees and contractors with daily access to a computer for self-study with a new
eLearning campaign targeted for 2020.
17 REPORT BY THE BOARD OF DIRECTORS
business. Nevertheless, there is a risk that Ou-totec’s employees, suppliers, agents or other representatives may act in a way that violates applicable laws and regulations or they may act unethicall. This may make Outotec subject to investigations and may cause financial losses and damages to Outotec.
More information about Outotec’s business risks and risk management is available in the Notes to the Financial Statements and on the company’s website at www.outotec.com/investors.
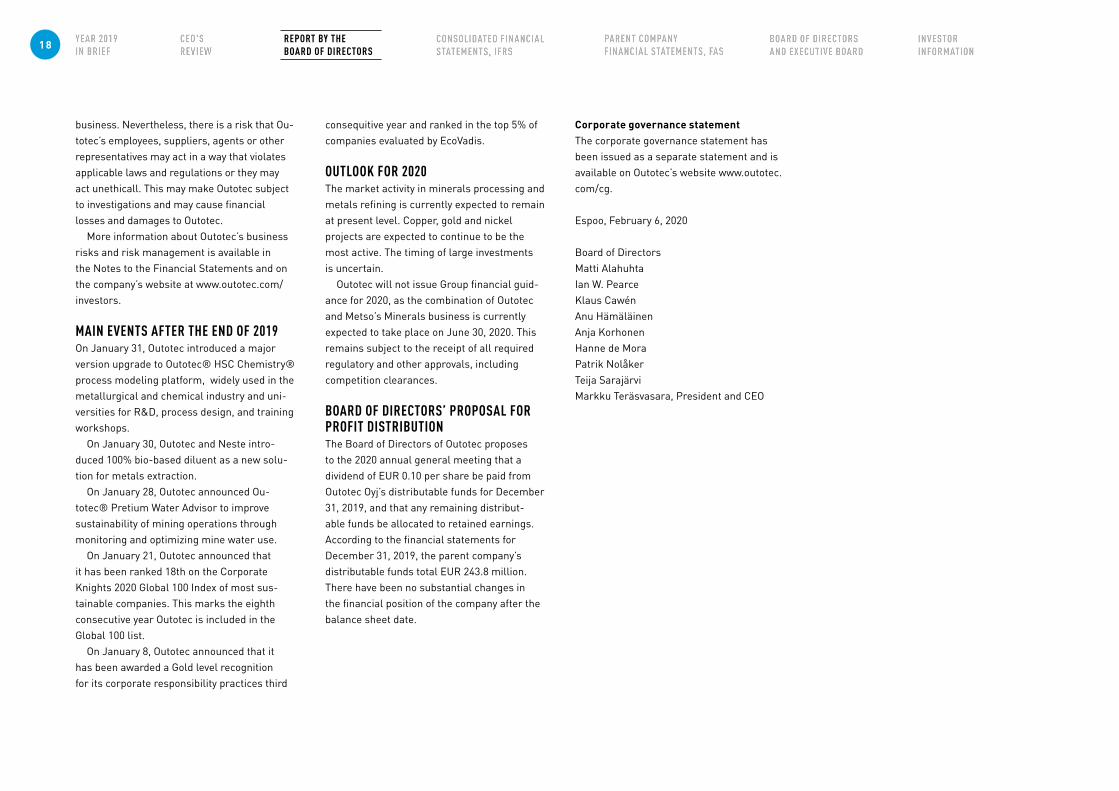
MAIN EVENTS AFTER THE END OF 2019On January 31, Outotec introduced a major version upgrade to Outotec® HSC Chemistry® process modeling platform, widely used in the metallurgical and chemical industry and uni-versities for R&D, process design, and training workshops.
On January 30, Outotec and Neste intro-duced 100% bio-based diluent as a new solu-tion for metals extraction.
On January 28, Outotec announced Ou-totec® Pretium Water Advisor to improve sustainability of mining operations through monitoring and optimizing mine water use.
On January 21, Outotec announced that it has been ranked 18th on the Corporate Knights 2020 Global 100 Index of most sus-tainable companies. This marks the eighth consecutive year Outotec is included in the Global 100 list.
On January 8, Outotec announced that it has been awarded a Gold level recognition for its corporate responsibility practices third
consequitive year and ranked in the top 5% of companies evaluated by EcoVadis.
OUTLOOK FOR 2020 The market activity in minerals processing and metals refining is currently expected to remain at present level. Copper, gold and nickel projects are expected to continue to be the most active. The timing of large investments is uncertain.
Outotec will not issue Group financial guid-ance for 2020, as the combination of Outotec and Metso’s Minerals business is currently expected to take place on June 30, 2020. This remains subject to the receipt of all required regulatory and other approvals, including competition clearances.
BOARD OF DIRECTORS’ PROPOSAL FOR PROFIT DISTRIBUTIONThe Board of Directors of Outotec proposes to the 2020 annual general meeting that a dividend of EUR 0.10 per share be paid from Outotec Oyj’s distributable funds for December 31, 2019, and that any remaining distribut-able funds be allocated to retained earnings. According to the financial statements for December 31, 2019, the parent company’s distributable funds total EUR 243.8 million. There have been no substantial changes in the financial position of the company after the balance sheet date.
Corporate governance statement The corporate governance statement has been issued as a separate statement and is available on Outotec’s website www.outotec.com/cg.
Espoo, February 6, 2020
Board of Directors Matti Alahuhta Ian W. Pearce Klaus Cawén Anu HämäläinenAnja Korhonen Hanne de Mora Patrik Nolåker Teija SarajärviMarkku Teräsvasara, President and CEO
18 REPORT BY THE BOARD OF DIRECTORS
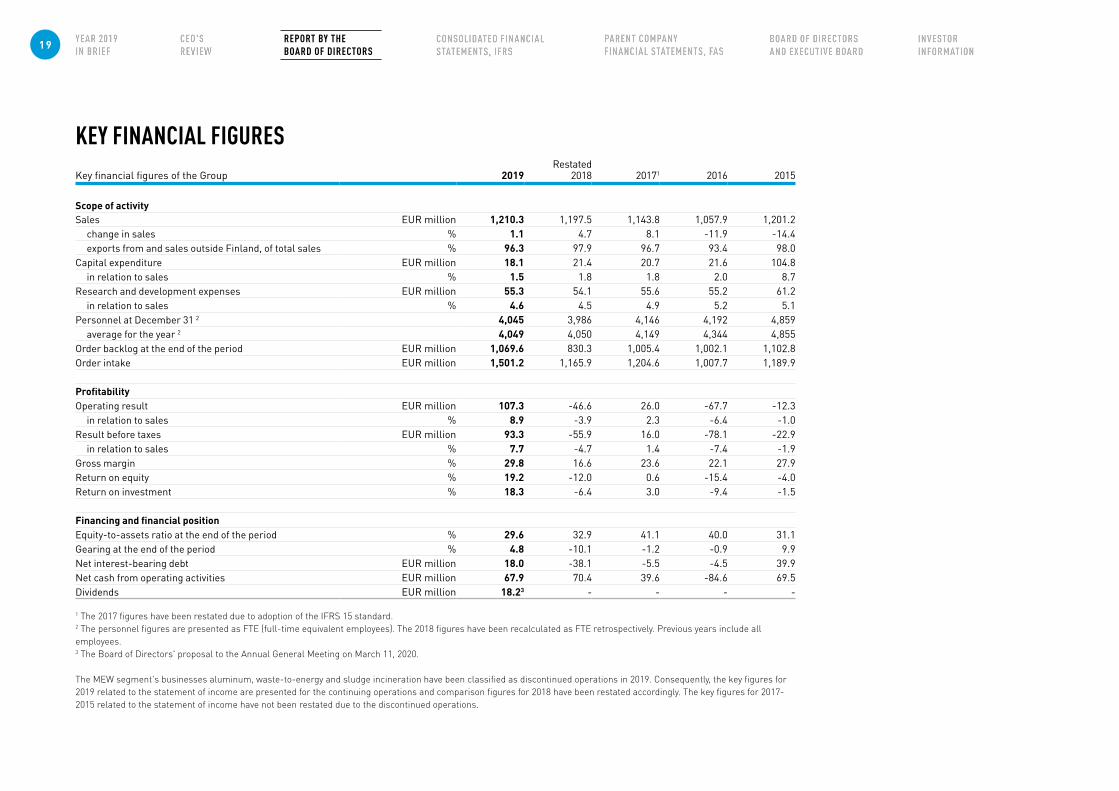
KEY FINANCIAL FIGURES Key financial figures of the Group 2019
Restated2018 20171 2016 2015
Scope of activitySales EUR million 1,210.3 1,197.5 1,143.8 1,057.9 1,201.2
change in sales % 1.1 4.7 8.1 -11.9 -14.4exports from and sales outside Finland, of total sales % 96.3 97.9 96.7 93.4 98.0
Capital expenditure EUR million 18.1 21.4 20.7 21.6 104.8in relation to sales % 1.5 1.8 1.8 2.0 8.7
Research and development expenses EUR million 55.3 54.1 55.6 55.2 61.2in relation to sales % 4.6 4.5 4.9 5.2 5.1
Personnel at December 31 2 4,045 3,986 4,146 4,192 4,859average for the year 2 4,049 4,050 4,149 4,344 4,855
Order backlog at the end of the period EUR million 1,069.6 830.3 1,005.4 1,002.1 1,102.8Order intake EUR million 1,501.2 1,165.9 1,204.6 1,007.7 1,189.9
ProfitabilityOperating result EUR million 107.3 -46.6 26.0 -67.7 -12.3
in relation to sales % 8.9 -3.9 2.3 -6.4 -1.0Result before taxes EUR million 93.3 -55.9 16.0 -78.1 -22.9
in relation to sales % 7.7 -4.7 1.4 -7.4 -1.9Gross margin % 29.8 16.6 23.6 22.1 27.9Return on equity % 19.2 -12.0 0.6 -15.4 -4.0Return on investment % 18.3 -6.4 3.0 -9.4 -1.5
Financing and financial positionEquity-to-assets ratio at the end of the period % 29.6 32.9 41.1 40.0 31.1Gearing at the end of the period % 4.8 -10.1 -1.2 -0.9 9.9Net interest-bearing debt EUR million 18.0 -38.1 -5.5 -4.5 39.9Net cash from operating activities EUR million 67.9 70.4 39.6 -84.6 69.5Dividends EUR million 18.23 - - - -
1 The 2017 figures have been restated due to adoption of the IFRS 15 standard. 2 The personnel figures are presented as FTE (full-time equivalent employees). The 2018 figures have been recalculated as FTE retrospectively. Previous years include all employees.3 The Board of Directors' proposal to the Annual General Meeting on March 11, 2020.
The MEW segment's businesses aluminum, waste-to-energy and sludge incineration have been classified as discontinued operations in 2019. Consequently, the key figures for 2019 related to the statement of income are presented for the continuing operations and comparison figures for 2018 have been restated accordingly. The key figures for 2017-2015 related to the statement of income have not been restated due to the discontinued operations.
19 REPORT BY THE BOARD OF DIRECTORS
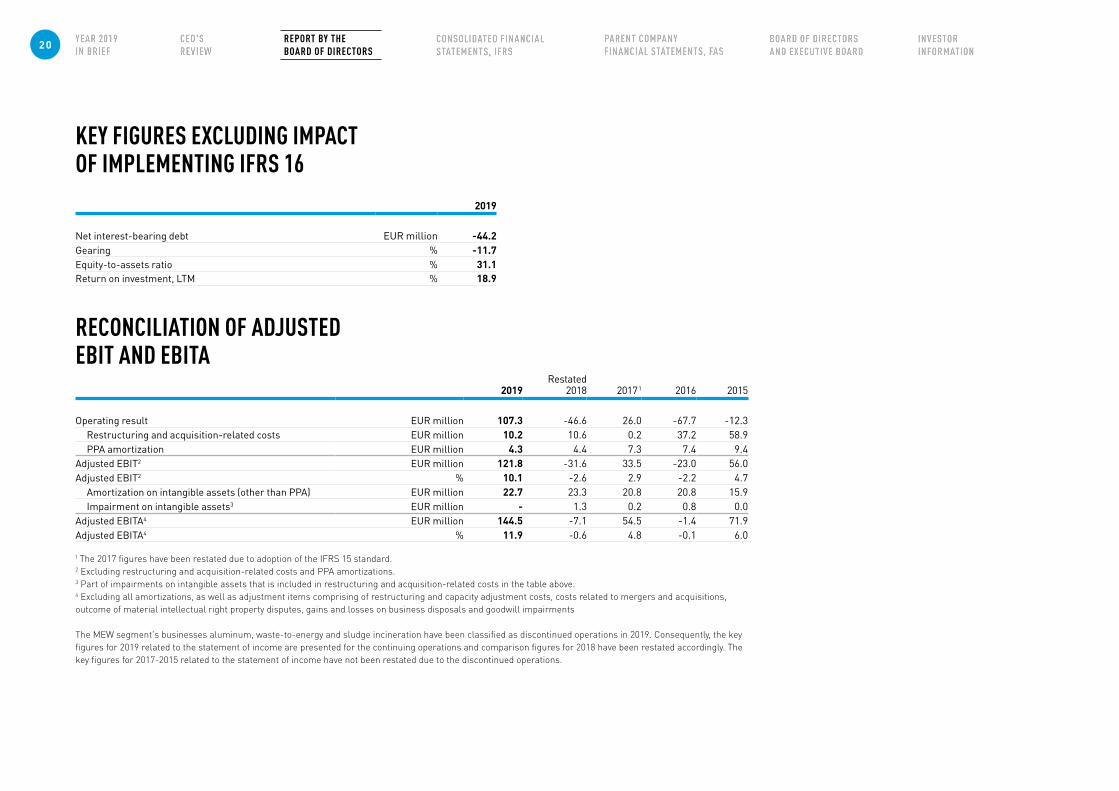
KEY FIGURES EXCLUDING IMPACT OF IMPLEMENTING IFRS 16
2019
Net interest-bearing debt EUR million -44.2Gearing % -11.7Equity-to-assets ratio % 31.1Return on investment, LTM % 18.9
RECONCILIATION OF ADJUSTED EBIT AND EBITA
2019Restated
2018 20171 2016 2015
Operating result EUR million 107.3 -46.6 26.0 -67.7 -12.3Restructuring and acquisition-related costs EUR million 10.2 10.6 0.2 37.2 58.9PPA amortization EUR million 4.3 4.4 7.3 7.4 9.4
Adjusted EBIT2 EUR million 121.8 -31.6 33.5 -23.0 56.0Adjusted EBIT2 % 10.1 -2.6 2.9 -2.2 4.7
Amortization on intangible assets (other than PPA) EUR million 22.7 23.3 20.8 20.8 15.9Impairment on intangible assets3 EUR million - 1.3 0.2 0.8 0.0
Adjusted EBITA4 EUR million 144.5 -7.1 54.5 -1.4 71.9Adjusted EBITA4 % 11.9 -0.6 4.8 -0.1 6.0
1 The 2017 figures have been restated due to adoption of the IFRS 15 standard.2 Excluding restructuring and acquisition-related costs and PPA amortizations.3 Part of impairments on intangible assets that is included in restructuring and acquisition-related costs in the table above.4 Excluding all amortizations, as well as adjustment items comprising of restructuring and capacity adjustment costs, costs related to mergers and acquisitions, outcome of material intellectual right property disputes, gains and losses on business disposals and goodwill impairments
The MEW segment's businesses aluminum, waste-to-energy and sludge incineration have been classified as discontinued operations in 2019. Consequently, the key figures for 2019 related to the statement of income are presented for the continuing operations and comparison figures for 2018 have been restated accordingly. The key figures for 2017-2015 related to the statement of income have not been restated due to the discontinued operations.
20 REPORT BY THE BOARD OF DIRECTORS
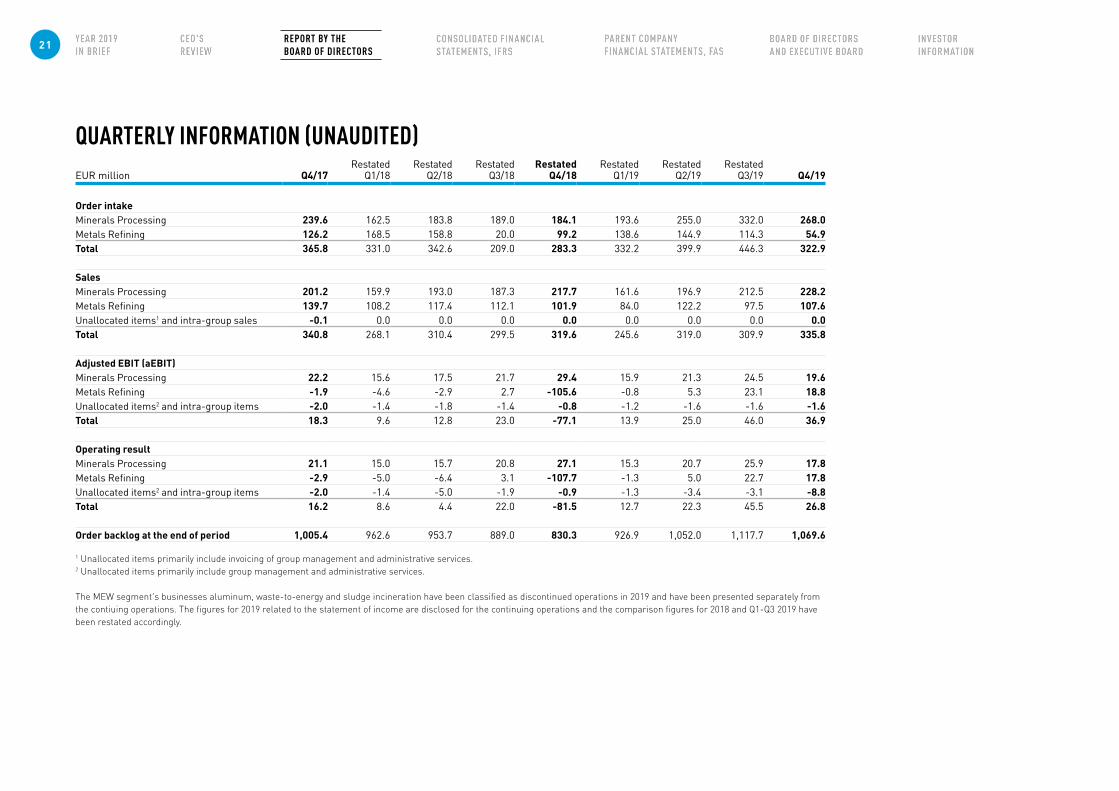
QUARTERLY INFORMATION (UNAUDITED) EUR million Q4/17
RestatedQ1/18
Restated Q2/18
Restated Q3/18
Restated Q4/18
Restated Q1/19
Restated Q2/19
Restated Q3/19 Q4/19
Order intakeMinerals Processing 239.6 162.5 183.8 189.0 184.1 193.6 255.0 332.0 268.0Metals Refining 126.2 168.5 158.8 20.0 99.2 138.6 144.9 114.3 54.9Total 365.8 331.0 342.6 209.0 283.3 332.2 399.9 446.3 322.9
SalesMinerals Processing 201.2 159.9 193.0 187.3 217.7 161.6 196.9 212.5 228.2Metals Refining 139.7 108.2 117.4 112.1 101.9 84.0 122.2 97.5 107.6Unallocated items1 and intra-group sales -0.1 0.0 0.0 0.0 0.0 0.0 0.0 0.0 0.0Total 340.8 268.1 310.4 299.5 319.6 245.6 319.0 309.9 335.8
Adjusted EBIT (aEBIT)Minerals Processing 22.2 15.6 17.5 21.7 29.4 15.9 21.3 24.5 19.6Metals Refining -1.9 -4.6 -2.9 2.7 -105.6 -0.8 5.3 23.1 18.8Unallocated items2 and intra-group items -2.0 -1.4 -1.8 -1.4 -0.8 -1.2 -1.6 -1.6 -1.6Total 18.3 9.6 12.8 23.0 -77.1 13.9 25.0 46.0 36.9
Operating resultMinerals Processing 21.1 15.0 15.7 20.8 27.1 15.3 20.7 25.9 17.8Metals Refining -2.9 -5.0 -6.4 3.1 -107.7 -1.3 5.0 22.7 17.8Unallocated items2 and intra-group items -2.0 -1.4 -5.0 -1.9 -0.9 -1.3 -3.4 -3.1 -8.8Total 16.2 8.6 4.4 22.0 -81.5 12.7 22.3 45.5 26.8
Order backlog at the end of period 1,005.4 962.6 953.7 889.0 830.3 926.9 1,052.0 1,117.7 1,069.6
1 Unallocated items primarily include invoicing of group management and administrative services.2 Unallocated items primarily include group management and administrative services.
The MEW segment's businesses aluminum, waste-to-energy and sludge incineration have been classified as discontinued operations in 2019 and have been presented separately from the contiuing operations. The figures for 2019 related to the statement of income are disclosed for the continuing operations and the comparison figures for 2018 and Q1-Q3 2019 have been restated accordingly.
21 REPORT BY THE BOARD OF DIRECTORS
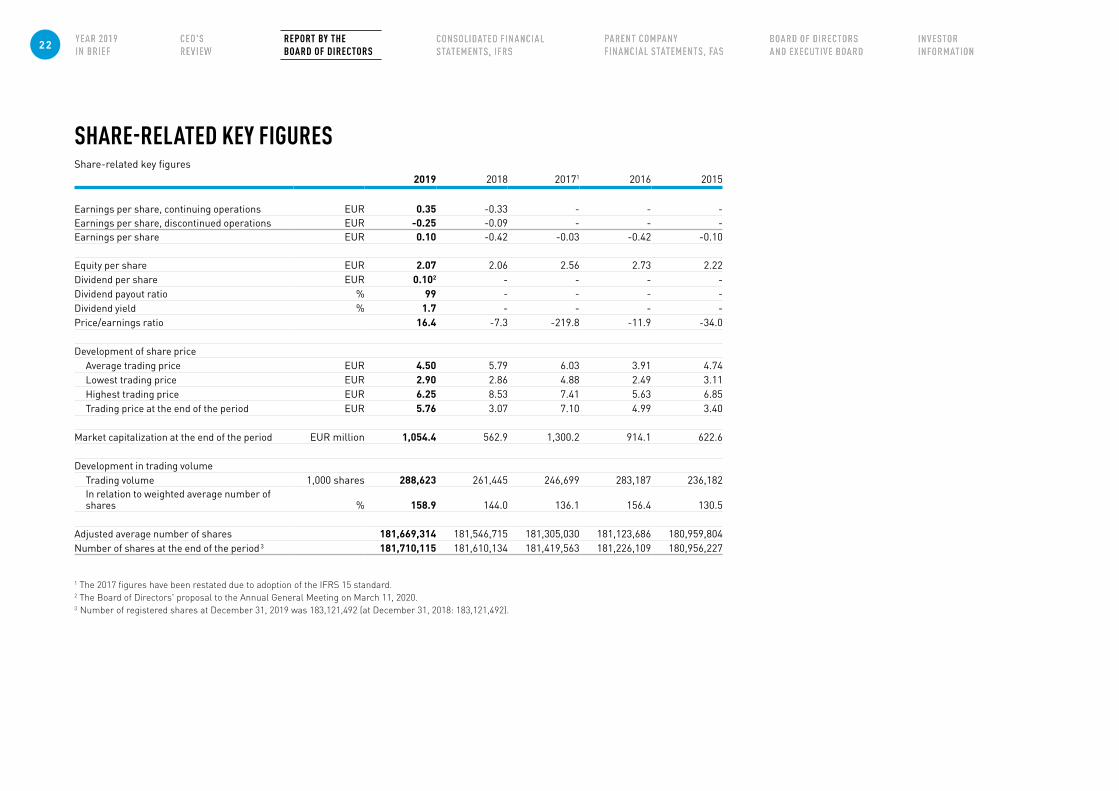
SHARE-RELATED KEY FIGURES Share-related key figures
2019 2018 20171 2016 2015
Earnings per share, continuing operations EUR 0.35 -0.33 - - -Earnings per share, discontinued operations EUR -0.25 -0.09 - - -Earnings per share EUR 0.10 -0.42 -0.03 -0.42 -0.10
Equity per share EUR 2.07 2.06 2.56 2.73 2.22Dividend per share EUR 0.102 - - - -Dividend payout ratio % 99 - - - -Dividend yield % 1.7 - - - -Price/earnings ratio 16.4 -7.3 -219.8 -11.9 -34.0
Development of share priceAverage trading price EUR 4.50 5.79 6.03 3.91 4.74Lowest trading price EUR 2.90 2.86 4.88 2.49 3.11Highest trading price EUR 6.25 8.53 7.41 5.63 6.85Trading price at the end of the period EUR 5.76 3.07 7.10 4.99 3.40
Market capitalization at the end of the period EUR million 1,054.4 562.9 1,300.2 914.1 622.6
Development in trading volumeTrading volume 1,000 shares 288,623 261,445 246,699 283,187 236,182In relation to weighted average number of shares % 158.9 144.0 136.1 156.4 130.5
Adjusted average number of shares 181,669,314 181,546,715 181,305,030 181,123,686 180,959,804Number of shares at the end of the period 3 181,710,115 181,610,134 181,419,563 181,226,109 180,956,227
1 The 2017 figures have been restated due to adoption of the IFRS 15 standard.2 The Board of Directors' proposal to the Annual General Meeting on March 11, 2020.3 Number of registered shares at December 31, 2019 was 183,121,492 (at December 31, 2018: 183,121,492).
22 REPORT BY THE BOARD OF DIRECTORS

DEFINITION OF KEY FINANCIAL FIGURES Change in comparable currencies
=Reporting period's figures converted using foreign exhange rates duringthe comparison period
Gross margin, % =Sales - cost of sales
Salesx 100
Adjusted EBITA (aEBITA) =
Operating result excluding all amortizations, as well as adjustment itemscomprising of restructuring and capacity adjustment costs, costs related to mergers and acquisitions, outcome of material intellectual rights property disputes, gains and losses on business disposals and goodwill impairments
Adjusted EBIT (aEBIT) =
Operating result excluding restructuring-related items, items related to mergers and acquisitions, purchase price allocation (PPA) amortizations, and goodwill impairments
Earnings per share = Result for the period attributable to the equity holders of theparent company - hybrid loan interest, net of tax
Avarage number of shares during the period
Diluted earnings per share =
Result for the period attributable to the equity holders of theparent company - hybrid loan interest, net of tax
Diluted number of shares during the period
Net interest- bearing debt =
Borrowings + lease liabilities - other shares and securities - loan receiveables - interest bearing trade and other receivabales - cash and cash equivalents
GearingNet interest-bearing debt
× 100Total equity
Equity-to-assets ratio =
Total equity × 100
Total assets – net advances received
Equity per share =Total equity attributable to the equity holders of the parent
Number of shares at the end of the period
Net working capital =
Trade and other receivables (excl. accrued interests) + inventories + derivative financial instruments (assets) - pension obligations - provisions- trade and other payables (excl. accrued interests) - derivative financialinstruments (liabilities)
Capital expenditure = Additions in intagible assets and property, plant and equipment
Research and development expenses
Research and development expenses in the statement of comprehensive income (including expenses covered by grants received)
Return on investment(last 12 months)
=Operating result + finance income (last 12 months)
× 100Total equity + borrowings + lease liabilities (12 months' average)
Return on equity(last 12 months) =
Result for the period (last 12 months)× 100
Total equity (average for the 12 months)
Dividend per share =Dividend for the financial year
Number of shares outstanding at the end of the period
Dividend payout ratio =
Dividend for the financial year× 100Result for the period attributable to the equity holders of the parent
company
Dividend yield =Dividend per share
× 100Adjusted trading price at the end of the period
Price/earnings ratio (P/E) =
Adjusted trading price at the end of the period
Earnings per share
Average trading price =
EUR amount traded during the period
Number of shares at the end of period
Market capitalization at end of the period
= Number of shares at the end of period × trading price at the end of the period
Trading volume = Number of shares traded during the period, and in relation tothe weighted average number of shares during the period
23 REPORT BY THE BOARD OF DIRECTORS

CONSOLIDATED FINANCIAL STATEMENTS, IFRS
Highlights and management’s comments are marked with orange.
ABOUT THIS REPORT Accounting principles and accounting estimates and judge-ments are presented together with the relevant note. The aim is to improve the presentation of the operating perfor-mance, what assets were used in the business operations and how they were financed.
Accounting principles
Accounting principles are presented on an orange background.
Kirjanpidolliset arviot ja harkintaan Accounting estimates and judgements are presented on a grey background.
Accounting estimates and judgements
CONSOLIDATED FINANCIAL STATEMENTS, IFRS 24
Consolidated statement of comprehensive income 25
Consolidated statement of financial position 26
Consolidated statement of cash flows 27
Consolidated statement of changes in equity 28
Notes to the consolidated financial statements 29
Basis of preparation 30
Adoption of new and amended standards 31
Business operations 33
1.1. Operating performance 34
1.1 Operating segments and geographical areas 35
1.2 Customer contracts 38
1.3 Function expenses by nature 40
1.4 Employee benefit expenses 40
1.5 Other income and expenses 41
1.6 Earnings per share 42
1.7 Income taxes 43
2. Net working capital 46
2.1 Inventories 47
2.2 Trade and other receivables 47
2.3 Trade and other payables 48
2.4 Provisions 49
Capital structure 50
3. Fixed assets and other investments 51
3.1 Business combinations 51
3.2 Intangible assets and property, plant and equipment 51
3.3 Goodwill 55
3.4 Associated companies 56
3.5 Other shares and securities 57
4. Financing 58
4.1 Equity 58
4.2 Interest-bearing receivables and liabilities 59
4.3 Cash and cash equivalents 61
4.4 Finance income and expenses 61
4.5 Financial risk management 62
4.6 Derivative instruments 67
4.7 Fair values of financial assets and liabilities 69
Other notes 72
5.1 Discontinued operations and disposal group classified as held for sale 72
5.2 Share-based payments 74
5.3 Pension obligations 76
5.4 Leases 78
5.5 Commitments and contingent liabilities 79
5.6 Related party transactions 80
5.7 Disputes and litigations 80
5.8 Events after the balance sheet date 80
5.9 Subsidaries 81
24 CONSOLIDATED FINANCIAL STATEMENTS, IFRS
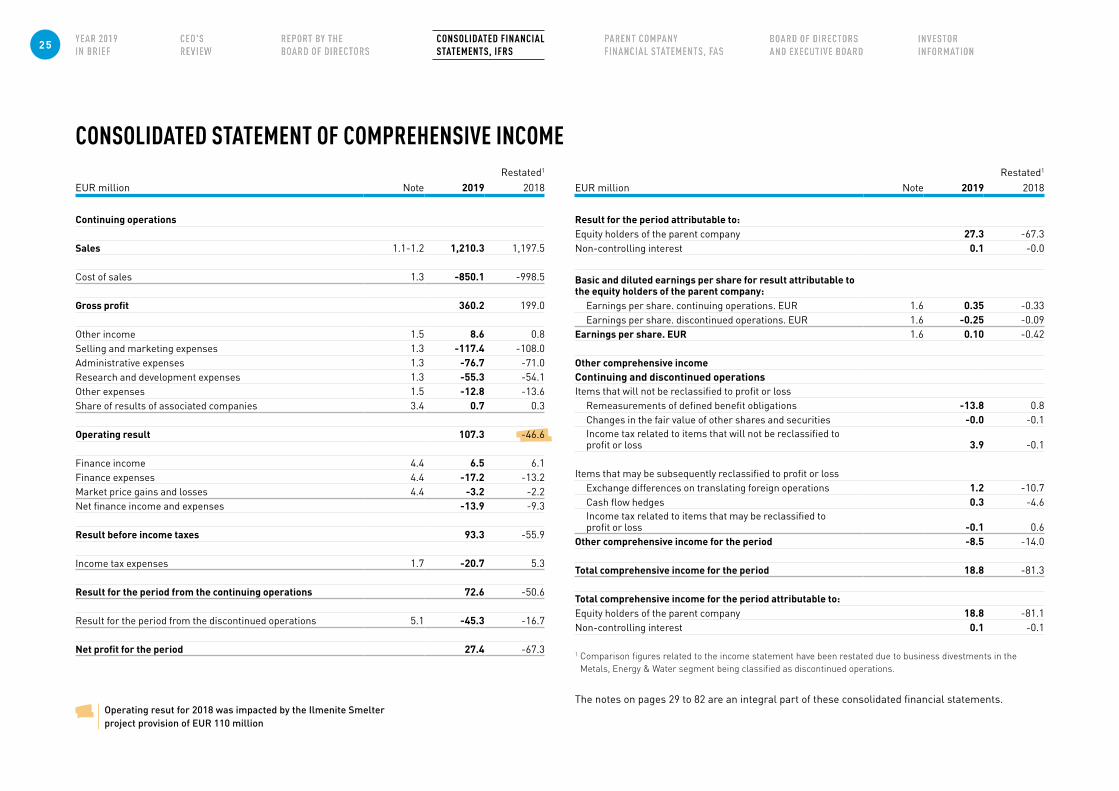
CONSOLIDATED STATEMENT OF COMPREHENSIVE INCOMERestated1
EUR million Note 2019 2018
Continuing operations
Sales 1.1-1.2 1,210.3 1,197.5
Cost of sales 1.3 -850.1 -998.5
Gross profit 360.2 199.0
Other income 1.5 8.6 0.8Selling and marketing expenses 1.3 -117.4 -108.0Administrative expenses 1.3 -76.7 -71.0Research and development expenses 1.3 -55.3 -54.1Other expenses 1.5 -12.8 -13.6Share of results of associated companies 3.4 0.7 0.3
Operating result 107.3 -46.6
Finance income 4.4 6.5 6.1Finance expenses 4.4 -17.2 -13.2Market price gains and losses 4.4 -3.2 -2.2Net finance income and expenses -13.9 -9.3
Result before income taxes 93.3 -55.9
Income tax expenses 1.7 -20.7 5.3
Result for the period from the continuing operations 72.6 -50.6
Result for the period from the discontinued operations 5.1 -45.3 -16.7
Net profit for the period 27.4 -67.3
Restated1 EUR million Note 2019 2018
Result for the period attributable to:Equity holders of the parent company 27.3 -67.3Non-controlling interest 0.1 -0.0
Basic and diluted earnings per share for result attributable to the equity holders of the parent company:
Earnings per share. continuing operations. EUR 1.6 0.35 -0.33Earnings per share. discontinued operations. EUR 1.6 -0.25 -0.09
Earnings per share. EUR 1.6 0.10 -0.42
Other comprehensive incomeContinuing and discontinued operationsItems that will not be reclassified to profit or loss
Remeasurements of defined benefit obligations -13.8 0.8Changes in the fair value of other shares and securities -0.0 -0.1Income tax related to items that will not be reclassified to profit or loss 3.9 -0.1
Items that may be subsequently reclassified to profit or lossExchange differences on translating foreign operations 1.2 -10.7Cash flow hedges 0.3 -4.6Income tax related to items that may be reclassified to profit or loss -0.1 0.6
Other comprehensive income for the period -8.5 -14.0
Total comprehensive income for the period 18.8 -81.3
Total comprehensive income for the period attributable to:Equity holders of the parent company 18.8 -81.1Non-controlling interest 0.1 -0.1
Operating resut for 2018 was impacted by the Ilmenite Smelter project provision of EUR 110 million
1 Comparison figures related to the income statement have been restated due to business divestments in the Metals, Energy & Water segment being classified as discontinued operations.
The notes on pages 29 to 82 are an integral part of these consolidated financial statements.
25 CONSOLIDATED FINANCIAL STATEMENTS, IFRS
including the provision made for the ilmenite smelter project
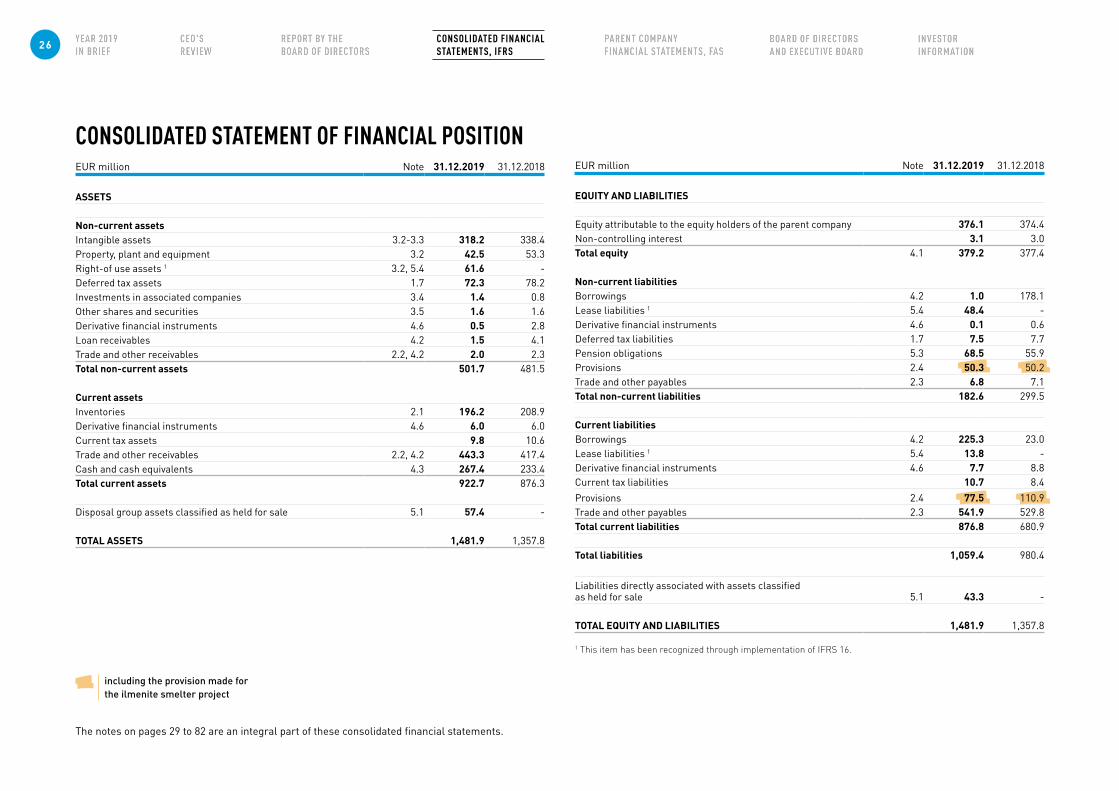
CONSOLIDATED STATEMENT OF FINANCIAL POSITIONEUR million Note 31.12.2019 31.12.2018
ASSETS
Non-current assetsIntangible assets 3.2-3.3 318.2 338.4Property, plant and equipment 3.2 42.5 53.3Right-of use assets 1 3.2, 5.4 61.6 -Deferred tax assets 1.7 72.3 78.2Investments in associated companies 3.4 1.4 0.8Other shares and securities 3.5 1.6 1.6Derivative financial instruments 4.6 0.5 2.8Loan receivables 4.2 1.5 4.1Trade and other receivables 2.2, 4.2 2.0 2.3Total non-current assets 501.7 481.5
Current assetsInventories 2.1 196.2 208.9Derivative financial instruments 4.6 6.0 6.0Current tax assets 9.8 10.6Trade and other receivables 2.2, 4.2 443.3 417.4Cash and cash equivalents 4.3 267.4 233.4Total current assets 922.7 876.3
Disposal group assets classified as held for sale 5.1 57.4 -
TOTAL ASSETS 1,481.9 1,357.8
EUR million Note 31.12.2019 31.12.2018
EQUITY AND LIABILITIES
Equity attributable to the equity holders of the parent company 376.1 374.4Non-controlling interest 3.1 3.0Total equity 4.1 379.2 377.4
Non-current liabilitiesBorrowings 4.2 1.0 178.1Lease liabilities 1 5.4 48.4 -Derivative financial instruments 4.6 0.1 0.6Deferred tax liabilities 1.7 7.5 7.7Pension obligations 5.3 68.5 55.9Provisions 2.4 50.3 50.2Trade and other payables 2.3 6.8 7.1Total non-current liabilities 182.6 299.5
Current liabilitiesBorrowings 4.2 225.3 23.0Lease liabilities 1 5.4 13.8 -Derivative financial instruments 4.6 7.7 8.8Current tax liabilities 10.7 8.4Provisions 2.4 77.5 110.9Trade and other payables 2.3 541.9 529.8Total current liabilities 876.8 680.9
Total liabilities 1,059.4 980.4
Liabilities directly associated with assets classified as held for sale 5.1 43.3 -
TOTAL EQUITY AND LIABILITIES 1,481.9 1,357.8
1 This item has been recognized through implementation of IFRS 16.
The notes on pages 29 to 82 are an integral part of these consolidated financial statements.
26 CONSOLIDATED FINANCIAL STATEMENTS, IFRS
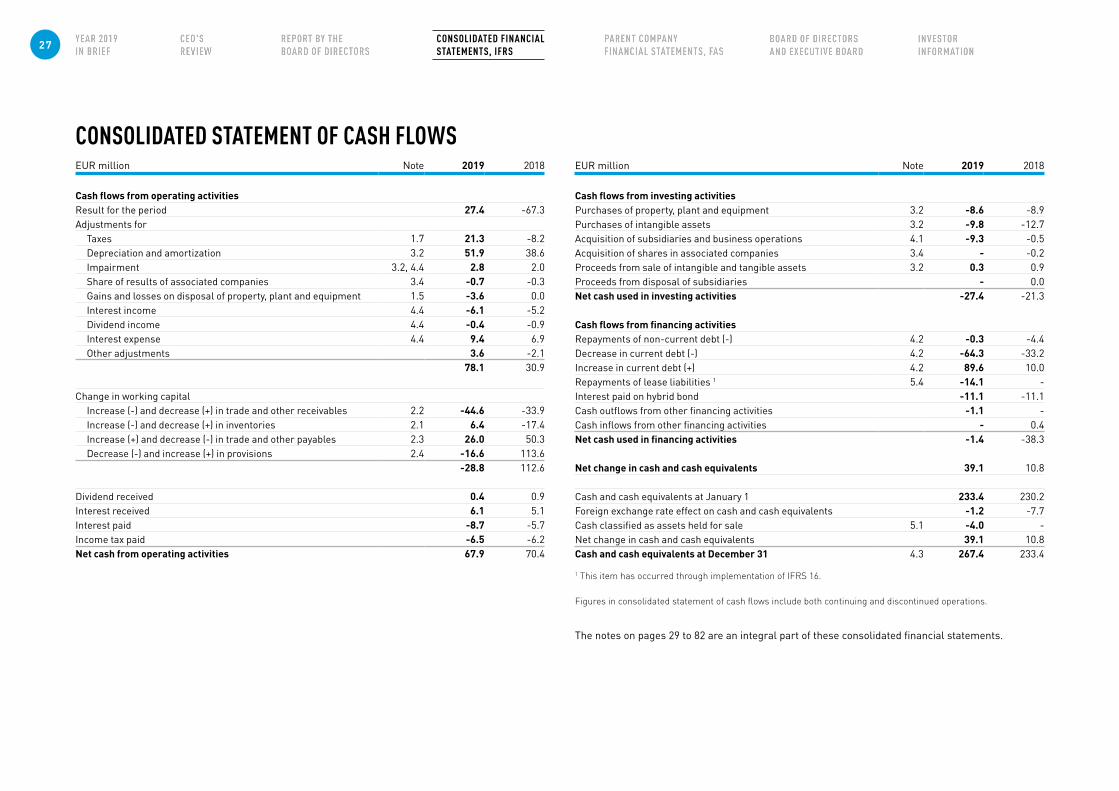
CONSOLIDATED STATEMENT OF CASH FLOWSEUR million Note 2019 2018
Cash flows from operating activitiesResult for the period 27.4 -67.3Adjustments for
Taxes 1.7 21.3 -8.2Depreciation and amortization 3.2 51.9 38.6Impairment 3.2, 4.4 2.8 2.0Share of results of associated companies 3.4 -0.7 -0.3Gains and losses on disposal of property, plant and equipment 1.5 -3.6 0.0Interest income 4.4 -6.1 -5.2Dividend income 4.4 -0.4 -0.9Interest expense 4.4 9.4 6.9Other adjustments 3.6 -2.1
78.1 30.9
Change in working capitalIncrease (-) and decrease (+) in trade and other receivables 2.2 -44.6 -33.9Increase (-) and decrease (+) in inventories 2.1 6.4 -17.4Increase (+) and decrease (-) in trade and other payables 2.3 26.0 50.3Decrease (-) and increase (+) in provisions 2.4 -16.6 113.6
-28.8 112.6
Dividend received 0.4 0.9Interest received 6.1 5.1Interest paid -8.7 -5.7Income tax paid -6.5 -6.2Net cash from operating activities 67.9 70.4
EUR million Note 2019 2018
Cash flows from investing activitiesPurchases of property, plant and equipment 3.2 -8.6 -8.9Purchases of intangible assets 3.2 -9.8 -12.7Acquisition of subsidiaries and business operations 4.1 -9.3 -0.5Acquisition of shares in associated companies 3.4 - -0.2Proceeds from sale of intangible and tangible assets 3.2 0.3 0.9Proceeds from disposal of subsidiaries - 0.0Net cash used in investing activities -27.4 -21.3
Cash flows from financing activitiesRepayments of non-current debt (-) 4.2 -0.3 -4.4Decrease in current debt (-) 4.2 -64.3 -33.2Increase in current debt (+) 4.2 89.6 10.0Repayments of lease liabilities 1 5.4 -14.1 -Interest paid on hybrid bond -11.1 -11.1Cash outflows from other financing activities -1.1 -Cash inflows from other financing activities - 0.4Net cash used in financing activities -1.4 -38.3
Net change in cash and cash equivalents 39.1 10.8
Cash and cash equivalents at January 1 233.4 230.2Foreign exchange rate effect on cash and cash equivalents -1.2 -7.7Cash classified as assets held for sale 5.1 -4.0 -Net change in cash and cash equivalents 39.1 10.8Cash and cash equivalents at December 31 4.3 267.4 233.4
1 T his item has occurred through implementation of IFRS 16.
Figures in consolidated statement of cash flows include both continuing and discontinued operations.
The notes on pages 29 to 82 are an integral part of these consolidated financial statements.
27 CONSOLIDATED FINANCIAL STATEMENTS, IFRS
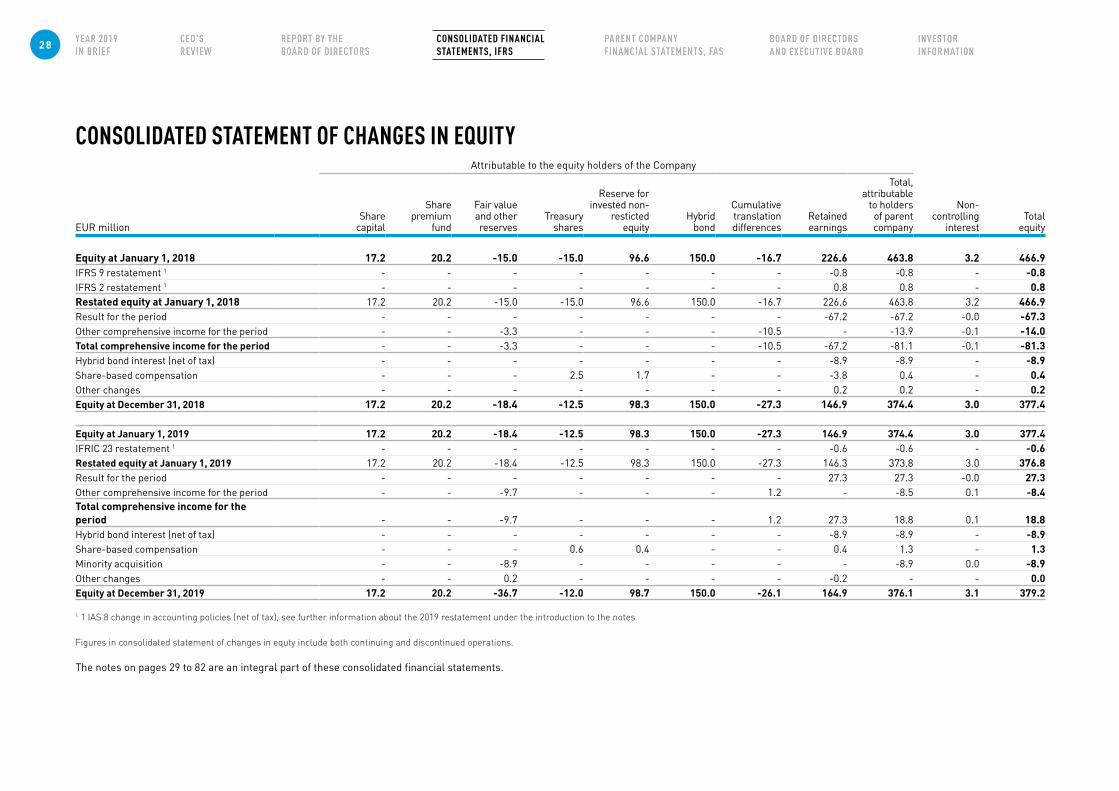
CONSOLIDATED STATEMENT OF CHANGES IN EQUITYAttributable to the equity holders of the Company
EUR millionShare
capital
Share premium
fund
Fair value and other
reservesTreasury
shares
Reserve for invested non-
resticted equity
Hybrid bond
Cumulative translation differences
Retained earnings
Total, attributable
to holders of parent company
Non-controlling
interestTotal
equity
Equity at January 1, 2018 17.2 20.2 -15.0 -15.0 96.6 150.0 -16.7 226.6 463.8 3.2 466.9IFRS 9 restatement 1 - - - - - - - -0.8 -0.8 - -0.8IFRS 2 restatement 1 - - - - - - - 0.8 0.8 - 0.8Restated equity at January 1, 2018 17.2 20.2 -15.0 -15.0 96.6 150.0 -16.7 226.6 463.8 3.2 466.9Result for the period - - - - - - - -67.2 -67.2 -0.0 -67.3Other comprehensive income for the period - - -3.3 - - - -10.5 - -13.9 -0.1 -14.0Total comprehensive income for the period - - -3.3 - - - -10.5 -67.2 -81.1 -0.1 -81.3Hybrid bond interest (net of tax) - - - - - - - -8.9 -8.9 - -8.9Share-based compensation - - - 2.5 1.7 - - -3.8 0.4 - 0.4Other changes - - - - - - - 0.2 0.2 - 0.2Equity at December 31, 2018 17.2 20.2 -18.4 -12.5 98.3 150.0 -27.3 146.9 374.4 3.0 377.4
Equity at January 1, 2019 17.2 20.2 -18.4 -12.5 98.3 150.0 -27.3 146.9 374.4 3.0 377.4IFRIC 23 restatement 1 - - - - - - - -0.6 -0.6 - -0.6Restated equity at January 1, 2019 17.2 20.2 -18.4 -12.5 98.3 150.0 -27.3 146.3 373.8 3.0 376.8Result for the period - - - - - - - 27.3 27.3 -0.0 27.3Other comprehensive income for the period - - -9.7 - - - 1.2 - -8.5 0.1 -8.4Total comprehensive income for the period - - -9.7 - - - 1.2 27.3 18.8 0.1 18.8Hybrid bond interest (net of tax) - - - - - - - -8.9 -8.9 - -8.9Share-based compensation - - - 0.6 0.4 - - 0.4 1.3 - 1.3Minority acquisition - - -8.9 - - - - - -8.9 0.0 -8.9Other changes - - 0.2 - - - - -0.2 - - 0.0Equity at December 31, 2019 17.2 20.2 -36.7 -12.0 98.7 150.0 -26.1 164.9 376.1 3.1 379.2
1 1 IAS 8 change in accounting policies (net of tax), see further information about the 2019 restatement under the introduction to the notes
Figures in consolidated statement of changes in equty include both continuing and discontinued operations.
The notes on pages 29 to 82 are an integral part of these consolidated financial statements.
28 CONSOLIDATED FINANCIAL STATEMENTS, IFRS
INTRODUCTION
INTRODUCTION
NOTES TO THE CONSOLIDATED FINANCIAL STATEMENTS INTRODUCTION
Outotec Oyj (“the company” or “Parent company”) is a Finnish public limited liability company organized under the laws of Finland with its reg-istered office in Espoo. Outotec Oyj has been listed on the Nasdaq Helsinki since 2006.
Outotec is a leading global provider of process solutions, technologies, and services for the mining and metallurgical industries. The company also provides innovative solutions for industrial water treatment and chemical industry. Outotec utilizes its extensive experience and process know-how by providing environmentally sound and energy efficient plants, proprietary equipment, and services and works in close partnership with its customers.
Outotec and its subsidiaries (collectively “the Group” or “Outotec”) operate through two business units which are also reporting segments: Minerals Processing and Metals Refining. The service business is reported under the two segments. However, its sales volume, order intake and order backlog are also reported separately on Outotec level.
The Board of Directors has authorized the Consolidated Financial State-ments for issue on February 6, 2020. According to the Finnish Limited
Liability Companies Act the shareholders have the right to approve, amend or reject the Consolidated Financial Statements in the Annual General Meeting held after issuing.
Discontinued operations in 2019On December 10, 2019, Outotec accounced its decision to divest three businesses from the Metals, Energy & Water segment’s portfolio, be-ing aluminum, waste-to-energy and sludge incineration. The divested businesses have been classified as discontinued operations in 2019. Consequently, the figures for 2019 related to the statement of income are presented for the continuing operations and comparative figures for 2018 have been restated accordingly. The assets held for sale and liabilities directly attributable to them have been transferred to separate lines in the statement of financial position. The comparative figures for 2018 related to the statement of financial position have not been restated. The divest-ments are disclosed in note 5.1. The segment has been renamed as ‘Met-als Refining’ (MR) to reflect the changes in the continuing business.
29 CONSOLIDATED FINANCIAL STATEMENTS, IFRS
INTRODUCTION
Accounting principle
The consolidated financial statements of Outotec have been prepared in compliance with the International Financial Reporting Standards (IFRS) as adopted by the European Union through the application of the IAS and IFRS standards, as well as the SIC and IFRIC interpretations in force on December 31, 2019. Notes to the consolidated financial statements have also been prepared in accordance with the Finnish accounting Standards and Finnish corporate legislation.
The consolidated financial statements are presented in millions of euros and have been prepared on the historical cost basis, unless otherwise stated in the accounting principles or disclosures. Figures presented have been rounded to the nearest whole number, and consequently the sum of individual figures may deviate from the sum presented. Key figures have been calculated using exact figures.
ConsolidationThe consolidated financial statements include the parent company Outotec Oyj and all subsidiaries where the parent company is in control of the company. The group controls an entity when it is exposed or has rights to variable returns from its involvement with the entity and is able to affect those returns through its power over the entity.
Acquired subsidiaries are included in the consolidated financial statement from the date when Outotec has gained control and disposed subsidiaries until the date when the controlling right has ended. Acquired companies are accounted for using the acquisition method, according to which the assets, liabilities, and contingent liabilities of the acquired company are measured at fair value on the date of acquisition. Goodwill arising on an acquisition represents the excess of the cost of the acquisition over the fair value of the net identifiable assets, liabilities, and contingent liabilities acquired.
All intra-group transactions, receivables, liabilities, and unrealized margins, as well as the distribution of profits within the Group, are eliminated in the consolidation.
Non-controlling interestsNet profit or loss for the reporting period and comprehensive income items are allocated to the parent company’s shareholders and non-controlling interest parties and are presented in the comprehensive income. The share of the non-controlling interest is disclosed separately from the equity belonging to the shareholders of the parent company.
Foreign currency translationThe consolidated financial statements are presented in euros, which is the functional currency of the parent company. Comprehensive income and cash flows of subsidiaries, whose functional currency is not euro, are converted into euros at the average exchange rates during the financial period. Their statements of financial positions are converted at the exchange rates on the reporting date. The differences between average exchange rates and the reporting date rates are recognized in equity and the change is recognized in other comprehensive income.
Foreign currency transactionsForeign currency transactions in the group companies are translated into functional currencies using the exchange rates prevailing on the dates of the transactions. Monetary assets and liabilities denominated in foreign currencies are translated into functional currencies at the exchange rates prevailing at the reporting date. Foreign exchange gains and losses resulting from the settlement or translation of monetary interest-bearing assets and liabilities denominated in foreign currencies and related derivatives are recognized in financial income and expenses. Foreign exchange differences arising with respect to other financial instruments are included in operating profit under sales, purchases or other income and expenses.
Accounting estimates and judgements
The preparation of the financial statements in accordance with IFRS requires management to make estimates and judgements that affect the reported amounts. The most significant accounting estimates and judgements made by the management relate to customer contracts, impairment of goodwill, valuation of inventories and trade receivables, provisions, pension obligations and deferred tax assets and liabilities. The basis for the estimates is described in more detail in connection with the relevant disclosure. Although these estimates are based on management’s best knowledge of current events and actions, actual results may differ from the estimates used in the financial statements.
30 CONSOLIDATED FINANCIAL STATEMENTS, IFRS
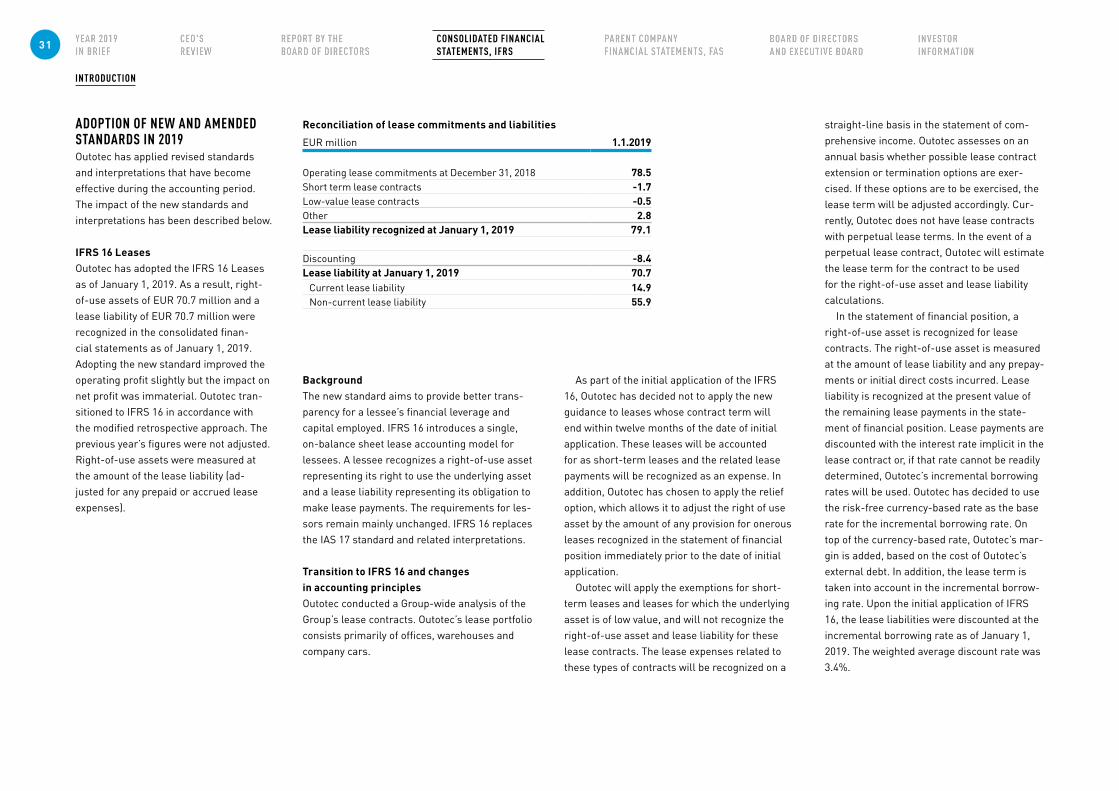
INTRODUCTION
Reconciliation of lease commitments and liabilities
EUR million 1.1.2019
Operating lease commitments at December 31, 2018 78.5Short term lease contracts -1.7Low-value lease contracts -0.5Other 2.8Lease liability recognized at January 1, 2019 79.1
Discounting -8.4Lease liability at January 1, 2019 70.7 Current lease liability 14.9 Non-current lease liability 55.9
ADOPTION OF NEW AND AMENDED STANDARDS IN 2019Outotec has applied revised standards and interpretations that have become effective during the accounting period. The impact of the new standards and interpretations has been described below.
IFRS 16 LeasesOutotec has adopted the IFRS 16 Leases as of January 1, 2019. As a result, right-of-use assets of EUR 70.7 million and a lease liability of EUR 70.7 million were recognized in the consolidated finan-cial statements as of January 1, 2019. Adopting the new standard improved the operating profit slightly but the impact on net profit was immaterial. Outotec tran-sitioned to IFRS 16 in accordance with the modified retrospective approach. The previous year’s figures were not adjusted. Right-of-use assets were measured at the amount of the lease liability (ad-justed for any prepaid or accrued lease expenses).
BackgroundThe new standard aims to provide better trans-parency for a lessee’s financial leverage and capital employed. IFRS 16 introduces a single, on-balance sheet lease accounting model for lessees. A lessee recognizes a right-of-use asset representing its right to use the underlying asset and a lease liability representing its obligation to make lease payments. The requirements for les-sors remain mainly unchanged. IFRS 16 replaces the IAS 17 standard and related interpretations. Transition to IFRS 16 and changes in accounting principlesOutotec conducted a Group-wide analysis of the Group’s lease contracts. Outotec’s lease portfolio consists primarily of offices, warehouses and company cars.
As part of the initial application of the IFRS 16, Outotec has decided not to apply the new guidance to leases whose contract term will end within twelve months of the date of initial application. These leases will be accounted for as short-term leases and the related lease payments will be recognized as an expense. In addition, Outotec has chosen to apply the relief option, which allows it to adjust the right of use asset by the amount of any provision for onerous leases recognized in the statement of financial position immediately prior to the date of initial application.
Outotec will apply the exemptions for short-term leases and leases for which the underlying asset is of low value, and will not recognize the right-of-use asset and lease liability for these lease contracts. The lease expenses related to these types of contracts will be recognized on a
straight-line basis in the statement of com-prehensive income. Outotec assesses on an annual basis whether possible lease contract extension or termination options are exer-cised. If these options are to be exercised, the lease term will be adjusted accordingly. Cur-rently, Outotec does not have lease contracts with perpetual lease terms. In the event of a perpetual lease contract, Outotec will estimate the lease term for the contract to be used for the right-of-use asset and lease liability calculations.
In the statement of financial position, a right-of-use asset is recognized for lease contracts. The right-of-use asset is measured at the amount of lease liability and any prepay-ments or initial direct costs incurred. Lease liability is recognized at the present value of the remaining lease payments in the state-ment of financial position. Lease payments are discounted with the interest rate implicit in the lease contract or, if that rate cannot be readily determined, Outotec’s incremental borrowing rates will be used. Outotec has decided to use the risk-free currency-based rate as the base rate for the incremental borrowing rate. On top of the currency-based rate, Outotec’s mar-gin is added, based on the cost of Outotec’s external debt. In addition, the lease term is taken into account in the incremental borrow-ing rate. Upon the initial application of IFRS 16, the lease liabilities were discounted at the incremental borrowing rate as of January 1, 2019. The weighted average discount rate was 3.4%.
31 CONSOLIDATED FINANCIAL STATEMENTS, IFRS
INTRODUCTION
Under IFRS 16, depreciation on a right-of-use asset and the interest expense on the discounted lease liability is recognized in the statement of comprehensive income in com-parison to a lease expense recognized under IAS 17. In the consolidated statement of cash flows, net cash from operating activities will increase, and the net cash used in financing activities will decrease as the repayment of the principal portion of the lease liabilities is clas-sified as cash flows from financing activities.
The Group’s activities as a lessor are not material, and hence the new standard did not have any significant impact on the financial statements.
IFRIC 23 -Uncertainty over income tax treatmentsOutotec has adopted the IFRIC 23 interpre-tation as of January 1, 2019. Outotec tran-sitioned to IFRIC 23 in accordance with the modified retrospective approach. Based on the analysis of uncertain tax treatments in the light of IFRIC 23, Outotec recognized additional income tax liabilities totaling EUR 0.6 million affecting the opening balance of retained earnings. Prior to the restatement, income tax liabilities on January 1, 2019 totaled EUR 8.4 million, and after restatement of EUR 0.6 million the income tax liabilities were EUR 9.1 million.
The new interpretation should be applied to the determination of taxable profit (tax loss), tax bases, unused tax losses, unused tax credits and tax rates, when there is uncer-tainty over income tax treatment under IAS 12.
Based on IFRIC 23, an entity must consider whether it is probable that the relevant tax au-thority would accept each tax treatment used in its income tax filings, assuming full visibility of all relevant information. Each uncertain tax treatment is to be considered separately or together as a group, and the impact of uncer-tainty is to be measured using either the most likely amount or the expected value method, depending on which approach better predicts resolution of the uncertainty.
Amendments to IAS 19Outotec has adopted the amendments to IAS 19 Employee benefits as of January 1, 2019. The amendments did not have a material impact on the Group’s financial statement. The amendments to IAS 19 clarify the accounting for defined benefit plan amendments, curtail-ments and settlements.
Adoption of new and amended standards in 2020In 2020, Outotec will adopt the following new and amended standars and interpretations issued by IASB.
Amendments to IFRS 3Amendments to IFRS 3 (Business combina-tions), effective for financial periods begin-ning on or after 1 January 2020, include the amended definition of a business requires an acquisition to include an input and a sub-stantive process that together significantly contribute to the ability to create outputs. The definition of the term ‘outputs’ is amended
to focus on goods and services provided to customers, generating investment income and other income, and it excludes returns in the form of lower costs and other economic benefits. The impact in the Group’s financial statements is not expected to be material. The amendment is not yet endorsed for use by the European Union as of 31 December 2019.
Amendments to IAS 1 and IAS 8Amendments to IAS 1 (Presentation of Financial Statements) and IAS 8 (Accounting Policies, Changes in Accounting Estimates and Errors), effective for financial periods beginning on or after 1 January 2020, use a consistent definition of materiality throughout International Financial Reporting Standards and the Conceptual Framework for Financial Reporting, clarify when information is material and incorporate some of the guidance in IAS 1 about immaterial information.In particular, the amendments clarify:• that the reference to obscuring information
addresses situations in which the effect is similar to omitting or misstating that information, and that an entity assesses materiality in the context of the financial statements as a whole, and
• the meaning of ‘primary users of general purpose financial statements’ to whom those financial statements are directed, by defining them as ‘existing and potential investors, lenders and other creditors’ that must rely on general purpose financial statements for much of the financial infor-mation they need.
The amended definition of a business re-quires an acquisition to include an input and a
substantive process that together significantly contribute to the ability to create outputs. The definition of the term ‘outputs’ is amended to fo-cus on goods and services provided to custom-ers, generating investment income and other income, and it excludes returns in the form of lower costs and other economic benefits.
The amendments will likely result in more acquisitions being accounted for as asset ac-quisitions. The impact in the Group’s financial statements is not expected to be material.
Amendments to IFRS 9, IAS 39 and IFRS 7The IASB has amended the hedge ac-counting requirements in IFRS 9 (Financial Instruments), IAS 39 (Financial instruments -Recognition and Measurement) and IFRS 7 (Financial instruments -Disclosures), effective for financial periods beginning on or after 1 January, 2020. The amendments modify some specific hedge accounting requirements to provide relief from potential effects of the uncertainty caused by the IBOR reform. In addition, the amendments require companies to provide additional information to investors about their hedging relationships which are directly affected by these uncertainties.
The Group has not currently hedge ac-counting relationships that would directly be impacted by the uncertainty caused by the IBOR reform. The Company is monitoring the situation and assessing the impact of the amendments in its future financial reporting.
32 CONSOLIDATED FINANCIAL STATEMENTS, IFRS

BUSINESS OPERATIONS
33 CONSOLIDATED FINANCIAL STATEMENTS, IFRS
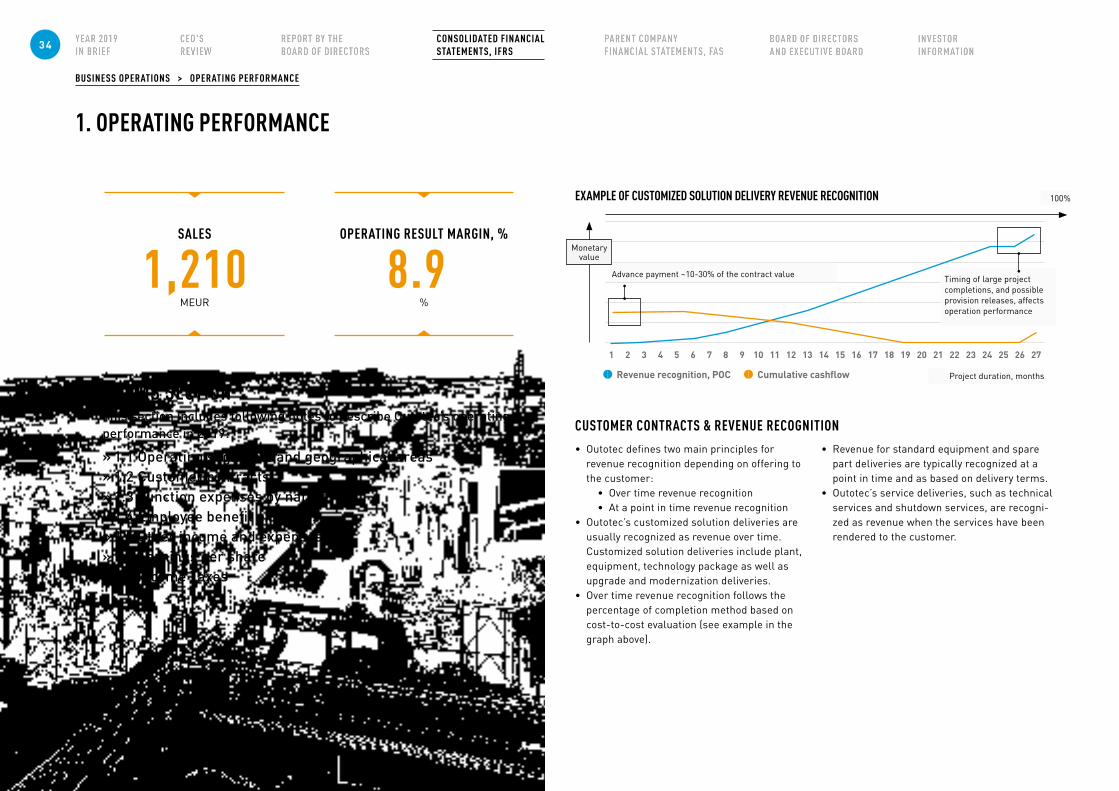
BUSINESS OPERATIONS > OPERATING PERFORMANCE
1. OPERATING PERFORMANCE
SALES
1,210 MEUR
OPERATING RESULT MARGIN, %
8.9 %
IN THIS SECTIONThis section includes following notes to describe Outotec’s operating performance in 2019:
» 1.1 Operating segments and geographical areas » 1.2 Customer contracts » 1.3 Function expenses by nature » 1.4 Employee benefit expenses » 1.5 Other income and expenses » 1.6 Earnings per share » 1.7 Income Taxes
CUSTOMER CONTRACTS & REVENUE RECOGNITION• Outotec defines two main principles for
revenue recognition depending on offering to the customer:
• Over time revenue recognition• At a point in time revenue recognition
• Outotec’s customized solution deliveries are usually recognized as revenue over time. Customized solution deliveries include plant, equipment, technology package as well as upgrade and modernization deliveries.
• Over time revenue recognition follows the percentage of completion method based on cost-to-cost evaluation (see example in the graph above).
• Revenue for standard equipment and spare part deliveries are typically recognized at a point in time and as based on delivery terms.
• Outotec’s service deliveries, such as technical services and shutdown services, are recogni-zed as revenue when the services have been rendered to the customer.
1 135 176 187 198 209 2110 2211 234 1612 24 25 26 273 152 14
EXAMPLE OF CUSTOMIZED SOLUTION DELIVERY REVENUE RECOGNITION
Revenue recognition, POC Cumulative cashflow
Timing of large project completions, and possible provision releases, affects operation performance
Project duration, months
Advance payment ~10-30% of the contract value
BUSINESS OPERATIONS > OPERATING PERFORMANCE
Monetaryvalue
100%
34 CONSOLIDATED FINANCIAL STATEMENTS, IFRS
BUSINESS OPERATIONS > OPERATING PERFORMANCE
1.1 OPERATING SEGMENTS AND GEOGRAPHICAL AREAS
Outotec’s business logic is to serve its cus-tomers by providing solutions throughout the entire life cycle of customer operations in order to ensure optimized total cost of owner-ship. Outotec reports its result in line with the Group’s strategy and internal financial report-ing structure. In 2019, the Group has defined its nine business lines as operating segments which have been aggregated to two segments in financial reporting, Minerals Processing and Metals Refining. The Board of Directors (CODM) assesses the Group’s financial posi-tion and its development as a whole and based on the reportable segments and operating segments.
The pricing of inter-segment transactions is based on current market prices. Segment as-sets and liabilities are operative items, which are used in a segment’s business operations or which can be allocated to the segments on a reasonable basis. Unallocated items include taxes, financial items, and items which are common for the whole group. Investments include additions in intangible assets and property, plant and equipment.
Minerals ProcessingOutotec provides the mining industry with sustainable mineral processing solutions, from pre-feasibility studies to complete plants and life cycle services. Outotec’s comprehen-sive offering makes the efficient and profitable treatment of virtually all ore types possible.
Segment Minerals Processing consists of six business lines which have been classified
as operating segments in 2019: Grinding, Flo-tation, Filtration, Analyzers and Automation, Thickening and Clarification and Concentra-tor Plant Solutions. The operating segments have been aggregated to one segment due to their common customers, shared projects and strong interlink between technologies to form a complete Concentrator Plant. Business lines use common resources and their technologies are supporting each other. They also operate in similar regulatory environment and have similar economic characteristics.
Metals RefiningOutotec provides sustainable solutions for metal processing and industrial water treat-ment. Metals Refining include an extensive range of metal processing solutions for processing virtually all types of ores and concentrates to refined metals. Water includes solutions to produce water that meets the environmental discharge standards and maximizes water recycling as well as reduces water and energy consumption.
Segment Metals Refining consists of three business lines which have been classified as operating segments in 2019: Smelting and Converting, Hydrometallurgy and Metals and Chemicals processing. The operating seg-ments have been aggregated to one segment as they operate in similar regulatory environ-ment and have similar economic characteris-tics. Business lines use common resources, share partially same customers and their technologies are supporting each other.
Accounting principle
Operating segmentsIn accordance with IFRS 8 Outotec has determined that operating segments are based on end customers and the customer value chain. The operating segments are reported in a manner consistent with the internal reporting provided for the Board of Directors, which has been identified as Outotec’s chief operating decision-maker as described in the Charter of the Board of Directors. The Board of Directors is responsible for deciding on basic strategies of the Outotec Group, deciding on major investments, business acquisitions and di-vestments as well as major sales contracts and significant financing arrangements. In addition, the Board of Directors nominates top management resources and decides on
significant changes in the business organi-zation of the Group.
Geographical information is based on the three main areas where the Group has activities. The Regions are Americas, EMEA (including Europe, Middle East, Africa and CIS countries) and APAC (including Asia, Pacific, China and India).
Operating resultOperating profit is the net amount that equals to sales less cost of sales, added with other operating income, less selling and marketing, in addition to adminis-tration and research and development expenses, less other operating expenses and added with the share of the result of the associated companies.
35 CONSOLIDATED FINANCIAL STATEMENTS, IFRS
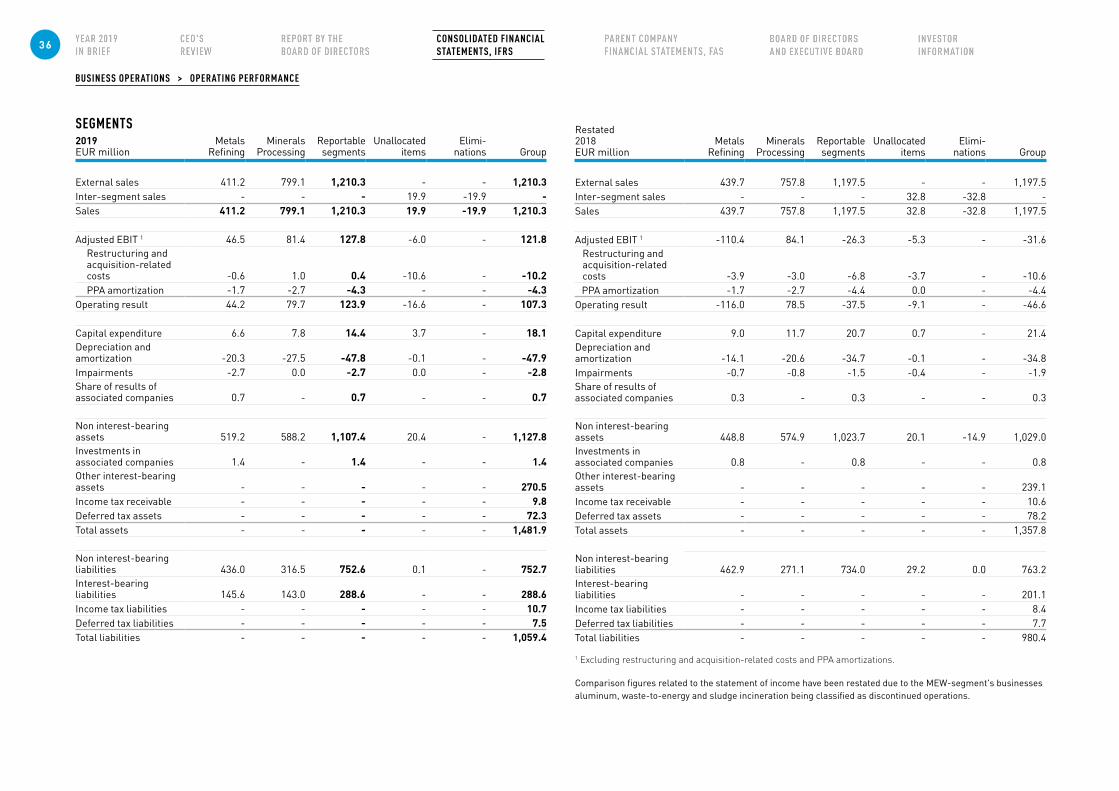
BUSINESS OPERATIONS > OPERATING PERFORMANCE
SEGMENTS2019EUR million
Metals Refining
MineralsProcessing
Reportablesegments
Unallocateditems
Elimi-nations Group
External sales 411.2 799.1 1,210.3 - - 1,210.3Inter-segment sales - - - 19.9 -19.9 -Sales 411.2 799.1 1,210.3 19.9 -19.9 1,210.3
Adjusted EBIT 1 46.5 81.4 127.8 -6.0 - 121.8Restructuring and acquisition-related costs -0.6 1.0 0.4 -10.6 - -10.2PPA amortization -1.7 -2.7 -4.3 - - -4.3
Operating result 44.2 79.7 123.9 -16.6 - 107.3
Capital expenditure 6.6 7.8 14.4 3.7 - 18.1Depreciation and amortization -20.3 -27.5 -47.8 -0.1 - -47.9Impairments -2.7 0.0 -2.7 0.0 - -2.8Share of results of associated companies 0.7 - 0.7 - - 0.7
Non interest-bearing assets 519.2 588.2 1,107.4 20.4 - 1,127.8Investments in associated companies 1.4 - 1.4 - - 1.4Other interest-bearing assets - - - - - 270.5Income tax receivable - - - - - 9.8Deferred tax assets - - - - - 72.3Total assets - - - - - 1,481.9
Non interest-bearing liabilities 436.0 316.5 752.6 0.1 - 752.7Interest-bearing liabilities 145.6 143.0 288.6 - - 288.6Income tax liabilities - - - - - 10.7Deferred tax liabilities - - - - - 7.5Total liabilities - - - - - 1,059.4
Restated2018EUR million
Metals Refining
MineralsProcessing
Reportablesegments
Unallocateditems
Elimi-nations Group
External sales 439.7 757.8 1,197.5 - - 1,197.5Inter-segment sales - - - 32.8 -32.8 -Sales 439.7 757.8 1,197.5 32.8 -32.8 1,197.5
Adjusted EBIT 1 -110.4 84.1 -26.3 -5.3 - -31.6Restructuring and acquisition-related costs -3.9 -3.0 -6.8 -3.7 - -10.6
PPA amortization -1.7 -2.7 -4.4 0.0 - -4.4Operating result -116.0 78.5 -37.5 -9.1 - -46.6
Capital expenditure 9.0 11.7 20.7 0.7 - 21.4Depreciation and amortization -14.1 -20.6 -34.7 -0.1 - -34.8Impairments -0.7 -0.8 -1.5 -0.4 - -1.9Share of results of associated companies 0.3 - 0.3 - - 0.3
Non interest-bearing assets 448.8 574.9 1,023.7 20.1 -14.9 1,029.0Investments in associated companies 0.8 - 0.8 - - 0.8Other interest-bearing assets - - - - - 239.1Income tax receivable - - - - - 10.6Deferred tax assets - - - - - 78.2Total assets - - - - - 1,357.8
Non interest-bearing liabilities 462.9 271.1 734.0 29.2 0.0 763.2Interest-bearing liabilities - - - - - 201.1Income tax liabilities - - - - - 8.4Deferred tax liabilities - - - - - 7.7Total liabilities - - - - - 980.4
1 Excluding restructuring and acquisition-related costs and PPA amortizations.
Comparison figures related to the statement of income have been restated due to the MEW-segment's businesses aluminum, waste-to-energy and sludge incineration being classified as discontinued operations.
36 CONSOLIDATED FINANCIAL STATEMENTS, IFRS
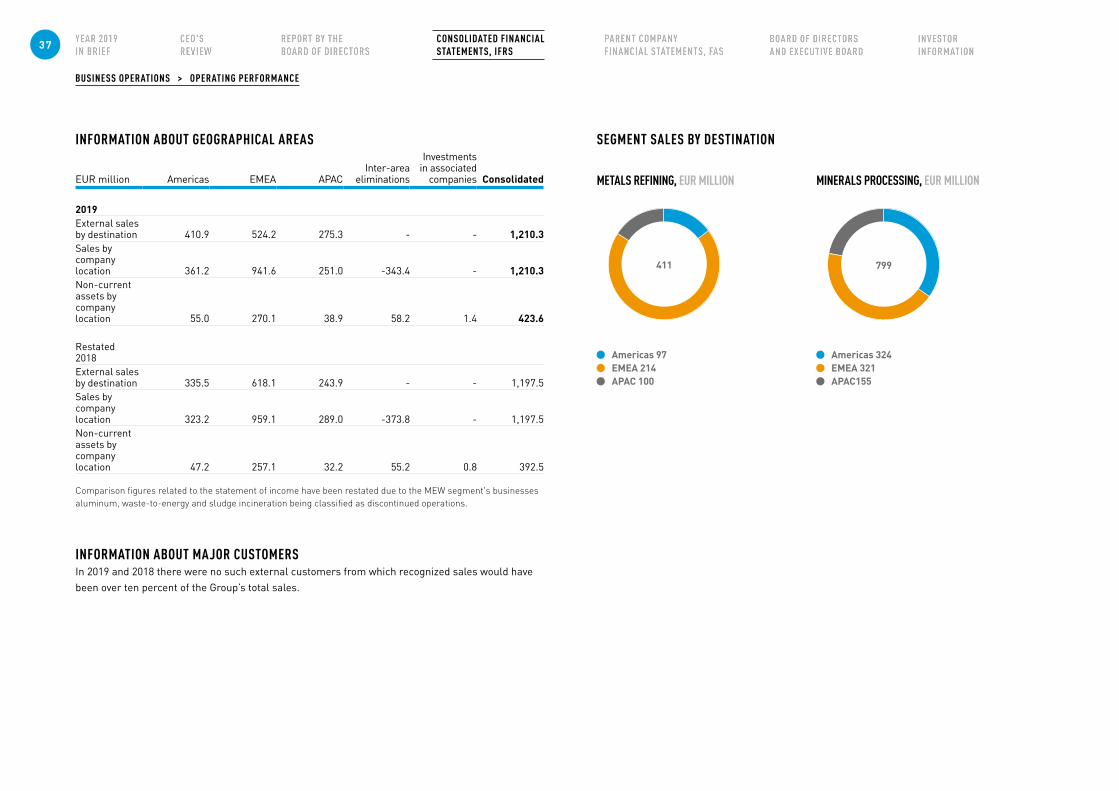
BUSINESS OPERATIONS > OPERATING PERFORMANCE
INFORMATION ABOUT GEOGRAPHICAL AREAS
EUR million Americas EMEA APACInter-area
eliminations
Investments in associated
companies Consolidated
2019External sales by destination 410.9 524.2 275.3 - - 1,210.3Sales by company location 361.2 941.6 251.0 -343.4 - 1,210.3Non-current assets by company location 55.0 270.1 38.9 58.2 1.4 423.6
Restated 2018External sales by destination 335.5 618.1 243.9 - - 1,197.5Sales by company location 323.2 959.1 289.0 -373.8 - 1,197.5Non-current assets by company location 47.2 257.1 32.2 55.2 0.8 392.5
Comparison figures related to the statement of income have been restated due to the MEW segment's businesses aluminum, waste-to-energy and sludge incineration being classified as discontinued operations.
INFORMATION ABOUT MAJOR CUSTOMERSIn 2019 and 2018 there were no such external customers from which recognized sales would have been over ten percent of the Group’s total sales.
SEGMENT SALES BY DESTINATION
METALS REFINING, EUR MILLION MINERALS PROCESSING, EUR MILLION
Americas 97 EMEA 214 APAC 100
Americas 324 EMEA 321 APAC155
411 799
37 CONSOLIDATED FINANCIAL STATEMENTS, IFRS
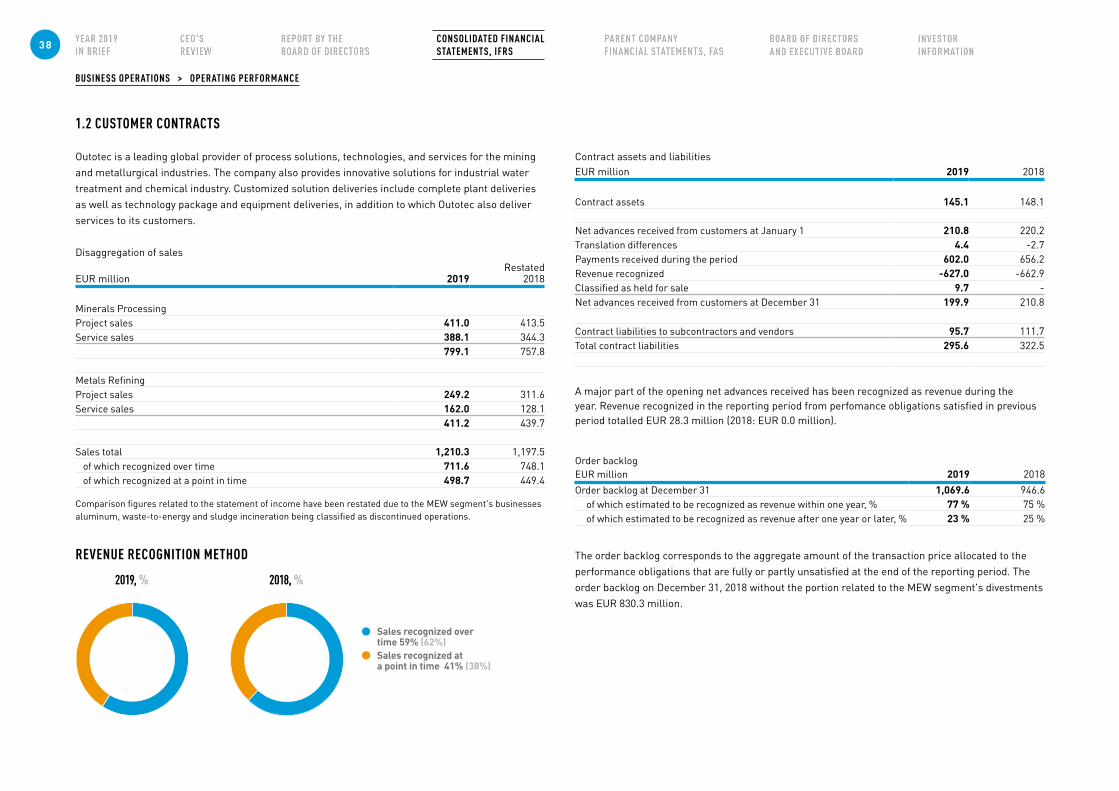
BUSINESS OPERATIONS > OPERATING PERFORMANCE
1.2 CUSTOMER CONTRACTS
Outotec is a leading global provider of process solutions, technologies, and services for the mining and metallurgical industries. The company also provides innovative solutions for industrial water treatment and chemical industry. Customized solution deliveries include complete plant deliveries as well as technology package and equipment deliveries, in addition to which Outotec also deliver services to its customers.
Disaggregation of sales
EUR million 2019Restated
2018
Minerals ProcessingProject sales 411.0 413.5Service sales 388.1 344.3
799.1 757.8
Metals RefiningProject sales 249.2 311.6Service sales 162.0 128.1
411.2 439.7
Sales total 1,210.3 1,197.5of which recognized over time 711.6 748.1of which recognized at a point in time 498.7 449.4
Contract assets and liabilitiesEUR million 2019 2018
Contract assets 145.1 148.1
Net advances received from customers at January 1 210.8 220.2Translation differences 4.4 -2.7Payments received during the period 602.0 656.2Revenue recognized -627.0 -662.9Classified as held for sale 9.7 -Net advances received from customers at December 31 199.9 210.8
Contract liabilities to subcontractors and vendors 95.7 111.7Total contract liabilities 295.6 322.5
A major part of the opening net advances received has been recognized as revenue during the year. Revenue recognized in the reporting period from perfomance obligations satisfied in previous period totalled EUR 28.3 million (2018: EUR 0.0 million).
Order backlogEUR million 2019 2018Order backlog at December 31 1,069.6 946.6
of which estimated to be recognized as revenue within one year, % 77 % 75 %of which estimated to be recognized as revenue after one year or later, % 23 % 25 %
The order backlog corresponds to the aggregate amount of the transaction price allocated to the performance obligations that are fully or partly unsatisfied at the end of the reporting period. The order backlog on December 31, 2018 without the portion related to the MEW segment's divestments was EUR 830.3 million.
REVENUE RECOGNITION METHOD
2019, % 2018, %
Sales recognized over time 59% (62%)
Sales recognized at a point in time 41% (38%)
Comparison figures related to the statement of income have been restated due to the MEW segment's businesses aluminum, waste-to-energy and sludge incineration being classified as discontinued operations.
38 CONSOLIDATED FINANCIAL STATEMENTS, IFRS
BUSINESS OPERATIONS > OPERATING PERFORMANCE
Accounting principle
Outotec recognizes revenue when control of the good or service is transferred to the customer in an amount that reflects the total payment to which the Group expects to be en-titled. These principles are applied using the following five steps: (1) Identify the contract(s) with a customer, (2) Identify the performance obligations in the contract, (3) Determine the transaction price, (4) Allocate the transaction price to the performance obligations in the contract and (5) Recognize revenue.
Customized solutionsCustomized solution deliveries include complete plant deliveries as well as tech-nology package and equipment deliveries.
In a typical plant delivery, Outotec has the overall project management respon-sibility of the project, including engineer-ing, designing and constructing the plant, procuring all necessary materials and equipment, commissioning and start-up of the plant. In technology package and equipment deliveries, Outotec delivers a specified technology or equipment solution to the customer, typically including engi-neering and supply of proprietary equip-ment and overall project management. The projects may also include installation, advisory services, training, commissioning, performance test runs and other related services. Customized solution deliveries are typically considered as one perfor-mance obligation, as Outotec provides significant service to integrate the goods and services, and the goods and services are highly interrelated with other goods and services promised in the contract.
The transaction prices are based on stand-alone market prices and fixed for the entire project delivery. If a contract in-cludes more than one performance obliga-tion, Outotec uses pricing information from proposal calculations in determining the stand-alone selling prices for the distinct performance obligations.
Outotec’s contracts may also include components of variable consideration, such as penalties, liquidated damages or performance bonus arrangements. Vari-able components are generally allocated proportionately to all performance obliga-tions in the contract, unless they relate to a specific performance obligation.
The criteria for recognizing revenue over time is typically met in Outotec’s custom-ized solution contracts. Outotec’s perfor-mance creates an asset with no alternative use, and Outotec has an enforceable right to payment for the performance completed to date. To measure progress in projects where revenue is recognized over time, Outotec uses a method under which the percentage of completion is defined as the ratio of costs incurred to total estimated costs. This method is considered to result in a revenue profile that best reflects the transfer of control to the customer. Provi-sions for expected project losses are recog-nized immediately as an expense.
For on-going over time projects, a cus-tomer payment is recognized as a payment received within contract liabilities. At each reporting date, revenue is recognized accord-ing to the measured progress and booked against the contract liabilities. A contract as-
set is recognized to the extent the recognized revenue exceeds the payment received. The contract liabilities are removed from the balance sheet as the contract is final billed. Project loss provisions are recognized when it is probable that the costs will exceed the estimated total revenue. The loss is recog-nized as an expense immediately, including general expenses to fulfil the contract.
In customized solution contracts, pay-ments are usually received in advance, before satisfaction of the performance obligation. Payment terms exceeding one year are not typical in Outotec’s business.
Service deliveriesService deliveries include spare parts, technical and shutdown services. Spare parts are provided to the customer to be used in standard maintenance activities and are typically treated as a distinct per-formance obligation from the main project. Technical services mostly include opera-tions and maintenance services, treated as a single performance obligation distinct.
The transaction prices are in most cases based on fixed hourly or monthly pricing,
and for shutdown services fixed for the entire project.
Outotec recognizes revenue for standard equipment and spare part deliveries typi-cally at a point in time and as based on delivery terms.
Revenue for long-term service contracts and shutdown services are recognized when benefits have been rendered to the customer.
Costs related to a customer contract and incurring under a point-in-time delivery are capitalized as inventory until the perfor-mance obligation has been satisfied and rev-enue is recognized along with the expense.
Outotec uses standard payment terms in its service contracts.
WarrantiesOutotec grants standard assurance-type warranties for its mechanical equipment to guarantee that they will work in accord-ance with the contract. If an extended war-ranty is granted for the customer, it may be accounted for as a distinct performance obligation. Service-type warranties are not typical in Outotec’s project business.
Accounting estimates and judgements
When evaluating the criteria for recog-nizing revenue over time, judgement is required in assessing the enforceable right to payment for the performance completed to date. Furthermore, a certain amount of judgement is required in over-time revenue recognition as this is based on estimates of anticipated contract revenues and expense as well as on the measurement of project
progress. Variable consideration is estimat-ed by using either the expected value or the most likely amount. In addition, possible provisions for project losses and changes in accruals for project expenses are made based on the judgement of management. Risks related to new commercialized prod-ucts are also evaluated and quantified, and the necessary accruals recognized.
39 CONSOLIDATED FINANCIAL STATEMENTS, IFRS

BUSINESS OPERATIONS > OPERATING PERFORMANCE
1.3 FUNCTION EXPENSES BY NATURE
EUR million 2019Restated
2018
Merchandise and raw materials -458.1 -691,4Logistics expenses -22.2 -30,1Employee benefit expenses -320.8 -293,5Rents and leases -6.9 -27,9Depreciation and amortization (note 3.2) -47.9 -34,8Change in inventories -5.1 10,5Services purchased -158.2 -137,6Other expenses -80.5 -26,8
-1,099.5 -1,231,5Other expenses include grants received EUR 2.3 million in 2019 (2018: EUR 3.5 million).
Comparison figures related to the statement of income have been restated due to the MEW segment's businesses aluminum, waste-to-energy and sludge incineration being classified as discontinued operations.
Auditors' fees
EUR million 2019
2018
Audit -0.9 -0,8Tax consulting -0.2 -0.3Merger related advisory and assurance services -1.1 -Fees for ancillary services -0.2 -0,2
-2.4 -1,3Fees for ancillary services paid to PwC Finland amount to EUR 1.3 million in 2019 (2018: EUR 0.2 million).
Accounting principle
ExpensesExpenses are presented by function in the income statement and by nature in this note. Expenses by function include cost of sales, selling and marketing, administra-tive as well as research and development expenses. Costs are expensed when in-curred for the same reporting period as the related income is recognized as revenue.
Research and development expensesResearch and development costs are expensed as they are incurred.
Government grantsGovernment or other grants are recognized as income on a systematic basis over the periods necessary to match them with the related costs, which they are intended to compensate.
1.4 EMPLOYEE BENEFIT EXPENSES
EUR million 2019Restated
2018
Wages and salaries -268,9 -241,5Share based payments (note 5.2) -2,6 -1,3Social security costs -18,6 -19,2Pension and other post-employment benefits (note 5.3)
Defined benefit plans -2,2 -2,9Defined contribution plans -23,9 -23,3Other post-employment benefits -0,1 -0,1
Other personnel expenses -4,4 -5,3-320,8 -293,5
Comparison figures related to the statement of income have been restated due to the MEW segment's businesses aluminum, waste-to-energy and sludge incineration being classified as discontinued operations.
Personnel related restructuring items of EUR 0.6 million income (2018: EUR -2.3 million expenses) are reported in other expenses.
Personnel 2019Restated
2018
Personnel at end of year 4,045 3,986Average number of personnel during the year 4,049 4,050
The personnel figures are dislosed as FTE (full-time equivalent employees). The figures for 2018 have been recalculated as FTE retrospectively. Personnel in Finland at the end of the year was 1,426 (2018: 1,306).
Comparison figures related to the statement of income have been restated due to the MEW segment's businesses aluminum, waste-to-energy and sludge incineration being classified as discontinued operations.
Cost of sales -850.1 (-998.5) Selling and marketing expenses
-117.4 (-108.0) Administrative expenses
-76.7 (-71.0) Research and development
expenses -55.3 (-54.1)
Merchandise and raw materi-als including the provision made for the ilmenite smelter project. Services purchased including costs from transfer-ring resources to Citec.
ADJUSTED 2018FUNCTION EXPENSES, EUR MILLION2019
0
-200
-400
-600
-800
-1000
0
-200
-400
-600
-800
-1000
40 CONSOLIDATED FINANCIAL STATEMENTS, IFRS
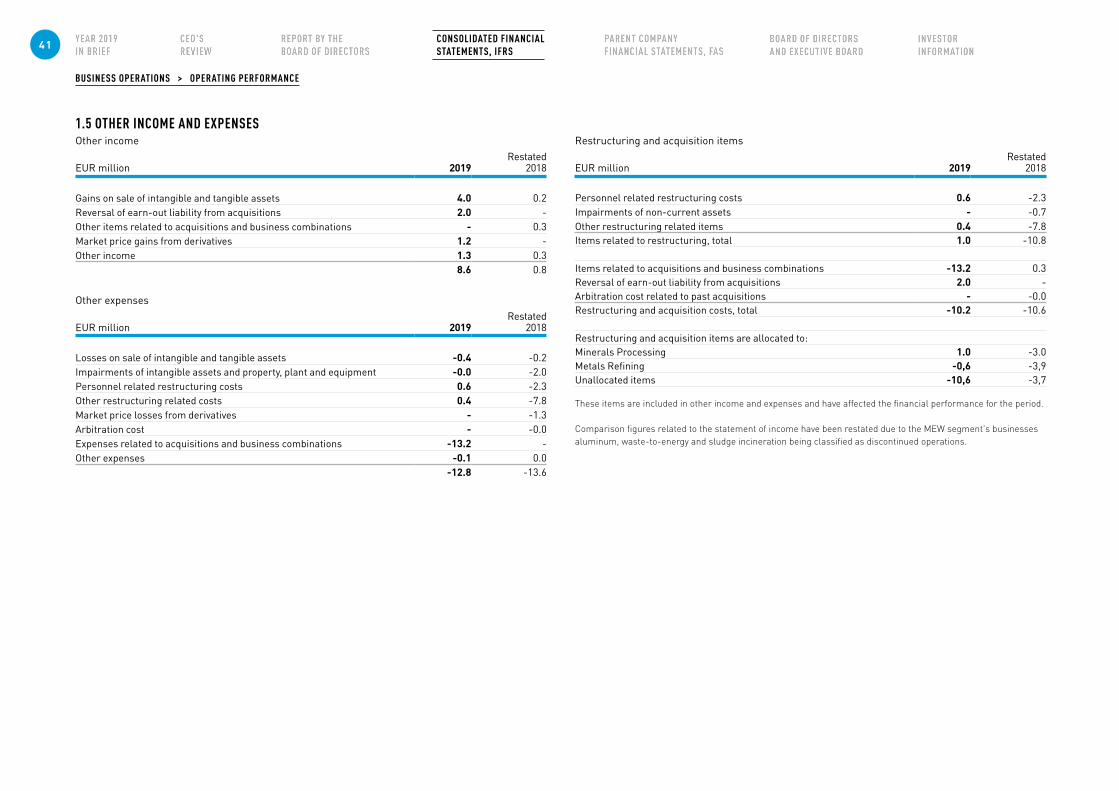
BUSINESS OPERATIONS > OPERATING PERFORMANCE
1.5 OTHER INCOME AND EXPENSESOther income
EUR million 2019Restated
2018
Gains on sale of intangible and tangible assets 4.0 0.2Reversal of earn-out liability from acquisitions 2.0 -Other items related to acquisitions and business combinations - 0.3Market price gains from derivatives 1.2 -Other income 1.3 0.3
8.6 0.8
Other expenses
EUR million 2019Restated
2018
Losses on sale of intangible and tangible assets -0.4 -0.2Impairments of intangible assets and property, plant and equipment -0.0 -2.0Personnel related restructuring costs 0.6 -2.3Other restructuring related costs 0.4 -7.8Market price losses from derivatives - -1.3Arbitration cost - -0.0Expenses related to acquisitions and business combinations -13.2 -Other expenses -0.1 0.0
-12.8 -13.6
Restructuring and acquisition items
EUR million 2019Restated
2018
Personnel related restructuring costs 0.6 -2.3Impairments of non-current assets - -0.7Other restructuring related items 0.4 -7.8Items related to restructuring, total 1.0 -10.8
Items related to acquisitions and business combinations -13.2 0.3Reversal of earn-out liability from acquisitions 2.0 -Arbitration cost related to past acquisitions - -0.0Restructuring and acquisition costs, total -10.2 -10.6
Restructuring and acquisition items are allocated to:Minerals Processing 1.0 -3.0Metals Refining -0,6 -3,9Unallocated items -10,6 -3,7
These items are included in other income and expenses and have affected the financial performance for the period.
Comparison figures related to the statement of income have been restated due to the MEW segment's businesses aluminum, waste-to-energy and sludge incineration being classified as discontinued operations.
41 CONSOLIDATED FINANCIAL STATEMENTS, IFRS
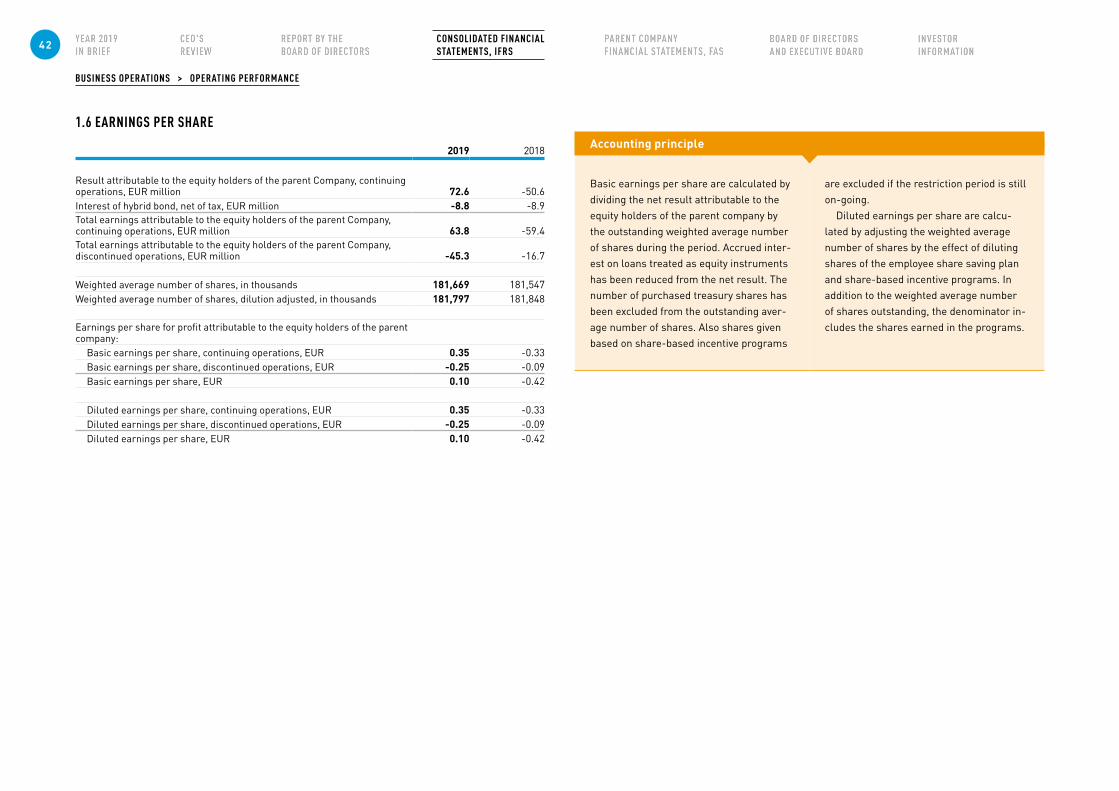
BUSINESS OPERATIONS > OPERATING PERFORMANCE
1.6 EARNINGS PER SHARE
2019
2018
Result attributable to the equity holders of the parent Company, continuing operations, EUR million 72.6 -50.6Interest of hybrid bond, net of tax, EUR million -8.8 -8.9Total earnings attributable to the equity holders of the parent Company, continuing operations, EUR million 63.8 -59.4Total earnings attributable to the equity holders of the parent Company, discontinued operations, EUR million -45.3 -16.7
Weighted average number of shares, in thousands 181,669 181,547Weighted average number of shares, dilution adjusted, in thousands 181,797 181,848
Earnings per share for profit attributable to the equity holders of the parent company:
Basic earnings per share, continuing operations, EUR 0.35 -0.33Basic earnings per share, discontinued operations, EUR -0.25 -0.09Basic earnings per share, EUR 0.10 -0.42
Diluted earnings per share, continuing operations, EUR 0.35 -0.33Diluted earnings per share, discontinued operations, EUR -0.25 -0.09Diluted earnings per share, EUR 0.10 -0.42
Accounting principle
Basic earnings per share are calculated by dividing the net result attributable to the equity holders of the parent company by the outstanding weighted average number of shares during the period. Accrued inter-est on loans treated as equity instruments has been reduced from the net result. The number of purchased treasury shares has been excluded from the outstanding aver-age number of shares. Also shares given based on share-based incentive programs
are excluded if the restriction period is still on-going.
Diluted earnings per share are calcu-lated by adjusting the weighted average number of shares by the effect of diluting shares of the employee share saving plan and share-based incentive programs. In addition to the weighted average number of shares outstanding, the denominator in-cludes the shares earned in the programs.
42 CONSOLIDATED FINANCIAL STATEMENTS, IFRS
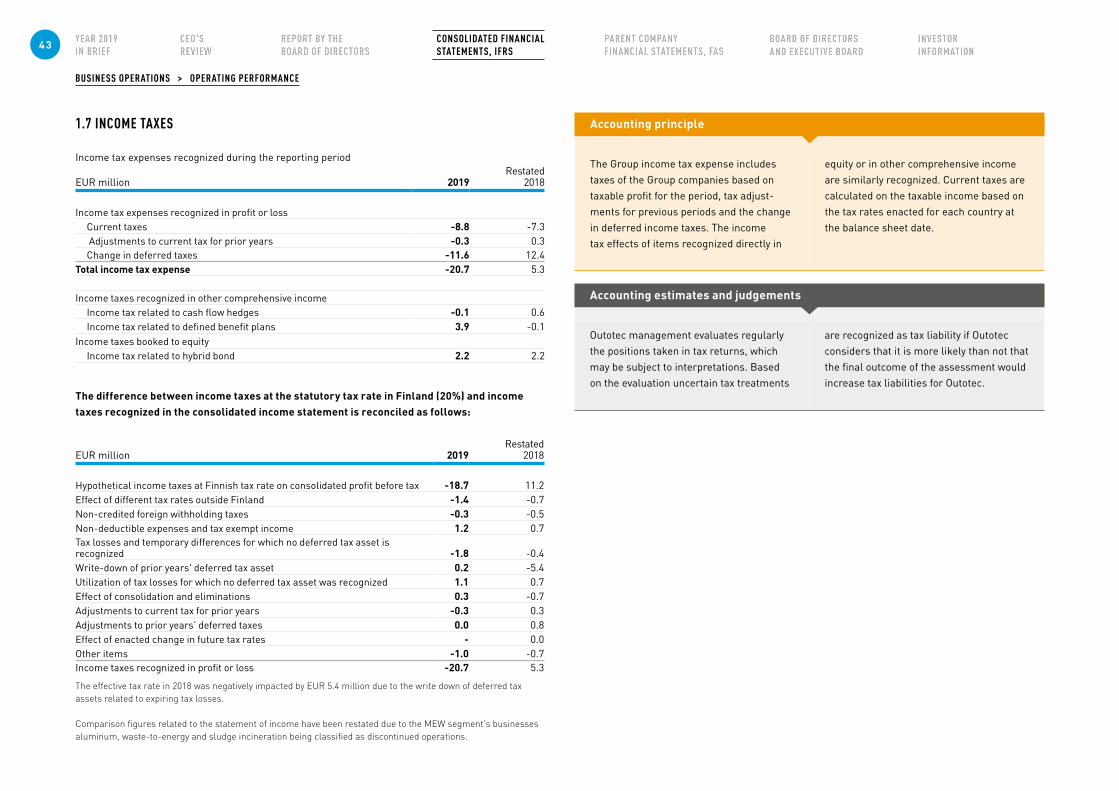
BUSINESS OPERATIONS > OPERATING PERFORMANCE
1.7 INCOME TAXES
Income tax expenses recognized during the reporting period
EUR million 2019Restated
2018
Income tax expenses recognized in profit or lossCurrent taxes -8.8 -7.3 Adjustments to current tax for prior years -0.3 0.3Change in deferred taxes -11.6 12.4
Total income tax expense -20.7 5.3
Income taxes recognized in other comprehensive incomeIncome tax related to cash flow hedges -0.1 0.6Income tax related to defined benefit plans 3.9 -0.1
Income taxes booked to equityIncome tax related to hybrid bond 2.2 2.2
The difference between income taxes at the statutory tax rate in Finland (20%) and income taxes recognized in the consolidated income statement is reconciled as follows:
EUR million 2019Restated
2018
Hypothetical income taxes at Finnish tax rate on consolidated profit before tax -18.7 11.2Effect of different tax rates outside Finland -1.4 -0.7Non-credited foreign withholding taxes -0.3 -0.5Non-deductible expenses and tax exempt income 1.2 0.7Tax losses and temporary differences for which no deferred tax asset is recognized -1.8 -0.4Write-down of prior years' deferred tax asset 0.2 -5.4Utilization of tax losses for which no deferred tax asset was recognized 1.1 0.7Effect of consolidation and eliminations 0.3 -0.7Adjustments to current tax for prior years -0.3 0.3Adjustments to prior years' deferred taxes 0.0 0.8Effect of enacted change in future tax rates - 0.0Other items -1.0 -0.7Income taxes recognized in profit or loss -20.7 5.3
The effective tax rate in 2018 was negatively impacted by EUR 5.4 million due to the write down of deferred tax assets related to expiring tax losses.
Comparison figures related to the statement of income have been restated due to the MEW segment's businesses aluminum, waste-to-energy and sludge incineration being classified as discontinued operations.
Accounting principle
The Group income tax expense includes taxes of the Group companies based on taxable profit for the period, tax adjust-ments for previous periods and the change in deferred income taxes. The income tax effects of items recognized directly in
equity or in other comprehensive income are similarly recognized. Current taxes are calculated on the taxable income based on the tax rates enacted for each country at the balance sheet date.
Accounting estimates and judgements
Outotec management evaluates regularly the positions taken in tax returns, which may be subject to interpretations. Based on the evaluation uncertain tax treatments
are recognized as tax liability if Outotec considers that it is more likely than not that the final outcome of the assessment would increase tax liabilities for Outotec.
43 CONSOLIDATED FINANCIAL STATEMENTS, IFRS

BUSINESS OPERATIONS > OPERATING PERFORMANCE
DEFERRED TAXES IN CONSOLIDATED STATEMENT OF FINANCIAL POSITION
EUR million 2019 2018
Deferred tax assets 72.3 78.2Deferred tax liabilities 7.5 7.7
64.8 70.6
Changes in deferred tax assets and liabilities
2019EUR million
January 1
Recognized in profit or loss
Recognized in other
compre- hensive income
Charged to equity
Translation and other
differences
Deferred taxes related to
discontinued operations
December 31
Deferred tax assetsTax losses and credits carried forward 19.6 1.7 - - 0.3 - 21.7Timing difference in revenue recognition 5.5 -1.5 - - - - 4.1Pension provisions 1.4 0.5 - - - - 1.9Depreciaton difference 24.9 -4.7 - - - - 20.2Project provisions 31.5 -12.6 - - - - 18.9Effects of consolidation and eliminations 6.6 1.6 - - - -0.5 7.7Valuation loss on assets, liabilities and derivative instruments 7.7 0.0 4.0 - - - 11.7Provisions for operating expenses and other items 17.0 3.5 - - - - 20.5
114.2 -11.3 4.0 - 0.3 -0.5 106.8Netting of deferred tax assets and liabilities1 -36.1 - - - - -34.4
78.2 -11.3 4.0 - 0.3 -0.5 72.3
Deferred tax liabilitiesTiming difference in revenue recognition 16.6 1.0 - - - - 17.6Depreciaton difference 4.6 2.6 - - - - 7.2Purchase price allocation 6.2 -1.1 - - - - 5.1Valuation gain on assets, liabilities and derivative instruments 0.2 0.0 0.2 - - - 0.4Hybrid loan 1.7 2.2 - -2.2 - - 1.7Project provisions 5.9 -3.9 - - - - 2.1Other items 8.5 -0.5 - - - - 8.0
43.8 0.3 0.2 -2.2 - - 41.9Netting of deferred tax assets and liabilities1 -36.1 - - - - -34.4
7.7 0.3 0.2 -2.2 - - 7.5
Net deferred tax asset 70.6 -11.6 3.8 2.2 0.3 -0.5 64.8
Accounting principle
Deferred income taxes are calculated using the liability method and recognized on all temporary differences arising between the tax bases of assets and liabilities and their carrying amount in the financial statements. Deferred tax is determined by using the tax rates (and laws) that are enacted or substantially enacted by the closing date and are expected to be applied at the time of settlement of the temporary difference. Deferred tax is recognized for the undistributed profits in subsidiaries and associated companies, unless the timing of the reversal of the temporary difference is
controlled by Outotec and it is probable that such temporary difference will not reverse in the foreseeable future.
Deductible temporary differences are recognized as a deferred tax asset to the extent that it is probable that future taxable profits will be available, against which the deductible temporary difference can be utilized.
Deferred tax assets are offset against deferred tax liabilities when they relate to the same taxation authority.
Accounting estimates and judgements
In determining the deferred tax assets and liabilities, Outotec management has made certain assumptions and estimates regard-ing the future tax consequences related to differences between the carrying amounts of assets and liabilities as recorded in the financial statements and their tax basis. The assumptions made include estimates
regarding future operating performance and taxable income of subsidiaries, recov-erability periods for tax-loss carry forwards will not change, and that the existing tax laws and rates will remain unchanged into foreseeable future in jurisdictions where Outotec operates.
44 CONSOLIDATED FINANCIAL STATEMENTS, IFRS
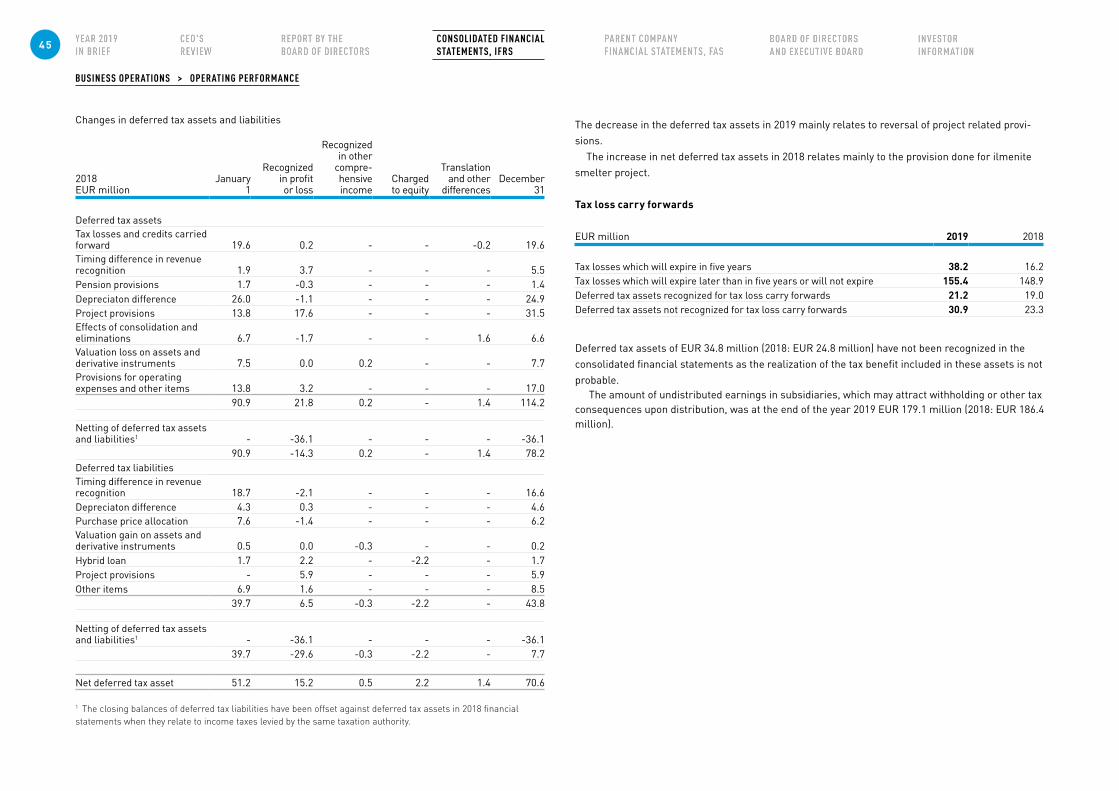
BUSINESS OPERATIONS > OPERATING PERFORMANCE
Changes in deferred tax assets and liabilities
2018 EUR million
January 1
Recognized in profit or loss
Recognized in other
compre-hensive income
Charged to equity
Translation and other
differencesDecember
31
Deferred tax assetsTax losses and credits carried forward 19.6 0.2 - - -0.2 19.6Timing difference in revenue recognition 1.9 3.7 - - - 5.5Pension provisions 1.7 -0.3 - - - 1.4Depreciaton difference 26.0 -1.1 - - - 24.9Project provisions 13.8 17.6 - - - 31.5Effects of consolidation and eliminations 6.7 -1.7 - - 1.6 6.6Valuation loss on assets and derivative instruments 7.5 0.0 0.2 - - 7.7Provisions for operating expenses and other items 13.8 3.2 - - - 17.0
90.9 21.8 0.2 - 1.4 114.2
Netting of deferred tax assets and liabilities1 - -36.1 - - - -36.1
90.9 -14.3 0.2 - 1.4 78.2Deferred tax liabilitiesTiming difference in revenue recognition 18.7 -2.1 - - - 16.6Depreciaton difference 4.3 0.3 - - - 4.6Purchase price allocation 7.6 -1.4 - - - 6.2Valuation gain on assets and derivative instruments 0.5 0.0 -0.3 - - 0.2Hybrid loan 1.7 2.2 - -2.2 - 1.7Project provisions - 5.9 - - - 5.9Other items 6.9 1.6 - - - 8.5
39.7 6.5 -0.3 -2.2 - 43.8
Netting of deferred tax assets and liabilities1 - -36.1 - - - -36.1
39.7 -29.6 -0.3 -2.2 - 7.7
Net deferred tax asset 51.2 15.2 0.5 2.2 1.4 70.6
1 The closing balances of deferred tax liabilities have been offset against deferred tax assets in 2018 financial statements when they relate to income taxes levied by the same taxation authority.
The decrease in the deferred tax assets in 2019 mainly relates to reversal of project related provi-sions.
The increase in net deferred tax assets in 2018 relates mainly to the provision done for ilmenite smelter project.
Tax loss carry forwards
EUR million 2019 2018
Tax losses which will expire in five years 38.2 16.2Tax losses which will expire later than in five years or will not expire 155.4 148.9Deferred tax assets recognized for tax loss carry forwards 21.2 19.0Deferred tax assets not recognized for tax loss carry forwards 30.9 23.3
Deferred tax assets of EUR 34.8 million (2018: EUR 24.8 million) have not been recognized in the consolidated financial statements as the realization of the tax benefit included in these assets is not probable.
The amount of undistributed earnings in subsidiaries, which may attract withholding or other tax consequences upon distribution, was at the end of the year 2019 EUR 179.1 million (2018: EUR 186.4 million).
45 CONSOLIDATED FINANCIAL STATEMENTS, IFRS
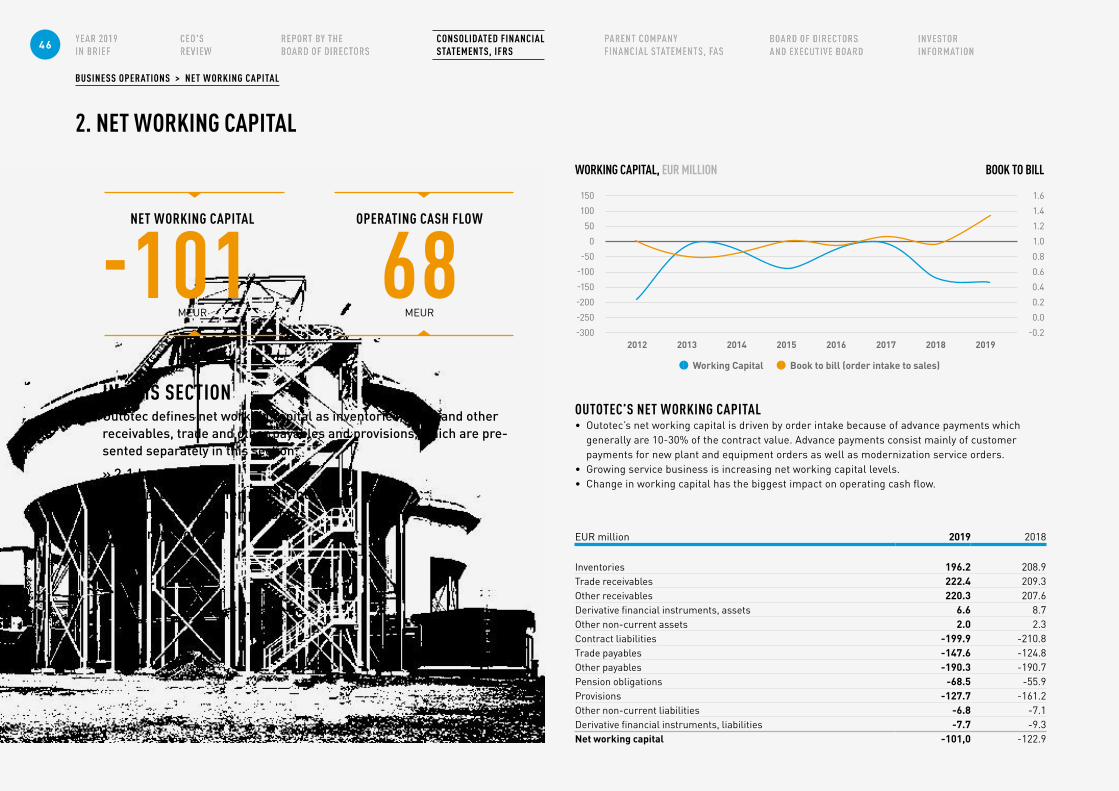
BUSINESS OPERATIONS > NET WORKING CAPITAL
2. NET WORKING CAPITAL
IN THIS SECTIONOutotec defines net working capital as inventories, trade and other receivables, trade and other payables and provisions, which are pre-sented separately in this section:
» 2.1 Inventories » 2.2 Trade and other receivables » 2.3 Trade and other payables » 2.4 Provisions
OUTOTEC’S NET WORKING CAPITAL• Outotec’s net working capital is driven by order intake because of advance payments which
generally are 10-30% of the contract value. Advance payments consist mainly of customer payments for new plant and equipment orders as well as modernization service orders.
• Growing service business is increasing net working capital levels.• Change in working capital has the biggest impact on operating cash flow.
EUR million 2019 2018
Inventories 196.2 208.9Trade receivables 222.4 209.3Other receivables 220.3 207.6Derivative financial instruments, assets 6.6 8.7Other non-current assets 2.0 2.3Contract liabilities -199.9 -210.8Trade payables -147.6 -124.8Other payables -190.3 -190.7Pension obligations -68.5 -55.9Provisions -127.7 -161.2Other non-current liabilities -6.8 -7.1Derivative financial instruments, liabilities -7.7 -9.3Net working capital -101,0 -122.9
OPERATING CASH FLOW
68 MEUR
NET WORKING CAPITAL
-101 MEUR
150 1.6
100 1.4
50 1.2
0 1.0
-50 0.8
-100 0.6
-150 0.4
-200 0.2
-250 0.0
-300 -0.22012 2013 2014 2015 2016 2018 20192017
WORKING CAPITAL, EUR MILLION BOOK TO BILL
Working Capital Book to bill (order intake to sales)
46 CONSOLIDATED FINANCIAL STATEMENTS, IFRS
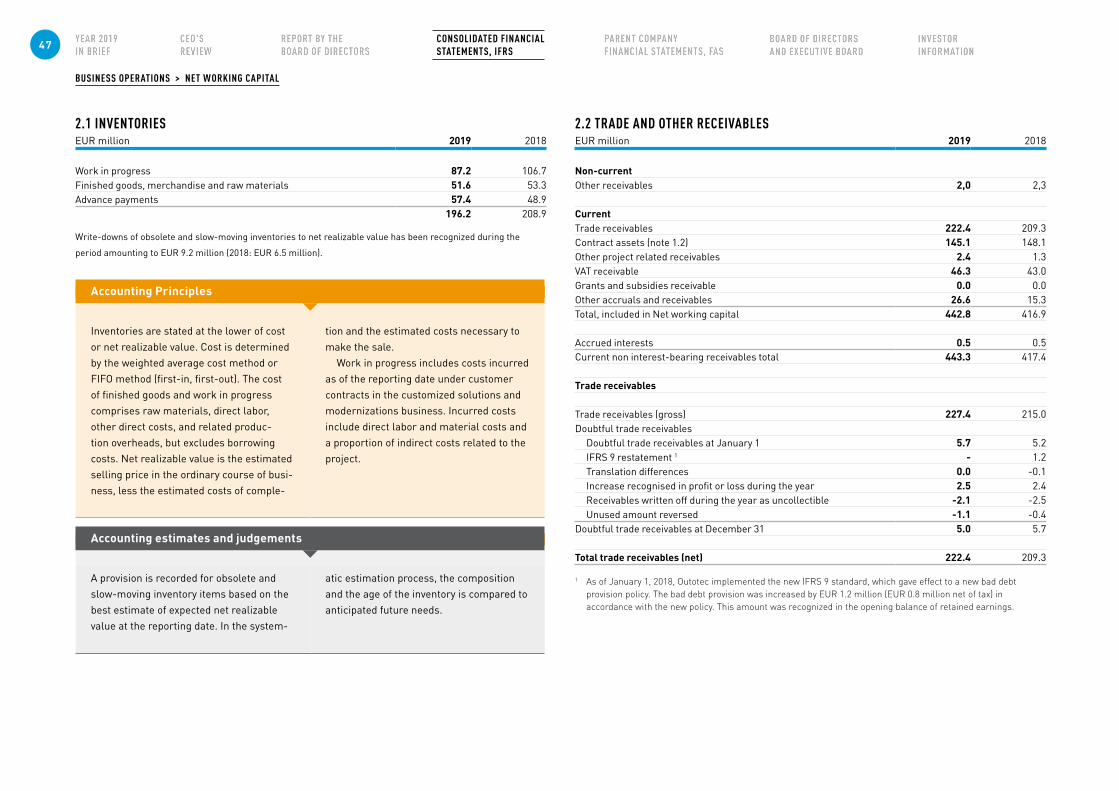
2.2 TRADE AND OTHER RECEIVABLESEUR million 2019 2018
Non-currentOther receivables 2,0 2,3
CurrentTrade receivables 222.4 209.3Contract assets (note 1.2) 145.1 148.1Other project related receivables 2.4 1.3VAT receivable 46.3 43.0Grants and subsidies receivable 0.0 0.0Other accruals and receivables 26.6 15.3Total, included in Net working capital 442.8 416.9
Accrued interests 0.5 0.5Current non interest-bearing receivables total 443.3 417.4
Trade receivables
Trade receivables (gross) 227.4 215.0Doubtful trade receivables
Doubtful trade receivables at January 1 5.7 5.2IFRS 9 restatement 1 - 1.2Translation differences 0.0 -0.1Increase recognised in profit or loss during the year 2.5 2.4Receivables written off during the year as uncollectible -2.1 -2.5Unused amount reversed -1.1 -0.4
Doubtful trade receivables at December 31 5.0 5.7
Total trade receivables (net) 222.4 209.3
1 As of January 1, 2018, Outotec implemented the new IFRS 9 standard, which gave effect to a new bad debt provision policy. The bad debt provision was increased by EUR 1.2 million (EUR 0.8 million net of tax) in accordance with the new policy. This amount was recognized in the opening balance of retained earnings.
Accounting Principles
Inventories are stated at the lower of cost or net realizable value. Cost is determined by the weighted average cost method or FIFO method (first-in, first-out). The cost of finished goods and work in progress comprises raw materials, direct labor, other direct costs, and related produc-tion overheads, but excludes borrowing costs. Net realizable value is the estimated selling price in the ordinary course of busi-ness, less the estimated costs of comple-
tion and the estimated costs necessary to make the sale.
Work in progress includes costs incurred as of the reporting date under customer contracts in the customized solutions and modernizations business. Incurred costs include direct labor and material costs and a proportion of indirect costs related to the project.
Accounting estimates and judgements
A provision is recorded for obsolete and slow-moving inventory items based on the best estimate of expected net realizable value at the reporting date. In the system-
atic estimation process, the composition and the age of the inventory is compared to anticipated future needs.
2.1 INVENTORIESEUR million 2019 2018
Work in progress 87.2 106.7Finished goods, merchandise and raw materials 51.6 53.3Advance payments 57.4 48.9
196.2 208.9
Write-downs of obsolete and slow-moving inventories to net realizable value has been recognized during the
period amounting to EUR 9.2 million (2018: EUR 6.5 million).
BUSINESS OPERATIONS > NET WORKING CAPITAL
47 CONSOLIDATED FINANCIAL STATEMENTS, IFRS
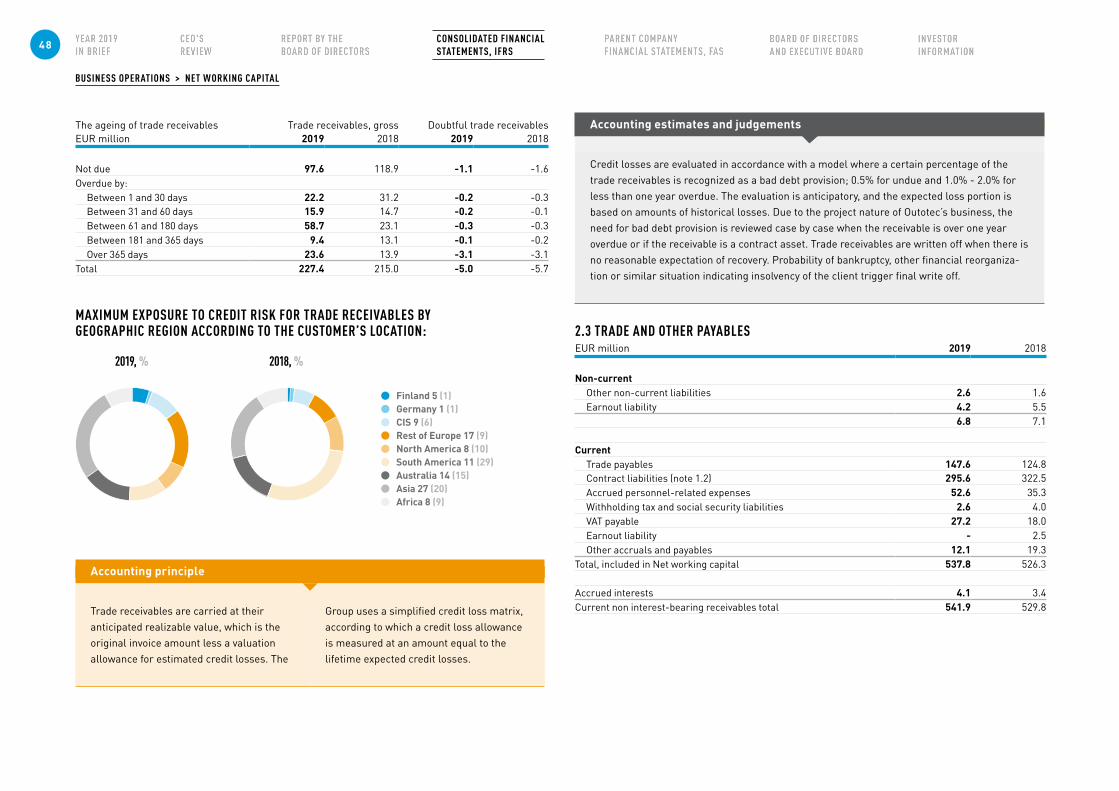
2.3 TRADE AND OTHER PAYABLESEUR million 2019 2018
Non-currentOther non-current liabilities 2.6 1.6Earnout liability 4.2 5.5
6.8 7.1
CurrentTrade payables 147.6 124.8Contract liabilities (note 1.2) 295.6 322.5Accrued personnel-related expenses 52.6 35.3Withholding tax and social security liabilities 2.6 4.0VAT payable 27.2 18.0Earnout liability - 2.5Other accruals and payables 12.1 19.3
Total, included in Net working capital 537.8 526.3
Accrued interests 4.1 3.4Current non interest-bearing receivables total 541.9 529.8
The ageing of trade receivables Trade receivables, gross Doubtful trade receivablesEUR million 2019 2018 2019 2018
Not due 97.6 118.9 -1.1 -1.6Overdue by:
Between 1 and 30 days 22.2 31.2 -0.2 -0.3Between 31 and 60 days 15.9 14.7 -0.2 -0.1Between 61 and 180 days 58.7 23.1 -0.3 -0.3Between 181 and 365 days 9.4 13.1 -0.1 -0.2Over 365 days 23.6 13.9 -3.1 -3.1
Total 227.4 215.0 -5.0 -5.7
Accounting estimates and judgements
Credit losses are evaluated in accordance with a model where a certain percentage of the trade receivables is recognized as a bad debt provision; 0.5% for undue and 1.0% - 2.0% for less than one year overdue. The evaluation is anticipatory, and the expected loss portion is based on amounts of historical losses. Due to the project nature of Outotec’s business, the need for bad debt provision is reviewed case by case when the receivable is over one year overdue or if the receivable is a contract asset. Trade receivables are written off when there is no reasonable expectation of recovery. Probability of bankruptcy, other financial reorganiza-tion or similar situation indicating insolvency of the client trigger final write off.
Finland 5 (1) Germany 1 (1) CIS 9 (6) Rest of Europe 17 (9) North America 8 (10) South America 11 (29) Australia 14 (15) Asia 27 (20) Africa 8 (9)
Accounting principle
Trade receivables are carried at their anticipated realizable value, which is the original invoice amount less a valuation allowance for estimated credit losses. The
Group uses a simplified credit loss matrix, according to which a credit loss allowance is measured at an amount equal to the lifetime expected credit losses.
MAXIMUM EXPOSURE TO CREDIT RISK FOR TRADE RECEIVABLES BY GEOGRAPHIC REGION ACCORDING TO THE CUSTOMER’S LOCATION:
2019, % 2018, %
BUSINESS OPERATIONS > NET WORKING CAPITAL
48 CONSOLIDATED FINANCIAL STATEMENTS, IFRS
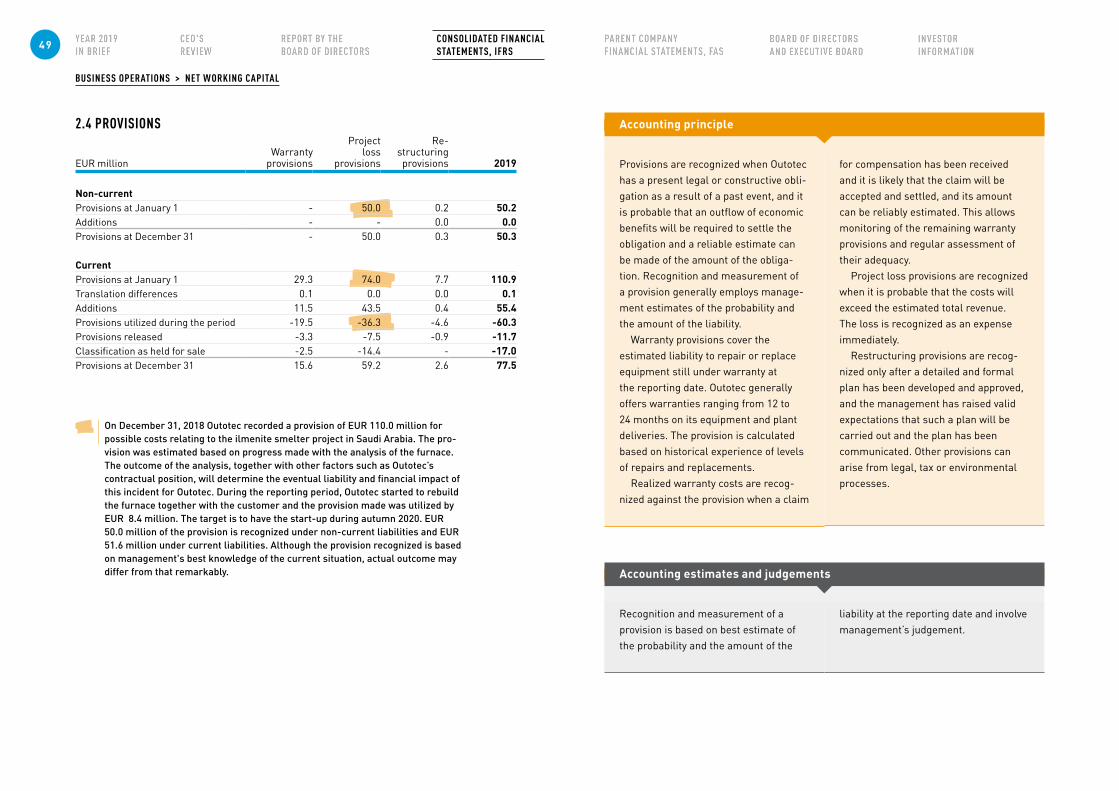
2.4 PROVISIONS
EUR millionWarranty
provisions
Project loss
provisions
Re- structuring provisions 2019
Non-currentProvisions at January 1 - 50.0 0.2 50.2Additions - - 0.0 0.0Provisions at December 31 - 50.0 0.3 50.3
CurrentProvisions at January 1 29.3 74.0 7.7 110.9Translation differences 0.1 0.0 0.0 0.1Additions 11.5 43.5 0.4 55.4Provisions utilized during the period -19.5 -36.3 -4.6 -60.3Provisions released -3.3 -7.5 -0.9 -11.7Classification as held for sale -2.5 -14.4 - -17.0Provisions at December 31 15.6 59.2 2.6 77.5
Accounting principle
Provisions are recognized when Outotec has a present legal or constructive obli-gation as a result of a past event, and it is probable that an outflow of economic benefits will be required to settle the obligation and a reliable estimate can be made of the amount of the obliga-tion. Recognition and measurement of a provision generally employs manage-ment estimates of the probability and the amount of the liability.
Warranty provisions cover the estimated liability to repair or replace equipment still under warranty at the reporting date. Outotec generally offers warranties ranging from 12 to 24 months on its equipment and plant deliveries. The provision is calculated based on historical experience of levels of repairs and replacements.
Realized warranty costs are recog-nized against the provision when a claim
for compensation has been received and it is likely that the claim will be accepted and settled, and its amount can be reliably estimated. This allows monitoring of the remaining warranty provisions and regular assessment of their adequacy.
Project loss provisions are recognized when it is probable that the costs will exceed the estimated total revenue. The loss is recognized as an expense immediately.
Restructuring provisions are recog-nized only after a detailed and formal plan has been developed and approved, and the management has raised valid expectations that such a plan will be carried out and the plan has been communicated. Other provisions can arise from legal, tax or environmental processes.
On December 31, 2018 Outotec recorded a provision of EUR 110.0 million for possible costs relating to the ilmenite smelter project in Saudi Arabia. The pro-vision was estimated based on progress made with the analysis of the furnace. The outcome of the analysis, together with other factors such as Outotec’s contractual position, will determine the eventual liability and financial impact of this incident for Outotec. During the reporting period, Outotec started to rebuild the furnace together with the customer and the provision made was utilized by EUR 8.4 million. The target is to have the start-up during autumn 2020. EUR 50.0 million of the provision is recognized under non-current liabilities and EUR 51.6 million under current liabilities. Although the provision recognized is based on management's best knowledge of the current situation, actual outcome may differ from that remarkably. Accounting estimates and judgements
Recognition and measurement of a provision is based on best estimate of the probability and the amount of the
liability at the reporting date and involve management’s judgement.
BUSINESS OPERATIONS > NET WORKING CAPITAL
49 CONSOLIDATED FINANCIAL STATEMENTS, IFRS
CAPITAL STRUCTURE
50 CONSOLIDATED FINANCIAL STATEMENTS, IFRS
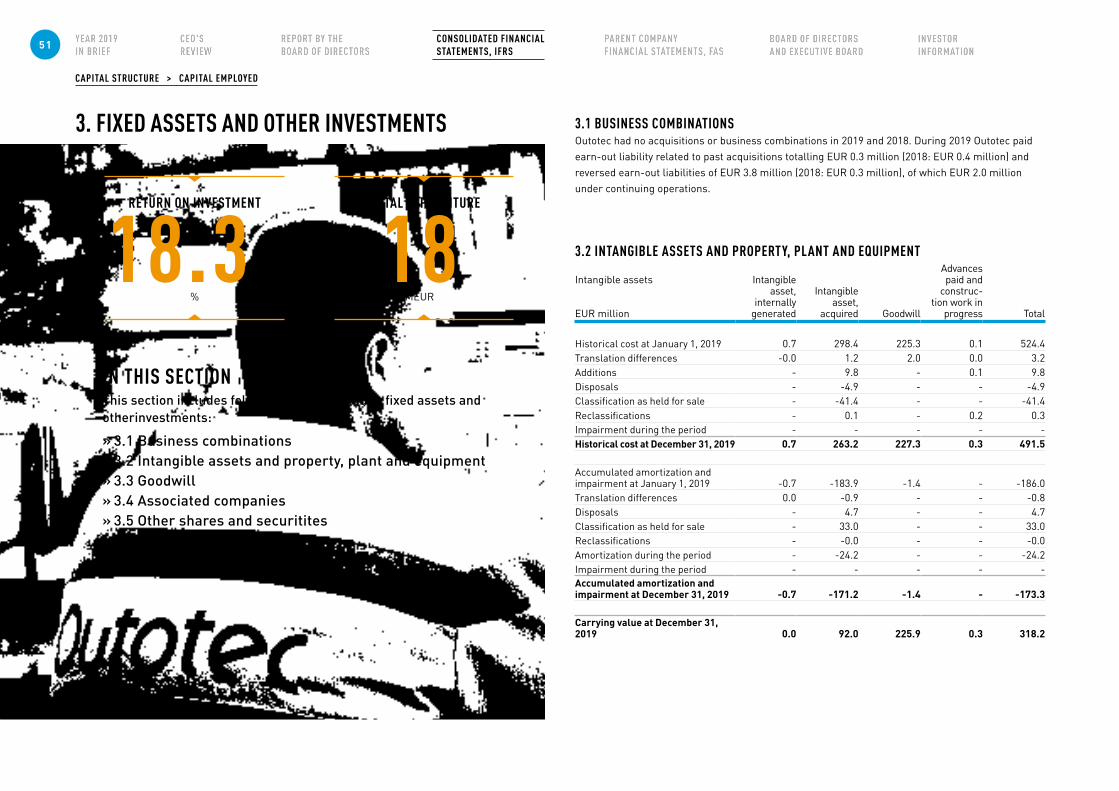
CAPITAL STRUCTURE > CAPITAL EMPLOYED
IN THIS SECTIONThis section includes following notes related to fixed assets and otherinvestments:
» 3.1 Business combinations » 3.2 Intangible assets and property, plant and equipment » 3.3 Goodwill » 3.4 Associated companies » 3.5 Other shares and securitites
CAPITAL EXPENDITURE
18 MEUR
RETURN ON INVESTMENT
18.3 %
3. FIXED ASSETS AND OTHER INVESTMENTS 3.1 BUSINESS COMBINATIONSOutotec had no acquisitions or business combinations in 2019 and 2018. During 2019 Outotec paid earn-out liability related to past acquisitions totalling EUR 0.3 million (2018: EUR 0.4 million) and reversed earn-out liabilities of EUR 3.8 million (2018: EUR 0.3 million), of which EUR 2.0 million under continuing operations.
3.2 INTANGIBLE ASSETS AND PROPERTY, PLANT AND EQUIPMENT
Intangible assets
EUR million
Intangible asset,
internally generated
Intangible asset,
acquired Goodwill
Advances paid and
construc-tion work in
progress Total
Historical cost at January 1, 2019 0.7 298.4 225.3 0.1 524.4Translation differences -0.0 1.2 2.0 0.0 3.2Additions - 9.8 - 0.1 9.8Disposals - -4.9 - - -4.9Classification as held for sale - -41.4 - - -41.4Reclassifications - 0.1 - 0.2 0.3Impairment during the period - - - - -Historical cost at December 31, 2019 0.7 263.2 227.3 0.3 491.5
Accumulated amortization and impairment at January 1, 2019 -0.7 -183.9 -1.4 - -186.0Translation differences 0.0 -0.9 - - -0.8Disposals - 4.7 - - 4.7Classification as held for sale - 33.0 - - 33.0Reclassifications - -0.0 - - -0.0Amortization during the period - -24.2 - - -24.2Impairment during the period - - - - -Accumulated amortization and impairment at December 31, 2019 -0.7 -171.2 -1.4 - -173.3
Carrying value at December 31, 2019 0.0 92.0 225.9 0.3 318.2
51 CONSOLIDATED FINANCIAL STATEMENTS, IFRS
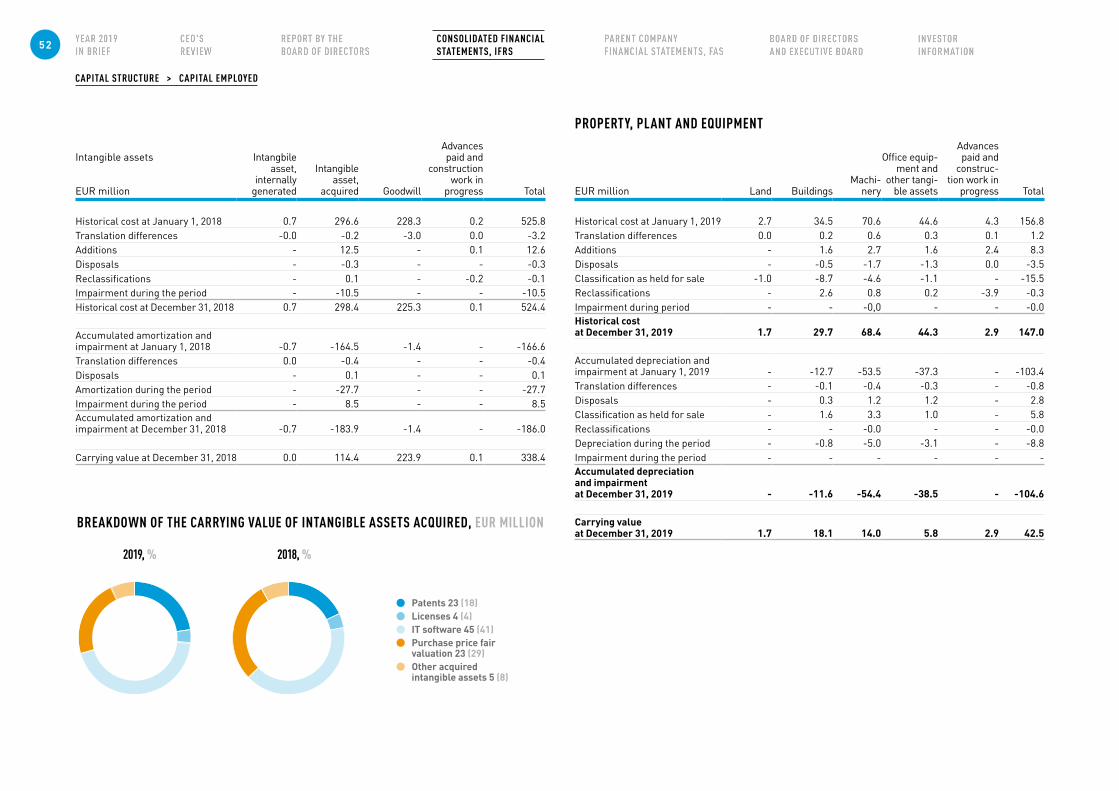
CAPITAL STRUCTURE > CAPITAL EMPLOYED
Patents 23 (18) Licenses 4 (4) IT software 45 (41) Purchase price fair
valuation 23 (29) Other acquired
intangible assets 5 (8)
BREAKDOWN OF THE CARRYING VALUE OF INTANGIBLE ASSETS ACQUIRED, EUR MILLION
2019, % 2018, %
PROPERTY, PLANT AND EQUIPMENT
EUR million Land BuildingsMachi-
nery
Office equip-ment and
other tangi-ble assets
Advances paid and
construc-tion work in
progress Total
Historical cost at January 1, 2019 2.7 34.5 70.6 44.6 4.3 156.8Translation differences 0.0 0.2 0.6 0.3 0.1 1.2Additions - 1.6 2.7 1.6 2.4 8.3Disposals - -0.5 -1.7 -1.3 0.0 -3.5Classification as held for sale -1.0 -8.7 -4.6 -1.1 - -15.5Reclassifications - 2.6 0.8 0.2 -3.9 -0.3Impairment during period - - -0,0 - - -0.0Historical cost at December 31, 2019 1.7 29.7 68.4 44.3 2.9 147.0
Accumulated depreciation and impairment at January 1, 2019 - -12.7 -53.5 -37.3 - -103.4Translation differences - -0.1 -0.4 -0.3 - -0.8Disposals - 0.3 1.2 1.2 - 2.8Classification as held for sale - 1.6 3.3 1.0 - 5.8Reclassifications - - -0.0 - - -0.0 Depreciation during the period - -0.8 -5.0 -3.1 - -8.8Impairment during the period - - - - - -Accumulated depreciation and impairment at December 31, 2019 - -11.6 -54.4 -38.5 - -104.6
Carrying value at December 31, 2019 1.7 18.1 14.0 5.8 2.9 42.5
Intangible assets
EUR million
Intangbile asset,
internally generated
Intangible asset,
acquired Goodwill
Advances paid and
construction work in
progress Total
Historical cost at January 1, 2018 0.7 296.6 228.3 0.2 525.8Translation differences -0.0 -0.2 -3.0 0.0 -3.2Additions - 12.5 - 0.1 12.6Disposals - -0.3 - - -0.3Reclassifications - 0.1 - -0.2 -0.1Impairment during the period - -10.5 - - -10.5Historical cost at December 31, 2018 0.7 298.4 225.3 0.1 524.4
Accumulated amortization and impairment at January 1, 2018 -0.7 -164.5 -1.4 - -166.6Translation differences 0.0 -0.4 - - -0.4Disposals - 0.1 - - 0.1Amortization during the period - -27.7 - - -27.7Impairment during the period - 8.5 - - 8.5Accumulated amortization and impairment at December 31, 2018 -0.7 -183.9 -1.4 - -186.0
Carrying value at December 31, 2018 0.0 114.4 223.9 0.1 338.4
52 CONSOLIDATED FINANCIAL STATEMENTS, IFRS
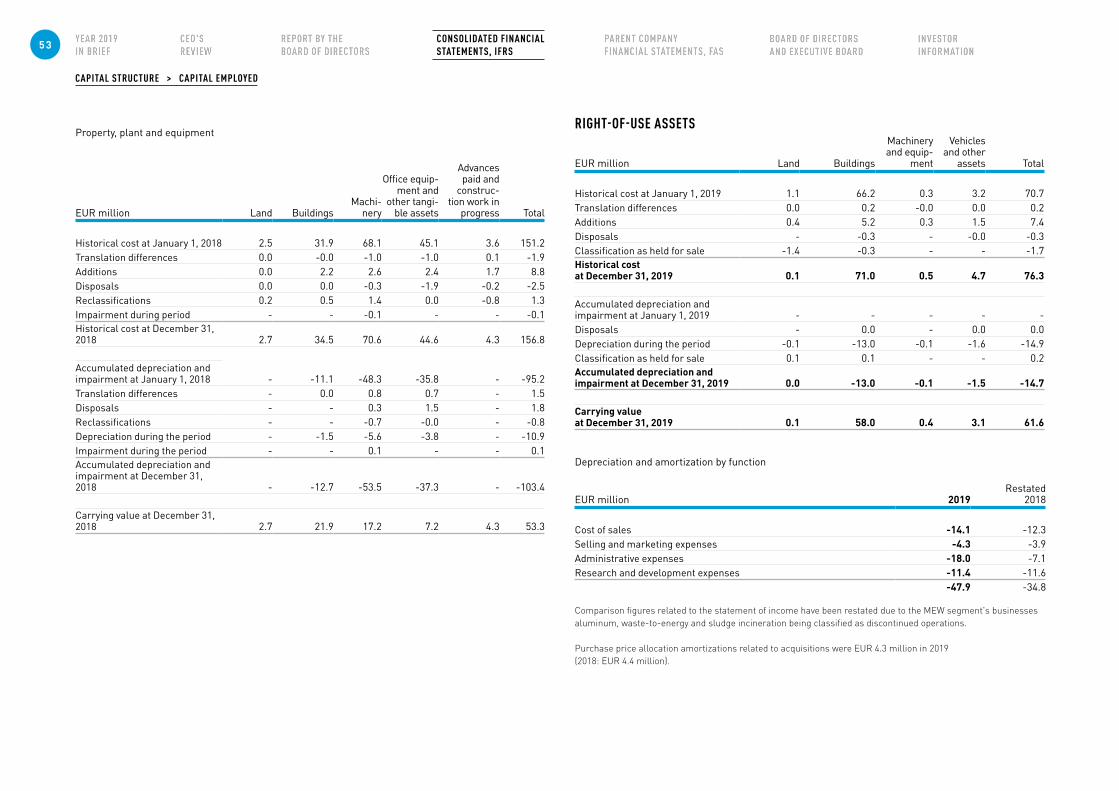
CAPITAL STRUCTURE > CAPITAL EMPLOYED
Property, plant and equipment
EUR million Land BuildingsMachi-
nery
Office equip-ment and
other tangi-ble assets
Advances paid and
construc-tion work in
progress Total
Historical cost at January 1, 2018 2.5 31.9 68.1 45.1 3.6 151.2Translation differences 0.0 -0.0 -1.0 -1.0 0.1 -1.9Additions 0.0 2.2 2.6 2.4 1.7 8.8Disposals 0.0 0.0 -0.3 -1.9 -0.2 -2.5Reclassifications 0.2 0.5 1.4 0.0 -0.8 1.3Impairment during period - - -0.1 - - -0.1Historical cost at December 31, 2018 2.7 34.5 70.6 44.6 4.3 156.8
Accumulated depreciation and impairment at January 1, 2018 - -11.1 -48.3 -35.8 - -95.2Translation differences - 0.0 0.8 0.7 - 1.5Disposals - - 0.3 1.5 - 1.8Reclassifications - - -0.7 -0.0 - -0.8Depreciation during the period - -1.5 -5.6 -3.8 - -10.9Impairment during the period - - 0.1 - - 0.1Accumulated depreciation and impairment at December 31, 2018 - -12.7 -53.5 -37.3 - -103.4
Carrying value at December 31, 2018 2.7 21.9 17.2 7.2 4.3 53.3
RIGHT-OF-USE ASSETS
EUR million Land Buildings
Machinery and equip-
ment
Vehicles and other
assets Total
Historical cost at January 1, 2019 1.1 66.2 0.3 3.2 70.7Translation differences 0.0 0.2 -0.0 0.0 0.2Additions 0.4 5.2 0.3 1.5 7.4Disposals - -0.3 - -0.0 -0.3Classification as held for sale -1.4 -0.3 - - -1.7Historical cost at December 31, 2019 0.1 71.0 0.5 4.7 76.3
Accumulated depreciation and impairment at January 1, 2019 - - - - -Disposals - 0.0 - 0.0 0.0Depreciation during the period -0.1 -13.0 -0.1 -1.6 -14.9Classification as held for sale 0.1 0.1 - - 0.2Accumulated depreciation and impairment at December 31, 2019 0.0 -13.0 -0.1 -1.5 -14.7
Carrying value at December 31, 2019 0.1 58.0 0.4 3.1 61.6
Depreciation and amortization by function
EUR million 2019Restated
2018
Cost of sales -14.1 -12.3Selling and marketing expenses -4.3 -3.9Administrative expenses -18.0 -7.1Research and development expenses -11.4 -11.6
-47.9 -34.8
Comparison figures related to the statement of income have been restated due to the MEW segment's businesses aluminum, waste-to-energy and sludge incineration being classified as discontinued operations.
Purchase price allocation amortizations related to acquisitions were EUR 4.3 million in 2019 (2018: EUR 4.4 million).
53 CONSOLIDATED FINANCIAL STATEMENTS, IFRS
CAPITAL STRUCTURE > CAPITAL EMPLOYED
Impairment of assetsIn 2018 the group did not record impairments in intangible assets (2018 1.9 million related to intellectual property rights and IT software).
The impairments have been recorded under other expenses in the Statement of Comprehen-sive income.
Accounting principle
Intangible assetsGoodwill arising on an acquisition represents the excess of the cost of the acquisition over the fair value of the net identifiable assets, liabilities, and contin-gent liabilities acquired. Goodwill is stated at cost and is not amortized but is tested annually for impairment.
Other intangible assets include customer relationships, patents, copyrights, licenses and software. The valuation of intangible assets acquired in a business combination is based on fair value. Development costs or acquisition costs of new software clearly associated with an identifiable product, which will be controlled by the Group and has probable economic benefit exceeding its cost beyond one year, are recognized as an intangible asset and depreciated over the software’s expected useful life. Associated costs include staff costs of the development team. An intangible asset is recognized only if it is probable that the
future economic benefits that are attribut-able to the asset will flow to the Group, and the cost of the asset can be measured reliably. All other expenditure is expensed as incurred.
Amortization of intangible assets is based on the following expected useful life: • Intangible rights 3–20 years• Software 3–10 years
Property, plant and equipmentProperty, plant and equipment acquired by Group companies are stated at historical cost, less impairment, except the assets of acquired companies that were stated at their fair values at the date of acquisition. Depreciation is calculated as based on the useful life of the assets. The carrying value of the property, plant and equipment in the statement of financial position represents the cost less accumulated depreciation and any impairment charges.
Depreciation of tangible assets is based on the following expected useful life:• Buildings 10–20 years• Machinery and equipment 5–20 years• Research and development equipment
3–10 years
Land is not depreciated.
The expected useful life of non-current assets is reviewed on each reporting date and, where they differ significantly from previous estimates, depreciation periods are changed accordingly. Ordinary repairs and maintenance costs are charged to the statement of comprehensive income during the financial year in which they are incurred. The cost of major renovations is included in the asset’s carrying amount when it is probable that the Group will derive future economic benefits in excess of the originally assessed standard of performance of the existing asset. Major renovations are depreciated over the useful life of the related assets. Gains and losses on sales and disposals are determined by comparing the received proceeds with the carrying amount and are included in operating profit.
Impairments of assetsProperty, plant and equipment and other non-current assets, including goodwill and intangible assets, are reviewed for poten-tial impairment at each date of statement of financial position, as well as whenever events or changes in circumstances indi-cate that the carrying amount of an asset may not be recoverable. If any such indica-tion arises, the recoverable amount is estimated as the higher of the asset’s fair value less cost of disposal and the value in use. An impairment loss is recognized in the statement of income whenever the carrying amount exceeds the recoverable amount.
A previously recognized impairment loss is reversed only if there has been a change in the estimates used to determine the recoverable amount. However, the reversal must not result in the adjusted value being higher than the carrying amount that would have been determined if no impairment loss had been recognized in prior years. Goodwill and intangible assets which are not yet available for use are tested for im-pairment. Further information in note 3.3.
54 CONSOLIDATED FINANCIAL STATEMENTS, IFRS
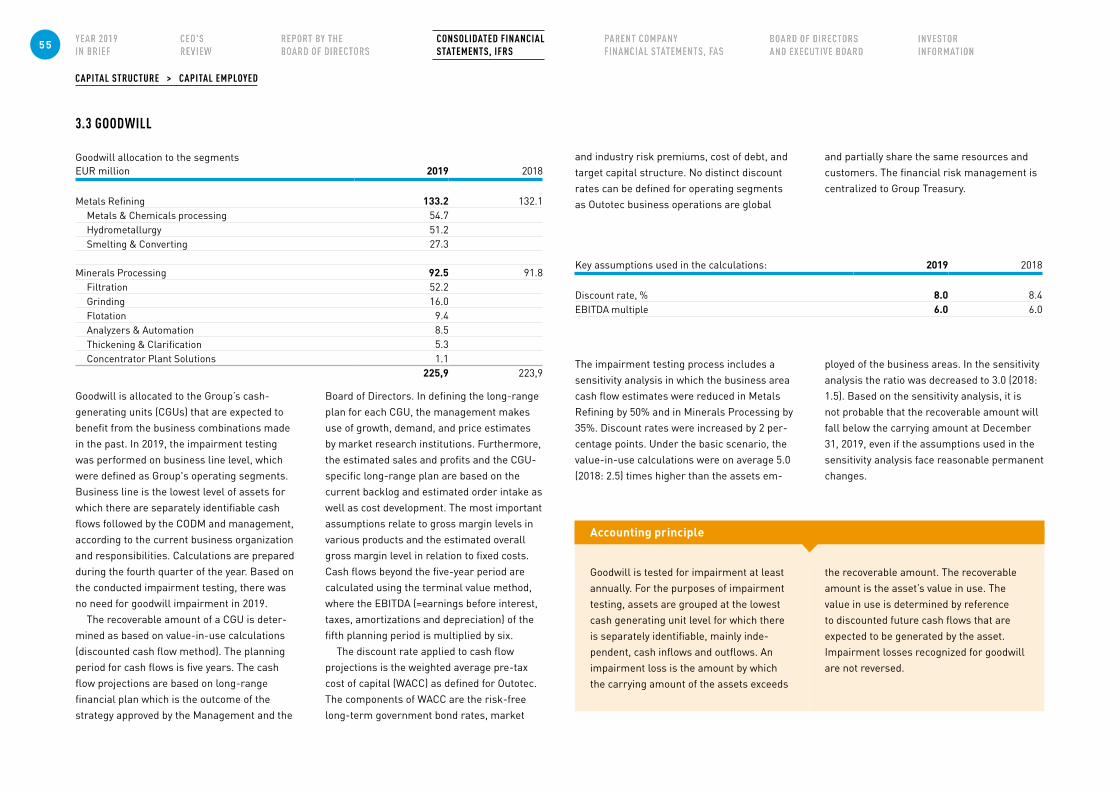
CAPITAL STRUCTURE > CAPITAL EMPLOYED
3.3 GOODWILL
Goodwill allocation to the segmentsEUR million 2019 2018
Metals Refining 133.2 132.1Metals & Chemicals processing 54.7Hydrometallurgy 51.2Smelting & Converting 27.3
Minerals Processing 92.5 91.8Filtration 52.2Grinding 16.0Flotation 9.4Analyzers & Automation 8.5Thickening & Clarification 5.3Concentrator Plant Solutions 1.1
225,9 223,9
Goodwill is allocated to the Group’s cash-generating units (CGUs) that are expected to benefit from the business combinations made in the past. In 2019, the impairment testing was performed on business line level, which were defined as Group's operating segments. Business line is the lowest level of assets for which there are separately identifiable cash flows followed by the CODM and management, according to the current business organization and responsibilities. Calculations are prepared during the fourth quarter of the year. Based on the conducted impairment testing, there was no need for goodwill impairment in 2019.
The recoverable amount of a CGU is deter-mined as based on value-in-use calculations (discounted cash flow method). The planning period for cash flows is five years. The cash flow projections are based on long-range financial plan which is the outcome of the strategy approved by the Management and the
Board of Directors. In defining the long-range plan for each CGU, the management makes use of growth, demand, and price estimates by market research institutions. Furthermore, the estimated sales and profits and the CGU-specific long-range plan are based on the current backlog and estimated order intake as well as cost development. The most important assumptions relate to gross margin levels in various products and the estimated overall gross margin level in relation to fixed costs. Cash flows beyond the five-year period are calculated using the terminal value method, where the EBITDA (=earnings before interest, taxes, amortizations and depreciation) of the fifth planning period is multiplied by six.
The discount rate applied to cash flow projections is the weighted average pre-tax cost of capital (WACC) as defined for Outotec. The components of WACC are the risk-free long-term government bond rates, market
and industry risk premiums, cost of debt, and target capital structure. No distinct discount rates can be defined for operating segments as Outotec business operations are global
and partially share the same resources and customers. The financial risk management is centralized to Group Treasury.
Key assumptions used in the calculations: 2019 2018
Discount rate, % 8.0 8.4EBITDA multiple 6.0 6.0
The impairment testing process includes a sensitivity analysis in which the business area cash flow estimates were reduced in Metals Refining by 50% and in Minerals Processing by 35%. Discount rates were increased by 2 per-centage points. Under the basic scenario, the value-in-use calculations were on average 5.0 (2018: 2.5) times higher than the assets em-
ployed of the business areas. In the sensitivity analysis the ratio was decreased to 3.0 (2018: 1.5). Based on the sensitivity analysis, it is not probable that the recoverable amount will fall below the carrying amount at December 31, 2019, even if the assumptions used in the sensitivity analysis face reasonable permanent changes.
Accounting principle
Goodwill is tested for impairment at least annually. For the purposes of impairment testing, assets are grouped at the lowest cash generating unit level for which there is separately identifiable, mainly inde-pendent, cash inflows and outflows. An impairment loss is the amount by which the carrying amount of the assets exceeds
the recoverable amount. The recoverable amount is the asset’s value in use. The value in use is determined by reference to discounted future cash flows that are expected to be generated by the asset. Impairment losses recognized for goodwill are not reversed.
55 CONSOLIDATED FINANCIAL STATEMENTS, IFRS
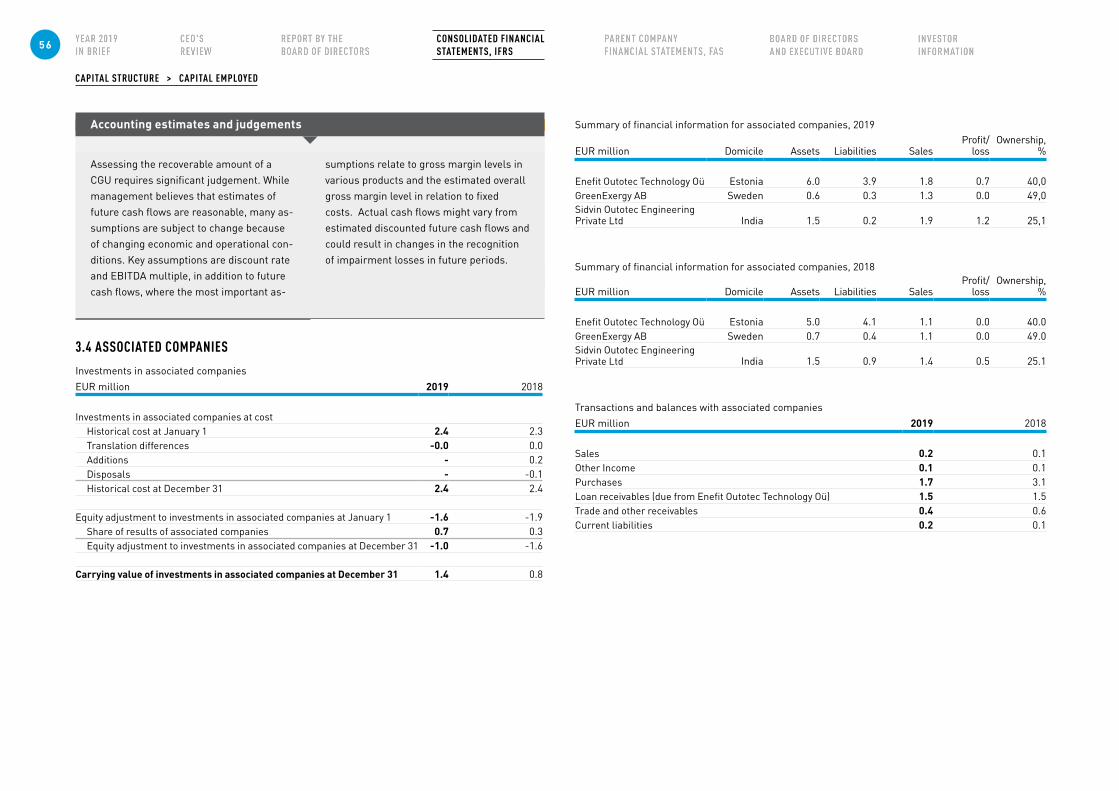
CAPITAL STRUCTURE > CAPITAL EMPLOYED
3.4 ASSOCIATED COMPANIESInvestments in associated companiesEUR million 2019 2018
Investments in associated companies at costHistorical cost at January 1 2.4 2.3Translation differences -0.0 0.0Additions - 0.2Disposals - -0.1Historical cost at December 31 2.4 2.4
Equity adjustment to investments in associated companies at January 1 -1.6 -1.9Share of results of associated companies 0.7 0.3Equity adjustment to investments in associated companies at December 31 -1.0 -1.6
Carrying value of investments in associated companies at December 31 1.4 0.8
Summary of financial information for associated companies, 2019
EUR million Domicile Assets Liabilities SalesProfit/
lossOwnership,
%
Enefit Outotec Technology Oü Estonia 6.0 3.9 1.8 0.7 40,0GreenExergy AB Sweden 0.6 0.3 1.3 0.0 49,0Sidvin Outotec Engineering Private Ltd India 1.5 0.2 1.9 1.2 25,1
Summary of financial information for associated companies, 2018
EUR million Domicile Assets Liabilities SalesProfit/
lossOwnership,
%
Enefit Outotec Technology Oü Estonia 5.0 4.1 1.1 0.0 40.0GreenExergy AB Sweden 0.7 0.4 1.1 0.0 49.0Sidvin Outotec Engineering Private Ltd India 1.5 0.9 1.4 0.5 25.1
Transactions and balances with associated companiesEUR million 2019 2018
Sales 0.2 0.1Other Income 0.1 0.1Purchases 1.7 3.1Loan receivables (due from Enefit Outotec Technology Oü) 1.5 1.5Trade and other receivables 0.4 0.6Current liabilities 0.2 0.1
Accounting estimates and judgements
Assessing the recoverable amount of a CGU requires significant judgement. While management believes that estimates of future cash flows are reasonable, many as-sumptions are subject to change because of changing economic and operational con-ditions. Key assumptions are discount rate and EBITDA multiple, in addition to future cash flows, where the most important as-
sumptions relate to gross margin levels in various products and the estimated overall gross margin level in relation to fixed costs. Actual cash flows might vary from estimated discounted future cash flows and could result in changes in the recognition of impairment losses in future periods.
56 CONSOLIDATED FINANCIAL STATEMENTS, IFRS
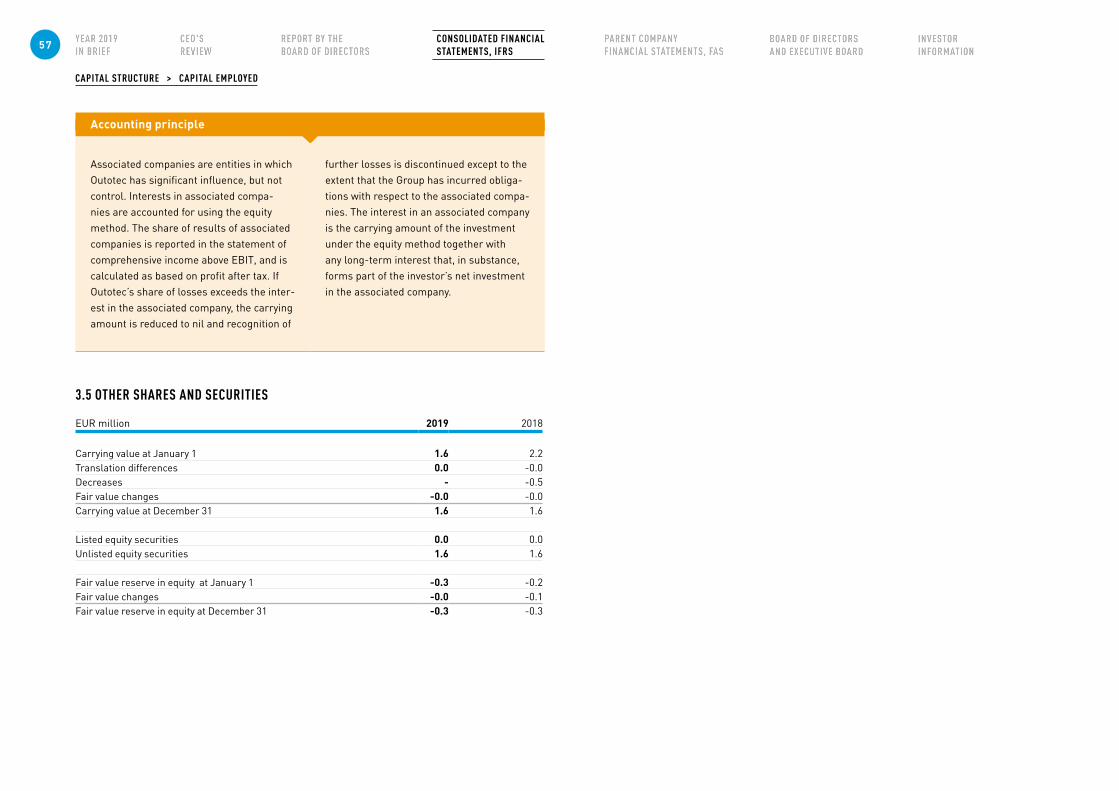
CAPITAL STRUCTURE > CAPITAL EMPLOYED
Accounting principle
Associated companies are entities in which Outotec has significant influence, but not control. Interests in associated compa-nies are accounted for using the equity method. The share of results of associated companies is reported in the statement of comprehensive income above EBIT, and is calculated as based on profit after tax. If Outotec’s share of losses exceeds the inter-est in the associated company, the carrying amount is reduced to nil and recognition of
further losses is discontinued except to the extent that the Group has incurred obliga-tions with respect to the associated compa-nies. The interest in an associated company is the carrying amount of the investment under the equity method together with any long-term interest that, in substance, forms part of the investor’s net investment in the associated company.
3.5 OTHER SHARES AND SECURITIES
EUR million 2019 2018
Carrying value at January 1 1.6 2.2Translation differences 0.0 -0.0Decreases - -0.5Fair value changes -0.0 -0.0Carrying value at December 31 1.6 1.6
Listed equity securities 0.0 0.0Unlisted equity securities 1.6 1.6
Fair value reserve in equity at January 1 -0.3 -0.2Fair value changes -0.0 -0.1Fair value reserve in equity at December 31 -0.3 -0.3
57 CONSOLIDATED FINANCIAL STATEMENTS, IFRS
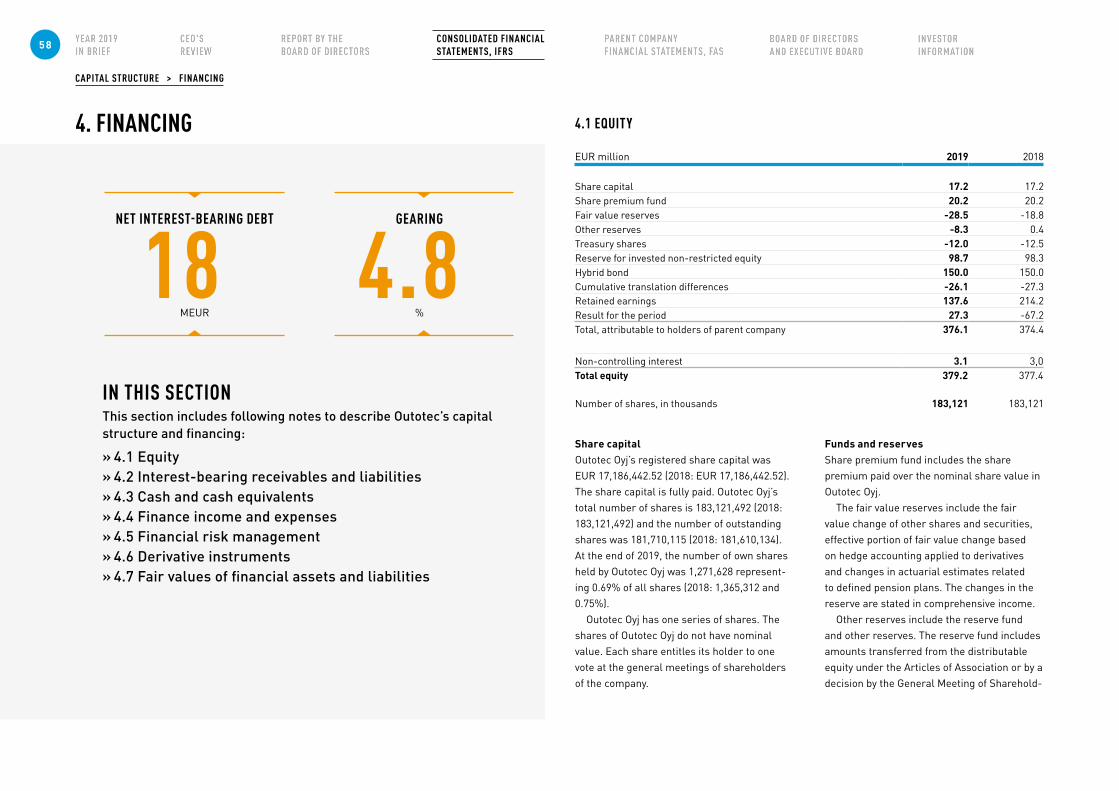
CAPITAL STRUCTURE > FINANCING
4.1 EQUITY
EUR million 2019 2018
Share capital 17.2 17.2Share premium fund 20.2 20.2Fair value reserves -28.5 -18.8Other reserves -8.3 0.4Treasury shares -12.0 -12.5Reserve for invested non-restricted equity 98.7 98.3Hybrid bond 150.0 150.0Cumulative translation differences -26.1 -27.3Retained earnings 137.6 214.2Result for the period 27.3 -67.2Total, attributable to holders of parent company 376.1 374.4
Non-controlling interest 3.1 3,0Total equity 379.2 377.4
Number of shares, in thousands 183,121 183,121
4. FINANCING
IN THIS SECTIONThis section includes following notes to describe Outotec’s capital structure and financing:
» 4.1 Equity » 4.2 Interest-bearing receivables and liabilities » 4.3 Cash and cash equivalents » 4.4 Finance income and expenses » 4.5 Financial risk management » 4.6 Derivative instruments » 4.7 Fair values of financial assets and liabilities
GEARING
4.8 %
NET INTEREST-BEARING DEBT
18 MEUR
CAPITAL STRUCTURE > FINANCING
Share capitalOutotec Oyj’s registered share capital was EUR 17,186,442.52 (2018: EUR 17,186,442.52). The share capital is fully paid. Outotec Oyj’s total number of shares is 183,121,492 (2018: 183,121,492) and the number of outstanding shares was 181,710,115 (2018: 181,610,134). At the end of 2019, the number of own shares held by Outotec Oyj was 1,271,628 represent-ing 0.69% of all shares (2018: 1,365,312 and 0.75%).
Outotec Oyj has one series of shares. The shares of Outotec Oyj do not have nominal value. Each share entitles its holder to one vote at the general meetings of shareholders of the company.
Funds and reservesShare premium fund includes the share premium paid over the nominal share value in Outotec Oyj.
The fair value reserves include the fair value change of other shares and securities, effective portion of fair value change based on hedge accounting applied to derivatives and changes in actuarial estimates related to defined pension plans. The changes in the reserve are stated in comprehensive income.
Other reserves include the reserve fund and other reserves. The reserve fund includes amounts transferred from the distributable equity under the Articles of Association or by a decision by the General Meeting of Sharehold-
58 CONSOLIDATED FINANCIAL STATEMENTS, IFRS
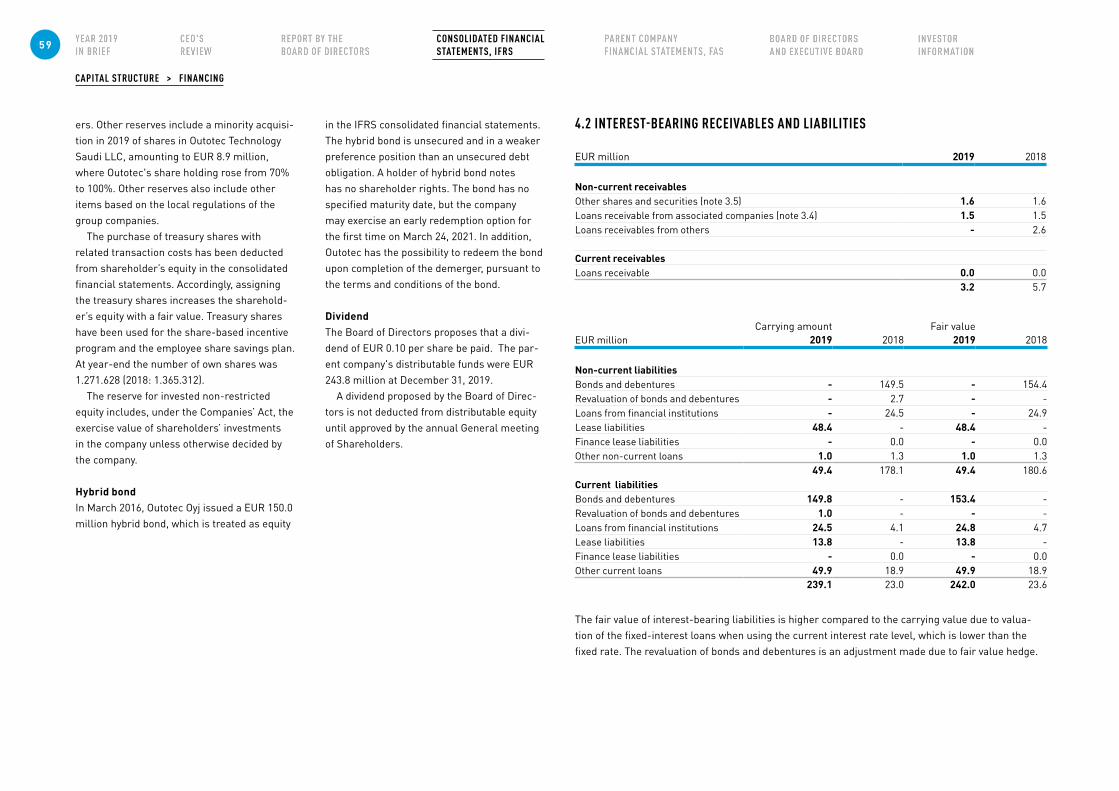
CAPITAL STRUCTURE > FINANCING
4.2 INTEREST-BEARING RECEIVABLES AND LIABILITIES
EUR million 2019 2018
Non-current receivablesOther shares and securities (note 3.5) 1.6 1.6Loans receivable from associated companies (note 3.4) 1.5 1.5Loans receivables from others - 2.6
Current receivablesLoans receivable 0.0 0.0
3.2 5.7
Carrying amount Fair valueEUR million 2019 2018 2019 2018
Non-current liabilitiesBonds and debentures - 149.5 - 154.4Revaluation of bonds and debentures - 2.7 - -Loans from financial institutions - 24.5 - 24.9Lease liabilities 48.4 - 48.4 -Finance lease liabilities - 0.0 - 0.0Other non-current loans 1.0 1.3 1.0 1.3
49.4 178.1 49.4 180.6Current liabilitiesBonds and debentures 149.8 - 153.4 -Revaluation of bonds and debentures 1.0 - - -Loans from financial institutions 24.5 4.1 24.8 4.7Lease liabilities 13.8 - 13.8 -Finance lease liabilities - 0.0 - 0.0Other current loans 49.9 18.9 49.9 18.9
239.1 23.0 242.0 23.6
The fair value of interest-bearing liabilities is higher compared to the carrying value due to valua-tion of the fixed-interest loans when using the current interest rate level, which is lower than the fixed rate. The revaluation of bonds and debentures is an adjustment made due to fair value hedge.
ers. Other reserves include a minority acquisi-tion in 2019 of shares in Outotec Technology Saudi LLC, amounting to EUR 8.9 million, where Outotec's share holding rose from 70% to 100%. Other reserves also include other items based on the local regulations of the group companies.
The purchase of treasury shares with related transaction costs has been deducted from shareholder’s equity in the consolidated financial statements. Accordingly, assigning the treasury shares increases the sharehold-er’s equity with a fair value. Treasury shares have been used for the share-based incentive program and the employee share savings plan. At year-end the number of own shares was 1.271.628 (2018: 1.365.312).
The reserve for invested non-restricted equity includes, under the Companies’ Act, the exercise value of shareholders’ investments in the company unless otherwise decided by the company.
Hybrid bondIn March 2016, Outotec Oyj issued a EUR 150.0 million hybrid bond, which is treated as equity
in the IFRS consolidated financial statements. The hybrid bond is unsecured and in a weaker preference position than an unsecured debt obligation. A holder of hybrid bond notes has no shareholder rights. The bond has no specified maturity date, but the company may exercise an early redemption option for the first time on March 24, 2021. In addition, Outotec has the possibility to redeem the bond upon completion of the demerger, pursuant to the terms and conditions of the bond.
DividendThe Board of Directors proposes that a divi-dend of EUR 0.10 per share be paid. The par-ent company's distributable funds were EUR 243.8 million at December 31, 2019.
A dividend proposed by the Board of Direc-tors is not deducted from distributable equity until approved by the annual General meeting of Shareholders.
59 CONSOLIDATED FINANCIAL STATEMENTS, IFRS
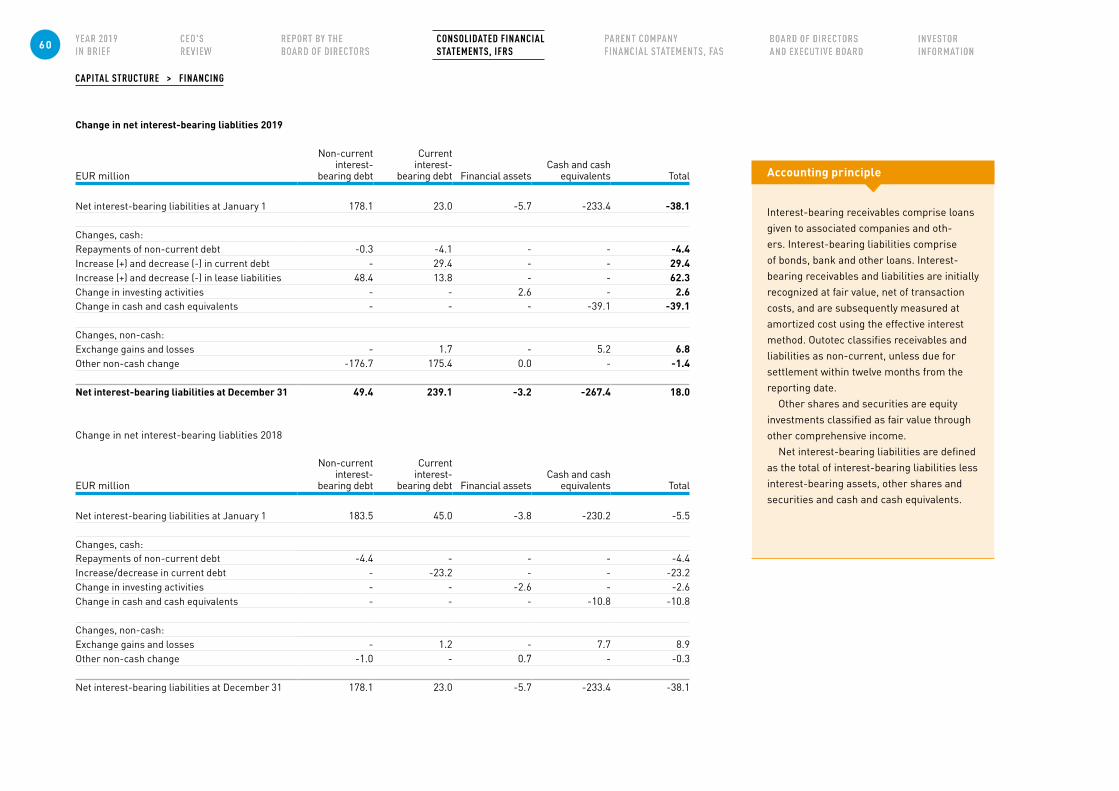
CAPITAL STRUCTURE > FINANCING
Change in net interest-bearing liablities 2019
EUR million
Non-current interest-
bearing debt
Current interest-
bearing debt Financial assetsCash and cash
equivalents Total
Net interest-bearing liabilities at January 1 178.1 23.0 -5.7 -233.4 -38.1
Changes, cash:Repayments of non-current debt -0.3 -4.1 - - -4.4Increase (+) and decrease (-) in current debt - 29.4 - - 29.4Increase (+) and decrease (-) in lease liabilities 48.4 13.8 - - 62.3Change in investing activities - - 2.6 - 2.6Change in cash and cash equivalents - - - -39.1 -39.1
Changes, non-cash:Exchange gains and losses - 1.7 - 5.2 6.8Other non-cash change -176.7 175.4 0.0 - -1.4
Net interest-bearing liabilities at December 31 49.4 239.1 -3.2 -267.4 18.0
Change in net interest-bearing liablities 2018
EUR million
Non-current interest-
bearing debt
Current interest-
bearing debt Financial assetsCash and cash
equivalents Total
Net interest-bearing liabilities at January 1 183.5 45.0 -3.8 -230.2 -5.5
Changes, cash:Repayments of non-current debt -4.4 - - - -4.4Increase/decrease in current debt - -23.2 - - -23.2Change in investing activities - - -2.6 - -2.6Change in cash and cash equivalents - - - -10.8 -10.8
Changes, non-cash:Exchange gains and losses - 1.2 - 7.7 8.9Other non-cash change -1.0 - 0.7 - -0.3
Net interest-bearing liabilities at December 31 178.1 23.0 -5.7 -233.4 -38.1
Accounting principle
Interest-bearing receivables comprise loans given to associated companies and oth-ers. Interest-bearing liabilities comprise of bonds, bank and other loans. Interest-bearing receivables and liabilities are initially recognized at fair value, net of transaction costs, and are subsequently measured at amortized cost using the effective interest method. Outotec classifies receivables and liabilities as non-current, unless due for settlement within twelve months from the reporting date.
Other shares and securities are equity investments classified as fair value through other comprehensive income.
Net interest-bearing liabilities are defined as the total of interest-bearing liabilities less interest-bearing assets, other shares and securities and cash and cash equivalents.
60 CONSOLIDATED FINANCIAL STATEMENTS, IFRS
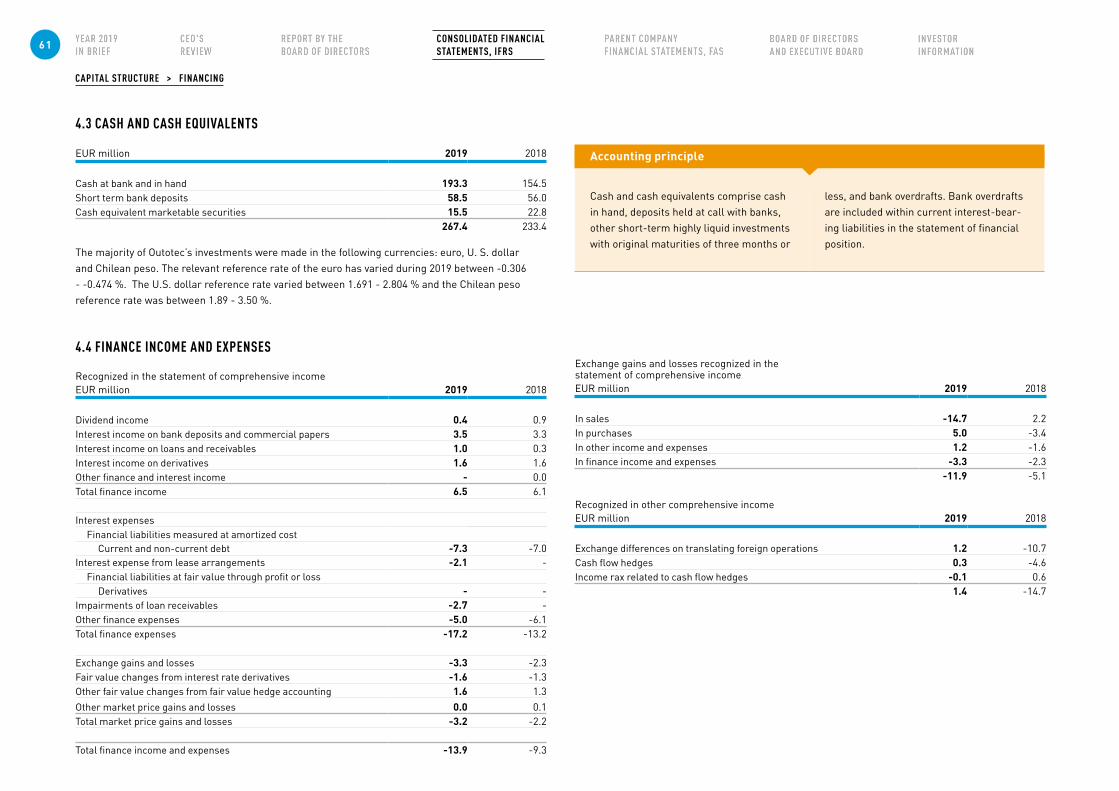
CAPITAL STRUCTURE > FINANCING
4.3 CASH AND CASH EQUIVALENTS
EUR million 2019 2018
Cash at bank and in hand 193.3 154.5Short term bank deposits 58.5 56.0Cash equivalent marketable securities 15.5 22.8
267.4 233.4
The majority of Outotec’s investments were made in the following currencies: euro, U. S. dollar and Chilean peso. The relevant reference rate of the euro has varied during 2019 between -0.306 - -0.474 %. The U.S. dollar reference rate varied between 1.691 - 2.804 % and the Chilean peso reference rate was between 1.89 - 3.50 %.
4.4 FINANCE INCOME AND EXPENSES
Recognized in the statement of comprehensive incomeEUR million 2019 2018
Dividend income 0.4 0.9Interest income on bank deposits and commercial papers 3.5 3.3Interest income on loans and receivables 1.0 0.3Interest income on derivatives 1.6 1.6Other finance and interest income - 0.0Total finance income 6.5 6.1
Interest expensesFinancial liabilities measured at amortized cost
Current and non-current debt -7.3 -7.0Interest expense from lease arrangements -2.1 -
Financial liabilities at fair value through profit or lossDerivatives - -
Impairments of loan receivables -2.7 -Other finance expenses -5.0 -6.1Total finance expenses -17.2 -13.2
Exchange gains and losses -3.3 -2.3Fair value changes from interest rate derivatives -1.6 -1.3Other fair value changes from fair value hedge accounting 1.6 1.3Other market price gains and losses 0.0 0.1Total market price gains and losses -3.2 -2.2
Total finance income and expenses -13.9 -9.3
Exchange gains and losses recognized in the statement of comprehensive incomeEUR million 2019 2018
In sales -14.7 2.2In purchases 5.0 -3.4In other income and expenses 1.2 -1.6In finance income and expenses -3.3 -2.3
-11.9 -5.1
Recognized in other comprehensive incomeEUR million 2019 2018
Exchange differences on translating foreign operations 1.2 -10.7Cash flow hedges 0.3 -4.6Income rax related to cash flow hedges -0.1 0.6
1.4 -14.7
Accounting principle
Cash and cash equivalents comprise cash in hand, deposits held at call with banks, other short-term highly liquid investments with original maturities of three months or
less, and bank overdrafts. Bank overdrafts are included within current interest-bear-ing liabilities in the statement of financial position.
61 CONSOLIDATED FINANCIAL STATEMENTS, IFRS
CAPITAL STRUCTURE > FINANCING
4.5 FINANCIAL RISK MANAGEMENT
Financial Risk Management and InsurancesAccording to Outotec’s Financial Risk Manage-ment policy the CEO and the Executive Board monitor implementation of risk management procedures in coordination with the Board of Directors. The CFO is responsible for imple-mentation and development of financial risk management.
The Board’s Audit and Risk Committee oversees how the management monitors compliance with the Group’s risk manage-ment policies and procedures, and reviews the adequacy of the risk management framework in relation to the risks faced by the Group. The Audit and Risk Committee is assisted by Inter-nal Audit, which undertakes both regular and ad hoc reviews of risk management controls and procedures.
Outotec has a centralized Group Treas-ury with two main objectives: 1) to arrange adequate funding for the Group’s underlying operations on competitive terms and 2) to identify and evaluate the financial risks within the Group and implement the hedges for the Group companies.
Financial risks consist of market, credit and liquidity risks. Market risks are caused by changes in foreign exchange and interest rates, as well as commodity or other prices. Especially changes in foreign exchange rates may have a significant impact on Group’s earnings, cash flows and balance sheet. As the main principle Outotec’s business units hedge their market risks by entering into agreements with Group Treasury, which does most of the financial contracts with banks and
other financial institutions. Outotec’s Treasury is also responsible for managing certain Group level risks, such as interest rate risk and for-eign currency transaction risk in accordance with the Financial Risk Management policy.
In addition, the Group is sensitive to the fluctuations of raw material, external suppli-ers and subcontractors. The price fluctuation is prevented and the availability of raw mate-rial ascertained by long-term contracts, timing of the acquisitions, and fixed contract prices.
Foreign exchange riskThe overall objective of foreign exchange risk management is to limit the short-term nega-tive impact on earnings and cash flow from ex-change rate fluctuations, therefore increasing the predictability of the financial results.
Foreign exchange risk is the principal market risk within Outotec and as such has a significant potential impact on the income statement and balance sheet.
The currencies related to sales and costs can vary materially. A major part of Outotec’s sales is, and a significant part of costs arises in euros, US dollars, Australian dollars, Chilean peso and South African rand.Outotec’s policy is to hedge in full the transaction risk. Cash flow risk related to firm commitments is hedged almost completely, within subsidiary specific limits defined in the Financial Risk Management policy, whereas forecasted and probable cash flows are hedged only selective-ly with financial instruments based on sepa-rate decisions. A major part of cash flow risk hedging takes place operatively by matching sales and cost currencies, and the remaining open net positions are normally hedged with
derivative contracts (typically forward agree-ments). Hedging currency pairs with large difference in interest rates may increase hedg-ing costs. Subsidiary level foreign exchange exposures are monitored and consolidated on a monthly basis. In this description of financial risk management, the term hedging has been used in its broadest sense, and therefore it also includes usage of non-hedge-accounted derivatives.
Hedge accounting in accordance with IFRS is applied to most of the hedges in these exposures. As the underlying cash flows can have long maturities, the related hedges can be done with shorter maturities and they can be rolled over when needed, so that at the maturity the total currency rate related gains/losses from these hedges are expected to fully offset the related gains/losses from the underlying cash flows.
As only high credit quality counterpar-ties are utilized, counterparty credit risk is expected to have minimal effect on hedge valuations.
Outotec does not typically hedge its equity translation risk.
See the tables “Transaction risk” and ”Sensitivity of financial instruments on foreign exchange rates”.
Interest rate riskInterest rate risk is the risk of repricing and price caused by the changes in market inter-est rates. To control interest rate risks in the loan portfolio the Group has agreed both fixed and floating rate instruments. On December 31, 2019 the share of fixed rate loans of all interest-bearing debt was 100 percent.
A significant part of the financial invest-ments has a short-term interest rate as a reference rate. The majority of cash and cash equivalent funds are invested in bank ac-counts, bank deposits and short-term money market instruments. The advance payments received from projects in emerging markets and the related financial investments occa-sionally cause interest rate risks. The largest interest rate exposures are in euros, United States dollars and Chilean pesos.
The Group is designating derivatives (interest rate swaps) as hedging instruments under a fair value hedge accounting model and account for fixed rate financial liabilities at fair value through profit or loss. Therefore, a change in interest rates at the reporting date would affect profit or loss for fixed rate instruments. On December 31, 2019 the total nominal value of interest rate swaps was EUR 75.0 million (December 31, 2018: EUR 75.0 million).
For variable rate interest-bearing financial investments, a shift of one percentage point would have increased (decreased) profit or loss by EUR 0.7 million for December 31, 2019 (December 31, 2018: EUR 0.8 million) and for interest bearing-debt when including effect of interest rate swaps by EUR 0.8 million for December 31, 2019 (December 31, 2018: EUR 0.8 million).
Securities price riskOutotec does not have any material amounts of other listed equity securities classified as fair value through other comprehensive income.
62 CONSOLIDATED FINANCIAL STATEMENTS, IFRS
CAPITAL STRUCTURE > FINANCING
Credit risksCredit risk arises from the potential failure of a counterparty to meet its contractual pay-ment obligations. In addition, counterparty risk arises in conjunction with financial invest-ments and hedging instruments. The objective of credit and counterparty risk management is to minimize in a cost-efficient manner the losses incurred as a result of counterparty not fulfilling its obligations.
Outotec’s trade receivables and other potential sources of sales contract related credit risk are generated by a large number of customers worldwide, but occasionally risk concentrations may develop due to large individual contracts. Outotec’s operational and financial risk management policies have been created to manage the various project related risks and address them in a concised manner. The policies and related procedures require identification of counterparty risks in a project together with the evaluation of the available and cost-efficient mitigation of risks with contractual terms and/or various financial instruments. The credit risks related to busi-ness operations can be mitigated for example by the use of advance payments and other payment terms under sales contracts, project specific credit insurance plans and letters of credit. The trade receivable exposures are re-viewed regularly in Outotec’s project level and other operative reporting. During 2019, the reporting of overdue external trade receiva-bles, their rotation periods and collection were further intensified. More detailed analysis of trade receivables is included in note 2.2.
Outotec’s Treasury manages a substantial part of the credit risk related to the Group’s
financial investments. Outotec seeks to reduce these risks by limiting the counterparties to banks, other financial institutions and other counterparties, which have a good credit standing. Investments related to liquidity man-agement are made in liquid money market instruments with, as far as possible, low credit risk and within pre-agreed credit limits and maturities. The limits are reviewed regularly. Part of Outotec’s project advance payments can be invested in local money markets in emerging countries.
InsurancesOutotec Oyj acquires Group wide insurances on a case by case basis covering all or part of the Group companies’ insurance needs. Furthermore, Outotec companies acquire local insurances on a case by case basis in separately defined areas and specific delivery contracts. The most important insurance lines relate to liability. On the other hand, decisions to insure credit risks in projects are usually made on a project by project basis.
General liability is the most important line of insurance and a major part of insurance premiums paid relate to these types of risks. For production units, Outotec has adequate property damage and business interruption insurance cover.
Liquidity riskOutotec ensures required liquidity through a combination of cash management, liquid investment portfolios, and committed and uncommitted facilities. The object is to reduce liquidity and refinancing risks by means of the availability of an adequate number of credit
lines, which have a balanced maturity profile. Efficient cash and liquidity management also reduces liquidity risk.
Outotec’s Treasury centrally raises most of the Group’s interest-bearing debt. Outo-tec’s subsidiaries have had some local credit lines of their own, which mostly have been counter-guaranteed by Outotec Oyj. The share of long-term loans was 0.6 % of the total interest-bearing loan portfolio.
With regard to interest bearing debt, the Group offers the following committed lines of credit: • EUR 100 million multicurrency revolving
credit facility that is unsecured. The final maturity is latest on August 31, 2020.
• EUR 60 million revolving credit facility that is unsecured. The final maturity is latest on August 31, 2020.
• EUR 50 million revolving credit facility that is unsecured. The final maturity is on April 30, 2021.
• EUR 120 million Forward Start Term Facility that is unsecured. The final maturity is latest on April 30, 2021.As of December 31, 2019, the above credit
lines were fully unutilized.Additionally, Outotec has several bilateral
uncommitted commercial bank guarantee lim-its the total aggregate nominal value of which exceeds EUR 700 million.
See the tables “Contractual cash flows of liabilities” and “Cash and cash equivalents and committed unutilized credit facilities”.
Capital management Outotec’s gearing ratio was 4.8% on December 31, 2019 (-10.1% on December 31, 2018). The
Board’s target is to maintain a strong capital base in order to maintain investor, creditor and market confidence and to sustain future development of the business and the capability to pay dividends. The capital structure of the Group is reviewed by the Board of Directors on a regular basis and the Board set the following ong-term target in 2014:
• Gearing at maximum 50%
The Board of Directors of Outotec has a mandate to purchase its own shares on the market.
Certain externally imposed capital require-ments exist. Outotec’s main credit facilities from financial institutions include financial covenants related to adjusted equity ratio and liquidity. The Group has operated in compli-ance with the covenants during 2006–2019.
As part of Group’s capital management operations Outotec Oyj, on March 24, 2016, issued a EUR 150 million five-year hybrid bond with a fixed coupon rate of 7.375 per cent per annum. The hybrid bond is treated as equity in the IFRS consolidated financial statements. Outotec can postpone interest payment if it does not distribute dividends or other equity to its shareholders. The bond has no maturity date, but the company has the right to redeem it five years after the issue date. In addition, Outotec has the possibility to redeem the bond upon completion of the Demerger, pursuant to the terms and conditions of the bond. The hybrid bond is unsecured and in a weaker preference position than unsecured debt obligation. A holder of hybrid bond notes has no shareholder rights.
63 CONSOLIDATED FINANCIAL STATEMENTS, IFRS
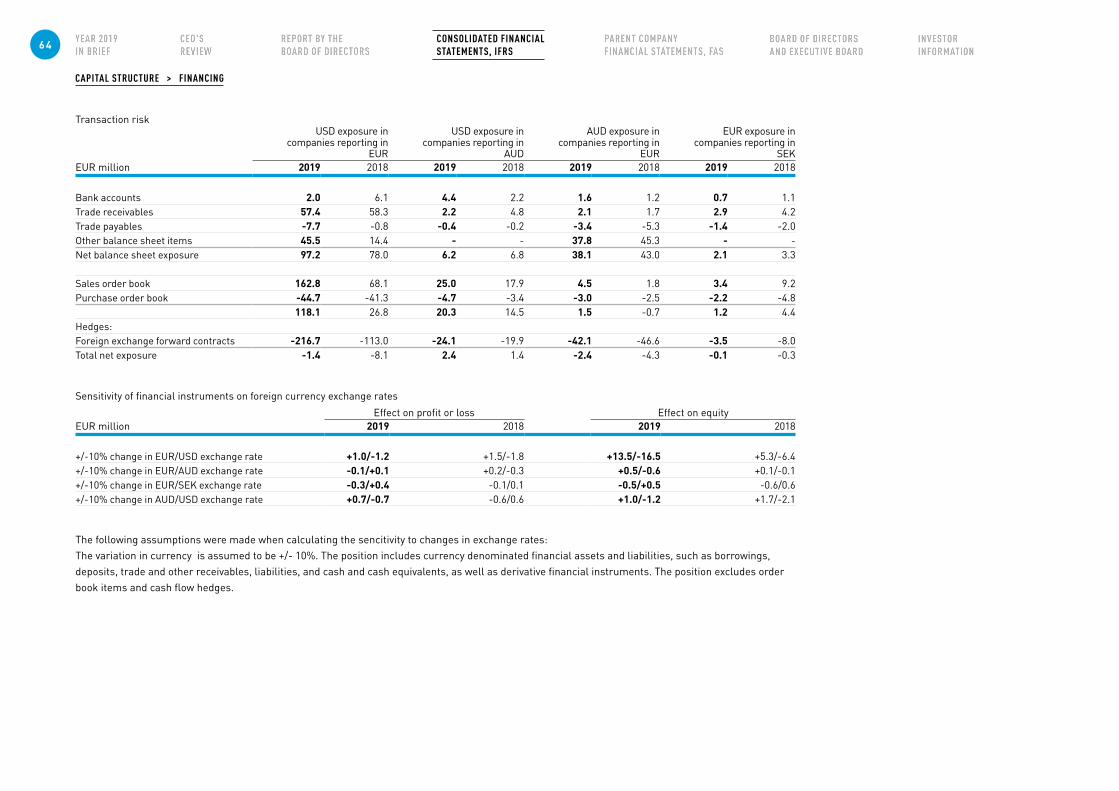
CAPITAL STRUCTURE > FINANCING
Transaction riskUSD exposure in
companies reporting in EUR
USD exposure in companies reporting in
AUD
AUD exposure in companies reporting in
EUR
EUR exposure in companies reporting in
SEKEUR million 2019 2018 2019 2018 2019 2018 2019 2018
Bank accounts 2.0 6.1 4.4 2.2 1.6 1.2 0.7 1.1Trade receivables 57.4 58.3 2.2 4.8 2.1 1.7 2.9 4.2Trade payables -7.7 -0.8 -0.4 -0.2 -3.4 -5.3 -1.4 -2.0Other balance sheet items 45.5 14.4 - - 37.8 45.3 - -Net balance sheet exposure 97.2 78.0 6.2 6.8 38.1 43.0 2.1 3.3
Sales order book 162.8 68.1 25.0 17.9 4.5 1.8 3.4 9.2Purchase order book -44.7 -41.3 -4.7 -3.4 -3.0 -2.5 -2.2 -4.8
118.1 26.8 20.3 14.5 1.5 -0.7 1.2 4.4Hedges:Foreign exchange forward contracts -216.7 -113.0 -24.1 -19.9 -42.1 -46.6 -3.5 -8.0Total net exposure -1.4 -8.1 2.4 1.4 -2.4 -4.3 -0.1 -0.3
Sensitivity of financial instruments on foreign currency exchange rates
Effect on profit or loss Effect on equityEUR million 2019 2018 2019 2018
+/-10% change in EUR/USD exchange rate +1.0/-1.2 +1.5/-1.8 +13.5/-16.5 +5.3/-6.4+/-10% change in EUR/AUD exchange rate -0.1/+0.1 +0.2/-0.3 +0.5/-0.6 +0.1/-0.1+/-10% change in EUR/SEK exchange rate -0.3/+0.4 -0.1/0.1 -0.5/+0.5 -0.6/0.6+/-10% change in AUD/USD exchange rate +0.7/-0.7 -0.6/0.6 +1.0/-1.2 +1.7/-2.1
The following assumptions were made when calculating the sencitivity to changes in exchange rates:The variation in currency is assumed to be +/- 10%. The position includes currency denominated financial assets and liabilities, such as borrowings, deposits, trade and other receivables, liabilities, and cash and cash equivalents, as well as derivative financial instruments. The position excludes order book items and cash flow hedges.
64 CONSOLIDATED FINANCIAL STATEMENTS, IFRS
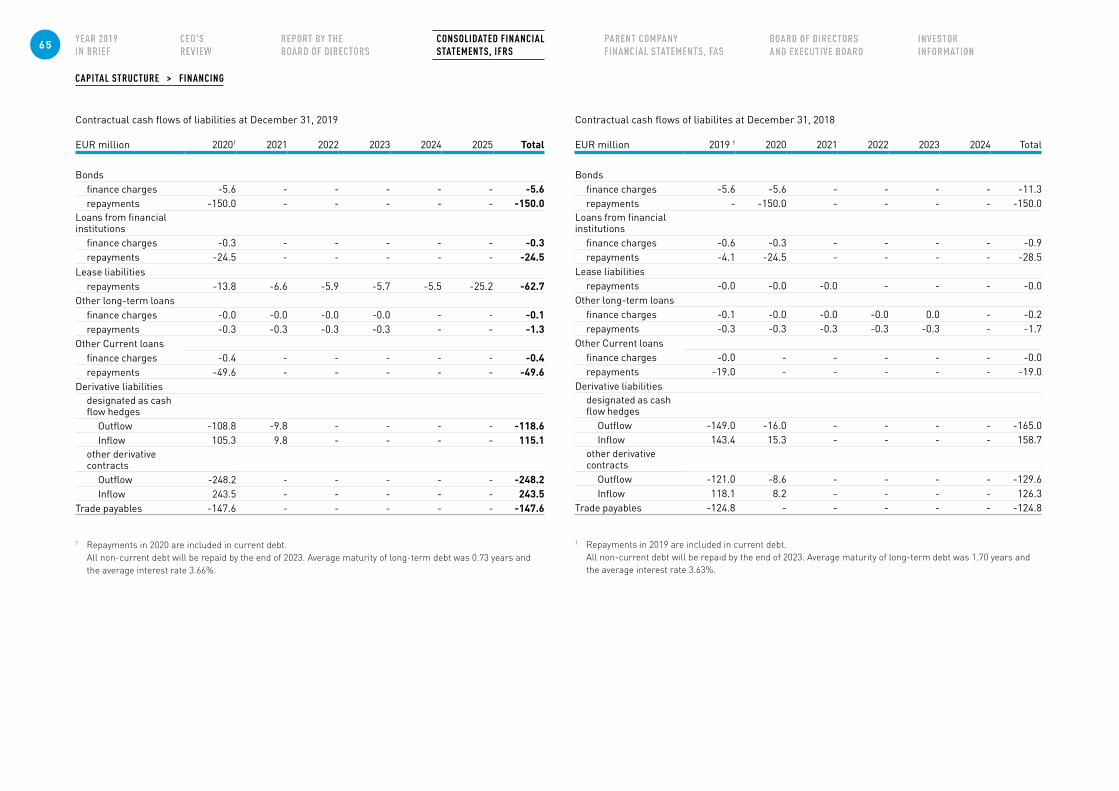
CAPITAL STRUCTURE > FINANCING
Contractual cash flows of liabilities at December 31, 2019
EUR million 20201 2021 2022 2023 2024 2025 Total
Bondsfinance charges -5.6 - - - - - -5.6repayments -150.0 - - - - - -150.0
Loans from financial institutions
finance charges -0.3 - - - - - -0.3repayments -24.5 - - - - - -24.5
Lease liabilitiesrepayments -13.8 -6.6 -5.9 -5.7 -5.5 -25.2 -62.7
Other long-term loansfinance charges -0.0 -0.0 -0.0 -0.0 - - -0.1repayments -0.3 -0.3 -0.3 -0.3 - - -1.3
Other Current loansfinance charges -0.4 - - - - - -0.4repayments -49.6 - - - - - -49.6
Derivative liabilitiesdesignated as cash flow hedges
Outflow -108.8 -9.8 - - - - -118.6Inflow 105.3 9.8 - - - - 115.1
other derivative contracts
Outflow -248.2 - - - - - -248.2Inflow 243.5 - - - - - 243.5
Trade payables -147.6 - - - - - -147.6
1 Repayments in 2020 are included in current debt. All non-current debt will be repaid by the end of 2023. Average maturity of long-term debt was 0.73 years and the average interest rate 3.66%.
Contractual cash flows of liabilites at December 31, 2018
EUR million 2019 1 2020 2021 2022 2023 2024 Total
Bondsfinance charges -5.6 -5.6 - - - - -11.3repayments - -150.0 - - - - -150.0
Loans from financial institutions
finance charges -0.6 -0.3 - - - - -0.9repayments -4.1 -24.5 - - - - -28.5
Lease liabilitiesrepayments -0.0 -0.0 -0.0 - - - -0.0
Other long-term loansfinance charges -0.1 -0.0 -0.0 -0.0 0.0 - -0.2repayments -0.3 -0.3 -0.3 -0.3 -0.3 - -1.7
Other Current loansfinance charges -0.0 - - - - - -0.0repayments -19.0 - - - - - -19.0
Derivative liabilitiesdesignated as cash flow hedges
Outflow -149.0 -16.0 - - - - -165.0Inflow 143.4 15.3 - - - - 158.7
other derivative contracts
Outflow -121.0 -8.6 - - - - -129.6Inflow 118.1 8.2 - - - - 126.3
Trade payables -124.8 - - - - - -124.8
1 Repayments in 2019 are included in current debt. All non-current debt will be repaid by the end of 2023. Average maturity of long-term debt was 1.70 years and the average interest rate 3.63%.
65 CONSOLIDATED FINANCIAL STATEMENTS, IFRS
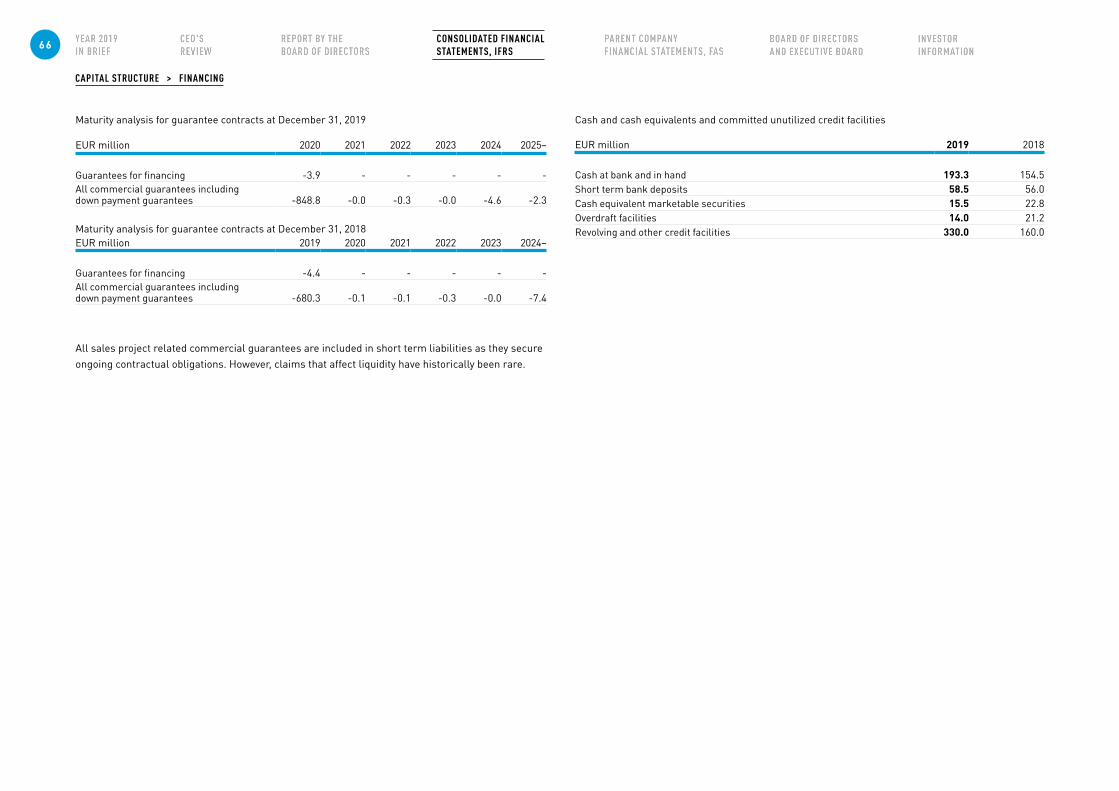
CAPITAL STRUCTURE > FINANCING
Maturity analysis for guarantee contracts at December 31, 2019
EUR million 2020 2021 2022 2023 2024 2025–
Guarantees for financing -3.9 - - - - -All commercial guarantees including down payment guarantees -848.8 -0.0 -0.3 -0.0 -4.6 -2.3
Maturity analysis for guarantee contracts at December 31, 2018EUR million 2019 2020 2021 2022 2023 2024–
Guarantees for financing -4.4 - - - - -All commercial guarantees including down payment guarantees -680.3 -0.1 -0.1 -0.3 -0.0 -7.4
Cash and cash equivalents and committed unutilized credit facilities
EUR million 2019 2018
Cash at bank and in hand 193.3 154.5Short term bank deposits 58.5 56.0Cash equivalent marketable securities 15.5 22.8Overdraft facilities 14.0 21.2Revolving and other credit facilities 330.0 160.0
All sales project related commercial guarantees are included in short term liabilities as they secure ongoing contractual obligations. However, claims that affect liquidity have historically been rare.
66 CONSOLIDATED FINANCIAL STATEMENTS, IFRS
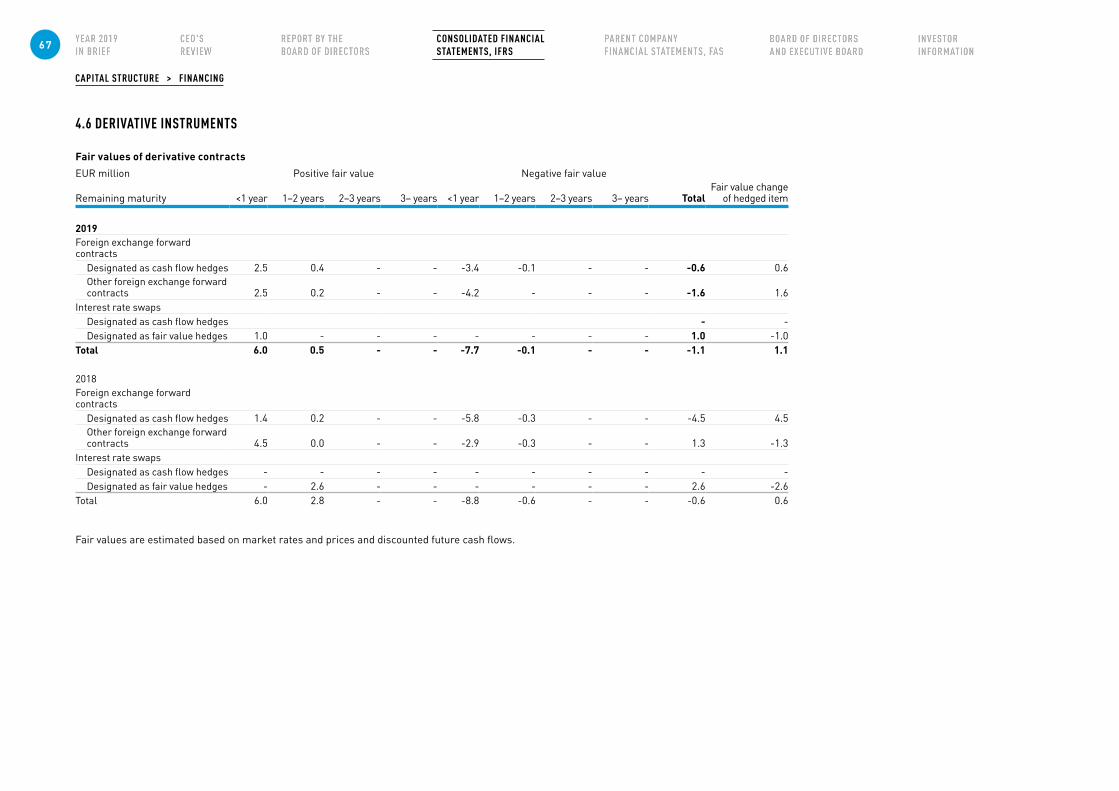
CAPITAL STRUCTURE > FINANCING
4.6 DERIVATIVE INSTRUMENTS
Fair values of derivative contractsEUR million Positive fair value Negative fair value
Remaining maturity <1 year 1–2 years 2–3 years 3– years <1 year 1–2 years 2–3 years 3– years TotalFair value change
of hedged item
2019Foreign exchange forward contracts
Designated as cash flow hedges 2.5 0.4 - - -3.4 -0.1 - - -0.6 0.6Other foreign exchange forward contracts 2.5 0.2 - - -4.2 - - - -1.6 1.6
Interest rate swapsDesignated as cash flow hedges - -Designated as fair value hedges 1.0 - - - - - - - 1.0 -1.0
Total 6.0 0.5 - - -7.7 -0.1 - - -1.1 1.1
2018Foreign exchange forward contracts
Designated as cash flow hedges 1.4 0.2 - - -5.8 -0.3 - - -4.5 4.5Other foreign exchange forward contracts 4.5 0.0 - - -2.9 -0.3 - - 1.3 -1.3
Interest rate swapsDesignated as cash flow hedges - - - - - - - - - -Designated as fair value hedges - 2.6 - - - - - - 2.6 -2.6
Total 6.0 2.8 - - -8.8 -0.6 - - -0.6 0.6
Fair values are estimated based on market rates and prices and discounted future cash flows.
67 CONSOLIDATED FINANCIAL STATEMENTS, IFRS
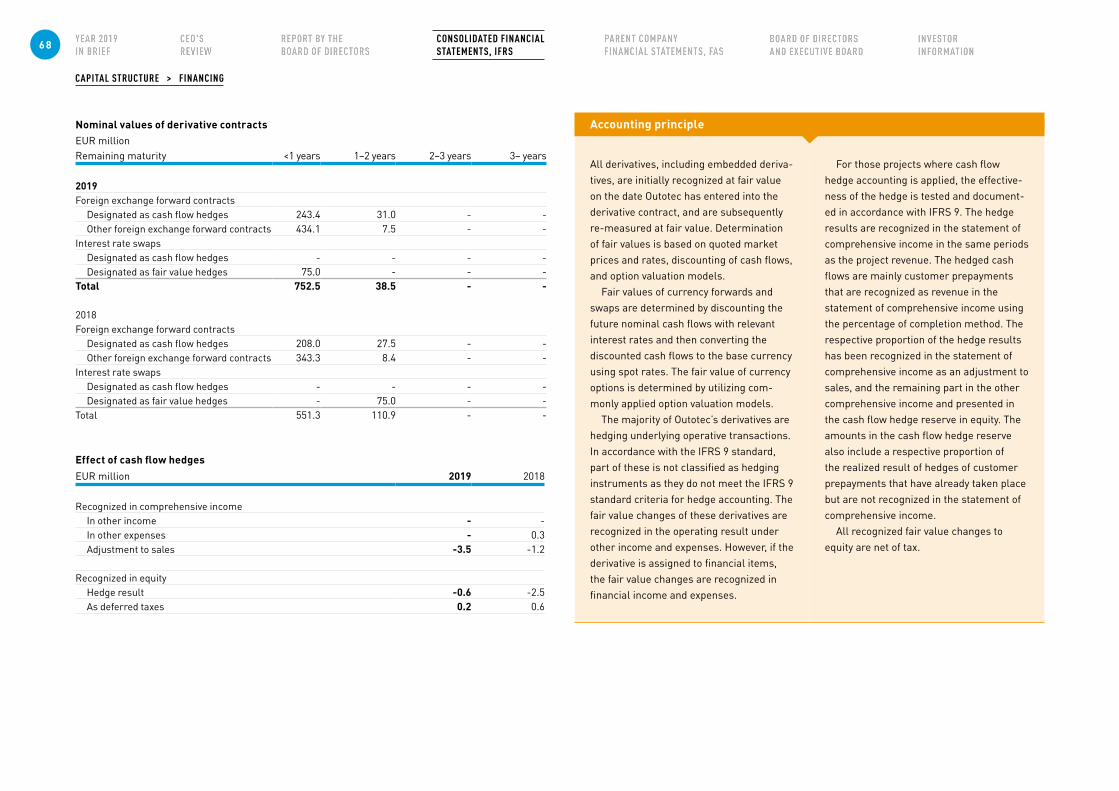
CAPITAL STRUCTURE > FINANCING
Nominal values of derivative contractsEUR millionRemaining maturity <1 years 1–2 years 2–3 years 3– years
2019Foreign exchange forward contracts
Designated as cash flow hedges 243.4 31.0 - -Other foreign exchange forward contracts 434.1 7.5 - -
Interest rate swapsDesignated as cash flow hedges - - - -Designated as fair value hedges 75.0 - - -
Total 752.5 38.5 - -
2018Foreign exchange forward contracts
Designated as cash flow hedges 208.0 27.5 - -Other foreign exchange forward contracts 343.3 8.4 - -
Interest rate swapsDesignated as cash flow hedges - - - -Designated as fair value hedges - 75.0 - -
Total 551.3 110.9 - -
Effect of cash flow hedgesEUR million 2019 2018
Recognized in comprehensive incomeIn other income - -In other expenses - 0.3Adjustment to sales -3.5 -1.2
Recognized in equityHedge result -0.6 -2.5As deferred taxes 0.2 0.6
Accounting principle
All derivatives, including embedded deriva-tives, are initially recognized at fair value on the date Outotec has entered into the derivative contract, and are subsequently re-measured at fair value. Determination of fair values is based on quoted market prices and rates, discounting of cash flows, and option valuation models.
Fair values of currency forwards and swaps are determined by discounting the future nominal cash flows with relevant interest rates and then converting the discounted cash flows to the base currency using spot rates. The fair value of currency options is determined by utilizing com-monly applied option valuation models.
The majority of Outotec’s derivatives are hedging underlying operative transactions. In accordance with the IFRS 9 standard, part of these is not classified as hedging instruments as they do not meet the IFRS 9 standard criteria for hedge accounting. The fair value changes of these derivatives are recognized in the operating result under other income and expenses. However, if the derivative is assigned to financial items, the fair value changes are recognized in financial income and expenses.
For those projects where cash flow hedge accounting is applied, the effective-ness of the hedge is tested and document-ed in accordance with IFRS 9. The hedge results are recognized in the statement of comprehensive income in the same periods as the project revenue. The hedged cash flows are mainly customer prepayments that are recognized as revenue in the statement of comprehensive income using the percentage of completion method. The respective proportion of the hedge results has been recognized in the statement of comprehensive income as an adjustment to sales, and the remaining part in the other comprehensive income and presented in the cash flow hedge reserve in equity. The amounts in the cash flow hedge reserve also include a respective proportion of the realized result of hedges of customer prepayments that have already taken place but are not recognized in the statement of comprehensive income.
All recognized fair value changes to equity are net of tax.
68 CONSOLIDATED FINANCIAL STATEMENTS, IFRS
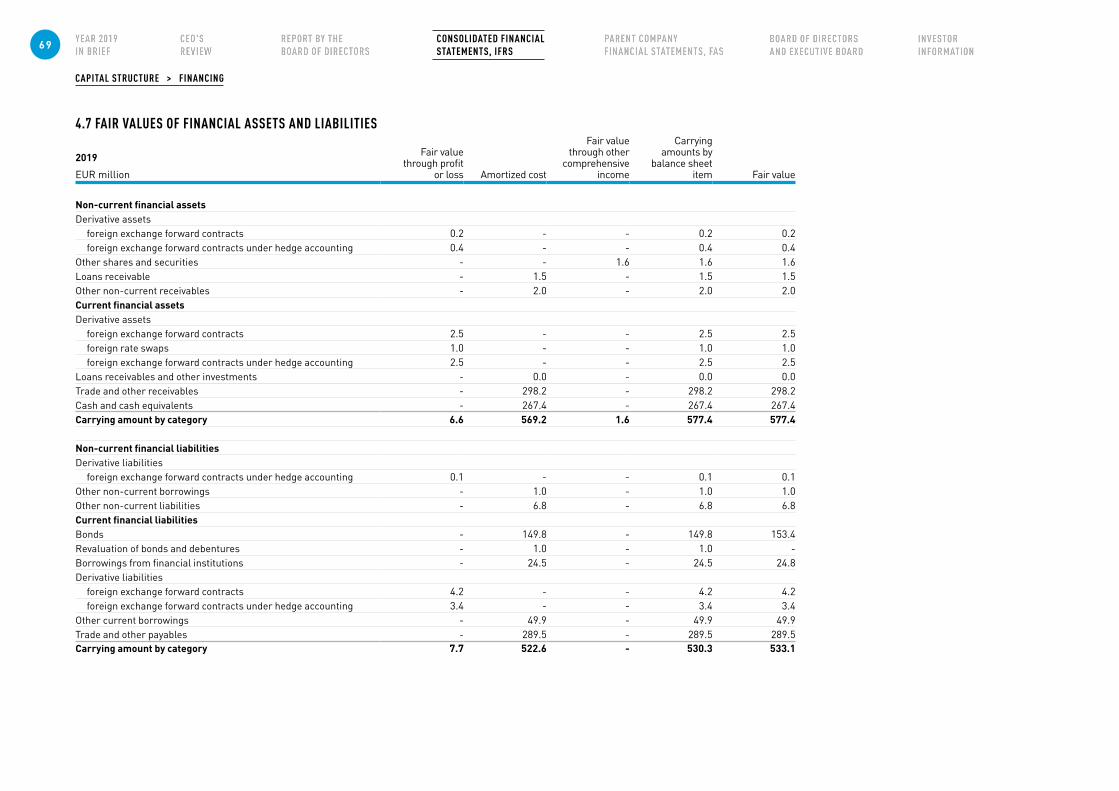
CAPITAL STRUCTURE > FINANCING
4.7 FAIR VALUES OF FINANCIAL ASSETS AND LIABILITIES
2019
EUR million
Fair value through profit
or loss Amortized cost
Fair value through other
comprehensive income
Carrying amounts by
balance sheet item Fair value
Non-current financial assetsDerivative assets
foreign exchange forward contracts 0.2 - - 0.2 0.2foreign exchange forward contracts under hedge accounting 0.4 - - 0.4 0.4
Other shares and securities - - 1.6 1.6 1.6Loans receivable - 1.5 - 1.5 1.5Other non-current receivables - 2.0 - 2.0 2.0Current financial assetsDerivative assets
foreign exchange forward contracts 2.5 - - 2.5 2.5foreign rate swaps 1.0 - - 1.0 1.0foreign exchange forward contracts under hedge accounting 2.5 - - 2.5 2.5
Loans receivables and other investments - 0.0 - 0.0 0.0Trade and other receivables - 298.2 - 298.2 298.2Cash and cash equivalents - 267.4 - 267.4 267.4Carrying amount by category 6.6 569.2 1.6 577.4 577.4
Non-current financial liabilitiesDerivative liabilities
foreign exchange forward contracts under hedge accounting 0.1 - - 0.1 0.1Other non-current borrowings - 1.0 - 1.0 1.0Other non-current liabilities - 6.8 - 6.8 6.8Current financial liabilitiesBonds - 149.8 - 149.8 153.4Revaluation of bonds and debentures - 1.0 - 1.0 -Borrowings from financial institutions - 24.5 - 24.5 24.8Derivative liabilities
foreign exchange forward contracts 4.2 - - 4.2 4.2foreign exchange forward contracts under hedge accounting 3.4 - - 3.4 3.4
Other current borrowings - 49.9 - 49.9 49.9Trade and other payables - 289.5 - 289.5 289.5Carrying amount by category 7.7 522.6 - 530.3 533.1
69 CONSOLIDATED FINANCIAL STATEMENTS, IFRS
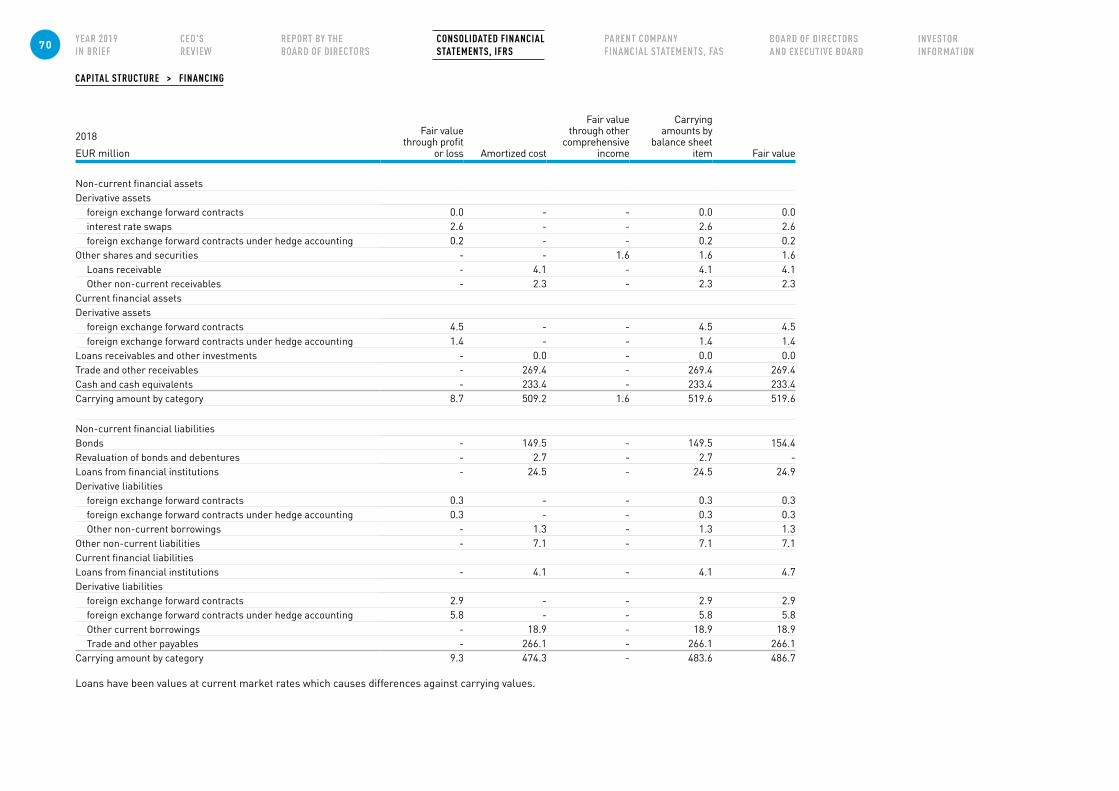
CAPITAL STRUCTURE > FINANCING
2018
EUR million
Fair value through profit
or loss Amortized cost
Fair value through other
comprehensive income
Carrying amounts by
balance sheet item Fair value
Non-current financial assetsDerivative assets
foreign exchange forward contracts 0.0 - - 0.0 0.0interest rate swaps 2.6 - - 2.6 2.6foreign exchange forward contracts under hedge accounting 0.2 - - 0.2 0.2
Other shares and securities - - 1.6 1.6 1.6Loans receivable - 4.1 - 4.1 4.1Other non-current receivables - 2.3 - 2.3 2.3
Current financial assetsDerivative assets
foreign exchange forward contracts 4.5 - - 4.5 4.5foreign exchange forward contracts under hedge accounting 1.4 - - 1.4 1.4
Loans receivables and other investments - 0.0 - 0.0 0.0Trade and other receivables - 269.4 - 269.4 269.4Cash and cash equivalents - 233.4 - 233.4 233.4Carrying amount by category 8.7 509.2 1.6 519.6 519.6
Non-current financial liabilitiesBonds - 149.5 - 149.5 154.4Revaluation of bonds and debentures - 2.7 - 2.7 -Loans from financial institutions - 24.5 - 24.5 24.9Derivative liabilities
foreign exchange forward contracts 0.3 - - 0.3 0.3foreign exchange forward contracts under hedge accounting 0.3 - - 0.3 0.3Other non-current borrowings - 1.3 - 1.3 1.3
Other non-current liabilities - 7.1 - 7.1 7.1Current financial liabilitiesLoans from financial institutions - 4.1 - 4.1 4.7Derivative liabilities
foreign exchange forward contracts 2.9 - - 2.9 2.9foreign exchange forward contracts under hedge accounting 5.8 - - 5.8 5.8Other current borrowings - 18.9 - 18.9 18.9Trade and other payables - 266.1 - 266.1 266.1
Carrying amount by category 9.3 474.3 - 483.6 486.7
Loans have been values at current market rates which causes differences against carrying values.
70 CONSOLIDATED FINANCIAL STATEMENTS, IFRS
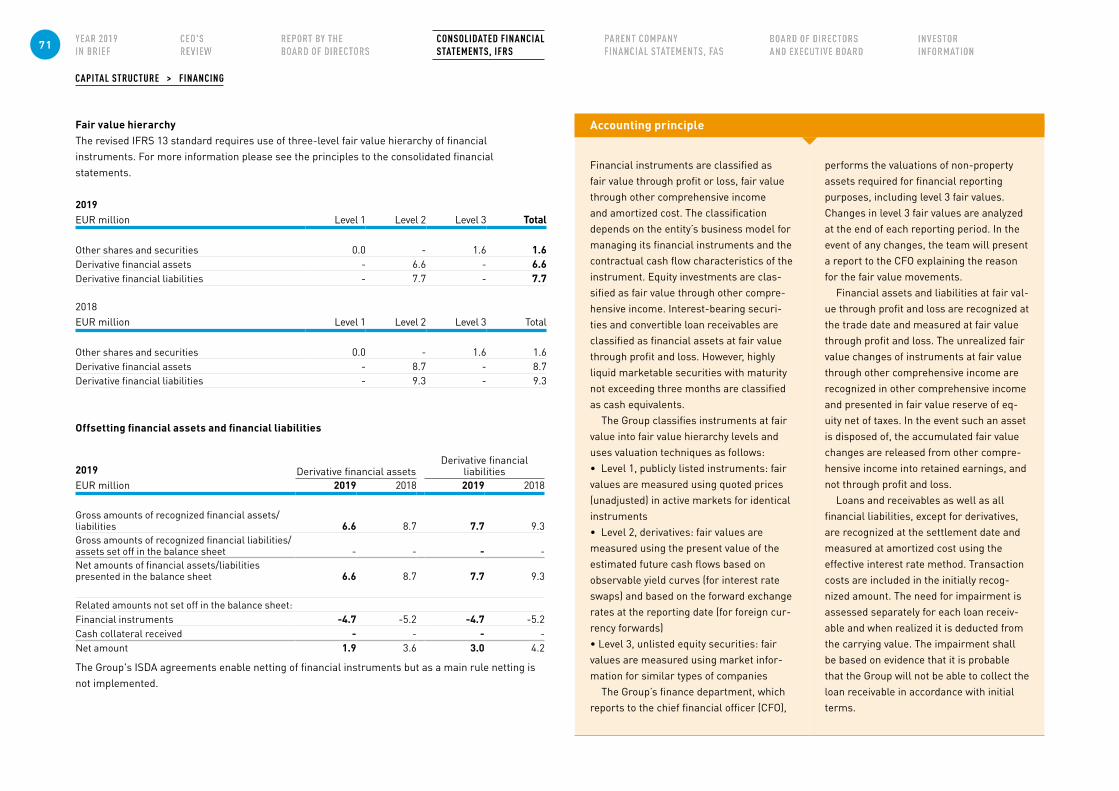
CAPITAL STRUCTURE > FINANCING
Fair value hierarchyThe revised IFRS 13 standard requires use of three-level fair value hierarchy of financial instruments. For more information please see the principles to the consolidated financial statements.
2019EUR million Level 1 Level 2 Level 3 Total
Other shares and securities 0.0 - 1.6 1.6Derivative financial assets - 6.6 - 6.6Derivative financial liabilities - 7.7 - 7.7
2018EUR million Level 1 Level 2 Level 3 Total
Other shares and securities 0.0 - 1.6 1.6Derivative financial assets - 8.7 - 8.7Derivative financial liabilities - 9.3 - 9.3
Offsetting financial assets and financial liabilities
2019 Derivative financial assets Derivative financial
liabilities EUR million 2019 2018 2019 2018
Gross amounts of recognized financial assets/liabilities 6.6 8.7 7.7 9.3Gross amounts of recognized financial liabilities/assets set off in the balance sheet - - - -Net amounts of financial assets/liabilities presented in the balance sheet 6.6 8.7 7.7 9.3
Related amounts not set off in the balance sheet:Financial instruments -4.7 -5.2 -4.7 -5.2Cash collateral received - - - -Net amount 1.9 3.6 3.0 4.2
The Group's ISDA agreements enable netting of financial instruments but as a main rule netting is not implemented.
Accounting principle
Financial instruments are classified as fair value through profit or loss, fair value through other comprehensive income and amortized cost. The classification depends on the entity’s business model for managing its financial instruments and the contractual cash flow characteristics of the instrument. Equity investments are clas-sified as fair value through other compre-hensive income. Interest-bearing securi-ties and convertible loan receivables are classified as financial assets at fair value through profit and loss. However, highly liquid marketable securities with maturity not exceeding three months are classified as cash equivalents.
The Group classifies instruments at fair value into fair value hierarchy levels and uses valuation techniques as follows:• Level 1, publicly listed instruments: fair values are measured using quoted prices (unadjusted) in active markets for identical instruments• Level 2, derivatives: fair values are measured using the present value of the estimated future cash flows based on observable yield curves (for interest rate swaps) and based on the forward exchange rates at the reporting date (for foreign cur-rency forwards)• Level 3, unlisted equity securities: fair values are measured using market infor-mation for similar types of companies
The Group’s finance department, which reports to the chief financial officer (CFO),
performs the valuations of non-property assets required for financial reporting purposes, including level 3 fair values. Changes in level 3 fair values are analyzed at the end of each reporting period. In the event of any changes, the team will present a report to the CFO explaining the reason for the fair value movements.
Financial assets and liabilities at fair val-ue through profit and loss are recognized at the trade date and measured at fair value through profit and loss. The unrealized fair value changes of instruments at fair value through other comprehensive income are recognized in other comprehensive income and presented in fair value reserve of eq-uity net of taxes. In the event such an asset is disposed of, the accumulated fair value changes are released from other compre-hensive income into retained earnings, and not through profit and loss.
Loans and receivables as well as all financial liabilities, except for derivatives, are recognized at the settlement date and measured at amortized cost using the effective interest rate method. Transaction costs are included in the initially recog-nized amount. The need for impairment is assessed separately for each loan receiv-able and when realized it is deducted from the carrying value. The impairment shall be based on evidence that it is probable that the Group will not be able to collect the loan receivable in accordance with initial terms.
71 CONSOLIDATED FINANCIAL STATEMENTS, IFRS
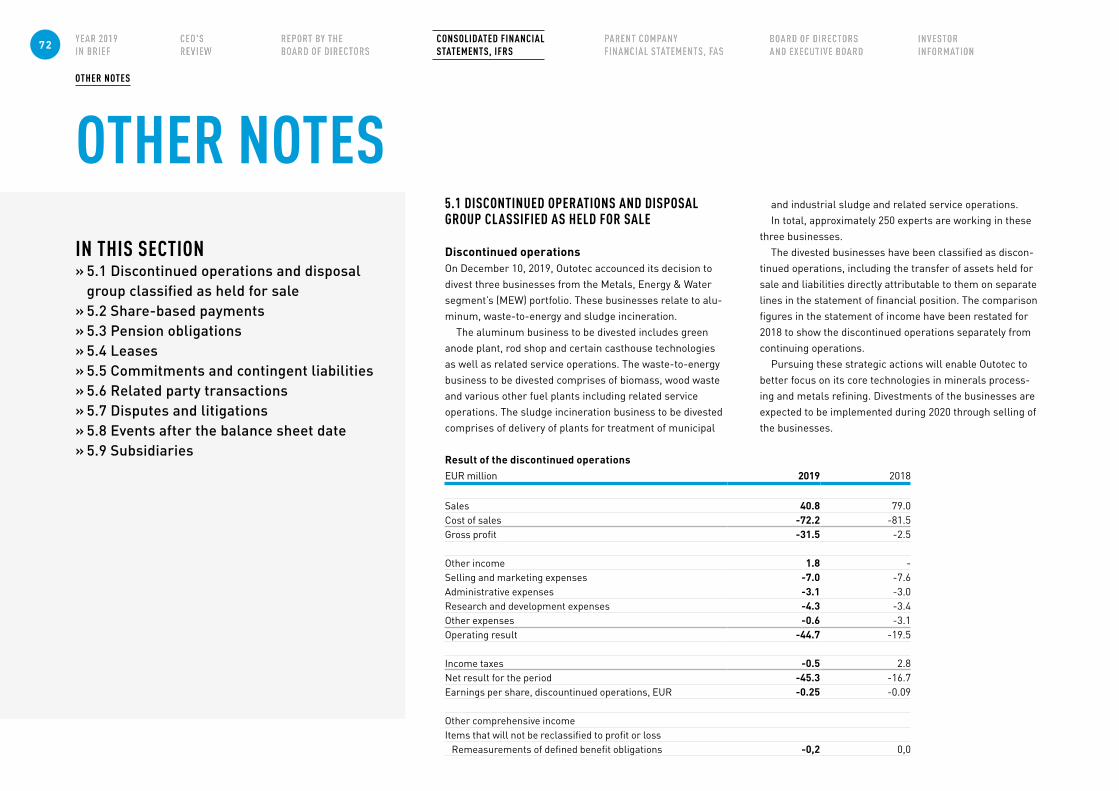
OTHER NOTES
OTHER NOTESIN THIS SECTION
» 5.1 Discontinued operations and disposal group classified as held for sale » 5.2 Share-based payments » 5.3 Pension obligations » 5.4 Leases » 5.5 Commitments and contingent liabilities » 5.6 Related party transactions » 5.7 Disputes and litigations » 5.8 Events after the balance sheet date » 5.9 Subsidiaries
Result of the discontinued operationsEUR million 2019 2018
Sales 40.8 79.0Cost of sales -72.2 -81.5Gross profit -31.5 -2.5
Other income 1.8 -Selling and marketing expenses -7.0 -7.6Administrative expenses -3.1 -3.0Research and development expenses -4.3 -3.4Other expenses -0.6 -3.1Operating result -44.7 -19.5
Income taxes -0.5 2.8Net result for the period -45.3 -16.7Earnings per share, discountinued operations, EUR -0.25 -0.09
Other comprehensive incomeItems that will not be reclassified to profit or loss Remeasurements of defined benefit obligations -0,2 0,0
5.1 DISCONTINUED OPERATIONS AND DISPOSAL GROUP CLASSIFIED AS HELD FOR SALE
Discontinued operationsOn December 10, 2019, Outotec accounced its decision to divest three businesses from the Metals, Energy & Water segment’s (MEW) portfolio. These businesses relate to alu-minum, waste-to-energy and sludge incineration.
The aluminum business to be divested includes green anode plant, rod shop and certain casthouse technologies as well as related service operations. The waste-to-energy business to be divested comprises of biomass, wood waste and various other fuel plants including related service operations. The sludge incineration business to be divested comprises of delivery of plants for treatment of municipal
and industrial sludge and related service operations. In total, approximately 250 experts are working in these
three businesses. The divested businesses have been classified as discon-
tinued operations, including the transfer of assets held for sale and liabilities directly attributable to them on separate lines in the statement of financial position. The comparison figures in the statement of income have been restated for 2018 to show the discontinued operations separately from continuing operations.
Pursuing these strategic actions will enable Outotec to better focus on its core technologies in minerals process-ing and metals refining. Divestments of the businesses are expected to be implemented during 2020 through selling of the businesses.
72 CONSOLIDATED FINANCIAL STATEMENTS, IFRS
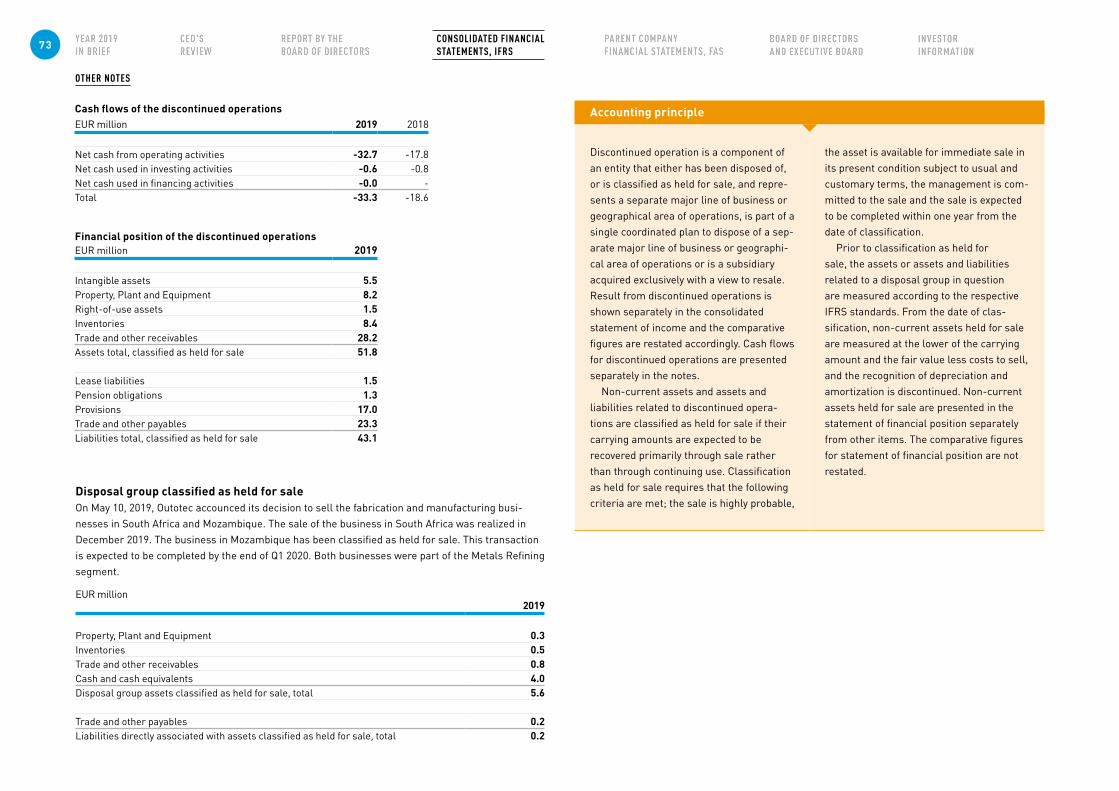
OTHER NOTES
Disposal group classified as held for saleOn May 10, 2019, Outotec accounced its decision to sell the fabrication and manufacturing busi-nesses in South Africa and Mozambique. The sale of the business in South Africa was realized in December 2019. The business in Mozambique has been classified as held for sale. This transaction is expected to be completed by the end of Q1 2020. Both businesses were part of the Metals Refining segment.
EUR million2019
Property, Plant and Equipment 0.3Inventories 0.5Trade and other receivables 0.8Cash and cash equivalents 4.0Disposal group assets classified as held for sale, total 5.6
Trade and other payables 0.2Liabilities directly associated with assets classified as held for sale, total 0.2
Cash flows of the discontinued operationsEUR million 2019 2018
Net cash from operating activities -32.7 -17.8Net cash used in investing activities -0.6 -0.8Net cash used in financing activities -0.0 -Total -33.3 -18.6
Financial position of the discontinued operationsEUR million 2019
Intangible assets 5.5Property, Plant and Equipment 8.2Right-of-use assets 1.5Inventories 8.4Trade and other receivables 28.2Assets total, classified as held for sale 51.8
Lease liabilities 1.5Pension obligations 1.3Provisions 17.0Trade and other payables 23.3Liabilities total, classified as held for sale 43.1
Accounting principle
Discontinued operation is a component of an entity that either has been disposed of, or is classified as held for sale, and repre-sents a separate major line of business or geographical area of operations, is part of a single coordinated plan to dispose of a sep-arate major line of business or geographi-cal area of operations or is a subsidiary acquired exclusively with a view to resale. Result from discontinued operations is shown separately in the consolidated statement of income and the comparative figures are restated accordingly. Cash flows for discontinued operations are presented separately in the notes.
Non-current assets and assets and liabilities related to discontinued opera-tions are classified as held for sale if their carrying amounts are expected to be recovered primarily through sale rather than through continuing use. Classification as held for sale requires that the following criteria are met; the sale is highly probable,
the asset is available for immediate sale in its present condition subject to usual and customary terms, the management is com-mitted to the sale and the sale is expected to be completed within one year from the date of classification.
Prior to classification as held for sale, the assets or assets and liabilities related to a disposal group in question are measured according to the respective IFRS standards. From the date of clas-sification, non-current assets held for sale are measured at the lower of the carrying amount and the fair value less costs to sell, and the recognition of depreciation and amortization is discontinued. Non-current assets held for sale are presented in the statement of financial position separately from other items. The comparative figures for statement of financial position are not restated.
73 CONSOLIDATED FINANCIAL STATEMENTS, IFRS

OTHER NOTES
5.2 SHARE-BASED PAYMENTSShare-based payments include a share-based incentive program for key personnel and an em-ployee share savings plan.
Share-based Incentive Program 2019-2021Outotec’s Board of Directors decided December 11, 2018 to adopt a Share-based Incentive Pro-gram 2019-2021 for the company’s key personnel. The program comprises of three earning periods: calendar years 2019, 2020 and 2021. On an an-nual basis, the Board of Directors determines the maximum number of allocated shares, the participants, the length of the earning period, the amount of maximum reward for each individual, the earning criteria and the targets established for them. The length of the earning and measure-ment period can vary from one to three years. A precondition for the Executive Board members to be eligible for the Share-based Incentive Program is that s/he also participates in Outotec’s Em-ployee Share Savings Plan.
The person must remain employed for at least two years after the closing of the earning period. The reward will be paid after the end of this restriction period as a combination of shares and cash. The cash portion is intended for covering taxes and tax-related payments. The reward will not be paid if the person's employment ends before the end of the restriction period.
The targets for the 2019 earning period are based on the operating result (EBIT) and free cash flow.
Share-based Incentive Program 2016-2018Outotec’s Board of Directors decided February 29, 2016 to adopt a Share-based Incentive Program 2016-2018 for the company’s key personnel. The program comprised of three earning periods: calendar years 2016, 2017 and 2018. On an an-nual basis, the Board of Directors determined the maximum number of allocated shares, the participants, the length of earning period, the amount of maximum reward for each individual, the earning criteria and the targets established for them. A precondition for the Executive Board members to be eligible for the Share-based Incentive Program was that s/he also participated in Outotec’s Employee Share Savings Plan.
The reward was paid in the spring of the year following the closing of the earning period as a combination of shares and cash. The cash portion was intended for covering taxes and tax-related payments. The reward was not paid if the per-son's employment ended before the closing of the earning period. The person must also hold the earned shares and remain employed for at least two years after the closing of the earning period. If the person left Outotec within this period, the shares were returned to Outotec.
The targets for the 2016 earning period, based on net profit and free cash flow, were not reached and thus no reward was paid. The targets for the 2017 earning period were based on adjusted EBIT and free cash flow, and of the reward paid in June 2018 a net number of 139 749 shares was outstanding at the end of the period in addition to a cash payment corresponding to an income taxable value of 11 909 shares to be paid upon
vesting in some tax jurisdictions. The targets for the 2018 earning period were based on ad-justed EBIT and free cash flow. These were not reached and thus no reward will be paid out.
Employee Share Savings PlanOutotec’s Board of Directors decided on Sep-tember 25, 2012, to launch a global Employee Share Savings Plan for Outotec employees. The participants have a possibility to save 2 to 5% of their gross salary for purchasing Outotec shares. The shares are acquired quarterly at market price. To encourage participation, Ou-totec offers each participant one free share for two acquired shares, after a designated holding period of approximately three years. The free shares are taxable income for the recipient; consequently, part of the granted shares is withheld as a cash portion for settlement of income taxes, the plan thus having net settle-ment features. Outotec's Board of Directors has decided not to launch a new O'share saving period for 2020. The decision was taken due to the expected combination of Outotec and Metso Minerals, as incentive plans for 2020 are part of the integration planning.
The 2016 plan ended during the reporting period, under which a reward corresponding to a total of 99,981 shares was delivered in addi-tion to the cash portion intended for covering taxes and tax-related payments.
74 CONSOLIDATED FINANCIAL STATEMENTS, IFRS
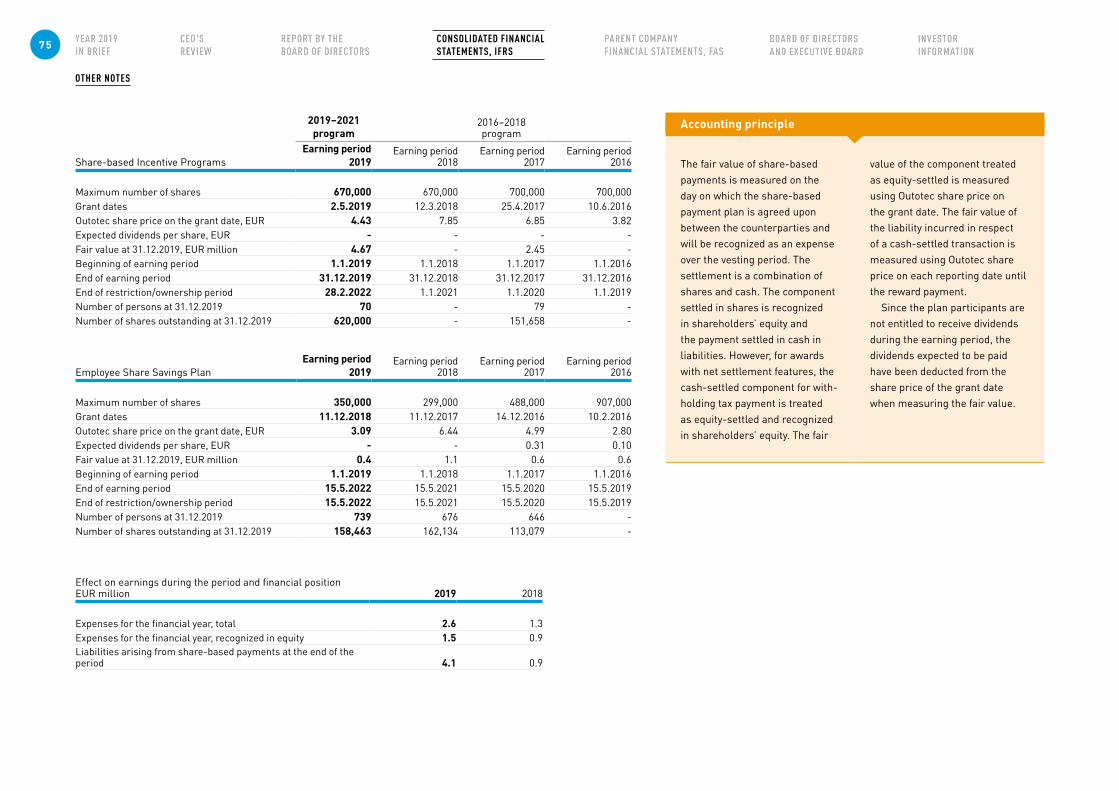
OTHER NOTES
2019–2021 program
2016–2018 program
Share-based Incentive ProgramsEarning period
2019Earning period
2018Earning period
2017Earning period
2016
Maximum number of shares 670,000 670,000 700,000 700,000Grant dates 2.5.2019 12.3.2018 25.4.2017 10.6.2016Outotec share price on the grant date, EUR 4.43 7.85 6.85 3.82Expected dividends per share, EUR - - - -Fair value at 31.12.2019, EUR million 4.67 - 2.45 -Beginning of earning period 1.1.2019 1.1.2018 1.1.2017 1.1.2016End of earning period 31.12.2019 31.12.2018 31.12.2017 31.12.2016End of restriction/ownership period 28.2.2022 1.1.2021 1.1.2020 1.1.2019Number of persons at 31.12.2019 70 - 79 -Number of shares outstanding at 31.12.2019 620,000 - 151,658 -
Effect on earnings during the period and financial positionEUR million 2019 2018
Expenses for the financial year, total 2.6 1.3Expenses for the financial year, recognized in equity 1.5 0.9Liabilities arising from share-based payments at the end of the period 4.1 0.9
Accounting principle
The fair value of share-based payments is measured on the day on which the share-based payment plan is agreed upon between the counterparties and will be recognized as an expense over the vesting period. The settlement is a combination of shares and cash. The component settled in shares is recognized in shareholders’ equity and the payment settled in cash in liabilities. However, for awards with net settlement features, the cash-settled component for with-holding tax payment is treated as equity-settled and recognized in shareholders’ equity. The fair
value of the component treated as equity-settled is measured using Outotec share price on the grant date. The fair value of the liability incurred in respect of a cash-settled transaction is measured using Outotec share price on each reporting date until the reward payment.
Since the plan participants are not entitled to receive dividends during the earning period, the dividends expected to be paid have been deducted from the share price of the grant date when measuring the fair value.
Employee Share Savings PlanEarning period
2019Earning period
2018Earning period
2017Earning period
2016
Maximum number of shares 350,000 299,000 488,000 907,000Grant dates 11.12.2018 11.12.2017 14.12.2016 10.2.2016Outotec share price on the grant date, EUR 3.09 6.44 4.99 2.80Expected dividends per share, EUR - - 0.31 0.10Fair value at 31.12.2019, EUR million 0.4 1.1 0.6 0.6Beginning of earning period 1.1.2019 1.1.2018 1.1.2017 1.1.2016End of earning period 15.5.2022 15.5.2021 15.5.2020 15.5.2019End of restriction/ownership period 15.5.2022 15.5.2021 15.5.2020 15.5.2019Number of persons at 31.12.2019 739 676 646 -Number of shares outstanding at 31.12.2019 158,463 162,134 113,079 -
75 CONSOLIDATED FINANCIAL STATEMENTS, IFRS
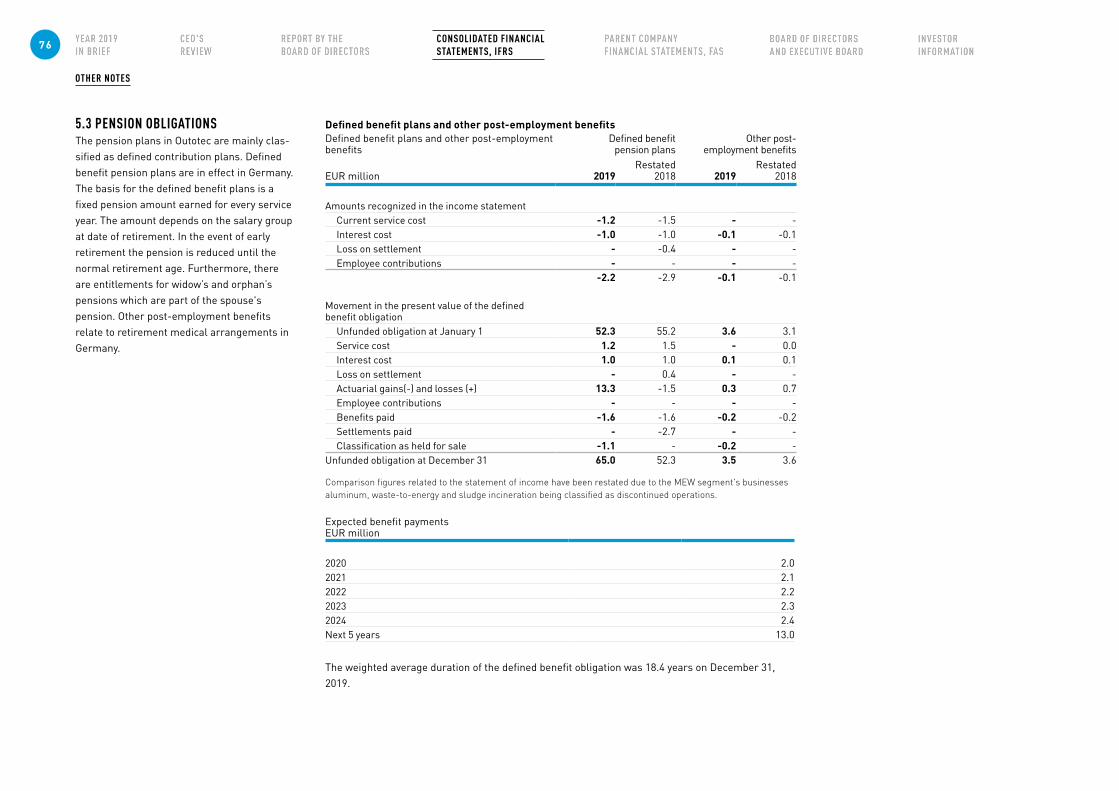
OTHER NOTES
5.3 PENSION OBLIGATIONSThe pension plans in Outotec are mainly clas-sified as defined contribution plans. Defined benefit pension plans are in effect in Germany. The basis for the defined benefit plans is a fixed pension amount earned for every service year. The amount depends on the salary group at date of retirement. In the event of early retirement the pension is reduced until the normal retirement age. Furthermore, there are entitlements for widow’s and orphan’s pensions which are part of the spouse's pension. Other post-employment benefits relate to retirement medical arrangements in Germany.
Defined benefit plans and other post-employment benefitsDefined benefit plans and other post-employment benefits
Defined benefit pension plans
Other post- employment benefits
EUR million 2019Restated
2018 2019Restated
2018
Amounts recognized in the income statementCurrent service cost -1.2 -1.5 - -Interest cost -1.0 -1.0 -0.1 -0.1Loss on settlement - -0.4 - -Employee contributions - - - -
-2.2 -2.9 -0.1 -0.1
Movement in the present value of the defined benefit obligation
Unfunded obligation at January 1 52.3 55.2 3.6 3.1Service cost 1.2 1.5 - 0.0Interest cost 1.0 1.0 0.1 0.1Loss on settlement - 0.4 - -Actuarial gains(-) and losses (+) 13.3 -1.5 0.3 0.7Employee contributions - - - -Benefits paid -1.6 -1.6 -0.2 -0.2Settlements paid - -2.7 - -Classification as held for sale -1.1 - -0.2 -
Unfunded obligation at December 31 65.0 52.3 3.5 3.6
Comparison figures related to the statement of income have been restated due to the MEW segment's businesses aluminum, waste-to-energy and sludge incineration being classified as discontinued operations.
Expected benefit paymentsEUR million
2020 2.02021 2.12022 2.22023 2.32024 2.4Next 5 years 13.0
The weighted average duration of the defined benefit obligation was 18.4 years on December 31, 2019.
76 CONSOLIDATED FINANCIAL STATEMENTS, IFRS
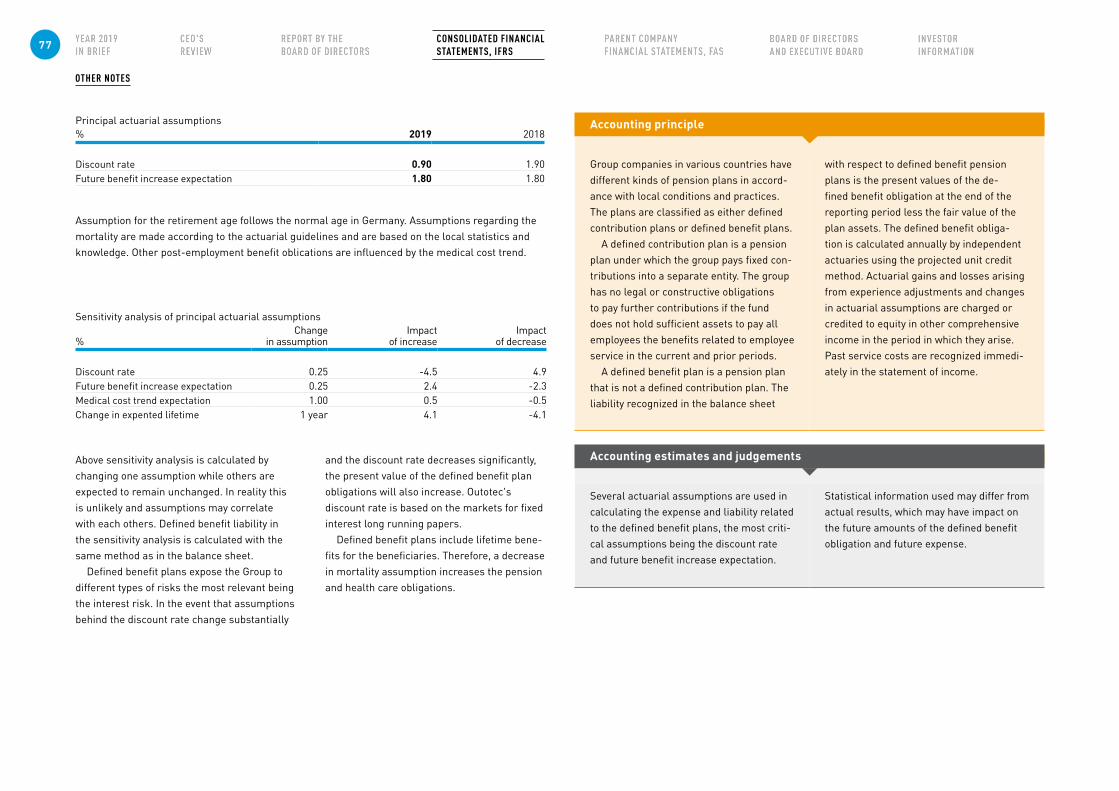
OTHER NOTES
Principal actuarial assumptions% 2019 2018
Discount rate 0.90 1.90Future benefit increase expectation 1.80 1.80
Assumption for the retirement age follows the normal age in Germany. Assumptions regarding the mortality are made according to the actuarial guidelines and are based on the local statistics and knowledge. Other post-employment benefit oblications are influenced by the medical cost trend.
Sensitivity analysis of principal actuarial assumptions
%Change
in assumptionImpact
of increaseImpact
of decrease
Discount rate 0.25 -4.5 4.9Future benefit increase expectation 0.25 2.4 -2.3Medical cost trend expectation 1.00 0.5 -0.5Change in expented lifetime 1 year 4.1 -4.1
Above sensitivity analysis is calculated by changing one assumption while others are expected to remain unchanged. In reality this is unlikely and assumptions may correlate with each others. Defined benefit liability in the sensitivity analysis is calculated with the same method as in the balance sheet.
Defined benefit plans expose the Group to different types of risks the most relevant being the interest risk. In the event that assumptions behind the discount rate change substantially
and the discount rate decreases significantly, the present value of the defined benefit plan obligations will also increase. Outotec's discount rate is based on the markets for fixed interest long running papers.
Defined benefit plans include lifetime bene-fits for the beneficiaries. Therefore, a decrease in mortality assumption increases the pension and health care obligations.
Accounting principle
Group companies in various countries have different kinds of pension plans in accord-ance with local conditions and practices. The plans are classified as either defined contribution plans or defined benefit plans.
A defined contribution plan is a pension plan under which the group pays fixed con-tributions into a separate entity. The group has no legal or constructive obligations to pay further contributions if the fund does not hold sufficient assets to pay all employees the benefits related to employee service in the current and prior periods.
A defined benefit plan is a pension plan that is not a defined contribution plan. The liability recognized in the balance sheet
with respect to defined benefit pension plans is the present values of the de-fined benefit obligation at the end of the reporting period less the fair value of the plan assets. The defined benefit obliga-tion is calculated annually by independent actuaries using the projected unit credit method. Actuarial gains and losses arising from experience adjustments and changes in actuarial assumptions are charged or credited to equity in other comprehensive income in the period in which they arise. Past service costs are recognized immedi-ately in the statement of income.
Accounting estimates and judgements
Several actuarial assumptions are used in calculating the expense and liability related to the defined benefit plans, the most criti-cal assumptions being the discount rate and future benefit increase expectation.
Statistical information used may differ from actual results, which may have impact on the future amounts of the defined benefit obligation and future expense.
77 CONSOLIDATED FINANCIAL STATEMENTS, IFRS
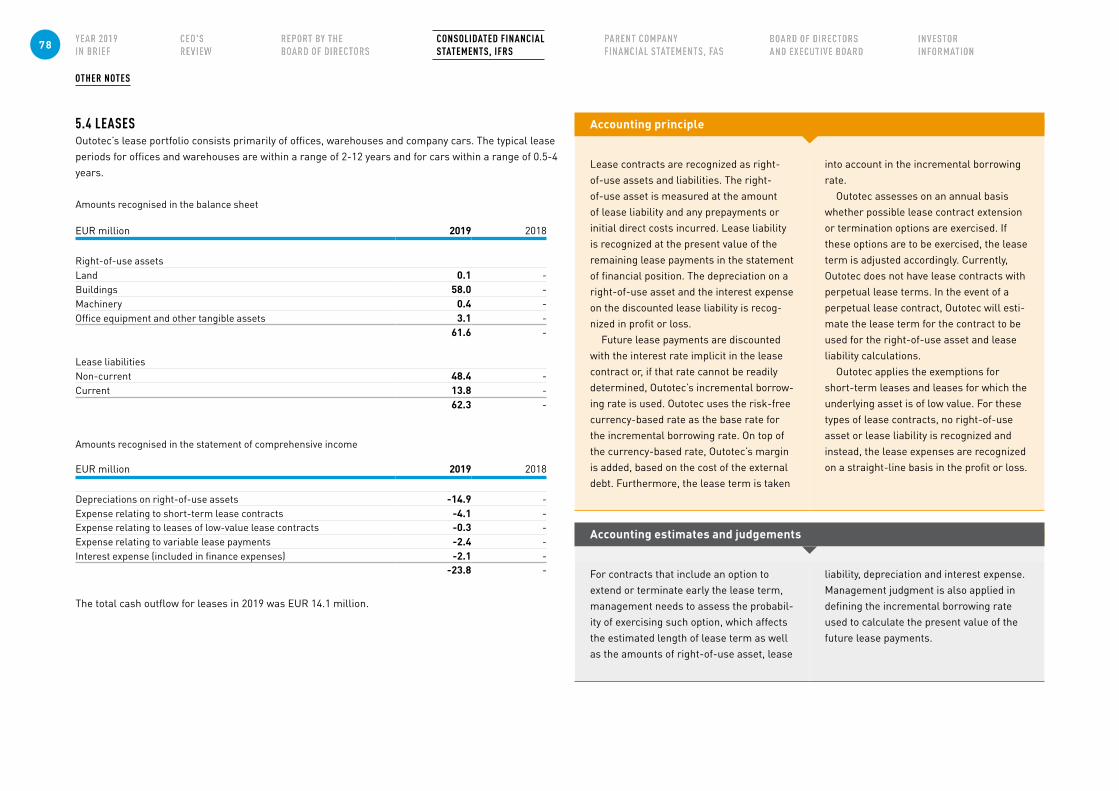
OTHER NOTES
5.4 LEASESOutotec’s lease portfolio consists primarily of offices, warehouses and company cars. The typical lease periods for offices and warehouses are within a range of 2-12 years and for cars within a range of 0.5-4 years.
Amounts recognised in the balance sheet
EUR million 2019 2018
Right-of-use assetsLand 0.1 -Buildings 58.0 -Machinery 0.4 -Office equipment and other tangible assets 3.1 -
61.6 -
Lease liabilitiesNon-current 48.4 -Current 13.8 -
62.3 -
Amounts recognised in the statement of comprehensive income
EUR million 2019 2018
Depreciations on right-of-use assets -14.9 -Expense relating to short-term lease contracts -4.1 -Expense relating to leases of low-value lease contracts -0.3 -Expense relating to variable lease payments -2.4 -Interest expense (included in finance expenses) -2.1 -
-23.8 -
The total cash outflow for leases in 2019 was EUR 14.1 million.
Accounting principle
Lease contracts are recognized as right-of-use assets and liabilities. The right-of-use asset is measured at the amount of lease liability and any prepayments or initial direct costs incurred. Lease liability is recognized at the present value of the remaining lease payments in the statement of financial position. The depreciation on a right-of-use asset and the interest expense on the discounted lease liability is recog-nized in profit or loss.
Future lease payments are discounted with the interest rate implicit in the lease contract or, if that rate cannot be readily determined, Outotec’s incremental borrow-ing rate is used. Outotec uses the risk-free currency-based rate as the base rate for the incremental borrowing rate. On top of the currency-based rate, Outotec’s margin is added, based on the cost of the external debt. Furthermore, the lease term is taken
into account in the incremental borrowing rate.
Outotec assesses on an annual basis whether possible lease contract extension or termination options are exercised. If these options are to be exercised, the lease term is adjusted accordingly. Currently, Outotec does not have lease contracts with perpetual lease terms. In the event of a perpetual lease contract, Outotec will esti-mate the lease term for the contract to be used for the right-of-use asset and lease liability calculations.
Outotec applies the exemptions for short-term leases and leases for which the underlying asset is of low value. For these types of lease contracts, no right-of-use asset or lease liability is recognized and instead, the lease expenses are recognized on a straight-line basis in the profit or loss.
Accounting estimates and judgements
For contracts that include an option to extend or terminate early the lease term, management needs to assess the probabil-ity of exercising such option, which affects the estimated length of lease term as well as the amounts of right-of-use asset, lease
liability, depreciation and interest expense. Management judgment is also applied in defining the incremental borrowing rate used to calculate the present value of the future lease payments.
78 CONSOLIDATED FINANCIAL STATEMENTS, IFRS
OTHER NOTES
No securities or collateral have been pledged. Commercial guarantees relating to project
performance obligations and equipment deliv-eries totaled EUR 661.9 million on December 31, 2019 (December 31, 2018: EUR 490.7 mil-lion). These are issued by financial institutions or Outotec Oyj on behalf of Group companies.
The total value of the commercial guaran-tees above does not include advance payment guarantees issued by financial institutions, the parent or other Group companies, or guaran-tees for financial obligations. The total amount of guarantees for financing issued by Group
companies amounted to EUR 3.9 million as of December 31, 2019 (December 31, 2018: EUR 4.4 million) and for commercial commit-ments including advance payment guarantees EUR 856.1 million as of December 31, 2019 (December 31, 2018: EUR 688.1 million). The high exposure of on-demand guarantees may increase the risk of claims that may have an impact on Outotec’s liquidity.
Major off-balance sheet investment commitmentsThe Group had no major off-balance sheet investment commitments at December 31, 2019.
5.5 COMMITMENTS AND CONTINGENT LIABILITIES
79 CONSOLIDATED FINANCIAL STATEMENTS, IFRS
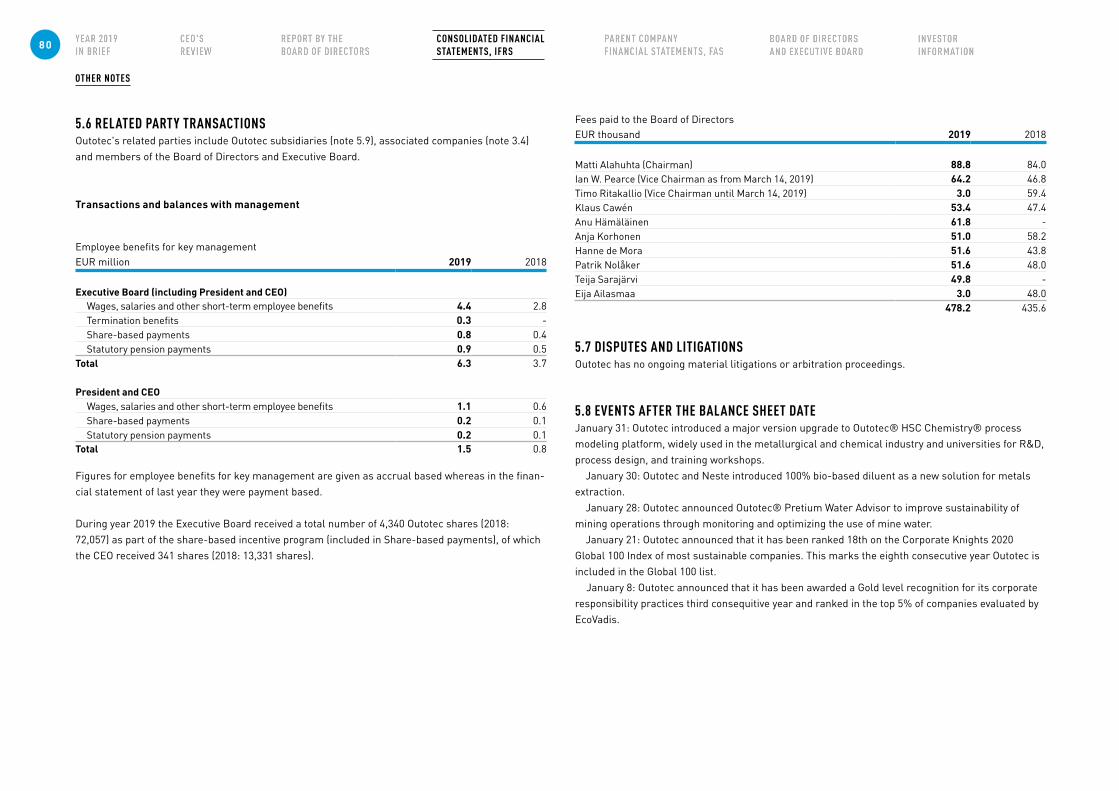
OTHER NOTES
5.6 RELATED PARTY TRANSACTIONS Outotec's related parties include Outotec subsidiaries (note 5.9), associated companies (note 3.4) and members of the Board of Directors and Executive Board.
Transactions and balances with management
Employee benefits for key managementEUR million 2019 2018
Executive Board (including President and CEO)Wages, salaries and other short-term employee benefits 4.4 2.8Termination benefits 0.3 -Share-based payments 0.8 0.4Statutory pension payments 0.9 0.5
Total 6.3 3.7
President and CEOWages, salaries and other short-term employee benefits 1.1 0.6Share-based payments 0.2 0.1Statutory pension payments 0.2 0.1
Total 1.5 0.8
Figures for employee benefits for key management are given as accrual based whereas in the finan-cial statement of last year they were payment based.
During year 2019 the Executive Board received a total number of 4,340 Outotec shares (2018: 72,057) as part of the share-based incentive program (included in Share-based payments), of which the CEO received 341 shares (2018: 13,331 shares).
Fees paid to the Board of DirectorsEUR thousand 2019 2018
Matti Alahuhta (Chairman) 88.8 84.0Ian W. Pearce (Vice Chairman as from March 14, 2019) 64.2 46.8Timo Ritakallio (Vice Chairman until March 14, 2019) 3.0 59.4Klaus Cawén 53.4 47.4Anu Hämäläinen 61.8 -Anja Korhonen 51.0 58.2Hanne de Mora 51.6 43.8Patrik Nolåker 51.6 48.0Teija Sarajärvi 49.8 -Eija Ailasmaa 3.0 48.0
478.2 435.6
5.7 DISPUTES AND LITIGATIONSOutotec has no ongoing material litigations or arbitration proceedings.
5.8 EVENTS AFTER THE BALANCE SHEET DATEJanuary 31: Outotec introduced a major version upgrade to Outotec® HSC Chemistry® process modeling platform, widely used in the metallurgical and chemical industry and universities for R&D, process design, and training workshops. January 30: Outotec and Neste introduced 100% bio-based diluent as a new solution for metals extraction. January 28: Outotec announced Outotec® Pretium Water Advisor to improve sustainability of mining operations through monitoring and optimizing the use of mine water. January 21: Outotec announced that it has been ranked 18th on the Corporate Knights 2020 Global 100 Index of most sustainable companies. This marks the eighth consecutive year Outotec is included in the Global 100 list.
January 8: Outotec announced that it has been awarded a Gold level recognition for its corporate responsibility practices third consequitive year and ranked in the top 5% of companies evaluated by EcoVadis.
80 CONSOLIDATED FINANCIAL STATEMENTS, IFRS
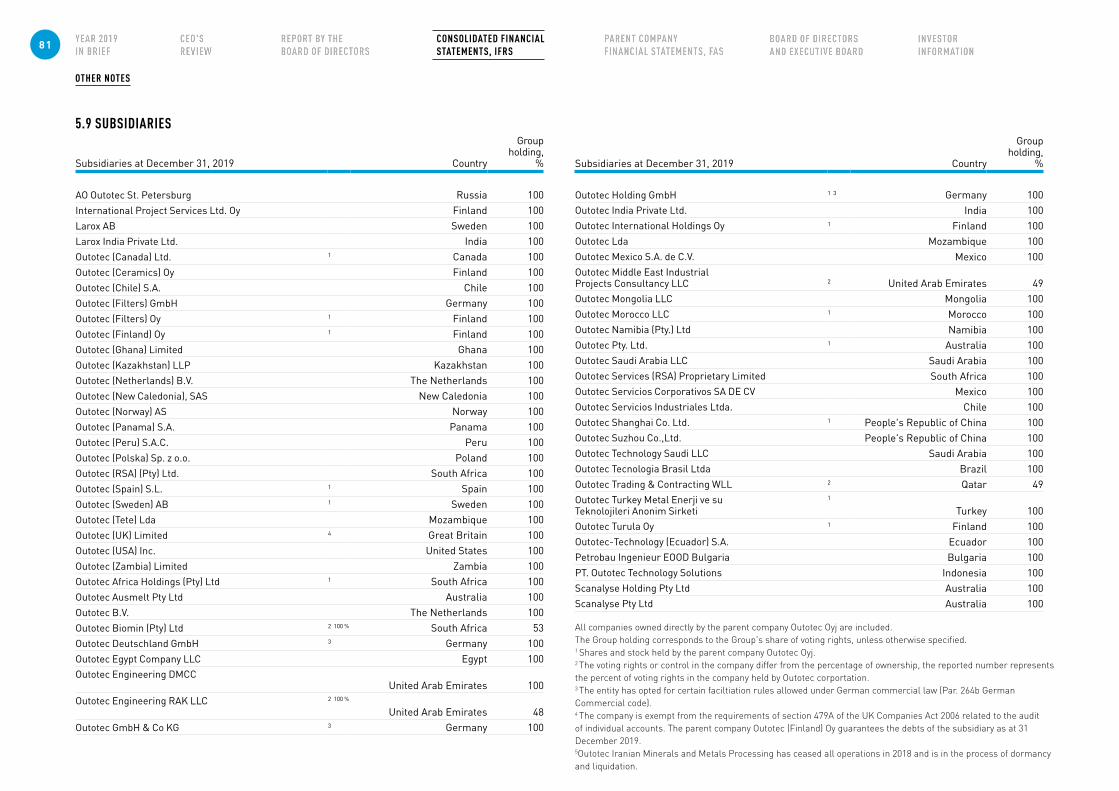
OTHER NOTES
5.9 SUBSIDIARIES
Subsidiaries at December 31, 2019 Country
Groupholding,
%
AO Outotec St. Petersburg Russia 100International Project Services Ltd. Oy Finland 100Larox AB Sweden 100Larox India Private Ltd. India 100Outotec (Canada) Ltd. 1 Canada 100Outotec (Ceramics) Oy Finland 100Outotec (Chile) S.A. Chile 100Outotec (Filters) GmbH Germany 100Outotec (Filters) Oy 1 Finland 100Outotec (Finland) Oy 1 Finland 100Outotec (Ghana) Limited Ghana 100Outotec (Kazakhstan) LLP Kazakhstan 100Outotec (Netherlands) B.V. The Netherlands 100Outotec (New Caledonia), SAS New Caledonia 100Outotec (Norway) AS Norway 100Outotec (Panama) S.A. Panama 100Outotec (Peru) S.A.C. Peru 100Outotec (Polska) Sp. z o.o. Poland 100Outotec (RSA) (Pty) Ltd. South Africa 100Outotec (Spain) S.L. 1 Spain 100Outotec (Sweden) AB 1 Sweden 100Outotec (Tete) Lda Mozambique 100Outotec (UK) Limited 4 Great Britain 100Outotec (USA) Inc. United States 100Outotec (Zambia) Limited Zambia 100Outotec Africa Holdings (Pty) Ltd 1 South Africa 100Outotec Ausmelt Pty Ltd Australia 100Outotec B.V. The Netherlands 100Outotec Biomin (Pty) Ltd 2 100 % South Africa 53Outotec Deutschland GmbH 3 Germany 100Outotec Egypt Company LLC Egypt 100Outotec Engineering DMCC
United Arab Emirates 100Outotec Engineering RAK LLC 2 100 %
United Arab Emirates 48Outotec GmbH & Co KG 3 Germany 100
Subsidiaries at December 31, 2019 Country
Groupholding,
%
Outotec Holding GmbH 1 3 Germany 100Outotec India Private Ltd. India 100Outotec International Holdings Oy 1 Finland 100Outotec Lda Mozambique 100Outotec Mexico S.A. de C.V. Mexico 100Outotec Middle East Industrial Projects Consultancy LLC 2 United Arab Emirates 49Outotec Mongolia LLC Mongolia 100Outotec Morocco LLC 1 Morocco 100Outotec Namibia (Pty.) Ltd Namibia 100Outotec Pty. Ltd. 1 Australia 100Outotec Saudi Arabia LLC Saudi Arabia 100Outotec Services (RSA) Proprietary Limited South Africa 100Outotec Servicios Corporativos SA DE CV Mexico 100Outotec Servicios Industriales Ltda. Chile 100Outotec Shanghai Co. Ltd. 1 People's Republic of China 100Outotec Suzhou Co.,Ltd. People's Republic of China 100Outotec Technology Saudi LLC Saudi Arabia 100Outotec Tecnologia Brasil Ltda Brazil 100Outotec Trading & Contracting WLL 2 Qatar 49Outotec Turkey Metal Enerji ve su Teknolojileri Anonim Sirketi
1
Turkey 100Outotec Turula Oy 1 Finland 100Outotec-Technology (Ecuador) S.A. Ecuador 100Petrobau Ingenieur EOOD Bulgaria Bulgaria 100PT. Outotec Technology Solutions Indonesia 100Scanalyse Holding Pty Ltd Australia 100Scanalyse Pty Ltd Australia 100
All companies owned directly by the parent company Outotec Oyj are included. The Group holding corresponds to the Group's share of voting rights, unless otherwise specified. 1 Shares and stock held by the parent company Outotec Oyj. 2 The voting rights or control in the company differ from the percentage of ownership, the reported number represents the percent of voting rights in the company held by Outotec corportation. 3 The entity has opted for certain faciltiation rules allowed under German commercial law (Par. 264b German Commercial code). 4 The company is exempt from the requirements of section 479A of the UK Companies Act 2006 related to the audit of individual accounts. The parent company Outotec (Finland) Oy guarantees the debts of the subsidiary as at 31 December 2019. 5Outotec Iranian Minerals and Metals Processing has ceased all operations in 2018 and is in the process of dormancy and liquidation.
81 CONSOLIDATED FINANCIAL STATEMENTS, IFRS
OTHER NOTES
Branch Offices at December 31, 2019International Project Services Ltd Oy Greek Branch, branch office in Greece International Project Services Ltd. Oy Ogranak Branch, branch office in Serbia Outotec Pty. Ltd, Sri Lanka Branch Office, branch office in Sri Lanka Outotec (RSA) (Pty) Ltd. (Branch Office), branch office in Zambia Outotec (Netherlands) B.V. Philippine Branch, branch office in Philippines Outotec (USA) Inc. UK Branch Office, branch office in United Kindom Outotec GmbH & co KG Bahrain branch, branch office in Bahrain
Changes in 2019Outotec (Filters) Oy Sucursal Branch Office in Peru liquidated on February 26, 2019 Outotec-Technology (Ecuador) S.A. established on July 12, 2019 Outotech Technology Saudi LLC change in ownership from 70% to 100% on June 30, 2019 Outotec Biomin (Pty) Ltd change in ownership from 51% to 52,9% on January 22, 2019
Changes in 2018Outotec GmbH & co KG Bahrain branch, branch office in Bahrain was registered on January 28, 2018 Outotec Egypt Company LLC was established in January 29, 2018 Outotec Austria GmbH was liquidated on April 24, 2018 Outotec Servicios Corporativos SA DE CV was established on October 11, 2018 Outotec Technology Saudi LLC (prev. Middle East Metals Processing Company Ltd.) changed from associate to subsidiary on November 1, 2018
82 CONSOLIDATED FINANCIAL STATEMENTS, IFRS
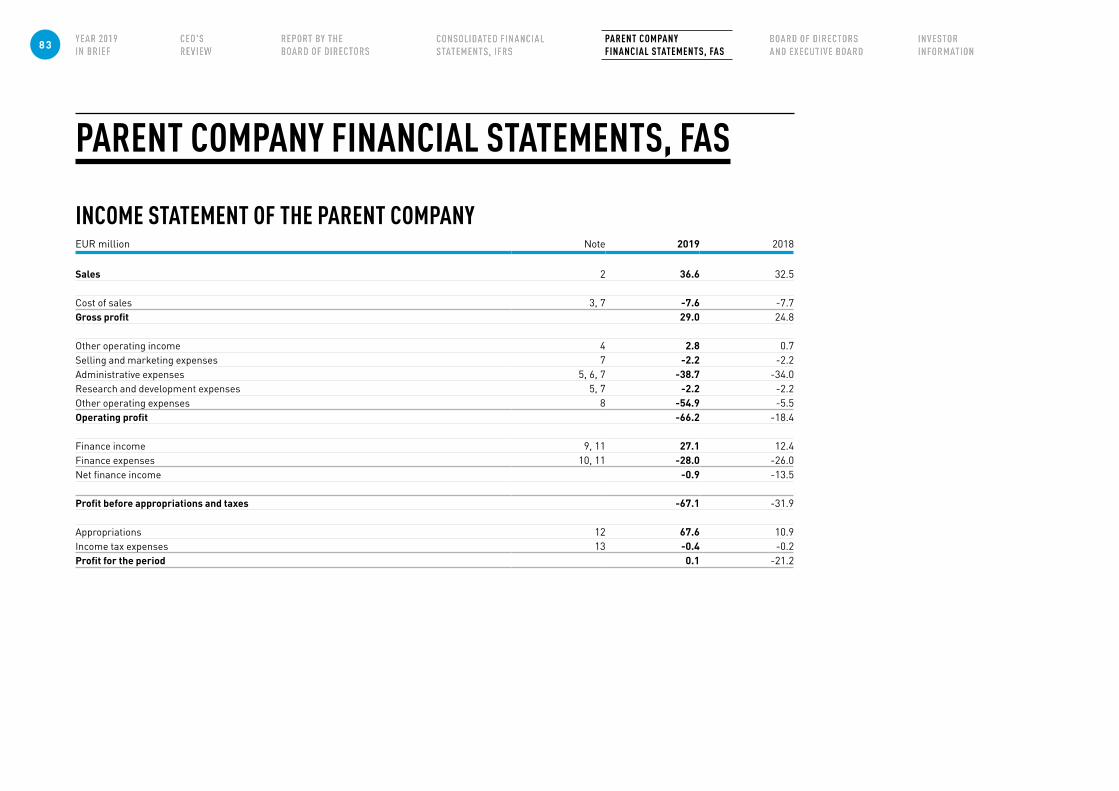
PARENT COMPANY FINANCIAL STATEMENTS, FAS
INCOME STATEMENT OF THE PARENT COMPANYEUR million Note 2019 2018
Sales 2 36.6 32.5
Cost of sales 3, 7 -7.6 -7.7Gross profit 29.0 24.8
Other operating income 4 2.8 0.7Selling and marketing expenses 7 -2.2 -2.2Administrative expenses 5, 6, 7 -38.7 -34.0Research and development expenses 5, 7 -2.2 -2.2Other operating expenses 8 -54.9 -5.5Operating profit -66.2 -18.4
Finance income 9, 11 27.1 12.4Finance expenses 10, 11 -28.0 -26.0Net finance income -0.9 -13.5
Profit before appropriations and taxes -67.1 -31.9
Appropriations 12 67.6 10.9Income tax expenses 13 -0.4 -0.2Profit for the period 0.1 -21.2
83 PARENT COMPANY FINANCIAL STATEMENTS, FAS
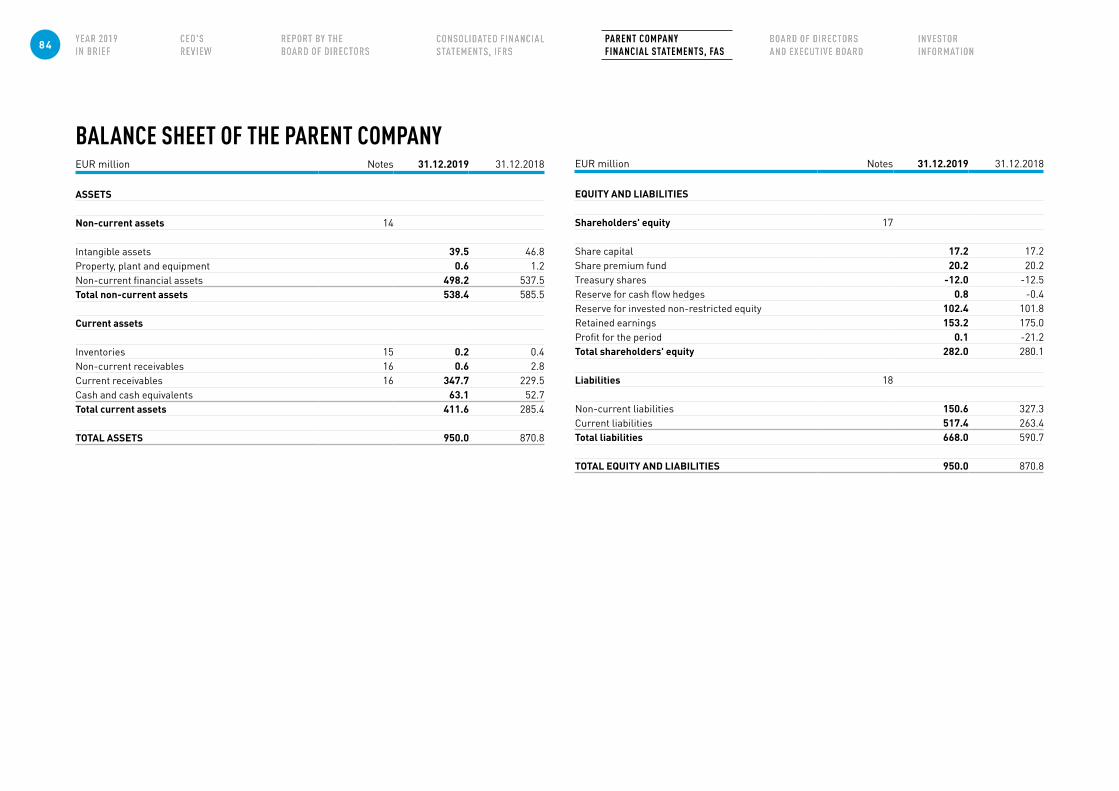
BALANCE SHEET OF THE PARENT COMPANY EUR million Notes 31.12.2019 31.12.2018
ASSETS
Non-current assets 14
Intangible assets 39.5 46.8Property, plant and equipment 0.6 1.2Non-current financial assets 498.2 537.5Total non-current assets 538.4 585.5
Current assets
Inventories 15 0.2 0.4Non-current receivables 16 0.6 2.8Current receivables 16 347.7 229.5Cash and cash equivalents 63.1 52.7Total current assets 411.6 285.4
TOTAL ASSETS 950.0 870.8
EUR million Notes 31.12.2019 31.12.2018
EQUITY AND LIABILITIES
Shareholders' equity 17
Share capital 17.2 17.2Share premium fund 20.2 20.2Treasury shares -12.0 -12.5Reserve for cash flow hedges 0.8 -0.4Reserve for invested non-restricted equity 102.4 101.8Retained earnings 153.2 175.0Profit for the period 0.1 -21.2Total shareholders' equity 282.0 280.1
Liabilities 18
Non-current liabilities 150.6 327.3Current liabilities 517.4 263.4Total liabilities 668.0 590.7
TOTAL EQUITY AND LIABILITIES 950.0 870.8
84 PARENT COMPANY FINANCIAL STATEMENTS, FAS
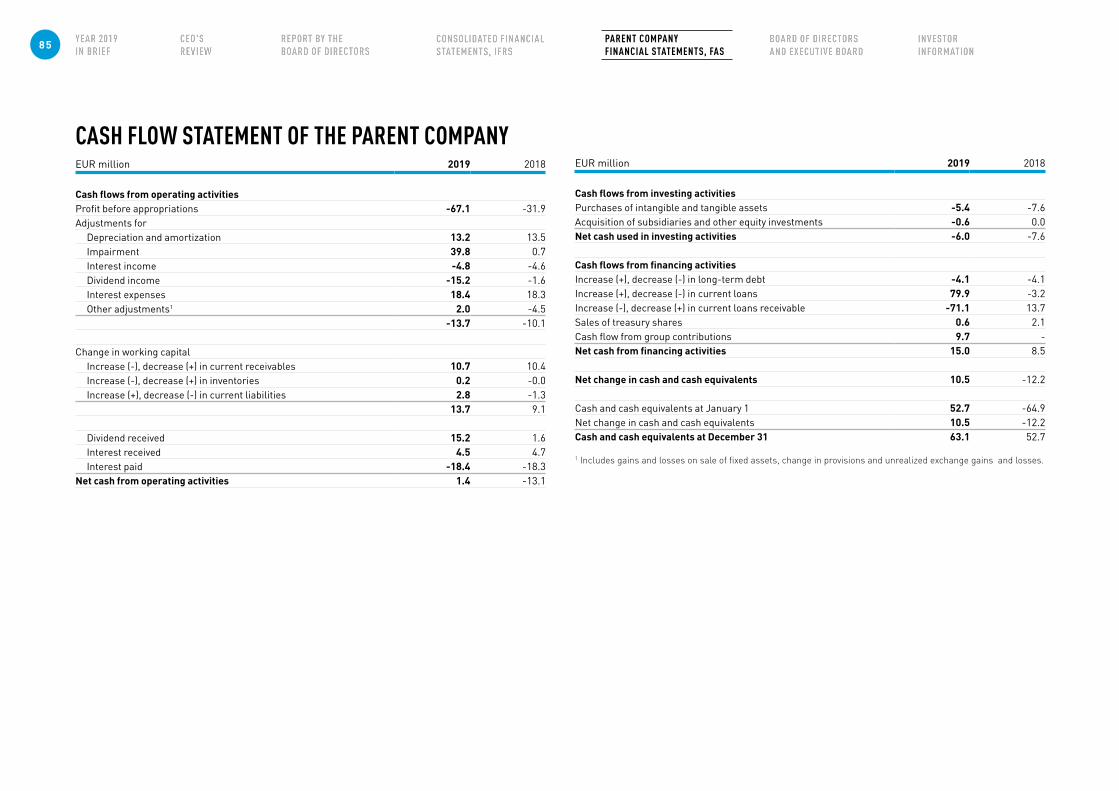
CASH FLOW STATEMENT OF THE PARENT COMPANY EUR million 2019 2018
Cash flows from operating activitiesProfit before appropriations -67.1 -31.9Adjustments for
Depreciation and amortization 13.2 13.5Impairment 39.8 0.7Interest income -4.8 -4.6Dividend income -15.2 -1.6Interest expenses 18.4 18.3Other adjustments1 2.0 -4.5
-13.7 -10.1
Change in working capital Increase (-), decrease (+) in current receivables 10.7 10.4Increase (-), decrease (+) in inventories 0.2 -0.0Increase (+), decrease (-) in current liabilities 2.8 -1.3
13.7 9.1
Dividend received 15.2 1.6Interest received 4.5 4.7Interest paid -18.4 -18.3
Net cash from operating activities 1.4 -13.1
EUR million 2019 2018
Cash flows from investing activitiesPurchases of intangible and tangible assets -5.4 -7.6Acquisition of subsidiaries and other equity investments -0.6 0.0Net cash used in investing activities -6.0 -7.6
Cash flows from financing activitiesIncrease (+), decrease (-) in long-term debt -4.1 -4.1Increase (+), decrease (-) in current loans 79.9 -3.2Increase (-), decrease (+) in current loans receivable -71.1 13.7Sales of treasury shares 0.6 2.1Cash flow from group contributions 9.7 -Net cash from financing activities 15.0 8.5
Net change in cash and cash equivalents 10.5 -12.2
Cash and cash equivalents at January 1 52.7 -64.9Net change in cash and cash equivalents 10.5 -12.2Cash and cash equivalents at December 31 63.1 52.7
1 Includes gains and losses on sale of fixed assets, change in provisions and unrealized exchange gains and losses.
85 PARENT COMPANY FINANCIAL STATEMENTS, FAS
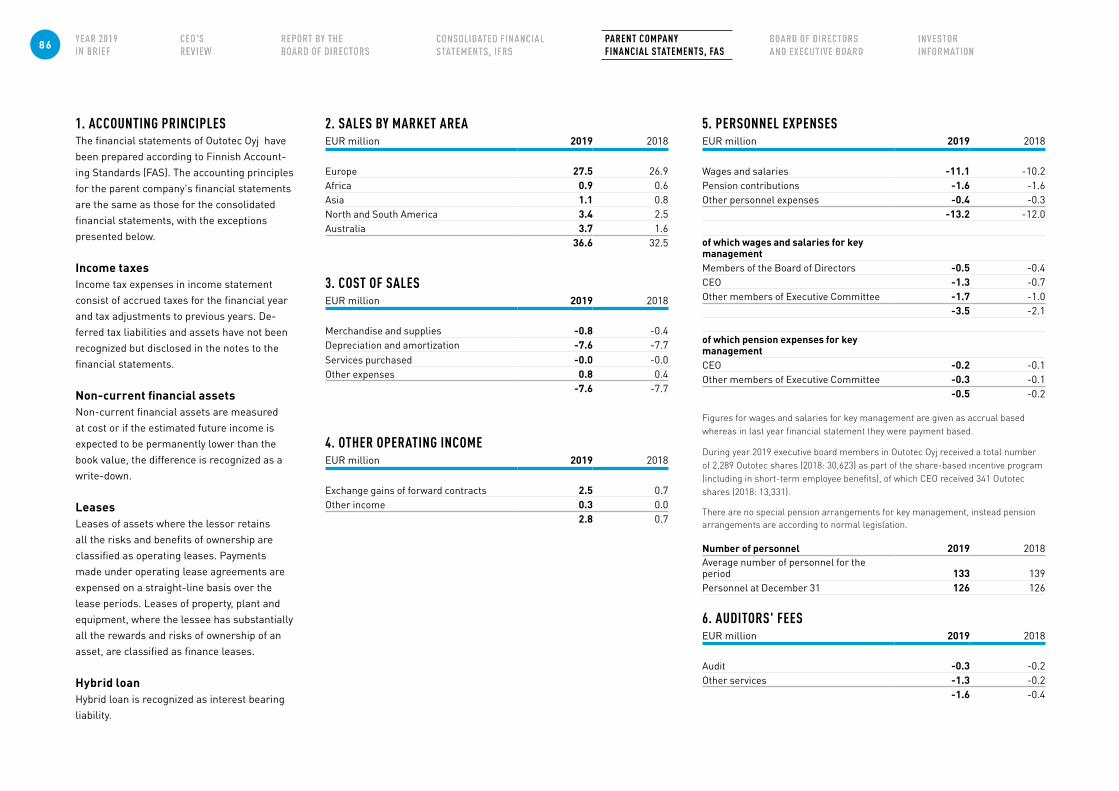
1. ACCOUNTING PRINCIPLESThe financial statements of Outotec Oyj have been prepared according to Finnish Account-ing Standards (FAS). The accounting principles for the parent company's financial statements are the same as those for the consolidatedfinancial statements, with the exceptions presented below.
Income taxesIncome tax expenses in income statement consist of accrued taxes for the financial year and tax adjustments to previous years. De-ferred tax liabilities and assets have not been recognized but disclosed in the notes to the financial statements.
Non-current financial assetsNon-current financial assets are measured at cost or if the estimated future income is expected to be permanently lower than the book value, the difference is recognized as a write-down.
LeasesLeases of assets where the lessor retains all the risks and benefits of ownership are classified as operating leases. Payments made under operating lease agreements are expensed on a straight-line basis over the lease periods. Leases of property, plant and equipment, where the lessee has substantially all the rewards and risks of ownership of an asset, are classified as finance leases.
Hybrid loanHybrid loan is recognized as interest bearing liability.
2. SALES BY MARKET AREA EUR million 2019 2018
Europe 27.5 26.9Africa 0.9 0.6Asia 1.1 0.8North and South America 3.4 2.5Australia 3.7 1.6
36.6 32.5
3. COST OF SALESEUR million 2019 2018
Merchandise and supplies -0.8 -0.4Depreciation and amortization -7.6 -7.7Services purchased -0.0 -0.0Other expenses 0.8 0.4
-7.6 -7.7
4. OTHER OPERATING INCOME EUR million 2019 2018
Exchange gains of forward contracts 2.5 0.7Other income 0.3 0.0
2.8 0.7
5. PERSONNEL EXPENSESEUR million 2019 2018
Wages and salaries -11.1 -10.2Pension contributions -1.6 -1.6Other personnel expenses -0.4 -0.3
-13.2 -12.0
of which wages and salaries for key managementMembers of the Board of Directors -0.5 -0.4CEO -1.3 -0.7Other members of Executive Committee -1.7 -1.0
-3.5 -2.1
of which pension expenses for key managementCEO -0.2 -0.1Other members of Executive Committee -0.3 -0.1
-0.5 -0.2
Figures for wages and salaries for key management are given as accrual based whereas in last year financial statement they were payment based.
During year 2019 executive board members in Outotec Oyj received a total number of 2,289 Outotec shares (2018: 30,623) as part of the share-based incentive program (including in short-term employee benefits), of which CEO received 341 Outotec shares (2018: 13,331).
There are no special pension arrangements for key management, instead pension arrangements are according to normal legislation.
Number of personnel 2019 2018Average number of personnel for the period 133 139Personnel at December 31 126 126
6. AUDITORS' FEES EUR million 2019 2018
Audit -0.3 -0.2Other services -1.3 -0.2
-1.6 -0.4
86 PARENT COMPANY FINANCIAL STATEMENTS, FAS
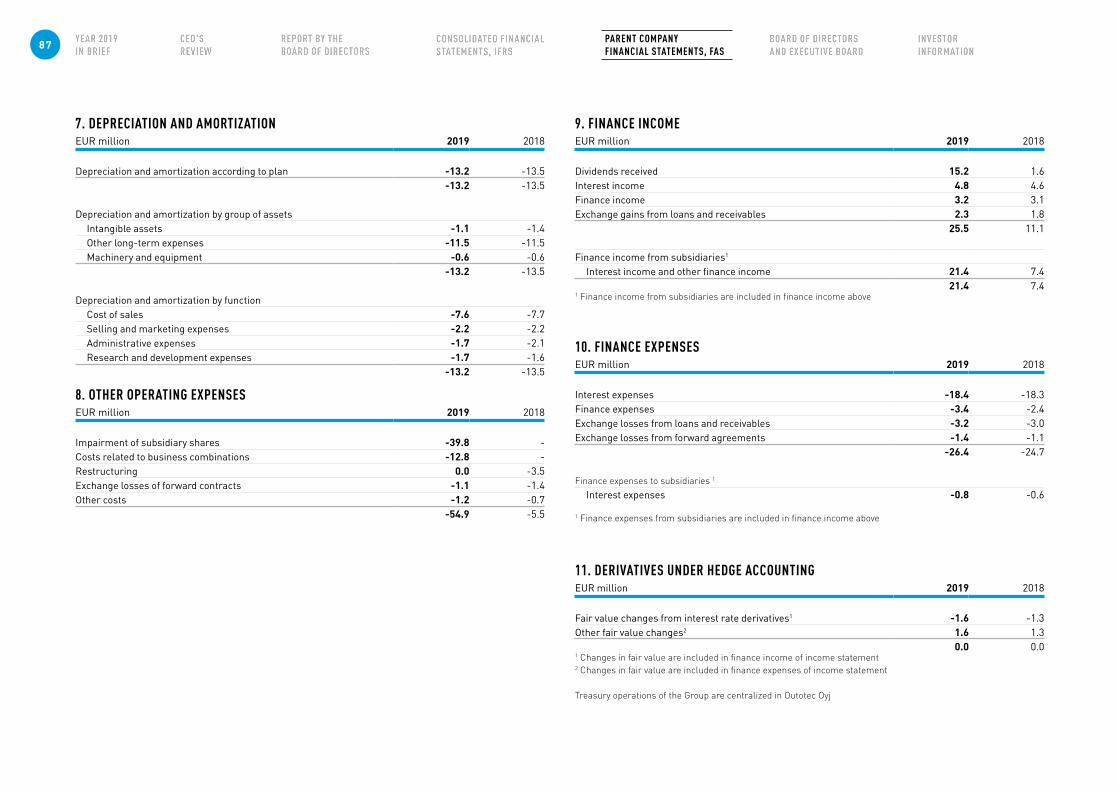
8. OTHER OPERATING EXPENSES EUR million 2019 2018
Impairment of subsidiary shares -39.8 -Costs related to business combinations -12.8 -Restructuring 0.0 -3.5Exchange losses of forward contracts -1.1 -1.4Other costs -1.2 -0.7
-54.9 -5.5
9. FINANCE INCOME EUR million 2019 2018
Dividends received 15.2 1.6Interest income 4.8 4.6Finance income 3.2 3.1Exchange gains from loans and receivables 2.3 1.8
25.5 11.1
Finance income from subsidiaries1
Interest income and other finance income 21.4 7.421.4 7.4
1 Finance income from subsidiaries are included in finance income above
10. FINANCE EXPENSESEUR million 2019 2018
Interest expenses -18.4 -18.3Finance expenses -3.4 -2.4Exchange losses from loans and receivables -3.2 -3.0Exchange losses from forward agreements -1.4 -1.1
-26.4 -24.7
Finance expenses to subsidiaries 1
Interest expenses -0.8 -0.6
1 Finance expenses from subsidiaries are included in finance income above
11. DERIVATIVES UNDER HEDGE ACCOUNTINGEUR million 2019 2018
Fair value changes from interest rate derivatives1 -1.6 -1.3Other fair value changes2 1.6 1.3
0.0 0.01 Changes in fair value are included in finance income of income statement 2 Changes in fair value are included in finance expenses of income statement
Treasury operations of the Group are centralized in Outotec Oyj
7. DEPRECIATION AND AMORTIZATIONEUR million 2019 2018
Depreciation and amortization according to plan -13.2 -13.5-13.2 -13.5
Depreciation and amortization by group of assetsIntangible assets -1.1 -1.4Other long-term expenses -11.5 -11.5Machinery and equipment -0.6 -0.6
-13.2 -13.5
Depreciation and amortization by functionCost of sales -7.6 -7.7Selling and marketing expenses -2.2 -2.2Administrative expenses -1.7 -2.1Research and development expenses -1.7 -1.6
-13.2 -13.5
87 PARENT COMPANY FINANCIAL STATEMENTS, FAS
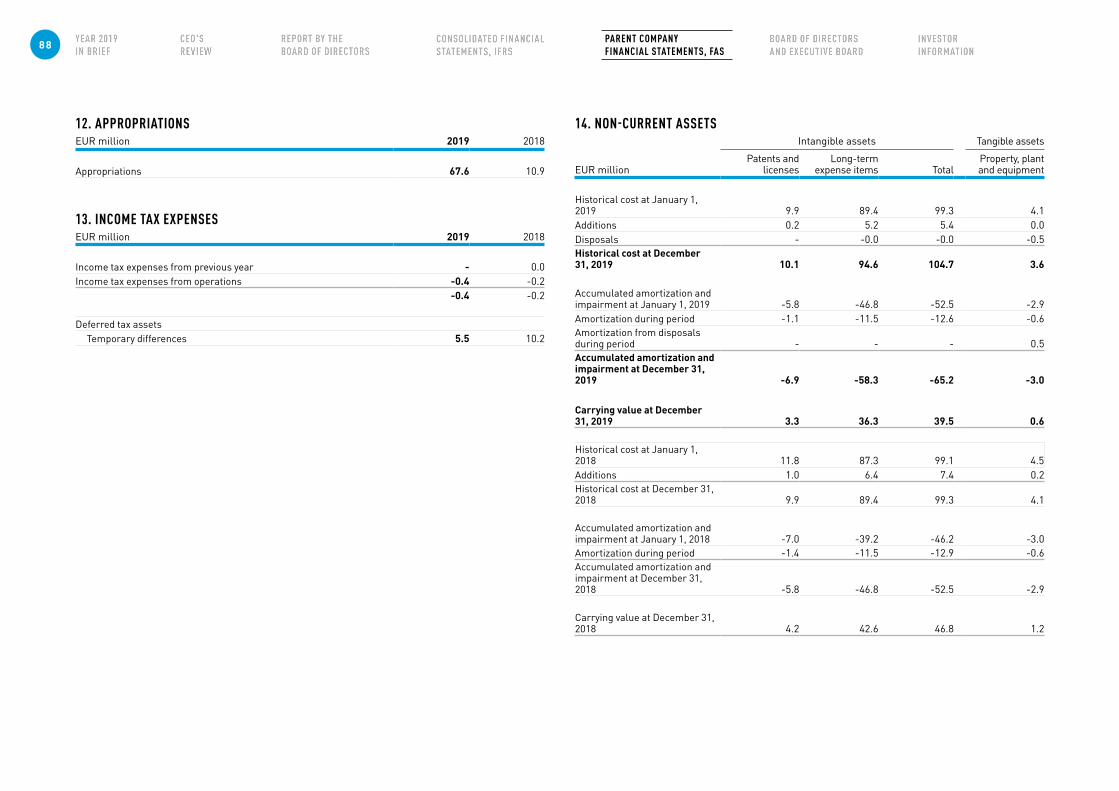
12. APPROPRIATIONSEUR million 2019 2018
Appropriations 67.6 10.9
13. INCOME TAX EXPENSESEUR million 2019 2018
Income tax expenses from previous year - 0.0Income tax expenses from operations -0.4 -0.2
-0.4 -0.2
Deferred tax assets Temporary differences 5.5 10.2
14. NON-CURRENT ASSETSIntangible assets Tangible assets
EUR millionPatents and
licensesLong-term
expense items TotalProperty, plant and equipment
Historical cost at January 1, 2019 9.9 89.4 99.3 4.1Additions 0.2 5.2 5.4 0.0Disposals - -0.0 -0.0 -0.5Historical cost at December 31, 2019 10.1 94.6 104.7 3.6
Accumulated amortization andimpairment at January 1, 2019 -5.8 -46.8 -52.5 -2.9Amortization during period -1.1 -11.5 -12.6 -0.6Amortization from disposals during period - - - 0.5Accumulated amortization andimpairment at December 31, 2019 -6.9 -58.3 -65.2 -3.0
Carrying value at December 31, 2019 3.3 36.3 39.5 0.6
Historical cost at January 1, 2018 11.8 87.3 99.1 4.5Additions 1.0 6.4 7.4 0.2Historical cost at December 31, 2018 9.9 89.4 99.3 4.1
Accumulated amortization andimpairment at January 1, 2018 -7.0 -39.2 -46.2 -3.0Amortization during period -1.4 -11.5 -12.9 -0.6Accumulated amortization andimpairment at December 31, 2018 -5.8 -46.8 -52.5 -2.9
Carrying value at December 31, 2018 4.2 42.6 46.8 1.2
88 PARENT COMPANY FINANCIAL STATEMENTS, FAS
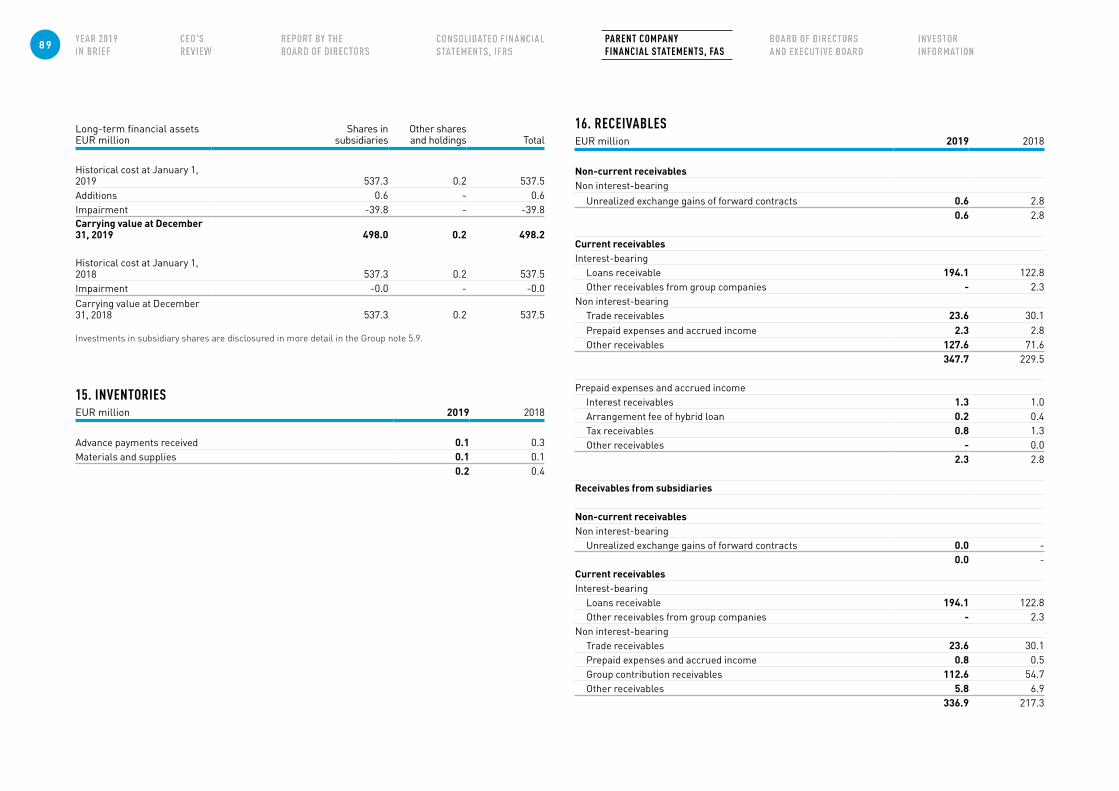
Long-term financial assetsEUR million
Shares in subsidiaries
Other shares and holdings Total
Historical cost at January 1, 2019 537.3 0.2 537.5Additions 0.6 - 0.6Impairment -39.8 - -39.8Carrying value at December 31, 2019 498.0 0.2 498.2
Historical cost at January 1, 2018 537.3 0.2 537.5Impairment -0.0 - -0.0Carrying value at December 31, 2018 537.3 0.2 537.5
Investments in subsidiary shares are disclosured in more detail in the Group note 5.9.
15. INVENTORIESEUR million 2019 2018
Advance payments received 0.1 0.3Materials and supplies 0.1 0.1
0.2 0.4
16. RECEIVABLES EUR million 2019 2018
Non-current receivablesNon interest-bearing
Unrealized exchange gains of forward contracts 0.6 2.80.6 2.8
Current receivablesInterest-bearing
Loans receivable 194.1 122.8Other receivables from group companies - 2.3
Non interest-bearingTrade receivables 23.6 30.1Prepaid expenses and accrued income 2.3 2.8Other receivables 127.6 71.6
347.7 229.5
Prepaid expenses and accrued incomeInterest receivables 1.3 1.0Arrangement fee of hybrid loan 0.2 0.4Tax receivables 0.8 1.3Other receivables - 0.0
2.3 2.8
Receivables from subsidiaries
Non-current receivablesNon interest-bearing
Unrealized exchange gains of forward contracts 0.0 -0.0 -
Current receivablesInterest-bearing
Loans receivable 194.1 122.8Other receivables from group companies - 2.3
Non interest-bearingTrade receivables 23.6 30.1Prepaid expenses and accrued income 0.8 0.5Group contribution receivables 112.6 54.7Other receivables 5.8 6.9
336.9 217.3
89 PARENT COMPANY FINANCIAL STATEMENTS, FAS
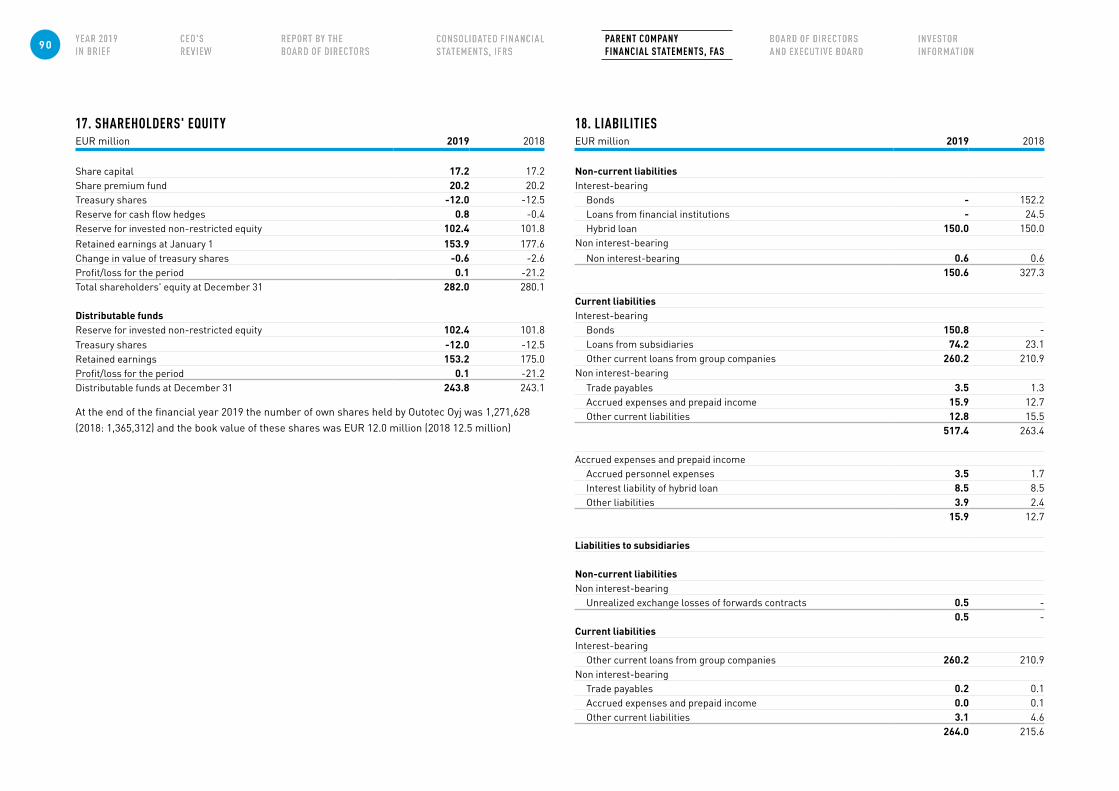
17. SHAREHOLDERS' EQUITYEUR million 2019 2018
Share capital 17.2 17.2Share premium fund 20.2 20.2Treasury shares -12.0 -12.5Reserve for cash flow hedges 0.8 -0.4Reserve for invested non-restricted equity 102.4 101.8Retained earnings at January 1 153.9 177.6Change in value of treasury shares -0.6 -2.6Profit/loss for the period 0.1 -21.2Total shareholders' equity at December 31 282.0 280.1
Distributable funds Reserve for invested non-restricted equity 102.4 101.8Treasury shares -12.0 -12.5Retained earnings 153.2 175.0Profit/loss for the period 0.1 -21.2Distributable funds at December 31 243.8 243.1
18. LIABILITIESEUR million 2019 2018
Non-current liabilitiesInterest-bearing
Bonds - 152.2Loans from financial institutions - 24.5Hybrid loan 150.0 150.0
Non interest-bearingNon interest-bearing 0.6 0.6
150.6 327.3
Current liabilitiesInterest-bearing
Bonds 150.8 -Loans from subsidiaries 74.2 23.1Other current loans from group companies 260.2 210.9
Non interest-bearingTrade payables 3.5 1.3Accrued expenses and prepaid income 15.9 12.7Other current liabilities 12.8 15.5
517.4 263.4
Accrued expenses and prepaid incomeAccrued personnel expenses 3.5 1.7Interest liability of hybrid loan 8.5 8.5Other liabilities 3.9 2.4
15.9 12.7
Liabilities to subsidiaries
Non-current liabilitiesNon interest-bearing
Unrealized exchange losses of forwards contracts 0.5 -0.5 -
Current liabilitiesInterest-bearing
Other current loans from group companies 260.2 210.9Non interest-bearing
Trade payables 0.2 0.1Accrued expenses and prepaid income 0.0 0.1Other current liabilities 3.1 4.6
264.0 215.6
At the end of the financial year 2019 the number of own shares held by Outotec Oyj was 1,271,628 (2018: 1,365,312) and the book value of these shares was EUR 12.0 million (2018 12.5 million)
90 PARENT COMPANY FINANCIAL STATEMENTS, FAS
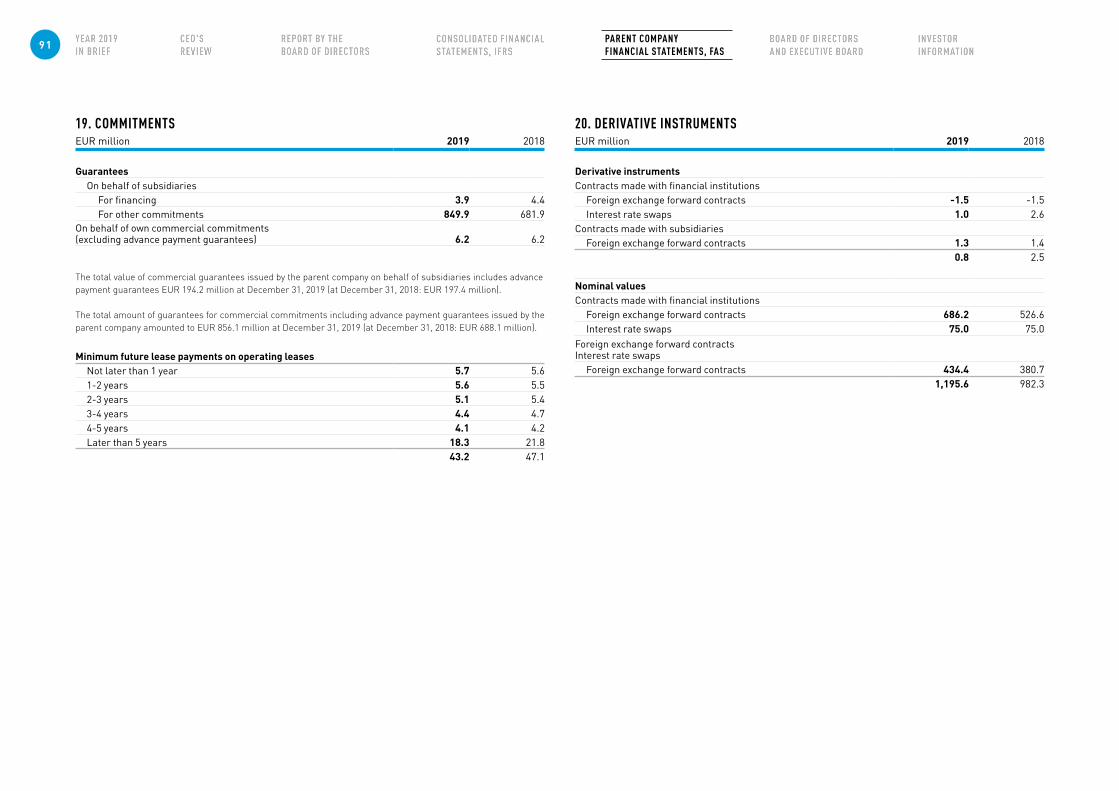
19. COMMITMENTS EUR million 2019 2018
Guarantees On behalf of subsidiaries
For financing 3.9 4.4For other commitments 849.9 681.9
On behalf of own commercial commitments(excluding advance payment guarantees) 6.2 6.2
The total value of commercial guarantees issued by the parent company on behalf of subsidiaries includes advance payment guarantees EUR 194.2 million at December 31, 2019 (at December 31, 2018: EUR 197.4 million).
The total amount of guarantees for commercial commitments including advance payment guarantees issued by the parent company amounted to EUR 856.1 million at December 31, 2019 (at December 31, 2018: EUR 688.1 million).
Minimum future lease payments on operating leases Not later than 1 year 5.7 5.61-2 years 5.6 5.52-3 years 5.1 5.43-4 years 4.4 4.74-5 years 4.1 4.2Later than 5 years 18.3 21.8
43.2 47.1
20. DERIVATIVE INSTRUMENTSEUR million 2019 2018
Derivative instrumentsContracts made with financial institutions
Foreign exchange forward contracts -1.5 -1.5Interest rate swaps 1.0 2.6
Contracts made with subsidiariesForeign exchange forward contracts 1.3 1.4
0.8 2.5
Nominal valuesContracts made with financial institutions
Foreign exchange forward contracts 686.2 526.6Interest rate swaps 75.0 75.0
Foreign exchange forward contractsInterest rate swaps
Foreign exchange forward contracts 434.4 380.71,195.6 982.3
91 PARENT COMPANY FINANCIAL STATEMENTS, FAS
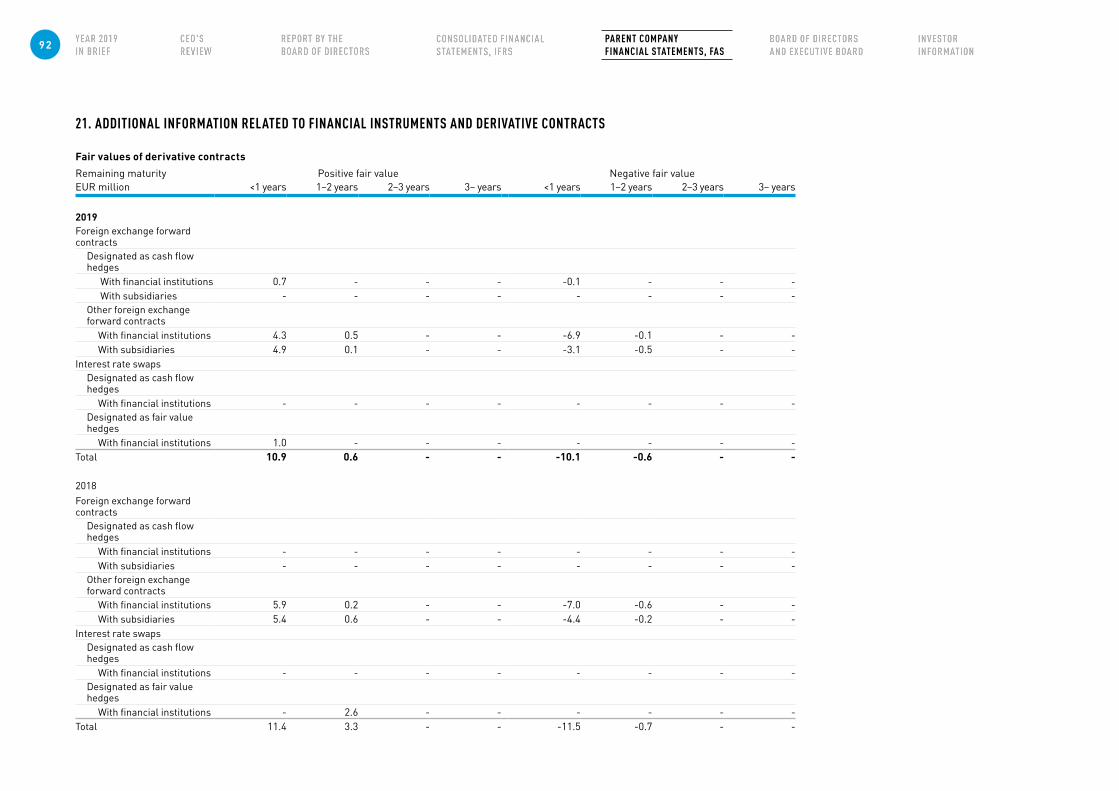
21. ADDITIONAL INFORMATION RELATED TO FINANCIAL INSTRUMENTS AND DERIVATIVE CONTRACTS
Fair values of derivative contractsRemaining maturity Positive fair value Negative fair valueEUR million <1 years 1–2 years 2–3 years 3– years <1 years 1–2 years 2–3 years 3– years
2019Foreign exchange forward contracts
Designated as cash flow hedges
With financial institutions 0.7 - - - -0.1 - - - With subsidiaries - - - - - - - -
Other foreign exchange forward contracts
With financial institutions 4.3 0.5 - - -6.9 -0.1 - -With subsidiaries 4.9 0.1 - - -3.1 -0.5 - -
Interest rate swapsDesignated as cash flow hedges
With financial institutions - - - - - - - -Designated as fair value hedges
With financial institutions 1.0 - - - - - - -Total 10.9 0.6 - - -10.1 -0.6 - -
2018Foreign exchange forward contracts
Designated as cash flow hedges
With financial institutions - - - - - - - -With subsidiaries - - - - - - - -
Other foreign exchange forward contracts
With financial institutions 5.9 0.2 - - -7.0 -0.6 - -With subsidiaries 5.4 0.6 - - -4.4 -0.2 - -
Interest rate swapsDesignated as cash flow hedges
With financial institutions - - - - - - - -Designated as fair value hedges
With financial institutions - 2.6 - - - - - -Total 11.4 3.3 - - -11.5 -0.7 - -
92 PARENT COMPANY FINANCIAL STATEMENTS, FAS
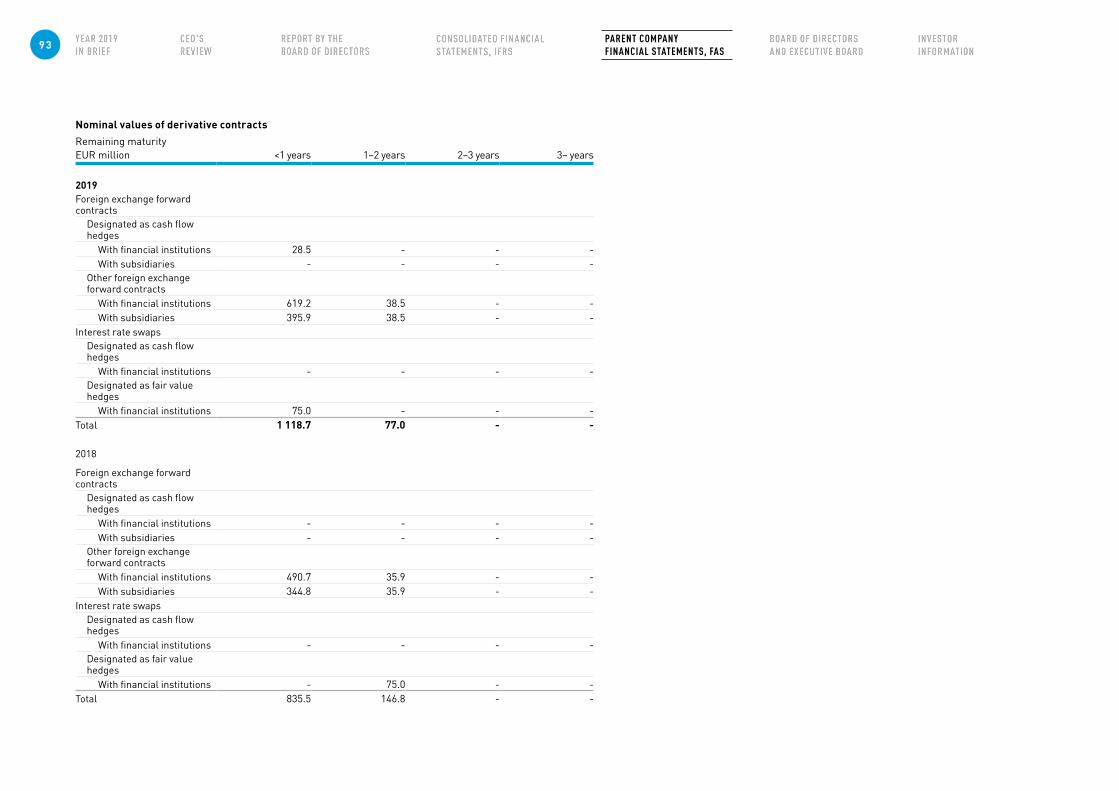
Nominal values of derivative contractsRemaining maturityEUR million <1 years 1–2 years 2–3 years 3– years
2019Foreign exchange forward contracts
Designated as cash flow hedges
With financial institutions 28.5 - - -With subsidiaries - - - -
Other foreign exchange forward contracts
With financial institutions 619.2 38.5 - -With subsidiaries 395.9 38.5 - -
Interest rate swapsDesignated as cash flow hedges
With financial institutions - - - -Designated as fair value hedges
With financial institutions 75.0 - - -Total 1 118.7 77.0 - -
2018
Foreign exchange forward contracts
Designated as cash flow hedges
With financial institutions - - - -With subsidiaries - - - -
Other foreign exchange forward contracts
With financial institutions 490.7 35.9 - -With subsidiaries 344.8 35.9 - -
Interest rate swapsDesignated as cash flow hedges
With financial institutions - - - -Designated as fair value hedges
With financial institutions - 75.0 - -Total 835.5 146.8 - -
93 PARENT COMPANY FINANCIAL STATEMENTS, FAS
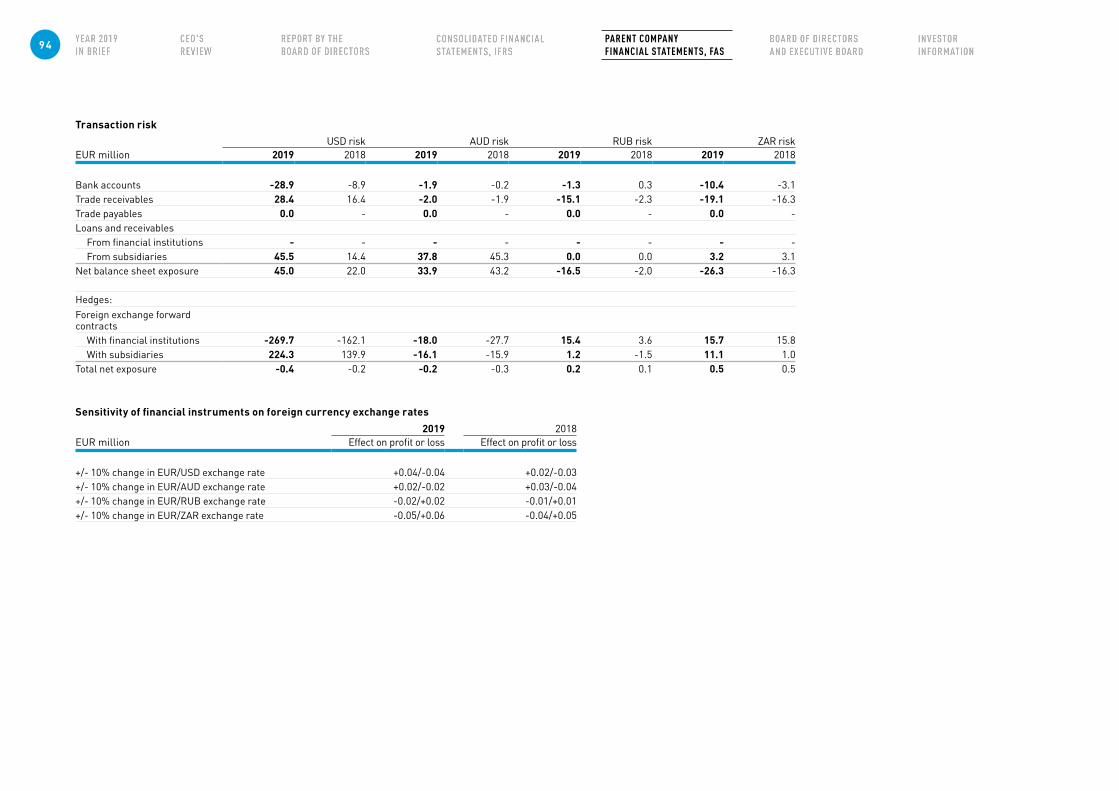
Transaction riskUSD risk AUD risk RUB risk ZAR risk
EUR million 2019 2018 2019 2018 2019 2018 2019 2018
Bank accounts -28.9 -8.9 -1.9 -0.2 -1.3 0.3 -10.4 -3.1Trade receivables 28.4 16.4 -2.0 -1.9 -15.1 -2.3 -19.1 -16.3Trade payables 0.0 - 0.0 - 0.0 - 0.0 -Loans and receivables
From financial institutions - - - - - - - -From subsidiaries 45.5 14.4 37.8 45.3 0.0 0.0 3.2 3.1
Net balance sheet exposure 45.0 22.0 33.9 43.2 -16.5 -2.0 -26.3 -16.3
Hedges:Foreign exchange forward contracts
With financial institutions -269.7 -162.1 -18.0 -27.7 15.4 3.6 15.7 15.8With subsidiaries 224.3 139.9 -16.1 -15.9 1.2 -1.5 11.1 1.0
Total net exposure -0.4 -0.2 -0.2 -0.3 0.2 0.1 0.5 0.5
Sensitivity of financial instruments on foreign currency exchange rates2019 2018
EUR million Effect on profit or loss Effect on profit or loss
+/- 10% change in EUR/USD exchange rate +0.04/-0.04 +0.02/-0.03+/- 10% change in EUR/AUD exchange rate +0.02/-0.02 +0.03/-0.04+/- 10% change in EUR/RUB exchange rate -0.02/+0.02 -0.01/+0.01+/- 10% change in EUR/ZAR exchange rate -0.05/+0.06 -0.04/+0.05
94 PARENT COMPANY FINANCIAL STATEMENTS, FAS
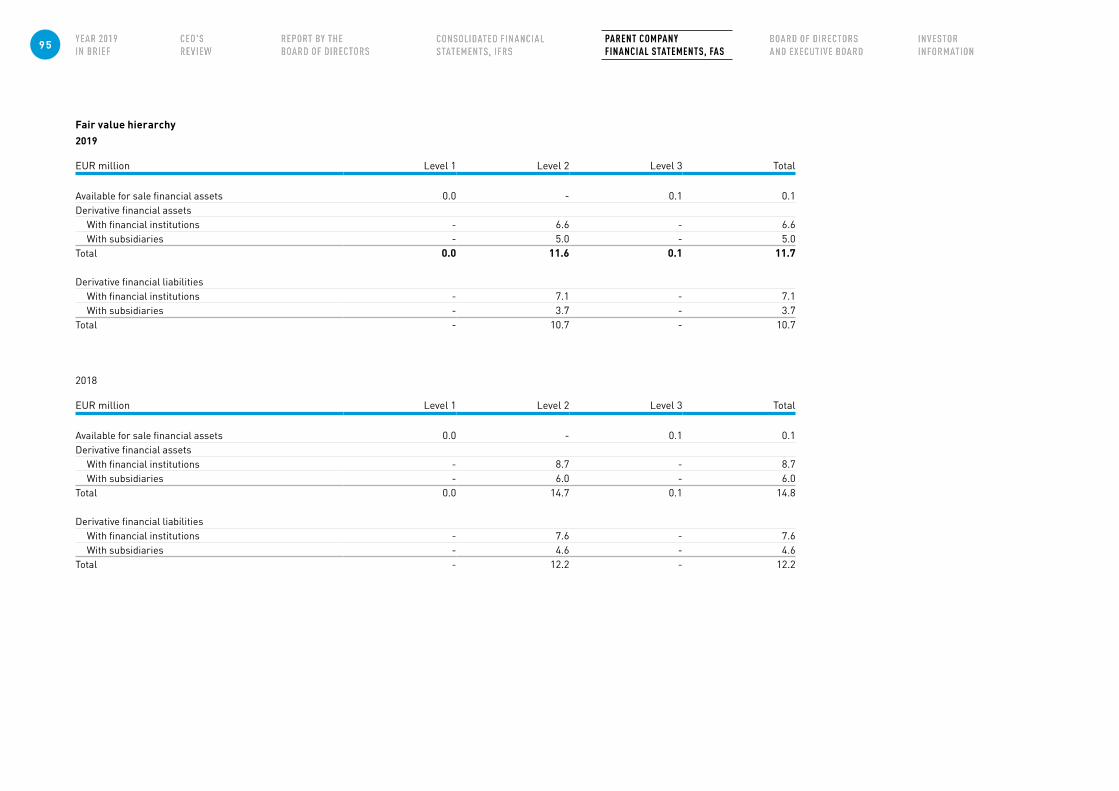
Fair value hierarchy2019
EUR million Level 1 Level 2 Level 3 Total
Available for sale financial assets 0.0 - 0.1 0.1Derivative financial assets
With financial institutions - 6.6 - 6.6With subsidiaries - 5.0 - 5.0
Total 0.0 11.6 0.1 11.7
Derivative financial liabilitiesWith financial institutions - 7.1 - 7.1With subsidiaries - 3.7 - 3.7
Total - 10.7 - 10.7
2018
EUR million Level 1 Level 2 Level 3 Total
Available for sale financial assets 0.0 - 0.1 0.1Derivative financial assets
With financial institutions - 8.7 - 8.7With subsidiaries - 6.0 - 6.0
Total 0.0 14.7 0.1 14.8
Derivative financial liabilitiesWith financial institutions - 7.6 - 7.6With subsidiaries - 4.6 - 4.6
Total - 12.2 - 12.2
95 PARENT COMPANY FINANCIAL STATEMENTS, FAS

Fair values of financial assets and liabilities
2019
EUR million
Financial assets at fair value through
profit or lossAvailable-for-sale
financial assets
Financial liabilities at fair value through
profit or lossDerivatives under hedge accounting
Carrying amounts by balance sheet item Fair value
Non-current financial assetsDerivative assets
Foreign exchange forward contractsWith financial institutions 0.5 - - - 0.5 0.5With subsidiaries 0.1 - - - 0.1 0.1
Interest rate swapsWith financial institutions - - - - 0.0 0.0
Other share and securitites - 0.1 - - 0.1 0.1Current financial assetsDerivative assets
Foreign exchange forward contractsWith financial institutions 4.3 - - 0.7 5.0 5.0With subsidiaries 4.9 - - - 4.9 4.9
Interest rate swapsWith financial institutions - - - 1.0 1.0 1.0
Carrying amount by category 9.8 0.1 - 1.7 11.7 11.7
Non-current financial liabilitiesDerivative liabilities
Foreign exchange forward contractsWith financial institutions - - 0.1 - 0.1 0.1With subsidiaries - - 0.5 - 0.5 0.5
Interest rate swapsWith financial institutions - - - - - -
Lyhytaikaiset rahoitusvelatDerivative liabilities
Foreign exchange forward contractsWith financial institutions - - 6.9 0.1 7.0 7.0With subsidiaries - - 3.1 - 3.1 3.1
Interest rate swapsWith financial institutions - - - - 0.0 0.0
Carrying amount by category - - 10.7 0.1 10.7 10.7
96 PARENT COMPANY FINANCIAL STATEMENTS, FAS
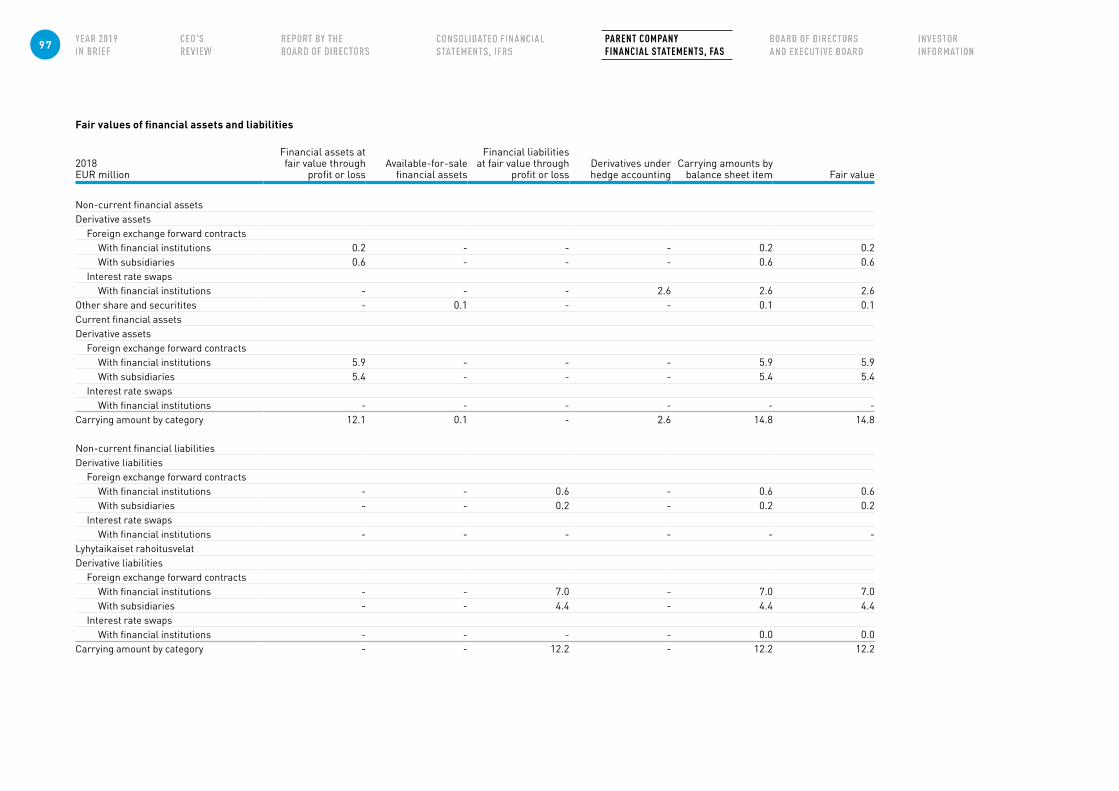
Fair values of financial assets and liabilities
2018EUR million
Financial assets at fair value through
profit or lossAvailable-for-sale
financial assets
Financial liabilities at fair value through
profit or lossDerivatives under hedge accounting
Carrying amounts by balance sheet item Fair value
Non-current financial assetsDerivative assets
Foreign exchange forward contractsWith financial institutions 0.2 - - - 0.2 0.2With subsidiaries 0.6 - - - 0.6 0.6
Interest rate swapsWith financial institutions - - - 2.6 2.6 2.6
Other share and securitites - 0.1 - - 0.1 0.1Current financial assetsDerivative assets
Foreign exchange forward contractsWith financial institutions 5.9 - - - 5.9 5.9With subsidiaries 5.4 - - - 5.4 5.4
Interest rate swapsWith financial institutions - - - - - -
Carrying amount by category 12.1 0.1 - 2.6 14.8 14.8
Non-current financial liabilitiesDerivative liabilities
Foreign exchange forward contractsWith financial institutions - - 0.6 - 0.6 0.6With subsidiaries - - 0.2 - 0.2 0.2
Interest rate swapsWith financial institutions - - - - - -
Lyhytaikaiset rahoitusvelatDerivative liabilities
Foreign exchange forward contractsWith financial institutions - - 7.0 - 7.0 7.0With subsidiaries - - 4.4 - 4.4 4.4
Interest rate swapsWith financial institutions - - - - 0.0 0.0
Carrying amount by category - - 12.2 - 12.2 12.2
97 PARENT COMPANY FINANCIAL STATEMENTS, FAS
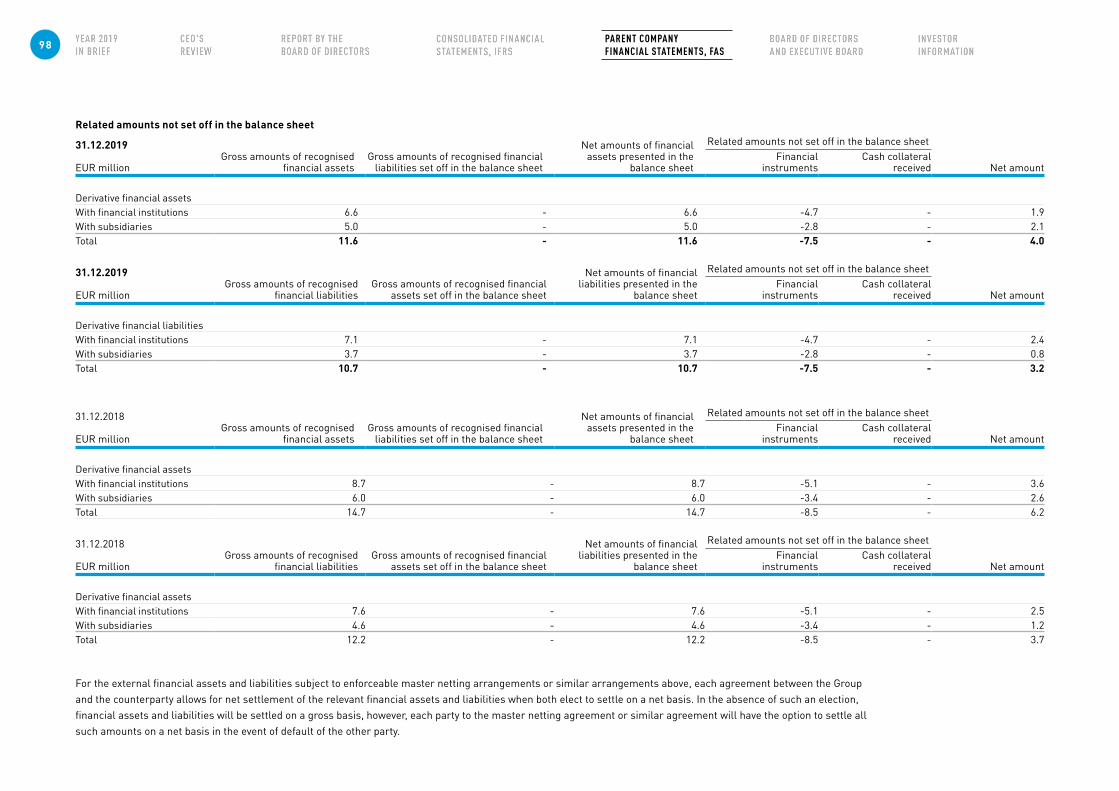
Related amounts not set off in the balance sheet
31.12.2019
EUR millionGross amounts of recognised
financial assetsGross amounts of recognised financial
liabilities set off in the balance sheet
Net amounts of financial assets presented in the
balance sheet
Related amounts not set off in the balance sheet
Net amountFinancial
instrumentsCash collateral
received
Derivative financial assets With financial institutions 6.6 - 6.6 -4.7 - 1.9With subsidiaries 5.0 - 5.0 -2.8 - 2.1Total 11.6 - 11.6 -7.5 - 4.0
31.12.2019
EUR millionGross amounts of recognised
financial liabilitiesGross amounts of recognised financial
assets set off in the balance sheet
Net amounts of financial liabilities presented in the
balance sheet
Related amounts not set off in the balance sheet
Net amountFinancial
instrumentsCash collateral
received
Derivative financial liabilitiesWith financial institutions 7.1 - 7.1 -4.7 - 2.4With subsidiaries 3.7 - 3.7 -2.8 - 0.8Total 10.7 - 10.7 -7.5 - 3.2
31.12.2018
EUR millionGross amounts of recognised
financial assetsGross amounts of recognised financial
liabilities set off in the balance sheet
Net amounts of financial assets presented in the
balance sheet
Related amounts not set off in the balance sheet
Net amountFinancial
instrumentsCash collateral
received
Derivative financial assets With financial institutions 8.7 - 8.7 -5.1 - 3.6With subsidiaries 6.0 - 6.0 -3.4 - 2.6Total 14.7 - 14.7 -8.5 - 6.2
31.12.2018
EUR millionGross amounts of recognised
financial liabilitiesGross amounts of recognised financial
assets set off in the balance sheet
Net amounts of financial liabilities presented in the
balance sheet
Related amounts not set off in the balance sheet
Net amountFinancial
instrumentsCash collateral
received
Derivative financial assets With financial institutions 7.6 - 7.6 -5.1 - 2.5With subsidiaries 4.6 - 4.6 -3.4 - 1.2Total 12.2 - 12.2 -8.5 - 3.7
For the external financial assets and liabilities subject to enforceable master netting arrangements or similar arrangements above, each agreement between the Group and the counterparty allows for net settlement of the relevant financial assets and liabilities when both elect to settle on a net basis. In the absence of such an election, financial assets and liabilities will be settled on a gross basis, however, each party to the master netting agreement or similar agreement will have the option to settle all such amounts on a net basis in the event of default of the other party.
98 PARENT COMPANY FINANCIAL STATEMENTS, FAS
SIGNATURES OF THE FINANCIAL STATEMENTS AND REPORT BY THE BOARD OF DIRECTORSEspoo, February 6, 2020
Matti Alahuhta Anu Hämäläinen Patrik NolåkerChairman of the Board of Directors Member of the Board of Directors Member of the Board of Directors
Ian W. Pearce Anja Korhonen Teija SarajärviVice Chairman of the Board of Directors Member of the Board of Directors Member of the Board of Directors
Klaus Cawén Hanne de Mora Markku TeräsvasaraMember of the Board of Directors Member of the Board of Directors President & CEOoimitusjoh
AUDITOR'S NOTESThe Auditor’s note A report on the audit performed has been issued today.
Helsinki, February 14, 2020
PricewaterhouseCoopersAuthorised Public Accountants
Pasi KarppinenAuthorised Public Accountant
99 PARENT COMPANY FINANCIAL STATEMENTS, FAS
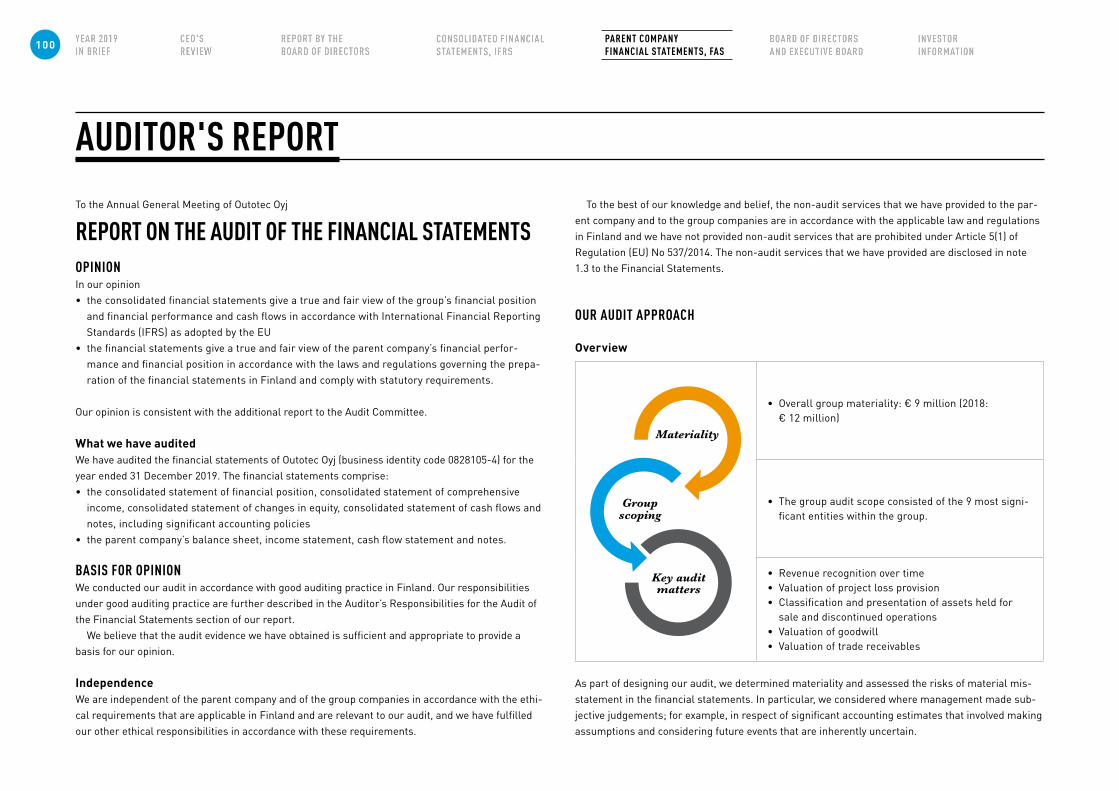
AUDITOR'S REPORTTo the Annual General Meeting of Outotec Oyj
REPORT ON THE AUDIT OF THE FINANCIAL STATEMENTS OPINION In our opinion • the consolidated financial statements give a true and fair view of the group’s financial position
and financial performance and cash flows in accordance with International Financial Reporting Standards (IFRS) as adopted by the EU
• the financial statements give a true and fair view of the parent company’s financial perfor-mance and financial position in accordance with the laws and regulations governing the prepa-ration of the financial statements in Finland and comply with statutory requirements.
Our opinion is consistent with the additional report to the Audit Committee.
What we have auditedWe have audited the financial statements of Outotec Oyj (business identity code 0828105-4) for the year ended 31 December 2019. The financial statements comprise:• the consolidated statement of financial position, consolidated statement of comprehensive
income, consolidated statement of changes in equity, consolidated statement of cash flows and notes, including significant accounting policies
• the parent company’s balance sheet, income statement, cash flow statement and notes.
BASIS FOR OPINION We conducted our audit in accordance with good auditing practice in Finland. Our responsibilities under good auditing practice are further described in the Auditor’s Responsibilities for the Audit of the Financial Statements section of our report.
We believe that the audit evidence we have obtained is sufficient and appropriate to provide a basis for our opinion.
IndependenceWe are independent of the parent company and of the group companies in accordance with the ethi-cal requirements that are applicable in Finland and are relevant to our audit, and we have fulfilled our other ethical responsibilities in accordance with these requirements.
To the best of our knowledge and belief, the non-audit services that we have provided to the par-ent company and to the group companies are in accordance with the applicable law and regulations in Finland and we have not provided non-audit services that are prohibited under Article 5(1) of Regulation (EU) No 537/2014. The non-audit services that we have provided are disclosed in note 1.3 to the Financial Statements.
OUR AUDIT APPROACH
Overview
• Overall group materiality: € 9 million (2018: € 12 million)
• The group audit scope consisted of the 9 most signi-ficant entities within the group.
• Revenue recognition over time• Valuation of project loss provision• Classification and presentation of assets held for
sale and discontinued operations• Valuation of goodwill• Valuation of trade receivables
As part of designing our audit, we determined materiality and assessed the risks of material mis-statement in the financial statements. In particular, we considered where management made sub-jective judgements; for example, in respect of significant accounting estimates that involved making assumptions and considering future events that are inherently uncertain.
100 PARENT COMPANY FINANCIAL STATEMENTS, FAS
MaterialityThe scope of our audit was influenced by our application of materiality. An audit is designed to ob-tain reasonable assurance whether the financial statements are free from material misstatement. Misstatements may arise due to fraud or error. They are considered material if individually or in aggregate, they could reasonably be expected to influence the economic decisions of users taken on the basis of the financial statements.
Based on our professional judgement, we determined certain quantitative thresholds for materi-ality, including the overall group materiality for the consolidated financial statements as set out in the table below. These, together with qualitative considerations, helped us to determine the scope of our audit and the nature, timing and extent of our audit procedures and to evaluate the effect of misstatements on the financial statements as a whole.
Overall group materiality € 9 million (2018: € 12 million)
How we determined it We used the 0,75% of total sales to determine overall group materiality.
Rationale for the material-ity benchmark applied
We assessed for Outotec the suitability of the commonly ac-cepted benchmarks for the determination of materiality. Due to the volatility in profitability of the company, we determined that total sales provide a suitable representation of the magnitude of Outotec’s operations. The percentage applied is within the com-monly accepted range as set out in relevant auditing standards.
How we tailored our group audit scopeWe tailored the scope of our audit, taking into account the structure of the group, the accounting processes and controls, and the industry in which the group operates.
We determined the type of work that needed to be performed at group companies by us, as the group engagement team, or by auditors from other PwC networks firms operating under our instructions. Audit procedures were performed in group companies which are considered significant either because of their individual financial significance or due to their specific nature, covering the majority of sales, assets and liabilities of the Group. We also performed additional specified proce-dures as well as analytical procedures at the group-level.
KEY AUDIT MATTERS Key audit matters are those matters that, in our professional judgment, were of most significance in our audit of the financial statements of the current period. These matters were addressed in the context of our audit of the financial statements as a whole, and in forming our opinion thereon, and we do not provide a separate opinion on these matters.
As in all of our audits, we also addressed the risk of management override of internal controls, including among other matters consideration of whether there was evidence of bias that represent-ed a risk of material misstatement due to fraud.
101 PARENT COMPANY FINANCIAL STATEMENTS, FAS

Key audit matter in the audit of the group
How our audit addressed the key audit matter
Revenue recognition over timeRefer to notes 1.2 and 2.2 in the consolidated financial statements
A significant portion of the company’s sales is recognized over time. As described in the accounting principles to the consolidated financial statements, the stage of completion of a project is measured by using the cost-to-cost method under which the stage of completion is defined as the ratio of costs incurred to total estimated costs.
Appropriate timing of revenue recognition is dependent on estimates regarding anticipated contract revenues and expenses. There is a risk that these estimates are incorrect and hence contract revenue is incorrectly recognized across reporting periods.
This risk is emphasized when the company delivers new types of technical solutions or applications, for which there is no extensive past experience. The risk is also emphasized in comprehensive plant deliveries, where the company is responsible for construction of the plant in addition to the process technology.
Due to the significance of revenue recogni-tion over time and the aforementioned risks that affect appropriate recognition of revenue across accounting periods, it is considered a key audit matter.
This matter is a significant risk of material misstatement referred to in Article 10(2c) of Regulation (EU) No 537/2014.
We tested the company’s key internal controls in processes that affect revenue recognition over time. In addition to processes and con-trols, we focused on detailed audit procedures relating to the accounting treatment of indi-vidual contracts. As part of the procedures we:
• tested the IT-system configurations for percentage of completion calculations.
• tested values used in the calculations against customer contracts
• obtained an understanding of key terms in customer contracts and assessed whether those have been taken into account cor-rectly in revenue recognition
• tested the approval process for setting up new projects in the system
• tested the risk assessment process for determining risk provision amounts
• assessed management estimates re-lating to projects with particular risk characteristics
• assessed the company’s ability to make reliable estimates by performing retros-pective analysis of past estimates of actual outcomes
Key audit matter in the audit of the group
How our audit addressed the key audit matter
Valuation of project loss provisionRefer to note 2.4 in the consolidated financial statements
We focused on this area because management has made a project loss provision that requires significant judgement in relation to the amount of additional costs relating to the ilmenite smelter project.
This matter is a significant risk of material misstatement referred to in Article 10(2c) of Regulation (EU) No 537/2014.
In response to the risk related to valuation of the provision and completeness of the related disclosures in the financial statements, we:• read external legal opinions from Outotec’s
legal advisor and assessed implications to the financial statements
• read the technical analyses prepared by internal and external experts that mana-gement has used in the estimation of the future costs
• discussed the case with management, and reviewed correspondence and other docu-ments exchanged between Outotec and the other parties involved
• read the minutes of the board meetings, and inspected the company’s legal expen-ses, in order to ensure that relevant risks have been identified
• evaluated the reasonableness of the as-sumptions applied by management in the calculation of the provision and verified that the disclosures are sufficient based on the evidence we have obtained from the above listed procedures
102 PARENT COMPANY FINANCIAL STATEMENTS, FAS
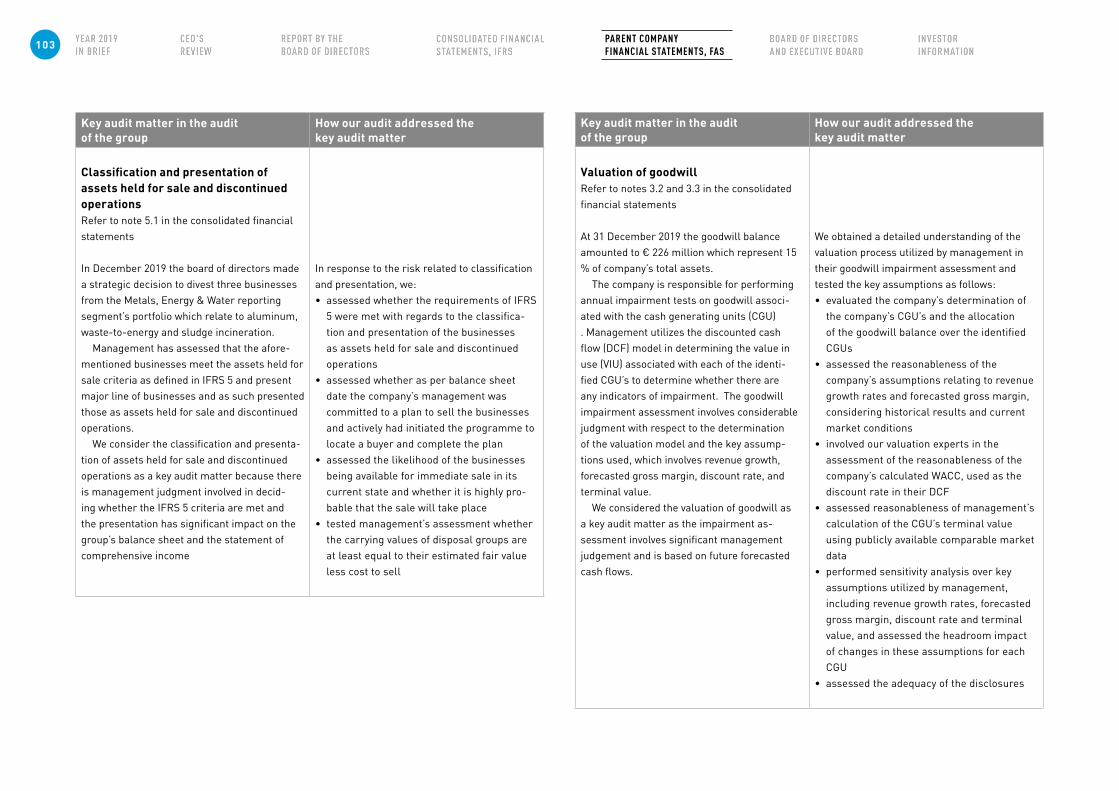
Key audit matter in the audit of the group
How our audit addressed the key audit matter
Classification and presentation of assets held for sale and discontinued operationsRefer to note 5.1 in the consolidated financial statements
In December 2019 the board of directors made a strategic decision to divest three businesses from the Metals, Energy & Water reporting segment’s portfolio which relate to aluminum, waste-to-energy and sludge incineration.
Management has assessed that the afore-mentioned businesses meet the assets held for sale criteria as defined in IFRS 5 and present major line of businesses and as such presented those as assets held for sale and discontinued operations.
We consider the classification and presenta-tion of assets held for sale and discontinued operations as a key audit matter because there is management judgment involved in decid-ing whether the IFRS 5 criteria are met and the presentation has significant impact on the group’s balance sheet and the statement of comprehensive income
In response to the risk related to classification and presentation, we:• assessed whether the requirements of IFRS
5 were met with regards to the classifica-tion and presentation of the businesses as assets held for sale and discontinued operations
• assessed whether as per balance sheet date the company’s management was committed to a plan to sell the businesses and actively had initiated the programme to locate a buyer and complete the plan
• assessed the likelihood of the businesses being available for immediate sale in its current state and whether it is highly pro-bable that the sale will take place
• tested management’s assessment whether the carrying values of disposal groups are at least equal to their estimated fair value less cost to sell
Key audit matter in the audit of the group
How our audit addressed the key audit matter
Valuation of goodwillRefer to notes 3.2 and 3.3 in the consolidated financial statements
At 31 December 2019 the goodwill balance amounted to € 226 million which represent 15 % of company’s total assets.
The company is responsible for performing annual impairment tests on goodwill associ-ated with the cash generating units (CGU) . Management utilizes the discounted cash flow (DCF) model in determining the value in use (VIU) associated with each of the identi-fied CGU’s to determine whether there are any indicators of impairment. The goodwill impairment assessment involves considerable judgment with respect to the determination of the valuation model and the key assump-tions used, which involves revenue growth, forecasted gross margin, discount rate, and terminal value.
We considered the valuation of goodwill as a key audit matter as the impairment as-sessment involves significant management judgement and is based on future forecasted cash flows.
We obtained a detailed understanding of the valuation process utilized by management in their goodwill impairment assessment and tested the key assumptions as follows:• evaluated the company’s determination of
the company’s CGU’s and the allocation of the goodwill balance over the identified CGUs
• assessed the reasonableness of the company’s assumptions relating to revenue growth rates and forecasted gross margin, considering historical results and current market conditions
• involved our valuation experts in the assessment of the reasonableness of the company’s calculated WACC, used as the discount rate in their DCF
• assessed reasonableness of management’s calculation of the CGU’s terminal value using publicly available comparable market data
• performed sensitivity analysis over key assumptions utilized by management, including revenue growth rates, forecasted gross margin, discount rate and terminal value, and assessed the headroom impact of changes in these assumptions for each CGU
• assessed the adequacy of the disclosures
103 PARENT COMPANY FINANCIAL STATEMENTS, FAS
Responsibilities of the Board of Directors and the Managing Director for the Financial StatementsThe Board of Directors and the Managing Director are responsible for the preparation of consoli-dated financial statements that give a true and fair view in accordance with International Financial Reporting Standards (IFRS) as adopted by the EU, and of financial statements that give a true and fair view in accordance with the laws and regulations governing the preparation of financial state-ments in Finland and comply with statutory requirements. The Board of Directors and the Managing Director are also responsible for such internal control as they determine is necessary to enable the preparation of financial statements that are free from material misstatement, whether due to fraud or error.
In preparing the financial statements, the Board of Directors and the Managing Director are re-sponsible for assessing the parent company’s and the group’s ability to continue as a going concern, disclosing, as applicable, matters relating to going concern and using the going concern basis of ac-counting. The financial statements are prepared using the going concern basis of accounting unless there is an intention to liquidate the parent company or the group or to cease operations, or there is no realistic alternative but to do so.
Auditor’s Responsibilities for the Audit of the Financial StatementsOur objectives are to obtain reasonable assurance about whether the financial statements as a whole are free from material misstatement, whether due to fraud or error, and to issue an audi-tor’s report that includes our opinion. Reasonable assurance is a high level of assurance, but is not a guarantee that an audit conducted in accordance with good auditing practice will always detect a material misstatement when it exists. Misstatements can arise from fraud or error and are consid-ered material if, individually or in the aggregate, they could reasonably be expected to influence the economic decisions of users taken on the basis of these financial statements.
As part of an audit in accordance with good auditing practice, we exercise professional judgment and maintain professional skepticism throughout the audit. We also:
• Identify and assess the risks of material misstatement of the financial statements, whether due to fraud or error, design and perform audit procedures responsive to those risks, and obtain audit evidence that is sufficient and appropriate to provide a basis for our opinion. The risk of not detecting a material misstatement resulting from fraud is higher than for one resulting from error, as fraud may involve collusion, forgery, intentional omissions, misrepresentations, or the override of internal control.
• Obtain an understanding of internal control relevant to the audit in order to design audit pro-cedures that are appropriate in the circumstances, but not for the purpose of expressing an opinion on the effectiveness of the parent company’s or the group’s internal control.
Key audit matter in the audit of the group
How our audit addressed the key audit matter
Valuation of trade receivablesRefer to note 2.2 in the consolidated financial statements
The company has significant trade receivables from a wide range of customers across the world. The customers include private and state actors in a number of industries.
Trade receivables include inherent risk of credit loss, in addition to which a significant portion of the receivables are aged, as dis-closed in note 2.2 to the financial statements. Significant aging is considered an indication of heightened risk of credit loss. The Group uses a simplified credit loss matrix, according to which a credit loss allowance is measured at an amount equal to the lifetime expected credit losses.
The company carries trade receivables at their anticipated realizable value, which is the original invoice amount less a valuation allow-ance for estimated credit losses.
Due to the significant amount of aged trade receivables and the estimation risk involved in their valuation, this is considered a key audit matter.
We obtained an understanding of the Com-pany’s process for monitoring receivables and recording credit loss allowance relating to receivables with risk of non-recoverability. We also performed audit procedures to assess the valuation of the company’s receivable portfolio at the balance sheet date. We:• analysed the trade receivables recorded in
the balance sheet and obtained evidence regarding the appropriate valuation of items with particular risk characteristics
• assessed management assessment of recoverability particularly for significant aged items by corroborating them against internal and external evidence regarding the likelihood of payment
• assessed the company’s ability to make reli-able estimates by performing retrospective analysis of past estimates
We have no key audit matters to report with respect to our audit of the parent company financial statements.
There are no significant risks of material misstatement referred to in Article 10(2c) of Regulation (EU) No 537/2014 with respect to the parent company financial statements.
104 PARENT COMPANY FINANCIAL STATEMENTS, FAS
• Evaluate the appropriateness of accounting policies used and the reasonableness of accounting esti-mates and related disclosures made by management.
• Conclude on the appropriateness of the Board of Directors’ and the Managing Director’s use of the going concern basis of accounting and based on the audit evidence obtained, whether a material uncertainty exists related to events or conditions that may cast significant doubt on the parent company’s or the group’s ability to continue as a going concern. If we conclude that a material uncertainty exists, we are required to draw attention in our auditor’s report to the related disclosures in the financial statements or, if such disclosures are inadequate, to modify our opinion. Our conclusions are based on the audit evidence obtained up to the date of our auditor’s report. However, future events or conditions may cause the parent company or the group to cease to continue as a going concern.
• Evaluate the overall presentation, structure and content of the financial statements, including the dis-closures, and whether the financial statements represent the underlying transactions and events so that the financial statements give a true and fair view.
• Obtain sufficient appropriate audit evidence regarding the financial information of the entities or busi-ness activities within the group to express an opinion on the consolidated financial statements. We are responsible for the direction, supervision and performance of the group audit. We remain solely respon-sible for our audit opinion.
We communicate with those charged with governance regarding, among other matters, the planned scope and timing of the audit and significant audit findings, including any significant deficiencies in internal control that we identify during our audit.
We also provide those charged with governance with a statement that we have complied with relevant ethi-cal requirements regarding independence, and to communicate with them all relationships and other matters that may reasonably be thought to bear on our independence, and where applicable, related safeguards.
From the matters communicated with those charged with governance, we determine those matters that were of most significance in the audit of the financial statements of the current period and are therefore the key audit matters. We describe these matters in our auditor’s report unless law or regulation precludes public disclosure about the matter or when, in extremely rare circumstances, we determine that a matter should not be communicated in our report because the adverse consequences of doing so would reasonably be expected to outweigh the public interest benefits of such communication.
OTHER REPORTING REQUIREMENTS AppointmentWe were first appointed as auditors by the annual general meeting on 23.3.2012. Our appointment represents a total period of uninterrupted engagement of 8 years.
Other Information The Board of Directors and the Managing Director are responsible for the other information. The other information comprises the all other sections than Consolidated Financial Statements and Parent Company Financial Statements and auditor’s report.
Our opinion on the financial statements does not cover the other information.
In connection with our audit of the financial statements, our responsibility is to read the other information and, in doing so, consider whether the other information is materially inconsistent with the financial statements or our knowledge obtained in the audit, or otherwise appears to be materi-ally misstated. With respect to the report of the Board of Directors, our responsibility also includes considering whether the report of the Board of Directors has been prepared in accordance with the applicable laws and regulations.
In our opinion• the information in the report of the Board of Directors is consistent with the information in the
financial statements• the report of the Board of Directors has been prepared in accordance with the applicable laws
and regulations.
If, based on the work we have performed, we conclude that there is a material misstatement of the other information, we are required to report that fact. We have nothing to report in this regard.
Helsinki 14 February 2020
PricewaterhouseCoopers OyAuthorised Public Accountants
Pasi KarppinenAuthorised Public Accountant (KHT)
105 PARENT COMPANY FINANCIAL STATEMENTS, FAS
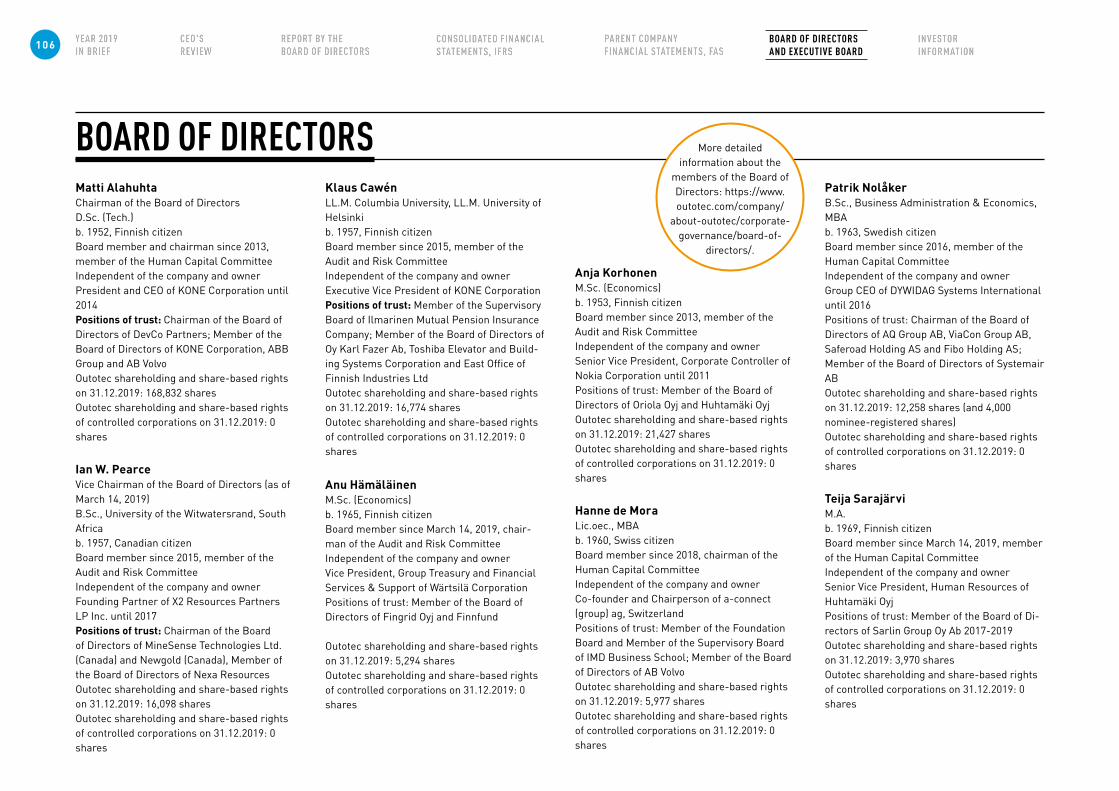
BOARD OF DIRECTORSMatti AlahuhtaChairman of the Board of DirectorsD.Sc. (Tech.)b. 1952, Finnish citizenBoard member and chairman since 2013, member of the Human Capital CommitteeIndependent of the company and ownerPresident and CEO of KONE Corporation until 2014Positions of trust: Chairman of the Board of Directors of DevCo Partners; Member of the Board of Directors of KONE Corporation, ABB Group and AB VolvoOutotec shareholding and share-based rights on 31.12.2019: 168,832 sharesOutotec shareholding and share-based rights of controlled corporations on 31.12.2019: 0 shares
Ian W. PearceVice Chairman of the Board of Directors (as of March 14, 2019)B.Sc., University of the Witwatersrand, South Africab. 1957, Canadian citizenBoard member since 2015, member of the Audit and Risk CommitteeIndependent of the company and ownerFounding Partner of X2 Resources Partners LP Inc. until 2017Positions of trust: Chairman of the Board of Directors of MineSense Technologies Ltd. (Canada) and Newgold (Canada), Member of the Board of Directors of Nexa ResourcesOutotec shareholding and share-based rights on 31.12.2019: 16,098 sharesOutotec shareholding and share-based rights of controlled corporations on 31.12.2019: 0 shares
Klaus CawénLL.M. Columbia University, LL.M. University of Helsinkib. 1957, Finnish citizenBoard member since 2015, member of the Audit and Risk CommitteeIndependent of the company and ownerExecutive Vice President of KONE CorporationPositions of trust: Member of the Supervisory Board of Ilmarinen Mutual Pension Insurance Company; Member of the Board of Directors of Oy Karl Fazer Ab, Toshiba Elevator and Build-ing Systems Corporation and East Office of Finnish Industries LtdOutotec shareholding and share-based rights on 31.12.2019: 16,774 sharesOutotec shareholding and share-based rights of controlled corporations on 31.12.2019: 0 shares
Anu HämäläinenM.Sc. (Economics)b. 1965, Finnish citizenBoard member since March 14, 2019, chair-man of the Audit and Risk CommitteeIndependent of the company and ownerVice President, Group Treasury and Financial Services & Support of Wärtsilä CorporationPositions of trust: Member of the Board of Directors of Fingrid Oyj and Finnfund
Outotec shareholding and share-based rights on 31.12.2019: 5,294 sharesOutotec shareholding and share-based rights of controlled corporations on 31.12.2019: 0 shares
Anja KorhonenM.Sc. (Economics)b. 1953, Finnish citizenBoard member since 2013, member of the Audit and Risk CommitteeIndependent of the company and ownerSenior Vice President, Corporate Controller of Nokia Corporation until 2011Positions of trust: Member of the Board of Directors of Oriola Oyj and Huhtamäki OyjOutotec shareholding and share-based rights on 31.12.2019: 21,427 sharesOutotec shareholding and share-based rights of controlled corporations on 31.12.2019: 0 shares
Hanne de MoraLic.oec., MBAb. 1960, Swiss citizenBoard member since 2018, chairman of the Human Capital CommitteeIndependent of the company and ownerCo-founder and Chairperson of a-connect (group) ag, SwitzerlandPositions of trust: Member of the Foundation Board and Member of the Supervisory Board of IMD Business School; Member of the Board of Directors of AB VolvoOutotec shareholding and share-based rights on 31.12.2019: 5,977 sharesOutotec shareholding and share-based rights of controlled corporations on 31.12.2019: 0 shares
Patrik NolåkerB.Sc., Business Administration & Economics, MBAb. 1963, Swedish citizenBoard member since 2016, member of the Human Capital CommitteeIndependent of the company and ownerGroup CEO of DYWIDAG Systems International until 2016Positions of trust: Chairman of the Board of Directors of AQ Group AB, ViaCon Group AB, Saferoad Holding AS and Fibo Holding AS; Member of the Board of Directors of Systemair ABOutotec shareholding and share-based rights on 31.12.2019: 12,258 shares (and 4,000 nominee-registered shares)Outotec shareholding and share-based rights of controlled corporations on 31.12.2019: 0 shares
Teija SarajärviM.A.b. 1969, Finnish citizenBoard member since March 14, 2019, member of the Human Capital CommitteeIndependent of the company and ownerSenior Vice President, Human Resources of Huhtamäki OyjPositions of trust: Member of the Board of Di-rectors of Sarlin Group Oy Ab 2017-2019 Outotec shareholding and share-based rights on 31.12.2019: 3,970 sharesOutotec shareholding and share-based rights of controlled corporations on 31.12.2019: 0 shares
More detailed information about the
members of the Board of Directors: https://www.outotec.com/company/
about-outotec/corporate-governance/board-of-
directors/.
106 BOARD OF DIRECTORS AND EXECUTIVE BOARD
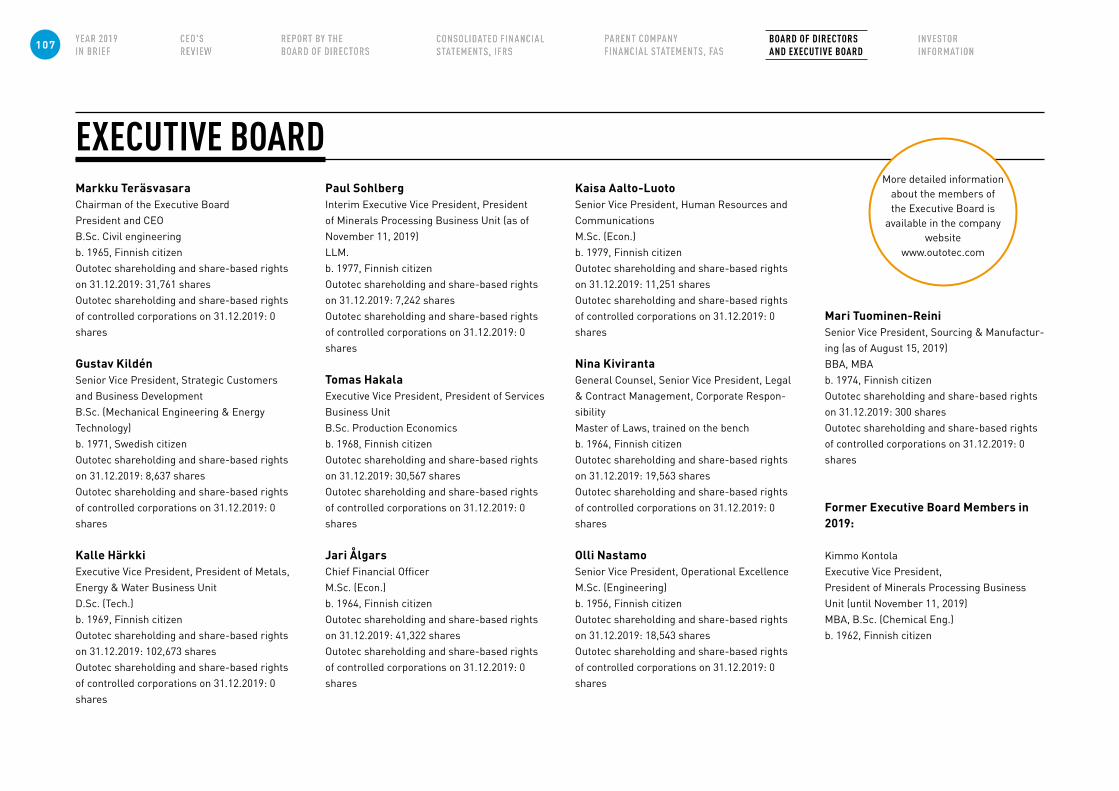
EXECUTIVE BOARDMarkku TeräsvasaraChairman of the Executive BoardPresident and CEOB.Sc. Civil engineeringb. 1965, Finnish citizenOutotec shareholding and share-based rights on 31.12.2019: 31,761 sharesOutotec shareholding and share-based rights of controlled corporations on 31.12.2019: 0 shares
Gustav KildénSenior Vice President, Strategic Customers and Business DevelopmentB.Sc. (Mechanical Engineering & Energy Technology)b. 1971, Swedish citizenOutotec shareholding and share-based rights on 31.12.2019: 8,637 sharesOutotec shareholding and share-based rights of controlled corporations on 31.12.2019: 0 shares
Kalle HärkkiExecutive Vice President, President of Metals, Energy & Water Business UnitD.Sc. (Tech.)b. 1969, Finnish citizen Outotec shareholding and share-based rights on 31.12.2019: 102,673 shares Outotec shareholding and share-based rights of controlled corporations on 31.12.2019: 0 shares
Paul SohlbergInterim Executive Vice President, President of Minerals Processing Business Unit (as of November 11, 2019)LLM.b. 1977, Finnish citizenOutotec shareholding and share-based rights on 31.12.2019: 7,242 sharesOutotec shareholding and share-based rights of controlled corporations on 31.12.2019: 0 shares
Tomas HakalaExecutive Vice President, President of Services Business UnitB.Sc. Production Economicsb. 1968, Finnish citizenOutotec shareholding and share-based rights on 31.12.2019: 30,567 sharesOutotec shareholding and share-based rights of controlled corporations on 31.12.2019: 0 shares
Jari ÅlgarsChief Financial Officer M.Sc. (Econ.)b. 1964, Finnish citizen Outotec shareholding and share-based rights on 31.12.2019: 41,322 shares Outotec shareholding and share-based rights of controlled corporations on 31.12.2019: 0 shares
Kaisa Aalto-LuotoSenior Vice President, Human Resources and CommunicationsM.Sc. (Econ.)b. 1979, Finnish citizen Outotec shareholding and share-based rights on 31.12.2019: 11,251 sharesOutotec shareholding and share-based rights of controlled corporations on 31.12.2019: 0 shares
Nina KivirantaGeneral Counsel, Senior Vice President, Legal & Contract Management, Corporate Respon-sibilityMaster of Laws, trained on the benchb. 1964, Finnish citizenOutotec shareholding and share-based rights on 31.12.2019: 19,563 sharesOutotec shareholding and share-based rights of controlled corporations on 31.12.2019: 0 shares
Olli NastamoSenior Vice President, Operational ExcellenceM.Sc. (Engineering)b. 1956, Finnish citizenOutotec shareholding and share-based rights on 31.12.2019: 18,543 sharesOutotec shareholding and share-based rights of controlled corporations on 31.12.2019: 0 shares
Mari Tuominen-ReiniSenior Vice President, Sourcing & Manufactur-ing (as of August 15, 2019)BBA, MBAb. 1974, Finnish citizenOutotec shareholding and share-based rights on 31.12.2019: 300 sharesOutotec shareholding and share-based rights of controlled corporations on 31.12.2019: 0 shares
Former Executive Board Members in 2019:
Kimmo KontolaExecutive Vice President, President of Minerals Processing Business Unit (until November 11, 2019)MBA, B.Sc. (Chemical Eng.)b. 1962, Finnish citizen
More detailed information about the members of the Executive Board is
available in the company website
www.outotec.com
107 BOARD OF DIRECTORS AND EXECUTIVE BOARD

CORPORATE GOVERNANCE STATEMENT AND POLICYOutotec’s Corporate Governance Statement2019 has been given separately from theFinancial Statements. The Statement as wellas Outotec’s Corporate Governance Policy inits entirety are available on Outotec’s websiteat www.outotec.com/cg.
ANNUAL GENERAL MEETING 2020The AGM will be held on March 11. More infor-mation at www.outotec.com/agm.
DIVIDENDThe Board of Directors proposes to the Annual General Meeting 2020 that a dividend of EUR 0.10 per share shall be paid for the financial year 2020.
FINANCIAL REPORTING IN 2020• January–March: May 7• Half Year Financial Report: August 5• January–September: October 31
SHARE INFORMATIONListing: Nasdaq Helsinki, OMXHTrading symbol: OTE1VNo of shares: 183,121,492 (Feb 6, 2020)Sector: IndustryISIN: FI0009014575
ANALYSTSAnalysts following Outotec atwww.outotec.com/company/investors/analysts
CONSENSUSConsensus estimates provided by VaraResearch at www.outotec.com/company/in-vestors/analysts.
CONTACTMs Elena Ranta, Executive Assistant [email protected]
INVESTOR INFORMATION
108 INVESTOR INFORMATION