Embed Size (px)
Citation preview

2019 NORFOLK ISLAND INQUIRY
FINAL REPORT
Staff of the Commonwealth Grants Commission completed this inquiry in response to a
request from the Department of Infrastructure, Transport, Cities and Regional
Development.
NOVEMBER 2019

ii
ACKNOWLEDGEMENTS
We appreciate the ready and extensive co-operation extended to Commission staff and the
information provided during this inquiry by the Department of Infrastructure, Transport,
Cities and Regional Development and the Norfolk Island Regional Council. The report would
not have been possible without this assistance.
iii
CONTENTS
ACKNOWLEDGEMENTS ii
CONTENTS iii
LIST OF ACRONYMS vii
OVERVIEW ix
TASK ix
THE COMMISSION’S APPROACH ix
NORFOLK ISLAND CIRCUMSTANCES x
Unique circumstances x
Governance and service delivery arrangements xi
REVENUE AND EXPENSE ASSESSMENTS AND RESULTS xii
State-type revenues xii
Local government-type revenues xiii
State-type expenses xiii
Local government-type expenses xiv
Overall results xiv
Infrastructure xv
TERMS OF REFERENCE XVI
1 INTRODUCTION 1
THE TASK 1
GENERAL APPROACH 2
CONCEPTS 4
Comparable communities 4
Norfolk Island circumstances 4
Average efficiency 4
OTHER ISSUES 5
Service delivery arrangements 5
Functional classification of expenses 6
Government business enterprises 6
Infrastructure costs 7
2 UNIQUE CIRCUMSTANCES OF NORFOLK ISLAND 8
INTRODUCTION 8
LOCATION 9
Remoteness and service delivery scale 9
Isolation 10
Other effects of remoteness and isolation 12
ECONOMY 12

iv
Tax bases 13
Service delivery 13
POPULATION ISSUES 16
Population size 16
Age distribution 16
Socio-economic status 17
Community and culture 18
GOVERNANCE AND SERVICE DELIVERY ARRANGEMENTS 18
Service delivery arrangements 18
Grants to local governments 19
3 ASSESSED EXPENSES, REVENUES AND FINANCING REQUIREMENT 21
ASSESSED STATE-TYPE REVENUE 21
LOCAL GOVERNMENT REVENUE 23
ASSESSED STATE EXPENSES 24
LOCAL GOVERNMENT EXPENSES 27
OVERALL RESULTS 29
INFRASTRUCTURE 30
Ports 31
Airport 31
Telecommunications (Norfolk Telecom) 32
ATTACHMENT A: CURRENT SERVICE DELIVERY ARRANGEMENTS FOR NORFOLK ISLAND 34
ATTACHMENT B: NORFOLK ISLAND REVENUE AND EXPENSES 36
INTRODUCTION 36
DATA SOURCES 36
METHODS 37
NORFOLK ISLAND REVENUES AND EXPENSES 38
ATTACHMENT C: STATE TAXES AND CHARGES 42
INTRODUCTION 42
METHOD 42
PAYROLL TAX 43
State and Norfolk Island taxation arrangements 43
Assessed revenue for Norfolk Island 44
LAND TAX 45
State and Norfolk Island taxation arrangements 45
Assessed revenue for Norfolk Island 45
STAMP DUTY ON CONVEYANCES 46
State and Norfolk Island taxation arrangements 46
Assessed revenue for Norfolk Island 47
INSURANCE TAX 48
v
State and Norfolk Island taxation arrangements 48
Assessed revenue for Norfolk Island 49
MOTOR TAX 49
State and Norfolk Island taxation arrangements 49
Assessed revenue for Norfolk Island 50
MINING REVENUE 51
State and Norfolk Island taxation arrangements 51
Assessed revenue for Norfolk Island 52
GAMBLING TAX 53
State and Norfolk Island taxation arrangements 53
Assessed revenue for Norfolk Island 53
OTHER REVENUE 53
ATTACHMENT D: LOCAL GOVERNMENT TAXES AND CHARGES 55
INTRODUCTION 55
METHODS 55
MUNICIPAL RATES 56
Rating arrangements 56
Assessed revenue for Norfolk Island 57
OTHER REVENUE 58
Airport 58
FINANCIAL ASSISTANCE AND LOCAL ROADS GRANTS 59
GRANTS FROM STATE GOVERNMENTS 59
ATTACHMENT E: STATE GOVERNMENT SERVICES 61
INTRODUCTION 61
SCOPE OF STATE SERVICES 61
METHODS 63
SCHOOLS 63
State service and funding arrangements 63
Norfolk Island service and funding arrangements 64
Assessed expenses for Norfolk Island services 65
POST SECONDARY EDUCATION 66
State service and funding arrangements 66
Norfolk Island service delivery and funding arrangements 67
Assessed expenses for Norfolk Island services 67
HEALTH 68
State service delivery and funding arrangements 68
Norfolk Island service delivery and funding arrangements 68
Assessed expenses for Norfolk Island services 70
JUSTICE 73
State service delivery and funding arrangements 73

vi
Norfolk Island service delivery and funding arrangements 73
Assessed expenses for Norfolk Island services 75
WELFARE 77
State service delivery and funding arrangements 77
Norfolk Island service and funding arrangements 77
Assessed expenses for Norfolk Island services 78
HOUSING 79
State service delivery and funding arrangements 79
Norfolk Island service and funding arrangements 80
Assessed expenses for Norfolk Island services 81
SERVICES TO COMMUNITIES 82
State service delivery and funding arrangements 82
Norfolk Island service and funding arrangements 82
Assessed expenses for Norfolk Island services 83
TRANSPORT 85
Commonwealth activities relating to transport 85
Assessed expenses for Norfolk Island services 86
SERVICES TO INDUSTRY 86
State service delivery and funding arrangements 86
Norfolk Island service and funding arrangements 87
Assessed expenses for Norfolk Island services 87
OTHER EXPENSES 89
State service delivery and funding arrangements 89
Norfolk Island service and funding arrangements 89
Assessed cost of Norfolk Island services 89
ATTACHMENT F: LOCAL GOVERNMENT SERVICES 91
INTRODUCTION 91
SCOPE OF LOCAL GOVERNMENT SERVICES 91
METHOD 92
GENERAL ADMINISTRATION 95
HEALTH, HOUSING AND WELFARE 96
LAW, ORDER AND PUBLIC SAFETY 96
PLANNING AND COMMUNITY AMENITIES 96
ENVIRONMENTAL PROTECTION 97
RECREATION AND CULTURE 98
ROADS AND BRIDGES 98
DEPRECIATION 99
AIRPORT 100
OTHER SERVICES 101

vii
LIST OF ACRONYMS
Acronym Meaning
ABS Australian Bureau of Statistics
ACARA Australian Curriculum, Assessment and Reporting Authority
AFP Australian Federal Police
APC Actual per capita
COFOG – A Classifications of the Functions of Government - Australia
CGC Commonwealth Grants Commission
DHA Department of Health and Ageing
The Department Department of Infrastructure, Transport, Cities and Regional Development
EPC Equal per capita
FAGS Financial Assistance Grants
FESL Fire and emergency services levies
GBE Government Business Enterprise
GFS Government Financial Statistics
GP General Practitioner
ICSEA Index of Community Socio-Educational Advantage
IHAD Index of Household Advantage and Disadvantage
IHPA Independent Health Pricing Authority
IPTAAS New South Wales’ Isolated Patients Travel and Accommodation Assistance Scheme
KAVHA The Kingston and Arthur’s Vale Historic Area
kWh Kilowatt hour (for electricity)
LGGC Local Government Grants Commission
NDIS National Disability Insurance Scheme
NHFB National Health Funding Body
NI Norfolk Island
NICS Norfolk Island Central School
NIHRACS Norfolk Island Health and Residential Aged Care Service
NIPTAAS Norfolk Island Patients’ Travel Accommodation and Assistance Scheme
NIRC Norfolk lsland Regional Council
NPP National Partnership Payment
NWAU National Weighted Activity Unit
PBS Pharmaceutical Benefits Scheme
PNFC Public Non-Financial Corporation

viii
RTOs Registered Training Organisations
SDA Service Delivery Agreement
SDC Socio-demographic composition
SES Socio-economic status
SESLHD South East Sydney Local Health District
TAFE Technical and Further Education
ix
OVERVIEW
TASK
The Department of Infrastructure, Transport, Cities and Regional Development (the
Department) engaged Commonwealth Grants Commission staff to review the funding
for Norfolk Island. The Department sought credible costing-related information to:
support its consideration of options for the provision of State-type government
and local government services, and for State-type government business enterprises
provide estimates of the annual expenditure, including infrastructure costs, required to provide these services, by reference to the services available in comparable communities
identify the capacity of Norfolk Island to raise revenue from a range of taxes and charges comparable to those levied by State and local governments, assuming it makes the average Australian revenue raising effort.
THE COMMISSION’S APPROACH
We undertook a desktop based inquiry using data and other information sourced
from the Department, the Norfolk Island Regional Council (NIRC) and third party
sources.
The main steps in the inquiry were as follows.
We reviewed the service delivery expenses and revenue raising activities on Norfolk Island to develop an understanding of the circumstances of Norfolk Island and assist in identifying comparable Australian communities for costing purposes.
We used that information to develop methods for estimating assessed expenses and revenue for all major State-type and local government services and revenues.
Assessed expenses are the cost of delivering comparable State-type and local
government services and infrastructure on Norfolk Island having regard to its unique circumstances.
Assessed revenue is the amount that would be raised from State-type and local government equivalent revenue bases if comparable Australian revenue raising efforts were made.
The assessments of State-type expenses and revenues were based on the
Commission’s latest methods where appropriate. The assessment of local

x
government expenses and revenue used a mixture of methods, including those used
by the States’ Local Government Grants Commissions.
The assessments largely did not require actual expenditure and revenue data for
Norfolk Island. Nevertheless, we collected this information to help build our
understanding of circumstances and to double check the assessed expenses and
revenue. For example, if the assessed expenses differed markedly from the actual
spending on Norfolk Island, we:
considered whether the current standard of services on Norfolk Island is similar to
that in comparable communities, or whether the assessment method did not capture a cost advantage or disadvantage faced on Norfolk Island
sought to validate our findings using comparisons with other communities facing
similar circumstances to Norfolk Island (for example, King Island or the Indian Ocean Territories).
The analysis focused only on 2017-18. Given the governance and administrative
arrangements introduced in July 2016, the 2017-18 data were considered more
reliable and reflective of Norfolk Island circumstances going forward.
NORFOLK ISLAND CIRCUMSTANCES
Unique circumstances
The approach was to make calculations by reference to revenues raised and services
provided in comparable communities and make an allowance for the specific
circumstances of Norfolk Island. We considered Norfolk Island as comparable to
small, very remote communities with relatively low Aboriginal and Torres Strait
Islander populations.
Our assessed revenues and expenses were derived by establishing a base from the
expenses and revenues in communities or regions where the major features are
broadly comparable with those on Norfolk Island and then making adjustments to
better recognise any special characteristics of Norfolk Island.
The unique circumstances that make Norfolk Island different from other communities
in Australia, and which affect its financial capacity, include its:
location including its remoteness, isolation and island status
economy, including its narrow economic base with a strong reliance on tourism, the size of the potential tax bases, the number of tourists on the Island at any one time and its wage levels
small size, which means many services are less able to achieve economies of scale
population characteristics including a relatively small working age population and
a relatively large elderly population

xi
governance arrangements, which result in the need for special arrangements for the delivery of State-type services.
The assessments have taken into account these unique circumstances by:
taking into account the demographic and socio-economic status of the population and service delivery arrangements
allowing for the cost impact of remoteness and community size (or service delivery scale) by adding a range of cost factors that vary depending on the service or revenue under consideration and the available data
applying a 5% isolation allowance to the base costs for most services to account
for additional costs arising from Norfolk’s isolated island status and which are not covered by the remoteness allowances. The allowance was based on previous
analysis of the extent to which transport, travel, communication and equipment costs were increased by Norfolk Island’s isolation
adding a cost factor for the impact of tourists on the demand for some services
applying a contract administration allowance of 10% in estimating assessed expenses of State-type services performed under the service delivery agreements.
Governance and service delivery arrangements
Our calculations reflected the current arrangements for service delivery on Norfolk
Island. They include:
Commonwealth-type activities are delivered on Norfolk Island by the Australian Government agencies responsible for them in the rest of Australia
The Department has responsibility for State-type services through service delivery agreements whereby it funds the services delivered by a mix of mainland based and Norfolk Island-based service providers
NIRC is responsible for local government-type activities, but also provides some
services that are normally Commonwealth or State activities (such as telecommunications and electricity).
We have excluded revenues and expenses related to activities on Norfolk Island that
are a Commonwealth responsibility. These include the Kingston and Arthur’s Vale
Historic Area (KAVHA) World Heritage site, the National Park, airline and air freight
subsidies and major capital works, such as the airport runway repaving and jetty
upgrades. The activities of Norfolk Island Telecom were also excluded from our
analysis because telecommunications is normally a Commonwealth responsibility.
In those cases where NIRC provides services that are normally a State service (for
example, electricity generation and distribution) we included the relevant revenues
and expenses in our analysis of State-type matters and excluded them from the local
government analyses. We also treated some tourism expenses incurred by NIRC as

xii
State-type expenses because responsibility for tourism is normally split between
State and local governments.
There are some legacy State and local government-type government business
enterprises on Norfolk Island. These include Norfolk Telecom, electricity generation
and distribution, the airport, waste management, wastewater and the Liquor Bond.
We have treated:
waste management and the Liquor Bond as local government functions and included all revenues and expenses for these businesses in our assessments
the airport as a local government function but only included the net result for the airport in our assessments
electricity generation and distribution, water and wastewater as State functions,
but we only considered the net subsidy in our assessments, consistent with our approach for States
Norfolk Telecom as out of scope as telecommunications is a Commonwealth
responsibility.
Reflecting these service delivery arrangements, State services were classified into 11
functional groups: Schools, Post-secondary education, Health, Welfare, Housing,
Justice, Services to communities, Roads, Transport, Services to industry and Other
expenses. Many of those functional groups were split into sub-functions to facilitate
the assessments. For example, health services were split into hospital services (on-
and off-island), patient transport and community health.
Local government services were classified into 11 functional groups: General
administration; Health, housing and welfare; Law, order and public safety; Planning
and community amenities; Environmental protection; Recreation and culture;
Tourism; Roads and bridges; Depreciation; Debt charges and Other expenses.
REVENUE AND EXPENSE ASSESSMENTS AND RESULTS
State-type revenues
If comparable State-type revenue policies applied on Norfolk Island we estimated
$3.2 million or $1 824 per capita could have been raised in 2017-18. This compares
with average State revenue of $5 107 per capita and actual Norfolk Island revenue of
$1 335 per capita. The results indicate:
Norfolk Island’s capacity to raise State-type revenues is well below that of
comparable communities
there is below average revenue raising effort for a number of State-type taxes and other revenues including motor tax, insurance tax and other revenue

xiii
The Commission also compared Norfolk Island assessed revenues to those of the
Northern Territory, as this is the State or territory with the highest proportion of its
population in remote areas. The Northern Territory’s assessed State-type revenues in
2017-18 were $5 596 per capita, or about three times that of Norfolk Island in per
capita terms.
Local government-type revenues
If comparable local government-type policies applied on Norfolk Island, and it
received the average amount of grants from Commonwealth and State governments,
we estimated it could have raised $7.8 million or $4 460 per capita in 2017-18. This
compares with average all-council revenue of $1 921 per capita and actual Norfolk
Island revenue of $4 698 per capita. The results indicate:
Norfolk Island’s capacity to raise local government-type revenues is significantly
above that of comparable communities due largely to its above average Commonwealth financial assistance grants and the substantial net contribution from the Liquor Bond, which is a unique revenue source for NIRC.
Below average revenue raising effort applies to most normal local government-type revenue bases, including the municipal rates tax base.
State-type expenses
The estimated expenses required to provide comparable State-type services on
Norfolk Island in 2017-18 is $32.0 million or $18 241 per capita, which is more than
double the average level of State spending. The high level of assessed spending is
mainly due to Norfolk Island’s remoteness and isolation from the mainland and its
small scale, which raises per capita service delivery costs. Those unique circumstances
of Norfolk Island affect most services but especially schools, health, police and
electricity. The Commonwealth engages a range of providers to deliver services
through service delivery agreements, as it is not best placed to directly deliver
State-type services. Providers include the New South Wales Government, NIRC, the
Australian Federal Police (AFP) or private contractors. This arrangement further
increases costs. In addition, we assessed above average per capita costs for tourism
to allow Norfolk Island to provide services similar to those provided by the States on
average.
We found that total assessed and actual spending were about the same in 2017-18
($32.0 million and $33.1 million). However, there are some large differences between
assessed and actual spending for some services.
Some State-type services were not provided in 2017-18 including first home owner
grants, post-secondary education, remote community electricity subsidies and State

xiv
grants for local government.1 The assessed cost of providing those services at
comparable community standards on Norfolk Island is $2.8 million and about half of
this is for electricity subsidies.
Compared with the 2011 report, assessed expenses have increased by 119% or
$9 951 per capita, less than the increase in actual expenses (244% or $13 370 per
capita). The faster increase in actual expenses is partly due to the higher wages now
payable for some services, but it also suggests that service levels have increased since
2009-10.
The Commission also compared Norfolk Island’s assessed expenses to those raised by
the Northern Territory, as this is the State or territory with the greatest level of
remote areas. The Northern Territory’s assessed State-type expenses in 2017-18 were
$20 604 per capita, or about 12% above those of Norfolk Island in per capita terms.
Local government-type expenses
We have estimated that Norfolk Island would need to spend $3 168 per capita or
$5.6 million in 2017-18 to deliver comparable local government services. The result is
driven by above average costs relative to comparable communities in all areas except
debt charges. The main factors affecting State service delivery expenses (remoteness,
isolation from the mainland and diseconomies of small scale) also affect local
government expenses. Assessed spending on tourism is also above that of
comparable communities reflecting the importance of tourism to Norfolk Island’s
economy.
Norfolk Island’s actual spending on local government type-services is 26% above our
assessed level of spending.
Overall results
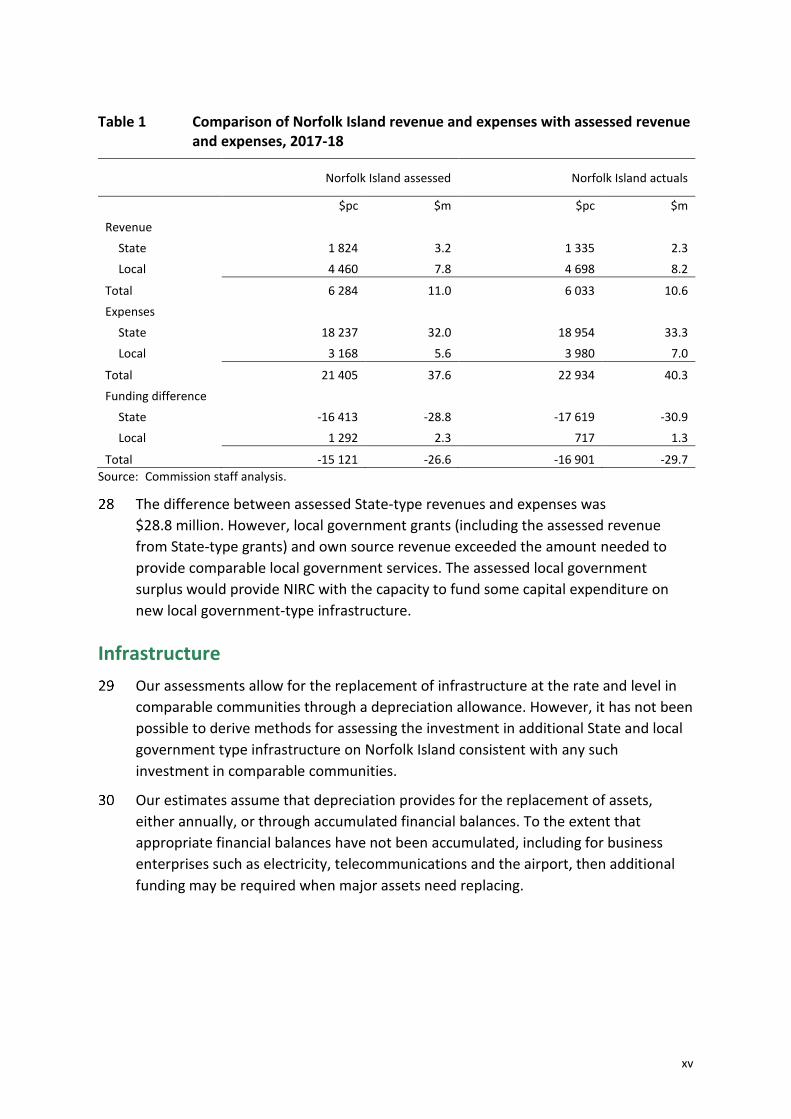
Table 1 compares the amounts Norfolk Island actually spent and raised in 2017-18
with what it would have spent and raised if it operated like comparable communities.
In 2017-18, there was a difference of $26.6 million between the Norfolk Island State
and local government assessed revenues and expenses. This is the net assistance
needed to provide comparable State and local government services at average levels
of efficiency, if comparable State and local government revenues were raised.
1 Post-secondary education services were introduced in 2018-19 but other services remain unavailable.
National disability services are available to Norfolk Island residents and we included an allowance for the average per capita State contribution to the National Disability Insurance Agency. However, the actual mechanism for scheme contributions is unclear.
xv
Table 1 Comparison of Norfolk Island revenue and expenses with assessed revenue and expenses, 2017-18
Norfolk Island assessed Norfolk Island actuals
$pc $m $pc $m
Revenue
State 1 824 3.2 1 335 2.3
Local 4 460 7.8 4 698 8.2
Total 6 284 11.0 6 033 10.6
Expenses
State 18 237 32.0 18 954 33.3
Local 3 168 5.6 3 980 7.0
Total 21 405 37.6 22 934 40.3
Funding difference
State -16 413 -28.8 -17 619 -30.9
Local 1 292 2.3 717 1.3
Total -15 121 -26.6 -16 901 -29.7
Source: Commission staff analysis.
The difference between assessed State-type revenues and expenses was
$28.8 million. However, local government grants (including the assessed revenue
from State-type grants) and own source revenue exceeded the amount needed to
provide comparable local government services. The assessed local government
surplus would provide NIRC with the capacity to fund some capital expenditure on
new local government-type infrastructure.
Infrastructure
Our assessments allow for the replacement of infrastructure at the rate and level in
comparable communities through a depreciation allowance. However, it has not been
possible to derive methods for assessing the investment in additional State and local
government type infrastructure on Norfolk Island consistent with any such
investment in comparable communities.
Our estimates assume that depreciation provides for the replacement of assets,
either annually, or through accumulated financial balances. To the extent that
appropriate financial balances have not been accumulated, including for business
enterprises such as electricity, telecommunications and the airport, then additional
funding may be required when major assets need replacing.

xvi
TERMS OF REFERENCE
xvii

1
1 INTRODUCTION
THE TASK
The Department of Infrastructure, Transport, Cities and Regional Development (the
Department) engaged the Commonwealth Grants Commission (CGC) staff to review
the funding for Norfolk Island. The scope of the task is set out in the Terms of
Reference received from the Department in March 2019, a copy of which is at the
beginning of this report.
The Department is seeking credible costing related information to:
support consideration of options for the provision of State-type government services on Norfolk Island
assist in defining the optimal service provision framework for the delivery of State-type and local government services, and legacy State-type government business enterprises.
The main outputs sought are estimates of:
the amount of annual expenditure, including infrastructure costs, required to provide State-type government services, local government services and support for legacy State-type government business enterprises, with reference to the services available in comparable communities
the capacity of Norfolk Island to raise revenue from a comparable range of taxes
and charges levied by State and local governments, assuming Norfolk Island makes the average Australian revenue raising effort.
The Terms of Reference require the inquiry to have regard to the circumstances of
Norfolk Island, and refer to and, where applicable, update the Commission staff’s
2011 Norfolk Island Inquiry.
The Terms of Reference require the inquiry to produce a modelling tool or
mechanism for updating the estimated annual expenditure for services. CGC and the
Department later agreed that this tool or mechanism was no longer needed and that
the CGC would advise the Department on updating its estimated costs of service
delivery on Norfolk Island.

2
GENERAL APPROACH
The 2011 staff inquiry (2011 inquiry) into Norfolk Island was based on the approach
of the 2006 Commission inquiry (2006 inquiry).2 There have been significant changes
to governance arrangements for Norfolk Island and the Commission’s methods for
measuring State financial capacities (mainly reflecting changes to State government
responsibilities and new data sources) since 2011. These changes have necessitated
major changes in the methods for assessing Norfolk Island costs and revenue raising
capacity. The methods for assessing service delivery costs and revenue raising
capacity are described in the attachments to this report.
Staff did not visit Norfolk Island during the inquiry. We agreed with the Department
that this would be a desktop inquiry and that we would collect data and other
information for the inquiry from the Department, NIRC and third party sources.
Throughout the inquiry, we have been in regular contact with the Department and
NIRC and received significant support from them.
The main steps in the inquiry were as follows.
We collected information from the Department, NIRC and third-party sources to develop an understanding of service delivery and revenue raising activities on the Island. We consulted the Department and NIRC several times during March 2019 to August 2019 regarding this information and to clarify the service delivery and revenue collection approach and issues. These extensive consultations provided an understanding of the unique circumstances of Norfolk Island and assisted in identifying comparable Australian communities for costing purposes.
The assessments of service delivery costs and revenue raising capacity required financial data on State and local government expenses and revenues. The State financial data were available from the Commission’s inquiries into State finances. Local government data were mainly sourced from Australian Bureau of Statistics’ (ABS) Government Finance Statistics (GFS). Financial data for Norfolk Island were provided by the Department and NIRC. Population data were also needed, which were sourced from the ABS.
We calculated assessed expenses and revenue for all major State-type and local
government services and revenues.
Assessed expenses are the costs of delivering comparable State-type and local government services and infrastructure on Norfolk Island having regard to the unique circumstances of the Island.
2 The 2006 Norfolk Island inquiry was an official CGC inquiry under the CGC Act involving
Commissioners, whereas staff of the Commission undertook the 2011 inquiry. References to staff in this report are to staff of the CGC, unless otherwise stated.

3
Assessed revenue is the amount that would be raised from State-type and local equivalent revenue bases if comparable Australian revenue raising efforts were made.
To the extent that it was appropriate, the assessments of State-type expenses and
revenues were based on the Commission’s latest methods. The assessment of local
government expenses and revenue used a mixture of methods, including those used
by States’ Local Government Grants Commissions.
For most services and revenues, our assessments did not require actual expenditure
and revenue data for Norfolk Island. Nevertheless, we collected this information to
help build our understanding and to double check the assessed expenses and
revenue. For example, if the assessed expenses differed markedly from the actual
spending on the Island, we considered whether the current standard of services on
Norfolk Island matched that in comparable communities, or whether the assessment
method did not capture a cost advantage or disadvantage faced on Norfolk Island. In
some cases, we sought to validate our findings using comparisons with other
communities facing similar circumstances to Norfolk Island (for example, King Island
or the Indian Ocean Territories).
Initially, we tried to collect Norfolk Island data for two years, 2016-17 and 2017-18,
but in the end the analysis focused only on 2017-18. As the new governance and
administrative arrangements were introduced in July 2016, the 2017-18 data were
considered more reliable and reflective of Norfolk Island circumstances going
forward.
The Terms of Reference say the inquiry should refer to and, where applicable, update
the 2011 Norfolk Island Inquiry. For each expenditure and revenue assessment, we
considered the suitability of the 2011 methods, which were largely based on methods
devised in the 2006 Inquiry. Those methods used adjusted actual Norfolk Island
expenses as the basis for estimating assessed expenses for many major services.
Updating those methods using costs derived from the current service delivery
contracts would not support one of the aims of this inquiry, which is to assist the
costing of State-type government services on Norfolk. In addition, some of the 2006
and 2011 Inquiry revenue assessments used estimates of revenue bases that relied
on partial information (for example, land values were estimated in 2006 and
extrapolated for the 2011 inquiry). For some assessments, data that were not
previously available became available and have been used in this Inquiry.

4
CONCEPTS
Comparable communities
The Terms of Reference asked us to make our calculations by reference to revenues
raised and services provided in comparable communities and allow for other
circumstances of Norfolk Island.
This conceptual approach recognises that, while Norfolk Island requires services
similar to those in comparable communities, there are particular circumstances that
mean those services cannot be provided at the same cost, or that other
supplementary services may be required. Similarly, circumstances on Norfolk Island
may mean per capita revenue collected there may differ from that in comparable
communities, even when the same revenue raising effort is made.
In general terms, we considered Norfolk Island was comparable to small, very remote
communities with a relatively low Aboriginal or Torres Strait Islander population in
the States. However, our concept of comparable communities did not rely on full
comparability with an actual community. Instead, it relied on establishing a base from
the costs and revenues in communities or regions where the major features are
broadly comparable with those on Norfolk Island and making adjustments to it to
better recognise any other circumstances of Norfolk Island.
Norfolk Island circumstances
Circumstances that make Norfolk Island different from other communities in
Australia, and which affect its financial capacity, include its island status and isolated
location; its narrow economic base with a strong reliance on tourism; its small size,
which affects the ability to achieve economies of scale in service delivery; its
population characteristics; and its governance arrangements.
Chapter 2 discusses how these factors influence Norfolk Island costs and revenue.
Average efficiency
The Terms of Reference required us to base our estimates of service delivery costs on
the assumption services are delivered at the average level of efficiency in comparable
communities elsewhere in Australia.
As in all other Commission inquiries, we have assumed the average level of efficiency
is reflected in the average amount spent by States, local government or comparable
communities. However, an allowance has been included to recognise that some costs
incurred in delivering administrative and regulatory services are independent of the
size of the community. For example, all local governments have a level of fixed costs
to cover elected officials, general manager(s), group managers and support staff

5
providing corporate and financial services, and other administrative functions. The
small size of the Norfolk community means that the per capita cost of those services
is higher than the average.
OTHER ISSUES
Service delivery arrangements
Under the current arrangements for service delivery on Norfolk Island:
Commonwealth-type activities are delivered on Norfolk Island by Australian Government agencies responsible for them in the rest of Australia
The Department has responsibility for State-type services. It has set up a number of service delivery agreements whereby it funds the services but they are delivered by a mix of mainland based and on-Island service providers
NIRC is responsible for local government-type activities, but also provides some
services that are normally Commonwealth or State activities (such as telecommunications and electricity). Some State-type services are provided by NIRC under contract from the Commonwealth.
Further discussion of the governance and administrative arrangements is in Chapter 2
and a diagram presenting an overview of which governments and agencies are
responsible for delivering services is in Attachment A.
The Terms of Reference asked us to consider State and local government-type
functions including legacy State-type government business enterprises.
Consequently, our assessments excluded Commonwealth services and revenues. This
includes spending and revenues associated with programs such as the Medical
Benefits Scheme (MBS), Pharmaceutical Benefits Scheme (PBS), income support
payments and Commonwealth taxes. In the case of the National Disability Insurance
Scheme (NDIS), we excluded expenses incurred by the Commonwealth in delivering
services but we have included the amounts States contribute towards the scheme.
We also excluded revenues and expenses related to activities on Norfolk Island where
the Commonwealth has accepted the responsibility. These include the Kingston and
Arthur’s Vale Historic Area (KAVHA) World Heritage site, the National Park, passenger
airline underwriting, air freight subsidies and major capital works, such as airport
runway repaving and jetty upgrades.
The activities of Norfolk Island Telecom were also excluded from our analysis because
telecommunications are a Commonwealth responsibility.
In those cases where NIRC provides services that are normally a State service (the
main example is electricity generation) we included the relevant revenues and
6
expenses in our analysis of State-type matters and excluded them from the local
government analyses. We also treated some tourism promotion expenses incurred by
NIRC as State-type expenses because responsibility for tourism is normally split
between State and local governments.
Functional classification of expenses
The Terms of Reference ask us to provide a breakdown by expense categories of
State-type services, local government-type services and legacy State-type
government business enterprises (see Attachment B).
To prepare those details, we used the same breakdown of State-type government
services as the Commission uses in its inquiries into State finances, which is based on
the GFS Classification of Functions of Government — Australia (COFOG-A) prepared
by the ABS. The classification of local government activities was also based on the
ABS classification.
State services were classified into 11 functional groups: Schools, Post-secondary education, Health, Welfare, Housing, Justice, Services to communities, Roads, Transport, Services to industry and Other expenses. Many of those functional groups were split into sub-functions to facilitate the assessments. For example, health services were split into hospital services (on and off-island), patient transport and community health.
Local government services were classified into 11 functional groups: General administration; Health, housing and welfare; Law, order and public safety; Planning and community amenities; Environmental protection; Recreation and
culture; Tourism; Roads and bridges; Depreciation; Debt charges and Other expenses.
Government business enterprises
NIRC provides many services for which fees and charges are made and which may,
therefore, be operated in business-like ways. These include Norfolk Island Telecom,
electricity generation and distribution, the airport, waste management and sewerage.
As noted earlier, we have treated Norfolk Telecom as a Commonwealth activity and
excluded related revenues and expenses from our assessments.
The electricity generation and distribution and wastewater activities have been
treated as State-type activities. However, the Commission does not make detailed
assessments of electricity or wastewater undertakings in its inquiries into State
finances because there are large variations between the States in the extent to which
they have privatised and limited information is available. It is, however, common for
States to provide subsidies for electricity services in remote areas that are not
connected to the main electricity grid and for wastewater services in small isolated

7
communities. Those subsidies were taken into account in assessing State financial
capacities and we adopted a similar approach in this inquiry. Further details of that
assessment are in Attachment E on State Government services.
We treated the other business-like activities on Norfolk Island as local government
activities. We assessed the small positive net operating result for the airport and
liquor bond as NIRC revenue. For the other local government business enterprises we
assessed their revenues and expenses separately. Attachment F discusses our
assessment methods for these activities.
Infrastructure costs
The Terms of Reference asks for an estimate of the annual expenditure on
infrastructure associated with the delivery of State and local government-type
services and legacy State-type government business undertakings. That estimate was
to be based on an assumption that the Island had the average per capita
infrastructure at the beginning of the year. This assumption means we were not
required to estimate any infrastructure backlogs for the Island, which would be a
significant task that is not normally part of the Commission’s remit.
Capital spending can be thought of as consisting of spending to replace or renew
existing assets and investment in additional infrastructure and assets. The
Commission makes assessments of both components in its State financing inquiries.
We attempted to apply the Commission’s existing methods for estimating State
investment in additional infrastructure to Norfolk Island. However, it did not produce
plausible outcomes. This was predominantly because most investment in additional
infrastructure and assets is driven by population growth and/or is intended to
recognise costs associated with major transport infrastructure such as State roads
and public transit including railways. Those drivers of investment do not apply to
Norfolk Island.
It has not been possible to derive other methods for assessing the investment in
additional State and local government type infrastructure on Norfolk Island
consistent with any such investment in comparable communities.
We were, however, able to make estimates of depreciation expenses related to State
and local government-type assets. Those expenses may be thought of as equivalent
to a stream of funds for capital spending to replace or renew existing assets.
Chapter 3 discusses this issue further. The depreciation assessments are discussed in
Attachments E and F.
8
2 UNIQUE CIRCUMSTANCES OF NORFOLK ISLAND
INTRODUCTION
The Terms of Reference for this inquiry ask us to estimate:
the annual expenses, including infrastructure costs, required to provide State-
type government services, local government services and support for legacy State-type government business enterprises on Norfolk Island, taking into account the circumstances of Norfolk Island
the capacity of Norfolk Island to raise revenue from a comparable range of taxes
and charges levied by State and local governments.
As in the 2006 and 2011 Commission inquiries into Norfolk Island finances, we have
interpreted ‘the circumstances of Norfolk Island’ as the characteristics of
Norfolk Island, its people or community, which would:
increase or reduce the cost of delivering similar services, compared to the cost in a comparable community elsewhere in Australia
vary the revenue that could be collected from comparable revenue policies.
Characteristics that make Norfolk Island different from many other Australian
communities include:
its location including its remoteness, isolation and island status
its economy, including its narrow economic base with a strong reliance on tourism, the size of the potential tax bases, the number of tourists on the Island at any one time and its wage levels
its small size, which means many services are less able to achieve economies of
scale
its population characteristics including a relatively small working age population and a relatively large elderly population
its governance arrangements, which result in the need for special arrangements for the delivery of State-type services.
It is important to note that the circumstances of Norfolk Island we recognised are its
inherent characteristics which affect what it will cost to deliver services and the
revenues which could be raised. Differences between Norfolk Island and comparable
communities arising from policy choices are not treated as unique circumstances.
This chapter sets out our understanding of these circumstances. It identifies how they
might cause the costs of delivering comparable services on Norfolk Island, or its
revenue raising capacity, to differ from those of comparable communities.

9
LOCATION
Norfolk Island is located in the South Pacific Ocean, 1 500 kilometres from the eastern
Australian coast. It is about two hours flying time from Brisbane and two and a half
hours from Sydney, the nearest major cities.
While there are communities in the rest of Australia which are long distances from
major cities, they are not islands, except for Christmas Island and the Cocos (Keeling)
Islands. Similarly, while there are island communities, they are usually closer to the
mainland.
These observations imply that few other communities are fully comparable with
Norfolk Island. However, our concept of comparable communities does not rely on
full comparability. Instead, we identified the costs in communities or regions where
the major features are comparable with those on Norfolk Island and made
adjustments to better recognise any other circumstances of Norfolk Island. Further
explanations of the processes adopted are in the following parts of this chapter.
Remoteness and service delivery scale
The costs of providing government services are strongly influenced by the
remoteness of the location where they are provided, which can increase the cost of
freight, fuel and electricity, communications, staff travel, training and recruitment.
Per capita costs may also be affected by the need to deliver services in small
communities because the major features of the service are broadly similar to those
for larger communities, but the costs are spread over fewer people.
We have allowed for the cost impact of remoteness and community size (or service
delivery scale) in several ways, depending on the service or revenue under
consideration and the available data.
In some cases, such as community health services, data collected for the
Commission’s work on State finances provides estimates of the average costs of
providing services in very remote regions. Such data provided a base cost estimate
which was adjusted to reflect the effects of other relevant features such as the small
size of the community.
In other cases, State average per capita costs were used as the base and allowances
were made for the impact on those costs of remoteness, the level of activity on
Norfolk Island and other relevant features of the Island’s population, such as its age
distribution or socio-economic status. In the case of schools, average costs per
student were the base and they were adjusted for remoteness (average costs were
increased by 55%), school size (average costs were increased by 9%) and student
characteristics which generally affect costs (costs for students in the bottom quintile

10
of the Index of Community Socio-Educational Advantage (ICSEA) 3 were increased by
66%).
Again, the size of the allowances for remoteness (or regional costs) and the higher
costs often faced when delivering services in small communities (called service
delivery scale) have been based on data and analysis from the Commission’s work on
State finances.
Table 2 provides details of the percentage allowances applied to average per capita
costs for most expense categories to recognise the effects of remoteness (or regional
costs) and service delivery scale (small community size).
Table 2 Allowances for remoteness and service delivery scale
Expense category Very remote, small community allowances
Category specific allowances
Schools
Regional costs 1.55
Service delivery scale 1.09
Post-secondary (a) 1.87
Hospitals
Regional costs 1.12
Service delivery scale 1.73
Courts (a) 1.10
Wastewater (a) 2.62
Construction costs (a) 1.54
General adjustment (b) 1.34
(a) Combines the effects of remoteness and service delivery scale. (b) This adjustment was applied to most services not specifically mentioned in the table. It covers the
effects of remoteness only. Source: Commission calculation for the 2020 Review.
These remoteness and service delivery scale allowances were not made for services
where the per capita costs for King Island were used as the base. We considered the
King Island costs already included the effects of remoteness, the need to deliver
services for a small community and many of the effects of an island.
Isolation
Our inclusion of allowances for remoteness and service delivery scale provide the
best estimates of the costs of providing services in small very remote communities.
However, Norfolk Island is not just very remote but is also isolated. That isolated
3 ICSEA is compiled by the Australian Curriculum and Reporting Authority – see
http://docs.acara.edu.au/resources/About_icsea_2014.pdf for an overview of this data.

11
island status has some implications for the costs of services over and above those of a
small very remote community on the mainland.
Implications of the isolated island nature of Norfolk Island include:
it relies almost exclusively on air services for the movement of people and some freight to and from its shores
the limited number of flights to and from the mainland means trips by community members, the private sector, visitors and service delivery staff can be longer than their business otherwise requires
most freight must be moved by sea rather than by road and since Norfolk Island has no deep water harbour, a lighterage service must be used to move freight and equipment from the ships to its jetties
service providers on Norfolk are unable to access cost savings arising from the
sharing of facilities and systems with neighbouring service providers
the longer response times involved in getting back-up and emergency services to Norfolk Island may require the Island to have levels of facilities and equipment which are over and above those in remote and very remote mainland communities
A high level of emergency management coordination required to ensure the Island is prepared for any emergency situation, in comparison to regions where resourcing and emergency services are more readily accessible.
A study done for the Department by KPMG,4 a consultancy, also concluded the
isolation of Norfolk Island led to extra costs for staff travel, recruitment and
retention, freight and lost efficiencies arising from the inability to share resources and
services with neighbouring councils.
In the 2006 and 2011 Norfolk Inquiries, allowances were made for the effects of
those influences by applying a 5% isolation allowance to the base costs for most
services. That allowance was based on an analysis of the extent to which transport,
travel, communication and equipment costs were increased by the Island’s isolation.
A reduced allowance was made when King Island or Northern Territory costs were
used as the base because those costs included some isolation costs.
Similar data were not available for the current inquiry. We, therefore, decided to
apply the same 5% allowance in cases where Australian average per capita costs were
used as the base, and to apply a 2.5% allowance when King Island costs were the
base.
The KPMG report also said the Financial Assistance Grants (FAGs) recommended by
the New South Wales Local Government Grants Commission were understated
because they did not fully capture the higher costs of some services on Norfolk Island.
4 KPMG, Analysis of Remote Island Disadvantages – Norfolk Island, December 2017.

12
Services specifically mentioned by KPMG were airport services, fire and emergency
services, planning and building services, tourism support and waste management.
We considered most of the issues raised by KPMG were addressed by our assessment
methods. Specifically, our use of either very remote, non- Aboriginal or Torres Strait
Islander community costs or King Island per capita costs as the base, and the inclusion
of allowances for isolation, captures most of the higher costs on Norfolk Island. The
exception is the case of waste management where we included an extra isolation
allowance of $200 000 to reflect the higher costs on Norfolk Island due to the need to
upgrade its waste management and sanitation processes. That allowance is similar to
those in the grants recommended for Christmas Island and Cocos (Keeling) Islands by
the Western Australian Local Government Grants Commission. This issue is discussed
further in Attachment F – Local Government services.
Other effects of remoteness and isolation
The remoteness of the Island also affects other aspects of service provision.
High cost of electricity for consumers.
The cost of generating electricity is high on Norfolk Island because a stand-alone
diesel plant is used. The cost of importing the fuel required to run the generators is
high and there is a high level of in-built redundancy. The high costs are recognised in
the assessment of electricity subsidies in Attachment E.
Waste management.
Being a small island creates unique challenges for waste disposal. Waste
management regimes need to meet the requirements of waste management best
practice, Marine Parks requirements and international treaties and protocols for the
prevention of sea pollution. This issue is discussed above and in Attachment F.
Access to tertiary medical services.
Medical services on the Island are delivered through the Norfolk Island Health and
Residential Aged Care Service (NIHRACS – a multi-purpose service). Residents travel
to Sydney, Brisbane and sometimes Auckland for most major surgery and other high
level specialist care. The cost of treating Norfolk residents in mainland hospitals and
associated travel is recognised in our health assessment.
ECONOMY
The characteristics of the Norfolk Island’s economy affect its tax bases and its costs of
delivering services.

13
Tax bases
The Norfolk Island tax bases reflect its economic circumstances, particularly a much
less diversified economy than States have. Tourism to Norfolk Island is the key
industry. As measured by visitor numbers, tourism expanded after 2016, however
remains below its pre Global Financial Crisis peak (see table 3). The Commission’s
estimates of land values and turnover are lower than in the 2011 and 2006 inquiries,
although these earlier amounts relied on estimated land values that were perhaps
overstated. In contrast, this inquiry relies on more recent land valuations by the
Norfolk Island Valuer-General. This inquiry therefore shows a lower capacity to raise
revenue from land tax, stamp duty on conveyances and municipal rates.
Before July 2016, Norfolk Island collected and retained a 12.5% Value-Added Tax (ie,
a Goods and Services Tax - GST). Thereafter, the Commonwealth has provided direct
funding of a larger size for State and Commonwealth services, although the NIRC no
longer has access to a GST-type tax base.
Service delivery
Tourism
Tourism is the dominant industry on Norfolk Island. The KPMG report, Analysis of
Remote Island Disadvantages – Norfolk Island (December 2017), noted 60% of the
Island’s economy depended on tourism and 41% of its gross product was attributable
to tourism, compared with 3% for New South Wales. (These data are dated as
economic surveys and related data collections have not been conducted since around
2010.)
Tourism has two implications for Norfolk Island’s finances:
substantial funding is required to promote and develop the industry and to provide advice and guidance for tourists on the Island
tourists increase the use of some services on the Island above that of the resident
population and hence increase the costs of providing those services and may increase the capacity to recover some costs.
The first of these impacts is recognised in our assessments of State and local
government tourism expenses. This issue is discussed in Attachment E.
The impact of tourists on service use and revenue raising capacity has been treated as
a Norfolk Island special circumstance in some of our assessments.
Details of the number of visitors to Norfolk Island in recent years are in Table 3.
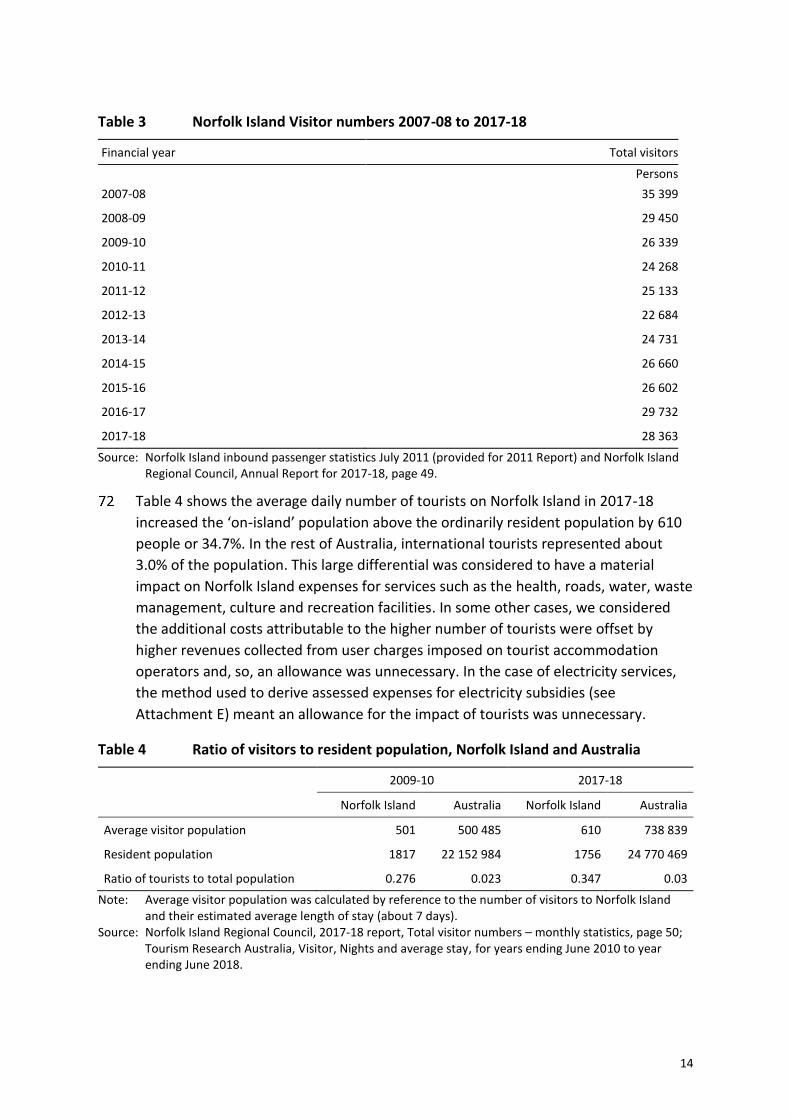
14
Table 3 Norfolk Island Visitor numbers 2007-08 to 2017-18
Financial year Total visitors
Persons
2007-08 35 399
2008-09 29 450
2009-10 26 339
2010-11 24 268
2011-12 25 133
2012-13 22 684
2013-14 24 731
2014-15 26 660
2015-16 26 602
2016-17 29 732
2017-18 28 363
Source: Norfolk Island inbound passenger statistics July 2011 (provided for 2011 Report) and Norfolk Island Regional Council, Annual Report for 2017-18, page 49.
Table 4 shows the average daily number of tourists on Norfolk Island in 2017-18
increased the ‘on-island’ population above the ordinarily resident population by 610
people or 34.7%. In the rest of Australia, international tourists represented about
3.0% of the population. This large differential was considered to have a material
impact on Norfolk Island expenses for services such as the health, roads, water, waste
management, culture and recreation facilities. In some other cases, we considered
the additional costs attributable to the higher number of tourists were offset by
higher revenues collected from user charges imposed on tourist accommodation
operators and, so, an allowance was unnecessary. In the case of electricity services,
the method used to derive assessed expenses for electricity subsidies (see
Attachment E) meant an allowance for the impact of tourists was unnecessary.
Table 4 Ratio of visitors to resident population, Norfolk Island and Australia
2009-10 2017-18
Norfolk Island Australia Norfolk Island Australia
Average visitor population 501 500 485 610 738 839
Resident population 1817 22 152 984 1756 24 770 469
Ratio of tourists to total population 0.276 0.023 0.347 0.03
Note: Average visitor population was calculated by reference to the number of visitors to Norfolk Island and their estimated average length of stay (about 7 days).
Source: Norfolk Island Regional Council, 2017-18 report, Total visitor numbers – monthly statistics, page 50; Tourism Research Australia, Visitor, Nights and average stay, for years ending June 2010 to year ending June 2018.

15
As in the 2011 inquiry, the allowance for the impact of tourists has been based on the
ratio of total population (including tourists) to resident population on Norfolk Island
relative to the similar ratio for the rest of Australia. That ratio was halved to reflect an
assumption that tourists used Island services at half the rate of residents. This
allowance implied a 16% increase to the base costs. This allowance is higher than the
13% allowance assessed for 2009-10 in the 2011 inquiry due to an increase in tourist
numbers on Norfolk Island and a fall in the Island’s resident population.
Wage levels
At the time of the 2011 inquiry, wage levels for many people on Norfolk Island were
low. Wages in many areas of the public sector were said to be about 70% of levels in
other Australian jurisdictions. In the hospitality sector, wages tended to be in the
lower part of this range. Those low wage levels were said to partly reflect the tax-free
status of most Island incomes (at that time, income tax was not payable on incomes
earned on the Island). However, staff of mainland service providers, such as teaching
staff, continued to be subject to their mainland conditions of employment, including
wage levels.
The generally lower wages for many Island-based staff were reflected in the assessed
expenses derived in the 2011 inquiry.
Circumstances have changed following the changes in governance and administrative
arrangements introduced in July 2016 which saw Commonwealth and/or New South
Wales legislation extended to Norfolk Island. The changes included the introduction
of income tax, Medicare levy and the associated surcharge, the application of social
security, health and aged care arrangements, and the phasing in of the
Fair Work Act 2009 and superannuation guarantee provisions.
Among the many implications of those changes has been an increase in wages
payable on the Island. For example, the phasing in of the Fair Work Act required
minimum wages on Norfolk to be 85% of levels in other jurisdictions from July 2017
and equal to these levels from July 2018 However, information we received indicated
many employees on the Island, were initially paid more than the minimum.
The changes introduced in July 2016 also resulted in the Commonwealth taking
responsibility for the provision of State-type services to Norfolk Island. While the
service delivery arrangements are still evolving, mainland-based service providers,
NIRC or other Island-based providers (particularly the Norfolk Island Health and
Residential Aged Care Service – NIHRACS) deliver State-type services under service
delivery agreements. Many of the staff needed to provide those services are
recruited from the rest of Australia and paid in line with this level of compensation.
This background indicates wage levels on Norfolk Island in 2017-18 were comparable
with those payable under provisions in the rest of Australia, except for
16
superannuation contributions. Specifically, we note the NIRC enterprise agreement
indicates that NIRC was making superannuation contributions of 5.5% of wages on
behalf of its employees when the agreement was signed in late 2017-18. This rate
compares with the 9.5% contribution rate in the rest of Australia.
We have, therefore, made a small downward adjustment to the 2017-18 assessed
expenses for local government services provided by NIRC. That adjustment reduced
assessed employee expenses for local government services by 3.7%.5
No adjustment was made in the calculation of assessed expenses for State-type
services because it appears mainland levels of wages and superannuation are paid to
the vast majority of staff providing those services.
POPULATION ISSUES
Aspects of Norfolk Island’s population that needed to be addressed in an assessment
of its financial capacity are:
its size
the characteristics that increase or reduce the demand for services – age distribution, socio-economic status and variable climatic conditions (such as the recent drought conditions affecting the Island).
Population size
The ordinarily resident population of Norfolk Island is small and has declined since its
peak in 2001 when it was 2 037. 2016 Census data shows the Norfolk Island
population as 1 748. The Australian Bureau of Statistics has estimated the 2017-18
Norfolk population as 1 756.
Age distribution
Norfolk Island’s population is older on average than the combined population in the
rest of Australia. Figure 1 shows that the proportion of the population in all age
groups above 45 years on Norfolk Island is higher than that in the rest of Australia.
Conversely, the proportion of the Norfolk population in the 20 to 35 years age groups
is well below that in the rest of Australia.
5 This was calculated on the assumption that NIRC employee expenses were wage levels in the rest of
Australia plus a 5.5% superannuation (an index of 105.5) relative to employee costs in other councils of wage levels plus superannuation contributions of 9.5% (an index of 109.5). It is equivalent to a 1.6% reduction to total local government expenses because employee expenses were, on average, only 44% of total local government expenses.

17
The relatively high number of people aged over 65 years on Norfolk Island (24.4% of
its population compared with 15.7% in the rest of Australia) increases its requirement
for some services, including health, other services for the aged and rates concessions.
On the other hand, the relatively low number of young people reduces its
requirement for some services, such as family and child welfare. These differences
between the age profile of the populations of Norfolk Island and the rest of Australia
are taken into account in the derivation of the relevant assessed expenses (see
Attachment E).
Figure 1 Australia and Norfolk Island population by age grouping, 2016 Census
Source: Australian Bureau of Statistics, QuickStats, 2016 Census.
Socio-economic status
Expenditure required to provide some services, such as schools, post-secondary
education, community health services, welfare and public housing, is affected by the
socio-economic status of the population.
However, those effects are relatively small because the socio-economic status of the
Island’s population is close to the Australian average. Norfolk Island’s Index of
Community Socio-Educational Advantage (ICSEA) was 1 005 and its Socio-Economic
Index for Areas (SEIFA) was 1 010, both of which are only slightly above the Australian
average of 1 000.
10 5 0 5 10
0-4
5-9
10-14
15-19
20-24
25-29
30-34
35-39
40-44
45-49
50-54
55-59
60-64
65-69
70-74
75-79
80-84
85+
Proportion (%)
Age
(ye
ars)
Population proportions by 5-year age grouping
Australia
Norfolk Island
18
Community and culture
Descendants of the Bounty mutineers and others who relocated from Pitcairn Island
to Norfolk Island in 1856 are a significant part of the Norfolk Island population. This
group, and its history, influences the culture on the Island in various ways, including
through certain cultural norms that are generally described as ‘the Norfolk Way’, the
use of the Norf’k language and the holding of cultural ceremonies recalling its history.
In the previous Norfolk Island inquiries, the Commission carefully considered whether
the unique community and culture of the Island should be reflected in the estimates
of assessed revenues and expenses. The Commission acknowledges that the
Norfolk Island context and culture is unique, and we have considered this across a
range of assessments of expenses. The Commission has, in particular, attempted to
recognise the specific governance and service delivery arrangements on Norfolk
Island through its assessments. While there are no major fiscal implications for
service delivery, the Commission has accounted for the unique tourism, culture and
recreation needs in its assessments (see relevant areas of the report).
GOVERNANCE AND SERVICE DELIVERY ARRANGEMENTS
The introduction of the Norfolk Island Legislation Amendment Act 2015, and related
Acts, provided for the Australian Government to take responsibility for funding and
delivering Commonwealth and State-type services to Norfolk Island.
Australian Government agencies responsible for Commonwealth-type services, such
as the Department of Health and Ageing, the Department of Human Services and
Parks Australia, are responsible for delivering their services and programs on Norfolk
Island. The Department has responsibility for State-type services.
The legislation also provided for the creation of NIRC with the revenue raising and
service delivery powers of a local government in New South Wales. Like other local
governments, it receives local government financial assistance and local roads grants
from the Commonwealth.
Service delivery arrangements
While the service delivery arrangements are still evolving, mainland based service
providers (such as the New South Wales Department of Education and Ministry of
Health and the Australian Federal Police), NIRC or other Island-based providers
(particularly NIHRACS) deliver State-type services under service delivery agreements
with the Department.
The Department is not the service provider, however plays a preeminent role of
policy adviser, service funder and advocate in Norfolk Island in its liaising with other

19
Australian Government agencies. These service funding and delivery arrangements
result in a greater level of costs associated with contract negotiation, supervision and
reporting. The Department and the contracted service providers incur such costs.
Our calculations of assessed expenses include allowances for such extra
administrative costs. Information from purchasing and contract administration
guidelines produced by the New South Wales and Western Australia Treasury and
Finance departments indicate that typical contract administration costs would be
between 10% and 20% of contractor costs.
We have applied a contract administration allowance of 10% in estimating assessed
expenses of State type services performed under service delivery agreements. We
used the lower point of the State range of costs as many State contracts would be
more complex to oversee and monitor than those for Norfolk Island services.
Grants to local governments
Local governments receive a variety of grants from the Commonwealth and their
State governments.
The annual general purpose FAGs and local roads grants from the Commonwealth are
the largest single source of grant revenue for local governments. They represented
37% of grant revenue received by local governments in the States in 2017-18.
For councils in the States, the local government financial assistance grant process
consists of two basic steps. First, each State receives the same per capita amount.
Second, each State’s local government grants commission allocates that amount
among the State’s local governments. The allocation of grants is intended to broadly
equalise the financial capacities of the local governments in the State to provide
services. The State local government grants commissions also allocate the local roads
grants to individual councils.
NIRC receives the equivalent of financial assistance and local roads grants from the
Commonwealth. The size of those grants for 2017-18 was based on advice from the
New South Wales Local Government Grants Commission. The recommended financial
assistance grant was based on the average per capita amount for Brewarrina, a small
rural agricultural council in New South Wales, and the local roads grant was based on
processes used to determine those grants for councils in New South Wales, which
mainly depends on the population and length of roads and bridges. For 2018-19 and
subsequent years, the FAGs for the NIRC have been supplemented with amounts
based on advice in the KPMG report on remote island disadvantages.6
Local governments in the States are also eligible to apply for a range of grants
provided by the Commonwealth and also receive grants from their State government.
6 KPMG, Analysis of Remote Island Disadvantages – Norfolk Island, December 2017.

20
The State grants cover a wide variety of purposes including community development,
community amenities, roads and other infrastructure. NIRC is eligible to apply for
similar Commonwealth grants under the same conditions as other councils but does
not currently receive the equivalent of State-type grants to councils.
The amounts actually received by NIRC for Commonwealth FAGs to local
governments, local roads grants and other specific purpose grants have been
included in our assessed budget for local government activities. This was because
those amounts are available to all councils to supplement own source revenue and
the amounts provided to NIRC were based on external independent advice.
In the case of State specific purpose grants to local government, we have assessed a
notional grant for Norfolk Island based on the average grant to New South Wales
councils. The assessed grant is currently unfunded. This is discussed further in
Attachment D.

21
3 ASSESSED EXPENSES, REVENUES AND FINANCING REQUIREMENT
This chapter brings together the assessed expenses and assessed revenue for State
and local government type functions on Norfolk Island. It responds to the Terms of
Reference seeking information about:
the annual expenditure, including infrastructure costs, required to provide
State-type government services, local government services and support for legacy State-type government business enterprises, with reference to the
services available in comparable communities
the capacity of Norfolk Island to raise revenue from a comparable range of taxes and charges levied by State and local governments, assuming Norfolk Island makes the average Australian revenue raising effort.
This chapter draws on the approaches and results contained in:
Attachment B: Actual revenue and expenses
Attachment C: State taxes and charges
Attachment D: Local Government taxes and charges
Attachment E: State services
Attachment F: Local Government services
As with State inquiries and the earlier Norfolk Island inquiries, the results in no way
imply how Norfolk Island should be raising revenues or delivering services. Rather,
assessed expenses show how much it would cost to deliver services on the Island of a
comparative nature to those enjoyed by comparable communities in the States.
Likewise, assessed revenue shows how much revenue would be raised if State and
local government revenue raising policies were applied on Norfolk Island.
ASSESSED STATE-TYPE REVENUE
The major State revenues are derived from payroll tax, land tax, stamp duty on
conveyances, insurance tax, motor tax, mining royalties, gambling tax and other
revenue. We estimated the capacity of Norfolk Island to raise revenue from each of
these State-type taxes and charges using a tax-by-tax approach. Details of the
calculations are in Attachment C.
Table 5 summarises our estimates of the State-type revenues that could have been
raised on Norfolk Island in 2017-18 if the average revenue raising policies of the
States had been applied. It shows assessed revenues of $3.2 million or

22
$1 824 per capita in 2017-18, which compares with the actual collections of
$2.3 million or $1 335 per capita. All the actual State-type revenues collected on
Norfolk Island were collected by NIRC and revenue was applied to offset expenses, as
part of the service delivery agreements with the Department.
Table 5 State-type revenue, 2017-18 – summary
State
average
Norfolk Island
Assessed Actual
$pc $pc $ $pc $
Payroll tax 979 17 29 230 0 0
Land tax 363 33 57 796 0 0
Stamp duty on conveyances 825 515 903 809 495 868 640
Insurance tax 214 184 322 793 0 0
Motor tax 448 667 1 171 275 403 707 279
Mining revenue 482 1 1 950 83 146 129
Gambling tax 251 56 97 547 71 124 345
Other revenue 1 545 352 618 665 284 497 937
TOTAL 5 107 1 824 3 203 064 1 335 2 344 330
Source: Commission staff analysis.
The table also compares Norfolk Island assessed revenue with the Australian State
average per capita revenue and actual Norfolk Island revenue. It shows:
Norfolk Island raised 26% of the Australian average per capita State-type
revenue in 2017-18. Norfolk Island’s assessed revenue is below the Australian
average for all revenue sources except motor taxes. It has more than twice the average capacity to raise motor taxes.
We assessed that Norfolk Island could raise some revenue from payroll tax, land tax and insurance tax even though those taxes are not imposed on the Island. However, the amounts it could raise from payroll tax and land tax are low compared to the rest of Australia. This is because there are few Island-based private or public businesses with payrolls above the payroll tax threshold and low taxable land values. Norfolk Island’s capacity to raise gambling taxes is also below that of comparable communities.
Norfolk Island has been assessed as having almost no capacity to raise revenue from mining. Beyond the Cascade rock quarry, there are a few potential sources of rock that have not yet been exploited.
Norfolk Island has the capacity to raise more revenue than its actual revenue in 2017-18. The main areas where actual revenue is well below assessed revenue are motor taxes, insurance tax and, to a lesser extent, other revenue.
Compared to 2011, Norfolk Island’s assessed capacity to raise revenue has
declined by 20%. The abolition of the Norfolk Island Goods and Services Tax, Land tax, gambling tax and insurance tax contributed most to the decline.

23
The Commission also compared Norfolk Island assessed revenues to those of the
Northern Territory, as this is the State or territory with the highest proportion of its
population in remote areas. The Northern Territory’s assessed State-type revenues in
2017-18 were $5 596 per capita, or about three times that of Norfolk Island.
LOCAL GOVERNMENT REVENUE
The assessed local government revenues have been derived using the same broad
approach as that used for State revenues. That is, for each tax or charge, the revenue
raising policies observed in broadly comparable circumstances in the States have
been applied to the revenue base on Norfolk Island. Details are in Attachment D.
Table 6 summarises our estimates of the local government revenues that could have
been raised on Norfolk Island in 2017-18 if the average revenue raising policies of
comparable councils in the States had been applied. It also shows the grants NIRC
received from the Commonwealth. Table 6 shows assessed local government revenue
of $4 460 per capita or $7.8 million in 2017-18, which is below the actual revenue of
$4 698 per capita or $8.2 million.
Table 6 Local government-type revenue, 2017-18 – summary
Revenue State
average
Norfolk Island
Assessed Actual $pc $pc $ $pc $
Financial assistance grants
General purpose 67 1 335 2 343 708 1 335 2 343 708
Local roads 29 60 106 030 60 106 030
Other grant support 0 0 0
Commonwealth 41 38 67 500 38 67 500
State 124 131 229 585 0 0
Total 262 1 564 2 746 823 1 434 2 517 238
0 0 0
Own source revenue 0 0 0
Municipal rates 739 894 1 569 962 694 1 217 982
User charges 519 339 595 193 571 1 003 007
Contribution from GBEs 0 0 0
Liquor Bond 0 1 339 2 351 044 1 339 2 351 044
Airport 0 17 29 201 17 29 201
Other revenue 401 307 539 265 644 1 130 940
Total 1 659 2 896 5 084 665 3 264 5 732 174
Total local government revenue 1 921 4 460 7 831 489 4 698 8 249 412
(a) The State average figure is the per capita amount paid to the Brewarrina Shire in NSW. Source: Commission staff analysis.

24
Table 6 shows:
The financial assistance grant and local roads grant received by NIRC from the
Commonwealth, which totalled $1 395 per capita, were based on independent recommendations received from the New South Wales Local Government Grants Commission. The recommended financial assistance grant was based on the per capita grant paid to the Brewarrina Shire of $1 302 and the recommended local roads grant was based on the amounts per kilometre of road and per capita paid to councils in New South Wales. In addition, NIRC received tied grants from the Commonwealth of $38 per capita, which was about the all-council average.
We assessed State-type grants, for purposes such as roads, community
development activities and culture, sport and recreation facilities, of $131 per capita or $229 600. That amount was consistent with the amount received by
comparable communities in 2017-18. NIRC did not receive State-type grants in 2017-18.
Norfolk Island raised more revenue per capita from its own sources than the all-council average, reflecting NIRC’s monopoly, by virtue of the Liquor Act 2005, on liquor supply that generates considerable revenue and substantial revenue from rents and interest earnings. Norfolk Island’s assessed capacity from municipal rates is about 20% above the all-council average. Conversely, it would raise less than the all-council average for user charges and other council-type revenues if it followed average policies.
Overall, the assessed local government-type revenue (including own-source and revenues) for Norfolk Island has increased by 55% since 2009-10 but this is mainly due to the introduction of financial assistance grants for Norfolk Island. Assessed
own source revenue grew by a more modest 18% between 2009-10 and 2017-18.
ASSESSED STATE EXPENSES
We have estimated the cost of services normally provided by State governments in
comparable communities, assuming that Norfolk Island operates at the Australian
average level of efficiency. Attachment E provides details of the assessments.
Table 7 compares the all-State average expense per capita for State-type services, the
assessed expenses and what is actually being spent to deliver State-type services on
Norfolk Island. The figures for actual expenses include spending by the Department
and NIRC. For example, the actual expenses for Other expenses ($2.4 million) consists
of $1.9 million spent by the Department and $533 000 attributed to NIRC. The actual
expenses for electricity ($833 000) consists entirely of the operating deficit of NIRC’s
electricity undertaking.
It shows that the current level of spending is about the amount that needs to be
spent to provide comparable services. However, while total assessed and actual

25
spending are about the same, there are some large differences between assessed and
actual spending for some services.
Table 7 State-type expenses, Norfolk Island, 2017-18 — summary
State
average
Norfolk Island
Assessed Actual (a)
$pc $pc $ $pc $
Schools 1 614 4 083 7 169 413 4 153 7 292 744
Post-secondary education 231 324 568 952 0 0
Health and general welfare 0 0 0 0 0
Hospital 2 196 4 623 8 118 214 4 721 8 289 700
Patient transport 25 1 756 3 083 000 1 756 3 083 000
Community health 380 1 698 2 981 458 1 720 3 020 150
General welfare 85 127 223 875 202 354 000
Other Welfare 0 0 0 0 0
Family and child 256 151 264 931 563 989 500
NDIS 373 373 655 794 0 0
Concessions 88 32 56 026 11 18 968
Housing 0 0 0 0 0
Social housing 97 127 222 432 0 0
First home owner grants 25 23 41 141 0 0
Justice 0 0 0 0 0
Police 438 851 1 495 000 1 225 2 151 000
Courts and other legal services (b) 189 202 354 379 494 867 367
Corrective services 196 147 257 263 85 150 000
Services to communities 0 0 0 0 0
Electricity 41 1 079 1 894 855 474 833 071
Water and waste water 18 32 55 499 37 64 607
Community development 88 58 101 821 0 0
Environmental protection 145 50 88 653 183 321 315
Transport 0 0 0 0 0
State roads grant for local government 37 55 97 084 0 0
Port services 1 282 495 008 282 495 008
Services to industry 0 0 0 0 0
Tourism 40 844 1 481 523 597 1 047 888
Industry regulation 121 63 111 354 0 0
Other business development 84 130 228 966 0 0
Other expenses 0 0 0 0 0
Recreation and culture 123 162 285 185 0 0
Public order and safety 62 163 285 740 658 1 155 678
Other (c) 692 7 12 654 1 793 3 148 849
Depreciation 1 013 794 1 394 047 0 0
Total 8 658 18 237 32 024 266 18 954 33 282 844
(a) Actual expenses include expenses incurred by both the Department and NIRC. (b) Actual expenses are made up of $75 000 on the Child & Family Wellbeing Unit; Chief Magistrate
($150 500); Commonwealth Director of Public Prosecutions ($277 700); and Policing, Courts & Legal Services under the SDA ($364 167).

26
(c) For some functions, actual expenses appear as zero. In many cases, this reflects difficulties in disaggregating actual expenses. This explains the very large amount in the other category.
Source: Commission staff analysis.
Table 7 shows:
In 2017-18, assessed expenses were $32.0 million or $18 237 per capita, which is more than double average State spending on service delivery. This is mainly due to Norfolk Island’s remoteness, isolation from the mainland and diseconomies of service delivery from its small scale. These unique circumstances of Norfolk affect most services but especially schools, health, police and electricity provision. The extensive use of service delivery agreements with New South Wales, NIRC, the AFP or private contractors to deliver most State-type services further increases the costs.
Assessed and actual spending on the major areas of schools and health are
similar. These functions account for about 65% of total assessed and actual spending on State-type services.
Tourism is the main industry on the Island. The high per capita costs are due to the need for tourism development, support and promotion services similar to those provided by the States on average.
Like comparable communities in the States, the per capita cost of providing electricity in a small isolated community is very high. All States with off-grid communities similar in size to Norfolk Island provide subsidies to reduce electricity prices. Without State-type electricity subsidies, the price Norfolk Island residents currently pay for electricity is much higher than that in comparable communities.
Actual spending on family and child services is well above average and assessed
spending levels. This likely reflects relatively high costs associated with establishing such services on the Island in 2017-18. Actual spending on justice services (including police and courts) and public order and safety (part of the Other expenses in our analysis) was also substantially higher than we assessed.
Some State-type services were not provided in 2017-18 including first home
owner grants, post-secondary education and State grants for local government. Post-secondary education services were introduced in 2018-19 but the other services remain unavailable. NDIS is available to Norfolk Island residents and we included an allowance for the average per capita State contribution to the National Disability Insurance Agency.7 However, the actual mechanism for contributions to the scheme is unclear.
7 The Commonwealth is responsible for delivering of disability services. Funding is a shared
Commonwealth-State responsibility. The total State contribution to the scheme is agreed between the Commonwealth and States. States fund the total State contribution on an equal per capita basis.

27
Although Table 7 shows no actual expenses for cultural and recreation services, the Commonwealth is responsible for and funds KAHVA and the national park, which provide significant benefits to the Norfolk Island community.
States do not generally subsidise port services. However, we assessed a subsidy
for these services (based on the actual payment to NIRC to manage and operate the port) because the port provides an essential service.
Assessed State type depreciation for Norfolk Island is less than the average. This is
because some assets that all States provide are not needed on the Island including State roads and urban transport infrastructure.
Compared with the 2011 report, assessed expenses have increased by about 120% or
$9 911 per capita, slower than the increase in actual expenses (about 245% or
$13 456 per capita). This is partly due to the increase in wages paid for some services
on the Island, but also suggests that service levels have increased since 2009-10.
The Commission also compared Norfolk Island’s assessed expenses to those raised by
the Northern Territory, as this is the State or territory with the greatest level of
remote areas. The Northern Territory’s assessed State-type expenses in 2017-18 were
$20 604 per capita, or about 12% above those of Norfolk Island in per capita terms.
LOCAL GOVERNMENT EXPENSES
In the rest of Australia, the delivery of local government services is the responsibility
of an elected council, supported by an administrative arm. The services provided by
councils vary between States. Generally, councils provide property related services
including waste management, storm water, local roads and building and planning
services, as well as cultural and recreation facilities. Many councils also provide a
limited range of health, education, aged and welfare services. Some councils provide
water, sewerage and airport services.
A similar conceptual approach as for State assessed costs was used to derive assessed
local government expenses. Details are in Attachment F.
Table 8 compares the average Australian local government expense per capita, the
Norfolk Island actual spending and its assessed expenses for 2017-18. Table 8 shows
that Norfolk Island’s actual spending was about $1.4 million more than we assessed it
needs to spend. More than half this difference is due to the high level of Other
expenses. The actual spending is virtually all spending by NIRC, but may also include
some spending by the Department. Some NIRC spending on functions such as tourism
and the electricity and port undertakings has been classified as State-type spending
and is included in the actual expenses figures in Table 8.

28
Table 8 Local government expenses, Norfolk Island, 2017-18 — summary
State
average
Norfolk Island
Assessed Actual
$pc $pc $ $pc $
General Administration 270 813 1 428 480 456 800 209
Health, housing and welfare 89 122 213 842 0 0
Law order and public safety 37 51 89 060 0 0
Planning and community amenities 128 175 307 823 525 921 736
Environmental protection 183 364 639 592 529 929 210
Recreation and culture 206 314 550 984 0 0
Tourism 19 230 403 376 283 497 613
Roads and bridges 169 382 670 027 802 1 408 135
Depreciation - Roads and bridges 141 394 692 001 523 918 433
Depreciation - Other assets 183 231 406 194 407 714 157
Debt charges 25 0 0 0 0
Other 67 92 160 898 456 800 209
Total 1 519 3 168 5 562 278 3 980 6 989 701
(a) The difference between assessed and actual expenses is partly due to the inability to dissect actual expenses by function.
Source: Commission staff calculation
Table 8 suggests that Norfolk Island would need to spend $3 168 per capita
($5.6 million) to deliver local government services comparable to those provided in
the rest of Australia.
Norfolk Island’s assessed local government expenses are above the amount for comparable communities in all areas except debt charges.
The above average general administration assessed expenses arise because councils with small populations have higher per capita minimum governance requirements.
The above average assessed expenses for tourism are due to the importance of
the tourist industry on Norfolk Island. The assessed expenses for local government-type tourism expenses are about one third of the total assessed spending on State and local government-type tourism functions.
The higher than average assessed cost of environmental services reflects the particular challenges of dealing with waste management on a geographically small and remote island.
The assessed cost of maintaining roads on the Island is above the average. This reflects the effects of remoteness and isolation on the cost of some inputs used for road construction, and the requirement to provide a higher standard of roads, including signage, due to tourism. The same factors explain the above average roads depreciation expenses.
29
Some of these Local Government expenses appear to relate to other functions
including general administration and recreation and culture. As noted in Attachment
B, there is limited information in NIRC’s financial statements to allocate all expenses
by level of government and function.
Compared with the 2011 report, assessed expenses increased by 32% or
$777 per capita, less than the increase in Norfolk Island’s actual expenses (57% or
$1 437 per capita).
OVERALL RESULTS
Table 9 compares what Norfolk Island actually spent and raised in 2017-18 with what
it would have spent and raised if it operated like comparable communities. In
2017-18, there was a difference of $26.6 million between the Norfolk Island State and
local government assessed revenues and expenses. This is the net amount needed to
provide comparable State and local government services at average levels of
efficiency, if comparable State and local government revenues were raised.
The difference between State-type revenues and expenses was $28.8 million.
However, local government grants (including the assessed revenue from State-type
grants) and own source local government revenue exceeded the amount needed to
provide comparable local government services. The assessed local government
surplus would provide NIRC with the capacity to fund some capital expenditure on
new local government-type infrastructure.

30
Table 9 Comparison of Norfolk Island revenue and expenses with assessed revenue and expenses, 2017-18
Norfolk Island assessed Norfolk Island actuals
$pc $m $pc $m
Revenue
State 1 824 3.2 1 335 2.3
Local 4 460 7.8 4 698 8.2
Total 6 284 11.0 6 033 10.6
Expenses
State 18 237 32.0 18 954 33.3
Local 3 168 5.6 3 980 7.0
Total 21 405 37.6 22 934 40.3
Funding difference
State -16 413 -28.8 -17 619 -30.9
Local 1 292 2.3 717 1.3
Total -15 121 -26.6 -16 901 -29.7
Source: Commission staff calculation.
The service delivery arrangements on Norfolk Island are such that the allocation of
actual revenues and expenses between the State and local government levels are
more accurate than in previous inquiries. The main exception is tourism expenses
where the actual shares of State and local government tourism expenses for Australia
were used to allocate total assessed tourism expenses for Norfolk Island. If more
tourism expenses were allocated to local government, the assessed surplus for local
government services would be smaller.
INFRASTRUCTURE
Our assessments allow for the replacement of infrastructure at the rate and level in
comparable communities through a depreciation allowance. However, they make no
allowance for:
capital expenditure on new infrastructure assets at a rate comparable to that in comparable communities
any infrastructure backlog compared to other communities
any capital expenditure or depreciation for assets of government business enterprises, including the airport runway, port and telecommunications assets, although the net financial flows between those enterprises and NIRC are included in the estimated difference. For example, the subsidy for the operation of port and net profit of the airport and other government business enterprises are included in other revenue.

31
Our estimates assume that depreciation provides for the replacement of assets,
either annually, or through accumulated financial balances. To the extent that
appropriate financial balances have not been accumulated, including for business
enterprises such as the electricity, telecommunications and the airport, then
additional funding may be required when major assets need replacing.
NIRC’s financial statements for 2017-18 include depreciation expenses for all
government business enterprises. However, it is unclear whether these funds are
being used to finance the replacement of assets as they age.
The following sections include further observations about major economic
infrastructure owned by NIRC, and observations about how this infrastructure is
provided in comparable communities.
Ports
NIRC operates the Island’s three ports8 and the lighterage services for loading and
unloading sea freight. Since this is usually a State-type service, the Department
through a service delivery agreement funds the net cost of this service.
In the States, port operations are conducted on a full cost recovery basis, so there is
generally no impact on State budgets, other than through the receipt of dividends
and tax equivalent payments.9 However, the relatively low levels of traffic and high
overheads on the Island mean any attempt to fully recover operating and capital
costs would make freight charges extremely prohibitive. It would impose substantial
costs on the community compared to the status quo.
We understand that the current charges on Norfolk Island are only intended to
recover the costs of managing and operating the port, and that there is no provision
for capital expenditure to replace or upgrade the assets. However, the
Commonwealth did provide the capital funds necessary to undertake the upgrades to
the Cascade Pier completed in early 2018.
Airport
NIRC operates the airport and terminal facilities at the standard of an international
airport and there are regular, underwritten, commercial air services to and from
Sydney and Brisbane. The Norfolk Island airport is unlike airports operated by
mainland local governments. Although Norfolk is a small, very remote community,
the airport must accommodate the large jets major airlines use to provide services
over the long distance to Sydney and Brisbane. Comparable communities in very
8 Kingston, Cascade and Ball Bay. 9 In some States, the major ports have been privatised.

32
remote areas of Australia have small landing strips that are frequently unpaved as
they usually accommodate much smaller and more rugged aircraft.
While NIRC has been able to recover operating costs through airport fees and
charges, we consider that it cannot fund capital expenditure to replace or upgrade
the assets due to factors beyond its control, namely:
its distance from other centres (for example, 1 653 kilometres from Sydney) means larger aircraft are necessary compared to other remote centres
Norfolk Island’s isolation, yet extreme dependency on tourism, is unusual for
Australian very remote communities
its status as a divergence airport means it must maintain a capability to take large
jets traversing the Tasman Sea, but it does earn some fees from this capability.
Similar to ports, any attempts to fully cost recover operating and capital spending
would lead to higher airport charges, which would likely have adverse consequences
for the tourism industry. We also note that airports in other regional centres in
Australia receive substantial subsidies from the Commonwealth for infrastructure
upgrades under the Department’s Regional Aviation Access Program. 10
We have thus concluded that NIRC, which owns and operates the airport, has a
limited capacity to fund capital expenditures. This appears to be the reason the
Commonwealth has generally fulfilled this function since the early 2000s. Our
assessments did not include a subsidy for the airport.
Telecommunications (Norfolk Telecom)
The Island’s telecommunications services are also characterised by unique
circumstances. There is no other jurisdiction in Australia that operates its own
telecommunications Government Business Enterprise (GBE). For example,
Christmas Island is part of the Australian network with services provided by Telstra
and calls to and from the rest of Australia are priced as domestic calls. More broadly,
Telstra has a Universal Service Obligation to ensure standard telephone, mobile
services and payphones are reasonably accessible to all people in Australia on an
equitable basis, wherever they work or live. This does not extend to Norfolk Island.
The absence of comparable services on Norfolk Island may be a legacy of the service
provision approach of the former Norfolk Island Government or the operating
difficulties a commercial provider would face.
Norfolk Telecom recorded a net operating result of $329 000 in 2017-18. Since
telecommunications is a Commonwealth function, we excluded that amount from the
10 For details of this program, see https://www.infrastructure.gov.au/aviation/regional/

33
assessed local government-type figures for 2017-18.11 NIRC received a grant of $3.5
million through the Commonwealth’s Building Better Regions Fund program (Round
2) to install a 4G network on Norfolk Island to replace the obsolete 2G network. The
total project cost was expected to be $4.6 million.
11 We included the net contributions of the Liquor Bond and airport because they were considered local
government functions.

34
ATTACHMENT A: CURRENT SERVICE DELIVERY ARRANGEMENTS FOR NORFOLK ISLAND
Figure A-1 provides an overview of the arrangements that existed in late 2018 for the
delivery of services to Norfolk Island.
It shows:
the Australian Government agencies that are responsible for delivering Commonwealth services on Norfolk Island
the service delivery partners the Department of Infrastructure, Transport, Cities
and Regional Development has engaged to deliver State-type services on Norfolk Island
the main local government-type services provided by the Norfolk Island Regional
Council.
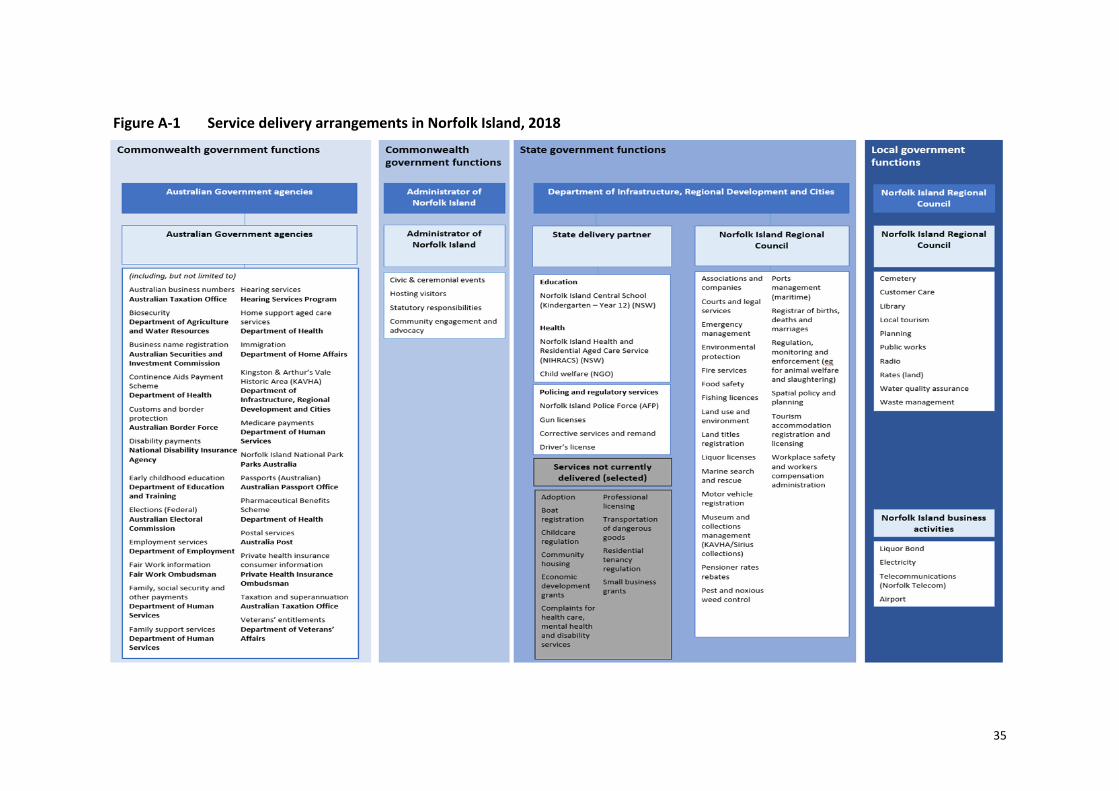
35
Figure A-1 Service delivery arrangements in Norfolk Island, 2018

36
ATTACHMENT B: NORFOLK ISLAND REVENUE AND EXPENSES
INTRODUCTION
Commonwealth, State and local-government type services and taxes are provided
and raised on Norfolk Island. This attachment provides information on how
Commission staff estimated and classified the revenues and expenses of
Norfolk Island by level of government, revenue source and expense function, to
enable the assessment of Norfolk Island’s revenue raising capacities and costs of
service provision. The calculations are for 2017-18 only because data collected for
2016-17 covered a year of major change and were considered unrepresentative of
the longer term situation on the Island.
DATA SOURCES
Data on revenues and expenses relating to Norfolk Island were collected from the
following sources.
The Department of Infrastructure, Transport, Cities and Regional Development (the Department), which provided information on:
spending on the direct provision of services for the Island (such as airline subsidies and payments for magistrates and legal officers)
payments to other agencies which provide services to the Island on its
behalf, including other Commonwealth agencies (such as the Australian Federal Police), New South Wales agencies (including the Departments of Premier and Cabinet, Education, Health and Local Government), the Norfolk Island Regional Council (NIRC), other on-island service providers (such as Norfolk Island Health and Residential Aged Care Service) and non-government service providers
other legislative and service provision arrangements for Norfolk Island.
NIRC’s financial statements for 2017-18 provided details of NIRC’s revenues and expenses including details of the revenues NIRC collected from taxes, charges and
other sources (including fees and charges imposed under the service delivery agreement with the Department). However, while the financial statements provided information on NIRC expenses classified by type of expense (employee benefits, material and depreciation), they contained limited data on expenses attributable to each type of service provided by NIRC and to each of its business undertakings.
37
NIRC’s State Services Delivery Annual Report 2017-18 provided details of NIRC’s total expenses associated with each State-type service it provided under the service delivery agreement with the Department. It also contained details of the revenues NIRC collected from State-type taxes and charges imposed under the service delivery agreement.12
Supplementary data on expenses of NIRC’s major business undertakings and the
costs of some services provided by NIRC in response to Commission data requests.
The 2017-18 annual reports of major service providers (such as the Norfolk Island
Health and Residential Aged Care Service).
METHODS
Staff classified the Norfolk Island revenues and expenses to Commonwealth, State or
local government-type activities on the basis of the level of government that
collects/delivers them in the States.
The classification of some services in this inquiry differs from that in the 2011 Norfolk
Island inquiry. For example, revenues and expenses related to the Kingston and
Arthur’s Vale Historic Area (KAVHA) are classified as Commonwealth revenues and
expenses in this inquiry, but were classified as State items in the 2011 inquiry.
Some of NIRC’s services are provided through commercial business operations. They
include telecommunication services, electricity provision, waste management,
sewerage, airport management and the Liquor Bond. The services provided by some
of those undertakings would be provided by other levels of government in other parts
of Australia. We applied the following classifications to their activities:
Norfolk Telecom was classified as a Commonwealth type undertaking
the electricity and sewerage undertakings were classified as State-type activities
the airport, waste management and Liquor Bond were classified as local
government activities.
The revenues and expenses of most business undertakings (with the major exception
of the waste management services) have been included in the analysis on a net basis.
That is, revenue from the relevant fees and charges has been deducted from the
gross expenses of the service. The resulting net amount has been classified as NIRC
revenue if the business makes a profit and as NIRC expenses if it incurs a loss. This is
consistent with the treatment adopted by the States, which generally record
contributions by business undertakings if they make a profit or subsidies to business
12 In simplified terms, the service delivery agreement between the Department and NIRC provided for
NIRC to retain the revenue from those taxes and charges to offset expenses incurred under the agreement and for the Department to reimburse NIRC for the unrecovered expenses.

38
undertakings if they run at a loss. However, we have shown the gross expenses and
revenues associated with the waste management operations.
Reflecting this inquiry’s focus on State and local government-type activities, our
analysis of government budgets does not include:
spending by other Australian Government agencies associated with the discharge
of Commonwealth activities, such as social security payments, Medicare and pharmaceutical benefits and expenses for the Norfolk Island National Park and the KAVHA
revenues collected from Commonwealth taxes imposed on the Island, especially
income tax
salaries of the Administrator of Norfolk Island13
salaries and other costs incurred by the Department for managing Norfolk Island matters
airline and freight subsidies.
Furthermore, staff were unable to calculate amounts for infrastructure investment
but did include the equivalent of general government depreciation expenses.
NORFOLK ISLAND REVENUES AND EXPENSES
Table B-1 shows the estimated Norfolk Island revenues and expenses for 2017-18
classified by the level of government usually responsible for them. Table B-2 provides
the amounts per capita for the Norfolk Island population.
Table B-1 shows that the 2017-18 total expenses are higher than total revenue for
both Commonwealth and State type functions. However, total revenue exceeds total
expenses for local government type services, which provides some funds for
investment in additional local government assets and infrastructure.
The major contributors to the State-type revenue are NIRC’s collections from land
title fees, motor registration fees and tourism charges (part of the Other revenue
item in the tables).
The biggest contributors to the local government type own-source revenue for
Norfolk Island is the net sales revenue of the Liquor Bond and the municipal rates and
other revenue. Other revenue consisted of user charges, fees and charges which
included NIRC’s rental income from its Department of Civil Aviation circle housing
properties and charges for private works ($293 000).
On the expense side of the budgets, the largest State-type items are:
13 However, expenses of the Office of the Administrator as specified in the service delivery agreement
between the Department and NIRC are included.

39
health services (including the aged care services provided by the Norfolk Island Health and Residential Aged Care Service) and 62% of those expenses was attributable to hospital and aged care services, 22% to community and public health and 16% to patient transport
schools, which covers primary and secondary students (including the $856 000
spent on the broadband satellite internet for the Norfolk Island Central School) as there was no separate spending on post-secondary education in 2017-18
other expenses includes $742 000 the Department paid the New South Wales
Department of Premier & Cabinet for coordinating the provision of services by New South Wales Government agencies on Norfolk Island. It also includes spending on registration and licencing services, staff for the Office of the Administrator on the island (but not the Administrator’s salary) and miscellaneous
administration services, including NIRC’s expenses on managing the service delivery agreement.
The largest local government type expenses are for depreciation, roads and other
services. Other services includes NIRC expenses which cannot be allocated to
separate functions.

40
Table B-1 Norfolk Island revenue and expenses, 2017-18
Federal-type State-type Local-type Total $000 $000 $000 $000
Revenue
Commonwealth grants and support 0 30 101 2 839 32 940 Local government FAGs – general purpose 2 344 2 344 Local government FAGs – local roads 106 106 Specific purpose grants 68 68 NIRC-DITCRD service delivery agreement (a) 3 036 3 036 DITCRD payments to various agencies 27 065 27 065 Roads levy (b) 322 322 Own-source revenue 329 2 344 5 732 8 405 Municipal rates 1 218 1 218 Stamp duty on conveyances (land title fees) 869 869 Motor taxes 707 707 Mining revenue (quarry revenue) 146 146 Gambling revenue 124 124 Interest income 299 299 Waste charges 693 693 Other revenue 498 1 142 1 640 Airport (net) 29 29 Liquor Bond (net) 2 351 2 351 Telecom (net) 329 329
Total revenue 329 32 445 8 571 41 345 Expenses
Schools 7 293 7 293 Health (c) 13 365 13 365 Welfare (c) 2 390 2 390 Justice – police 2 151 2 151 Justice – other 1 017 1 017 Water and waste water (net) 65 65 Electricity (net) 833 833 Waste management 929 929 Environmental protection – other 321 321 Community amenities 922 922 Roads 1 408 1 408 Ports and lighterage (net) 495 495 Tourism (d) 1 048 498 1 546 KAVHA (net) 1 072 1 072 Other expenses – public safety 1 156 1 156 Other expenses — other services 3 149 1 600 4 749 Depreciation — assets other than GBEs’ 1 633 1 633
Total expenses 1 072 33 283 6 990 41 344
Net expenses(+)/Net income(-) 743 838 -1 581 - 1
(a) Under the agreement between the Department and NIRC, NIRC imposes some State-type taxes, fees and
charges and retains the revenues. The amount shown is the net amount NIRC receives for services delivered after those retained revenues are deducted from gross costs.
(b) This is similar to the Commonwealth fuel excise imposed by NIRC which retains the revenue. (c) The allocation of health and welfare expenses in the assessed budget is different to the allocation in this table.
This is to reflect service delivery arrangements on the island where the Norfolk Island Health and Residential Aged Care Services provides general welfare services.
(d) Tourism spending is split between State and local government type of services using the actual shares of State and local tourism expenses.
Source: NIRC annual report for 2017-18 and information provided by the Department and NIRC.

41
Table B-2 Norfolk Island revenue and expenses, average per capita, 2017-18
Federal-type State-type Local-type Total $pc $pc $pc $pc
Revenue
Commonwealth grants and support 0 17 142 1 617 18 758 Local government FAGs – general purpose 0 0 1 335 1 335 Local government FAGs – local roads 0 0 60 60 Specific purpose grants 0 0 38 38 NIRC-DITCRD service delivery agreement (a) 0 1 729 0 1 729 DITCRD payments to various agencies 0 15 413 0 15 413 Roads levy (b) 0 0 183 183 Own-source revenue 187 1 335 3 264 4 787 Municipal rates 0 0 694 694 Stamp duty on conveyances (land title fees) 0 495 0 495 Motor taxes 0 403 0 403 Mining revenue (quarry revenue) 0 83 0 83 Gambling revenue 0 71 0 71 Interest income 0 0 170 170 Waste charges 0 0 395 395 Other revenue 0 284 651 934 Airport (net) 0 0 17 17 Liquor Bond (net) 0 0 1 339 1 339 Telecom (net) 187 0 0 187
Total revenue 187 18 477 4 881 23 545 Expenses
Schools 0 4 153 0 4 153 Health (c) 0 7 611 0 7 611 Welfare (c) 0 1 361 0 1 361 Justice – police 0 1 225 0 1 225 Justice – other 0 579 0 579 Water and waste water (net) 0 37 0 37 Electricity (net) 0 474 0 474 Waste management 0 0 529 529 Environmental protection – other 0 183 0 183 Community amenities 0 0 525 525 Roads 0 0 802 802 Ports and lighterage (net) 0 282 0 282 Tourism (d) 0 597 283 880 KAVHA (net) 610 0 0 610 Other expenses – public safety 0 658 0 658 Other expenses — other services 0 1 793 911 2 705 Depreciation — assets other than GBEs’ 0 0 930 930
Total expenses 610 18 954 3 980 23 545
Net expenses(+)/Net income(-) 423 477 -901 0
(a) Under the agreement between the Department and NIRC, NIRC imposes some State-type taxes, fees and charges and retains the revenues. The amount shown is the net amount NIRC receives for services delivered after those retained revenues are deducted from gross costs.
(b) This is equivalent to the Commonwealth fuel excise imposed by NIRC which retains the revenue. (c) The allocation of health and welfare expenses in the assessed budget is different to the allocation in this table.
This is to reflect service delivery arrangements on the island where the Norfolk Island Health and Residential Aged Care Services provides general welfare services.
(d) Tourism spending is split between State and local government type of services using the actual shares of State and local tourism expenses.
Source: NIRC annual report for 2017-18 and information provided by the Department and NIRC.

42
ATTACHMENT C: STATE TAXES AND CHARGES
INTRODUCTION
The Terms of Reference for this inquiry ask us to:
(3) Determine the capacity of Norfolk Island to raise revenue from a comparable range of taxes and charges levied by State and local governments.
The Terms of Reference also say that capacity should be based on the assumption
that ‘Norfolk Island makes the average Australian revenue raising effort from its state
and local government equivalent revenue bases’.
METHOD
As in Commission inquiries into the financial capacities of the States and previous
Norfolk Island inquiries, we have satisfied the Terms of Reference by estimating the
overall capacity of Norfolk Island to raise revenue from State and local
government-type taxes and charges using a tax by tax approach.
We estimated Norfolk Island’s capacity to raise revenue from each tax by applying the average tax rates and exemptions of the States and local governments to the potential revenue bases on Norfolk Island. Details of the calculations for State-
type taxes are in this attachment and those for local government-type taxes are in Attachment D.
Where appropriate, the Norfolk Island tax bases were adjusted to take account of the unique circumstances of the Island or to better align estimates with what could be raised in comparable communities in the States and Territories.
The assessed revenue for each tax was then summed to estimate overall assessed revenue.
This approach gives an estimate of what Norfolk Island could raise if the average tax
policies of the States were applied to its potential revenue bases. It recognises all
communities within a State face the same tax regimes but the per capita amounts
raised may differ from community to community because their circumstances and
potential revenue bases differ.
Our estimates of Norfolk Island’s capacity to raise revenue from each tax have, as far
as possible, been based on data and information on the size of the potential revenue
bases on the Island in 2017-18. We have not made adjustments for any possible
effects on those revenue bases which might stem from the introduction of State-type
taxes. For example, 2017-18 land values were used to estimate the capacity to raise
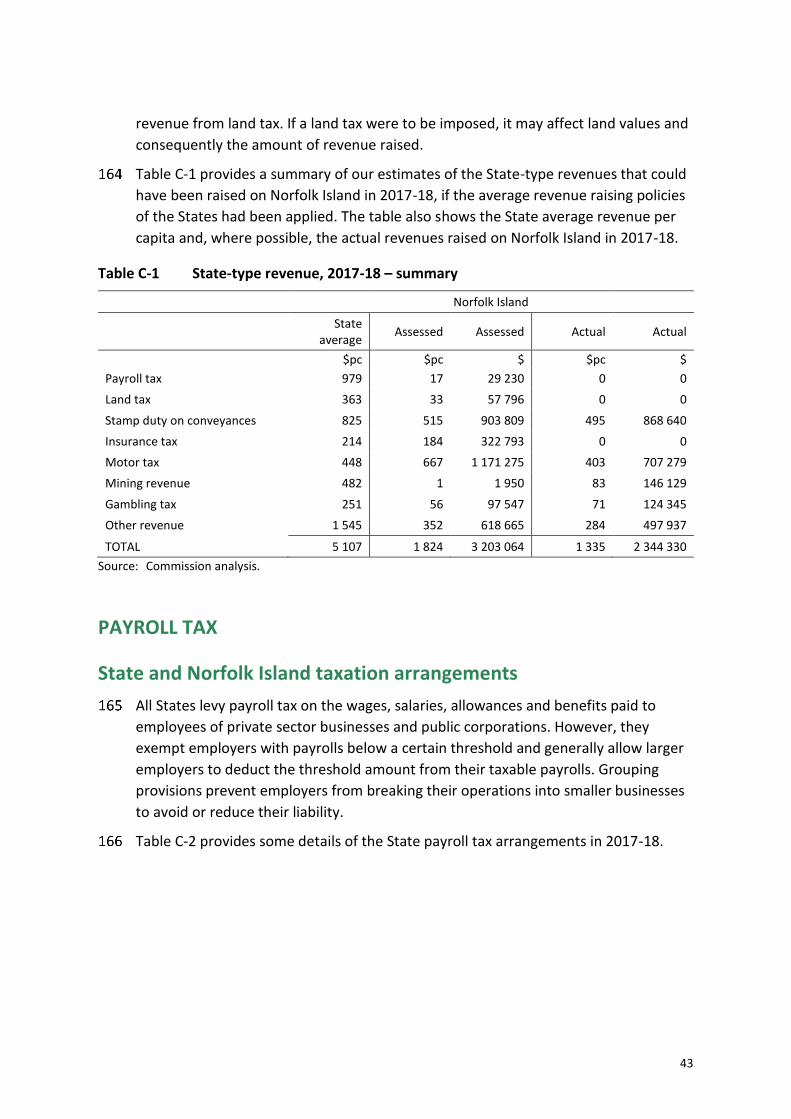
43
revenue from land tax. If a land tax were to be imposed, it may affect land values and
consequently the amount of revenue raised.
Table C-1 provides a summary of our estimates of the State-type revenues that could
have been raised on Norfolk Island in 2017-18, if the average revenue raising policies
of the States had been applied. The table also shows the State average revenue per
capita and, where possible, the actual revenues raised on Norfolk Island in 2017-18.
Table C-1 State-type revenue, 2017-18 – summary
Norfolk Island
State
average Assessed Assessed Actual Actual
$pc $pc $ $pc $
Payroll tax 979 17 29 230 0 0
Land tax 363 33 57 796 0 0
Stamp duty on conveyances 825 515 903 809 495 868 640
Insurance tax 214 184 322 793 0 0
Motor tax 448 667 1 171 275 403 707 279
Mining revenue 482 1 1 950 83 146 129
Gambling tax 251 56 97 547 71 124 345
Other revenue 1 545 352 618 665 284 497 937
TOTAL 5 107 1 824 3 203 064 1 335 2 344 330
Source: Commission analysis.
PAYROLL TAX
State and Norfolk Island taxation arrangements
All States levy payroll tax on the wages, salaries, allowances and benefits paid to
employees of private sector businesses and public corporations. However, they
exempt employers with payrolls below a certain threshold and generally allow larger
employers to deduct the threshold amount from their taxable payrolls. Grouping
provisions prevent employers from breaking their operations into smaller businesses
to avoid or reduce their liability.
Table C-2 provides some details of the State payroll tax arrangements in 2017-18.

44
Table C-2 State payroll tax arrangements, 2017-18
Australian average ($ per capita) $979
Australian average revenue base per capita (a) ($ per capita) $20 102
Australian average tax rate (% of taxable wages) (b) 4.9%
Australian average exemption threshold ($ per employer) $760 000
(a) Measured as the value of wages, salaries, allowances and benefits paid by private sector businesses and State and local government corporations above the exemption threshold.
(b) Calculated as revenue per capita divided by revenue base per capita. Source: Commonwealth Grants Commission calculations for 2019 Update of State revenue sharing relativities
and New South Wales Treasury, Interstate Comparison of Taxes, 2017-18.
Payroll tax is not imposed on Norfolk Island.
Assessed revenue for Norfolk Island
The potential payroll tax revenue base for Norfolk Island consists of three
components:
payrolls of Norfolk Island private businesses
payrolls of Norfolk Island publicly owned businesses
payrolls paid on Norfolk Island by Australian businesses operating on the Island.
Advice from Norfolk Island and Commission staff analysis of current circumstances on
Norfolk Island indicated no Norfolk Island-based private or public businesses had a
payroll above the threshold.
As in the 2011 inquiry, the only payrolls on Norfolk Island that would be potentially
subject to payroll tax under average State policies are those of large interstate
employers. Those employers would receive no exemptions for their Norfolk Island
payrolls because they would be offset against their State-based wages.
The only such employers identified were the two mainland banks operating on
Norfolk Island. Staff made a broad estimate of their payrolls on the basis of indicative
details of the bank staffing, average salaries of bank branch staff on the mainland and
the payrolls estimated in the 2011 inquiry.
The resulting estimated payrolls were about $600 000. Applying the average State tax
rate to that estimate implied assessed revenue of $29 000 for 2017-18 (see table C-1).
This estimate is similar to that assessed for 2009-10 in the 2011 inquiry ($26 000).

45
LAND TAX
State and Norfolk Island taxation arrangements
All States, except the Northern Territory impose a land tax. However, there is much
variation across the States in their taxation arrangements. In general, land tax is
imposed on commercial, industrial and other income producing land.14 Principal
residential properties and productive rural land are usually exempt, but hobby farms
are not. Leasehold land is variously treated. The tax scales are progressive but tax
free thresholds and the points at which the tax rates change vary between States.
Table C-3 provides some details of the State land tax arrangements in 2017-18.
Table C-3 State land tax arrangements, 2017-18
Australian average revenue per capita ($ per capita) $363
Australian average revenue base per capita ($ per capita) (a) $60 088
Australian average tax rate (% of taxable land) (b) 0.8%
Australian average exemption threshold ($ per landowner)
Varies between zero in the ACT and $600 000 in QLD
(a) Measured as the value of commercial, industrial and other income producing land (including non-principal places of residence).
(b) Calculated as total revenue per capita divided by the total value of taxable land per capita. However, land tax is imposed on a progressive basis with Australian average rates increasing from 0.1% in the lowest value range to 1.6% for properties valued at over $3 million.
Sources: Commonwealth Grants Commission calculations for 2019 Update of State revenue sharing relativities and New South Wales Treasury, Interstate Comparison of Taxes, 2017-18.
Land tax is not imposed on Norfolk Island. An absentee landowner’s levy was
imposed but has been abolished. The last assessments were made in late 2016. They
yielded $95 per capita in 2016-17.
Assessed revenue for Norfolk Island
As in Commission inquiries into the financial capacities of the States, we have
measured Norfolk Island’s revenue base for land tax as the value of commercial,
industrial and non-principal residence land. Since land tax is a progressive tax, the
data were classified into value ranges.
Those estimates were made using details of the unimproved value and land type
classification for each property on the Island, provided by the Norfolk Island Regional
Council (NIRC). The land valuations were prepared in mid-2018 by the Valuer-General
for Norfolk Island.
14 The ACT land tax is imposed on only income producing residential property and commercial property is
exempt.

46
While the valuation data provided reliable details of the value of commercial and
industrial land, it was necessary to estimate the value of land used for non-principal
residences. The value of residential and rural residential properties was apportioned
between principal and non-principal residences by reference to the proportion of
households on Norfolk who rent their home as observed in the 2016 Census. A similar
process is adopted in Commission inquiries into State financial capacities when States
cannot provide the relevant details.
The resulting estimated value of taxable land on Norfolk Island was $58.5 million.
Properties valued at less than $200 000 accounted for 65% of that total value.
Applying the average State tax rate for each value range to the taxable value of land
in each range produced a total assessed land tax revenue of $58 000 for 2017-18 (see
table C-3).
That estimated assessed revenue is much lower than that assessed for 2009-10 in the
2011 inquiry ($942 000). About 90% of the reduction in assessed revenue is due to a
fall in land values. The estimated taxable value of land in 2009-10 was $109.2 million,
of which 71.7 per cent was valued at over $1 million per property. However, by
2017-18, the taxable value of land had fallen to $58.5 million and only 3.3% of it was
accounted for by properties valued at over $1 million. The remaining fall in assessed
revenue was due to a decline in the average State tax rates.
The Valuer-General for Norfolk Island has indicated the fall in the taxable value of
land reflects the combined effects of an overestimation of previous land values.
STAMP DUTY ON CONVEYANCES
State and Norfolk Island taxation arrangements
All States levy stamp duty on conveyances on the transfer of a range of real property
including land, houses and business property.15 The duty is paid by the purchaser.
The duty is levied on the market value of property transferred. States have tiered rate
structures where the marginal rate of duty generally increases with the value of
property. Many States impose a surcharge on purchases of residential properties by
foreigners.16 All States grant exemptions or concessions to some types of transfers,
especially those involving first home buyers.
15 Some also levy duty on the transfer of non-real property such as copyright, goodwill, patents,
partnership interest, options to purchase and units in a trust. However, they are to be abolished when budget circumstances allow.
16 For the purposes of residential properties, foreign individuals are: not an Australian citizen, a permanent resident, a New Zealand Citizen with a Special Category Visa, or a person ordinarily resident in Australia.

47
Table C-4 provides some details of the State conveyance duty arrangements in
2017-18.
Table C-4 State stamp duty on conveyances arrangements, 2017-18
Australian average revenue per capita $825
Australian average revenue base per capita (a) $21 981
Australian average tax rate (b) - % of value 4.2%
(a) Measured as the market value of property transferred. (b) Calculated as total revenue per capita divided by the total taxable value of property transferred.
However, stamp duty on conveyances is imposed on a progressive basis with Australian average per capita rates increasing from 2.4% in the lowest value range to 4.8% for properties with a value over $1.5 million.
Sources: Commonwealth Grants Commission calculations for 2019 Update of State revenue sharing relativities and New South Wales Treasury, Interstate Comparison of Taxes, 2017-18.
Land title fees are charged on Norfolk Island. The fee is 4% of the payment for the
transfer or $935 when there is no payment in 2017-18. We treated these fees as
stamp duty on conveyances. The same approach was used in the Commission’s 2006
and 2011 inquiries.
Assessed revenue for Norfolk Island
Norfolk’s assessed revenue for 2017-18 has been estimated by applying the average
State conveyance duty rates to the value of land transferred during 2017-18. The
value of the transfers was dissected by value range to enable the assessment to take
account of the State’s progressive rate structure. The same process is used in the
Commission’s State financing inquiries and in previous Norfolk Island inquiries.
NIRC has provided details of the value and type of property transfers in the 2016,
2017 and 2018 calendar years. However, the data indicated many of the transfers
were made for ‘natural love and affection’ and are not valued. Furthermore, the data
showed considerable volatility in the number and value of transfers over the three
years, which may have reflected the changes and uncertainty on Norfolk Island over
those years.
In the States, conveyance duty based on the value of the property transferred would
be imposed on the value of property transferred for ‘natural love and affection’. We,
therefore, estimated the value of those transfers on Norfolk Island. We did so on the
basis that the value of each transfer for ‘natural love and affection’ was equal to the
average value per property of ‘priced’ transfers of a similar type of property. For
example, each of the 13 rural properties and the four business properties transferred
for ‘natural love and affection’ were assumed to have a value equal to the average
value of ‘priced’ transfers of rural and business properties, respectively.
While State revenue bases for stamp duty on conveyances show year to year
volatility, the volatility on Norfolk Island over 2016 to 2018 was much higher. To

48
better reflect the potentially taxable activity in less turbulent times, we estimated
Norfolk Island’s revenue base as the average value of transfers over the three years
2016 to 2018, plus the estimated value of transfers ‘for natural love and affection’.
Applying the average State tax rate for each value range to the estimated value of
transfers in each range produced a total assessed conveyance duty revenue of
$904 000 for 2017-18 (see Table C-1).
That estimated assessed revenue is higher than that assessed for 2009-10 in the 2011
inquiry ($640 000). The increase in assessed revenue reflects an increase in the
estimated revenue base between 2009-10 and 2017-18. The estimated value of
potentially taxable transfers on Norfolk increased from $20.8 million in 2009-10 to
$28.4 million in 2017-18, and the number of transfers rose from 70 to 98.17
INSURANCE TAX
State and Norfolk Island taxation arrangements
All States, except the ACT, impose a tax on the value of insurance premiums
pertaining to risks located in their State. In most States, the taxes are imposed on
premiums for insurance policies covering homes and other buildings, businesses,
personal incomes, vehicles (including compulsory third party insurance) and lives.
Table C-5 provides some details of the State insurance tax arrangements in 2017-18.
Table C-5 State insurance tax arrangements, 2017-18
Australian average revenue per capita ($ per capita) $214
Australian average revenue base per capita (a) ($ per capita) $1 578
Australian average tax rate (b) (% of value ) 14.2%
(a) Measured as the estimated value of premiums, including premiums for compulsory third party insurance.
(b) Calculated as total revenue per capita divided by the total value of per capita premiums. Sources: Commonwealth Grants Commission calculations for 2019 Update of State revenue sharing relativities
and New South Wales Treasury, Interstate Comparison of Taxes, 2017-18.
Insurance tax is not imposed on Norfolk Island.
17 All figures include transfers where a value was recorded and those for ‘natural love and affection’ but
exclude transfers usually exempt under State taxation provisions (such as transfers following the death of a joint tenant or under the terms of a will).

49
Assessed revenue for Norfolk Island
Norfolk’s assessed revenue for 2017-18 has been estimated by applying the average
rate for insurance tax in the States to the estimated value of insurance premiums
paid on Norfolk Island in 2017-18.
No data were available on insurance premiums paid on Norfolk Island, nor were any
data available on insurance premiums for risks located in remote/very remote
communities in the States. In the absence of such data, we estimated the potential
insurance tax revenue base for Norfolk Island by applying the per capita value of
premiums paid in Tasmania ($1 294 per capita) to the Norfolk Island population.
On this basis, potentially taxable premiums in 2017-18 were estimated as
$2.3 million. Applying the average State tax rate to that base produced assessed
revenue of $323 000 (see Table C-1).
That estimated revenue for 2017-18 is lower than the $545 000 assessed for 2009-10
in the 2011 inquiry, notwithstanding an increase in the average rate of tax from
11.4% in 2009-10 to 14.2% in 2017-18. The fall in assessed revenue reflects the
combined impact of some earlier overestimation of the revenue base for 2009-1018
and the effects of recent events on the value of assets and businesses on
Norfolk Island.
MOTOR TAX
State and Norfolk Island taxation arrangements
All States impose annual motor vehicle registration fees. However, the States each
have their own scale of charges and there are different charging regimes for light and
heavy vehicles. In New South Wales, Western Australia and the ACT, registration fees
for light vehicles are based on the weight of vehicles. In Queensland, South Australia
and the Northern Territory fees are based on the number of cylinders or engine
capacity. Tasmania uses both weight and engine size and Victoria bases its fees on the
type of fuel. For heavy vehicles, a national charging regime applies with rates based
on gross mass, number of axles, body type and trailer use.
All States also charge a stamp duty on the initial registration of vehicles and any
subsequent transfers. The duty is based on the value of the vehicle and the rate
generally increases with the value of the vehicle.
Table C-6 provides some details of the State motor tax arrangements in 2017-18.
18 The estimated value of premiums on Norfolk Island for 2009-10 was $2 632 per capita compared with
the all State average premiums of $1 248 per capita and the Tasmanian premiums of $975 per capita.

50
Table C-6 State motor tax arrangements, 2017-18
Australian average revenue per capita
Light vehicles ($ per capita) $268
Heavy vehicles ($ per capita) $62
Stamp duty on registrations and transfers ($ per capita) $118
Australian average revenue base per capita (a)
Light vehicles (vehicles per 1000 population) 707
Heavy vehicles (vehicles per 1000 population) 18
Stamp duty on registrations and transfers ($ per capita) $3 350
Australian average tax rate (b)
Light vehicles ($ per vehicle) $379
Heavy vehicles ($ per vehicle) $3 406
Stamp duty on registrations and transfers (% of value) 3.5%
(a) Measured as the number of vehicles per 1 000 population for light and heavy vehicle registration fees and vehicle value per capita for stamp duty on registrations and transfers.
(b) Calculated as total revenue per capita divided by the total number of light/heavy vehicles for registration fees or the value of vehicles transferred for the stamp duty.
Sources: Commonwealth Grants Commission calculations for 2019 Update of State revenue sharing relativities and New South Wales Treasury, Interstate Comparison of Taxes, 2017-18.
The NIRC imposes motor vehicle registration fees according to a scale of charges
which reflects the types of vehicle and their use. For example, the fee for a private
vehicle was $180 in 2017-18 and that for commercial vehicles with a load capacity of
over 1 tonne was $765. There is also a flat fee of $28 for transfers of registration.
However, stamp duty does not appear to be imposed on the initial registration of
new vehicles.
Assessed revenue for Norfolk Island
The calculation of Norfolk Island’s assessed revenue was done in three parts:
light vehicle registration fees and taxes
heavy vehicle registration fees and taxes
stamp duty on motor vehicle registrations and transfers.
The average fees in the States for light and heavy vehicles were applied to the
number of registered vehicles by type on Norfolk Island. For the stamp duty element,
the average tax rate in the States was applied to an estimate of the value of vehicles
registered or transferred on Norfolk Island.
Light and heavy vehicles registration fees
The necessary details of the number and type of vehicles on the Island were provided
by the NIRC. They indicated 2 275 light vehicles and 35 heavy vehicles were registered

51
on the Island in 2017-18. Applying the State average tax per vehicle to those numbers
produced assessed revenues of $863 000 for light vehicles and $119 000 for heavy
vehicles.
The resulting total of $982 000 is higher than the $703 000 assessed in the 2011
inquiry. That increase is almost entirely due to increases in the average fees imposed
in the States as a similar number of vehicles was on the register in both years. The
average fee for a light vehicle rose from $281 in 2009-10 to $379 in 2017-18 and for a
heavy vehicle they rose from $2 245 in 2009-10 to $3 406 in 2017-18.
Stamp duty on vehicle registrations and transfers
At the time of the 2011 inquiry, data were available on the number and value of
vehicles imported to Norfolk Island and the number of existing vehicles transferred
on Norfolk Island. However, no data were available for this inquiry on the value of
new vehicles registered, vehicle imports or the number and value of vehicles where
the registration was transferred.
In the absence of data, we estimated the Norfolk Island revenue base by assuming
the per capita value of initial registrations and on-island transfers of vehicles was the
same as that for Tasmania. This approach gave an estimated value of vehicles
registered or transferred in 2017-18 of $5 387 000 compared to $2 186 000 for
2009-10. This increase in the value of vehicles is broadly consistent with the increase
in the number of vehicles imported to the Island – it more than doubled from 97 in
2009-10 to 217 in 2017-18.
Applying the average State tax rate to that estimated value of vehicles produced an
assessed revenue for 2017-18 of $189 000. The assessed revenue for 2009-10 derived
in the 2011 inquiry was $71 000. The increase in assessed revenue is the combined
effect of the increase in the estimated value of vehicles registered or transferred and
the increase in the average State rate of tax from 3.2% in 2009-10 to 3.5% in 2017-18.
Total motor tax
The total 2017-18 assessed revenue for motor taxation is $1 171 000 (see Table C-1),
which is higher than the $774 000 assessed previously for 2009-10.
MINING REVENUE
State and Norfolk Island taxation arrangements
All States (apart from the ACT, which does not have any mineral production) levy
royalties on mineral producers. Mining revenues are an important component of
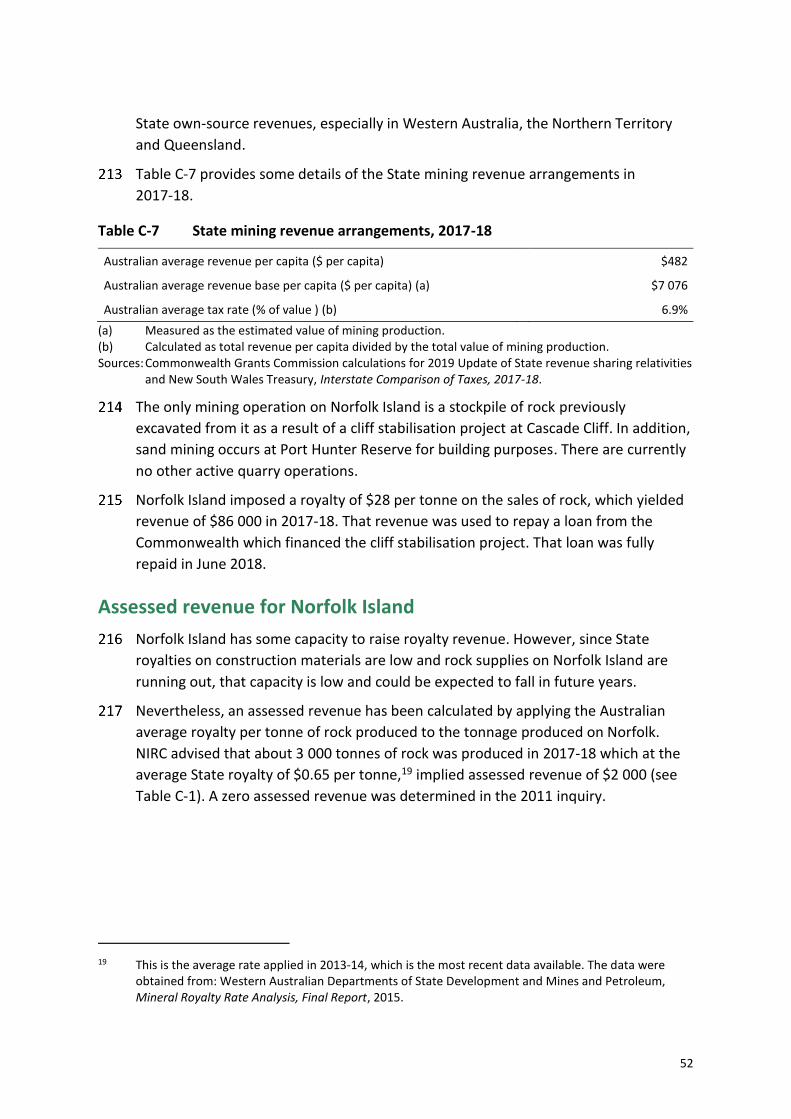
52
State own-source revenues, especially in Western Australia, the Northern Territory
and Queensland.
Table C-7 provides some details of the State mining revenue arrangements in
2017-18.
Table C-7 State mining revenue arrangements, 2017-18
Australian average revenue per capita ($ per capita) $482
Australian average revenue base per capita ($ per capita) (a) $7 076
Australian average tax rate (% of value ) (b) 6.9%
(a) Measured as the estimated value of mining production. (b) Calculated as total revenue per capita divided by the total value of mining production. Sources: Commonwealth Grants Commission calculations for 2019 Update of State revenue sharing relativities
and New South Wales Treasury, Interstate Comparison of Taxes, 2017-18.
The only mining operation on Norfolk Island is a stockpile of rock previously
excavated from it as a result of a cliff stabilisation project at Cascade Cliff. In addition,
sand mining occurs at Port Hunter Reserve for building purposes. There are currently
no other active quarry operations.
Norfolk Island imposed a royalty of $28 per tonne on the sales of rock, which yielded
revenue of $86 000 in 2017-18. That revenue was used to repay a loan from the
Commonwealth which financed the cliff stabilisation project. That loan was fully
repaid in June 2018.
Assessed revenue for Norfolk Island
Norfolk Island has some capacity to raise royalty revenue. However, since State
royalties on construction materials are low and rock supplies on Norfolk Island are
running out, that capacity is low and could be expected to fall in future years.
Nevertheless, an assessed revenue has been calculated by applying the Australian
average royalty per tonne of rock produced to the tonnage produced on Norfolk.
NIRC advised that about 3 000 tonnes of rock was produced in 2017-18 which at the
average State royalty of $0.65 per tonne,19 implied assessed revenue of $2 000 (see
Table C-1). A zero assessed revenue was determined in the 2011 inquiry.
19 This is the average rate applied in 2013-14, which is the most recent data available. The data were
obtained from: Western Australian Departments of State Development and Mines and Petroleum, Mineral Royalty Rate Analysis, Final Report, 2015.

53
GAMBLING TAX
State and Norfolk Island taxation arrangements
States collect a range of revenues by imposing licence fees and turnover taxes on a
range of gambling activities, including electronic gaming machines, casinos, racing
and sports betting and lotteries.
The form of those taxes varies across the States. The average revenue raised by the
States from taxes on all gambling activities in 2017-18 was $251 per capita.
Arrangements for gambling activities on Norfolk Island differ from those in most
States. The Norfolk Island Gaming Authority, which previously issued licences and
imposed fees and taxes on bookmaking, totalisator/online exchange betting
products, interactive home gaming and internet/online lottery licences, was
disbanded by the Commonwealth. A payment of $124 000 was made to
Norfolk Island in 2017-18 to replace the foregone revenue. Similar payments will be
made until 2019-20 at least. There are no electronic gaming machines, casinos or
associated revenue on Norfolk Island.
Assessed revenue for Norfolk Island
The States have a wide range of policies relating to the type and level of gambling
activities permitted and the taxation of them. In those circumstances, the
Commission, in its inquiries into the financial capacities of the States, considers each
State has the capacity to raise the average per capita revenue from taxing gambling.
We applied a similar approach in this inquiry. However, as the only permitted
gambling is lotteries and other minor activities, assessed revenue has been derived by
applying the average State gambling tax revenue from lotteries and other related
gambling activities ($56 per capita in 2017-18) to the Norfolk Island population. This
produced an assessed revenue of $98 000 (see Table C-1).
The 2017-18 assessed revenue is lower than the $468 000 assessed for 2009-10 in the
2011 inquiry. The lower assessed revenue in the current inquiry reflects the reduced
level of gambling activity on Norfolk Island.
OTHER REVENUE
This category comprises a wide range of comparatively small revenue sources where
differences between the States in their capacity to collect the taxes are primarily
driven by the policy choices of the State governments. It primarily covers revenue
from fees and fines and user charges, other than those related to health, education

54
and emergency services. Revenues related to those services are offset against the
expenses in our assessments.
Some States collect revenue from metropolitan improvement levies and duty on
corporate reconstructions. However, those revenues have been excluded from our
analysis because there is no capacity to collect them on Norfolk Island. We also
excluded State revenue from interest earnings because the funding arrangements for
State-type activities on Norfolk Island leave no capacity to earn interest.
The Commission’s method for this category in its State inquiries assumes each State
could collect the average per capita revenue.
The same approach has been adopted for the current inquiry. The average State
revenue per capita from the charges in the category was $1 545 in 2017-18. When
that amount is applied to the Norfolk Island population the resulting assessed
revenue is $619 000, or $352 per capita (see Table C-1). This is less than the assessed
revenue for 2009-10 of $757 000 derived in the 2011 inquiry. The reduction reflects
changes in the amounts of State revenue in this category and in our methods,
specifically the extent to which some user charges revenues are offset against the
related expenses.

55
ATTACHMENT D: LOCAL GOVERNMENT TAXES AND CHARGES
INTRODUCTION
This attachment provides details of how we estimated the revenue which could be
raised on Norfolk Island from local government-type taxes and charges if policies of
comparable Australian communities were applied. Local government revenues have
been defined to include those taxes normally raised by local governments in the rest
of Australia. Those revenues include municipal rates, user charges and other
revenues.
METHODS
The assessed local government revenues have been derived by the same broad
process as that used for State revenues. That is, for each tax or charge, the revenue
raising policies observed in broadly comparable circumstances on the mainland have
been applied to estimates of the revenue base on Norfolk Island.
The choice of the mainland circumstances used to derive the base or standard
revenue raising policies for each tax or charge depended on what we considered was
most consistent with the circumstances of Norfolk Island. In some cases, we derived
the base or standard policies from an average of those adopted by local governments
in all or selected States (such as Tasmania), in others we based them on King Island
policies. The basis of each choice is explained in this attachment.
As far as possible, we measured the potential revenue base on Norfolk Island using
data provided by NIRC. Where such data were not available estimates have been
made using the most relevant data available from State or local government sources.
The methods used to estimate revenue raising capacity carry no implications for how
revenue should be raised on Norfolk Island. Many different approaches could be
adopted and decisions about such local government-type revenue raising policies are
a matter for the NIRC.
Table D-1 provides a summary of our estimates of the local government-type
revenues that could have been raised on Norfolk Island in 2017-18 if the average
revenue raising policies of comparable councils in the States had been applied. The
table also shows: financial assistance and local roads grants provided by the
Commonwealth; specific purpose grants to local government by their State

56
government; the average revenue per capita for all councils (except the ACT); and,
where possible, the actual revenues received on Norfolk Island in 2017-18.
Table D-1 Local government-type revenue, 2017-18 - summary
Revenue State
average (a)
Norfolk Island
Assessed Actual
$pc $pc $ $pc $
Financial assistance grants (b)
General purpose 67 1 335 2 343 708 1 335 2 343 708
Local roads 29 60 106 030 60 106 030
Other grant support
Commonwealth 41 38 67 500 38 67 500
State 124 131 229 585 0 0
Total 262 1 564 2 746 823 1 434 2 517 238
Own source revenue
Municipal rates 739 894 1 569 962 694 1 217 982
User charges 519 339 595 193 571 1 003 007
Contribution from GBEs
Liquor Bond 0 1 339 2 351 044 1 339 2 351 044
Airport 0 17 29 201 17 29 201
Other revenue 401 307 539 265 644 1 130 940
Total 1 659 2 896 5 084 665 3 264 5 732 174
Total local government revenue 1 921 4 460 7 831 489 4 698 8 249 412
(a) Excludes ACT. (b) The State average financial assistance and local roads grant is the per capita amount received by the
Brewarrina Shire, which is the base the New South Wales Local Government Grants Commission used to determine the recommended financial assistance grant for Norfolk Island plus the all State average per capita local roads grant.
Source: Commission staff analysis.
MUNICIPAL RATES
Rating arrangements
Municipal rates are charged by the vast majority of local councils in Australia. The
basis on which they are charged varies from State to State. They are generally based
on the value of land but also often include a base fixed charge per property. Charges
applied to residential and commercial properties may vary.
The average per capita rate revenue collected by all councils in the States (excluding
the ACT) in 2017-18 was $739.
57
A municipal rating structure was introduced on Norfolk Island in 2016-17. Under the
Local Government Act 1993 (NSW) (Norfolk Island), NIRC was required to levy
ordinary rates which would produce minimum revenues of $500 000 in 2016-17 and
$1 000 000 in 2017-18 and future years. In 2016-17 and 2017-18, the rates imposed
depended on the use20 and size of properties. However, the rating model changed in
2018-19 to one where the charges consist of a base amount plus an amount based on
the value of the property. The base amounts and the tax rate applied to property
values under the new rating model varies with the land use classification of the
property.
Assessed revenue for Norfolk Island
Insufficient information was available for us to prepare a measure of the average
rating policy of local governments across Australia. This was primarily because of
differences in the basis of valuation. Some States use unimproved values, some use
land values and others use an annual value concept.
In the absence of other information, we used the per capita King Island rate revenue
for 2017-18 ($1 223 per capita) to measure the base or standard revenue raising
effort. That figure was applied to the Norfolk Island population to derive an initial
estimate of the assessed municipal rate revenue for 2017-18.
However, we considered that initial estimate overstated the capacity of NIRC to raise
revenue because of differences in the recent economic circumstances of
Norfolk Island and King Island. In particular, land values have been increasing on King
Island but they appear to have fallen substantially on Norfolk Island. To allow for the
impact of those differences, the initial estimate was reduced by 30%, which reflected
the fall in land valuations on Norfolk.
The New South Wales local government legislation which is applied to Norfolk Island
requires councils to provide eligible pensioners with a rates rebate of up to $250. The
legislation also says 55% of those rebates are to be financed by the State and 45% by
the councils. We, therefore, made a further small adjustment to the assessed
revenue to take account of the council funded component of the rebate.21
As was done in the 2011 inquiry, we also applied the rating policies of the Shoalhaven
City Council, a community with some similarities to Norfolk Island22, to the land
valuation data for Norfolk Island. This implied potential rate revenue of $1.8 million.
That figure is broadly comparable with the final estimated assessed revenue for
Norfolk Island, once allowance is made for the impact of the larger urban areas in
20 There were three main classifications of property use – residential, farmland and business. 21 An allowance for the equivalent of the State funded component of the pensioner concessions is
included in the calculation of the State-type expenses for concessions in the Welfare category. 22 The Shoalhaven area depends on tourism, fishing, pastoral and horticultural activities.
58
Shoalhaven on the rates needed to fund the services required (for example, relatively
more kerbing, street lighting and recreational facilities would be expected).
The final estimated assessed revenue of $1.6 million for 2017-18 is similar to the
$1.4 million assessed for 2009-10 in the 2011 inquiry.
OTHER REVENUE
Local governments in the rest of Australia raise revenues from a wide range of
charges and fees for goods and services, interest on cash balances and investments.
These include building application fees, development fees, subdivision fees, water,
sewerage, septic and waste levies, licence fees and fines, hall hire charges, landing
charges and dog registration fees.
The basis on which these revenues are collected varies considerably from State to
State and council to council. In view of the broad similarities between Norfolk Island
and King Island, we used the average per capita non-rate revenue collected by King
Island as the basis of the assessed revenue for Norfolk Island. In 2017-18, King Island
collected $625 per capita from its miscellaneous fees, charges, interest and other
revenues. About half of that revenue ($316 per capita) came from charges for waste
collection and disposal.
That base (or standard) per capita revenue implied an assessed revenue for Norfolk
Island of $1.1 million. This is largely because the amounts actually collected by NIRC
from rent of council properties ($563 000 or $320 per capita) and interest earnings
($291 00023 or $166 per capita) exceed those collected by the King Island Council and
are used as the base for the assessment. 24 The total assessed revenue is therefore
lower at $539 000.
Airport
We note that the airport operating result in 2017-18 was positive ($29 000),
indicating that the operating costs can be fully met through airport fees and charges.
The small profit on continuing operations has been included as a revenue in the local
government revenue assessment. For further discussion about the airport see
Attachment F — Local Government services.
23 Norfolk Island Regional Council Financial Statement for 2017-18, notes 3(c) and 3(d), page 16. 24 The King Island Council Financial Statement for 2017-18, notes 2.7 and 2.8, pages 10 and 11, indicate it
collected rents of $70 705 ($44 per capita) and interest and investment income of $227 780 ($143 per capita).

59
FINANCIAL ASSISTANCE AND LOCAL ROADS GRANTS
The Commonwealth provides financial assistance and local roads grants to all local
governments, including NIRC.
For councils in the States, the local government financial assistance grant process
consists of two basic steps. First, the Commonwealth makes an amount available for
each State, with each State receiving the same per capita amount ($67 per capita in
2017-18). Second, a local government grants commission in each State allocates that
amount among the local governments in the State. The allocation of grants is
intended to broadly equalise the financial capacities of the local governments in the
State to provide services, subject to all councils receiving a minimum amount.
The State local government grants commissions also allocate the local roads grants to
individual councils. In New South Wales, councils receive an amount based on the
population in the council’s area, plus an amount per kilometre of its local roads, plus
an amount per metre of bridges.
The 2017-18 financial assistance and local roads grants for NIRC were based on
independent advice from the New South Wales Local Government Grants
Commission. It determined the recommended financial assistance grant by applying
the per capita grant for the Brewarrina Shire to the Norfolk Island population.25 The
local roads grant was based on the per capita, per kilometre of road and per metre of
bridges used in deriving the grants for local governments in New South Wales.
The total amount paid to NIRC for financial assistance and local roads grants for
2017-18 was $2.4 million. That amount is to increase to $3.5 million in 2018-19, partly
to allow for some additional factors facing a remote island community not fully
reflected in the grant provided to Brewarrina.
GRANTS FROM STATE GOVERNMENTS
Local governments typically receive funding in the form of specific purpose grants
from their State government. Many of those grants relate to roads, community
development activities and culture, sport and recreation facilities. The grants are
generally obtained following council applications to the State agency administering
each program.
These grants are transfers from the State to the council. They are a State expense and
a council receipt. When the combined State and local government financial position
25 In its calculations, the New South Wales Local Government Grants Commission used a Norfolk Island
population of 1 800 which is slightly larger than the 1 756 figure used in our assessments.

60
of Norfolk Island is determined, those transactions should offset each other and the
final spending of the funds on the relevant service would appear as a council expense.
Our assessed State-type expenses for Services to communities, Roads and Other
expenses include amounts equivalent to the grants States provide to local
governments.
Ideally, the assessed local government-type revenues would include an amount for
assessed revenue from State-type grants that would reflect NIRC’s receipt of the
grants included in the assessed State expenses. However, sufficient details were not
available to adopt that approach. We therefore estimated NIRC’s assessed State grant
revenue by reference to the average per capita grants provided by New South Wales
to its local governments, which was $131 in 2017-18. Applying that figure to the
Norfolk Island population produced an assessed revenue from State grants of
$230 000.
61
ATTACHMENT E: STATE GOVERNMENT SERVICES
INTRODUCTION
The Terms of Reference for this inquiry asked the Commission to:
(1) Calculate the amount of annual expenditure, including infrastructure costs, required to provide state-type government services, local government services and support for legacy state-type government business enterprises on Norfolk Island, taking into account the circumstances of Norfolk Island.
The Terms of Reference also says estimates of annual services must have regard to
services available in comparable communities and assume Norfolk Island operates at
the average level of efficiency.
This attachment considers what it would cost to provide services on Norfolk Island
like those normally provided by State governments.
SCOPE OF STATE SERVICES
In the rest of Australia, State governments provide the following services.
education including pre-school, school and post-secondary education.
health including hospital, community and public health services.
welfare including child protection, out of home care and social housing.
police, prisons, criminal courts and other legal services.
water supply, wastewater and electricity subsidies, community development and
environmental protection.
transport including State roads and public transport.
services to industry including tourism promotion, other economic development and business and industry regulation.
general public services including the legislature, central administrative agencies that support State service delivery, emergency services and fire protection.
Table E-1 shows the classification of State government services adopted for this
inquiry. It also shows the average State expenses and Norfolk Island assessed and
actual expenses for 2017-18, which includes spending by the Department of
Infrastructure, Transport, Cities and Regional Development (the Department) and the
Norfolk Island Regional Council (NIRC).

62
Table E-1 State-type expenses, Norfolk Island, 2017-18 — summary
State
average
Norfolk Island
Assessed Actual
$pc $pc $ $pc $
Schools 1 614 4 083 7 169 413 4 153 7 292 744
Post-secondary education 231 324 568 952 0 0
Health and general welfare 0 0 0 0 0
Hospital 2 196 4 623 8 118 214 4 721 8 289 700
Patient transport 25 1 756 3 083 000 1 756 3 083 000
Community health 380 1 698 2 981 458 1 720 3 020 150
General welfare 85 127 223 875 202 354 000
Other Welfare 0 0 0 0 0
Family and child 256 151 264 931 563 989 500
NDIS 373 373 655 794 0 0
Concessions 88 32 56 026 11 18 968
Housing 0 0 0 0 0
Social housing 97 127 222 432 0 0
First home owner grants 25 23 41 141 0 0
Justice 0 0 0 0 0
Police 438 851 1 495 000 1 225 2 151 000
Courts and other legal services 189 202 354 379 494 867 367
Corrective services 196 147 257 263 0 0
Services to communities 0 0 0 0 0
Electricity 41 1 079 1 894 855 474 833 071
Water and waste water 18 32 55 499 37 64 607
Community development 88 60 105 627 0 0
Environmental protection 145 52 91 967 183 321 315
Transport 0 0 0 0 0
State roads grant for local government 37 55 97 084 0 0
Port services 1 282 495 008 282 495 008
Services to industry 0 0 0 0 0
Tourism 40 844 1 481 523 597 1 047 888
Industry regulation 121 63 111 354 0 0
Other business development 84 130 228 966 0 0
Other expenses 0 0 0 0 0
Recreation and culture 123 162 285 185 0 0
Public order and safety 62 163 285 740 658 1 155 678
Other 692 7 12 654 1 793 3 148 849
Depreciation 1 013 794 1 394 047 0 0
Total 8 658 18 241 32 031 387 18 868 33 132 844
(a) Actual expenses include expenses incurred by both the Department and NIRC. (b) The difference between assessed and actual expenses is due to the inability to dissect actual expenses
by function. Source: Commission staff analysis.
63
The classification of services is similar to the classification the Commission now uses
for its inquiries into State finances and as such differs from that used in the 2011
inquiry.
The following sections discuss the approaches used to calculate comparable State-
type expenses for Norfolk Island.
METHODS
The 2011 Norfolk Island inquiry used two methods to derive assessed expenses.
Assessed expenses were either based on those in a comparable community in other
parts of Australia (including in some cases the all-State average expense) or existing
costs on Norfolk Island. Where costs for a comparable Australian community were
used, adjustments were made to take account of Norfolk Island’s unique
circumstances (for example, lower wages, isolation and the influence of tourism).
Many of the methods adopted in 2011 were based on those used in the 2006 Norfolk
inquiry.
For this inquiry, we have drawn on the latest methods and data the Commission uses
for its State finance inquiries. There have been significant changes to the
Commission’s methods since the 2011 inquiry because it has been asked to simplify
its methods and the available data have changed, particularly in the areas of schools,
police and health.
For each service category, we considered whether we could use the methods the
Commission is developing for its 2020 Review methods to derive assessed expenses
for Norfolk Island. We concluded they were appropriate for most services. The
following sections outline the methods used to assess Norfolk Island State-type
service expenses.
SCHOOLS
State service and funding arrangements
State governments spent $40 billion on government and non-government schools in
2017-18, which was about 19% of total State government spending. Both the
Commonwealth and State governments fund government schools. States provide
around 80% of government recurrent funding for government schools, and the
Commonwealth provides 20%, mainly through the Quality school funding program.

64
States usually provide one year of pre-school for four or five year olds in the year
before full-time schooling. Preschool programs are intended to be available for a
minimum of 600 hours per calendar year (or 15 hours per week for 40 weeks).26
Norfolk Island service and funding arrangements
Norfolk Island Central School provides kindergarten to Year 12 classes. It is the only
school on Norfolk Island. There were 287 enrolments in 2018 and approximately 25
full-time equivalent teaching staff plus nine ancillary and support staff. The total cost
of services in 2017-18 was $6.4 million plus internet costs of $856 000. See table E-2
for an overview of the school.
The internet costs were significantly higher than those for comparable mainland
schools. We were unable to identify why that was so.
Table E-2 Norfolk Island Central School, 2018
Enrolments (K-12) 287
Index of Community Socio-Educational Advantage (ICSEA) (the Australian average ICSEA value is 1 000) 1,005
Proportion of students in the bottom ICSEA quintile 17%
Teaching staff (full-time equivalent) 25.3
Ancillary and support staff (full-time equivalent) 9.5
ABS remoteness area Very remote
Aboriginal or Torres Strait Islander students(a) 1%
Language background other than English 56%
Cost(b) $7.3 million
Student attendance rate 93%
(a) Students of Aboriginal or Torres Strait Islander descent who identify themselves as an Aboriginal or Torres Strait Islander and are accepted as such by the community in which they live.
(b) Includes Internet costs of $856 000. Sources: My School website; https://myschool.edu.au/school/42158; accessed on 27/6/19, Norfolk Island
Central School Annual Report 2017 and financial data supplied by the Department.
The NSW Department of Education currently provides teaching services at the school
on Norfolk Island.27 Teaching staff at the school must meet the professional
requirements for teaching in New South Wales public schools. In 2017-18, ancillary
and support staff were engaged through a Service Delivery Agreement between NIRC
and the Department. The Commonwealth funds all services.
26 The Commonwealth contributes to the cost of pre-school through the National Partnership Agreement
on Universal Access to Early Childhood Education. This program supports a minimum of 15 hours of pre-school per week.
27 Teachers at the school are recruited on a three-year contract from New South Wales and complete a minimum two-year term. Recent funding to improve the school’s IT infrastructure has enabled students and staff to access a greater range of services. The diverse school curriculum includes classes in the Norf’k language and culture.
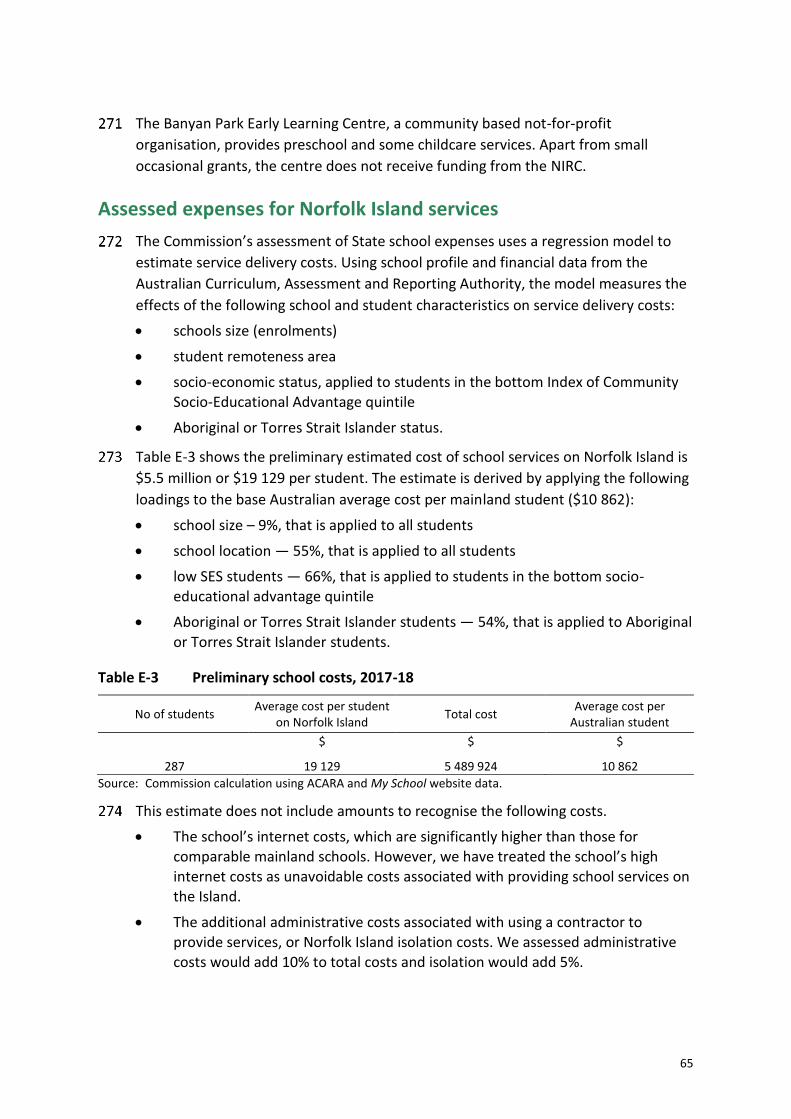
65
The Banyan Park Early Learning Centre, a community based not-for-profit
organisation, provides preschool and some childcare services. Apart from small
occasional grants, the centre does not receive funding from the NIRC.
Assessed expenses for Norfolk Island services
The Commission’s assessment of State school expenses uses a regression model to
estimate service delivery costs. Using school profile and financial data from the
Australian Curriculum, Assessment and Reporting Authority, the model measures the
effects of the following school and student characteristics on service delivery costs:
schools size (enrolments)
student remoteness area
socio-economic status, applied to students in the bottom Index of Community Socio-Educational Advantage quintile
Aboriginal or Torres Strait Islander status.
Table E-3 shows the preliminary estimated cost of school services on Norfolk Island is
$5.5 million or $19 129 per student. The estimate is derived by applying the following
loadings to the base Australian average cost per mainland student ($10 862):
school size – 9%, that is applied to all students
school location — 55%, that is applied to all students
low SES students — 66%, that is applied to students in the bottom socio-educational advantage quintile
Aboriginal or Torres Strait Islander students — 54%, that is applied to Aboriginal
or Torres Strait Islander students.
Table E-3 Preliminary school costs, 2017-18
No of students Average cost per student
on Norfolk Island Total cost
Average cost per Australian student
$ $ $
287 19 129 5 489 924 10 862
Source: Commission calculation using ACARA and My School website data.
This estimate does not include amounts to recognise the following costs.
The school’s internet costs, which are significantly higher than those for comparable mainland schools. However, we have treated the school’s high
internet costs as unavoidable costs associated with providing school services on the Island.
The additional administrative costs associated with using a contractor to provide services, or Norfolk Island isolation costs. We assessed administrative costs would add 10% to total costs and isolation would add 5%.

66
After making these adjustments, the final assessed cost of providing comparable
school services was $7.2 million in 2017-18, or $4 083 per capita.28
Table E-4 Schools assessment
2017-18
Preliminary cost ($) 5 489 924
Administrative loading 10%
Isolation loading 5%
Cost excluding internet costs ($) 856 000
Total cost ($) 7 169 413
Total cost ($ per student) 24 981
Source: Commission staff calculation.
This estimate reflects government student funding from all sources (Commonwealth
and States) and implicitly includes an amount for the provision of the Australian
average level of pre-school services.29 It also includes locality allowances and
corporate overheads including curriculum and assessment costs.
POST SECONDARY EDUCATION
State service and funding arrangements
Total Australian State government net expenses on post-secondary and other higher
education30 was $6 billion in 2017-18, representing 2.6% of total State expenses.
State post-secondary education expenses include spending on subsidised courses
provided in State government institutions and subsidies provided to private training
providers.
States provide post-secondary education through networks of public Technical and
Further Education institutes and private Registered Training Organisations. These
providers offer courses spanning foundation skills, certificate programs including
apprenticeships, diplomas, advanced diplomas and bachelor degrees. The campuses
used for service delivery are widely dispersed in all States, and States with dispersed,
small communities provide services in many of those communities.
Each State sets the subsidy levels for courses. States consider a range of factors in
setting subsidies including staffing levels, what equipment and facilities they involve,
the level of qualification and relevance of the training to State skill requirements (or
28 This per capita amount is calculated by dividing total assessed expenses by the Norfolk Island
population. Tables E-3 shows costs per student. 29 Norfolk Island Central School does not currently provide pre-school services. 30 Other higher education, which is mostly post-secondary education, accounts for about 5% of the total.

67
public value). States subsidise a higher proportion of the cost of lower level courses
(for example, foundation skills, and certificate I and II) and apprenticeships.
Part of the cost of subsidised training is met through student fees. Eligibility criteria
for fee exemptions and concessions are a matter of individual State policy. All States
offer concessions or exemptions to government benefit recipients, and most offer
them to Aboriginal or Torres Strait Islander students.
Although post-secondary education is a State responsibility, the Commonwealth
provides financial assistance to States to deliver these services. In 2017-18, the
Commonwealth provided $1.7 billion to the States for this function.
Norfolk Island service delivery and funding arrangements
Until January 2019, Norfolk Island residents could not access the subsidies for
post-secondary education courses. Recognising a service delivery gap, the
Commonwealth-funded Vocational Education and Training Financial Assistance
Initiative opened for applications in January 2019. As at April 2019, three Norfolk
residents had applied for that financial assistance. In addition, up to five residents
were preparing to sign up for apprenticeships.
The Initiative will reimburse Norfolk Island Post-secondary education students the
difference between the course fee they pay and the fee they would pay, for the same
course, in a mainland State. A contractor is delivering the program on behalf of the
Commonwealth. The contractor will receive and assess all applications from students
seeking assistance and provide reimbursements on receipt of satisfactory claims for
payment.
To be eligible to receive assistance, clients must be:
15 years or older
an Australian citizen
a resident of Norfolk Island
not receiving any other Commonwealth or State financial support towards the
course (student loans are not considered financial support under this Initiative).
Assessed expenses for Norfolk Island services
Our assessment of post-secondary education costs is based on average spending by
States on different population groups. Relevant population characteristics considered
in the assessment are Aboriginal or Torres Strait Islander status, socio-economic
status and remoteness. The target population for these services is the working
population, which is 15 to 64 year olds. Applying the Commission’s method to the
Norfolk Island population, we estimated the cost of providing comparable post-
secondary education services on Norfolk Island would be $495 000 in 2017-18. After
68
applying a 10% administration and 5% isolation loading, the final estimated cost is
$569 000 per capita.
HEALTH
State service delivery and funding arrangements
Total State government spending on Health was $64 billion in 2017-18, which was
30% of total State expenses. That spending covered expenses for admitted and non-
admitted patient services in public hospitals, community health and patient transport
services. Aged care became a solely Commonwealth responsibility in 2015-16.
In 2016-17, States provided 51% of funding for all public hospital services (including
non-admitted hospital services) and the Commonwealth provided 41%. The
remaining 8% was from non-government sources, including private health insurance,
injury compensation insurers, self-funded patients and other sources of private
revenue.
In addition to hospital services, States provide community and public health services
including dental services, primary health care, family and child health services,
alcohol and drug services, community mental health services, cancer screening,
health promotion and environmental health services.
All States provide aero-medical ambulance services using fixed wing aircraft and
helicopter. These services provide people in regional areas with rapid access to
transport to major hospitals for both emergencies and routine care. In addition, all
States offer patient assisted travel subsidy schemes that provide financial assistance
towards the cost for patients who must travel long distances to access specialist
medical services.
The Commonwealth funds Medicare and the Pharmaceutical Benefits Scheme in their
entirety. It is the primary funder of primary health services in Australia.
Norfolk Island service delivery and funding arrangements
From July 2016, Norfolk Island has been integrated with mainland taxation and social
security benefits. Like other Australians, Norfolk Islanders now have access to the
Medicare and the Pharmaceutical Benefit Schemes.
Hospital services (on and off-island)
The Norfolk Island Health and Residential Aged Care Service (NIHRACS) is a
multi-purpose service providing acute care including emergency services, residential
aged care, and primary and community health care services. The Norfolk Island health
69
facility has six inpatient adult beds and two emergency bays. NIHRACS’ facilities and
services are similar to other block funded multi-purpose services in remote and very
remote Australia.31
The Australian Government through agreements administered by Department funds
the following services and schemes:
The hospital, primary and community health services provided on Norfolk Island
Organisation governance and clinical advice to NIHRACS provided by the South
Eastern Sydney Local Health District and delivery of some provisions of the NSW Public Health Act
Medical evacuations, usually to Sydney, by regular air services or if necessary
specialised medical evacuation and subsequent treatment of patients who require
procedures that are too complex to be provided on the Island.32
The Norfolk Island Patients’ Travel Accommodation and Assistance Scheme (elements of which mirror the New South Wales Isolated Patients Travel and Accommodation Assistance Scheme).33 It covers the cost of flights to the mainland to see a specialist and provides subsidies for accommodation and travel while patients are seeking medical treatment.
Data on client numbers indicate there has been a sustained and significant increase in
Norfolk Island residents using health services and essential medicines on the Island,
using services on the mainland and accessing travel assistance since health service
arrangements changed in July 2016.34
Total expenses of NIHRACS was $11.3 million in 2017-18, partially offset by user
charges of $1.3 million. The Commonwealth provided $10.6 million to NIHRACS in
2017-18 to defray costs through the service delivery agreement. About $4.2 million
was incurred on coordination and oversight provided by New South Wales health
agencies.
Part of the Norfolk Island costs relate to aged care. Since aged care is solely a
Commonwealth responsibility, the assessment should exclude those expenses.
However, we found that the information to do this is limited. However, we used the
31 Block funded hospitals are smaller, typically regional and remote hospital facilities that receive a
Commonwealth contribution in a single ‘block’, based on the volume of services they provide and their remoteness. In contrast, activity based funding hospitals are funded for the number and mix of patients they treat. See the Independent Health Pricing Authority website https://www.ihpa.gov.au for more information.
32 The transfers are subject to a clinically determined protocol, but are primarily for procedures that cannot be resolved at Norfolk Island’s health facility, more complex procedures and emergency procedures.
33 https://www.health.nsw.gov.au/transport/Pages/iptaas.aspx [accessed 9/6/2019]. 34 https://www.regional.gov.au/territories/norfolk_island/administrator/media/2018/ni-a-mr-
201801.aspx [accessed 24/07/2019].
70
information35 to estimate that about 11% of activity at NIHRACS is devoted to aged
care services. The Commonwealth Department of Health and Ageing through the
residential aged care subsidy and Multi-purpose Services program, as well as resident
contributions, provides funding for aged care services. We have assumed that the
revenue from these sources is sufficient to meet all the aged care costs.
State provided non-residential aged care services are classified to Welfare, which is
discussed later in this attachment.
Patient transport
Patient transport includes medical evacuations and patient travel assistance which is
funded by the Department under a service delivery agreement. In 2017-18, there
were 67 medical evacuations with 72 emergency patients taken to the mainland for
emergency medical services.
Patients requiring non-urgent medical attention will travel to a mainland hospital on
an available commercial flight. In relation to costs, eligible out of hospital
accommodation on the mainland and return airfare costs to Norfolk Island are
booked and paid for by the patient, and applicable expenses are reimbursed through
the patient travel assistance scheme. Between 2016-17 and 2017-18, the number of
people claiming travel assistance more than doubled from 381 to 849, but the total
expense only increased by about 33%.
Community health
NIHRACS provides various community health services that are comparable with State
community health services. These include a monthly antenatal clinic and weekly child
health clinic, a nutrition/dietetics clinic, a smoking cessation clinic, physiotherapy,
hydrotherapy, counselling services, social working, medical imaging, pathology, a
dental clinic and community nursing service. The general practice clinic is fully bulk
billed for Medicare cardholders. General practitioners, in part, can work privately
servicing patients, like their colleagues on the mainland.
Assessed expenses for Norfolk Island services
The Commission’s health assessment for States typically estimates the cost to
Australian States of providing health services using national average spending
patterns in comparable institutions as the benchmark.
The assessment of Norfolk Island health expenses includes components for:
Multi-purpose services excluding aged care
35 Norfolk Island Health and Residential Aged Care Service Revenue Management Plan 2018-2021.
Provided to the Commission by NIHRACS in August 2019.

71
patient transport (excluding land ambulance services)
community health.
Hospital services – on-island
The hospital assessment includes services for admitted patients, emergency
department and outpatient services through
on-island treatment at NIHRACS
treatment of Norfolk Island residents in mainland hospitals
organisational governance and clinical advice to NIHRACS provided by New South Wales.
NIHRACS is a small facility in a very remote location. If it was on the mainland it would
be considered as a block-funded hospital.36 Based on the current level of on-island
activity and using King Island’s similar sized very remote facility as a benchmark, we
have classified the on-island facility as a middle-range block-funded hospital in the
Independent Hospital Pricing Authority’s service volume group C.
The Independent Hospital Pricing Authority uses actual expenses from mainland
hospital procedures to estimate the costs of procedures in very remote contexts,
taking into account: the health and demographic status of patients in very remote
contexts, the costs of servicing patients in very remote hospitals and the complexity
of treatment provided to acute and sub-acute patients. The pricing authority’s costing
for block-funded hospitals in group C provides a benchmark estimate of on-Island
hospital costs, of $5.5 million in 2017-18.
Hospital services – off-island
We based the assessed cost of off-island hospital services on national weighted
activity unit data on the use of mainland hospital services by Norfolk Island residents.
The data was sourced from the National Health Funding Body.
For 2017-18, the assessed cost was $2.7 million, based on the 2016-17 activity unit
data indexed by the growth in total Australian activity units.
Patient transport
Patient transport includes aero-medical ambulance services and the reimbursement
of costs through patient assisted travel schemes.
The average cost per person of patient transport for Norfolk Island ($1 798) is
comparable to the cost for other very remote small Island communities, such as
36 See the Independent Health Pricing Authority’s National Efficient Cost Determination 2017-18, sourced
from https://www.ihpa.gov.au/publications/national-efficient-cost-determination-2017-18 in March 2017.

72
Christmas and Cocos (Keeling) Islands ($1 742). It is nearly four times the per capita
cost for the average Australian State ($521) and almost twice the per capita average
cost for Tasmania and the Northern Territory. We concluded actual expenditure is an
appropriate reflection of underlying costs, being a reflection of the transport costs,
the availability of different mainland facilities, the composition and urgency of
treatments required and accommodation costs in different regions. The assessment is
therefore based on actual expenditure of $3.1 million in 2017-18.
Community health
The Community health assessment used Australian average community health
expenses as the base. Adjustments were made to reflect Norfolk Island
socio-demographic characteristics as a mainly non- Aboriginal or Torres Strait
Islander, very remote population, with a middle socio-economic status and an older
age profile.
An adjustment has also been made to reflect the availability of general practitioners
on Norfolk Island. In very remote regions on the mainland, the availability of private
general practitioners who bulk-bill is limited. The availability of general practitioners
affects the level of State spending on community and public health services as they
are substitutable – that is, where there are more private general practitioners there is
a reduced need for State funded community health services.
On Norfolk Island, there is a relatively high level of bulk-billing general practitioner
services available through NIHRACS. This is an unusual situation compared to very
remote communities on the mainland, which typically have few bulk-billing general
practitioners.37 To account for its unusually high provision of general practitioners,
who are funded in part by the Commonwealth through Medicare, the assessment has
discounted the Community health services need for Norfolk Island by 25%. This gives
an assessed Community health expense of $3.0 million in 2017-18.
Table E-5 summarises the assessment for Norfolk Island health expenses, totalling
$14.4 million in 2017-18. This amount includes the assessed expenses for general
welfare services provided by NIHRACS.
37 In some very remote communities privately practicing general practitioners operate out of community
health clinics working partially for themselves and for the State health authority. However, this is the exception.

73
Table E-5 Norfolk Island health services, assessed expenses, 2017-18
Component 2017-18
$
Hospital on-island 5 458 438
Hospital off-island 2 659 776
Patient transport 3 083 000
Community health 2 981 458
General welfare services 223 875
Total 14 406 547
Source: Commission staff analysis.
JUSTICE
State service delivery and funding arrangements
Total Australian State government Justice expenses were $20 billion in 2017-18,
representing 9% of total State expenses. State spending on this function covers
expenses for policing services, criminal courts, other legal services and prisons.
Policing includes the prevention, detection and investigation of crime, road safety, maintaining social order, community safety, crime prevention and bringing offenders to justice. States are responsible for most policing services. The Australian Federal Police enforces Commonwealth law, and deals with issues affecting crime and security at a national level.
Criminal courts services includes the conduct of cases at various court levels,
public prosecution and legal aid. State criminal courts have almost exclusive jurisdiction to hear matters relating to indictable offences, whether they occurred under Commonwealth or State law.
Other legal services include court and legal expenses, civil courts, Attorneys
General departments, crown solicitors and law reform commissions.
Prisons includes the running of prisons and other places of secure detention for convicted persons and alleged offenders of varying levels of security. It also includes juvenile detention, community-based corrections, parole, community service and home detention.
States typically impose user charges for justice services, largely related to legal
services and police provided services, such as at special events.
Norfolk Island service delivery and funding arrangements
Justice services for Norfolk Island involve a similar range of services, including
policing, courts (including criminal and civil courts and other legal services) and
prisons. Our assessment covers these three components.

74
The limited information on crime levels suggests that Norfolk Island has very low
levels of crime, compared with similar communities in Australia. While different
methods for recording crime makes a precise comparison difficult, the balance of
evidence is that crime rates are less than those for Tasmania, which are among the
lowest of the States.
Police
The Australian Federal Police (AFP) provides policing and related services on Norfolk
Island under a service delivery agreement with the Commonwealth. In 2009-10, there
were three AFP officers and three special constables funded by the then Norfolk
Island Administration. At that time, there were periods when the Island was reduced
to two sworn officers, which the AFP generally considers to be below the minimum
number necessary in an isolated locality.
There were three AFP sworn officers in 2016-17. Following a reconsideration of the
policing needs, the AFP engaged another two sworn officers in 2017-18, bringing the
total policing numbers to five. The key consideration for the expansion was to provide
coverage across more shifts and to provide some capacity to more quickly deal with
surge needs. NIRC also funded some associated services, including two community
policing constables, until February 2017 when the Commonwealth absorbed one of
the positions into the AFP and made another obsolete. NIRC now plays no role in
delivering policing services. One of the AFP officers performs the sheriff’s functions
under the service delivery agreement with the Commonwealth.
Courts and other legal services
Norfolk Island has a Supreme Court, Court of Petty Sessions, Coroner’s Court and
residents have access to the Australian Family Court . There are also several tribunals,
including an Administrative Review Tribunal, Employment tribunal and Mental health
tribunal. Some aspects of court proceedings are delivered through audio visual
conferencing systems.
Since July 2016, the Commonwealth has:
modernised the legal framework relating to the criminal code, child welfare and domestic and personal violence laws
has funded the appointment of Federal Court judges to the Supreme Court, an
experienced magistrate to be the Chief Magistrate of the Court of Petty Sessions and several lay magistrates to fulfil the judicial tasks
engaged the Commonwealth Director of Public Prosecutions to provide prosecution services and services to assist the Coroner of Norfolk Island.

75
The clerks and registrars of the courts and the various tribunals are provided by NIRC,
but funded by the Commonwealth, under the service delivery agreement between
the Department and NIRC.
Legal aid is provided through the Administrator, assisted by the Department and
funded by the Commonwealth.
Corrective services
The Norfolk Island police station has lock-up facilities, consistent with the typical
arrangements in remote or very remote communities in the States. During 2016-17,
detainees were supervised by AFP officers. There were also jailers engaged by NIRC
used on an as needed basis under a service delivery agreement with the Department.
However, the Department has since engaged a labour hire firm to engage staff to
assist the police with corrections matters such as supervising detainees and enforcing
community service orders. If an offender is sentenced to a prison term, the
New South Wales system is used – NIRC does not have the facilities to house long-
term prisoners. There is presently one offender detained in New South Wales jails.
The cost of this service in 2017-18 was approximately $150 000. 38
Assessed expenses for Norfolk Island services
Police
We estimated costs by comparing the Norfolk Island arrangements with the typical
policing levels for small very remote and isolated communities in the States. A range
of comparable communities of about 1 000 to 3 000 residents were examined. We
also allowed for the relevant unique circumstances of Norfolk Island.
Norfolk Island’s population is older than the Australian average and below average
levels of Aboriginals and Torres Strait Islanders. These characteristics tend to be
associated with lower levels of crime. On the other hand, it has a substantial tourist
population, which may increase the need for policing services. It also has a relatively
small land area to patrol and a much higher population density than comparable very
remote communities which reduces policing costs.
Unlike most very remote communities in the rest of Australia, Norfolk Island is not
readily accessible 24 hours per day, so the typical model of drawing in officers from
surrounding regions to deal with surges in needs is not feasible. Thus, the assessment
needs to allow for a greater level of Norfolk Island-based officers than that in a
38 Source: Email communication from the General-Manager of the NIRC, in response to the draft report,
24 September 2019.

76
comparable very remote community in Australia, where stations of one or two
officers are common.
Considering these factors, we consider police assessed expenses should cover the
costs of five police officers in a very remote setting. In 2017-18, the estimated cost
including remoteness, isolation and administrative adjustments is $1 495 000. This
estimate covers the base costs of running a police station, higher wages paid to AFP
officers but does not include central office costs related to corporate services or the
use of services such as detective and forensic services.
This allowance provides for a higher level of policing services than the Australian
average due to Norfolk Island’s isolation from the rest of Australia.
Courts and other legal services
We have used expenses typical of other very remote communities in Australia as a
benchmark. Norfolk Island’s remoteness and population characteristics (Aboriginal or
Torres Strait Islander status, socio-economic status and age distribution) were taken
into account when costing these services.
For criminal courts, the national average expenses per defendant in very remote
settings ($3 718 in 2017-18) has been applied to Norfolk Island’s estimated number of
defendants, which was 34 in 2017-18. This gave an estimated cost of services of
$125 000 in 2017-18. Norfolk Island’s assessed expenses were below average due to
its lower level of people who tend to appear in courts – those in the 15 to 44 year age
group and Aboriginal or Torres Strait Islanders.
For other legal services, the national average expenses per capita in very remote
areas ($95 in 2017-18) has been applied to the population, giving a cost estimate of
$183 147 for 2017-18.
These base assessed expenses were adjusted to recognise the higher administration
costs (a 10% allowance), very remote location (a 34% allowance) and isolation costs
(a 5% allowance) on Norfolk Island. The final assessed expenses for administration of
justice services were $354 000 in 2017-18 or $202 per capita.
Corrective services
To estimate the cost of corrective services, the Australian incarceration rate for very
remote communities with Norfolk Island’s population characteristics (Aboriginal or
Torres Strait Islander background, socio-economic status and age) were used to
estimate prisoner numbers. The estimated number of prisoners was two in 2017-18.
This has been applied to the national average expense per prisoner in major cities,
which was $116 000, giving a base assessed expense of $234 000 in 2017-18. A
further adjustment was made to recognise the higher administration costs associated

77
with using New South Wales corrective services. The final assessed expense for
corrective services in 2017-18 was $257 000 or $147 per capita.
WELFARE
State service delivery and funding arrangements
State expenses on Welfare were $20 billion in 2017-18, representing 9% of total State
expenses. State spending on this function comprises:
family and child services, principally child protection and out-of-home care
aged care services
services for people with a disability, including State funding contributions to the
National Disability Insurance Scheme
concessions on water, electricity and municipal rates
other welfare services (including assistance to the homeless, women’s shelters and information, advice and referral services).
States have policy and service delivery responsibility for most welfare services other
than aged care services and, with the full implementation of the National Disability
Insurance Scheme, most disability services. The Commonwealth has responsibility for
these services on Norfolk.
State governments spend significant amounts on child protection and out-of-home
care, early intervention and family support (including intensive family support)
services. Family and child services also cover State expenses on childcare and
after-school care but these represent only a very small proportion of expenses.
All States provide funding to water and electricity providers to fund concessions and
rebates for users on low incomes. Rates concessions, or in some instances a cost of
living concession or rebate, are also provided to those on low incomes.
Other welfare services cover a wide range of services, including homeless persons’
assistance, women’s shelters, care of refugees, prisoners’ aid and information, advice
and referral services. Homelessness services account for the bulk of other welfare
expenses.
The Commonwealth provides some funding to the States for welfare services
including homelessness services
Norfolk Island service and funding arrangements
Since July 2016, residents of Norfolk Island have been entitled to the full range of
Australian social security services.
78
In 2016-17, family and child welfare services were provided by a child welfare officer
engaged by NIRC and funded by the Commonwealth under a service delivery
agreement. The responsibility for this service was transferred to the Norfolk Island
Health and Residential Aged Care Service from January 2017, which has a Child and
Family Wellbeing unit with three staff.
The Department engaged a service provider to be responsible for supervision and
support to this unit from July 2018. It also has a child and family wellbeing team, with
estimated employee costs of $533 000 in 2018-19, to plan and oversee the services
on Norfolk Island.
There are 14 residential aged care beds operated by the Norfolk health service, which
charges each resident $51.21 per day (1 July 2019 rate)) and receives an aged care
subsidy from the Commonwealth.
NIRC rebates of 50% of general rates for eligible pensioners. Consistent with the
policy in New South Wales, 50% of those rebates are reimbursed by the Department.
The National Disability Insurance Scheme was extended to Norfolk Island from 1 July
2018. Prior to then, a voluntary association provided disability information. However,
there was no disability equipment assistance, no alternative care for children and
young people with disabilities and no pre-school or school disability programs.
Assessed expenses for Norfolk Island services
Family and child protection services
Assessed expenses were estimated by reference to average State spending and
service use rates for children aged 0-17 who were the subject of substantiations39.
The assessed use of this service takes into account Norfolk Island’s circumstances in
relation to its age structure (use of the service is limited to children), Aboriginal and
Torres Strait Islander population, level of socio-economic disadvantage 40 and
remoteness.
For Norfolk Island, applying national use rates to its population produced a family and
child protection preliminary assessed expense of $230 000. That preliminary estimate
was adjusted to allow for the additional administrative costs associated with using
contractors to provide services (a 10% allowance) and Norfolk Island’s isolation costs
(a 5% allowance). The final assessed cost of providing comparable family and child
services is $265 000 in 2017-18, or $151 per capita.
39 Substantiations are interventions by the authorities in respect of child welfare. 40 Households are categorised into two categories by socio-economic status – the bottom 40% and the
top 60%, which is the approach the Commission takes with States’ inquiries.

79
National Disability Insurance Scheme
These services are assessed on an equal per capita basis in the Commission’s inquiries
into State finances41 and this is the approach we have taken for Norfolk Island. This
reflects how States are contributing to the cost of scheme. This approach gives rise to
assessed expenses of $656 000 in 2017-18 for Norfolk Island. This is the amount a
State would contribute to the National Disability Insurance Agency.
General welfare
State spending on general welfare includes residual aged care, disability and other
welfare services. Residual aged care and disability services were assessed on an equal
per capita basis. Other general welfare services, which mainly target the working
aged population, were assessed by applying the Norfolk Island working age
population to the national average spend per working age person. The preliminary
estimate made using those approaches were adjusted to allow for the additional
administrative costs associated with using contractors to provide services (a 10%
allowance), Norfolk Island’s remoteness (a 35% allowance) and its additional isolation
costs not captured in the remoteness allowance (a 5% allowance). After making these
adjustments, we estimated the final assessed cost of providing comparable general
welfare to be $224 000 in 2017-18, or $127 per capita.
Concessions
We were advised there were 144 concession card holders on Norfolk Island in
2018-19. 42 Since client numbers do not change much from year to year, that figure
was used to derive the assessed expenses for 2017-18. As the average concession per
card holder was $389 in 2017-18, the assessed concessions expense for Norfolk Island
was $56 000.
HOUSING
State service delivery and funding arrangements
There are three types of social housing: public housing (rented or owned by State
governments), Aboriginal or Torres Strait Islander housing in some States and
41 In the State inquiries, 2011 Census populations are used to estimate State contributions to the
National Disability Insurance Scheme. This aligns the assessment with the agreed Commonwealth-State funding arrangements. For simplicity, we have used 2017-18 populations to estimate Norfolk Island’s contribution.
42 Comprising 132 Centrelink and 12 Department of Veteran’s Affairs concession card holders. Information provided by the Norfolk Island Regional Council in May 2019.

80
community housing managed by not-for-profit organisations. Around three-quarters
of social housing dwellings are provided through public housing authorities.
State gross expenses for Housing were $6 billion in 2017-18 of which about $3 billion
was recovered through rent. The net spending of $3 billion represented 1% of total
State expenses. State spending on this function includes expenses for:
all social housing services provided by the States and their housing authorities and subsidies to community housing providers
First Home Owner Grants
private rental assistance and other forms of home purchase assistance.
State housing expenses do not include spending on accommodation for State
employees, residential institutions providing living quarters for people with special
needs and homeless persons’ assistance.
The Commonwealth provided a range of funding to the States for social housing,
totalling about $1 billion in 2017-18. The Commonwealth also funds rent assistance
for people on low to moderate incomes. This is a non-taxable income supplement to
assist those renting in the private market or community housing. It is available to
pensioners and others receiving more than the base rate of Family Tax Benefit Part A.
Norfolk Island service and funding arrangements
The NIRC has six residential properties that it uses for social-type housing that are
known as the DCA (Department of Civil Aviation) Circle houses, which are rented to
low income tenants. NIRC advised that the houses are not well maintained and as
such are rented at relatively low rent ($150 per week). NIRC received $39 000 in rent
from tenants in 2016-17.43 There were also some small units in the hospital grounds
built from a philanthropic grant and initially intended for pre-nursing home care. They
were previously used by social welfare recipients with low level health care needs.
However, we were advised that these dwellings are no longer occupied for that
purpose. The nature of this housing is such that it is not equivalent to State-type
social housing.
We were not able to ascertain whether Norfolk Island residents have access to First
Home Owner grants, as Norfolk Island residents.
43 The Commission does not have information on the actual gross expenses incurred by the NIRC in
managing these properties in 2016-17 and 2017-18. The actuals data in the expense tables in this report therefore show nil gross social housing expenses. However, rents from the DCA circle housing have been included in other income for the NIRC.

81
Assessed expenses for Norfolk Island services
The assessment of housing expenses followed the method used in Commission
inquiries into State finances, which are done in three components – social housing
expenses, social housing rents and first home owner expenses. Access to these
services and programs by comparable communities in Australia was used as a
benchmark for costing Norfolk Island services.
The Commission has calculated the annual costs that would be associated with
operating a social housing program on the Island.
In making the calculation, we assumed the use of social housing on Norfolk Island
would be similar to that in an outer regional area rather than a very remote region.
Use of social housing by non- Aboriginal or Torres Strait Islander populations in very
remote mainland communities is affected by shortages of affordable private rental
stock, which did not appear to be an issue for Norfolk Island. We assumed 1% of
Norfolk Island households would be living in social housing.
Social housing and revenues from rents
Applying national social housing use rates for outer regional areas (1%) to the number
of households on Norfolk Island households indicated the Island would require about
seven social housing dwellings. This implied the net annual cost of administering a
social housing program (including house maintenance) would be $222 000 in
2017-18, or $127 per capita. The depreciation assessment includes an amount for the
depreciation of this notional housing stock. We have not included an allowance for
the initial cost of acquiring the required housing stock.
First Home Owner Expenses
Data from the 2016 Census indicate there were 206 occupied private dwellings on
Norfolk that are rented, with the remaining 542 occupied private dwellings being
owned or under other tenure types.
In the absence of any data related to first home owner grants on Norfolk Island, we
used Census dwelling data and national data on housing turnover and the first home
owner share of financed homes to estimate that up to eight dwellings could be
purchased by new home owners in a year. However, as there are few new dwellings
being constructed on Norfolk Island (population growth is flat) and Norfolk Island has
an older than Australian average age profile, we halved this estimate, giving an
allowance of four dwellings with first home owner grant access. This gave a total
estimated grant of $41 000 for 2017-18.
82
SERVICES TO COMMUNITIES
State service delivery and funding arrangements
State expenses on services to communities were $7 billion in 2017-18, representing
about 3% of total State expenses. That spending includes expenses for:
subsidies for electricity services in remote communities
subsidies for water and wastewater services in small isolated communities
Aboriginal and Torres Strait Islander community development
other community development
expenses related to environmental protection services, including national parks
and wildlife.
In isolated, remote communities in Australia, diesel is the main fuel used for
electricity generation. However, diesel is costly to use and transport. Some remote
communities supplement diesel with renewable energy sources, although this
requires significant capital investment, and the uptake of renewable energy in
remote areas has been slow.
Costs for wastewater services in very remote areas are driven by diseconomies of
small scale. Service providers have few customers per wastewater treatment plant,
and few customers per kilometre of pipe network. In some remote and very remote
communities, as with Norfolk Island, some households may have their own septic
systems, reducing the cost to service providers.
The Commonwealth provides funding to the States for Services to communities,
including the Sustainable Rural Water Use and Infrastructure Programme and other
national partnership payments.
Norfolk Island service and funding arrangements
We have treated the electricity supply service operated by NIRC as a State-type
function. NIRC largely operates this service on a cost recovery basis. It charged 62
cents per kilowatt hour (kWh) for electricity in 2016-17 and 2017-18, which rose to 71
cents per kWh in 2018-19 and has fallen slightly to 70 cents in 2019-20. NIRC does not
currently receive any subsidies from the Commonwealth to offset the costs of the
electricity generation, nor are there subsidies for water, sewerage or waste disposal.
The average gross cost of providing electricity services to very remote communities in
Australia is $3 978 per capita.44 This is almost double the cost on Norfolk Island of
44 Based on 2015-16 cost data supplied to the Commission by five States for 172 small, isolated off-grid
electricity generation schemes.
83
$2 071 per capita in 2017-1845. The lower costs on Norfolk may be due to its reduced
distribution network. We also derived a net operating result for the Norfolk Island
electricity service of $833 000 ($474 per capita).46
There is no reticulated water supply on Norfolk. Households rely on rainwater tanks
and groundwater. Accommodation facilities use a combination of rainwater tanks and
underground water supplies. NIRC, however, does have a water quality assurance
process. Sewerage services are provided, but only to a subset of households and
accommodation facilities.
The average cost of providing wastewater services to very remote communities in
Australia is $373 per capita.47 This is higher than the cost on Norfolk Island of
$306 per capita in 2017-18. The lower expenses on Norfolk Island may be due to its
relatively small wastewater pipe network that mainly services households and
businesses in the main township. However, while that network is small, many very
remote communities on the mainland are even smaller which increases their per
capita costs.
NIRC provides environmental protection services including the control of noxious
plants and animals. However, most of the costs are funded by the Department
through a service delivery agreement for pest control. The Department provided
$286 000 in 2017-18 for these services.
Assessed expenses for Norfolk Island services
Electricity
Electricity retail prices have two components: usage charges priced by kWh, and a
daily fixed charge. King Island, which is similar to Norfolk in many ways, had fixed
charges of 89.3 cents per day in 2017-18. Norfolk Island’s fixed charges were similar,
averaging 84.0 cents per day.48.
Retail electricity prices on Norfolk Island in 2017-18 (62 cents per kWh) were high
compared to the national average of 30.2 cents.49 The price on King Island was
27.8 cents per kWh, compared to a price of 25.9 cents per kWh in the rest of
45 Based on advice provided by NIRC. 46 Derived by subtracting the electricity charges revenue published in NIRC’s Financial Statement for
2017-18 (page 15) of $2 803 149 from the gross expenses advised by NIRC. 47 Based on 2015-16 cost data supplied to the Commission by States. 48 This cost is higher for households with installed photovoltaic (PV) systems, and lower for non-PV
households. Norfolk Island has had a moratorium on new PV installations since 2013. 49 National average data sourced from the Australian Energy Market Commission, 2018 Residential
Electricity Price Trends Review, Final Report, Figure 4.

84
Tasmania.50 King Island receives a subsidy that enables it to sell electricity at below
cost prices.51
We derived an assessed subsidy for Norfolk as the amount per kWh required to
reduce its price to that on King Island (34 cents per kWh) applied to Norfolk Island’s
actual electricity consumption (5.5 mega Watt hours). This gave an assessed subsidy
of $1.9 million in 2017-18.
As the assessment uses actual electricity consumption to derive the subsidy
allowance, a tourism factor is not applied. Nor were isolation and remoteness factors
applied because King Island faces many similar factors.
Water
We have treated Norfolk Island as a small, very remote community, as there are only
a small number of sewerage connections (156 residential connections to private
dwellings and 76 business NIRC connections). Furthermore, since the typical
approach in the rest of Australia is to charge non-residential customers a
cost-reflective price, the assessment only considers residential connections.
The national average per capita cost of sewerage services in small, very remote
communities obtained from the Commission’s State inquiries was multiplied by an
estimate of the number of people on Norfolk Island living in residential dwellings with
sewerage services.52 The assessed subsidy was $55 000 in 2017-18.
Other community development
Assessed State-type community development expenses for Norfolk Island were
estimated as the State average per capita net expenses for other community
development, adjusted for remoteness and isolation, multiplied by the Island’s
population. This gave assessed expenses of $106 000 in 2017-18.
Local governments also incur community development expenses. The assessment of
those expenses is discussed in Attachment F on Local Government services.
50 Office of the Tasmanian Economic Regulator, Energy in Tasmania Report 2017-18. 51 The total subsidy for King Island and Flinders Island was $10 million (Hydro Tasmania, Annual report
2017-18.) 52 The number of people living in each dwelling receiving services (2.4) was based on information from
the Bureau of Meteorology, National performance report 2017–18: Urban water utilities. This figure is similar to the 2016 Census value of 2.2 persons per household on Norfolk Island. The number of persons per sewerage connection is higher because one connection may service more than one dwelling, as noted in the Norfolk Island Regional Council’s Annual Report 2017-18 (page 32).
85
Environmental protection
For States, this component includes national parks and environmental protection
authority, for example the NSW Environment Protection Authority. However, the
Commonwealth is responsible for the only national park on Norfolk Island. State
expenses on national parks were, therefore, excluded from the assessment. That
assessment applied the State average per capita net expense for environmental
protection (excluding national parks), adjusted for remoteness and isolation to the
Island’s population. This produced assessed expenses of $92 000 in 2017-18.
Local governments also provide environmental management services such as waste
disposal. The assessment of those expenses is discussed in Attachment F on Local
Government services.
TRANSPORT
NIRC operates the Island’s three ports and the lighterage services at two of the ports
for the loading and unloading of sea freight under a service delivery agreement with
the Department.
States have either sold or corporatised their ports. So, there is generally no impact on
State budgets as the ports they retained are operated on a full cost recovery basis.
States or their authorities also provide a range of urban transport services, non-urban
transport services and State-type roads. However, there is no requirement for similar
activities on Norfolk given its small township and isolated characteristics.
All roads on Norfolk are classified as local roads. The assessment of the related
expenses is discussed in Attachment F on Local Government services.
Commonwealth activities relating to transport
The Commonwealth’s actions relating to transport for Norfolk Island include:
the Department underwrites regular passenger air flights to and from Sydney and
Brisbane, analogous with subsides on about 100 air routes in other parts of Australia
the Department funded some freight flights to Norfolk in 2017 and 2018
the Commonwealth has written-off a loan for the last repaving of the airport
runway and has agreed to provide a substantial grant for the next runway repaving
the Commonwealth funded upgrading of the Cascade Pier and the acquisition of passenger transfer vessels to assist freight operations and assist cruise ship passengers to visit the Island.

86
Assessed expenses for Norfolk Island services
Given the lack of comparability of Norfolk Island transport operations with those in
the States, we made a nil assessment for land transport. Sea ports have been
assessed at the actual per capita cost, of $495 000 in 2017-18.
SERVICES TO INDUSTRY
State service delivery and funding arrangements
The States spent $6 billion on services to industry in 2017-18, representing 3% of
their total expenses. This category includes State expenses on the regulation and
development of businesses and industries, and other economic affairs. Some
spending relates to specific industries including agriculture, forestry, mining,
manufacturing, tourism and construction. Other spending relates to all businesses, or
to consumers.
Regulatory functions include business registration, licensing of tradespeople,
livestock identification schemes, chemical and pesticide regulation, building codes and construction industry regulation, energy market regulation, product safety, workplace health and safety, consumer protection, mine safety, industrial relations and employment conditions, and shop trading hours.
Business development activities include mineral exploration, geological mapping, agricultural irrigation systems, tourism and trade promotion, marketing, and
industry research and development.
All States:
provide a similar range of services for their agriculture, forestry, fishing and
hunting industries, mining and other regulatory functions, including biosecurity, animal welfare, regulation of agriculture and veterinary chemicals, water resource management and mining regulation
engage in activities to promote employment and economic growth. Some programs target businesses, while others support particular industries or regions. Activities include investment and trade promotion, regional development programs, major project facilitation, skills development, job creation projects, funding for research and development and support for small businesses
have a geological survey office to support and promote exploration and land use planning. Most States also offer mineral exploration grants to support the discovery of new resources and develop their mining industries.
States recover the cost of some regulation activities through fees and charges, which
were $1 billion in 2017-18, equivalent to 14% of gross Services to industry expenses.
Those user charges include revenue from regulatory functions such as: licensing and

87
permit fees; soil, plant or animal testing; mine safety and site rehabilitation; chemical
and pesticide regulation; and construction building regulations.
The Commonwealth provides funding to States for services to industry programs
through National Partnership Payments and provides direct assistance to businesses,
industry and local government through a variety of programs.
Norfolk Island service and funding arrangements
Most services to industry on Norfolk Island are directed towards the tourism industry,
which is the major industry on the Island. To support the tourism industry, NIRC
operates a Visitor Information Centre and has engaged Unique Tourism Collection as
its marketing agent, has a presence on the Tourism Australia website and conducts a
variety of other promotional activities. NIRC has also engaged a consultant to provide
other economic development services.
The Commonwealth has agreed to provide $776 000 over 2018-19 and 2019-20 to
help with tourism marketing. Norfolk Island has also been included in the Regional
Development Australia program53 and the Department has engaged a regional
investment officer to work with Norfolk Island businesses and NIRC to attract
investment and grow the Island’s economy.
Many of the Services to industry category functions undertaken by States, including
agriculture and mining regulation, are not necessary on Norfolk Island, or occur on a
very small scale.
Assessed expenses for Norfolk Island services
The assessed expenses for Services to industry were derived in three components for:
tourism; non-tourist industry development; and non-tourist industry regulation.
Tourism
The tourism industry is a much more important industry on Norfolk Island than in the
rest of Australia. In 2017-18, about 18% of State Services to industry expenses were
devoted to tourism and 82% on other industries.
On Norfolk Island, tourism and related industries employed 22.6% of employed
people aged 15 years and over.54 The corresponding share for Australian States was
only 3.8%. This implies that tourism is about six times more important than the State
average.
53 Regional Development Australia is an Australian Government initiative that brings together all levels of
government to enhance the development of Australia's regions. A national network of regional development committees has been set up to achieve this objective. See https://www.rda.gov.au/.
54 Estimate based on data from the 2016 Census.

88
Assessed expenses for tourism were based on the estimated cost of running a State
tourism office with associated tourism promotion programs and a local government
visitor information centre. The activities of State and local government tourism staff
include tourism strategy development; tourism promotion through print, television
and social media; local business support to develop tourism offerings and enhance
service standards; event management; website development and maintenance; and
visitor centre staffing. Our estimate of the cost of such activities for Norfolk Island
included staffing costs (nine full-time equivalent staff) and on-costs including
contracted tourism promotion services. This level of staffing is similar to that
provided by like jurisdictions. 55
This gave an assessed expense of $2.2 million in 2017-18, which we split between
State and local government-type services using a ratio of 68:32. That split was based
on the amount of total tourism spending by State and local government obtained
from the Australian Bureau of Statistics. The tourism State-type assessment was
therefore $1.5 million in 2017-18.
Non-tourist industry development costs
Australian average per capita expenses were used as the base for the assessment.
Adjustments were made to allow for the effects of Norfolk Island’s remoteness and
the extra costs arising from its isolated island nature. The resultant assessed expense
was $229 000 in 2017-18.
Non-tourist industry regulation costs
The ACT’s regulation expenses per capita for all industry regulation were used as the
base for this component, as the ACT is the jurisdiction with the most comparable
non-tourism industrial composition. Like Norfolk Island, it has no mining or heavy
industry and limited agriculture. Remoteness and isolation adjustments were also
applied. This gave a cost estimate of $111 000 in 2017-18.
Total
The total assessed expense for the whole Services to industry category was
$1.8 million in 2017-18.
55 The staff estimate accounts for a team leader, staff covering tourist promotion, industry development,
events and business support, ICT and website management, visitor information centre management and staffing, and administrative support. The Commission considered the approach by other State and local governments in relation to tourism support in other parts of Australia, and adopted those approaches and structures to this function as a benchmark.
89
OTHER EXPENSES
State service delivery and funding arrangements
States incurred expenses of about $28 billion in 2017-18, representing 13% of total
State expenses on a range of other services including:
general public services, including the activities of central administrative agencies
that support State service delivery agencies, debt charges and transfers of a general nature between different levels of government
public order and safety services other than those provided by police, such as emergency services and fire protection
recreation and cultural services, including libraries, public halls, art and sport
facilities
natural disaster relief.
Some of the costs of those services were recovered through user charges of $6 billion
in 2017-18. Those charges were mainly fire and emergency services levies and
cultural and recreational fees, such as museum entry fees. The Commonwealth
provides funding to States, particularly for natural disaster relief.
Norfolk Island service and funding arrangements
The Department has several units working on Norfolk Island matters, including units
for legislative reform and justice policy, strategic and operational policy, local
governance and facilities, heritage and economic development (part of which relates
to KAVHA), and State service delivery. There is an Administrator on Norfolk to liaise
between the Department and the community.
Funded by the Department under an SDA, NIRC operated airport fire service also
provides fire services for the Island. NIRC does not use volunteer fire fighters.
Assessed cost of Norfolk Island services
We used average per capita State expenses as the base for the relevant portion of
Other expenses. To begin, we removed expenses not relevant for Norfolk Island,
which included:
natural disaster relief expenses as Norfolk Island is not funded under mainland
arrangements and it has not suffered from a natural disaster in recent years
general public services expenses because they mostly relate to State legislature and central policy agencies.
The remaining expenses for recreation and culture, public safety, and
communications were assessed by taking State average per capita net expenses for
those services and applying allowances for Norfolk Island’s remoteness and the extra

90
costs arising from its isolated island nature and the administration of State services.
However, in the case of public safety (fire and emergency services) we made a further
allowance to reflect the higher per capita costs incurred because: there is a minimum
level of service which must be provided in isolated communities regardless of the
population of the community; and a high level of fire and emergency services is
required by an airport which receives the equivalent of international flights. That
allowance doubled the assessed public safety expenses.56 The resulting total assessed
Other expenses were $584 000 in 2017-18.
However, since general public services expenses were excluded, that estimate does
not recognise any administrative costs for the Department or the Administrator.
Since responsibility for State-type services and associated infrastructure rests with
the Commonwealth, we have not assessed any debt charge expenses.
56 The local government type assessments also include a small amount of assessed expense for fire
services but it cannot be distinguished from other local government expenses for law, order and public safety services.

91
ATTACHMENT F: LOCAL GOVERNMENT SERVICES
INTRODUCTION
The Terms of Reference for this inquiry asked us to:
(1) Calculate the amount of annual expenditure, including infrastructure costs, required to provide state-type government services, local government services and support for legacy state-type government business enterprises on Norfolk Island, taking into account the circumstances of Norfolk Island.
The reference also says that estimates of annual services must have regard to
services available in comparable communities, and assume that Norfolk Island
operates at the average level of efficiency.
SCOPE OF LOCAL GOVERNMENT SERVICES
In the rest of Australia, the delivery of local government services is the responsibility
of an elected council, supported by an administrative arm. The services provided by
councils vary between States. Generally, councils provide property related services
including waste management, storm water, local roads and building and planning
services, as well as cultural and recreation facilities. In addition, many councils
provide a limited range of health, education, aged and welfare services. Some
councils provide water, sewerage and airport services.57
Norfolk Island Regional Council (NIRC) provides the normal range of local government
services, including an airport, plus some Commonwealth-type services, notably
telecommunications, and State-type services including electricity. NIRC also provides
a number of Commonwealth and State-type services on behalf of the Commonwealth
including port management, management of Kingston and Arthur’s Vale Historic Area
(KAVHA), registry, licensing and regulatory services, and pest and noxious weed
control. In 2017-18, NIRC employed 184 staff including 103 full-time staff, 81 casual
staff and 5 part-time staff.
In the States, some functions such as tourism are the responsibility of both the State
and local governments. Local governments usually operate visitor information
centres, provide promotional material for local attractions, organise local events and
provide local business support. States provide a similar range of services with a
State-wide focus. We have treated Norfolk Island tourism as a State and local
57 In most States, State owned corporations provide water and sewerage services. In New South Wales
and Queensland it is a local government responsibility.

92
government, split across both levels of government. Attachment E discusses the State
assessment of tourism expenses.
The costings in this attachment are for local government type services. Table F-1
shows the classification of local government services for this inquiry. It is based on
the Australian Bureau of Statistics (ABS) Classification of Functions of Government —
Australia (COFOG-A).58
Table F-1 Classification of local government services
Functional classification Description
General administration Legislative, executive, financial and fiscal affairs relating to general purposes only.
Health, housing and welfare
Services for the aged, community health services, health inspections, family and child welfare, housing services.
Law order and public safety
Fire protection, emergency services, animal control and other public order and control.
Planning and community amenities
Planning and building services, street lighting, public conveniences, libraries, shopping malls, cemeteries and crematoria.
Environmental protection Household and other garbage services, urban storm water drainage, street cleaning, flood mitigation, waste-water and other protection of the environment.
Recreation and culture Public halls and civic centres, swimming pools, parks and playing grounds, sports assistance and promotion, libraries, radio and other cultural services.
Tourism Tourism services
Roads Re-construction and maintenance of roads and bridges.
Depreciation Depreciation for all functions
Other expenses Expenditure on items not elsewhere classified including public works not elsewhere classified.
(a) Tourism is a State and local government function. Source: Commission classification based on COFOG-A.
METHOD
The amount of annual expenditure, including infrastructure costs, required to provide
local government services on Norfolk Island has been calculated in one of two ways.
58 ABS 5514.0, Australian System of Government Finance Statistics: Concepts, Sources and Methods,
Australia, 2015, Appendix 1, Part C.

93
For most services, the calculation began with the Australian average spending by all councils59 with adjustments for remoteness (34%), isolation (5%) and wages.
For General administration and depreciation, King Island actual per capita
expenses and asset values provided the starting point with adjustments for isolation and wages. Using King Island as the comparable community benchmark ensures the assessed local government expenditure for Norfolk Island recognises the higher per capita costs of providing services to a small remote community. The cost loadings recognises the effects of Norfolk Island’s additional isolation and lower wage input costs.
Table F-2 shows the methods used to calculate comparable Norfolk Island local
government expenses for this inquiry.
59 Australian average spending was calculated by dividing total expenditure by local governments in all
States and the Northern Territory by the total population for those jurisdictions. The ACT was not included in the calculation because it does not have a separate local government.

94
Table F-2 Summary of assessment methods for local government type expenses
Function Assessment method
General administration King Island actual per capita expense with isolation and wages adjustments.
Health, housing and welfare
Average council expenses with very remote costs, isolation and wages adjustments.
Law, order and public safety
Average council expenses with very remote costs, isolation and wages adjustments.
Planning and community amenities
Average council expenses with very remote costs, isolation and wages adjustments.
Environmental protection
Method as above with a $200 000 additional allowance for waste management.
Recreation and culture Average council expenses with very remote cost, isolation, tourism and wages adjustments.
Tourism 32% of total assessed tourism expenses. Regional costs, isolation and wages adjustments.
Road maintenance Per km expenditure on local government sealed roads multiplied by the length of Norfolk Island sealed roads with very remote costs, isolation, tourism and wages adjustments.
Depreciation - Roads and bridges
The value of Norfolk Island roads assets was estimated using the value of sealed roads per kilometre for King Island multiplied by the length of Norfolk Island sealed roads. The depreciation rates for King Island roads and bridges were applied to the estimated value of Norfolk Island roads and the actual value of Norfolk Island bridges respectively to obtain comparable depreciation expenses for Norfolk Island. Isolation, tourism and wages adjustments were also applied.
Depreciation - Other assets
The value of Norfolk Island non-roads assets was estimated by multiplying the per capita value of non-road assets for King Island by the Norfolk Island population. The depreciation rate for King Island was applied to the estimated value of Norfolk Island non-roads assets to obtain comparable depreciation expenses for Norfolk Island. Isolation and wages adjustments were also applied.
Other services Average council expenses with very remote costs, isolation and wages adjustments.
Source: Commission method.
Table F-3 shows the average local government expenses and Norfolk Island assessed
and actual expenses for 2017-18.

95
Table F-3 Local government expenses, Norfolk Island, 2017-18 — summary
State
average
Norfolk Island
Assessed Actual
$pc $pc $ $pc $
General administration 270 813 1 428 480 456 800 209
Health, housing and welfare 89 122 213 842 0 0
Law, order and public safety 37 51 89 060 0 0
Planning and community amenities 128 175 307 823 525 921 736
Environmental protection 183 364 639 592 529 929 210
Recreation and culture 206 314 550 984 0 0
Tourism 19 230 403 376 283 497 613
Roads and bridges 169 382 670 027 802 1 408 135
Depreciation – roads and bridges 141 394 692 001 523 918 433
Depreciation – other assets 183 231 406 194 407 714 157
Debt charges 25 0 0 0 0
Other 67 92 160 898 456 800 209
Total 1 519 3 168 5 562 278 3 980 6 989 701
Note: No actual expenses are shown for Health, housing and welfare, law order and public safety and recreation and culture. This is due to limited data for allocating NIRC expenses by function. Actual expenses for these functions are included in Other expenses.
Source: Commission staff analysis.
Table F-3 shows that assessed Norfolk Island per capita expenses are almost twice the
all-Council average expenses but significantly less than Norfolk Island actual
expenses. The results are discussed in Chapter 3.
GENERAL ADMINISTRATION
These services include the provision of an elected government and its support staff,
corporate and financial services, and other administrative functions.
Norfolk Island has five elected councillors including the mayor and deputy mayor. The
day-to-day management of council is the responsibility of the General Manager,
supported by two Group managers and one Executive manager. NIRC is required to
act in accordance with the Local Government Act 1993 (NSW) (Norfolk Island). The
governance arrangements, including the number of executive positions, are similar to
mainland councils.
The average local government expenses per capita on these functions in 2017-18 was
$270 per capita and those for King Island were $807 per capita. Councils with smaller
populations have higher per capita costs because the minimum governance
requirements are similar regardless of council population. As in the 2011 inquiry, we
have assumed that a reasonable expense for Norfolk Island would be that applicable

96
on King Island, which recognises the higher per capita costs for a small remote
council.60 Since Norfolk Island is more isolated than King Island an additional isolation
factor of 5% is applied. Finally, adjustments were made to recognise the island’s
lower wages to obtain the assessed Norfolk Island expense of $813 per capita in
2017-18.
In the 2011 inquiry, a tourism adjustment was applied to General administration
expenses. We determined there is no case for applying a tourism adjustment in this
update because we were unable to identify how tourism would increase general
administration costs. The category specific expense and revenue assessments
recognise the effects of tourism where necessary.
HEALTH, HOUSING AND WELFARE
Most local government spending on these functions relates to public health and
general welfare services. Average local government spending on this function varies
between States reflecting differences in the extent to which councils in each State
provide services.61 The average per capita expense in 2017-18 is $89 per capita. We
applied a very remote cost loading (34%), an isolation cost loading (5%) and wages
adjustment to average expenses to obtain the assessed Norfolk Island expense of
$122 per capita.
LAW, ORDER AND PUBLIC SAFETY
Average per capita spending in 2017-18 was $37 which mainly covered animal control
and contributions for rural fire services. We applied a very remote cost loading (34%),
an isolation cost loading (5%) and wages adjustment to average expenses to obtain
the assessed Norfolk Island expense of $51 per capita.
PLANNING AND COMMUNITY AMENITIES
Local government is responsible for the use and development of land including
building applications, inspections and compliance. The key legislation that guides
planning and development on Norfolk Island are the Planning Act 2002 (Norfolk
Island) and Building Act 2002 (Norfolk Island). In 2017-18, NIRC classified all public
60 The population of King Island in 2016-17 was 1 614. This compares to the Norfolk Island population of
1 752. 61 For example, in a few States, local governments provide residential aged care services.

97
land vested in NIRC as either ‘community’ or ‘operational’ to comply with the Local
Government Act 1993 (NSW) (Norfolk Island).
Average per capita spending in 2017-18 was $90. This amount excludes New South
Wales and Queensland local government spending on water services. In most States,
this is a State government function. We applied a very remote cost loading (34%), an
isolation cost loading (5%) and wages adjustment to average expenses to obtain the
assessed Norfolk Island expense of $175 per capita.
ENVIRONMENTAL PROTECTION
Waste management is a local government function and a major component of the
environmental protection category. NIRC provides similar waste management
services to comparable Australian councils.
Since kerbside waste collection is not available on the Island, residents take their
waste to the main waste management centre, which is located just outside Burnt
Pine. Commercial waste is taken directly to the Headstone Disposal Centre. A
significant amount of recyclable material is sorted on the Island and sent to mainland
Australia or New Zealand for disposal.
Significant effort is being applied to cease ocean outfall of Norfolk Island waste.
Waste expenses were 61% higher in 2017-18 compared to 2016-17, due to initiatives
to divert more waste into an on-island composting system and increase the recycling
streams to include plastics and steel. A NIRC Environmental Strategy, co-funded by
the Building Better Regions Fund and NIRC, includes waste management but is more
broadly focussed on addressing all aspects of environmental issues on Norfolk Island.
Two major contracts were awarded during the year to facilitate this work. In addition
to recurrent expenses, new waste management equipment valued at about $670 000
was acquired during the year.
The all-council average per capita spending in 2017-18 was $183 per capita. We
applied a very remote cost loading (34%), an isolation cost loading (5%) and wages
adjustment to this estimate to obtain a preliminary expense of $440 000. However,
we considered that this would not fully recognise the costs associated with managing
waste on a geographically small and isolated island. The Western Australian Local
Government Grants Commission recently included an extra allowance in its grant
recommended for Christmas Island and Cocos (Keeling) Islands to meet the higher
costs of waste management on the islands. Therefore we included an extra isolation
allowance of $200 000 to reflect the higher costs on Norfolk Island due to the need to
upgrade its waste management and sanitation processes. This gave a total of
$364 per capita in 2017-18.

98
RECREATION AND CULTURE
In the rest of Australia, local governments generally provide local cultural and
recreational facilities and grants to support local cultural and recreational initiatives.
This includes the provision of park and barbeque facilities, libraries, halls, play
equipment, local sporting grounds and grants for local sporting and cultural activities,
such as support for a sporting team, art displays and theatre groups. State
governments also provide culture and recreation services. An assessment for State
services is in Attachment E.
NIRC provides local government recreational facilities at picnic areas, sporting ovals
and netball courts. It operates a library, Radio Norfolk and the public hall. It also
provides some cultural activities. NIRC operates a Community Grants Program, which
allocated about $70 000 in grants during 2017-18. The Commonwealth Government
is responsible for the maintenance of KAHVA buildings and grounds and KAVHA
museums, delivered by NIRC under the SDA, and the Norfolk Island National Park.
All-council average per capita spending in 2017-18 was $206. We applied a very
remote cost loading (34%), an isolation cost loading (5%), tourism loading (16%) and
wages adjustment to average expenses to obtain the assessed Norfolk Island expense
of $314 per capita.
ROADS AND BRIDGES
This category includes expenditure on the re-construction and maintenance of roads
and bridges. Roads and bridges depreciation is assessed in a separate category.
Norfolk Island has a road network consisting of 78 kilometres of sealed roads and 4
kilometres of unsealed roads62, which is a relatively small network when compared
with most remote and very remote local government areas in the rest of Australia.
Norfolk Island only has local roads – it does not have any State-type roads.
Table F-3 shows Norfolk Island per capita expenses for roads were $802 in 2017-18 or
$1.4 million.
Some road upgrades and major maintenance have been completed in recent years, in
part funded by a Commonwealth grant of $250 000 for upgrading Channers Corner.
Like other local governments, Norfolk Island receives financial assistance grants from
the Commonwealth for local roads. Those local roads grants were $106 000 in
2017-18.63
62 Norfolk Island Regional Council 2017-18 Annual Report, page 37. 63 Local roads grants are provided on an untied basis, meaning there is not requirement for councils to
spend the money on roads.

99
We estimated assessed spending on Norfolk Island roads by multiplying the length of
Norfolk Island sealed roads (78 kilometres) by an estimate of the average per
kilometre expenditure on local government sealed roads ($5 736 per kilometre).64, 65
We then applied a very remote cost loading (34%), isolation loading of (5%), tourism
adjustment (16%) and wages adjustment to obtain a assessed Norfolk Island expense
of $670 000 or $382 per capita.
DEPRECIATION
Roads and bridges
For roads depreciation, King Island Council roads data were used as the comparable
community benchmark. We were unable to use Norfolk Island road asset values
because they differed markedly from the all council average values. King Island values
were comparable to the other mainland rural councils. Therefore, it was used as the
benchmark. There are relatively few bridges on Norfolk Island and limited
information available on bridges in comparable communities. Consequently, we
decided to use Norfolk Island bridge actual valuations.
The value of Norfolk Island roads assets was estimated using the per kilometre value
of sealed roads for King Island multiplied by the length of Norfolk Island sealed roads.
The depreciation rates for King Island roads and bridges were applied to the
estimated value of Norfolk Island roads and actual value of Norfolk Island bridges to
obtain a preliminary estimate of assessed roads and bridges depreciation for Norfolk
Island.
We applied an isolation cost loading (5%), tourism loading (16%) and wages
adjustment to this amount to obtain the assessed Norfolk Island expenses of
$692 000 or $394 per capita. We did not apply a very remote cost loading because
the asset values used in the calculation were based on King Island data.
Other assets
Other assets include plant and equipment, buildings and other structures. We were
unable to identify the value of local government-type, non-road assets on Norfolk
Island from NIRC’s financial statements.
64 Sourced from the National Local Roads Data System, which is maintained by the Australian Local
Government Association, http://www.jr.net.au/NLRDS/other.asp accessed on 9/8/2019. 65 The estimated total expenditure per kilometre on local government sealed roads in 2017-18 was
$13 519. The proportion attributed to maintenance expenditure was 42%, or $5 736 per kilometre. Road construction and upgrade accounted for the balance.

100
The value of Norfolk Island non-roads assets was estimated by multiplying the per
capita value of non-road assets for King Island ($229) by the Norfolk Island
population. The depreciation rate for King Island (3.6%) was applied to the estimated
value of Norfolk Island non-roads assets, to obtain assessed depreciation for Norfolk
Island. Isolation and wages adjustments were also applied. The estimated Norfolk
Island assessed expense for 2017-18 was $406 000 or $231 per capita. We did not
apply a very remote cost loading because the asset values used in the calculation
were based on King Island data.
AIRPORT
NIRC operates the airport and terminal facilities at the standard of an international
airport and there are regular, underwritten flights to and from Sydney, including
some extra flights in the peak tourist season. Flights to and from Auckland, however,
have been less regular – some flights were provided up to June 2018 and NIRC has
secured agreement for a service to recommence from September 2019.
The services operated by Air New Zealand are underwritten by the Commonwealth.
On the mainland, a subsidy of a similar scale is provided on 100 routes to regional
centres under the Regional Aviation Access Program. This also includes a scheme to
refund airlines for air traffic control charges for flights to regional centres.66
NIRC operates the airport at an international divergence standard – that is, the
airport is maintained and operated as ready for divergences that cannot be dealt with
by the nearest other international airports at Noumea and Auckland. The airport is
equipped for narrow body jet aircraft (single aisle, such as Boeing 737s), although
some wide-body (twin aisle Airbus A330s and Boeing 767s and 777s) aircraft can land
under some circumstances. NIRC receives revenues of around $168 000 per annum to
account for that albeit remote possibility.67
Norfolk Island airport is unlike other mainland airports that are operated by local
governments, since despite being a small and very remote location, it accommodates
jets with regular air services from major airlines. We have been unable to determine
the comparable cost of operating this type of airport. Nevertheless, we note that the
airport operating result in 2017-18 was positive ($29 200), indicating that the
operating costs can be fully met through airport fees and charges. The small profit on
continuing operations has been included as a revenue in the local government
revenue assessment.
66 See the Department’s website for program details –
https://www.infrastructure.gov.au/aviation/regional/ 67 With Noumea and Auckland relatively close, it is highly unlikely that a diversion for such large aircraft
would occur frequently.

101
Given the size of the operating result for the airport we consider that NIRC may not
be able to fund any major runway upgrade without a significant increase in fees,
which would have adverse implications for tourism, given its small scale. The
Department provides capital grants for capital expenditure at the airport that have
not been assessed in this inquiry.
OTHER SERVICES
Average per capita spending in 2017-18 was $67. We applied a very remote cost
loading of 34% and an isolation loading of 5% to this average expense to obtain a
comparable Norfolk Island expense of $92 per capita or $161 000.