Embed Size (px)
Citation preview

WISE M NEY2019: Issue 692, Week: 15th - 19th July
A Weekly Update from SMC(For private circulation only)
GURU IS ASPIRATIONGURU IS INSPIRATION
16th JULY HAPPY GURU PURNIMA
Bra
nd s
mc
476

as on 31st March, 2019
From The Desk Of Editor
(Saurabh Jain)
SMC Global Securities Ltd. (hereinafter referred to as “SMC”) is a registered Member of National Stock Exchange of India Limited, Bombay Stock Exchange Limited and its associate is member of MCX stock Exchange Limited. It is also registered as a Depository Participant with CDSL and NSDL. Its associates merchant banker and Portfolio Manager are registered with SEBI and NBFC registered with RBI. It also has registration with AMFI as a Mutual Fund Distributor.
SMC is a SEBI registered Research Analyst having registration number INH100001849. SMC or its associates has not been debarred/ suspended by SEBI or any other regulatory authority for accessing /dealing in securities market.
SMC or its associates including its relatives/analyst do not hold any financial interest/beneficial ownership of more than 1% in the company covered by Analyst. SMC or its associates and relatives does not have any material conflict of interest. SMC or its associates/analyst has not received any compensation from the company covered by Analyst during the past twelve months. The subject company has not been a client of SMC during the past twelve months. SMC or its associates has not received any compensation or other benefits from the company covered by analyst or third party in connection with the research report. The Analyst has not served as an officer, director or employee of company covered by Analyst and SMC has not been engaged in market making activity of the company covered by Analyst.
The views expressed are based solely on information available publicly available/internal data/ other reliable sources believed to be true.
SMC does not represent/ provide any warranty express or implied to the accuracy, contents or views expressed herein and investors are advised to independently evaluate the market conditions/risks involved before making any investment decision.
n the week gone by, markets across the globe looked energetic after Fed Chair,
IJerome Powell, indicated that short-term interest rates could soon be cut as the
global economy weakens and concerns persist over trade policy. The Fed's
benchmark rate is currently in a range of 2.25% and 2.5%. However, concern over
renewed trade tensions between Washington and Beijing weighed on sentiments
ahead of the release of June trade data from China. Meanwhile, Japan’s core
consumer inflation in June likely slowed to its weakest in nearly two years and exports
fell for a seventh straight month.
Back at home, domestic market looked disappointed with the Budget fine prints as
markets were expecting some kind of fiscal stimulus from the budget. Also the
proposal of the Finance minister to raise the minimum public shareholding of listed
companies to 35%, a 20% tax on stock buybacks and an increase in the surcharge on
high-income earners, spooked the sentiments. Recently, Moody's has warned that
weak growth prospects for India will complicate the government's fiscal consolidation
efforts, and this too dented the confidence of the investors. Going forward, the
market is expected to remain volatile as investors are watching out - how the earnings
season will pan out. Stock specific movement is expected to continue in the market.
On the commodity market front, lower level buying was witnessed in CRB, which gave
closing near 194 levels. Upside in bullions, crude and in few base metals strengthened
whereas bearish pressure in agri commodities capped the upside. Bullion counter may
continue to remain on an upside path but profit booking at higher levels cannot be
denied. Gold is facing stiff hurdle near 35300 levels in MCX and $1440 in COMEX while
it has strong support near $1380 and 34000 levels on domestic bourses. Crude oil
prices may continue to witness further upside as U.S. oil producers in the Gulf of
Mexico cut more than half their output in the face of a tropical storm and as tensions
continued in the Middle East. Base metal counter may witness lower level buying as US
and Chinese negotiators opened a new round of trade talks and expectations of a US
interest rate cut later this month. GDP of China, CPI of New zeland, Japan, UK and
Canada, German ZEW Survey Expectations¸ Euro-Zone ZEW Survey, Retail Sales
Advance and U. of Mich. Sentiment of US, Unemployment Rate of Australia, Bank of
England Bank Liabilites /Credit Conditions Surveys etc are few strong triggers for the
commodity market this week.
Contents
Equity 4-7
Derivatives 8-9
Commodity 10-13
Currency 14
IPO 15
FD Monitor 16
Mutual Fund 17-18
SMC GLOBAL SECURITIES LTD.
REGISTERED OFFICES:
11 / 6B, Shanti Chamber, Pusa Road, New Delhi 110005.
Tel: 91-11-30111000, Fax: 91-11-25754365
MUMBAI OFFICE:
Lotus Corporate Park, A Wing 401 / 402 , 4th Floor ,
Graham Firth Steel Compound, Off Western Express Highway,
Jay Coach Signal, Goreagon (East) Mumbai - 400063
Tel: 91-22-67341600, Fax: 91-22-67341697
KOLKATA OFFICE:
18, Rabindra Sarani, Poddar Court, Gate No-4,5th Floor, Kolkata-700001
Tel.: 033 6612 7000/033 4058 7000, Fax: 033 6612 7004/033 4058 7004
AHMEDABAD OFFICE :
10/A, 4th Floor, Kalapurnam Building, Near Municipal Market,
C G Road, Ahmedabad-380009, Gujarat
Tel : 91-79-26424801 - 05, 40049801 - 03
CHENNAI OFFICE:
Salzburg Square, Flat No.1, III rd Floor, Door No.107, Harrington Road,
Chetpet, Chennai - 600031.
Tel: 044-39109100, Fax -044- 39109111
SECUNDERABAD OFFICE:
315, 4th Floor Above CMR Exclusive, BhuvanaTower,
S D Road, Secunderabad, Telangana-500003
Tel : 040-30031007/8/9
DUBAI OFFICE:
2404, 1 Lake Plaza Tower, Cluster T, Jumeriah Lake Towers,
PO Box 117210, Dubai, UAE
Tel: 97145139780 Fax : 97145139781
Email ID : [email protected]
Printed and Published on behalf of
Mr. Saurabh Jain @ Publication Address
11/6B, Shanti Chamber, Pusa Road, New Delhi-110005
Website: www.smcindiaonline.com
Investor Grievance : [email protected]
Printed at: S&S MARKETING
102, Mahavirji Complex LSC-3, Rishabh Vihar, New Delhi - 110092 (India)
Ph.: +91-11- 43035012, 43035014, Email: [email protected]
NOTES:1) These levels should not be confused with the daily trend sheet, which is sent every morning by e-mail in the name
of "Morning Mantra ".2) Sometimes you will find the stop loss to be too far but if we change the stop loss once, we will find more strength
coming into the stock. At the moment, the stop loss will be far as we are seeing the graphs on weekly basis and taking a long-term view and not a short-term view.
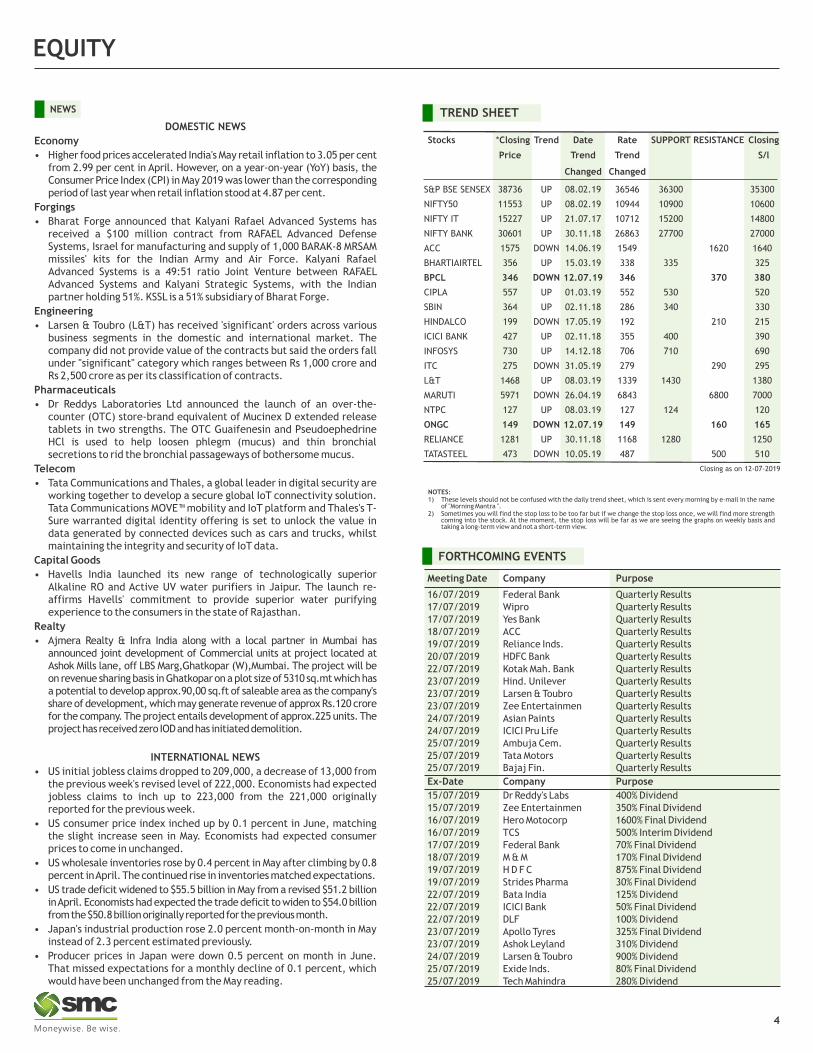
TREND SHEET
4
Closing as on 12-07-2019
Stocks *Closing Trend Date Rate SUPPORT RESISTANCE Closing
Price Trend Trend S/l
Changed Changed
S&P BSE SENSEX 38736 UP 08.02.19 36546 36300 35300
NIFTY50 11553 UP 08.02.19 10944 10900 10600
NIFTY IT 15227 UP 21.07.17 10712 15200 14800
NIFTY BANK 30601 UP 30.11.18 26863 27700 27000
ACC 1575 DOWN 14.06.19 1549 1620 1640
BHARTIAIRTEL 356 UP 15.03.19 338 335 325
BPCL 346 DOWN 12.07.19 346 370 380
CIPLA 557 UP 01.03.19 552 530 520
SBIN 364 UP 02.11.18 286 340 330
HINDALCO 199 DOWN 17.05.19 192 210 215
ICICI BANK 427 UP 02.11.18 355 400 390
MARUTI 5971 DOWN 26.04.19 6843 6800 7000
NTPC 127 UP 08.03.19 127 124 120
ONGC 149 DOWN 12.07.19 149 160 165
RELIANCE 1281 UP 30.11.18 1168 1280 1250
TATASTEEL 473 DOWN 10.05.19 487 500 510
ITC 275 DOWN 31.05.19 279 290 295
L&T 1468 UP 08.03.19 1339 1430 1380
INFOSYS 730 UP 14.12.18 706 710 690
FORTHCOMING EVENTS
EQUITY
Meeting Date Company Purpose
16/07/2019 Federal Bank Quarterly Results17/07/2019 Wipro Quarterly Results17/07/2019 Yes Bank Quarterly Results18/07/2019 ACC Quarterly Results19/07/2019 Reliance Inds. Quarterly Results20/07/2019 HDFC Bank Quarterly Results22/07/2019 Kotak Mah. Bank Quarterly Results23/07/2019 Hind. Unilever Quarterly Results23/07/2019 Larsen & Toubro Quarterly Results23/07/2019 Zee Entertainmen Quarterly Results24/07/2019 Asian Paints Quarterly Results24/07/2019 ICICI Pru Life Quarterly Results25/07/2019 Ambuja Cem. Quarterly Results25/07/2019 Tata Motors Quarterly Results25/07/2019 Bajaj Fin. Quarterly Results
Ex-Date Company Purpose
15/07/2019 Dr Reddy's Labs 400% Dividend15/07/2019 Zee Entertainmen 350% Final Dividend16/07/2019 Hero Motocorp 1600% Final Dividend16/07/2019 TCS 500% Interim Dividend17/07/2019 Federal Bank 70% Final Dividend18/07/2019 M & M 170% Final Dividend19/07/2019 H D F C 875% Final Dividend19/07/2019 Strides Pharma 30% Final Dividend22/07/2019 Bata India 125% Dividend22/07/2019 ICICI Bank 50% Final Dividend22/07/2019 DLF 100% Dividend23/07/2019 Apollo Tyres 325% Final Dividend23/07/2019 Ashok Leyland 310% Dividend24/07/2019 Larsen & Toubro 900% Dividend25/07/2019 Exide Inds. 80% Final Dividend25/07/2019 Tech Mahindra 280% Dividend
NEWS
DOMESTIC NEWS
Economy
• Higher food prices accelerated India's May retail inflation to 3.05 per cent from 2.99 per cent in April. However, on a year-on-year (YoY) basis, the Consumer Price Index (CPI) in May 2019 was lower than the corresponding period of last year when retail inflation stood at 4.87 per cent.
Forgings
• Bharat Forge announced that Kalyani Rafael Advanced Systems has received a $100 million contract from RAFAEL Advanced Defense Systems, Israel for manufacturing and supply of 1,000 BARAK-8 MRSAM missiles' kits for the Indian Army and Air Force. Kalyani Rafael Advanced Systems is a 49:51 ratio Joint Venture between RAFAEL Advanced Systems and Kalyani Strategic Systems, with the Indian partner holding 51%. KSSL is a 51% subsidiary of Bharat Forge.
Engineering
• Larsen & Toubro (L&T) has received 'significant' orders across various business segments in the domestic and international market. The company did not provide value of the contracts but said the orders fall under "significant" category which ranges between Rs 1,000 crore and Rs 2,500 crore as per its classification of contracts.
Pharmaceuticals
• Dr Reddys Laboratories Ltd announced the launch of an over-the-counter (OTC) store-brand equivalent of Mucinex D extended release tablets in two strengths. The OTC Guaifenesin and Pseudoephedrine HCl is used to help loosen phlegm (mucus) and thin bronchial secretions to rid the bronchial passageways of bothersome mucus.
Telecom
• Tata Communications and Thales, a global leader in digital security are working together to develop a secure global IoT connectivity solution. Tata Communications MOVE™ mobility and IoT platform and Thales's T-Sure warranted digital identity offering is set to unlock the value in data generated by connected devices such as cars and trucks, whilst maintaining the integrity and security of IoT data.
Capital Goods
• Havells India launched its new range of technologically superior Alkaline RO and Active UV water purifiers in Jaipur. The launch re-affirms Havells' commitment to provide superior water purifying experience to the consumers in the state of Rajasthan.
Realty
• Ajmera Realty & Infra India along with a local partner in Mumbai has announced joint development of Commercial units at project located at Ashok Mills lane, off LBS Marg,Ghatkopar (W),Mumbai. The project will be on revenue sharing basis in Ghatkopar on a plot size of 5310 sq.mt which has a potential to develop approx.90,00 sq.ft of saleable area as the company's share of development, which may generate revenue of approx Rs.120 crore for the company. The project entails development of approx.225 units. The project has received zero IOD and has initiated demolition.
INTERNATIONAL NEWS
• US initial jobless claims dropped to 209,000, a decrease of 13,000 from the previous week's revised level of 222,000. Economists had expected jobless claims to inch up to 223,000 from the 221,000 originally reported for the previous week.
• US consumer price index inched up by 0.1 percent in June, matching the slight increase seen in May. Economists had expected consumer prices to come in unchanged.
• US wholesale inventories rose by 0.4 percent in May after climbing by 0.8 percent in April. The continued rise in inventories matched expectations.
• US trade deficit widened to $55.5 billion in May from a revised $51.2 billion in April. Economists had expected the trade deficit to widen to $54.0 billion from the $50.8 billion originally reported for the previous month.
• Japan's industrial production rose 2.0 percent month-on-month in May instead of 2.3 percent estimated previously.
• Producer prices in Japan were down 0.5 percent on month in June. That missed expectations for a monthly decline of 0.1 percent, which would have been unchanged from the May reading.
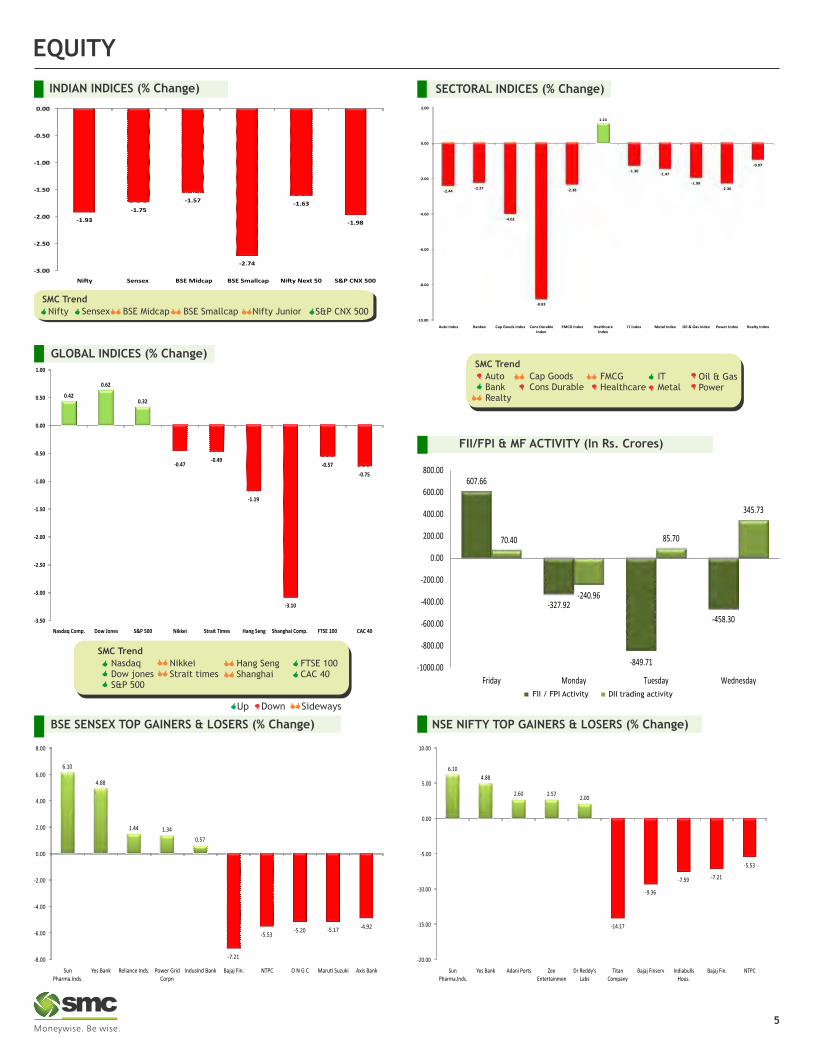
BSE SENSEX TOP GAINERS & LOSERS (% Change) NSE NIFTY TOP GAINERS & LOSERS (% Change)
SECTORAL INDICES (% Change)
GLOBAL INDICES (% Change)
INDIAN INDICES (% Change)
FII/FPI & MF ACTIVITY (In Rs. Crores)
5
SMC Trend
FTSE 100CAC 40
NasdaqDow jonesS&P 500
NikkeiStrait times
Hang SengShanghai
Down SidewaysUp
EQUITY
SMC Trend
BSE Midcap BSE SmallcapSensexNifty Nifty Junior S&P CNX 500
SMC Trend
ITMetal
Oil & GasPower
Cap GoodsCons Durable
Auto BankRealty
FMCGHealthcare
FII / FPI Activity DII trading activity
-20.00
-15.00
-10.00
-5.00
0.00
5.00
10.00
Sun Pharma.Inds.
Yes Bank Adani Ports Zee Entertainmen
Dr Reddy's Labs
Titan Company
Bajaj Finserv Indiabulls Hous.
Bajaj Fin. NTPC
6.10
4.88
2.60 2.572.00
-14.17
-9.36
-7.59 -7.21
-5.53
-8.00
-6.00
-4.00
-2.00
0.00
2.00
4.00
6.00
8.00
Sun Pharma.Inds.
Yes Bank Reliance Inds. Power Grid Corpn
IndusInd Bank Bajaj Fin. NTPC O N G C Maru� Suzuki Axis Bank
6.10
4.88
1.44 1.34
0.57
-7.21
-5.53-5.20 -5.17 -4.92
-1.93
-1.75
-1.57
-2.74
-1.63
-1.98
-3.00
-2.50
-2.00
-1.50
-1.00
-0.50
0.00
Ni�y Sensex BSE Midcap BSE Smallcap Ni�y Next 50 S&P CNX 500
-2.44-2.27
-4.02
-8.83
-2.38
1.10
-1.30-1.47
-1.99
-2.30
-0.97
-10.00
-8.00
-6.00
-4.00
-2.00
0.00
2.00
Auto Index Bankex Cap Goods Index Cons Durable Index
FMCG Index Healthcare Index
IT Index Metal Index Oil & Gas Index Power Index Realty Index
-0.47-0.49
-1.19
-3.10
-0.57
-0.75
-3.50
-3.00
-2.50
-2.00
-1.50
-1.00
-0.50
0.00
0.50
1.00
Nasdaq Comp. Dow Jones S&P 500 Nikkei Strait Times Hang Seng Shanghai Comp. FTSE 100 CAC 40
0.42
0.62
0.32
Beat the street - Fundamental Analysis
Source: Company Website Reuters CapitalineAbove calls are recommended with a time horizon of 8 to 10 months.
6
EQUITY
Face Value (Rs.) 2.00
52 Week High/Low 272.25/190.20
M.Cap (Rs. in Cr.) 14208.02
EPS (Rs.) 6.42
P/E Ratio (times) 35.30
P/B Ratio (times) 12.93
Dividend Yield (%) 0.88
Stock Exchange BSE
% OF SHARE HOLDING
VALUE PARAMETERS
AHLUWALIA CONTRACTS (INDIA) LIMITED CMP: 331.00 Upside: 21%Target Price: 402
` in cr
Investment Rationale
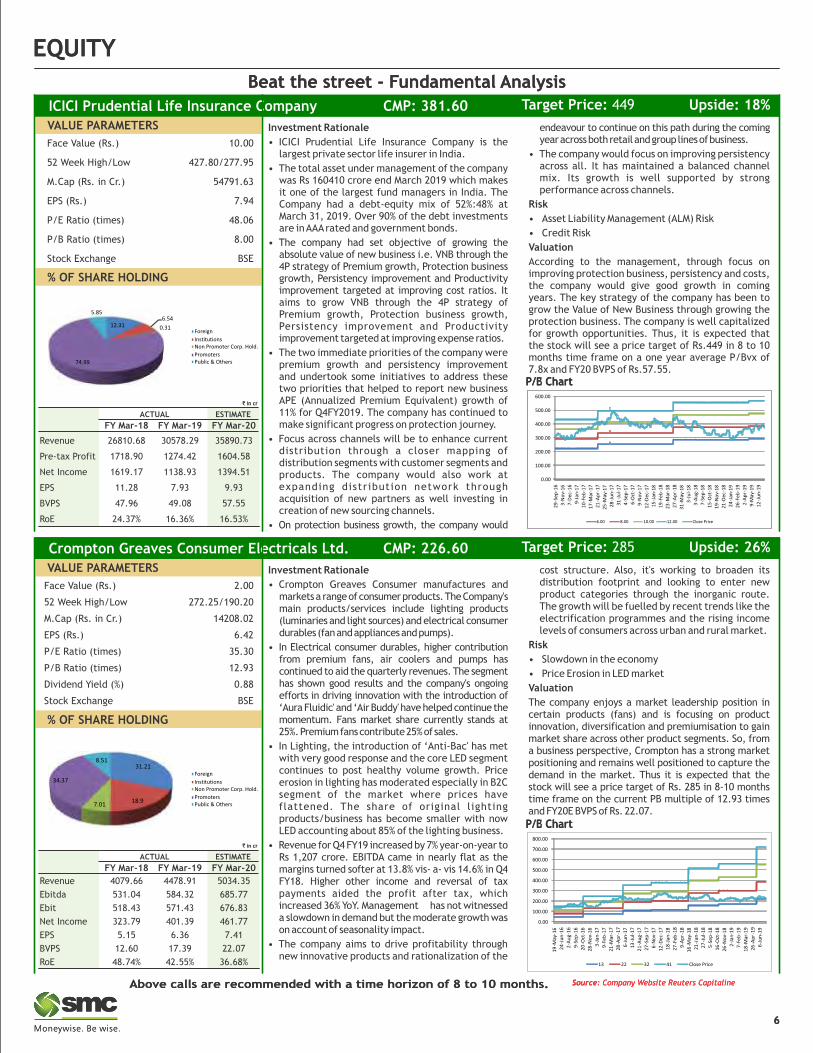
• Crompton Greaves Consumer manufactures and markets a range of consumer products. The Company's main products/services include lighting products (luminaries and light sources) and electrical consumer durables (fan and appliances and pumps).
• In Electrical consumer durables, higher contribution from premium fans, air coolers and pumps has continued to aid the quarterly revenues. The segment has shown good results and the company's ongoing efforts in driving innovation with the introduction of ‘Aura Fluidic' and ‘Air Buddy' have helped continue the momentum. Fans market share currently stands at 25%. Premium fans contribute 25% of sales.
• In Lighting, the introduction of ‘Anti-Bac' has met with very good response and the core LED segment continues to post healthy volume growth. Price erosion in lighting has moderated especially in B2C segment of the market where prices have flattened. The share of original lighting products/business has become smaller with now LED accounting about 85% of the lighting business.
• Revenue for Q4 FY19 increased by 7% year-on-year to Rs 1,207 crore. EBITDA came in nearly flat as the margins turned softer at 13.8% vis- a- vis 14.6% in Q4 FY18. Higher other income and reversal of tax payments aided the profit after tax, which increased 36% YoY. Management has not witnessed a slowdown in demand but the moderate growth was on account of seasonality impact.
• The company aims to drive profitability through new innovative products and rationalization of the
cost structure. Also, it's working to broaden its distribution footprint and looking to enter new product categories through the inorganic route. The growth will be fuelled by recent trends like the electrification programmes and the rising income levels of consumers across urban and rural market.
Risk
• Slowdown in the economy
• Price Erosion in LED market
Valuation
The company enjoys a market leadership position in certain products (fans) and is focusing on product innovation, diversification and premiumisation to gain market share across other product segments. So, from a business perspective, Crompton has a strong market positioning and remains well positioned to capture the demand in the market. Thus it is expected that the stock will see a price target of Rs. 285 in 8-10 months time frame on the current PB multiple of 12.93 times and FY20E BVPS of Rs. 22.07.
P/E Chart
Foreign
InstitutionsNon Promoter Corp. Hold.
PromotersPublic & Others
Face Value (Rs.) 10.00
52 Week High/Low 427.80/277.95
M.Cap (Rs. in Cr.) 54791.63
EPS (Rs.) 7.94
P/E Ratio (times) 48.06
P/B Ratio (times) 8.00
Stock Exchange BSE
% OF SHARE HOLDING
VALUE PARAMETERS
HEXAWARE TECHNOLOGIES LIMITED CMP: 382.90 Upside: 15%Target Price: 441
` in cr
Investment Rationale
• ICICI Prudential Life Insurance Company is the largest private sector life insurer in India.
• The total asset under management of the company was Rs 160410 crore end March 2019 which makes it one of the largest fund managers in India. The Company had a debt-equity mix of 52%:48% at March 31, 2019. Over 90% of the debt investments are in AAA rated and government bonds.
• The company had set objective of growing the absolute value of new business i.e. VNB through the 4P strategy of Premium growth, Protection business growth, Persistency improvement and Productivity improvement targeted at improving cost ratios. It aims to grow VNB through the 4P strategy of Premium growth, Protection business growth, Persistency improvement and Productivity improvement targeted at improving expense ratios.
• The two immediate priorities of the company were premium growth and persistency improvement and undertook some initiatives to address these two priorities that helped to report new business APE (Annualized Premium Equivalent) growth of 11% for Q4FY2019. The company has continued to make significant progress on protection journey.
• Focus across channels will be to enhance current distribution through a closer mapping of distribution segments with customer segments and products. The company would also work at expanding distribution network through acquisition of new partners as well investing in creation of new sourcing channels.
• On protection business growth, the company would
endeavour to continue on this path during the coming year across both retail and group lines of business.
• The company would focus on improving persistency across all. It has maintained a balanced channel mix. Its growth is well supported by strong performance across channels.
Risk
• Asset Liability Management (ALM) Risk
• Credit Risk
Valuation
According to the management, through focus on improving protection business, persistency and costs, the company would give good growth in coming years. The key strategy of the company has been to grow the Value of New Business through growing the protection business. The company is well capitalized for growth opportunities. Thus, it is expected that the stock will see a price target of Rs.449 in 8 to 10 months time frame on a one year average P/Bvx of 7.8x and FY20 BVPS of Rs.57.55.P/E Chart
Foreign
InstitutionsNon Promoter Corp. Hold.
PromotersPublic & Others
Beat the street - Fundamental Analysis
Source: Company Website Reuters CapitalineAbove calls are recommended with a time horizon of 8 to 10 months.
6
EQUITY
% OF SHARE HOLDING
VALUE PARAMETERS
Crompton Greaves Consumer Electricals Ltd. CMP: 226.60 Upside: 26%Target Price: 285
` in cr
P/B Chart
% OF SHARE HOLDING
VALUE PARAMETERS
ICICI Prudential Life Insurance Company CMP: 381.60 Upside: 18%Target Price: 449
` in cr
P/B Chart
ACTUAL ESTIMATE
FY Mar-18 FY Mar-19 FY Mar-20
Revenue 26810.68 30578.29 35890.73
Pre-tax Profit 1718.90 1274.42 1604.58
Net Income 1619.17 1138.93 1394.51
EPS 11.28 7.93 9.93
BVPS 47.96 49.08 57.55
RoE 24.37% 16.36% 16.53%
ACTUAL ESTIMATE
FY Mar-18 FY Mar-19 FY Mar-20
Revenue 4079.66 4478.91 5034.35
Ebitda 531.04 584.32 685.77
Ebit 518.43 571.43 676.83
Net Income 323.79 401.39 461.77
EPS 5.15 6.36 7.41
BVPS 12.60 17.39 22.07
RoE 48.74% 42.55% 36.68%
6.00 8.00 10.00 12.00 Close Price
31.21
18.97.01
34.37
8.51
0.00
100.00
200.00
300.00
400.00
500.00
600.00
700.00
800.00
19
-May
-16
24
-Ju
n-1
6
2-A
ug
-16
9-S
ep-1
6
20
-Oct
-16
28
-No
v-1
6
3-J
an-1
7
9-F
eb-1
7
21
-Mar
-17
28
-Ap
r-1
7
6-J
un
-17
13
-Ju
l-1
7
21
-Au
g-1
7
27
-Sep
-17
6-N
ov-
17
12
-Dec
-17
18
-Jan
-18
27
-Feb
-18
9-A
pr-
18
16
-May
-18
21
-Ju
n-1
8
27
-Ju
l-1
8
5-S
ep-1
8
16
-Oct
-18
26
-No
v-1
8
2-J
an-1
9
7-F
eb-1
9
18
-Mar
-19
26
-Ap
r-1
9
6-J
un
-19
13 22 32 41 Close Price
12.316.54
0.31
74.99
5.85
0.00
100.00
200.00
300.00
400.00
500.00
600.00
29
-Sep
-16
3-N
ov-
16
7-D
ec-1
6
9-J
an-1
7
10
-Feb
-17
17
-Mar
-17
21
-Ap
r-1
7
25
-May
-17
28
-Ju
n-1
7
31
-Ju
l-1
7
4-S
ep-1
7
6-O
ct-1
7
9-N
ov-
17
12
-Dec
-17
15
-Jan
-18
19
-Feb
-18
23
-Mar
-18
27
-Ap
r-1
8
31
-May
-18
3-J
ul-
18
3-A
ug
-18
7-S
ep-1
8
15
-Oct
-18
19
-No
v-1
8
21
-Dec
-18
24
-Jan
-19
26
-Feb
-19
2-A
pr-
19
9-M
ay-1
9
12
-Ju
n-1
9
Charts by Spider Software India Ltd
EQUITY
Above calls are recommended with a time horizon of 1-2 months
Disclaimer : The analyst and its affiliates companies make no representation or warranty in relation to the accuracy, completeness or reliability of the information contained in its research. The analysis contained in the analyst research is based on numerous assumptions. Different assumptions could result in materially different results.The analyst not any of its affiliated companies not any of their, members, directors, employees or agents accepts any liability for any loss or damage arising out of the use of all or any part of the analysis research.
SOURCE: CAPITAL LINE
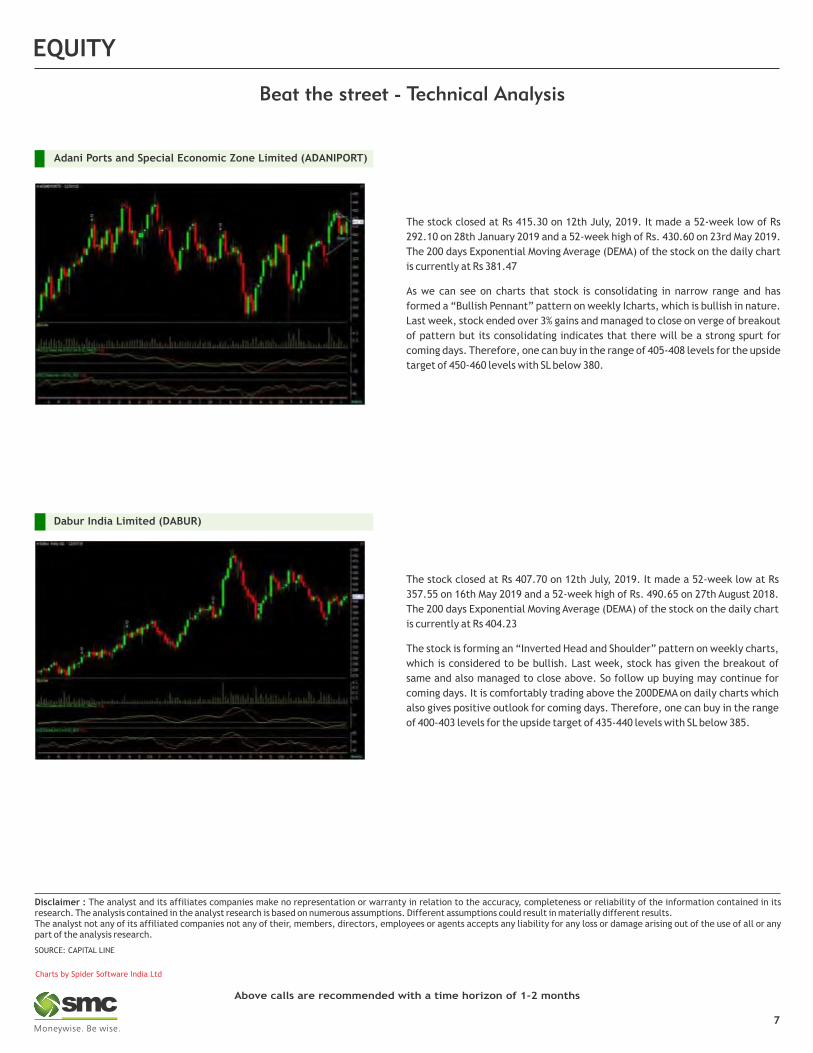
The stock closed at Rs 415.30 on 12th July, 2019. It made a 52-week low of Rs
292.10 on 28th January 2019 and a 52-week high of Rs. 430.60 on 23rd May 2019.
The 200 days Exponential Moving Average (DEMA) of the stock on the daily chart
is currently at Rs 381.47
As we can see on charts that stock is consolidating in narrow range and has
formed a “Bullish Pennant” pattern on weekly Icharts, which is bullish in nature.
Last week, stock ended over 3% gains and managed to close on verge of breakout
of pattern but its consolidating indicates that there will be a strong spurt for
coming days. Therefore, one can buy in the range of 405-408 levels for the upside
target of 450-460 levels with SL below 380.
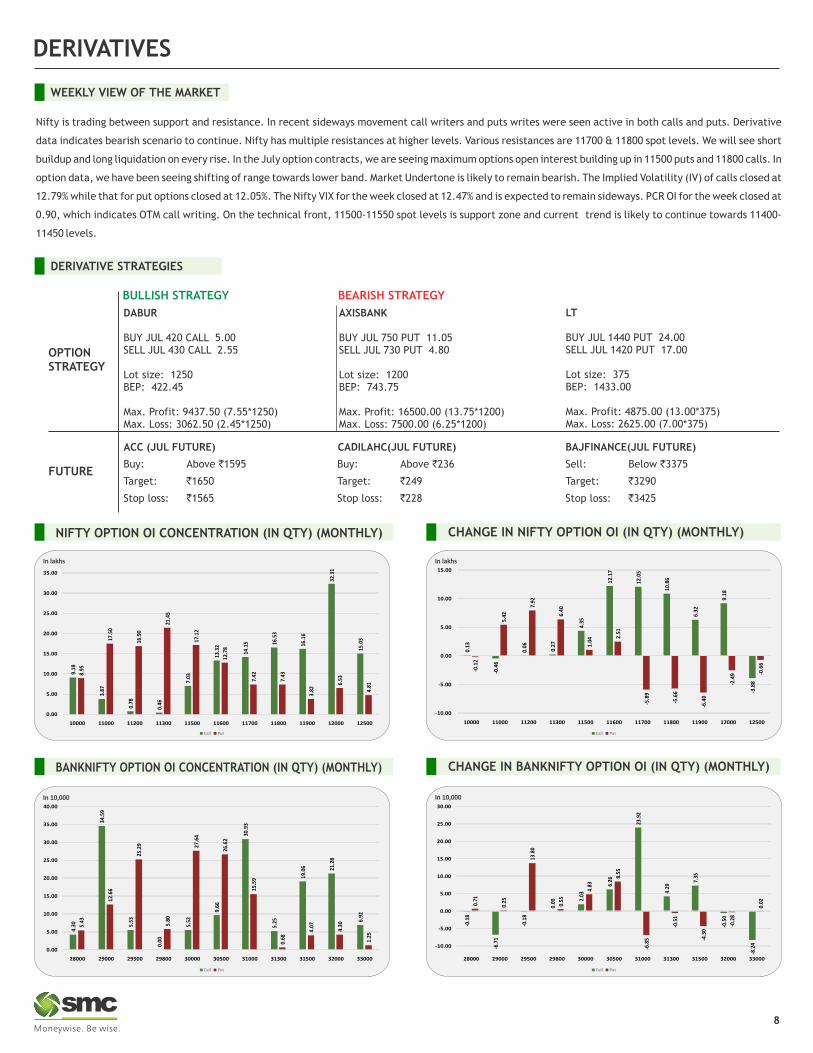
The stock closed at Rs 407.70 on 12th July, 2019. It made a 52-week low at Rs
357.55 on 16th May 2019 and a 52-week high of Rs. 490.65 on 27th August 2018.
The 200 days Exponential Moving Average (DEMA) of the stock on the daily chart
is currently at Rs 404.23
The stock is forming an “Inverted Head and Shoulder” pattern on weekly charts,
which is considered to be bullish. Last week, stock has given the breakout of
same and also managed to close above. So follow up buying may continue for
coming days. It is comfortably trading above the 200DEMA on daily charts which
also gives positive outlook for coming days. Therefore, one can buy in the range
of 400-403 levels for the upside target of 435-440 levels with SL below 385.
Dabur India Limited (DABUR)
7
Adani Ports and Special Economic Zone Limited (ADANIPORT)
DERIVATIVES
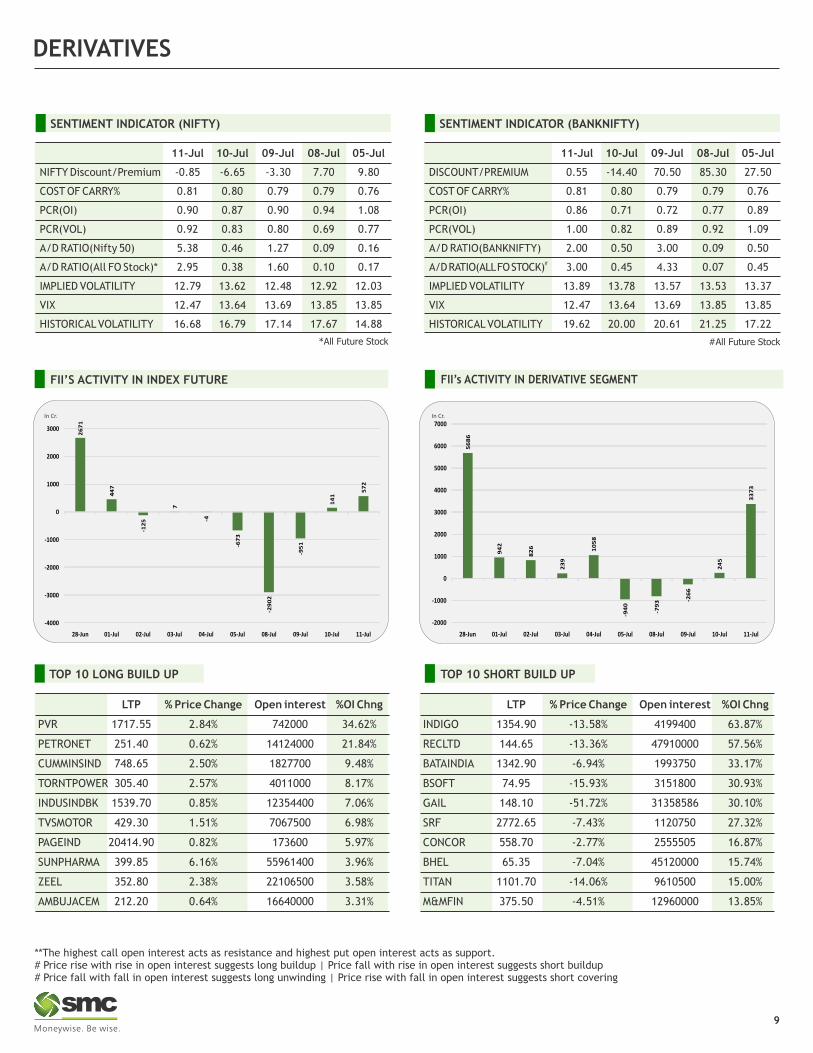
CHANGE IN NIFTY OPTION OI (IN QTY) (MONTHLY)
WEEKLY VIEW OF THE MARKET
NIFTY OPTION OI CONCENTRATION (IN QTY) (MONTHLY)
CHANGE IN BANKNIFTY OPTION OI (IN QTY) (MONTHLY)BANKNIFTY OPTION OI CONCENTRATION (IN QTY) (MONTHLY)
Nifty is trading between support and resistance. In recent sideways movement call writers and puts writes were seen active in both calls and puts. Derivative
data indicates bearish scenario to continue. Nifty has multiple resistances at higher levels. Various resistances are 11700 & 11800 spot levels. We will see short
buildup and long liquidation on every rise. In the July option contracts, we are seeing maximum options open interest building up in 11500 puts and 11800 calls. In
option data, we have been seeing shifting of range towards lower band. Market Undertone is likely to remain bearish. The Implied Volatility (IV) of calls closed at
12.79% while that for put options closed at 12.05%. The Nifty VIX for the week closed at 12.47% and is expected to remain sideways. PCR OI for the week closed at
0.90, which indicates OTM call writing. On the technical front, 11500-11550 spot levels is support zone and current trend is likely to continue towards 11400-
11450 levels.
LT
BUY JUL 1440 PUT 24.00SELL JUL 1420 PUT 17.00
Lot size: 375BEP: 1433.00
Max. Profit: 4875.00 (13.00*375)Max. Loss: 2625.00 (7.00*375)
OPTIONSTRATEGY
FUTURE
BUY JUL 750 PUT 11.05SELL JUL 730 PUT 4.80
Lot size: 1200BEP: 743.75
Max. Profit: 16500.00 (13.75*1200)Max. Loss: 7500.00 (6.25*1200)
AXISBANK
DERIVATIVE STRATEGIES
DABUR
BUY JUL 420 CALL 5.00SELL JUL 430 CALL 2.55
Lot size: 1250BEP: 422.45
Max. Profit: 9437.50 (7.55*1250)Max. Loss: 3062.50 (2.45*1250)
8
Call Put
Call Put
In lakhs
Call Put
In 10,000
BULLISH STRATEGY
ACC (JUL FUTURE)
Buy: Above `1595
Target: `1650
Stop loss: `1565
CADILAHC(JUL FUTURE)
Buy: Above `236
Target: `249
Stop loss: `228
BAJFINANCE(JUL FUTURE)
Sell: Below `3375
Target: `3290
Stop loss: `3425
BEARISH STRATEGY
In 10,000
Call Put
In lakhs
9.18
3.87
0.78
0.46
7.03
13.3
2
14.1
5 16.5
3
16.1
6
32.3
1
15.0
3
8.95
17.5
0
16.9
0
21.4
5
17.1
2
12.7
8
7.42
7.43
3.82
6.53
4.81
0.00
5.00
10.00
15.00
20.00
25.00
30.00
35.00
10000 11000 11200 11300 11500 11600 11700 11800 11900 12000 12500
0.13
-0.4
6
0.06
0.27
4.35
12.1
7
12.0
5
10.8
6
6.32
9.18
-3.8
8
-0.1
2
5.42
7.92
6.40
1.04
2.51
-5.8
9
-5.6
6
-6.4
0
-2.4
9 -0.6
6
-10.00
-5.00
0.00
5.00
10.00
15.00
10000 11000 11200 11300 11500 11600 11700 11800 11900 12000 12500
4.30
34.5
9
5.53
0.00
5.52
9.66
30.9
3
5.25
19.0
6 21.2
8
6.92
5.43
12.6
6
25.2
9
5.80
27.6
4
26.6
2
15.5
9
0.68
4.07
4.30
1.25
0.00
5.00
10.00
15.00
20.00
25.00
30.00
35.00
40.00
28000 29000 29500 29800 30000 30500 31000 31300 31500 32000 33000
-0.1
8
-6.7
1
-0.1
8
0.00 2.
03
6.26
23.9
2
4.29
7.35
-0.5
0
-8.2
4
0.71
0.25
13.8
0
0.55
4.83
8.55
-6.8
5
-0.5
1
-4.3
0
-0.2
8
0.02
-10.00
-5.00
0.00
5.00
10.00
15.00
20.00
25.00
30.00
28000 29000 29500 29800 30000 30500 31000 31300 31500 32000 33000
DERIVATIVES
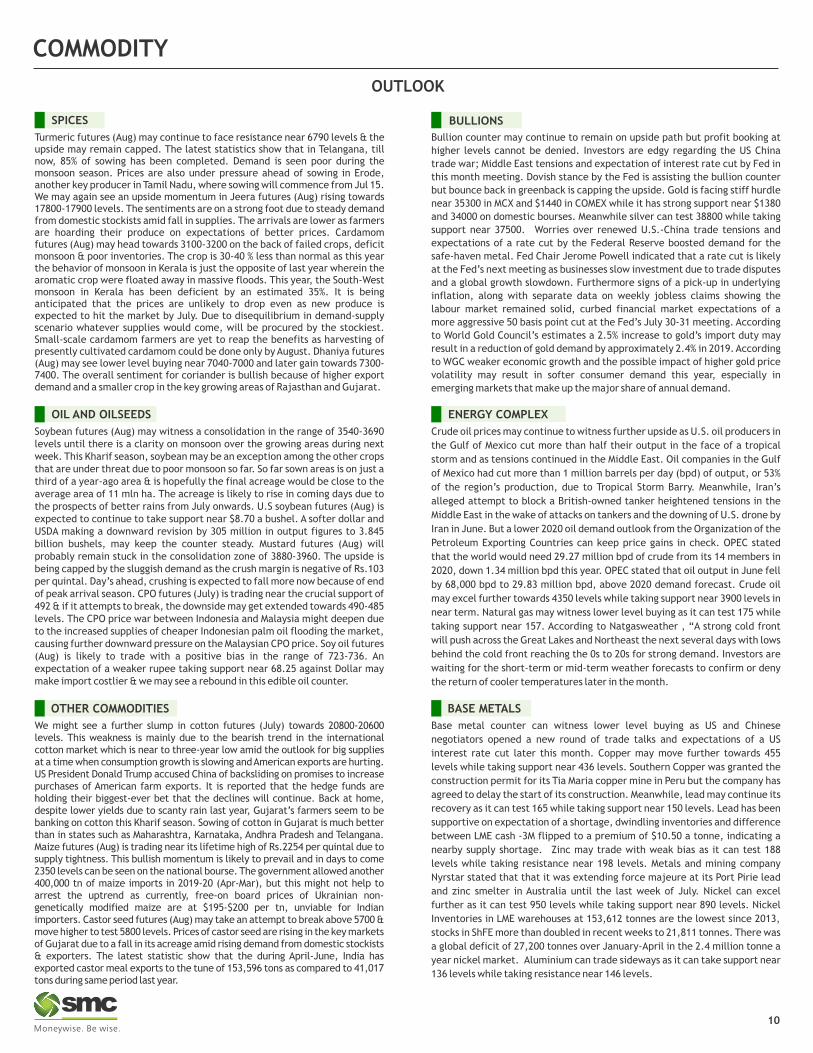
FII’s ACTIVITY IN DERIVATIVE SEGMENT
SENTIMENT INDICATOR (NIFTY)
11-Jul 10-Jul 09-Jul 08-Jul 05-Jul
NIFTY Discount/Premium -0.85 -6.65 -3.30 7.70 9.80
COST OF CARRY% 0.81 0.80 0.79 0.79 0.76
PCR(OI) 0.90 0.87 0.90 0.94 1.08
PCR(VOL) 0.92 0.83 0.80 0.69 0.77
A/D RATIO(Nifty 50) 5.38 0.46 1.27 0.09 0.16
A/D RATIO(All FO Stock)* 2.95 0.38 1.60 0.10 0.17
IMPLIED VOLATILITY 12.79 13.62 12.48 12.92 12.03
VIX 12.47 13.64 13.69 13.85 13.85
HISTORICAL VOLATILITY 16.68 16.79 17.14 17.67 14.88
*All Future Stock
SENTIMENT INDICATOR (BANKNIFTY)
FII’S ACTIVITY IN INDEX FUTURE
**The highest call open interest acts as resistance and highest put open interest acts as support.# Price rise with rise in open interest suggests long buildup | Price fall with rise in open interest suggests short buildup # Price fall with fall in open interest suggests long unwinding | Price rise with fall in open interest suggests short covering
#All Future Stock
11-Jul 10-Jul 09-Jul 08-Jul 05-Jul
DISCOUNT/PREMIUM 0.55 -14.40 70.50 85.30 27.50
COST OF CARRY% 0.81 0.80 0.79 0.79 0.76
PCR(OI) 0.86 0.71 0.72 0.77 0.89
PCR(VOL) 1.00 0.82 0.89 0.92 1.09
A/D RATIO(BANKNIFTY) 2.00 0.50 3.00 0.09 0.50#A/D RATIO(ALL FO STOCK) 3.00 0.45 4.33 0.07 0.45
IMPLIED VOLATILITY 13.89 13.78 13.57 13.53 13.37
VIX 12.47 13.64 13.69 13.85 13.85
HISTORICAL VOLATILITY 19.62 20.00 20.61 21.25 17.22
9
In Cr. In Cr.
TOP 10 SHORT BUILD UPTOP 10 LONG BUILD UP
LTP % Price Change Open interest %OI Chng
PVR 1717.55 2.84% 742000 34.62%
PETRONET 251.40 0.62% 14124000 21.84%
CUMMINSIND 748.65 2.50% 1827700 9.48%
TORNTPOWER 305.40 2.57% 4011000 8.17%
INDUSINDBK 1539.70 0.85% 12354400 7.06%
TVSMOTOR 429.30 1.51% 7067500 6.98%
PAGEIND 20414.90 0.82% 173600 5.97%
SUNPHARMA 399.85 6.16% 55961400 3.96%
ZEEL 352.80 2.38% 22106500 3.58%
AMBUJACEM 212.20 0.64% 16640000 3.31%
LTP % Price Change Open interest %OI Chng
INDIGO 1354.90 -13.58% 4199400 63.87%
RECLTD 144.65 -13.36% 47910000 57.56%
BATAINDIA 1342.90 -6.94% 1993750 33.17%
BSOFT 74.95 -15.93% 3151800 30.93%
GAIL 148.10 -51.72% 31358586 30.10%
SRF 2772.65 -7.43% 1120750 27.32%
CONCOR 558.70 -2.77% 2555505 16.87%
BHEL 65.35 -7.04% 45120000 15.74%
TITAN 1101.70 -14.06% 9610500 15.00%
M&MFIN 375.50 -4.51% 12960000 13.85%
26
71
44
7
-12
5
7
-4
-67
3
-29
02
-95
1
14
1
57
2
-4000
-3000
-2000
-1000
0
1000
2000
3000
28-Jun 01-Jul 02-Jul 03-Jul 04-Jul 05-Jul 08-Jul 09-Jul 10-Jul 11-Jul
56
86
94
2
82
6
23
9
10
58
-94
0
-79
3 -26
6
24
5
33
73
-2000
-1000
0
1000
2000
3000
4000
5000
6000
7000
28-Jun 01-Jul 02-Jul 03-Jul 04-Jul 05-Jul 08-Jul 09-Jul 10-Jul 11-Jul
10
Turmeric futures (Aug) may continue to face resistance near 6790 levels & the upside may remain capped. The latest statistics show that in Telangana, till now, 85% of sowing has been completed. Demand is seen poor during the monsoon season. Prices are also under pressure ahead of sowing in Erode, another key producer in Tamil Nadu, where sowing will commence from Jul 15. We may again see an upside momentum in Jeera futures (Aug) rising towards 17800-17900 levels. The sentiments are on a strong foot due to steady demand from domestic stockists amid fall in supplies. The arrivals are lower as farmers are hoarding their produce on expectations of better prices. Cardamom futures (Aug) may head towards 3100-3200 on the back of failed crops, deficit monsoon & poor inventories. The crop is 30-40 % less than normal as this year the behavior of monsoon in Kerala is just the opposite of last year wherein the aromatic crop were floated away in massive floods. This year, the South-West monsoon in Kerala has been deficient by an estimated 35%. It is being anticipated that the prices are unlikely to drop even as new produce is expected to hit the market by July. Due to disequilibrium in demand-supply scenario whatever supplies would come, will be procured by the stockiest. Small-scale cardamom farmers are yet to reap the benefits as harvesting of presently cultivated cardamom could be done only by August. Dhaniya futures (Aug) may see lower level buying near 7040-7000 and later gain towards 7300-7400. The overall sentiment for coriander is bullish because of higher export demand and a smaller crop in the key growing areas of Rajasthan and Gujarat.
SPICES
Bullion counter may continue to remain on upside path but profit booking at
higher levels cannot be denied. Investors are edgy regarding the US China
trade war; Middle East tensions and expectation of interest rate cut by Fed in
this month meeting. Dovish stance by the Fed is assisting the bullion counter
but bounce back in greenback is capping the upside. Gold is facing stiff hurdle
near 35300 in MCX and $1440 in COMEX while it has strong support near $1380
and 34000 on domestic bourses. Meanwhile silver can test 38800 while taking
support near 37500. Worries over renewed U.S.-China trade tensions and
expectations of a rate cut by the Federal Reserve boosted demand for the
safe-haven metal. Fed Chair Jerome Powell indicated that a rate cut is likely
at the Fed’s next meeting as businesses slow investment due to trade disputes
and a global growth slowdown. Furthermore signs of a pick-up in underlying
inflation, along with separate data on weekly jobless claims showing the
labour market remained solid, curbed financial market expectations of a
more aggressive 50 basis point cut at the Fed’s July 30-31 meeting. According
to World Gold Council’s estimates a 2.5% increase to gold’s import duty may
result in a reduction of gold demand by approximately 2.4% in 2019. According
to WGC weaker economic growth and the possible impact of higher gold price
volatility may result in softer consumer demand this year, especially in
emerging markets that make up the major share of annual demand.
BULLIONS
Soybean futures (Aug) may witness a consolidation in the range of 3540-3690 levels until there is a clarity on monsoon over the growing areas during next week. This Kharif season, soybean may be an exception among the other crops that are under threat due to poor monsoon so far. So far sown areas is on just a third of a year-ago area & is hopefully the final acreage would be close to the average area of 11 mln ha. The acreage is likely to rise in coming days due to the prospects of better rains from July onwards. U.S soybean futures (Aug) is expected to continue to take support near $8.70 a bushel. A softer dollar and USDA making a downward revision by 305 million in output figures to 3.845 billion bushels, may keep the counter steady. Mustard futures (Aug) will probably remain stuck in the consolidation zone of 3880-3960. The upside is being capped by the sluggish demand as the crush margin is negative of Rs.103 per quintal. Day’s ahead, crushing is expected to fall more now because of end of peak arrival season. CPO futures (July) is trading near the crucial support of 492 & if it attempts to break, the downside may get extended towards 490-485 levels. The CPO price war between Indonesia and Malaysia might deepen due to the increased supplies of cheaper Indonesian palm oil flooding the market, causing further downward pressure on the Malaysian CPO price. Soy oil futures (Aug) is likely to trade with a positive bias in the range of 723-736. An expectation of a weaker rupee taking support near 68.25 against Dollar may make import costlier & we may see a rebound in this edible oil counter.
OIL AND OILSEEDS
Crude oil prices may continue to witness further upside as U.S. oil producers in
the Gulf of Mexico cut more than half their output in the face of a tropical
storm and as tensions continued in the Middle East. Oil companies in the Gulf
of Mexico had cut more than 1 million barrels per day (bpd) of output, or 53%
of the region’s production, due to Tropical Storm Barry. Meanwhile, Iran’s
alleged attempt to block a British-owned tanker heightened tensions in the
Middle East in the wake of attacks on tankers and the downing of U.S. drone by
Iran in June. But a lower 2020 oil demand outlook from the Organization of the
Petroleum Exporting Countries can keep price gains in check. OPEC stated
that the world would need 29.27 million bpd of crude from its 14 members in
2020, down 1.34 million bpd this year. OPEC stated that oil output in June fell
by 68,000 bpd to 29.83 million bpd, above 2020 demand forecast. Crude oil
may excel further towards 4350 levels while taking support near 3900 levels in
near term. Natural gas may witness lower level buying as it can test 175 while
taking support near 157. According to Natgasweather , “A strong cold front
will push across the Great Lakes and Northeast the next several days with lows
behind the cold front reaching the 0s to 20s for strong demand. Investors are
waiting for the short-term or mid-term weather forecasts to confirm or deny
the return of cooler temperatures later in the month.
ENERGY COMPLEX
We might see a further slump in cotton futures (July) towards 20800-20600 levels. This weakness is mainly due to the bearish trend in the international cotton market which is near to three-year low amid the outlook for big supplies at a time when consumption growth is slowing and American exports are hurting. US President Donald Trump accused China of backsliding on promises to increase purchases of American farm exports. It is reported that the hedge funds are holding their biggest-ever bet that the declines will continue. Back at home, despite lower yields due to scanty rain last year, Gujarat’s farmers seem to be banking on cotton this Kharif season. Sowing of cotton in Gujarat is much better than in states such as Maharashtra, Karnataka, Andhra Pradesh and Telangana. Maize futures (Aug) is trading near its lifetime high of Rs.2254 per quintal due to supply tightness. This bullish momentum is likely to prevail and in days to come 2350 levels can be seen on the national bourse. The government allowed another 400,000 tn of maize imports in 2019-20 (Apr-Mar), but this might not help to arrest the uptrend as currently, free-on board prices of Ukrainian non-genetically modified maize are at $195-$200 per tn, unviable for Indian importers. Castor seed futures (Aug) may take an attempt to break above 5700 & move higher to test 5800 levels. Prices of castor seed are rising in the key markets of Gujarat due to a fall in its acreage amid rising demand from domestic stockists & exporters. The latest statistic show that the during April-June, India has exported castor meal exports to the tune of 153,596 tons as compared to 41,017 tons during same period last year.
OTHER COMMODITIES
Base metal counter can witness lower level buying as US and Chinese
negotiators opened a new round of trade talks and expectations of a US
interest rate cut later this month. Copper may move further towards 455
levels while taking support near 436 levels. Southern Copper was granted the
construction permit for its Tia Maria copper mine in Peru but the company has
agreed to delay the start of its construction. Meanwhile, lead may continue its
recovery as it can test 165 while taking support near 150 levels. Lead has been
supportive on expectation of a shortage, dwindling inventories and difference
between LME cash -3M flipped to a premium of $10.50 a tonne, indicating a
nearby supply shortage. Zinc may trade with weak bias as it can test 188
levels while taking resistance near 198 levels. Metals and mining company
Nyrstar stated that that it was extending force majeure at its Port Pirie lead
and zinc smelter in Australia until the last week of July. Nickel can excel
further as it can test 950 levels while taking support near 890 levels. Nickel
Inventories in LME warehouses at 153,612 tonnes are the lowest since 2013,
stocks in ShFE more than doubled in recent weeks to 21,811 tonnes. There was
a global deficit of 27,200 tonnes over January-April in the 2.4 million tonne a
year nickel market. Aluminium can trade sideways as it can take support near
136 levels while taking resistance near 146 levels.
BASE METALS
11
TREND SHEET
Closing as on 11.07.19
EXCHANGE COMMODITY CONTRACT CLOSING DATE TREND TREND RATE TREND SUPPORT RESISTANCE CLOSING
PRICE CHANGED CHANGED STOP/LOSS
NCDEX SOYABEAN AUG 3598.00 27.03.19 Sideways 3650.00 3520.00 3820.00 -
NCDEX JEERA AUG 17515.00 20.06.19 Sideways 16970.00 17200.00 18050.00 -
NCDEX REF.SOY OIL AUG 727.60 08.07.19 Down 739.00 - 737.00 740.00
NCDEX RMSEED AUG 3925.00 11.03.19 Down 3969.00 - 4020.00 4050.00
NCDEX CHANA AUG 4298.00 17.06.19 Down 4425.00 - 4470.00 4500.00
NCDEX GUARSEED AUG 4418.00 27.05.19 Down 4350.00 - 4550.00 4570.00
NCDEX COCUD AUG 2822.00 01.01.19 UP 1940.50 2770.00 - 2750.00
NCDEX CASTOR AUG 5652.00 25.04.19 Down 5900.00 - 5730.00 5750.00
MCX CPO JUL 497.40 11.07.19 Sideways 495.00 480.00 510.00 -
MCX MENTHA OIL JUL 1206.90 21.01.19 Down 1551.90 - 1250.00 1260.00
MCX SILVER SEP 38113.00 05.06.19 UP 37000.00 36700.00 - 36500.00
MCX GOLD AUG 34701.00 05.06.19 UP 33350.00 34100.00 - 34000.00
MCX COPPER JUL 441.25 04.06.19 Sideways 406.00 425.00 455.00 -
MCX LEAD JUL 156.90 24.05.19 UP 149.00 151.00 - 150.00
MCX ZINC JUL 192.35 23.04.19 Sideways 220.00 190.00 197.00 -
MCX NICKEL JUL 915.30 18.06.19 UP 880.00 885.00 - 870.00
MCX ALUMINIUM JUL 142.00 01.05.19 Sideways 144.80 138.00 145.00 -
MCX CRUDE OIL AUG 4132.00 18.06.19 UP 3778.00 3950.00 - 3900.00
MCX NATURAL GAS JUL 165.00 21.01.19 Down 217.90 - 178.00 180.00
TECHNICAL RECOMMENDATIONS
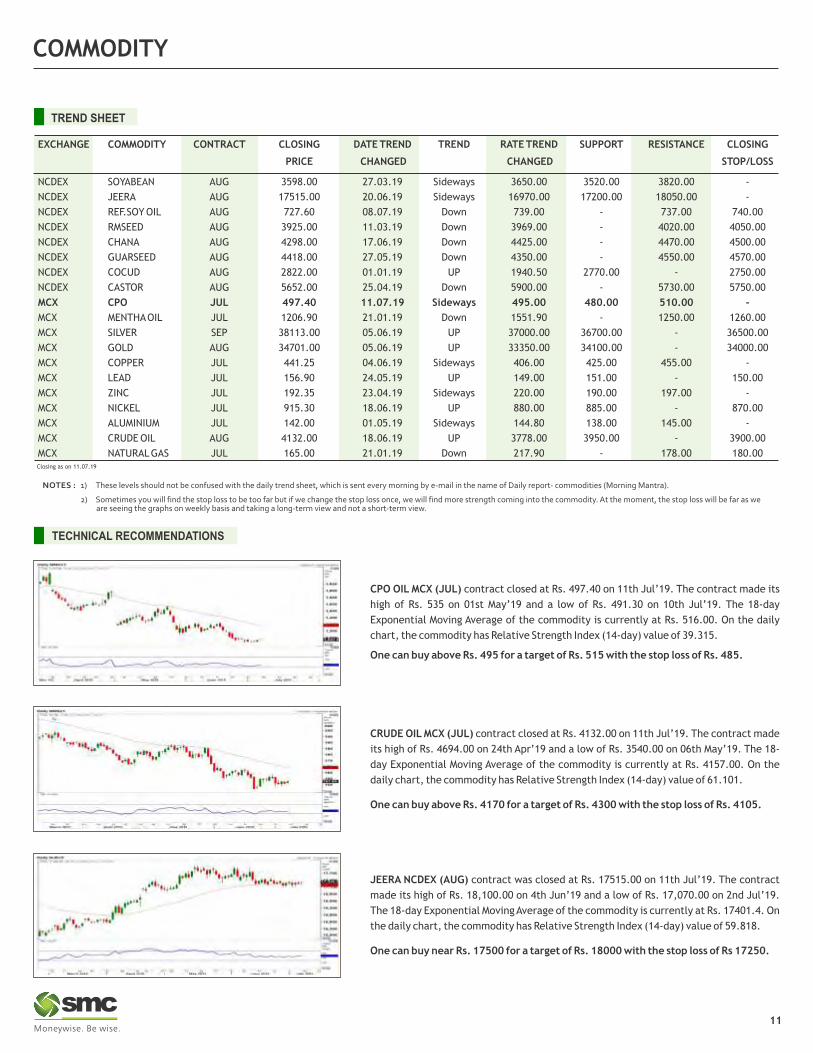
CPO OIL MCX (JUL) contract closed at Rs. 497.40 on 11th Jul’19. The contract made its
high of Rs. 535 on 01st May’19 and a low of Rs. 491.30 on 10th Jul’19. The 18-day
Exponential Moving Average of the commodity is currently at Rs. 516.00. On the daily
chart, the commodity has Relative Strength Index (14-day) value of 39.315.
One can buy above Rs. 495 for a target of Rs. 515 with the stop loss of Rs. 485.
CRUDE OIL MCX (JUL) contract closed at Rs. 4132.00 on 11th Jul’19. The contract made
its high of Rs. 4694.00 on 24th Apr’19 and a low of Rs. 3540.00 on 06th May’19. The 18-
day Exponential Moving Average of the commodity is currently at Rs. 4157.00. On the
daily chart, the commodity has Relative Strength Index (14-day) value of 61.101.
One can buy above Rs. 4170 for a target of Rs. 4300 with the stop loss of Rs. 4105.
JEERA NCDEX (AUG) contract was closed at Rs. 17515.00 on 11th Jul’19. The contract
made its high of Rs. 18,100.00 on 4th Jun’19 and a low of Rs. 17,070.00 on 2nd Jul’19.
The 18-day Exponential Moving Average of the commodity is currently at Rs. 17401.4. On
the daily chart, the commodity has Relative Strength Index (14-day) value of 59.818.
One can buy near Rs. 17500 for a target of Rs. 18000 with the stop loss of Rs 17250.
NEWS DIGEST
Lower level buying was witnessed in CRB which gave closing near 194 levels. Upside in bullions,
crude and in few base metals strengthened whereas bearish pressure in agri commodities
capped the upside. Crude saw rebound in the prices on various positive triggers, including
dropdown in inventories in US. Oil prices also rose after U.S. oil producers cut more than half of
Gulf of Mexico crude output due to Tropical Storm Barry, which is expected to make landfall over
the weekend. Meanwhile, in its latest monthly report released Thursday, OPEC forecasted
global oil demand will rise by 1.14 million barrels per day (bpd) next year, matching the
projection for 2019. Natural prices cooled off after a two week upside on profitbooking from
higher side. Gold continued to trade above $1400 in COMEX. Powell expressed worries that the
U.S. economy and hence a rate cut is expected. He showed concern of weak inflation as he
thought that it would be more persistent than previously expected. It gave jump to the gold
prices across the board. Gold made a new high of 35145 on MCX. Investors have rushed into gold
over the past two months, pushing the yellow metal from $1,200 levels to $1,400, as talk of a
rate cut came into play. Silver too made base near 38000 levels. In base metals, copper, nickel
and lead saw some upside whereas zinc saw massive decline in last eight week on weakness in
LME and SHFE whereas aluminum prices caught in a range trading. The falling price has been
rationalised as an indication of a better supplied market, signalled by rising Chinese production
and a collapse in the premium for cash metal on the LME. Treatment and refining charges in
China, have been held at an all-time high of $240 a tonne since May, suggesting China's smelting
capacity has not matched the processing need for concentrate. The difference between LME
cash and three-month lead contracts flipped to a premium of $US10.50 a tonne on Wednesday
after holding in the discount zone for nearly a month, indicating a nearby supply shortage. In
agri commodities, market welcomed the new listed commodities viz; paddy and moong. Moong
saw decent gains in the first trading week. Oil seeds and edible oil counter traded in pressure on
progress in monsoon amid low crushing in mustard. Overseas market traded firm as USDA
lowered its U.S. 2019-20 soybean production estimate to 3.845 billion bushels, down from 4.150
billion in June. Guar counter rose in the news of slowing down monsoon. It is reported that the
southwest monsoon is likely to take a pause after Jul 15, as the low-pressure area seen aiding
the monsoon current over Uttar Pradesh may dissipate soon.
12
NCDEX TOP GAINERS & LOSERS (% Change) MCX TOP GAINERS & LOSERS (% Change)
WEEKLY COMMENTARY
COMMODITY UNIT 03.07.19 11.07.19 DIFFERENCE
QTY. QTY.
ALUMINIUM MT 2957.75 3188.25 230.50
COTTON BALES 145000.00 137700.00 -7300.00
GOLD KGS 87.00 87.00 0.00
GOLD MINI KGS 58.20 53.10 -5.10
GOLD GUINEA KGS 7.36 7.00 -0.36
MENTHA OIL KGS 142651.17 226890.82 84239.65
NICKEL MT 89.13 89.13 0.00
SILVER (30 KG Bar) KGS 47523.32 15559.49 -31963.82
ZINC MT 708.40 616.83 -91.57
WEEKLY STOCK POSITIONS IN WAREHOUSE (MCX)
COMMODITY UNIT 04.07.19 11.07.19 DIFFERENCE
QTY. QTY.
BARLEY MT 8636 8636 0
CASTOR SEED MT 99001 99761 760
CHANA MT 100657 100908 251
COCUD MT 12385 8402 -3983
CORIANDER MT 6277 6307 30
GUARGUM MT 10657 10102 -555
GUARSEED MT 15731 15619 -112
JEERA MT 1631 1721 90
MAIZE (RABI) MT 12873 12872 -1
RM SEED MT 63765 60046 -3719
SOYBEAN MT 28236 24164 -4072
TURMERIC MT 5223 4749 -474
WHEAT MT 32611 32822 211
WEEKLY STOCK POSITIONS IN WAREHOUSE (NCDEX)
• ICEX launched Basmati Paddy 1121 futures contract on
11th July. The trading and delivery unit is 10 metric
tonnes and the delivery centre is Karnal, Haryana. From
Thursday, September, October and November contract
expiry will be available for trading.
• NCDEX launched futures trading in 'Paddy (Basmati) -
Pusa 1121 on 10th July. The trading and delivery unit is 10
metric tonnes with a compulsory delivery option.
• During Jun 1-Jul 9, the country received 202.7 mm
rainfall, 17% below the normal weighted average of
243.6 mm for the period.
• Malaysia's crude palm oil output declined 9% on month to
1.52 mln tn in June, according to data released by the
Malaysia Palm Oil Board.
• LME is planning an investment worth "tens of millions of
U.S. dollars" in a new trading platform that will enable
market participants to trade faster and that offers more
graphical interface.
• Bosnia's sole aluminium smelter was disconnected from
the power grid over a huge debt it had incurred because
of high electricity and alumina prices.
• The South African arm of steelmaker ArcelorMittal
expects to plunge to a first-half loss and cut more than
2,000 jobs as it struggles with cheap imports.
• The U.S. Commerce Department would impose duties of
up to 456% on certain steel produced in South Korea or
Taiwan.
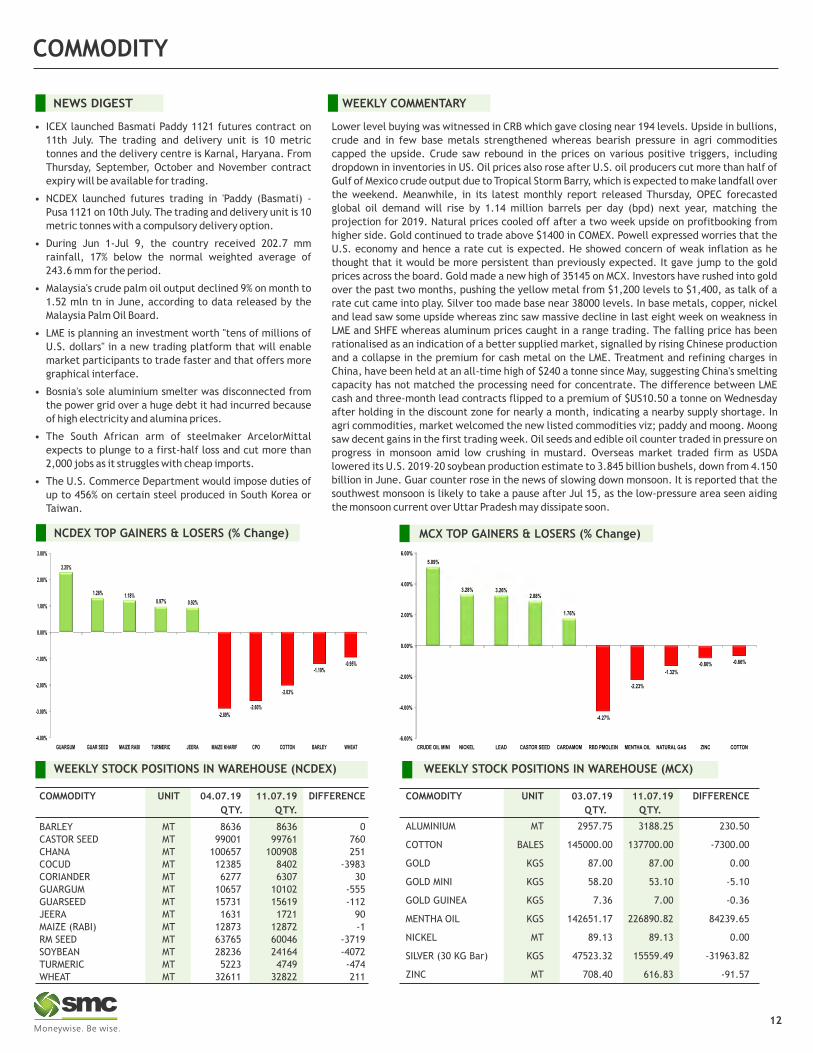
5.09%
3.28% 3.26%2.88%
1.76%
-6.00%
-4.00%
-2.00%
0.00%
2.00%
4.00%
6.00%
CRUDE OIL MINI NICKEL LEAD CASTOR SEED CARDAMOM RBD PMOLEIN MENTHA OIL NATURAL GAS ZINC COTTON
-4.27%
-2.23%
-1.32%
-0.80% -0.66%
-4.00%
-3.00%
-2.00%
-1.00%
0.00%
1.00%
2.00%
3.00%
GUARGUM GUAR SEED MAIZE RABI TURMERIC JEERA MAIZE KHARIF CPO COTTON BARLEY WHEAT
2.25%
1.28% 1.18%0.97% 0.92%
-2.89%-2.60%
-2.03%
-1.19%-0.95%
COMMODITY
PRICES OF COMMODITIES IN LME/ COMEX/ NYMEX (in US $)
WEEKLY STOCK POSITIONS IN LME (IN TONNES)
SPOT PRICES (% change) Basmati Paddy Pusa 1121.....From farm to platform
13
COMMODITY EXCHANGE CONTRACT 05.07.19 11.07.19 CHANGE%
ALUMINIUM LME CASH 1783.00 1807.00 1.35
COPPER LME CASH 5912.00 5925.00 0.22
LEAD LME CASH 1884.00 1950.00 3.50
NICKEL LME CASH 12525.00 13090.00 4.51
ZINC LME CASH 2392.00 2404.00 0.50
GOLD COMEX AUG 1400.00 1406.70 0.48
SILVER COMEX SEPT 15.05 15.15 0.66
LIGHT CRUDE OIL NYMEX SEPT 57.76 60.28 4.36
NATURAL GAS NYMEX AUG 2.40 2.42 0.83
COMMODITY STOCK POSITION STOCK POSITION DIFFERENCE
04.07.19 11.07.19
ALUMINIUM 977750 941750 -36000
COPPER 272500 293525 21025
NICKEL 158292 153612 -4680
LEAD 64250 63550 -700
ZINC 91625 82800 -8825
INTERNATIONAL COMMODITY PRICES
COMMODITY EXCHANGE CONTRACT UNIT 05.07.19 11.07.19 CHANGE(%)
Soybean CBOT AUG Dollars Per Bushel 8.76 8.99 2.63
Soy oil CBOT AUG Cents per Pound 27.56 28.18 2.25
CPO BMD SEPT MYR per MT 1960.00 1941.00 -0.97
Cotton ICE DEC Cents per Pound 66.82 63.08 -5.60
NCDEX has launched futures trading in Basmati Paddy–Pusa 1121 from July 10, 2019. Introduction of this new contract will facilitate an effective risk management tool for market participants and provide a fair price discovery platform for the highly volatile basmati paddy. ICEX, another trading platform, has also launched trading in Basmati Paddy 1121 futures contract from July 11, 2019. The specification for the commodity is almost same on both exchanges. However, the quality specifications on some parameters are different. Basmati paddy exhibits quite large price volatility more than 60 per cent in a year. To mitigate the risk arising out of this price fluctuation, a reliable mechanism was inevitable.
Global & Domestic scenario of Rice
India produces about 5.5 million tonne Basmati, famous for its quality, with more than 70% share of global basmati production, while Pakistan contributes with rest of about 30% share. It is estimated that India produces about 5% basmati out of its total paddy production. Major Basmati rice variety produced in India is PUSA 1121. Haryana & Punjab contribute about 83% of Basmati rice production and about 89% of Pusa-1121 production of India. Other Basmati rice producing states includes Uttar Pradesh and Uttarakhand.
On global front, rice production is about 501.5 million tonne. India contributes about 23% of global output with approximate production of 116 million tonne. Basmati contributes 8-9 million tonne of total global rice production.
India is the leading exporter of the Basmati Rice to the global market. Export of Basmati rice is increasing at a CAGR of 6%. Nearly 80 percent of the total Basmati production is exported.
According to NCDEX, the Paddy will be 5% (Max) green grain while 10% max green grain on ICEX. Average brown rice grain length will be 8.7 mm on ICEX while 8.6 mm on NCDEX. Damage and discolored grains will be 2% (max) on ICEX while 4% (max) on NCDEX. Admixture of other varieties of Basmati Paddy will be max. 5% on NCDEX while max 4% on ICEX.
The Basmati varieties are identified more by the grain morphological identification. There are chances of adulteration of inferior varieties of paddy, with the higher priced varieties. Hence to avoid adulteration – DNA test to determine the purity.
The future trading in Basmati Paddy Pusa 1121 will provide a stronger economic value to agri businesses. In order to safeguard market price risks, this hedging instrument will help commodity participants to fetch better price realization for their grain produce, and thus will enhance their income. Basmati has least government intervention.
Unit of Trading 10 MT
Delivery Unit 10 MT
Maximum Order Size 500 MT
Quotation/Base value Rs. Per Quintal
Tick Size Re 1
Quantity Variation +/- 5%
Basis Ex-Warehouse Karnal (Haryana), exclusive of GST
Additional Delivery Sonipat (Haryana) Centers
Delivery Logic Compulsory Delivery
Daily Price Limit DPL shall have two slabs- Initial and Enhanced Slab. Once the initial slab limit of 3% is reached in any contract, then after a period of 15 minutes this limit shall be increased further by enhanced slab of 1%, only in that contract. The trading shall be permitted during the 15 minutes period within the initial slab limit. After the DPL is enhanced, trades shall be permitted throughout the day within the enhanced total DPL of 4%.
PARAMETER SPECIFICATIONS
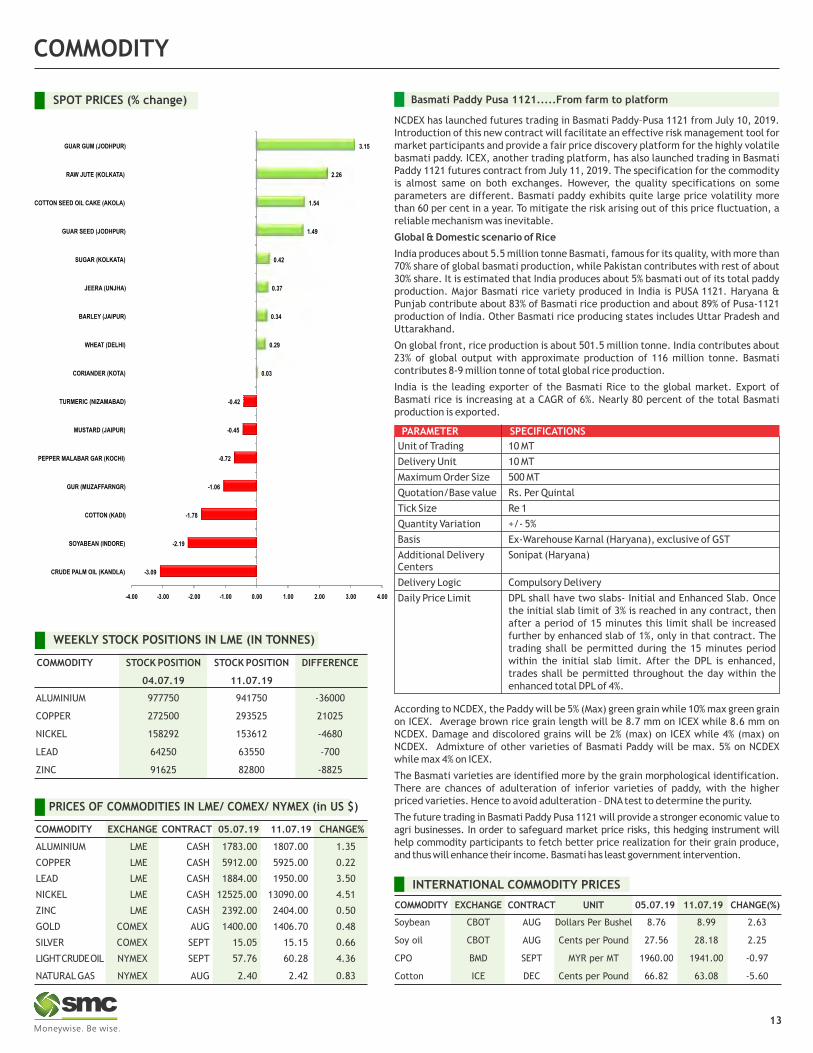
0.03
0.29
0.34
0.37
0.42
1.49
1.54
2.26
3.15
-4.00 -3.00 -2.00 -1.00 0.00 1.00 2.00 3.00 4.00
CRUDE PALM OIL (KANDLA)
SOYABEAN (INDORE)
COTTON (KADI)
GUR (MUZAFFARNGR)
PEPPER MALABAR GAR (KOCHI)
MUSTARD (JAIPUR)
TURMERIC (NIZAMABAD)
CORIANDER (KOTA)
WHEAT (DELHI)
BARLEY (JAIPUR)
JEERA (UNJHA)
SUGAR (KOLKATA)
GUAR SEED (JODHPUR)
COTTON SEED OIL CAKE (AKOLA)
RAW JUTE (KOLKATA)
GUAR GUM (JODHPUR)
-3.09
-2.19
-1.78
-1.06
-0.72
-0.45
-0.42
CURRENCY
Currency Table
Currency Pair Open High Low Close
USD/INR 68.74 68.9850 68.39 68.5425
EUR/INR 77.3975 77.5550 77.0625 77.40
GBP/INR 86.4950 86.4975 85.58 86.2225
JPY/INR 63.5450 63.70 63.1425 63.4850
News Flows of last week
(* NSE Currency future, Source: nseindia.com, Open: Monday 9.00 AM IST, Close: Thursday (5.00 PM IST)
8th JUL RBI governor hints at another rate cut with fiscal restraint praise
for government.
10th JUL Donald Trump tweets about Indian tariffs on US products “No
Longer Acceptable”.
11th JUL FED Chairman Jerome Powell strongly hints a rate cut is coming.
11th JUL RBI panel suggests extension of Forex market trading hours.
Market Stance
Indian Rupee remains elevated after budget announcement of narrowing fiscal
deficit target. Domestic currency got further support against US-Dollar after Fed
Chair Jay Powell’s dovish comment about economy outlook which open the doors
for further room for rate cuts. Usually lower US-yield bring boost to capital inflows
into riskier assets which includes Indian government bonds and bring carry trades
into Indian Rupee. Indian headline inflation prints likely to edge up to 3.2 percent
for the month of June. Globally ECB policy meeting minutes suggest that the rate-
setters were in consensus for uncertainty over the bloc economy and ready to
unleash new stimulus measures. Admittedly policy makers are poised to take steps
to pullback the economy. OIS markets are pricing 80 percent probability that the
ECB will cut its deposit rate into deeper either this month or September. On
economic data front from euro-zone German Zew economic sentiment will be
important to monitor as recent Fed dovish interest rate outlook fuelled rally in
global equities and having said that Zew Indicator of Economic Sentiment which
reflects six month expectations concerning the economy, inflation rates, interest
rates, equities and exchange rate which likely to remains slightly upbeat.
USDINR is likely to stay below 68.85 and move lower towards 68.02.
14
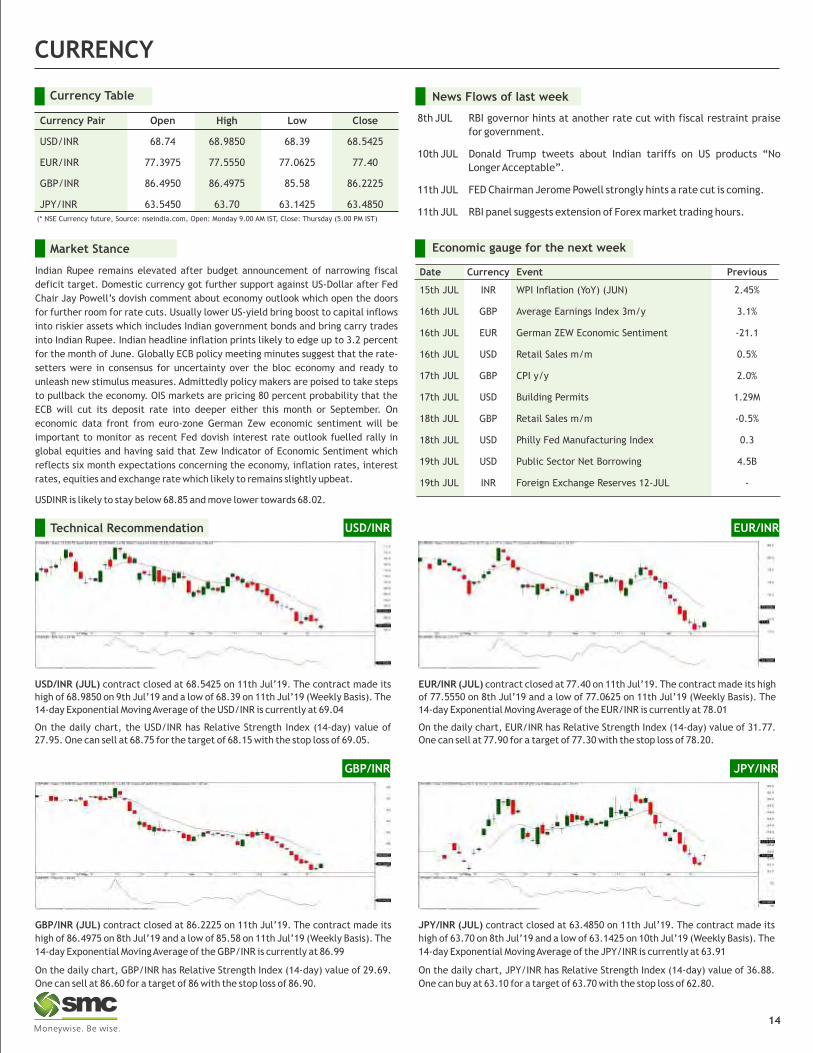
EUR/INR (JUL) contract closed at 77.40 on 11th Jul’19. The contract made its high
of 77.5550 on 8th Jul’19 and a low of 77.0625 on 11th Jul’19 (Weekly Basis). The
14-day Exponential Moving Average of the EUR/INR is currently at 78.01
On the daily chart, EUR/INR has Relative Strength Index (14-day) value of 31.77.
One can sell at 77.90 for a target of 77.30 with the stop loss of 78.20.
EUR/INR
USD/INR (JUL) contract closed at 68.5425 on 11th Jul’19. The contract made its
high of 68.9850 on 9th Jul’19 and a low of 68.39 on 11th Jul’19 (Weekly Basis). The
14-day Exponential Moving Average of the USD/INR is currently at 69.04
On the daily chart, the USD/INR has Relative Strength Index (14-day) value of
27.95. One can sell at 68.75 for the target of 68.15 with the stop loss of 69.05.
USD/INRTechnical Recommendation
GBP/INR (JUL) contract closed at 86.2225 on 11th Jul’19. The contract made its
high of 86.4975 on 8th Jul’19 and a low of 85.58 on 11th Jul’19 (Weekly Basis). The
14-day Exponential Moving Average of the GBP/INR is currently at 86.99
On the daily chart, GBP/INR has Relative Strength Index (14-day) value of 29.69.
One can sell at 86.60 for a target of 86 with the stop loss of 86.90.
GBP/INR
JPY/INR (JUL) contract closed at 63.4850 on 11th Jul’19. The contract made its
high of 63.70 on 8th Jul’19 and a low of 63.1425 on 10th Jul’19 (Weekly Basis). The
14-day Exponential Moving Average of the JPY/INR is currently at 63.91
On the daily chart, JPY/INR has Relative Strength Index (14-day) value of 36.88.
One can buy at 63.10 for a target of 63.70 with the stop loss of 62.80.
JPY/INR
Economic gauge for the next week
Date Currency Event Previous
15th JUL INR WPI Inflation (YoY) (JUN) 2.45%
16th JUL GBP Average Earnings Index 3m/y 3.1%
16th JUL EUR German ZEW Economic Sentiment -21.1
16th JUL USD Retail Sales m/m 0.5%
17th JUL GBP CPI y/y 2.0%
17th JUL USD Building Permits 1.29M
18th JUL GBP Retail Sales m/m -0.5%
18th JUL USD Philly Fed Manufacturing Index 0.3
19th JUL USD Public Sector Net Borrowing 4.5B
19th JUL INR Foreign Exchange Reserves 12-JUL -
IPOIPOIPOIPO
15
IPO NEWS
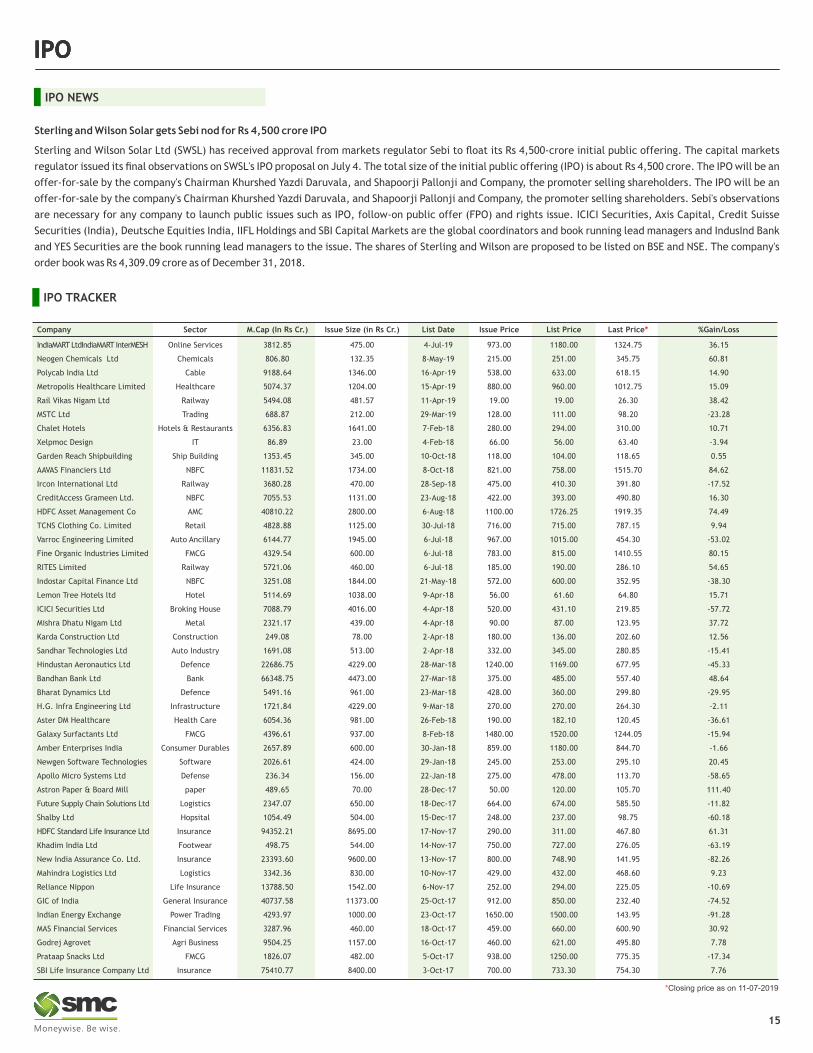
Sterling and Wilson Solar gets Sebi nod for Rs 4,500 crore IPO
Sterling and Wilson Solar Ltd (SWSL) has received approval from markets regulator Sebi to float its Rs 4,500-crore initial public offering. The capital markets
regulator issued its final observations on SWSL's IPO proposal on July 4. The total size of the initial public offering (IPO) is about Rs 4,500 crore. The IPO will be an
offer-for-sale by the company's Chairman Khurshed Yazdi Daruvala, and Shapoorji Pallonji and Company, the promoter selling shareholders. The IPO will be an
offer-for-sale by the company's Chairman Khurshed Yazdi Daruvala, and Shapoorji Pallonji and Company, the promoter selling shareholders. Sebi's observations
are necessary for any company to launch public issues such as IPO, follow-on public offer (FPO) and rights issue. ICICI Securities, Axis Capital, Credit Suisse
Securities (India), Deutsche Equities India, IIFL Holdings and SBI Capital Markets are the global coordinators and book running lead managers and IndusInd Bank
and YES Securities are the book running lead managers to the issue. The shares of Sterling and Wilson are proposed to be listed on BSE and NSE. The company's
order book was Rs 4,309.09 crore as of December 31, 2018.
*Closing price as on 11-07-2019
IPO TRACKER
Company Sector M.Cap (In Rs Cr.) Issue Size (in Rs Cr.) List Date Issue Price List Price Last Price %Gain/Loss*
IndiaMART LtdIndiaMART InterMESH Online Services 3812.85 475.00 4-Jul-19 973.00 1180.00 1324.75 36.15
Neogen Chemicals Ltd Chemicals 806.80 132.35 8-May-19 215.00 251.00 345.75 60.81
Polycab India Ltd Cable 9188.64 1346.00 16-Apr-19 538.00 633.00 618.15 14.90
Metropolis Healthcare Limited Healthcare 5074.37 1204.00 15-Apr-19 880.00 960.00 1012.75 15.09
Rail Vikas Nigam Ltd Railway 5494.08 481.57 11-Apr-19 19.00 19.00 26.30 38.42
MSTC Ltd Trading 688.87 212.00 29-Mar-19 128.00 111.00 98.20 -23.28
Chalet Hotels Hotels & Restaurants 6356.83 1641.00 7-Feb-18 280.00 294.00 310.00 10.71
Xelpmoc Design IT 86.89 23.00 4-Feb-18 66.00 56.00 63.40 -3.94
Garden Reach Shipbuilding Ship Building 1353.45 345.00 10-Oct-18 118.00 104.00 118.65 0.55
AAVAS Financiers Ltd NBFC 11831.52 1734.00 8-Oct-18 821.00 758.00 1515.70 84.62
Ircon International Ltd Railway 3680.28 470.00 28-Sep-18 475.00 410.30 391.80 -17.52
CreditAccess Grameen Ltd. NBFC 7055.53 1131.00 23-Aug-18 422.00 393.00 490.80 16.30
HDFC Asset Management Co AMC 40810.22 2800.00 6-Aug-18 1100.00 1726.25 1919.35 74.49
TCNS Clothing Co. Limited Retail 4828.88 1125.00 30-Jul-18 716.00 715.00 787.15 9.94
Varroc Engineering Limited Auto Ancillary 6144.77 1945.00 6-Jul-18 967.00 1015.00 454.30 -53.02
Fine Organic Industries Limited FMCG 4329.54 600.00 6-Jul-18 783.00 815.00 1410.55 80.15
RITES Limited Railway 5721.06 460.00 6-Jul-18 185.00 190.00 286.10 54.65
Indostar Capital Finance Ltd NBFC 3251.08 1844.00 21-May-18 572.00 600.00 352.95 -38.30
Lemon Tree Hotels ltd Hotel 5114.69 1038.00 9-Apr-18 56.00 61.60 64.80 15.71
ICICI Securities Ltd Broking House 7088.79 4016.00 4-Apr-18 520.00 431.10 219.85 -57.72
Mishra Dhatu Nigam Ltd Metal 2321.17 439.00 4-Apr-18 90.00 87.00 123.95 37.72
Karda Construction Ltd Construction 249.08 78.00 2-Apr-18 180.00 136.00 202.60 12.56
Sandhar Technologies Ltd Auto Industry 1691.08 513.00 2-Apr-18 332.00 345.00 280.85 -15.41
Hindustan Aeronautics Ltd Defence 22686.75 4229.00 28-Mar-18 1240.00 1169.00 677.95 -45.33
Bandhan Bank Ltd Bank 66348.75 4473.00 27-Mar-18 375.00 485.00 557.40 48.64
Bharat Dynamics Ltd Defence 5491.16 961.00 23-Mar-18 428.00 360.00 299.80 -29.95
H.G. Infra Engineering Ltd Infrastructure 1721.84 4229.00 9-Mar-18 270.00 270.00 264.30 -2.11
Aster DM Healthcare Health Care 6054.36 981.00 26-Feb-18 190.00 182.10 120.45 -36.61
Galaxy Surfactants Ltd FMCG 4396.61 937.00 8-Feb-18 1480.00 1520.00 1244.05 -15.94
Amber Enterprises India Consumer Durables 2657.89 600.00 30-Jan-18 859.00 1180.00 844.70 -1.66
Newgen Software Technologies Software 2026.61 424.00 29-Jan-18 245.00 253.00 295.10 20.45
Apollo Micro Systems Ltd Defense 236.34 156.00 22-Jan-18 275.00 478.00 113.70 -58.65
Astron Paper & Board Mill paper 489.65 70.00 28-Dec-17 50.00 120.00 105.70 111.40
Future Supply Chain Solutions Ltd Logistics 2347.07 650.00 18-Dec-17 664.00 674.00 585.50 -11.82
Shalby Ltd Hopsital 1054.49 504.00 15-Dec-17 248.00 237.00 98.75 -60.18
HDFC Standard Life Insurance Ltd Insurance 94352.21 8695.00 17-Nov-17 290.00 311.00 467.80 61.31
Khadim India Ltd Footwear 498.75 544.00 14-Nov-17 750.00 727.00 276.05 -63.19
New India Assurance Co. Ltd. Insurance 23393.60 9600.00 13-Nov-17 800.00 748.90 141.95 -82.26
Mahindra Logistics Ltd Logistics 3342.36 830.00 10-Nov-17 429.00 432.00 468.60 9.23
Reliance Nippon Life Insurance 13788.50 1542.00 6-Nov-17 252.00 294.00 225.05 -10.69
GIC of India General Insurance 40737.58 11373.00 25-Oct-17 912.00 850.00 232.40 -74.52
Indian Energy Exchange Power Trading 4293.97 1000.00 23-Oct-17 1650.00 1500.00 143.95 -91.28
MAS Financial Services Financial Services 3287.96 460.00 18-Oct-17 459.00 660.00 600.90 30.92
Godrej Agrovet Agri Business 9504.25 1157.00 16-Oct-17 460.00 621.00 495.80 7.78
Prataap Snacks Ltd FMCG 1826.07 482.00 5-Oct-17 938.00 1250.00 775.35 -17.34
SBI Life Insurance Company Ltd Insurance 75410.77 8400.00 3-Oct-17 700.00 733.30 754.30 7.76
FIXED DEPOSIT MONITOR
FIXED DEPOSIT COMPANIES
96-120M=7.75%; 0.25% FOR FEMALE, SENIORCITIZEN & TRUST
0.35% EXTRA FOR SR. CITIZEN OR 0.25% EXTRA FOR EXISTING CUSTOMER (15 DAYS GAP IN FIRST & SECOND DEPOSIT) & 0.10% EXTRA IN RENEWAL UPTO ` 5 CR.
0.50% ADD. INTEREST TO SR. CITIZEN,EMPLOYEES,SHAREHOLDERS AND PERSON INVESTING ` 5 LACS AND ABOVE - MAX. 0.50%
` 20000/- BUT` 40000/-
IN MONTHLY
1 BAJAJ FINANCE LTD.(UPTO ` 5 CR.) ` 25000/-
3 GRUH FINANCE LTD. ` 1000/-
HDFC LTD- PREMIUM DEPOSIT FOR INDIVIDUAL(UPTO ` 2 CR.)
0.25% FOR SENIOR CITIZEN UPTO ` 2 CR.4
HDFC LTD- REGULAR FOR INDIVIDUAL & TRUST(> ` 2 CR TO ` 10 CR)
0.25% FOR SENIOR CITIZEN UPTO ` 1 CR.7.93 - 7.93 7.93 - 7.93 7.93 -
HDFC LTD- PREMIUM DEPOSIT FOR TRUST &INSTITUTION (UPTO ` 2 CR.)
-
8 15M=7.98 - - 30M=7.98 - -
HDFC LTD- SPECIAL DEPOSIT FOR TRUST(UPTO ` 2 CR.) 0.25% FOR SENIOR CITIZEN UPTO ` 2 CR.33M=8.03 - - 66M=8.03 - -9
HDFC LTD- REGULAR DEPOSIT FOR TRUST &INSTITUTION (UPTO ` 2 CR.)
0.25% FOR SENIOR CITIZEN UPTO ` 1 CR.7.88 - 7.88 7.88 - 7.88 7.88 -10
8.00 - 7.90 8.20 - 8.25 8.25 8.30ICICI Home Finance (less than ` 1 Cr.)11 0.25% EXTRA FOR SR. CITIZEN
ICICI Home Finance (less than ` 1 Cr.)12 0.25% EXTRA FOR SR. CITIZEN
8.00 - 8.25 8.35 - - - -J K LAKSHMI CEMENT LTD13
0.50% ADD. INTEREST TO SR. CITIZEN,EMPLOYEES, SHAREHOLDERS AND PERSONINVESTING ` 5 LACS AND ABOVE - MAX. 0.50%
8.00 - 8.25 8.35 - - - -J K TYRE INDUSTRIES LTD.14
8.50 - 8.50 8.50 - 8.25 8.25 -KTDFC (KERALA TRANSPORT) ` 10000/-15 0.25% EXTRA FOR SR. CITIZEN
8.15 8.15 8.20 8.25 - - 8.30 -LIC HOUSING FINANCE LTD.(UPTO ` 25 CR.) ` 10000/-16 0.25% FOR SENIOR CITIZEN IF APP ABOVE ` 50,000/- & 0.10% IF APP UPTO ` 50,000/-
M&M FINANCIAL SERVICES LTD(FOR BELOW ` 1 CRORE)
8.10 8.10 8.50 8.80 - 8.80 8.80 -17 ` 10000/-0.25% FOR SENIOR CITIZEN
10.50 - 11.00 11.50 - - - -OMAXE LTD18 -
8.30 - 8.30 8.40 - 8.40 8.45 8.30PNB HOUSING FINANCE LTD.(UPTO ` 5 CR.)
` 10000/-
19 0.25% EXTRA FOR SR. CITIZEN UPTO ` 1 CRORE
15M=8.30 22M=8.35 30M=8.30 44M=8.45 PNB HOUSING FINANCE LTD.(UPTO ` 5 CR.)20 0.25% FOR SENIOR CITIZEN
8.25 - 8.50 9.00 - 9.00 9.25 -SHRIRAM TRANSPORT FINANCE-UNNATI SCHEME ` 5000/-21 0.25% FOR SENIOR CITIZEN,0.25% EXTRA FOR RENEWALS
8.25 - 8.50 9.00 - 9.00 9.25 -SHRIRAM CITY UNION SCHEME ` 5000/-22 0.25% FOR SENIOR CITIZEN,0.25% EXTRA FOR RENEWALS
2 CENT BANK HOME FINANCE (ONLY RENEWAL)CUM-` 5000/-
NON CUM-` 10000/-
7
0.25% FOR SENIOR CITIZEN
HDFC LTD- SPECIAL DEPOSIT FOR INDIVIDUAL(UPTO ` 2 CR.)
0.25% FOR SENIOR CITIZEN UPTO ` 2 CR.33M=7.98 - - 66M=7.98 - -5
HDFC LTD- REGULAR DEPOSIT FOR INDIVIDUAL(UPTO ` 2 CR.)
0.25% FOR SENIOR CITIZEN UPTO ` 1 CR.7.78 - 7.78 7.78 - 7.78 7.78 -6
15M= 20m= 30m= 35m= 40m= 75m= 90m=
8.20% 8.25% 8.35% 8.35% 8.35% 8.40% 8.40%
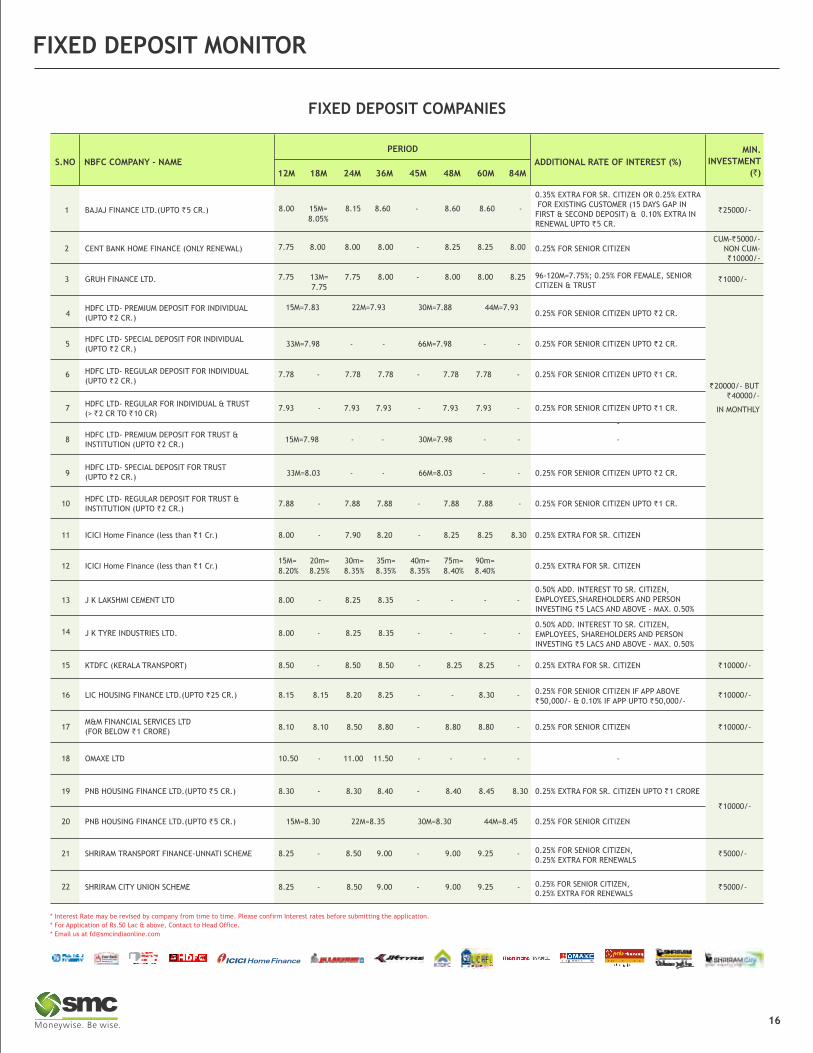
* Interest Rate may be revised by company from time to time. Please confirm Interest rates before submitting the application.
* For Application of Rs.50 Lac & above, Contact to Head Office.
* Email us at [email protected]
16
-
12M 18M 24M 36M 45M 48M 60M 84M
PERIOD
ADDITIONAL RATE OF INTEREST (%)
MIN.
INVESTMENT
(`)NBFC COMPANY - NAME S.NO
8.00 15M= 8.15 8.60 - 8.60 8.60 -
8.05%
7.75 8.00 8.00 8.00 - 8.25 8.25 8.00
7.75 13M= 7.75 8.00 - 8.00 8.00 8.25
7.75
15M=7.83 22M=7.93 30M=7.88 44M=7.93
INDUSTRY & FUND UPDATE
LIC Mutual Fund launches overnight fund
LIC Mutual Fund has launched a new fund named LIC Overnight Fund, an open ended debt scheme investing in overnight securities. The new fund offer will be open for subscription on 15 July. The scheme will be benchmarked against Nifty 1D Rate Index. According to the press release, the primary investment objective of the scheme is to provide reasonable returns commensurate with low risk and providing a high level of liquidity, through investments made primarily in overnight securities having maturity/residual maturity of 1 business day. The fund will be managed by Rahul Singh. The scheme offers two investment options-growth and dividend option. The dividend option has the following facilities: dividend re-investment facility (available for daily, weekly and periodic frequency) and dividend pay-out facility (available for periodic frequency). The scheme would invest up to 100 per cent of assets in overnight securities or debt instruments maturing on or before the next business day with low risk profile. The minimum application amount is Rs 5000 and in multiples of Rs 1 thereafter. The minimum additional purchase amount is Rs 500 and in multiple of Rs 1 thereafter. According to the fund house, the fund seeks to collect a minimum subscription amount of Rs 20 crore under the scheme during the NFO period. There is no entry load and exit load in the scheme.
Mirae Asset AMC launches the Mirae Asset Midcap Fund
Mirae Asset Mutual Fund has launched an open-ended mid cap fund- Mirae Asset Midcap Fund. The new fund offer (NFO) will open for subscription from July 8 to July 22. The scheme is benchmarked against Nifty Midcap 100 Index (TRI). According to the press release, the fund aims to build a diversified portfolio of strong growth companies as well as to avoid concentration and liquidity risks. The fund will be managed by Ankit Jain. The minimum investment required is Rs 5,000 and in multiples of Rs 1 thereafter. Investors will have to pay an exit load of 1 per cent if they sell their investments within a year. If the units are redeemed after a year, no exit load will be charged.
Mutual funds' AUM rises to Rs 25.49 lakh crore in June quarter
Mutual funds' asset base increased to Rs 25.49 lakh crore in April-June 2019, a rise of 4.14 per cent over the previous quarter, on the back of increased retail participation. The asset base of the industry, comprising 44 players, stood at Rs 24.48 lakh crore in the preceding three months, according to data by the Association of Mutual Funds in India (Amfi). Of the 44 fund houses, as many as 24 witnessed growth in their asset base during the period under review as compared to the January-March quarter. DHFL Pramerica Mutual Fund, Essel Mutual Fund and DSP Mutual Fund were among the fund houses that saw a decline in their AUMs. In terms of asset size, HDFC MF continued to lead the pack with an AUM of Rs 3,62,538 crore (excluding fund of funds) at the end of the June quarter, followed by ICICI Prudential MF (Rs 3,37,286 crore) and SBI MF (Rs 3,07,534 crore). In a statement, SBI Mutual Fund said it is number one in terms of AUM addition, which rose by Rs 23,718 crore in the period under review.
Liquid funds witness highest outflows in June; equity funds see inflows
The mutual fund industry witnessed the highest outflows of Rs 1.5 lakh crore among income and debt schemes in the month of June, according to the data from Association of Mutual Funds in India (AMFI). Last month, credit risk funds continued to register outflows. The category registered outflows worth Rs 2,694 crore. Mutual fund managers attributed the fall in liquid funds to quarter-end phenomenon while credit risk funds suffered on the back of the recent credit risk events. Net inflows for the open-ended growth and equity-oriented schemes have been consistently rising for the last three months since April 2019, from Rs 4,608.74 crores at the start of the fiscal to Rs 7,663.14 crores for June 2019, largely driven by Multi-Cap and Large Cap Fund categories, as per AMFI data. The net inflows in the equity-oriented schemes have grown three times faster in the last one month at Rs 2,256.37 crores from May 2019 to June 2019, compared to the rise in the earlier month at Rs 797 crores from April 2019 to May 2019. The net outflows from income and debt-oriented schemes to the tune of Rs 1.71 lakh crores during June 2019 have led to an overall decline in the June month-end AUM at Rs 24.25 lakh crore from Rs 25.93 lakh crore as on May 31, 2019. The overall average AUM for June 2019, however, stood higher at Rs 25.81 lakh crores, as compared to Rs 25.43 lakh crores a month ago.
Rs 10,000 crore worth 6th tranche of CPSE ETF to open on July 18
The government is planning to raise up to Rs 10,000 crore from the sixth tranche of CPSE ETF which would be launched on July 18, an official said. The CPSE Exchange Traded Fund (ETF) tracks shares of 11 Central Public Sector Enterprises (CPSEs) -- ONGC, NTPC, Coal India , IOC, Rural Electrification Corp, Power Finance Corp, Bharat Electronics, Oil India, NBCC India, NLC India and SJVN. The issue is likely to open on July 18 for anchor investors and on July 19 for other investors. Through the earlier five tranches of the CPSE ETF, the government has already raised Rs 38,500 crore -- Rs 3,000 crore from the first tranche in March 2014, Rs 6,000 crore in January 2017, Rs 2,500 crore from the third in March 2017, Rs 17,000 crore in November 2018 and Rs 10,000 crore in March 2019. The government aims to raise a record Rs 1.05 lakh crore through disinvestment in 2019-20, up from Rs 85,000 crore raised last fiscal.
MUTUAL FUND
17
NEW FUND OFFER
Scheme Name Baroda Equity Savings Fund
Fund Type Open Ended
Fund Class Hybrid Scheme - Equity Savings
Opens on 04-Jul-2019
Closes on 16-Jul-2019
Investment Objective To generate capital appreciation and income by using arbitrage opportunities, investment in equity / equity related instruments and debt/ money market instruments.
Min. Investment Rs. 5,000/-
Fund Manager Mr. Sanjay Chawla / Mr. Dipak Acharya / Mr. Alok Sahoo
Scheme Name Parag Parikh Tax Saver Fund - Regular Plan (G)Fund Type Open-EndedFund Class GrowthOpens on 04-Jul-2019Closes on 18-Jul-2019Investment Objective To generate long-term capital appreciation through a diversified portfolio of equity and equity related instruments. (80% of
total assets in accordance with Equity Linked Saving Scheme, 2005 notified by Ministry of Finance)Min. Investment Rs.5000/-Fund Manager Raj Mehta / Rajeev Thakkar / Raunak Onkar
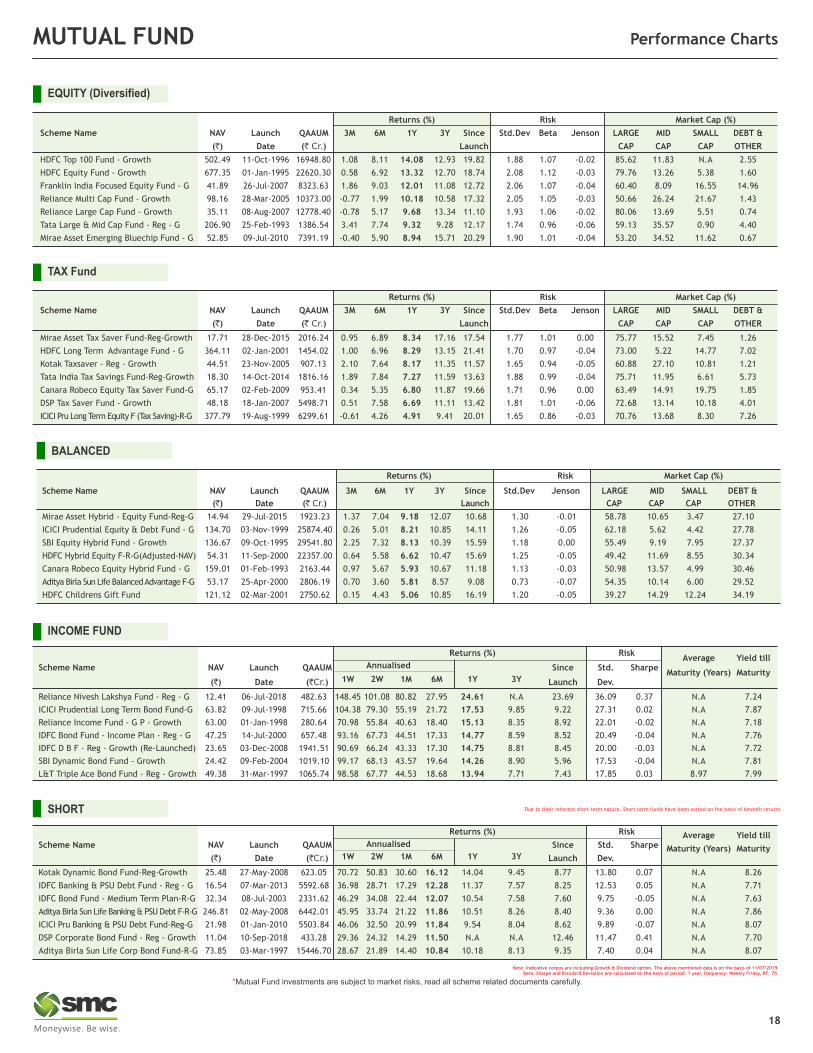
Note: Indicative corpus are including Growth & Dividend option . The above mentioned data is on the basis of 11/07/2019Beta, Sharpe and Standard Deviation are calculated on the basis of period: 1 year, frequency: Weekly Friday, RF: 7%
MUTUAL FUND Performance Charts
Returns (%) Risk Market Cap (%)
Scheme Name NAV Launch QAAUM 3M 6M 1Y 3Y Since Std.Dev Beta Jenson LARGE MID SMALL DEBT &
(`) Date (` Cr.) Launch CAP CAP CAP OTHER
Mirae Asset Tax Saver Fund-Reg-Growth 17.71 28-Dec-2015 2016.24 0.95 6.89 8.34 17.16 17.54 1.77 1.01 0.00 75.77 15.52 7.45 1.26
HDFC Long Term Advantage Fund - G 364.11 02-Jan-2001 1454.02 1.00 6.96 8.29 13.15 21.41 1.70 0.97 -0.04 73.00 5.22 14.77 7.02
Kotak Taxsaver - Reg - Growth 44.51 23-Nov-2005 907.13 2.10 7.64 8.17 11.35 11.57 1.65 0.94 -0.05 60.88 27.10 10.81 1.21
Tata India Tax Savings Fund-Reg-Growth 18.30 14-Oct-2014 1816.16 1.89 7.84 7.27 11.59 13.63 1.88 0.99 -0.04 75.71 11.95 6.61 5.73
Canara Robeco Equity Tax Saver Fund-G 65.17 02-Feb-2009 953.41 0.34 5.35 6.80 11.87 19.66 1.71 0.96 0.00 63.49 14.91 19.75 1.85
DSP Tax Saver Fund - Growth 48.18 18-Jan-2007 5498.71 0.51 7.58 6.69 11.11 13.42 1.81 1.01 -0.06 72.68 13.14 10.18 4.01
ICICI Pru Long Term Equity F (Tax Saving)-R-G 377.79 19-Aug-1999 6299.61 -0.61 4.26 4.91 9.41 20.01 1.65 0.86 -0.03 70.76 13.68 8.30 7.26
TAX Fund
Returns (%) Risk Market Cap (%)
Scheme Name NAV Launch QAAUM 3M 6M 1Y 3Y Since Std.Dev Beta Jenson LARGE MID SMALL DEBT &
(`) Date (` Cr.) Launch CAP CAP CAP OTHER
HDFC Top 100 Fund - Growth 502.49 11-Oct-1996 16948.80 1.08 8.11 14.08 12.93 19.82 1.88 1.07 -0.02 85.62 11.83 N.A 2.55
HDFC Equity Fund - Growth 677.35 01-Jan-1995 22620.30 0.58 6.92 13.32 12.70 18.74 2.08 1.12 -0.03 79.76 13.26 5.38 1.60
Franklin India Focused Equity Fund - G 41.89 26-Jul-2007 8323.63 1.86 9.03 12.01 11.08 12.72 2.06 1.07 -0.04 60.40 8.09 16.55 14.96
Reliance Multi Cap Fund - Growth 98.16 28-Mar-2005 10373.00 -0.77 1.99 10.18 10.58 17.32 2.05 1.05 -0.03 50.66 26.24 21.67 1.43
Reliance Large Cap Fund - Growth 35.11 08-Aug-2007 12778.40 -0.78 5.17 9.68 13.34 11.10 1.93 1.06 -0.02 80.06 13.69 5.51 0.74
Tata Large & Mid Cap Fund - Reg - G 206.90 25-Feb-1993 1386.54 3.41 7.74 9.32 9.28 12.17 1.74 0.96 -0.06 59.13 35.57 0.90 4.40
Mirae Asset Emerging Bluechip Fund - G 52.85 09-Jul-2010 7391.19 -0.40 5.90 8.94 15.71 20.29 1.90 1.01 -0.04 53.20 34.52 11.62 0.67
EQUITY (Diversified)
Annualised
Returns (%) RiskAverage Yield till
Scheme Name NAV Launch QAAUM Since Std. Sharpe
1W 2W 1M 6M 1Y 3YMaturity (Years) Maturity
(`) Date (`Cr.) Launch Dev.
Reliance Nivesh Lakshya Fund - Reg - G 12.41 06-Jul-2018 482.63 148.45 101.08 80.82 27.95 24.61 N.A 23.69 36.09 0.37 N.A 7.24
ICICI Prudential Long Term Bond Fund-G 63.82 09-Jul-1998 715.66 104.38 79.30 55.19 21.72 17.53 9.85 9.22 27.31 0.02 N.A 7.87
Reliance Income Fund - G P - Growth 63.00 01-Jan-1998 280.64 70.98 55.84 40.63 18.40 15.13 8.35 8.92 22.01 -0.02 N.A 7.18
IDFC Bond Fund - Income Plan - Reg - G 47.25 14-Jul-2000 657.48 93.16 67.73 44.51 17.33 14.77 8.59 8.52 20.49 -0.04 N.A 7.76
IDFC D B F - Reg - Growth (Re-Launched) 23.65 03-Dec-2008 1941.51 90.69 66.24 43.33 17.30 14.75 8.81 8.45 20.00 -0.03 N.A 7.72
SBI Dynamic Bond Fund - Growth 24.42 09-Feb-2004 1019.10 99.17 68.13 43.57 19.64 14.26 8.90 5.96 17.53 -0.04 N.A 7.81
L&T Triple Ace Bond Fund - Reg - Growth 49.38 31-Mar-1997 1065.74 98.58 67.77 44.53 18.68 13.94 7.71 7.43 17.85 0.03 8.97 7.99
INCOME FUND
Returns (%) Risk Average Yield tillScheme Name NAV Launch QAAUM Since Std. Sharpe
1W 2W 1M 6M 1Y 3YMaturity (Years) Maturity
(`) Date (`Cr.) Launch Dev.
Kotak Dynamic Bond Fund-Reg-Growth 25.48 27-May-2008 623.05 70.72 50.83 30.60 16.12 14.04 9.45 8.77 13.80 0.07 N.A 8.26
IDFC Banking & PSU Debt Fund - Reg - G 16.54 07-Mar-2013 5592.68 36.98 28.71 17.29 12.28 11.37 7.57 8.25 12.53 0.05 N.A 7.71
IDFC Bond Fund - Medium Term Plan-R-G 32.34 08-Jul-2003 2331.62 46.29 34.08 22.44 12.07 10.54 7.58 7.60 9.75 -0.05 N.A 7.63
Aditya Birla Sun Life Banking & PSU Debt F-R-G 246.81 02-May-2008 6442.01 45.95 33.74 21.22 11.86 10.51 8.26 8.40 9.36 0.00 N.A 7.86
ICICI Pru Banking & PSU Debt Fund-Reg-G 21.98 01-Jan-2010 5503.84 46.06 32.50 20.99 11.84 9.54 8.04 8.62 9.89 -0.07 N.A 8.07
DSP Corporate Bond Fund - Reg - Growth 11.04 10-Sep-2018 433.28 29.36 24.32 14.29 11.50 N.A N.A 12.46 11.47 0.41 N.A 7.70
Aditya Birla Sun Life Corp Bond Fund-R-G 73.85 03-Mar-1997 15446.70 28.67 21.89 14.40 10.84 10.18 8.13 9.35 7.40 0.04 N.A 8.07
SHORT Due to their inherent short term nature, Short term funds have been sorted on the basis of 6month returns
Annualised
Returns (%) Risk Market Cap (%)
Scheme Name NAV Launch QAAUM 3M 6M 1Y 3Y Since Std.Dev Jenson LARGE MID SMALL DEBT &
(`) Date (` Cr.) Launch CAP CAP CAP OTHER
Mirae Asset Hybrid - Equity Fund-Reg-G 14.94 29-Jul-2015 1923.23 1.37 7.04 9.18 12.07 10.68 1.30 -0.01 58.78 10.65 3.47 27.10
ICICI Prudential Equity & Debt Fund - G 134.70 03-Nov-1999 25874.40 0.26 5.01 8.21 10.85 14.11 1.26 -0.05 62.18 5.62 4.42 27.78
SBI Equity Hybrid Fund - Growth 136.67 09-Oct-1995 29541.80 2.25 7.32 8.13 10.39 15.59 1.18 0.00 55.49 9.19 7.95 27.37
HDFC Hybrid Equity F-R-G(Adjusted-NAV) 54.31 11-Sep-2000 22357.00 0.64 5.58 6.62 10.47 15.69 1.25 -0.05 49.42 11.69 8.55 30.34
Canara Robeco Equity Hybrid Fund - G 159.01 01-Feb-1993 2163.44 0.97 5.67 5.93 10.67 11.18 1.13 -0.03 50.98 13.57 4.99 30.46
Aditya Birla Sun Life Balanced Advantage F-G 53.17 25-Apr-2000 2806.19 0.70 3.60 5.81 8.57 9.08 0.73 -0.07 54.35 10.14 6.00 29.52
HDFC Childrens Gift Fund 121.12 02-Mar-2001 2750.62 0.15 4.43 5.06 10.85 16.19 1.20 -0.05 39.27 14.29 12.24 34.19
BALANCED
18
*Mutual Fund investments are subject to market risks, read all scheme related documents carefully.
Mr. Anurag Bansal (Whole Time Director, SMC Group) and Mrs. Nidhi Bansal (Regional Director, SMC Group)Awarding the new joinees during Abhinandan - Employee Induction Program from 5th – 7th June, 2019
at SMC Mumbai office.
Mr. D K Aggarwal (CMD, SMC Investments and Snr VP, PHD Chamber of Commerce)during Budget Viewing Session 2019-20 organised by PHD Chamber of Commerce held on Friday, 5th July, 2019
at PHD House, New Delhi.

At SMC Finance, We make it easy for you to get a loan.
Whether you are expanding your business, upgrading
new equipments or for working capital. We are here to
help you grow fast.
www.smcfinance.com
Professional and Transparent approach
Quick loan approval & disbursal
Hassle-free documentation process
Attractive Rate of Interest
FOCUS ON YOUR BUSINESS, NOT FINANCEGet easy business loans with SMC Finance
Call Toll-Free 1800 11 8818E-mail [email protected]
Moneywise Financial Services Pvt. Ltd. (A wholly owned subsidiary of SMC Global Securities Ltd.) Corporate Office: 11/6-B, 2nd Floor, Pusa Road, New Delhi 110005, Tel. +91-11-30111000, CIN No.: U51909WB1996PTC078352
Medical Equipment Finance | Personal Loan | Loan Against Property | Loan Against Shares/Mutual Funds/Bonds | MSME/SME Financing | Lease Rental Discounting | Promoter Financing | Debtors Financing | Structured Financing | Affordable Housing Application Financing | IPO/ NCD Financing | Business Loan
SMC GROUP PRESENCE:
DELHI | MUMBAI | KOLKATA | AHEMDABAD | LUCKNOW | CHANDIGARH | DUBAI