Embed Size (px)
Citation preview

2019 INTERNATIONAL AIRFREIGHT INDICATOR
DATA AND MEASUREMENT SERIES

INFRASTRUCTURE PARTNERSHIPS AUSTRALIA:
ADRIAN DWYER Chief Executive Officer Infrastructure Partnerships Australia P +61 2 9152 6000 E [email protected]
NICK HUDSON Director, Economics and Policy Infrastructure Partnerships Australia E [email protected]
DR PERSA PAFLIOTI Senior Policy Adviser Infrastructure Partnerships Australia
BIS OXFORD ECONOMICS:ROBERT MELLOR Managing Director BIS Oxford Economics P +61 2 8458 4200 E [email protected]
DARREN ANDERSON Associate Director, Transactions & Infrastructure BIS Oxford Economics E [email protected]
HUSAM EL-TARIFI Senior Economist BIS Oxford Economics E [email protected]
Infrastructure Partnerships Australia is an independent think tank and executive member network, focused on excellence in social and economic infrastructure.
Formed in 2005 as a genuine and enduring policy partnership between Australia’s governments and industry, we exist to shape public debate and drive policy reform for the benefit of the national interest. Infrastructure Partnerships Australia’s formation recognises that through innovation and reform, Australia can extract more from the infrastructure we have, and invest more in the infrastructure we need.
Infrastructure is about more than balance sheets and building sites. Infrastructure is the key to how Australia does business, how we meet the needs of a prosperous economy and growing population, and how we sustain a cohesive and inclusive society.
BIS Oxford Economics is the leader in forecasting, modelling and quantitative analysis within Australia and across the globe. They support organisations in understanding how various economic and sectoral drivers will evolve and the impacts they will have on their business.
Infrastructure Partnerships Australia, 2019
© 2019 by Infrastructure Partnerships Australia. 2019 AUSTRALIAN INTERNATIONAL AIRFREIGHT INDICATOR. This work is licensed under the Creative Commons Attribution 4.0 International License. To view a copy of this license, visit http://creativecommons.org/licenses/by/4.0/.

CONTENTS Message from the CEO 3
Key highlights for 2017-18 and 2018-19 4
Airports in focus 5
The International Airfreight Indicator 6
An overview of Australia’s airfreight 7
Australia’s airfreight by direction 11
Air cargo by airport: Sydney 16
Air cargo by airport: Melbourne 20
Air cargo by airport: Brisbane 24
Air cargo by airport: Perth 28
Abbreviations 32
Appendix 32
International Airfreight Indicator 2019 Infrastructure Partnerships Australia
LISTS OF TABLESTable 1: Overview of Australia’s airfreight imports 10
Table 2: Overview of Australia’s airfreight exports 10
Table 3: Air imports by commodity group 12
Table 4: Air exports by commodity group 14
Table 5: Sydney Airport imports by value and volume 18
Table 6: Sydney Airport exports by value and volume 19
Table 7: Melbourne Airport imports by value and volume 22
Table 8: Melbourne Airport exports by value and volume 23
Table 9: Brisbane Airport imports by value and volume 26
Table 10: Brisbane Airport exports by value and volume 27
Table 11: Perth Airport imports by value and volume 30
Table 12: Perth Airport exports by value and volume 31
Table 13: Data Description 33
LIST OF FIGURESFigure 1: International airfreight per capita 7
Figure 2: International airfreight values as a percentage of GDP 7
Figure 3: Relation between passengers and airfreight 8
Figure 4: Modal share in international freight for FY2017-18 8
Figure 5: International freight by mode and direction of trade 9
Figure 6: International airfreight by direction 9
Figure 7: Airfreight imports by airport location 11
Figure 8: Airfreight exports by airport location 13

International Airfreight Indicator 2019 Infrastructure Partnerships Australia 3
Every day over 550 international flights arrive and depart Australia. We know with a high degree of accuracy the number of passengers those planes are carrying, their origin and destination and even the purpose of their trip.
Yet, until now, we have known very little about what is being carried in the belly of those same planes. Beyond high level indicators about the volume of airfreight, we are remarkably blind to the value, the type of commodity, and the economic contribution of the airfreight that leaves or lands in Australia.
In a national first, the Infrastructure Partnerships Australia and BIS Oxford Economics’ International Airfreight Indicator shines a light on one of the most important components of Australia’s international freight task. By knowing at the granular level the nature of Australia’s inbound and outbound airfreight, we can begin to understand and improve the efficiency and effectiveness of an increasingly important part of the supply chain.
In FY2017-18, $109 billion of international trade passed through Australia’s airports, with more than 96 per cent of international airfreight passing through the four main capital city airports – Sydney, Melbourne, Brisbane and Perth. While airfreight represented less than one per cent
of Australia’s international trade by volume, it was more than 21 per cent in monetary value. Put another way, one in every $5 of Australia’s imports and exports travels via our airports.
In a period of heightened trade tensions and dynamic structural change, its increasingly critical to measure and understand the evolving nature of Australia’s international trade.
The International Airfreight Indicator shows that airports are crucial to our trade story, and the cargo transported beneath passengers is vitally important to airlines, airports and the Australian economy. More than 80 percent of our airfreight is carried in passenger aircraft, with the balance carried in dedicated freight carriers.
By transparently measuring the composition of these trade flows, the International Airfreight Indicator allows each of those players – airlines, airports and Australians more broadly – access to the information and insights needed to optimise the way we use our infrastructure and maximise our economic opportunities.
In April 2018, Infrastructure Partnerships Australia launched Fixing Freight: Establishing Freight Performance Australia. The report made the case that doing better on logistics first requires us to understand
the problem which, in turn, requires better data. Instead of simply making the call for better data, that work traced a practical pathway to establishing a dedicated freight body that we called Freight Performance Australia. Since the release of Fixing Freight, iMOVE CRC has commenced a study with the Commonwealth Government on freight data needs and measurement in freight.
To prove the case for better data – both the value it provides and that delivering it is achievable – we are pleased to present Australia’s first public International Airfreight Indicator. We will continue to develop the International Airfreight Indicator, adding further depth and new data. Amongst the planned upgrades are deeper granularity, new approaches to visualisation and the addition of other infrastructure nodes like seaports. We hope you find the Indicator useful, and we look forward to continuing to work with you to make Australia’s freight systems more efficient, more effective and more transparent.
MESSAGE FROM THE CEO

International Airfreight Indicator 2019 Infrastructure Partnerships Australia4
KEY HIGHLIGHTS FOR FY2017-18 AND FY2018-19
One in every five dollars of Australia’s goods trade travels via airfreight, but it is less than one percent of trade volume.
FY2017-18 saw a record high for airfreight trade – 1.15 million tonnes worth $109 billion. Over FY2018-19, we forecast this to increase by 3.5 and 4.4 per cent, respectively.
Exports increased more than imports in FY2017-18 relative to FY2016-17. However, exports growth expected to ease to 1.6 per cent in value and 2.4 per cent in volume compared to imports (6.2 per cent and 4.7 per cent respectively) for FY2018-19.
More than half of the growth in airfreight exports over FY2017-18 can be attributed to booming demand for food products from China. Over the past four years, exports of infant formula and related products have surged from being negligible to 18 per cent of airfreight exports by mass.
However, infant formula and other processed food products have reached a peak and will be flat over the near term. There is also considerable risk, especially on the downside due to possible trade restrictions.
The largest forecast decreases for exports over FY2018-19 is expected in vehicles and transport equipment – at 19 per cent. The decline will see exports fall by $333 million, from $1.75 billion the previous year. Export declines are forecast to continue as the industry in Melbourne continues to experience the aftershocks of the closure of the domestic manufacturing industry in late 2017.
The largest forecast increase for imports over FY2018-19 is in machinery and equipment. The forecast rise follows a pick up since FY2017-18 and improved outlook for non-mining tradeable sectors, as business confidence returns encouraging them to invest in machinery and equipment, and Intellectual Property products.
Airfreight reached a record high at around 70 kg per capita over FY2017-18. This measure has increased by approximately 60 per cent over the last five years alone.
Airfreight imports and exports are forecast to have a moderate increase in FY2018-19 – 1.2 million tonnes worth $114 billion.
1 in $5
1.15 million tonnes
Exports increase
50 per cent+ exports to China
Processed products peaked
Forecast $333m fall
Largest increase
TONNE
70 kg per capita
1.2 million tonnes

International Airfreight Indicator 2019 Infrastructure Partnerships Australia 5
AIRPORTS IN FOCUS
Sydney Airport – the most significant “freight hub” – represents circa 45 per cent of all freight imports and exports in both value and volume. Exports in FY2017-18 totalled 225 thousand tonnes, up 10 per cent compared to FY2016-17, bringing the total value of exports to $13 billion. Machinery and equipment, and infant formula have been the primary source of growth in airborne exports.
Melbourne Airport represented 28 per cent of all freight volume and 17 per cent of all freight value in FY2017-18. Growth in export volume over FY2018-19 is forecast to remain flat, however, primary rural products will increasingly drive the outlook over the coming quarters.
Brisbane represented 12 per cent of all freight volume and seven per cent of all freight value in FY2017-18. Growth in beef exports will increasingly drive the outlook over the coming quarters, however a flat outlook for processed food will see overall tonnage growth ease to three per cent growth over FY2018-19, while growth in value is forecast to decrease 0.5 per cent.
In value terms, exports are to a large extent driven by gold production, where Australia is the world’s second largest producer. Since Western Australia produces the majority of gold, Perth Airport is over-represented in exports. Exports are forecast to grow over the next two years and peak at 354 tonnes in FY2019-20, 322 tonnes of which are produced locally.
Sydney Airport45%
28%
12%
10%
Melbourne Airport
Brisbane Airport
Perth Airport
International Airfreight Indicator 2019 Infrastructure Partnerships Australia6
THE IMPORTANCE OF AIRFREIGHTAustralia’s international competitiveness is underpinned by a reliable and efficient transport sector. Airfreight is an increasingly important component of that transport task, carrying the highest value and most time critical shipments across the nation and the world. These include necessities such as pharmaceuticals, high-end manufacturing products, and time sensitive perishable goods such as seafood. Airfreight services reduce time to link suppliers and customers quickly, efficiently and reliably. Yet, the importance of airfreight to the Australian economy is often overlooked and misunderstood with the focus almost exclusively centred on passenger travel or seaborne freight.
THE INTERNATIONAL AIRFREIGHT INDICATORDespite the importance of moving people and goods to the economy, we have a remarkable lack of reliable indicators to help us understand our transport system. This deficit of insight is driven by an absence of data and analysis. The result is a policy, regulatory and investment environment where decisions are based on intuition and imperfect information, rather than evidence.
Despite the existence of various high-level reports throughout the years, Australia does not measure and report on airfreight systematically or consistently. The International Airfreight Indicator, produced by Infrastructure Partnerships Australia (IPA) in collaboration with BIS Oxford Economics (BISOE), seeks to fill that information gap. The inaugural International Airfreight Indicator provides comprehensive analysis of air cargo movements into and out of Australia. The motivation behind the International Airfreight Indicator is three-fold:
• first, given the increasing role of air transport in facilitating economic activity, an index of its output with 12-month forecasts, in both value and volume terms, can be a reliable indicator of the current and future economic activity of Australia
• second, by providing an overview of the evolving nature of airfreight in Australia, the Airfreight Indicator provides visibility and understanding of the market to industry and government. This includes a more detailed picture of what is moving where and why, how its changing over time, and the different dynamics across airports and wider catchments, and
• third, airfreight measurement through airports can lift the visibility and understanding of its significance to the Australian economy. In turn, this can assist infrastructure planning and development of strategies as well as management across the transport network.
The first edition sets the scene of the evolution of airfreight though a brief historical analysis.
THE INTERNATIONAL AIRFREIGHT INDICATOR

International Airfreight Indicator 2019 Infrastructure Partnerships Australia 7
Freight is a direct indicator of the health of the Australian economy, and the value and volume of airfreight imports and exports related to the population base and economic activity in an airport’s catchment. Air imports and exports in Australia reached a record high in FY2017-18, equivalent to 70 and 71 kg per capita respectively (Figure 1), which has grown strongly since 2004. In fact, growth in export volume of airfreight, measured on a per capita basis, has increased approximately 60 per cent over the last five years alone.
Figure 1: International airfreight per capita
0
10
20
30
40
50
60
70
80
0
2000
4000
6000
8000
10000
12000
kg/c
apita
$/ca
pita
Exports/capita Value Imports/capita Value Exports/capita Mass Imports/capita Mass
Jun-96 Jun-98 Jun-00 Jun-02 Jun-04 Jun-06 Jun-08 Jun-10 Jun-12 Jun-14 Jun-16 Jun-18
Source: IPA/BISOE based on ABS statistics
In terms of the per capita value of airfreight, imports and exports have declined marginally since their peak in 2009. Imports and exports, when measured by value on a per capita basis, displays a much higher correlation in movement than volume measured on a per capita basis. This reflects the sensitivity of airfreight, to changes in the exchange rate.
In total value terms, airfreight imports and exports represented 3.8 and 2.4 per cent of GDP respectively (Figure 2), totalling 6.2 per cent of GDP.
Figure 2: International airfreight values as a percentage of GDP
0
1
2
3
4
5
6
Exports/GDP Value
per c
ent
Imports/GDP Value
Jun-96 Jun-98 Jun-00 Jun-02 Jun-04 Jun-06 Jun-08 Jun-10 Jun-12 Jun-14 Jun-16 Jun-18
Source: IPA/BISOE based on ABS statistics
AN OVERVIEW OF AUSTRALIA’S AIRFREIGHT

International Airfreight Indicator 2019 Infrastructure Partnerships Australia8
The increase in international passenger travel at Australian airports has increased the potential for international freight to be carried into and out of Australia by plane. Over 80 per cent of airfreight is carried in the cargo hold of passenger aircraft. The remaining circa 20 per cent is carried by dedicated freighters. Forecast growth in patronage is significant with:
This positive relationship is further depicted historically in Figure 3, where the growth in passenger numbers correlates closely with the growth in airfreight. While airfreight to a large degree relies on passenger yield on routes, often the revenue generated from freight carried in the belly of passenger aircraft provides the necessary margin to sustain the commercial viability of a route or region. As such, there is a degree of interdependency
65.6m passengers
67m passengers
48.3m passengers
35m passengers
Sydney Airport forecasting 65.6 million passengers by 2039 up from 42.6 million in FY2016-17
Melbourne Airport has forecast a doubling of patronage to 67 million by 2038, compared to 34.8 million in FY2016-17
Brisbane Airport forecasting 48.3 million passengers by 2038, compared to 22.6 million in FY2017-18
Perth Airport forecasting 35 million passengers by 2045 up from 12.4 million in FY2016-17.
between passenger and airfreight movements, to support overall demand and exports.
Figure 3: Relation between passengers and airfreight
0
200,000
400,000
600,000
800,000
1,000,000
1,200,000
05,000,000
10,000,00015,000,00020,000,00025,000,00030,000,00035,000,00040,000,00045,000,000
frei
ght t
onne
s
pass
enge
r nu
mbe
r
airfreight passengers
Source: IPA/BISOE based on BITRE statistics
While airborne transportation may be a tiny proportion of international freight by volume - less than one per cent – it represents a significant amount of the country’s imports and exports by value at circa 21 per cent (Figure 4). In an international context, airfreight represents less than one per cent of world trade by volume, but it exceeds 35 per cent by value. Australia’s underweight level of airfreight compared to our global peers is due to the relative weight towards natural resources in Australia’s trade mix, which is transported via sea.
Figure 4: Modal share in international freight, FY2017-18
Sea Air Unknown
ValueVolume
98.8% 73.7%21.5%
4.8%
0.9%
0.3%
Source: IPA/BISOE based on ABS statistics
While shipping is the dominant mode for freight transportation (Figure 5), since 2014 its share in value terms has trended down while airfreight has risen. This has been the result of faster growth of goods that are transported by air relative to other classes of goods, rather than the stronger modal competition and mode shifting within commodity classes. Only a few smaller classes have experienced a shift between air and sea, such as footwear and food products. This is mainly due to a shift to higher quality products, which have a higher value-to-mass ratio and allow for just-in-time logistics models, as well as an increase in perishable goods.

International Airfreight Indicator 2019 Infrastructure Partnerships Australia 9
Figure 5: International freight by mode and direction of trade
0
10,000
20,000
30,000
40,000
50,000
60,000
70,000
0
50,000
100,000
150,000
200,000
250,000
300,000
Jun-96 Jun-98 Jun-00 Jun-02 Jun-04 Jun-06 Jun-08 Jun-10 Jun-12 Jun-14 Jun-16 Jun-18
$M A
ir
$M S
ea
Exports Sea Imports Sea Exports Air Imports Air
Source: IPA/BISOE based on ABS statistics
FY2017-18 was a record year for Australian trade measured in dollars and tonnes for both imports and exports by air. Circa 1.15 million tonnes of international freight, worth close to $109 billion, passed through Australia; 530,000 tonnes of this passed through Sydney Airport, which is the most significant entry and exit point for international freight. Sydney Airport handled almost half – more than 45 per cent – of all freight imports and exports in FY2017-18 in both volumes and values.
Melbourne Airport accounted for more than one quarter of the total freight volume with 28 per cent, and 17 per cent of the total value. Brisbane Airport, Perth Airport and other airports accounted for 12 per cent, nine per cent and four per cent respectively. However, while Brisbane Airport collectively with other airports represent 10 per cent of the total value of airfreight, Perth Airport represents circa 25 per cent of airfreight export value, with gold being the largest export commodity.
Inbound and outbound freight in Australia is typically symmetric, with inbound freight representing almost half (51 per cent) of the total freight by mass in FY2017-18 and outbound accounting for the remaining 49 per cent, as seen in Figure 6 below. However, when the value of freight is considered, there is an asymmetry, with inbound freight representing 61 per cent of the total freight with the remainder being outbound freight. As such, Australia imports higher value products per tonne, than it exports.
Figure 6: International airfreight by direction
Jun-96 Jun-98 Jun-00 Jun-02 Jun-04 Jun-06 Jun-08 Jun-10 Jun-12 Jun-14 Jun-16 Jun-180
100,000
200,000
300,000
400,000
500,000
600,000
700,000
0
10,000
20,000
30,000
40,000
50,000
60,000
70,000
80,000
Tonn
es
$M
Exports Value Imports Value Exports Mass Imports Mass
Source: IPA/BISOE based on ABS statistics
Forecasts for FY2018-19 show an increase in total airfreight of 4.4 per cent by value (to $114 billion) with a more modest increase of 3.5 per cent for total volume (1.19 million tonnes), relative to FY2017-18. Imports are forecast to experience the largest increase, relative to exports, in both value and volume with Brisbane Airport increasing its inbound freight by 6.9 per cent in value and Perth Airport by 5.4 per cent in tonnes. Air imports and exports are forecast to reach a record high in FY2018-19 in both values and volumes, albeit with a more modest growth relative to the previous year’s growth rate (Figure 6).

International Airfreight Indicator 2019 Infrastructure Partnerships Australia10
In a recent study, the International Air Transport Association forecast a rise in global airfreight carried to 62.5 million tonnes in 20181 with IATA underlying e-commerce emerging as a new driver of airfreight. The value of goods carried by airlines is expected to exceed US$6.2 trillion in 2018, representing 7.4 per cent of world GDP.
Table 1: Overview of Australia’s airfreight imports
Key Airports
2017-18 2018-19 10-year trend
2007-08 to 2017-18% change % change
$ million tonnes $ million tonnes $ million tonnes $ million tonnes $ million tonnes
Total Trade 108,860 1,150,847 3.8% 10.2% 113,652 1,191,579 4.4% 3.5%
Import 66,418 582,168 3.3% 9.5% 70,539 609,377 6.2% 4.7%
Sydney 39,619 305,922 4.3% 7.2% 42,106 320,173 6.3% 4.7%
Melbourne 11,738 146,932 10.2% 11.3% 12,477 153,190 6.3% 4.3%
Brisbane 4,680 61,496 12.9% 11.9% 5,000 64,683 6.9% 5.2%
Perth 7,008 45,242 -5.2% 7.6% 7,373 47,703 5.2% 5.4%
Other 3,373 22,576 -17.6% 30.8% 3,583 23,627 6.2% 4.7%
Source: IPA/BISOE based on ABS statistics
Table 2: Overview of Australia’s airfreight exports
Key Airports
2017-18 2018-19 10-year trend
2007-08 to 2017-18% change % change
$ million tonnes $ million tonnes $ million tonnes $ million tonnes $ million tonnes
Total Trade 108,860 1,150,847 3.8% 10.2% 113,652 1,191,579 4.4% 3.5%
Export 42,442 568,679 4.7% 10.9% 43,113 582,202 1.6% 2.4%
Sydney 12,895 224,559 11.1% 10.2% 13,038 226,773 1.1% 1.0%
Melbourne 5,661 178,519 5.0% 12.4% 5,719 184,361 1.0% 3.3%
Brisbane 2,489 78,316 20.3% 9.7% 2,477 80,620 -0.5% 2.9%
Perth 20,681 63,391 -0.5% 7.6% 21,152 65,971 2.3% 4.1%
Other 716 23,894 1.6% 18.3% 728 24,478 1.6% 2.4%
Source: IPA/BISOE based on ABS statistics
1 IATA, 2018, IATA Cargo Strategy, Geneva.

International Airfreight Indicator 2019 Infrastructure Partnerships Australia 11
IMPORTSImports tend to exhibit fluctuations reflecting local economic cycles and expectations for the development of the world economy, as reflected in Figure 7. While airports experience different volumes of freight, their fluctuations show a rather symmetric picture relative to the macroeconomic environment. More specifically the downturns of 1998 and 2008 are mainly a reflection of the world economic conditions due to the Asian and the Global Financial Crisis (GFC).
Local economic condition such as the structural change of Australia’s tax system in 1999, low exchange rates, inflationary pressures, high oil prices and weak residential construction affected consumer spending and business confidence in 2003 and 2005. The downturn in 2012 for volume is mainly the outcome of low investments with a slowdown of imported capital goods and in particular a decline in retail consumption. The same holds true for 2016 which was characterised by slow economic growth accompanied by weak household consumption and business investment. In general, imports refer mainly to consumption, capital and intermediate products and any change in consumer and business sentiment has a considerable impact on the respective airports’ freight volumes and values.
Figure 7: Air imports by airport location
Jun-
96
Jun-
98
Jun-
00
Jun-
02
Jun-
04
Jun-
06
Jun-
08
Jun-
10
Jun-
12
Jun-
14
Jun-
16
Jun-
18
Jun-
96
Jun-
98
Jun-
00
Jun-
02
Jun-
04
Jun-
06
Jun-
08
Jun-
10
Jun-
12
Jun-
14
Jun-
16
Jun-
180
10,000
20,000
30,000
40,000
50,000
60,000
70,000
80,000
$M
Sydney Melbourne Brisbane Perth Other
0
100,000
200,000
300,000
400,000
500,000
600,000
700,000
Tonn
es
Source: IPA/BISOE based on ABS statistics
Australia’s four major international airports carry a diversified trade. Imports are a mix of consumer goods (e.g. electronics and jewellery) as well as inputs into manufacturing and industry. The four large international airports in Sydney, Melbourne, Brisbane and Perth make up 96 per cent of air-based import trade into Australia, with BISOE able to identify 84 per cent of trade by commodity due to confidential commodities not reported by the ABS.
Machinery and equipment generally make up a third of imports by mass and circa 44 per cent by value (Table 3). The pick up seen since FY2017-18 is related to the improved outlook for the non-mining tradeable sectors, as a return to confidence encourages businesses to invest in machinery and equipment and Intellectual Property Products (e.g. software and research and development expenditure). The remainder of imports are made up of a wide range of consumer products (e.g. clothing, cosmetics, food, etc.) as well as chemicals and metals. As a result, import goods by air are relatively consistent across the four main airports, with a notable exception being Perth.
Perth Airport features a higher share of imports, especially in terms of value, than its population base would otherwise suggest. This is mainly due to the extensive precious metals trade in the region, which has a very high value per tonne. Precious metals and stones (gold, silver, diamonds, etc.) typically make up a smaller share by weight but are almost exclusively sent by air (to/from Perth) due to their low mass and high value.
Based on Office of Chief Economist (OCE) data, Australia exports more gold than it produces. Thus, a large portion of imports are used for local refining and re-export purposes. The OCE however, expects these imports to decline over the next two years.
Airfreight imports originate from a wide variety of trading partners, notably China, the US, New Zealand and Europe.
AUSTRALIA’S AIRFREIGHT BY DIRECTION

International Airfreight Indicator 2019 Infrastructure Partnerships Australia12
Forecasts
Forecasts show an increase of 6.2 per cent of imports by value and 4.7 per cent by volume in FY2018-19. It is expected that machinary and equipment will continue defining the outlook over the coming quarters across the four major airports. Strong growth in business investment (14 per cent) due to increasing capacity constraints has been a key driver of growth in machinery and equipment investment across Australia.
As with other non-food consumer goods, strong growth in imports has been driven by a rising consumption base (e.g. growth in the population as well as higher consumption per capita due to growth in wealth). The largest decrease in FY2018-19 is expected in chemical and pharmaceutical products – circa 11 per cent.
Table 3: Air imports by commodity group
Sorted by Section by Value
2017-18
% change 10-year trend
2007-08 to 2017-182017-18 2018-19
$ million tonnes $ million tonnes $ million tonnes $ million tonnes
Import 66,418 582,168 3.3% 9.5% 6.2% 4.7%
XVI Machinery and mechanical appliances; electrical equipment; parts thereof; sound recorders and reproducers, television image and sound recorders and reproducers, and parts and accessories of such articles
29,134 149,027 10.9% 10.7% 14.2% 14.3%
XI Textiles and textile articles 1,920 44,300 11.9% 7.3% 1.1% 1.1%
VI Products of the chemical or allied industries 9,659 43,222 -1.0% 9.5% -11.4% -11.5%
II Vegetable products 389 37,229 2.7% -5.2% -0.2% -0.2%
XV Base metals and articles of base metal 1,036 27,209 13.6% 17.9% 4.8% 4.9%
XVIII Optical, photographic, cinematographic, measuring, checking, precision, medical or surgical instruments and apparatus; clocks and watches; musical instruments; parts and accessories thereof
9,283 26,687 8.5% 14.0% 7.5% 7.5%
VII Plastics and articles thereof; rubber and articles thereof 616 24,163 12.3% 12.1% 4.8% 4.9%
XVII Vehicles, aircraft, vessels and associated transport equipment 2,338 16,250 -30.4% 10.3% -1.6% -1.6%
I Live animals; animal products 331 14,863 4.6% -0.7% 0.3% 0.4%
IV Prepared foodstuffs; beverages, spirits and vinegar; tobacco and manufactured tobacco substitutes
222 14,817 34.0% 44.9% 2.8% 2.8%
XX Miscellaneous manufactured articles 701 14,679 2.7% 1.3% -4.8% -4.8%
X Pulp of wood or of o ther cellulosic material, recovered (waste and scrap) paper and paperb oard, and articles thereof
383 14,329 11.2% 1.5% 1.2% 1.3%
VIII Raw hides and skins, leather, furskins and articles thereof; saddlery and harness, travel goods, handbags and similar containers; articles of animal gut (other than silk-worm gut)
738 6,546 12.0% 2.7% 14.5% 14.8%
XIII Articles of stone, plaster, cement, asbestos, mica or similar materials, ceramic products, glass and glassware
157 5,472 10.0% 13.8% 1.3% 1.6%
XII Footwear, headgear, umbrellas, sun umbrellas, walking-sticks, seat-sticks, whips, riding-crops, and parts thereof; prepared feathers and articles made therewith; artificial flowers; articles of human hair
343 5,042 6.0% -3.3% 5.7% 5.6%
XIV Natural or cultured pearls, precious or semi-precious stones, precious metals, metals clad with precious metal, and articles thereof; imitation jewellery; coin
8,837 1,666 -8.8% -3.1% 3.7% 4.0%
IX Wood and articles of wood; wood charcoal; cork and articles of cork; manufactures of straw, of esparto or of other plaiting materials; basketware and wickerwork
20 971 23.9% 1.2% 11.8% 11.5%
V Mineral products 9 959 13.5% 7.4% 2.4% 2.6%
III Animal or vegetable fats and oils and their cleavage products; prepared edible fats; animal or vegetable waxes
14 696 24.9% 10.0% 2.6% 2.1%
XIX Arms and ammunition; parts and accessories thereof 133 451 -49.7% -30.2% -5.7% -5.4%
XXI Works of art, collectors' pieces and antiques 151 268 -5.4% -7.7% 0.6% 0.4%
Unknown 12.0% 0.0%
Source: IPA/BISOE based on ABS statistics

International Airfreight Indicator 2019 Infrastructure Partnerships Australia 13
EXPORTSWhile imports tend to reflect local economic cycles and changes in the exchange rate, exports are exposed to changes in production for key commodities, which in turn reflect fluctuations in commodity prices, international demand and/or weather events. Moreover, airfreight is generally related to the production activity in an airport’s catchment. In general, exports are more precarious than imports since they are sensitive to both internal and external events, as reflected in Figure 8.
More specifically, external macroeconomic shocks, such as the Asian Financial Crisis (1997), the dot com bubble (2001) and the GFC (2008) in conjunction with the subsequent abrupt declines in world commodity prices led to a slowdown of Australia’s airfreight exports through these years. Moreover, internal local events, like weather conditions – droughts in 2003 and 2006, floods in 2010 in combination with cyclones in early 2011 – further disrupted economic growth and in turn airfreight exports.
Figure 8: Air exports by airport location
Jun-
96
Jun-
98
Jun-
00
Jun-
02
Jun-
04
Jun-
06
Jun-
08
Jun-
10
Jun-
12
Jun-
14
Jun-
16
Jun-
18
Jun-
96
Jun-
98
Jun-
00
Jun-
02
Jun-
04
Jun-
06
Jun-
08
Jun-
10
Jun-
12
Jun-
14
Jun-
16
Jun-
18
Sydney Melbourne Brisbane Perth Other
0
5,000
10,000
15,000
20,000
25,000
30,000
35,000
40,000
45,000
50,000
$M
0
100,000
200,000
300,000
400,000
500,000
600,000
700,000
Tonn
es
Source: IPA/BISOE based on ABS statistics
In terms of volume, exports are driven by animal products, vegetable products and beverages, with Melbourne being historically strong (Table 4). Beverage air exports have increased almost tenfold between FY2013-14 and FY2017-18, with most of the growth being through Sydney and Melbourne airports, with Brisbane and Perth airports also experiencing a significant uplift. The prime destination in recent years has been Asia, especially China/Hong Kong.
In terms of value, exports are to a large extent driven by gold production in Australia. Since Western Australia produces the majority of gold, Perth Airport has a disproportionate share of exports. The OCE notes Australia produced 288 tonnes of gold in FY2016-17, making Australia the world’s second largest producer. Exports are forecast to grow over the next two years and peak at 354 tonnes in FY2019-20, 322 tonnes of which are produced locally.
The prime destinations for exports in recent years have been China/Hong Kong, the UK, and a number of other Asian economies.
The four international airports in Sydney, Melbourne, Brisbane and Perth make up 96 per cent of air-based exports in Australia, and BISOE is able to identify 82 per cent of trade by commodity nationally. We are unable to identify the remaining exports due to confidential commodities not being reported by the ABS.
While the relative share of cargo exports from these cities does not reflect their relative populations, there is one very notable exception: infant formula and related products. Over the past four years, exports of infant formula and related products have surged from being negligible to 18 per cent of airfreight exports by mass, most of which have been sourced directly from Sydney and Melbourne retailers, which have higher frequency services to mainland China.
Forecasts
Typically, volumes peak in the December quarter, ease back in March, and then increase in the June quarter. This last bounce back did not materialise in the latest quarter, which may reveal a structural decline, exposing airfreight trade in FY2018-19 to a potentially significant downside if the decline continues.

International Airfreight Indicator 2019 Infrastructure Partnerships Australia14
As such, forecasts show exports will ease to 1.6 per cent by value and 2.4 per cent by volume for FY2018-19. The largest increase is projected in textiles and animal products – circa seven per cent. Machinery and equipment will also experience an increase; however, a more moderate outlook is suggested, due to an expected flat exchange rate. The largest decrease for FY2018-19 is expected in vehicles and associated transport equipment – circa 19 per cent. Export declines are forecast to continue as the industry in Melbourne continues to experience the aftershocks of the closure of the domestic automotive manufacturing industry in late 2017.
Table 4: Air exports by commodity group
Sorted by Section by Value
2017-18
% change 10-year trend
2007-08 to 2017-182017-18 2018-19
$ million tonnes $ million tonnes $ million tonnes $ million tonnes
Export 42,442 568,679 4.7% 10.9% 1.6% 2.4%
I Live animals; animal products 2,662 165,726 14.7% 18.2% 6.9% 6.8%
IV Prepared foodstuffs; beverages, spirits and vinegar; tobacco and manufactured tobacco substitutes
1,905 105,105 12.7% 11.8% -0.5% -0.5%
II Vegetable products 413 92,079 2.4% 0.6% 1.6% 1.6%
VI Products of the chemical or allied industries 3,259 34,418 22.4% 49.1% -0.3% -0.3%
XVI Machinery and mechanical appliances; electrical equipment; parts thereof; sound recorders and reproducers, television image and sound recorders and reproducers, and parts and accessories of such articles
5,389 32,789 4.9% -1.9% 5.4% 5.5%
XV Base metals and articles of base metal 250 18,078 3.4% -9.6% 7.1% 5.5%
X Pulp of wood or of o ther cellulosic material, recovered (waste and scrap) paper and paperb oard, and articles thereof
248 15,644 15.0% 28.3% -5.6% -4.7%
XVIII Optical, photographic, cinematographic, measuring, checking, precision, medical or surgical instruments and apparatus; clocks and watches; musical instruments; parts and accessories thereof
3,454 8,019 6.3% 6.9% 1.5% 1.5%
XVII Vehicles, aircraft, vessels and associated transport equipment 1,750 7,025 19.3% 14.8% -18.8% -18.6%
VII Plastics and articles thereof; rubber and articles thereof 170 5,050 -5.1% -1.1% 2.1% 2.1%
XI Textiles and textile articles 244 4,775 11.6% 15.2% 7.4% 7.5%
XX Miscellaneous manufactured articles 274 2,892 -13.7% -11.0% -8.1% -8.5%
XII Footwear, headgear, umbrellas, sun umbrellas, walking-sticks, seat-sticks, whips, riding-crops, and parts thereof; prepared feathers and articles made therewith; artificial flowers; articles of human hair
74 1,884 36.0% 32.2% 5.8% 5.8%
VIII Raw hides and skins, leather, furskins and articles thereof; saddlery and harness, travel goods, handbags and similar containers; articles of animal gut (other than silk-worm gut)
129 1,839 7.5% 5.9% 2.5% 2.5%
XIV Natural or cultured pearls, precious or semi-precious stones, precious metals, metals clad with precious metal, and articles thereof; imitation jewellery; coin
21,175 994 0.9% 14.9% 2.3% 0.8%
XIII Articles of stone, plaster, cement, asbestos, mica or similar materials, ceramic products, glass and glassware
53 779 7.2% -18.7% -1.9% -2.2%
IX Wood and articles of wood; wood charcoal; cork and articles of cork; manufactures of straw, of esparto or of other plaiting materials; basketware and wickerwork
7 395 35.4% -19.3% 1.9% 2.2%
V Mineral products 3 286 -8.1% -86.1% 4.8% 5.0%
III Animal or vegetable fats and oils and their cleavage products; prepared edible fats; animal or vegetable waxes
13 259 -34.2% -22.1% 2.9% 3.2%
XXI Works of art, collectors' pieces and antiques 78 131 -8.7% -33.7% -2.2% -2.9%
XIX Arms and ammunition; parts and accessories thereof 33 65 -23.3% -18.6% -5.0% -6.2%
Unknown 70,449 9.5% 0.0%
Source: IPA/BISOE based on ABS statistics

International Airfreight Indicator 2019 Infrastructure Partnerships Australia 15
International Airfreight Indicator 2019 Infrastructure Partnerships Australia16
AIRFREIGHT BY AIRPORT
SYDNEY AIRPORT

International Airfreight Indicator 2019 Infrastructure Partnerships Australia 17
KEY FINDINGS
Sydney Airport represented circa 45 per cent of all freight imports and exports in FY2017-18 in both value and volume.
Sydney Airport
306K tonnesTONNE
Imports in FY2017-18 were 306 thousand tonnes, up by seven per cent compared to FY2016-17, worth $40 billion. Machinery and equipment is the dominant import category in both value and volume terms.
Exports in FY2017-18 totalled 225 thousand tonnes, up 10 per cent compared to FY2016-17, worth $13 billion. Machinery and equipment as well infant formula and other processed food products have been the primary source of growth in airborne exports.
225K tonnes
Forecast import volumes reflect broader economic conditions, and export growth forecasts show that primary rural products will drive growth over FY2018/19.
Rural products
45%

International Airfreight Indicator 2019 Infrastructure Partnerships Australia18
SYDNEY AIRPORT – IMPORTS
Table 5: Sydney Airport imports by value and volume
Sorted by Section by Value
2017-18
% change 10-year trend
2007-08 to 2017-182017-18 2018-19
$ million tonnes $ million tonnes $ million tonnes $ million tonnes
Import 39,619 305,922 4.3% 7.2% 6.3% 4.7%
XVI Machinery and mechanical appliances; electrical equipment; parts thereof; sound recorders and reproducers, television image and sound recorders and reproducers, and parts and accessories of such articles
19,567 73,198 3.3% 0.4%
VI Products of the chemical or allied industries 7,699 26,431 -0.7% 2.8%
XI Textiles and textile articles 889 19,211 9.6% 5.1%
II Vegetable products 176 17,579 1.8% -4.1%
XVIII Optical, photographic, cinematographic, measuring, checking, precision, medical or surgical instruments and apparatus; clocks and watches; musical instruments; parts and accessories thereof
6,013 15,925 -2.5% 5.1%
VII Plastics and articles thereof; rubber and articles thereof 258 8,614 7.5% -12.8%
IV Prepared foodstuffs; beverages, spirits and vinegar; tobacco and manufactured tobacco substitutes
120 8,172 3.1% 16.8%
XV Base metals and articles of base metal 328 7,940 17.8% 11.2%
X Pulp of wood or of o ther cellulosic material, recovered (waste and scrap) paper and paperb oard, and articles thereof
228 7,636 9.2% -2.6%
Other or unspecified 4,342 121,216
Source: IPA/BISOE based on ABS statistics
Sydney Airport is Australia’s main hub for freight with a relatively stable market share of international cargo. By volume, circa 60 per cent of imports that pass through Sydney Airport have a known commodity classification according to ABS statistics. Meanwhile, the value of the unknown commodities approaches $4 billion – only 11 per cent of the total imports by value through the airport.
In volume tonnes, of the known commodities imported into Sydney, 24 per cent are machinery and equipment, nine per cent chemicals/pharmaceuticals, six per cent textiles and five per cent vegetable products. In monetary values, of the known commodities imported into Sydney, 49 per cent are machinery and equipment, 19 per cent chemical/pharmaceuticals and 15 per cent optical, photographic and medical instruments.
In FY2017-18, Sydney Airport carried more than half of the imported trade by value – 60 per cent of the total of $66 billion in airfreight imports. The same holds true for volumes; Sydney Airport carried 52 per cent of the total 582,000 tonnes in airfreight imports. In FY2017-18, imports totalled 306,000 tonnes, up by seven per cent compared to FY2016-17, worth close to $40 billion (Table 5).
Since overseas imports directly into Sydney Airport make up more than half of air imports into Australia, Sydney Airport, relative to its population catchment, is overweight on most major commodity classes in terms of mass, with the notable exception of base metals and mineral products. Sydney Airport is underweight on precious metal imports, since the majority is directed to Perth for processing and re-export.

International Airfreight Indicator 2019 Infrastructure Partnerships Australia 19
SYDNEY AIRPORT – EXPORTS
Table 6: Sydney Airport exports by value and volume
Sorted by Section by Value
2017-18
% change 10-year trend
2007-08 to 2017-182017-18 2018-19
$ million tonnes $ million tonnes $ million tonnes $ million tonnes
Export 12,895 224,559 11.1% 10.2% 1.1% 1.0%
IV Prepared foodstuffs; beverages, spirits and vinegar; tobacco and manufactured tobacco substitutes
1,103 57,597 11.1% 10.2%
II Vegetable products 106 28,092 -6.1% 1.5%
I Live animals; animal products 327 21,374 14.3% 43.1%
VI Products of the chemical or allied industries 1,679 17,877 56.1% 36.7%
XVI Machinery and mechanical appliances; electrical equipment; parts thereof; sound recorders and reproducers, television image and sound recorders and reproducers, and parts and accessories of such articles
3,189 16,984 0.4% -3.7%
X Pulp of wood or of o ther cellulosic material, recovered (waste and scrap) paper and paperb oard, and articles thereof
176 12,232 26.2% 137.9%
XVIII Optical, photographic, cinematographic, measuring, checking, precision, medical or surgical instruments and apparatus; clocks and watches; musical instruments; parts and accessories thereof
2,400 5,215 2.2% -3.0%
XV Base metals and articles of base metal 88 3,804 -1.6% -78.6%
XVII Vehicles, aircraft, vessels and associated transport equipment 726 3,441 6.5% 50.0%
Other or unspecified 3,102 57,944
Source: IPA/BISOE based on ABS statistics
By volume, we can identify 74 per cent of exports from Sydney Airport with the remainder not having a known commodity classification, according to ABS statistics. Of the known commodities exported from Sydney, 26 per cent are prepared food products, 12 per cent vegetable products and nine per cent live animals and animal products. By value, 76 per cent have a known commodity classification. Of the known commodities exported from Sydney, 25 per cent are machinery and equipment, 19 per cent are optical, photographic and medical instruments and 13 per cent chemicals/pharmaceuticals.
In FY2017-18, Sydney Airport carried circa one third of the exported trade by value – 30 per cent of the total of $42 billion in airfreight exports. In tonnes, Sydney Airport carried circa 39 per cent of the total 568,000 tonnes in airfreight exports by mass. In FY2017-18, exports totalled 225,000 tonnes, up by 10 per cent compared to FY2016-17, worth $13 billion (Table 6).
Since overseas exports make up 39 per cent of the overall airborne exports from Australia, Sydney Airport is relatively overweight on most major commodity classes in terms of mass - with the notable exception being animal products. In terms of value, a similar result holds true, with the exception that Sydney Airport is underweight on precious metal, since most gold is exported from Western Australia.
Export growth is expected to be flat over FY2018-19, with a one per cent forecast increase for both value and volume. This slow growth forecast comes off the back of robust growth over recent years, driven by machinery and equipment (24 per cent of total value), high-value optical and medical instruments, as well as exports of infant formula and other processed food products to China. Growth in other export classes (e.g. rural products) will increasingly drive the outlook over the coming quarters.

International Airfreight Indicator 2019 Infrastructure Partnerships Australia20
AIRFREIGHT BY AIRPORT
MELBOURNE AIRPORT

International Airfreight Indicator 2019 Infrastructure Partnerships Australia 21
KEY FINDINGS
Melbourne Airport represented 28 per cent of all freight volume and 17 per cent of all freight value in FY2017-18.
Melbourne Airport
147K tonnes
Imports in FY2017-18 were 147 thousand tonnes, up by 11 per cent compared to FY2016-17, worth $12 billion. Machinery and equipment forms the largest category in both value and volume terms.
Exports in FY2017-18 totalled 179 thousand tonnes, up by 12 per cent compared to FY2016-17, worth circa $6 billion. Animal products dominate volumetric tonnes, while chemicals/pharmaceuticals, machinery and equipment, and animal products have been the primary source of growth value.
179K tonnes
Forecast import volumes reflect broader economic conditions and business investment, and exports growth reveals that primary rural products will drive growth over the coming quarters.
Rural products
TONNE
28%

International Airfreight Indicator 2019 Infrastructure Partnerships Australia22
MELBOURNE AIRPORT – IMPORTS
Table 7: Melbourne Airport imports by value and volume
Sorted by Section by Value
2017-18
% change 10-year trend
2007-08 to 2017-182017-18 2018-19
$ million tonnes $ million tonnes $ million tonnes $ million tonnes
Import 11,738 146,932 10.2% 11.3% 6.3% 4.3%
XVI Machinery and mechanical appliances; electrical equipment; parts thereof; sound recorders and reproducers, television image and sound recorders and reproducers, and parts and accessories of such articles
5,109 35,460 -0.6% 3.3%
XI Textiles and textile articles 696 16,611 11.7% 7.7%
VI Products of the chemical or allied industries 1,510 10,819 -3.1% 20.6%
II Vegetable products 126 10,159 -0.1% -9.4%
VII Plastics and articles thereof; rubber and articles thereof 174 7,477 7.5% 6.0%
XV Base metals and articles of base metal 256 7,426 4.6% 6.5%
XVIII Optical, photographic, cinematographic, measuring, checking, precision, medical or surgical instruments and apparatus; clocks and watches; musical instruments; parts and accessories thereof
1,838 6,378 13.0% -2.8%
XVII Vehicles, aircraft, vessels and associated transport equipment 509 6,241 -19.6% 4.4%
I Live animals; animal products 162 5,898 14.2% 6.4%
Other or unspecified 1,359 40,464
Source: IPA/BISOE based on ABS statistics
Melbourne Airport is Australia’s second busiest airport and the main hub for the south-eastern part of Australia, including southern NSW, Victoria and Tasmania. By volume, it is estimated that circa 73 per cent of imports that pass through Melbourne Airport have a known commodity classification according to ABS statistics. Meanwhile, the value of the unknown commodities is $1 billion, only 11 per cent of total imports.
In tonnes, of the known commodities imported into Melbourne Airport, 24 per cent are machinery and equipment, 11 per cent textiles, seven per cent chemicals/pharmaceuticals and seven per cent vegetable products. By value, of the known commodities imported into Melbourne, 44 per cent are machinery and equipment, 16 per cent are optical, photographic and medical instruments and 13 per cent are chemicals/pharmaceuticals.
In FY2017-18, Melbourne Airport carried 18 per cent of the total of $66 billion in airfreight imports into Australia. In tonnes, Melbourne Airport carried 25 per cent of the total 582 thousand tonnes in airfreight imports. In FY2017-18, imports totalled 147 thousand tonnes, up by 12 per cent compared to FY2016-17, worth $12 billion (Table 7).
Overseas imports directly into Melbourne make up under a quarter of air imports into Australia. As a result, compared to its population, Melbourne Airport is mildly underweight on some major commodity classes in terms of volume. This includes mineral products, chemicals/pharmaceuticals, as well as machinery and equipment. Conversely, Melbourne Airport is overweight on plastics, wood products and clothing. In value terms, there is a similar result, with the notable exception that Melbourne Airport is underweight on precious metal imports since the majority is re-exported from Perth.

International Airfreight Indicator 2019 Infrastructure Partnerships Australia 23
MELBOURNE AIRPORT – EXPORTS
Table 8: Melbourne Airport exports by value and volume
Sorted by Section by Value
2017-18
% change 10-year trend
2007-08 to 2017-182017-18 2018-19
$ million tonnes $ million tonnes $ million tonnes $ million tonnes
Export 5,661 178,519 5.0% 12.4% 1.0% 3.3%
I Live animals; animal products 1,005 72,596 17.2% 16.4%
IV Prepared foodstuffs; beverages, spirits and vinegar; tobacco and manufactured tobacco substitutes
542 31,084 14.9% 15.0%
II Vegetable products 168 28,200 14.7% 0.6%
VI Products of the chemical or allied industries 1,155 8,990 -7.5% 37.8%
XVI Machinery and mechanical appliances; electrical equipment; parts thereof; sound recorders and reproducers, television image and sound recorders and reproducers, and parts and accessories of such articles
1,087 7,974 1.6% -5.9%
XV Base metals and articles of base metal 82 4,799 6.5% 90.2%
X Pulp of wood or of o ther cellulosic material, recovered (waste and scrap) paper and paperb oard, and articles thereof
54 2,617 -8.4% -58.1%
XVII Vehicles, aircraft, vessels and associated transport equipment 430 2,080 12.2% -14.6%
XVIII Optical, photographic, cinematographic, measuring, checking, precision, medical or surgical instruments and apparatus; clocks and watches; musical instruments; parts and accessories thereof
498 1,555 10.9% 21.4%
Other or unspecified 641 18,625
Source: IPA/BISOE based on ABS statistics
By volume, it is estimated that 90 per cent of exports that pass through Melbourne Airport have a known commodity classification according to ABS statistics. The value of the unknown commodities is estimated at $641 million – 11 per cent of total exports.
In tonnes, of the known commodities exported from Melbourne Airport, 41 per cent are animal products, 17 per cent are processed food products and 16 are per cent vegetable products. 11 per cent do not have a known commodity classification. By value, of the known commodities exported from Melbourne Airport, 20 per cent are chemicals/pharmaceuticals, 19 per cent are machinery and equipment and 18 per cent are animal products.
In FY2017-18, Melbourne Airport carried 13 per cent of the total of $42.4 billion in airfreight exports. In tonnes, Melbourne Airport carried 31 per cent of the total 569 thousand tonnes in airfreight exports. This means, over FY2017-18, exports totalled 179 thousand tonnes, up by 12 per cent compared to FY2016-17, worth close to $6 billion (Table 8).
Overseas exports from Melbourne make up 31 per cent of overall airborne exports from Australia. As a result, relative to its population base, Melbourne Airport holds an expected share of exports in terms of mass. In value terms, a similar result holds, with the notable exception that Melbourne Airport is underweight on precision instruments and precious metal since gold is mainly exported from Western Australia.
Exports of infant formula and other processed food products to China have been the primary source of growth in airborne exports Australia wide, including Melbourne. It is assumed that this class of exports has peaked and will be flat over the near-term. However, there is considerable risk, especially on the downside due to possible trade restrictions. Growth in other export classes, such as primary rural products, will increasingly drive the outlook over the coming quarters. It is forecast that overall tonnage growth will ease, slowing to 3.3 per cent annual growth in volume and one per cent in value by in FY2018-19.

International Airfreight Indicator 2019 Infrastructure Partnerships Australia24
AIRFREIGHT BY AIRPORT
BRISBANE AIRPORT

International Airfreight Indicator 2019 Infrastructure Partnerships Australia 25
KEY FINDINGS
Brisbane Airport represented 12 per cent of all freight volume and seven per cent of all freight value in FY2017-18.
Brisbane Airport
61K tonnes
Imports in FY2017-18 totalled 61 thousand tonnes, up 12 per cent compared to FY2016-17, worth $5 billion. Machinery and equipment forms the largest category in both value and volume terms.
Exports in FY2017-18 totalled 78 thousand tonnes, up eight per cent compared to FY2016-17, worth circa $2 billion. Animal and vegetable products dominate the volume exported, while machinery and equipment, animal products and transport equipment have been the primary source of growth in value.
78K tonnes
Import volume forecasts reflect broader economic conditions and business business investment. Beef exports have been increasingly driving growth over recent quarters. However, impact from loss of stock from the recent floods will be felt after FY2018-19.
Beef exports
TONNE
12%

International Airfreight Indicator 2019 Infrastructure Partnerships Australia26
BRISBANE AIRPORT – IMPORTS
Table 9: Brisbane Airport imports by value and volume
Sorted by Section by Value
2017-18
% change 10-year trend
2007-08 to 2017-182017-18 2018-19
$ million tonnes $ million tonnes $ million tonnes $ million tonnes
Import 4,680 61,496 12.9% 11.9% 6.9% 5.2%
XVI Machinery and mechanical appliances; electrical equipment; parts thereof; sound recorders and reproducers, television image and sound recorders and reproducers, and parts and accessories of such articles
1,739 16,127 15.5% 14.3%
XI Textiles and textile articles 220 5,148 25.3% 15.1%
II Vegetable products 56 4,928 7.9% -4.7%
XV Base metals and articles of base metal 131 3,619 10.8% 11.2%
VI Products of the chemical or allied industries 222 3,243 -1.0% 5.6%
VII Plastics and articles thereof; rubber and articles thereof 78 3,182 -2.6% 9.8%
XVII Vehicles, aircraft, vessels and associated transport equipment 319 2,189 -2.8% 5.4%
XVIII Optical, photographic, cinematographic, measuring, checking, precision, medical or surgical instruments and apparatus; clocks and watches; musical instruments; parts and accessories thereof
747 2,038 31.4% 13.4%
XX Miscellaneous manufactured articles 69 1,408 7.4% -10.9%
Other or unspecified 1,100 19,613
Source: IPA/BISOE based on ABS statistics
Brisbane is one of the four main airports in Australia. By volume, it is estimated that 68 per cent of imports that pass through Brisbane Airport have a known commodity classification according to ABS statistics. The worth of the unknown commodities is $1 billion – 23 per cent of the total imports by value.
By mass, of the known commodities imported into Brisbane, 26 per cent are machinery and equipment, eight per cent textiles, eight per cent vegetable products and five per cent base metals. In value terms, of the known commodities imported into Brisbane Airport, 37 per cent are machinery and equipment and 15 per cent are optical, photographic and medical instruments.
In FY2017-18, Brisbane Airport carried seven per cent of the total of $66.4 billion in airfreight imports into Australia. In tonnes, Brisbane Airport carried 11 per cent of the total 582 thousand tonnes in airfreight imported. In FY2017-18, imports totalled 61 thousand tonnes, up by 12 per cent compared to FY2016-17, worth close to $5 billion (Table 9).
Overseas imports directly into Brisbane make up 11 per cent of air imports into Australia. As a result, compared to either its population or total international passenger visits, Brisbane Airport is underweight on all major commodity classes in terms of value and volume.

International Airfreight Indicator 2019 Infrastructure Partnerships Australia 27
BRISBANE AIRPORT – EXPORTS
Table 10: Brisbane Airport exports by value and volume
Sorted by Section by Value
2017-18
% change 10-year trend
2007-08 to 2017-182017-18 2018-19
$ million tonnes $ million tonnes $ million tonnes $ million tonnes
Export 2,489 78,316 20.3% 9.7% -0.5% 2.9%
I Live animals; animal products 439 25,742 12.6% 24.0%
II Vegetable products 86 24,128 -4.0% 0.3%
IV Prepared foodstuffs; beverages, spirits and vinegar; tobacco and manufactured tobacco substitutes
117 8,775 23.2% 14.6%
XVI Machinery and mechanical appliances; electrical equipment; parts thereof; sound recorders and reproducers, television image and sound recorders and reproducers, and parts and accessories of such articles
557 3,562 2.8% 6.4%
VI Products of the chemical or allied industries 220 3,280 46.9% 79.7%
XV Base metals and articles of base metal 36 993 17.0% -29.0%
XVII Vehicles, aircraft, vessels and associated transport equipment 417 761 79.3% 13.7%
VII Plastics and articles thereof; rubber and articles thereof 23 737 7.0% 57.5%
XVIII Optical, photographic, cinematographic, measuring, checking, precision, medical or surgical instruments and apparatus; clocks and watches; musical instruments; parts and accessories thereof
303 609 15.9% -8.6%
Other or unspecified 291 9,728
Source: IPA/BISOE based on ABS statistics
In terms of both value and volume, it is estimated 12 per cent of exports that passed through Brisbane Airport do not have a known commodity classification according to ABS statistics. In tonnes, of the known commodities exported from Brisbane, 33 per cent are animal products, 31 per cent vegetable products and 11 per cent prepared food products. By value, of the known commodities exported from Brisbane Airport, 22 per cent are machinery and equipment, 18 per cent are animal products, and 17 per cent transport equipment.
In FY2017-18, Brisbane Airport carried six per cent of the total $42.4 billion in airfreight exports. In tonnes, Brisbane Airport carried 14 per cent of the total 569 thousand tonnes in airfreight exports. In FY2017-18, exports totalled 78 thousand tonnes, up by eight per cent compared to FY2016-17, worth approximately $2.5 billion (Table 10).
As noted, overseas exports from Brisbane make up 14 per cent and six per cent of overall airborne exports in value and volume from Australia. As a result, relative to its population and total international passenger visits, Brisbane Airport is relatively underweight on all major commodity classes in terms of value and volume.
As with the other capital Australian airports, exports of infant formula and other processed food to China have been a key source of growth in airborne exports. Animal product exports, primarily beef, have also contributed significantly in the Airport’s growth in recent years. However, the impact from loss of beef stocks from the recent floods will be felt after FY2018-19, and a flat outlook for processed food will see overall tonnage growth ease to three per cent while value growth is forecast to be negative 0.5 per cent in FY2018-19.

International Airfreight Indicator 2019 Infrastructure Partnerships Australia28
AIRFREIGHT BY AIRPORT
PERTH AIRPORT
International Airfreight Indicator 2019 Infrastructure Partnerships Australia 29
KEY FINDINGS
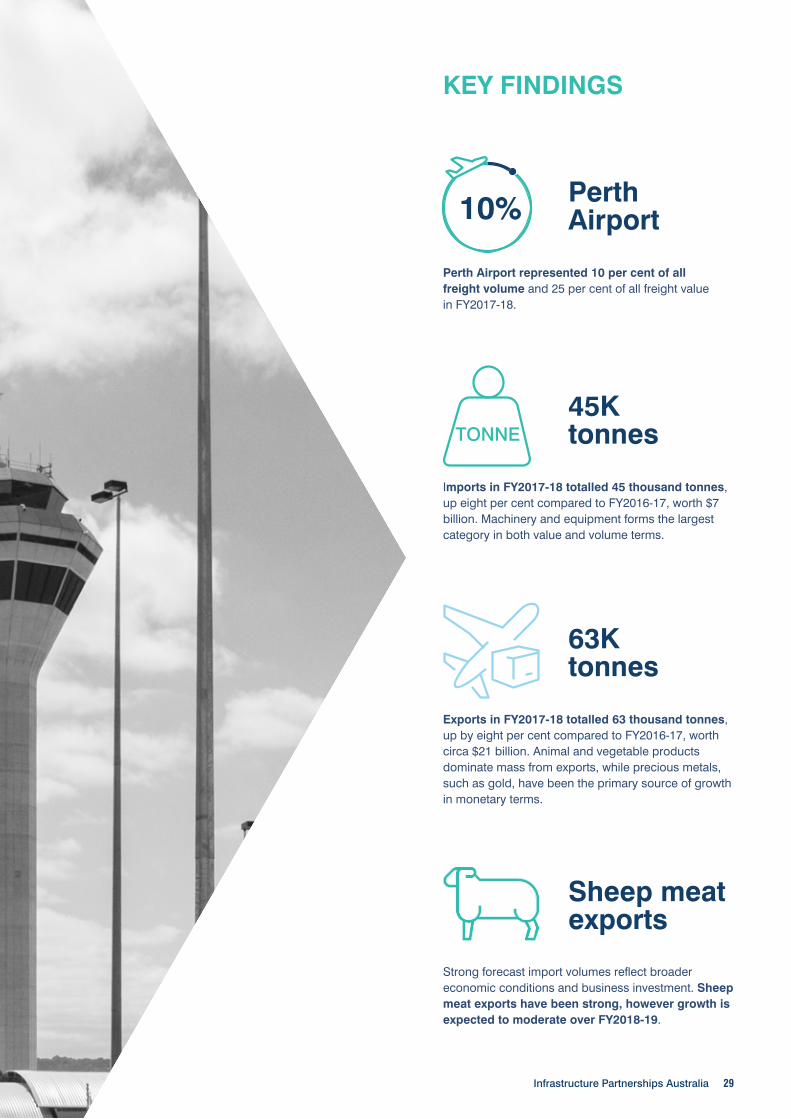
Perth Airport represented 10 per cent of all freight volume and 25 per cent of all freight value in FY2017-18.
Perth Airport
45K tonnes
Imports in FY2017-18 totalled 45 thousand tonnes, up eight per cent compared to FY2016-17, worth $7 billion. Machinery and equipment forms the largest category in both value and volume terms.
Exports in FY2017-18 totalled 63 thousand tonnes, up by eight per cent compared to FY2016-17, worth circa $21 billion. Animal and vegetable products dominate mass from exports, while precious metals, such as gold, have been the primary source of growth in monetary terms.
63K tonnes
Strong forecast import volumes reflect broader economic conditions and business investment. Sheep meat exports have been strong, however growth is expected to moderate over FY2018-19.
Sheep meat exports
TONNE
10%

International Airfreight Indicator 2019 Infrastructure Partnerships Australia30
PERTH AIRPORT – IMPORTS
Table 11: Perth Airport imports by value and volume
Sorted by Section by Value
2017-18
% change 10-year trend
2007-08 to 2017-182017-18 2018-19
$ million tonnes $ million tonnes $ million tonnes $ million tonnes
Import 7,008 45,242 -5.2% 7.6% 5.2% 5.4%
XVI Machinery and mechanical appliances; electrical equipment; parts thereof; sound recorders and reproducers, television image and sound recorders and reproducers, and parts and accessories of such articles
1,347 13,051 19.1% 8.6%
XV Base metals and articles of base metal 173 4,689 29.3% 46.9%
II Vegetable products 26 3,912 4.5% -4.6%
VII Plastics and articles thereof; rubber and articles thereof 52 1,801 13.3% 24.4%
XI Textiles and textile articles 71 1,784 0.7% -5.8%
XVIII Optical, photographic, cinematographic, measuring, checking, precision, medical or surgical instruments and apparatus; clocks and watches; musical instruments; parts and accessories thereof
364 1,292 -6.7% 22.6%
VI Products of the chemical or allied industries 127 1,197 7.6% 47.4%
XVII Vehicles, aircraft, vessels and associated transport equipment 172 1,003 -27.6% 18.1%
XX Miscellaneous manufactured articles 39 919 -10.1% -18.0%
Other or unspecified 4,638 15,595
Source: IPA/BISOE based on ABS statistics
Perth Airport is the last airport covered in this report and it is characterised by high-value, albeit low volume commodities. By volume, it is estimated 68 per cent of imports that pass through Perth Airport have a known commodity classification according to ABS statistics. Yet, it is noteworthy that the value of the unknown commodities approached $4.6 billion – 66 per cent of the total imports by value.
Of the known commodities imported into Perth, by volume 29 per cent are machinery and equipment, 10 per cent base metals and nine per cent vegetable products. In monetary terms, of the known commodities imported into Perth Airport, 19 per cent are machinery and equipment and five per cent are chemicals/pharmaceuticals.
In FY2017-18, Perth Airport carried 11 per cent of the total of $66.4 billion in airfreight imports into Australia. In tonnes, Perth Airport carried seven per cent of the total 582 thousand tonnes in airfreight imports by mass. In FY2017-18, imports totalled 45 thousand tonnes, up by eight per cent compared to FY2016-17, worth at least $7 billion (Table 11).
Overseas imports directly into Perth are relatively small in comparison to Sydney (306 thousand tonnes) and Melbourne (147 thousand tonnes). As a result, Perth Airport is relatively underweight on all major commodity classes in terms of mass. In value terms, a similar result holds, with the notable exception that Perth Airport is overweight on precious metal imports, primarily gold, which is imported for further processing and re-export.

International Airfreight Indicator 2019 Infrastructure Partnerships Australia 31
PERTH AIRPORT – EXPORTS
Table 12: Perth Airport exports by value and volume
Sorted by Section by Value
2017-18
% change 10-year trend
2007-08 to 2017-182017-18 2018-19
$ million tonnes $ million tonnes $ million tonnes $ million tonnes
Export 20,681 63,391 -0.5% 7.6% 2.3% 4.1%
I Live animals; animal products 701 33,593 16.1% 10.7%
II Vegetable products 46 8,901 1.0% 3.8%
XV Base metals and articles of base metal 36 8,317 10.3% 10.0%
IV Prepared foodstuffs; beverages, spirits and vinegar; tobacco and manufactured tobacco substitutes
97 4,896 7.9% 0.6%
XVI Machinery and mechanical appliances; electrical equipment; parts thereof; sound recorders and reproducers, television image and sound recorders and reproducers, and parts and accessories of such articles
369 3,242 6.7% -4.9%
VI Products of the chemical or allied industries 147 2,937 17.6% 338.1%
XIV Natural or cultured pearls, precious or semi-precious stones, precious metals, metals clad with precious metal, and articles thereof; imitation jewellery; coin
18,853 614 -0.2% 3.3%
XVII Vehicles, aircraft, vessels and associated transport equipment 82 409 31.5% 34.6%
XVIII Optical, photographic, cinematographic, measuring, checking, precision, medical or surgical instruments and apparatus; clocks and watches; musical instruments; parts and accessories thereof
175 388 71.2% 42.5%
Other or unspecified 174 93
Source: IPA/BISOE based on ABS statistics
In terms of both value and volume terms, it is estimated that nearly 100 per cent of exports that leave from Perth Airport have a known commodity classification according to ABS statistics. In volumetric tonnes, of the known commodities exported from Perth, 53 per cent are animal and animal products, 14 per cent vegetable products and 13 per cent base metal products. In monetary values, of the known commodities exported from Perth Airport, 91 per cent are precious metals.
In FY2017-18, Perth Airport carried 49 per cent of the total of $42.4 billion in airfreight exports by value. In tonnes, Perth Airport carried 11 per cent of the total 569,000 tonnes in airfreight exports. In FY2017-18, exports totalled 63,000 tonnes, up by seven per cent compared to FY2016-17, worth approximately $21 billion (Table 12).
Overseas exports by mass from Perth are relatively small compared to all other main airports. However, relative to its population base, Perth Airport holds an expected share of exports in terms of mass. Notably, Perth Airport is relatively overweight on animal products, precious metals and base metal products. In value terms, Perth Airport is overweight on precious metal imports, since gold is mainly exported from Western Australia.
Exports of infant formula and other processed food products to China have been the primary source of growth in airborne exports Australia wide. For Perth, however, growth in export tonnage has largely stemmed from a rapid increase in sheep meat exports, stemming from a recovery in meat production in Western Australia. However, as the outlook for sheep products is more moderate, forecasts show strong deceleration in growth over FY2018-19. The overall tonnage growth is forecast to ease to four per cent and increase to two per cent in value terms across FY2018-19.

International Airfreight Indicator 2019 Infrastructure Partnerships Australia32
ABBREVIATIONSABS Australian Bureau of StatisticsAUD Australian DollarBISOE BIS Oxford EconomicsBITRE Bureau of Infrastructure, Transport and Regional EconomicsFY Financial Year HS Harmonized SystemOCE Office of the Chief EconomistUSD United States Dollar
APPENDIX
WHAT IS MEASUREDThe primary source of data used for this edition is unpublished import and export statistics from the Australian Bureau of Statistics (ABS)2, which detail commodity movements by air, direction of trade (imports and exports), units of trade (value and volume) and commodity definition from FY1996-97 to FY2017-18.
International trade in and out of Australia is recorded using what is known as the Harmonized System3 (HS) for the classification of products. At the international level, the HS for classifying goods is a six-digit code system.4 The HS comprises approximately 5,300 article/product descriptions that appear as headings and subheadings, arranged in 99 chapters, grouped in 21 Sections.
The analysis used focuses on the mass tonnes and Free on Board5 (FOB) values (indexed to CPI as of June 20186) reported by the ABS by airport by Section, describing what has been occurring across the main four airports and commodities, with a focus on broad trends, recent changes, and a one-year outlook.
The forecasts used in the report rely upon a mix of commodity projections by respected government and industry bodies, and BISOE’ in-house projections of the underlying drivers of trade (i.e. consumption and production), airport and mode choice, and seasonality of the trade flows.
ABS reported airfreight movements are subject to confidentiality of import and export commodities, either at the commodity level and/or the port level. As such, the reported value or volume measures relying upon these statistics will tend to be underestimated. Furthermore, as the list of commodities is subject to confidentiality change over time7, shifts in the value and volume over time may be subject to changes in the confidentiality list. In turn, any percentage changes reported in the current report only refer to commodities that have not been moved on or off the list between July 2016 and June 20188.
2 Some of the data published by the ABS is subject to confidentiality, which may mean that the data is not published at the commodity level (such as mineral sands) or not available at the port level (such as sugar exports).
3 The HS is an hierarchical classification and was adopted by the World Customs Organization (WCO) in June 1983 and it entered into force on 1 January 1988. Australia began using the HS on that date as the basis for the AHECC and the Customs Tariff and for the compilation and dissemination of international merchandise trade statistics. The HS is used by over 200 countries or economies as the basis for their Customs Tariffs and for their international merchandise trade statistics. Approximately 98% of world merchandise trade is classified in terms of the HS.
4 The six digits can be broken down into three parts. The first two digits (HS-2) identify the chapter the goods are classified in, e.g. 09 = Coffee, Tea, Maté and Spices. The next two digits (HS-4) identify groupings within that chapter, e.g. 09.02 = Tea, whether or not flavoured. The next two digits (HS-6) are even more specific.
5 FOB values include the cost of delivering the goods to the nearest port is included but the buyer is responsible for the shipping and all other fees associated with getting the goods to the final destination.
6 The FOB values will be deflated with chain volume indices in future editions to capture the full fluctuations in the trade values.7 i.e. LNG imports were not reported in April 2018, lupin exports are now subject to a six month delay in reported volumes and barley exports are
now reported by port from April 2018 for the first time since November 1999 – for more details see ABS catalogue number 5372.0.55.001.8 BISOE has excluded the export of Aviation turbine fuel from this analysis, which is fuel engaged in the transport of passengers or goods between
Australia and other countries. This represents about three per cent by value of exports recorded by the ABS, but over 70 per cent by volume.

International Airfreight Indicator 2019 Infrastructure Partnerships Australia 33
The report covers trade by Section according to the Harmonised Commodity Description and Coding System (HS), which is the organisation of trade at the lowest level of granularity. Each Section is detailed below:
I. Live Animals; Animal ProductsII. Vegetable ProductsIII. Animal or Vegetable Fats and Oils and Their Cleavage Products; Prepared Edible Fats; Animal or Vegetable WaxesIV. Prepared Foodstuffs; Beverages, Spirits and Vinegar; Tobacco and Manufactured Tobacco SubstitutesV. Mineral ProductsVI. Products of the Chemical or Allied IndustriesVII. Plastics and Articles Thereof; Rubber and Articles ThereofVIII. Raw Hides and Skins, Leather, Furskins and Articles Thereof; Saddlery and Harness; Travel Goods, Handbags and
Similar Containers; Articles of Animal Gut (Other Than Silkworm Gut)IX. Wood and Articles of Wood; Wood Charcoal; Cork and Articles of Cork; Manufactures of Straw, of Esparto or of Other
Plaiting Materials; Basketware and WickerworkX. Pulp of Wood or of Other Fibrous Cellulosic Material; Recovered (Waste and Scrap) Paper or Paperboard; Paper and
Paperboard and Articles ThereofXI. Textiles and Textile ArticlesXII. Footwear, Headgear, Umbrellas, Sun Umbrellas, Walking-Sticks, Seat-Sticks, Whips, Riding-Crops and Parts Thereof;
Prepared Feathers and Articles Made Therewith; Artificial Flowers; Articles of Human HairXIII. Articles of Stone, Plaster, Cement, Asbestos, Mica or Similar Materials; Ceramic Products; Glass and GlasswareXIV. Natural or Cultured Pearls, Precious or Semi-Precious Stones, Precious Metals, Metals Clad with Precious Metal, and
Articles Thereof; Imitation Jewellery; CoinXV. Base Metals and Articles of Base MetalXVI. Machinery and Mechanical Appliances; Electrical Equipment; Parts Thereof; Sound Recorders and Reproducers,
Television Image and Sound Recorders and Reproducers, and Parts and Accessories of Such ArticlesXVII. Vehicles, Aircraft, Vessels and Associated Transport EquipmentXVIII. Optical, Photographic, Cinematographic, Measuring, Checking, Precision, Medical or Surgical Instruments and
Apparatus; Clocks and Watches; Musical Instruments; Parts and Accessories ThereofXIX. Arms and Ammunition; Parts and Accessories ThereofXX. Miscellaneous Manufactured ArticlesXXI. Works of Art, Collectors’ Pieces and Antiques
The following table describes the data used for the present report as provided by ABS statistics.
Table 13: Data Description
Dimensions of airfreight data Description
Imports
Value of goods free on board (FOB)
Gross weight of goods the shipping weight of goods (measured in kilograms) excluding the weight of shipping containers.
Overseas country country of origin and country of port of loading.
Overseas airport port of loading
Australian state state of discharge and state of final destination
Australian airport port of discharge
Exports
Value of goods free on board (FOB)
Gross weight of goods the shipping weight of goods (measured in kilograms) excluding the weight of shipping containers
Overseas country country of final destination and country of port of discharge
Overseas airport port of discharge
Australian state state of origin and state of loading
Australian airport port of loading
Source: IPA/BISOE based on ABS Statistics

Infrastructure Partnerships Australia Suite 3.03, Level 3, 95 Pitt Street Sydney NSW 2000 PO Box R 1771 Royal Exchange, NSW 1225 infrastructure.org.au