Embed Size (px)
Citation preview
0
2019 Interim Results1 August 2019
THIS PRESENTATION IS NOT FOR RELEASE, PUBLICATION OR DISTRIBUTION, IN WHOLE OR IN PART, IN OR INTO THE UNITED STATES OF AMERICA, ITS TERRITORIES OR POSSESSIONS, OR TO ANY RESIDENT THEREOF OR ANY OTHER JURISDICTION WHERE SUCH DISTRIBUTION WOULD BE UNLAWFUL OR TO ANY OTHER PERSON.
This presentation (the “Presentation”) is being furnished to each recipient in connection with ConvaTec Group Plc (“ConvaTec” and, together with its subsidiaries, the “Group”) and has been prepared from publicly available information. For the purposes of this notice, “Presentation” means this document, its contents or any part of it, any oral presentation, any question or answer session and any written or oral material discussed or distributed before, during or after the Presentation meeting. This information, which does not purport to be comprehensive, has not been verified by or on behalf of the Group.The information, statements and opinions contained in this Presentation do not constitute an offer to sell or a solicitation of an offer to buy any securities, and are not for publication or distribution in, the US or to persons in the US (within the meaning of Regulation S under the US Securities Act of 1933, as amended (the “Securities Act”)), Canada, Japan, Australia or any other jurisdiction where such distribution or offer is unlawful. Any securities referred to in this Presentation and herein have not been, and will not be, registered under the Securities Act, and may not be offered or sold in the United States absent registration under the Securities Act except to qualified institutional buyers (“QIBs”) as defined in Rule 144A under the Securities Act (“Rule 144A”) or pursuant to another exemption from, or in transactions not subject to, the registration requirements of the Securities Act. Subject to certain limited exceptions, neither this Presentation nor any copies of it may be taken, transmitted or distributed, directly or indirectly, into the US, its territories or possessions. The distribution of this Presentation in other jurisdictions may be restricted by law and persons into whose possession this Presentation comes should inform themselves about, and observe, any such restrictions. Any failure to comply with the foregoing restrictions may constitute a violation of securities laws.This Presentation does not constitute an offer or invitation for the sale or purchase of securities or any businesses or assets described in it, nor should any recipients construe the Presentation as legal, tax, regulatory, or financial or accounting advice and are urged to consult with their own advisers in relation to such matters. Nothing herein shall be taken as constituting investment advice and this Presentation should not be construed as a prospectus or offering document and investors should not subscribe for or purchase any securities on the basis of this Presentation and it is not intended to provide, and must not be taken as, the basis of any decision and should not be considered as a recommendation to acquire any securities of the Group. The recipient must make its own independent assessment and such investigations as it deems necessary.This Presentation includes statements that are, or may be deemed to be, “forward looking statements”. These forward-looking statements involve known and unknown risks and uncertainties, many of which are beyond the Group’s control. “Forward-looking statements” are sometimes identified by the use of forward-looking terminology, including the terms “believes”, “estimates”, “aims” “anticipates”, “expects”, “intends”, “plans”, “predicts”, “may”, “will”, “could”, “shall”, “risk”, “targets”, forecasts”, “should”, “guidance”, “continues”, “assumes” or “positioned” or, in each case, their negative or other variations or comparable terminology. These forward-looking statements include all matters that are not historical facts. They appear in a number of places and include, but are not limited to, statements regarding the Group’s intentions, beliefs or current expectations concerning, amongst other things, results of operations, financial condition, liquidity, prospects, growth, strategies and dividend policy of the Group and the industry in which it operates.By their nature, forward-looking statements involve risks and uncertainties because they relate to events and depend on circumstances that may or may not occur in the future. These statements are necessarily based upon a number of estimates and assumptions that, while considered reasonable by the Company, are inherently subject to significant business, economic and competitive uncertainties and contingencies. As such, no assurance can be given that such future results, including guidance provided by the Group, will be achieved; actual events or results may differ materially as a result of risks and uncertainties facing the Group. Such risks and uncertainties could cause actual results to vary materially from the future results indicated, expressed, or implied in such forward-looking statements. Forward-looking statements are not guarantees of future performance and the actual results of operations, financial condition and liquidity, and the development of the industry in which the Group operates, may differ materially from those made in or suggested by the forward-looking statements set out in this Presentation. Past performance of the Group cannot be relied on as a guide to future performance. Forward-looking statements speak only as at the date of this Presentation and the Company and its directors, officers, employees, agents, affiliates and advisers expressly disclaim any obligations or undertaking to release any update of, or revisions to, any forward-looking statements in this Presentation.To the extent available, the industry and market data contained in this Presentation has come from third party sources. Third party industry publications, studies and surveys generally state that the data contained therein have been obtained from sources believed to be reliable, but that there is no guarantee of the accuracy or completeness of such data. In addition, certain of the industry and market data contained in this Presentation come from the Company's own internal research and estimates based on the knowledge and experience of the Company's management in the market in which the Company operates. While the Company believes that such research and estimates are reasonable and reliable, they, and their underlying methodology and assumptions, have not been verified by any independent source for accuracy or completeness and are subject to change without notice. Accordingly, undue reliance should not be placed on any of the industry or market data contained in this Presentation.Unless otherwise stated all stated financial metrics in this presentation are adjusted; for a full definition of the adjustments made please the slide ‘Reconciliation: 2019 adjustments’ in the Appendix.
Disclaimer

Hosts & agenda
Rick AndersonExecutive Chairman
Frank SchulkesChief Financial Officer
David ShepherdPresident AWC
1. Introduction – Rick Anderson
2. Financial and operational review – Frank Schulkes
3. Transformation update – Rick Anderson
4. US Wound update – David Shepherd
5. Summary and close – Rick Anderson
6. Q&A2

1. IntroductionRick Anderson
Executive Chairman
Interim Results 2019 – Key Points
• Group organic revenue in H1 flat1, +1.0% excluding the one-off rebate provision2
• Progress in Q2: Group organic growth 2.1%1 with growth across all franchises
• Transformation Initiative on track:
― Annual gross benefit of $130 million – $150 million in 2021― $14 million cost in first half
• Adjusted3 H1 EBIT margin 18.6%
• Interim dividend of 1.717 cents maintained
• Leverage 2.6 times Net Debt/EBITDA4, continued good cash generation: 89.8%5 (2018: 75.2%5)
• Guidance for the full year maintained
4
1. Organic growth presents period over period growth at constant exchange rates (“CER”), excluding M&A activities2. One-off provision of $8.9 million taken in Q1 to revise the estimate of the distributor rebates accrual 3. Certain financial measures in this document, including adjusted results above, are not prepared in accordance with International Financial Reporting Standards
("IFRS"). All adjusted measures are reconciled to the most directly comparable measure prepared in accordance with IFRS in the Non-IFRS Financial Information 4. Last 12 months adjusted EBITDA of $458m5. Cash conversion
2. Financial and operational review
Frank Schulkes
Chief Financial Officer
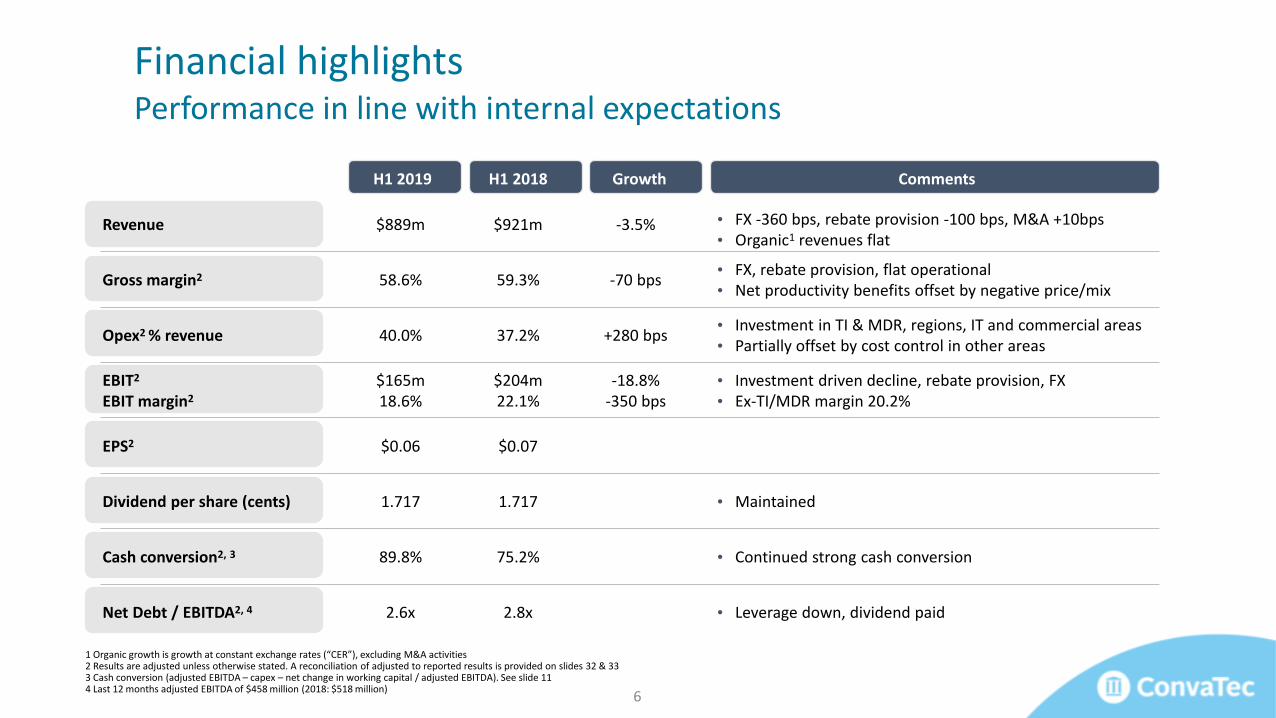
H1 2019 H1 2018 Growth Comments
Revenue $889m $921m -3.5% • FX -360 bps, rebate provision -100 bps, M&A +10bps • Organic1 revenues flat
Gross margin2 58.6% 59.3% -70 bps• FX, rebate provision, flat operational• Net productivity benefits offset by negative price/mix
Opex2 % revenue 40.0% 37.2% +280 bps• Investment in TI & MDR, regions, IT and commercial areas• Partially offset by cost control in other areas
EBIT2
EBIT margin2
$165m18.6%
$204m22.1%
-18.8%-350 bps
• Investment driven decline, rebate provision, FX• Ex-TI/MDR margin 20.2%
EPS2 $0.06 $0.07
Dividend per share (cents) 1.717 1.717 • Maintained
Cash conversion2, 3 89.8% 75.2% • Continued strong cash conversion
Net Debt / EBITDA2, 4 2.6x 2.8x • Leverage down, dividend paid
1 Organic growth is growth at constant exchange rates (“CER”), excluding M&A activities2 Results are adjusted unless otherwise stated. A reconciliation of adjusted to reported results is provided on slides 32 & 333 Cash conversion (adjusted EBITDA – capex – net change in working capital / adjusted EBITDA). See slide 11 4 Last 12 months adjusted EBITDA of $458 million (2018: $518 million)
Financial highlightsPerformance in line with internal expectations
6
921.3
888.9
2018 AWC OC CCC ID Rebateprovision
M&A FX 2019
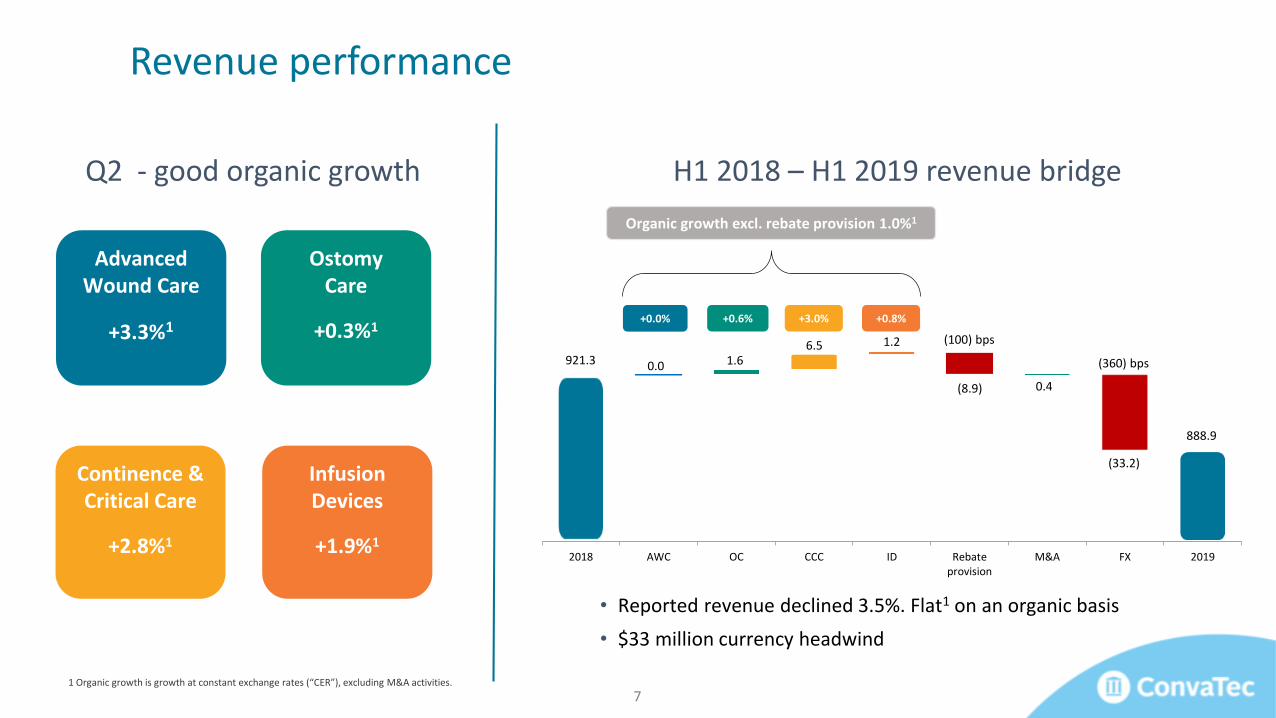
Organic growth excl. rebate provision 1.0%1
+0.0% +0.6% +3.0% +0.8%
1 Organic growth is growth at constant exchange rates (“CER”), excluding M&A activities.
H1 2018 – H1 2019 revenue bridge
• Reported revenue declined 3.5%. Flat1 on an organic basis
• $33 million currency headwind
Q2 - good organic growth
AdvancedWound Care
+3.3%1
OstomyCare
+0.3%1
Continence &Critical Care
+2.8%1
InfusionDevices
+1.9%1
Revenue performance
7
0.0 1.66.5 1.2
(8.9) 0.4
(33.2)
(100) bps
(360) bps
1 Organic growth is growth at constant exchange rates (“CER”), excluding M&A activities2 NPWT = Negative Pressure Wound Therapy
H1 2019: franchise performance
Advanced Wound Care
H1 19 (1.8)%1
Q2 19 +3.3%1
Ostomy Care
H1 19 (0.2)%1
Q2 19 +0.3%1
• Q2 organic growth +3.3%1, H1 flat1 ex. rebate provision
• AQUACELTM Foam and Silver growth offset by legacy products
• US - completed our move to a new salesforce model, positive lead indictors
• AvelleTM disposable NPWT2 and AQUACELTMAg Advantage launched in US
• Good performance in APAC and EMEA markets - UK market still challenging
• Q2 organic growth +0.3%1, H1 +0.6%1 ex. rebate provision
• Continued traction with more recent product launches: Esteem +TM Flex Convex, NaturaTM Accordion
• Good performance in Q2 in a number of markets in EMEA, LatAm
8
1 Organic growth is growth at constant exchange rates (“CER”), excluding M&A activities
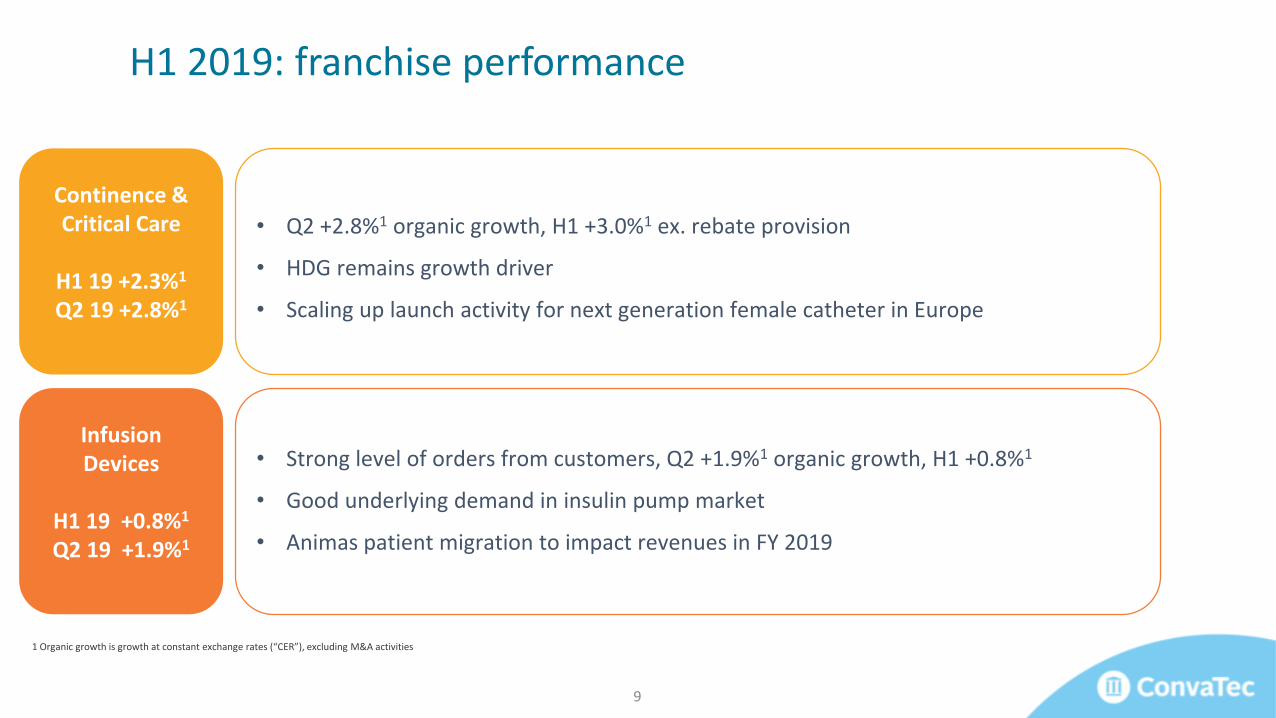
Continence & Critical Care
H1 19 +2.3%1
Q2 19 +2.8%1
Infusion Devices
H1 19 +0.8%1
Q2 19 +1.9%1
• Q2 +2.8%1 organic growth, H1 +3.0%1 ex. rebate provision
• HDG remains growth driver
• Scaling up launch activity for next generation female catheter in Europe
• Strong level of orders from customers, Q2 +1.9%1 organic growth, H1 +0.8%1
• Good underlying demand in insulin pump market
• Animas patient migration to impact revenues in FY 2019
9
H1 2019: franchise performance
H1 2019 H1 2018
R&D
G&A
S&D
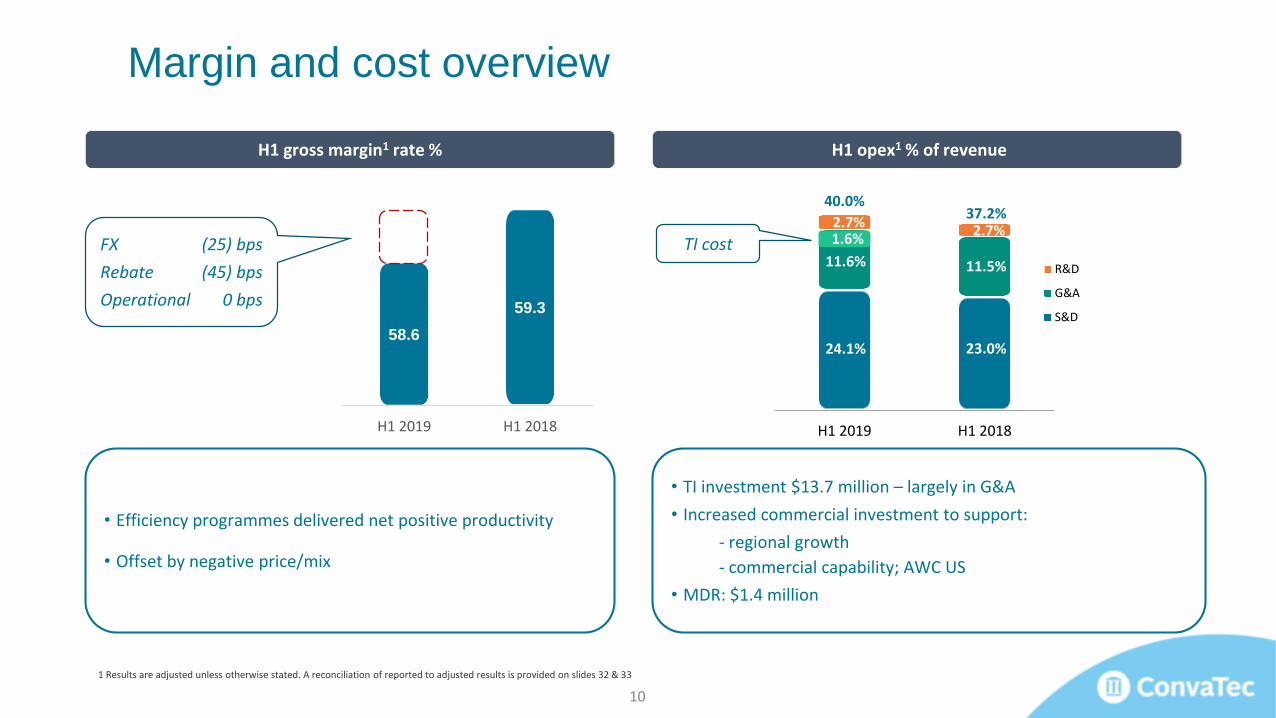
58.6
59.3
H1 2019 H1 2018
Margin and cost overview
H1 gross margin1 rate % H1 opex1 % of revenue
• Efficiency programmes delivered net positive productivity
• Offset by negative price/mix
1 Results are adjusted unless otherwise stated. A reconciliation of reported to adjusted results is provided on slides 32 & 33
11.6%
24.1%
11.5%
23.0%
2.7%2.7%
• TI investment $13.7 million – largely in G&A
• Increased commercial investment to support:
- regional growth
- commercial capability; AWC US
• MDR: $1.4 million
40.0%37.2%
10
TI cost FX (25) bps
Rebate (45) bps
Operational 0 bps
1.6%
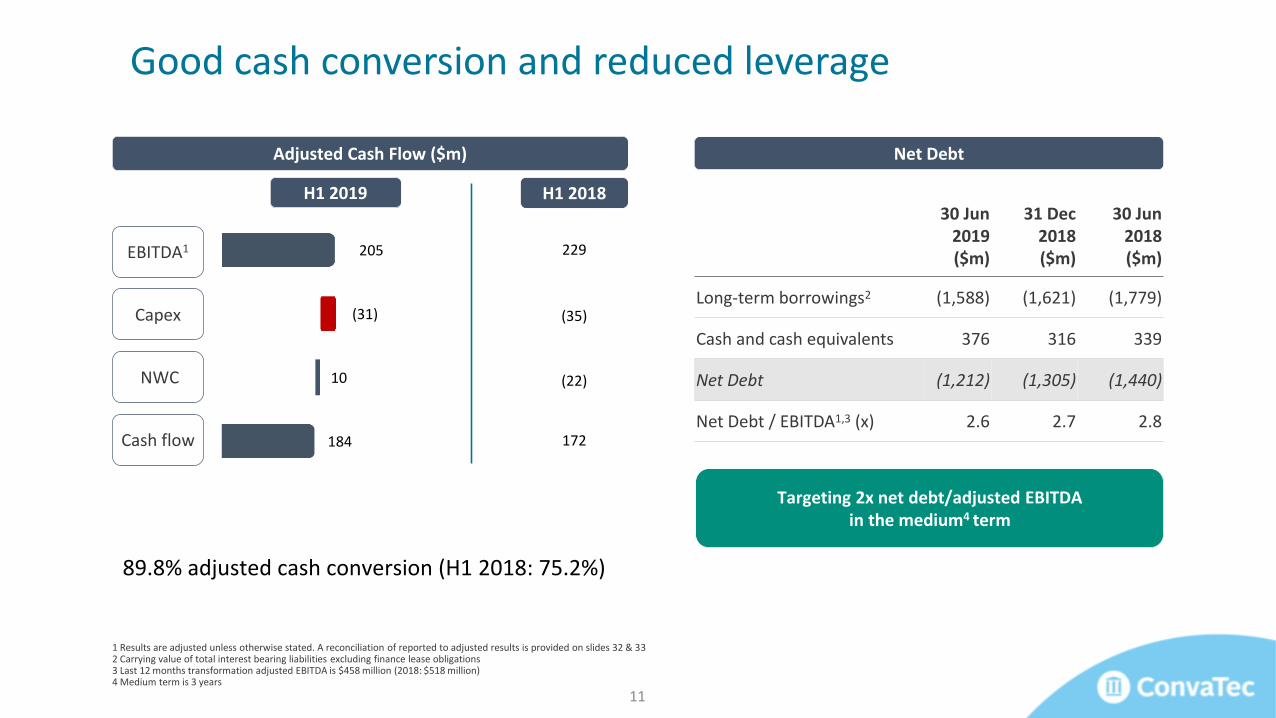
184
205
10
(31)
22.4%
11.4%
23.1%
1 Results are adjusted unless otherwise stated. A reconciliation of reported to adjusted results is provided on slides 32 & 332 Carrying value of total interest bearing liabilities excluding finance lease obligations3 Last 12 months transformation adjusted EBITDA is $458 million (2018: $518 million)4 Medium term is 3 years
Good cash conversion and reduced leverage
Adjusted Cash Flow ($m)
EBITDA1
Capex
Cash flow
Net Debt
30 Jun 2019($m)
31 Dec 2018($m)
30 Jun 2018($m)
Long-term borrowings2 (1,588) (1,621) (1,779)
Cash and cash equivalents 376 316 339
Net Debt (1,212) (1,305) (1,440)
Net Debt / EBITDA1,3 (x) 2.6 2.7 2.8
89.8% adjusted cash conversion (H1 2018: 75.2%)
NWC
2017 ($’m)
229
(35)
(22)
172
H1 2018H1 2019
Targeting 2x net debt/adjusted EBITDA in the medium4 term
11
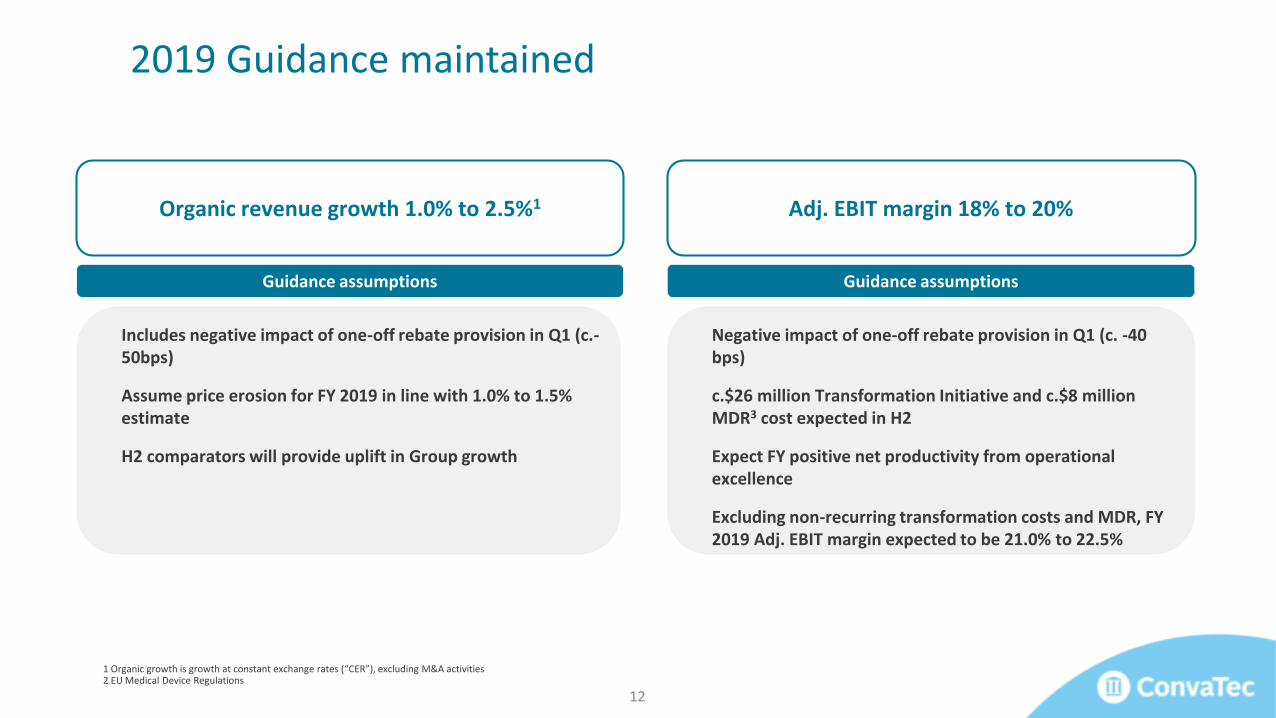
Includes negative impact of one-off rebate provision in Q1 (c.-50bps)
Assume price erosion for FY 2019 in line with 1.0% to 1.5% estimate
H2 comparators will provide uplift in Group growth
1 Organic growth is growth at constant exchange rates (“CER”), excluding M&A activities2 EU Medical Device Regulations
Negative impact of one-off rebate provision in Q1 (c. -40 bps)
c.$26 million Transformation Initiative and c.$8 million MDR3 cost expected in H2
Expect FY positive net productivity from operational excellence
Excluding non-recurring transformation costs and MDR, FY 2019 Adj. EBIT margin expected to be 21.0% to 22.5%
Organic revenue growth 1.0% to 2.5%1 Adj. EBIT margin 18% to 20%
Guidance assumptions Guidance assumptions
2019 Guidance maintained
12
3. Transformation update
Rick Anderson
Executive Chairman
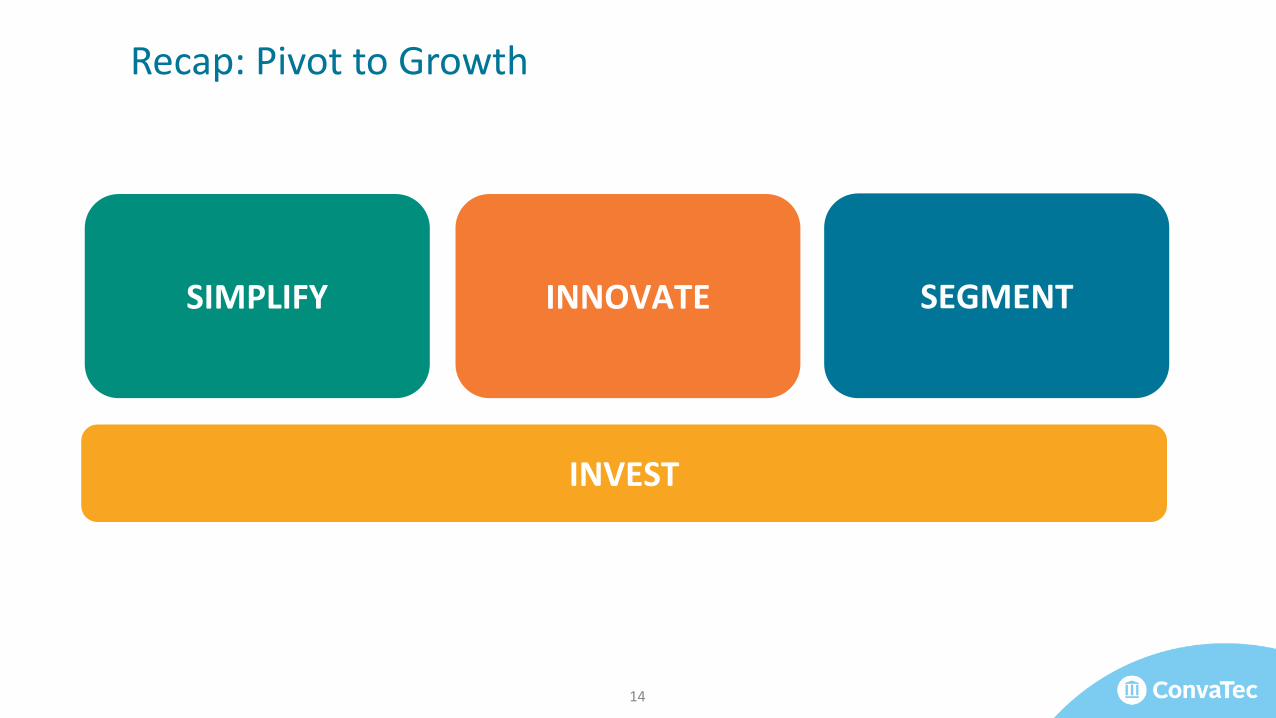
SEGMENTSIMPLIFY INNOVATE
INVEST
14
Recap: Pivot to Growth
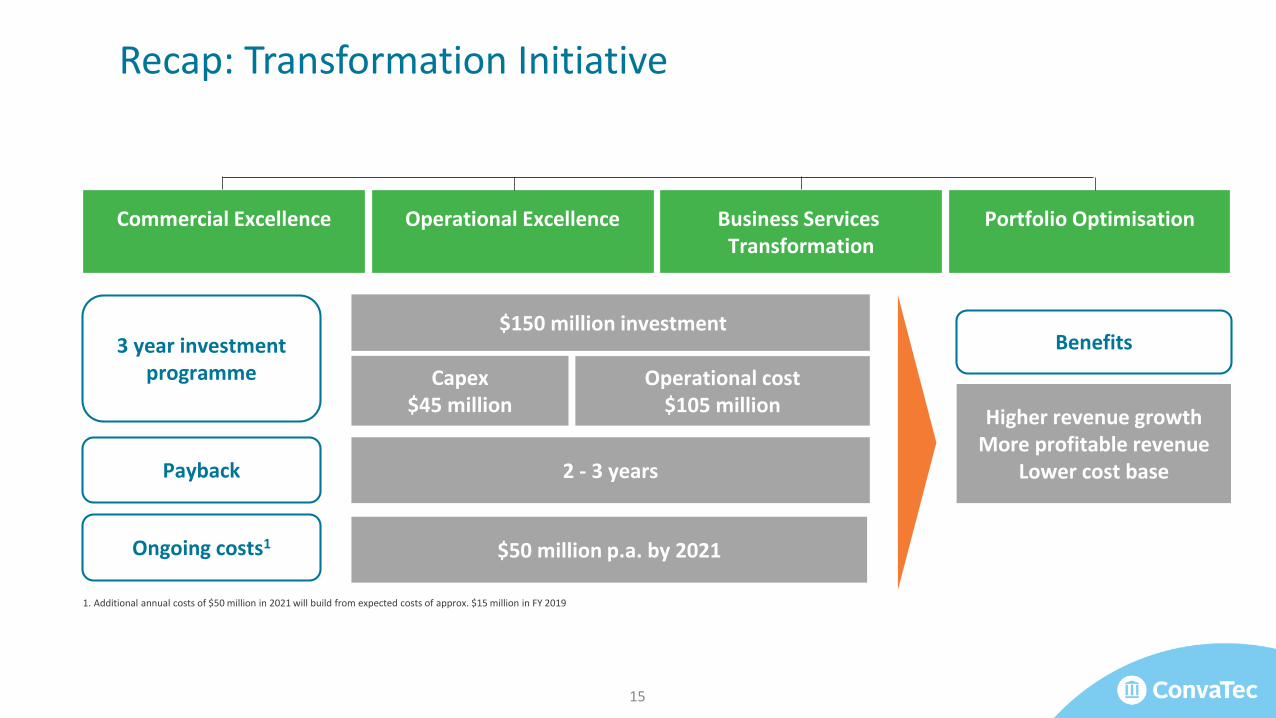
Recap: Transformation Initiative
Commercial Excellence Operational Excellence Business Services Transformation
Portfolio Optimisation
Payback
$150 million investment
Capex$45 million
Operational cost$105 million
2 - 3 years
Higher revenue growthMore profitable revenue
Lower cost base
$50 million p.a. by 2021
3 year investment programme
Benefits
1. Additional annual costs of $50 million in 2021 will build from expected costs of approx. $15 million in FY 2019
Ongoing costs1
15
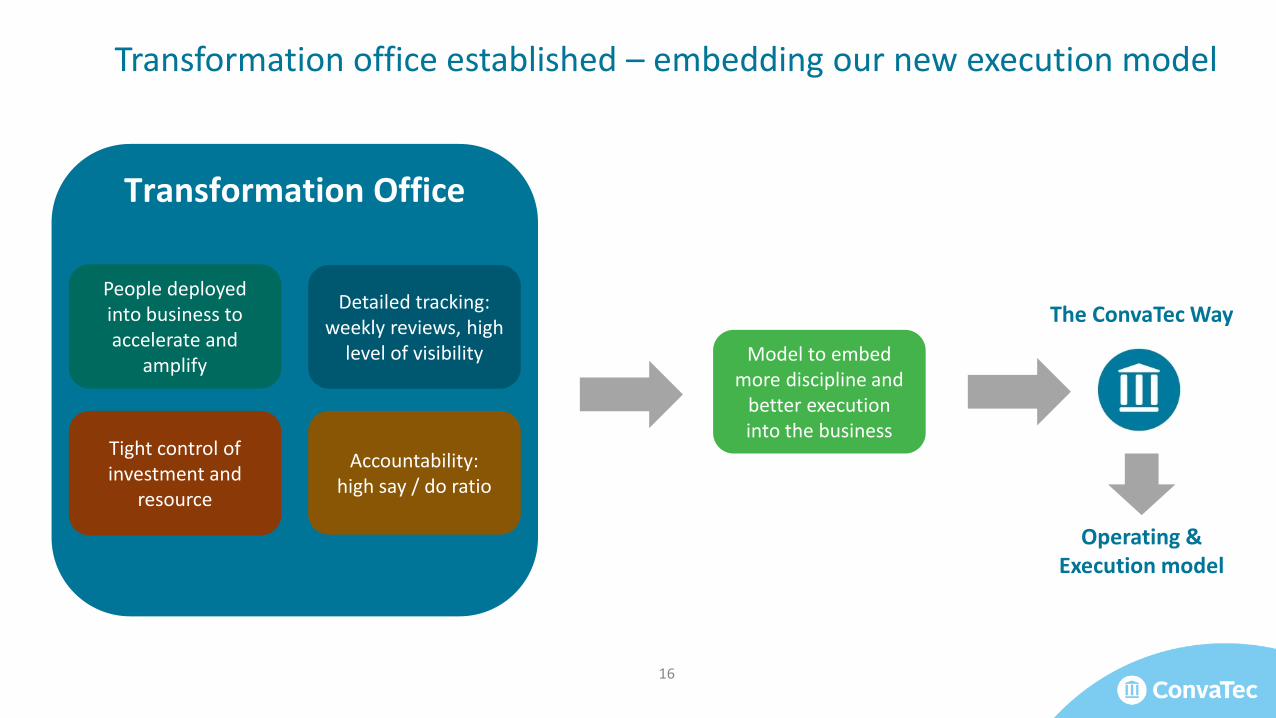
Transformation office established – embedding our new execution model
16
Transformation Office
People deployed into business to accelerate and
amplify
Detailed tracking: weekly reviews, high
level of visibility
Accountability: high say / do ratio
Model to embed more discipline and
better execution into the business
Tight control of investment and
resource
The ConvaTec Way
Operating & Execution model
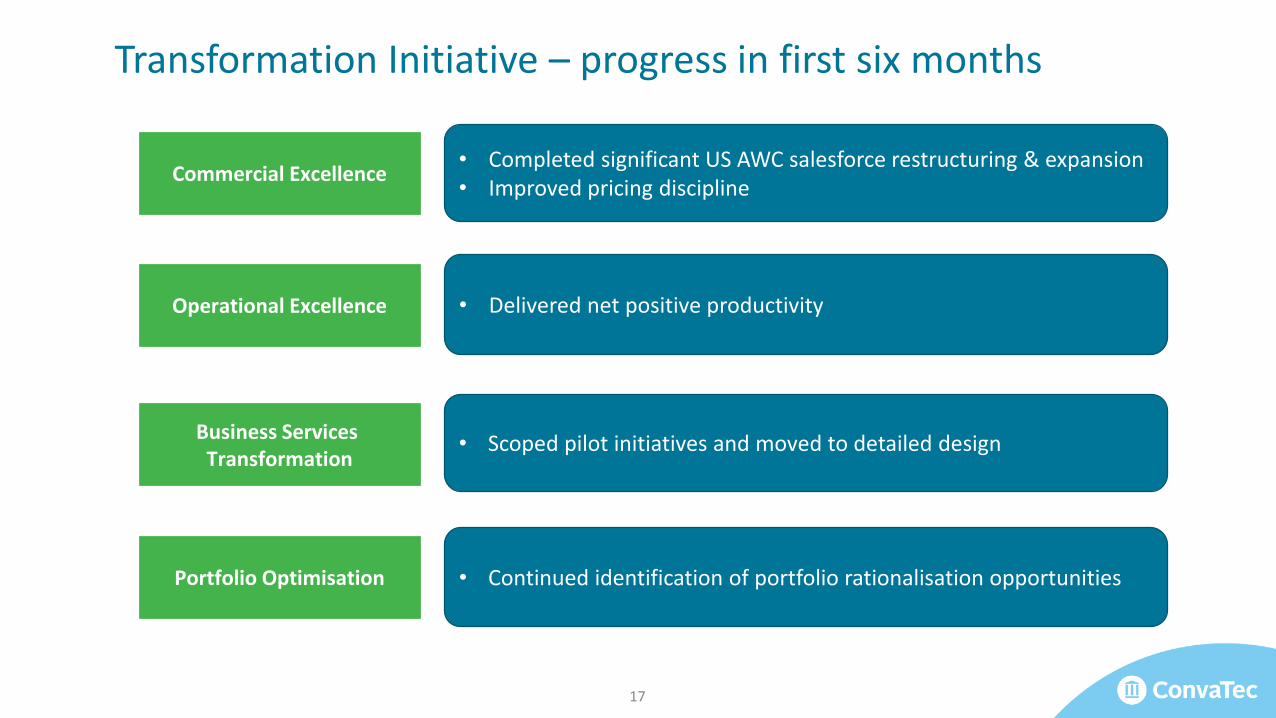
Transformation Initiative – progress in first six months
Commercial Excellence
Operational Excellence
Business Services Transformation
Portfolio Optimisation
• Completed significant US AWC salesforce restructuring & expansion• Improved pricing discipline
• Delivered net positive productivity
• Scoped pilot initiatives and moved to detailed design
• Continued identification of portfolio rationalisation opportunities
17
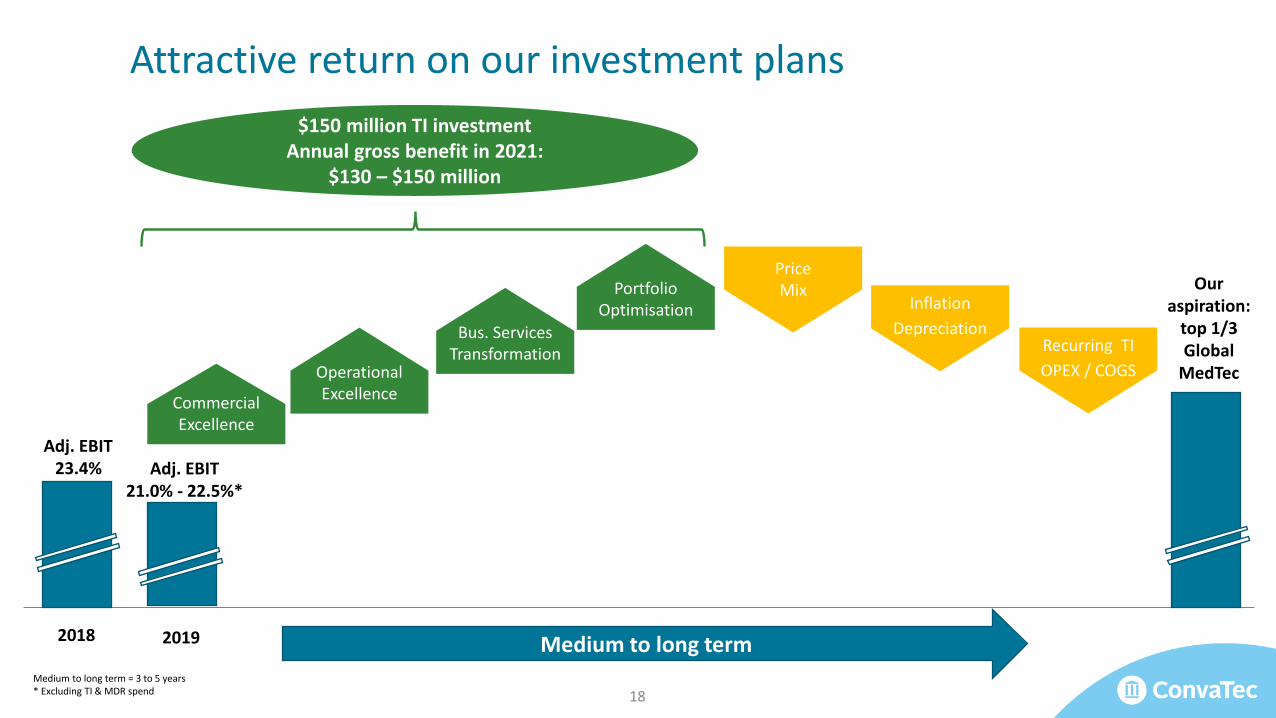
Attractive return on our investment plans
Adj. EBIT23.4%
2018
18
Commercial Excellence
Portfolio Optimisation
Bus. Services Transformation
Operational Excellence
PriceMix
Inflation
DepreciationRecurring TI
OPEX / COGS
Our aspiration:
top 1/3 Global
MedTec
$150 million TI investmentAnnual gross benefit in 2021:
$130 – $150 million
Medium to long termMedium to long term = 3 to 5 years* Excluding TI & MDR spend
2019
Adj. EBIT21.0% - 22.5%*
4. US Wound update
David Shepherd
President Advanced Wound Care
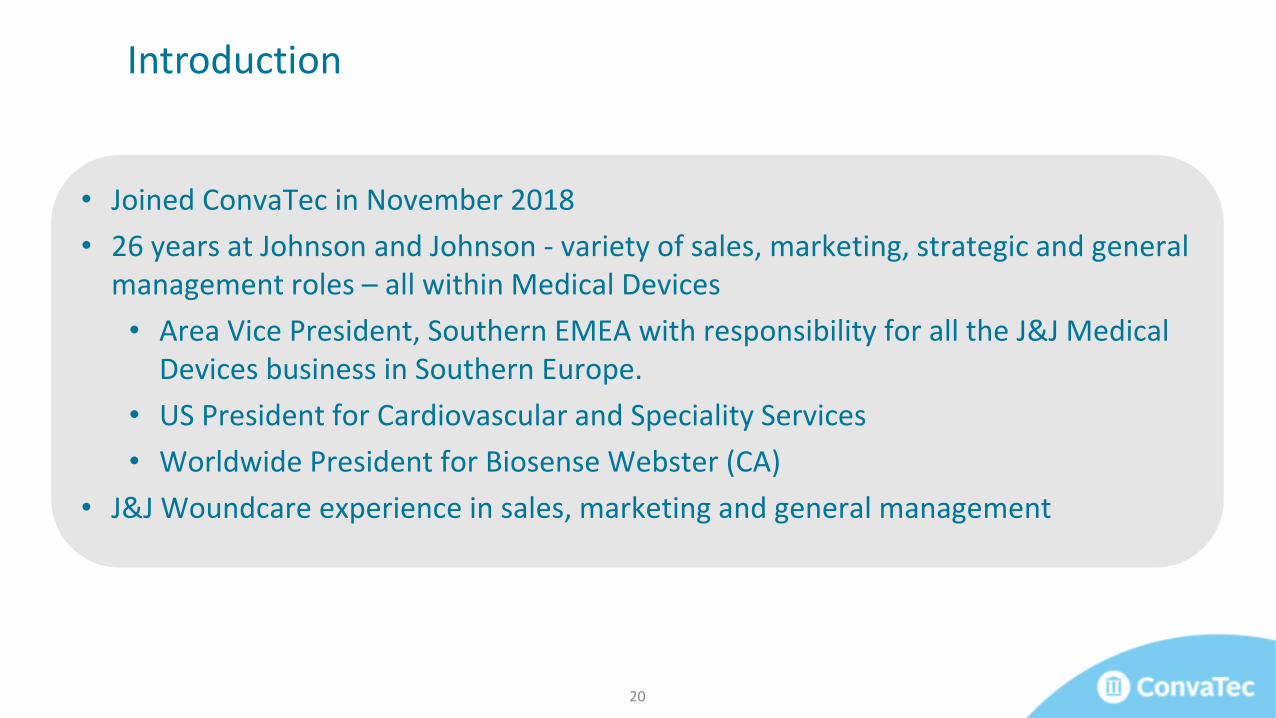
Introduction
20
• Joined ConvaTec in November 2018
• 26 years at Johnson and Johnson - variety of sales, marketing, strategic and general management roles – all within Medical Devices
• Area Vice President, Southern EMEA with responsibility for all the J&J Medical Devices business in Southern Europe.
• US President for Cardiovascular and Speciality Services
• Worldwide President for Biosense Webster (CA)
• J&J Woundcare experience in sales, marketing and general management
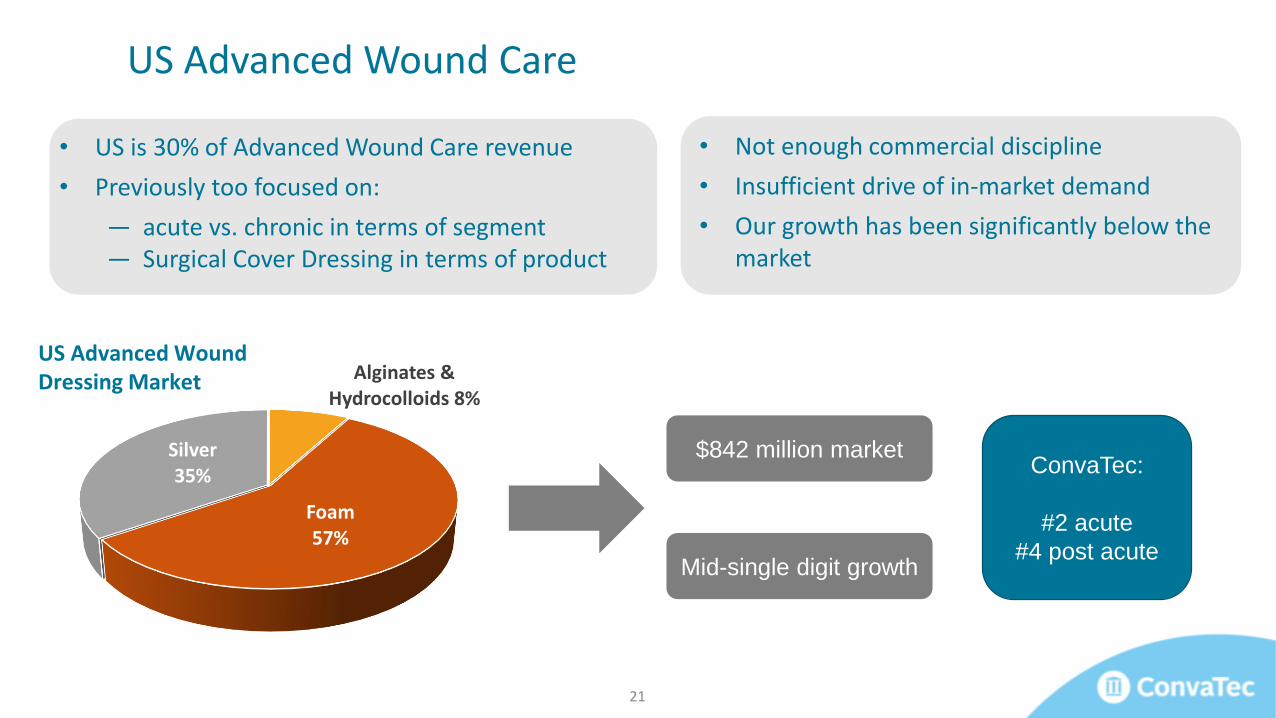
Alginates & Hydrocolloids 8%
Foam57%
Silver35%
• Not enough commercial discipline
• Insufficient drive of in-market demand
• Our growth has been significantly below the market
US Advanced Wound Care
21
US Advanced WoundDressing Market
$842 million market
Mid-single digit growth
• US is 30% of Advanced Wound Care revenue
• Previously too focused on:
― acute vs. chronic in terms of segment ― Surgical Cover Dressing in terms of product
ConvaTec:
#2 acute
#4 post acute
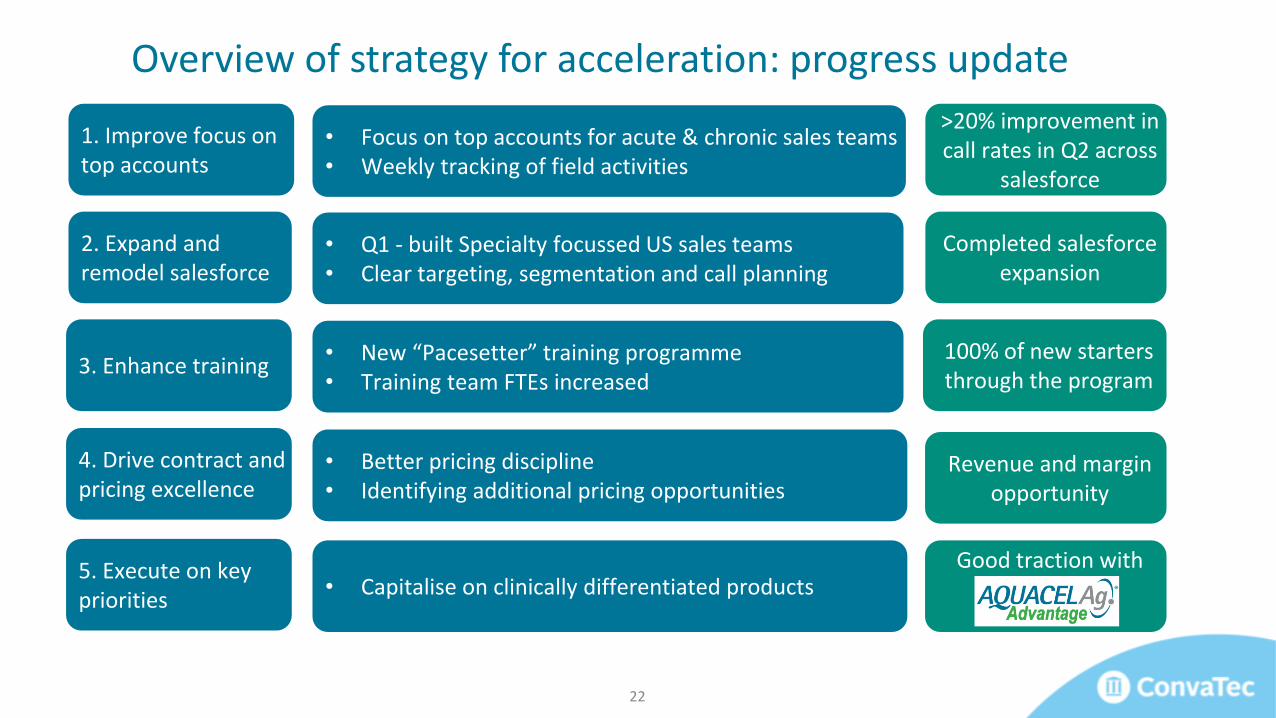
Overview of strategy for acceleration: progress update
2. Expand and remodel salesforce
1. Improve focus on top accounts
4. Drive contract and pricing excellence
3. Enhance training
5. Execute on key priorities
• Q1 - built Specialty focussed US sales teams• Clear targeting, segmentation and call planning
• Focus on top accounts for acute & chronic sales teams • Weekly tracking of field activities
• Better pricing discipline• Identifying additional pricing opportunities
• New “Pacesetter” training programme• Training team FTEs increased
• Capitalise on clinically differentiated products
22
Completed salesforce expansion
>20% improvement in call rates in Q2 across
salesforce
100% of new starters through the program
Revenue and margin opportunity
Good traction with
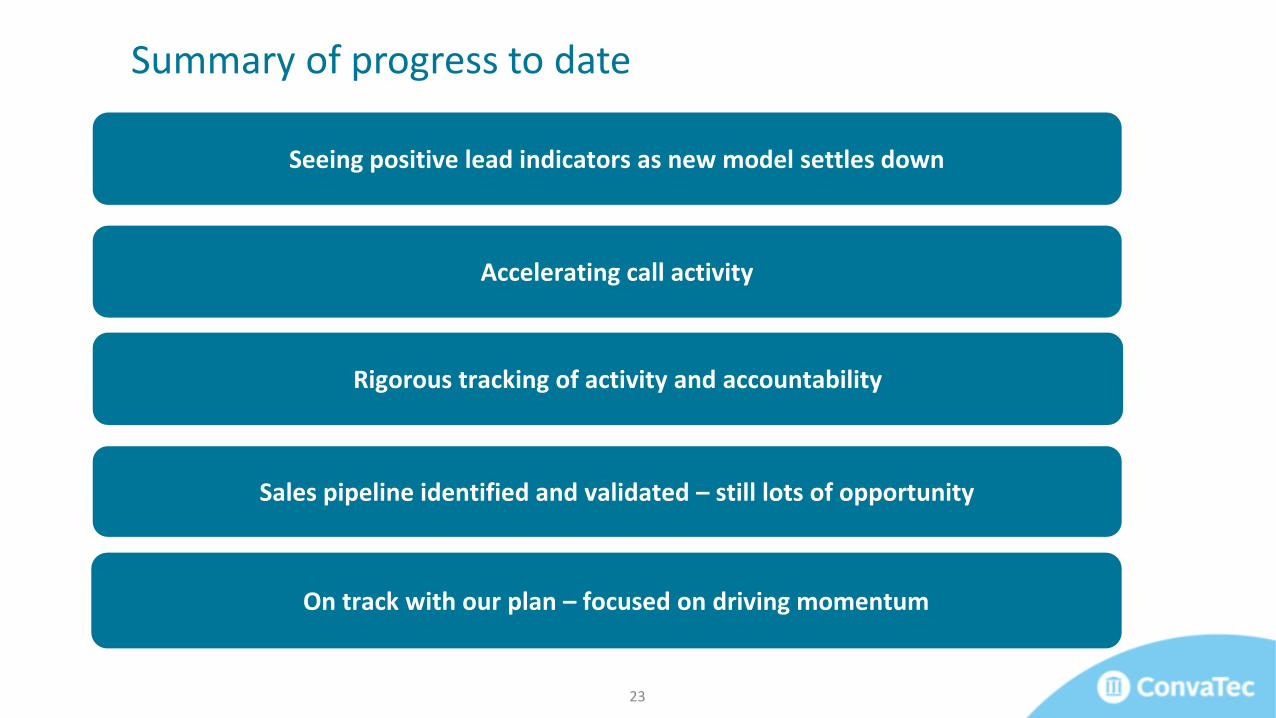
Summary of progress to date
Rigorous tracking of activity and accountability
Accelerating call activity
Sales pipeline identified and validated – still lots of opportunity
On track with our plan – focused on driving momentum
Seeing positive lead indicators as new model settles down
23

5. Summary & closeRick Anderson
Executive Chairman
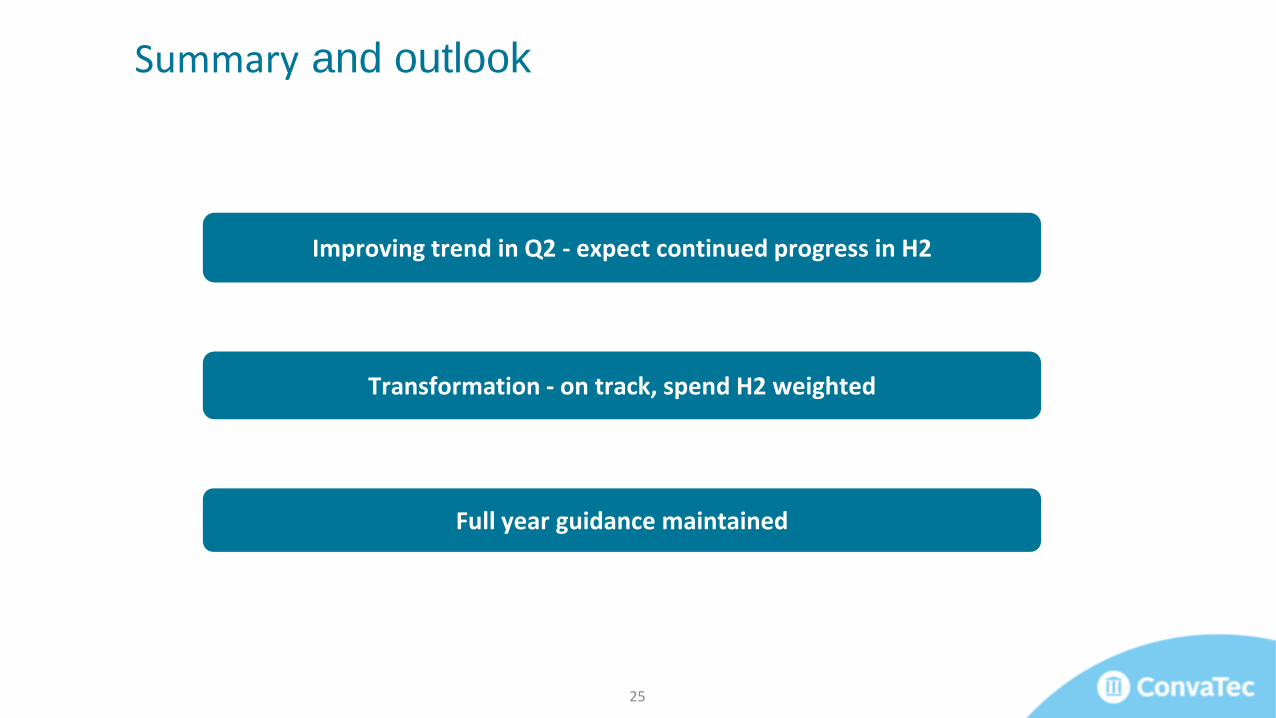
Summary and outlook
Full year guidance maintained
Improving trend in Q2 - expect continued progress in H2
Transformation - on track, spend H2 weighted
25
Q&A

Appendix
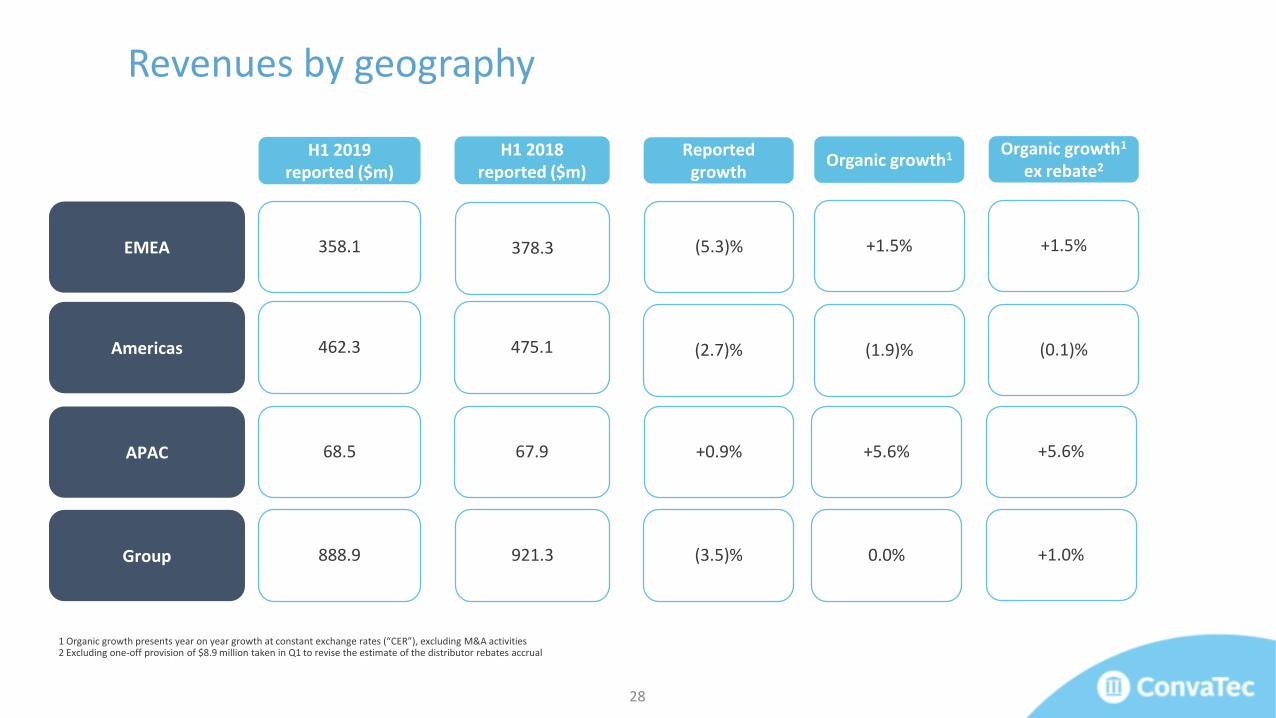
Revenues by geography
1 Organic growth presents year on year growth at constant exchange rates (“CER”), excluding M&A activities2 Excluding one-off provision of $8.9 million taken in Q1 to revise the estimate of the distributor rebates accrual
H1 2019 reported ($m)
H1 2018 reported ($m)
Reported growth
462.3 475.1 (2.7)%Americas
358.1 378.3 (5.3)%EMEA
68.5 67.9APAC +0.9%
888.9 921.3Group (3.5)%
Organic growth1
(1.9)%
+1.5%
+5.6%
0.0%
28
Organic growth1
ex rebate2
(0.1)%
+1.5%
+5.6%
+1.0%
11.9%
22.4%
11.4%
23.1%
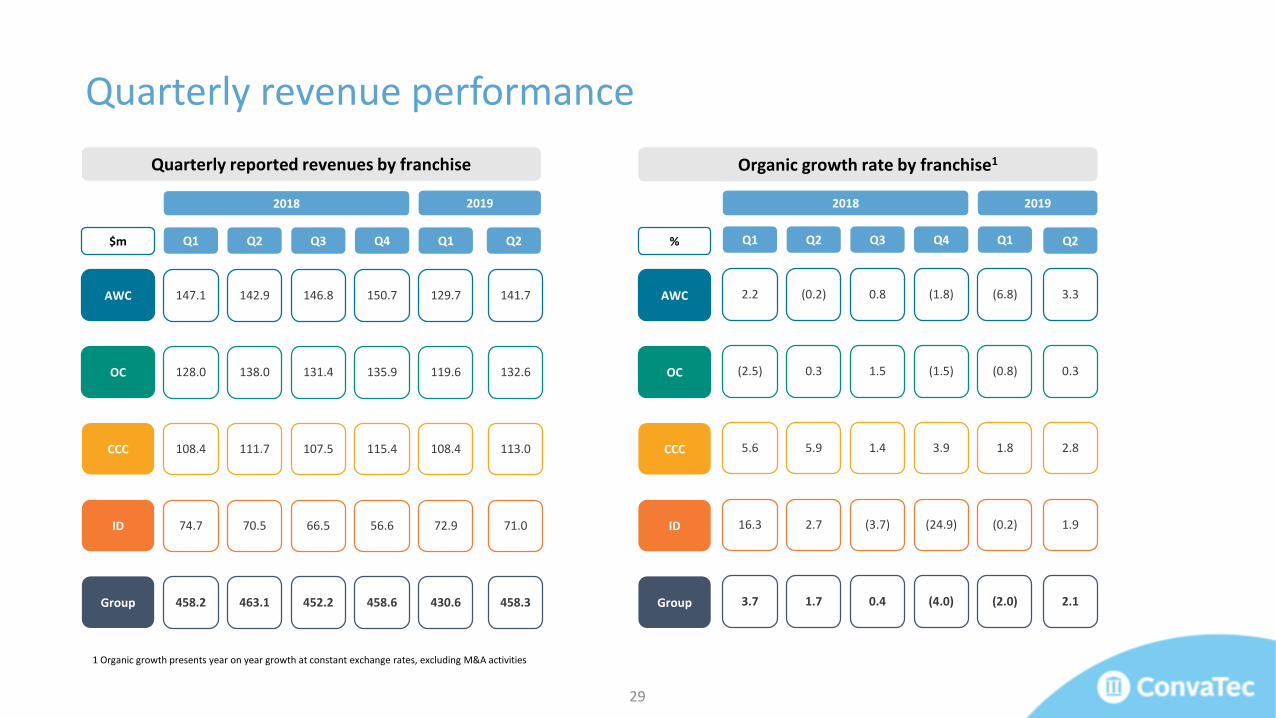
Q1
147.1
128.0
108.4
74.7
458.2
Q2
142.9
138.0
111.7
70.5
463.1
Q3
146.8
131.4
107.5
66.5
452.2
Q4
150.7
135.9
115.4
56.6
458.6
Q1
129.7
119.6
108.4
72.9
430.6
AWC
OC
CCC
ID
Group
$m Q1
2.2
(2.5)
5.6
16.3
3.7
Q2
(0.2)
0.3
5.9
2.7
1.7
Q3
0.8
1.5
1.4
(3.7)
0.4
Q4
(1.8)
(1.5)
3.9
(24.9)
(4.0)
Q1
(6.8)
(0.8)
1.8
(0.2)
(2.0)
Quarterly reported revenues by franchise Organic growth rate by franchise1
2018 2019 20192018
1 Organic growth presents year on year growth at constant exchange rates, excluding M&A activities
Quarterly revenue performance
AWC
OC
CCC
ID
Group
% Q2
3.3
0.3
2.8
1.9
2.1
Q2
141.7
132.6
113.0
71.0
458.3
29
22.4%23.1%
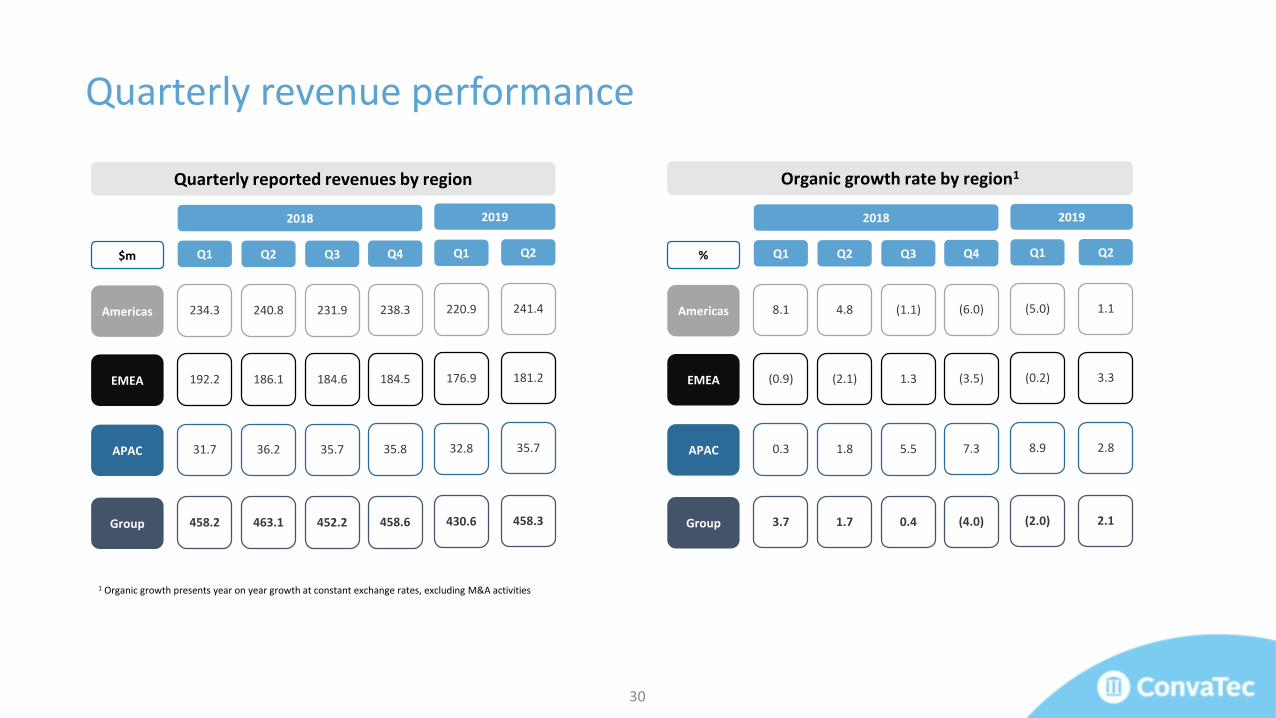
Q1
176.9
220.9
32.8
430.6
Q1
192.2
234.3
31.7
458.2
Q2
186.1
240.8
36.2
463.1
Q3
184.6
231.9
35.7
452.2
EMEA
Americas
APAC
Group
$m
Quarterly reported revenues by region
20192018
Q4
184.5
238.3
35.8
458.6
x%
22.4%
11.4%
23.1%
Q1
(0.2)
(5.0)
8.9
(2.0)
Q1
(0.9)
8.1
0.3
3.7
Q2
(2.1)
4.8
1.8
1.7
Q3
1.3
(1.1)
5.5
0.4
EMEA
Americas
APAC
Group
%
Organic growth rate by region1
20192018
Q4
(3.5)
(6.0)
7.3
(4.0)
Quarterly revenue performance
1 Organic growth presents year on year growth at constant exchange rates, excluding M&A activities
Q2
181.2
241.4
35.7
458.3
Q2
3.3
1.1
2.8
2.1
30
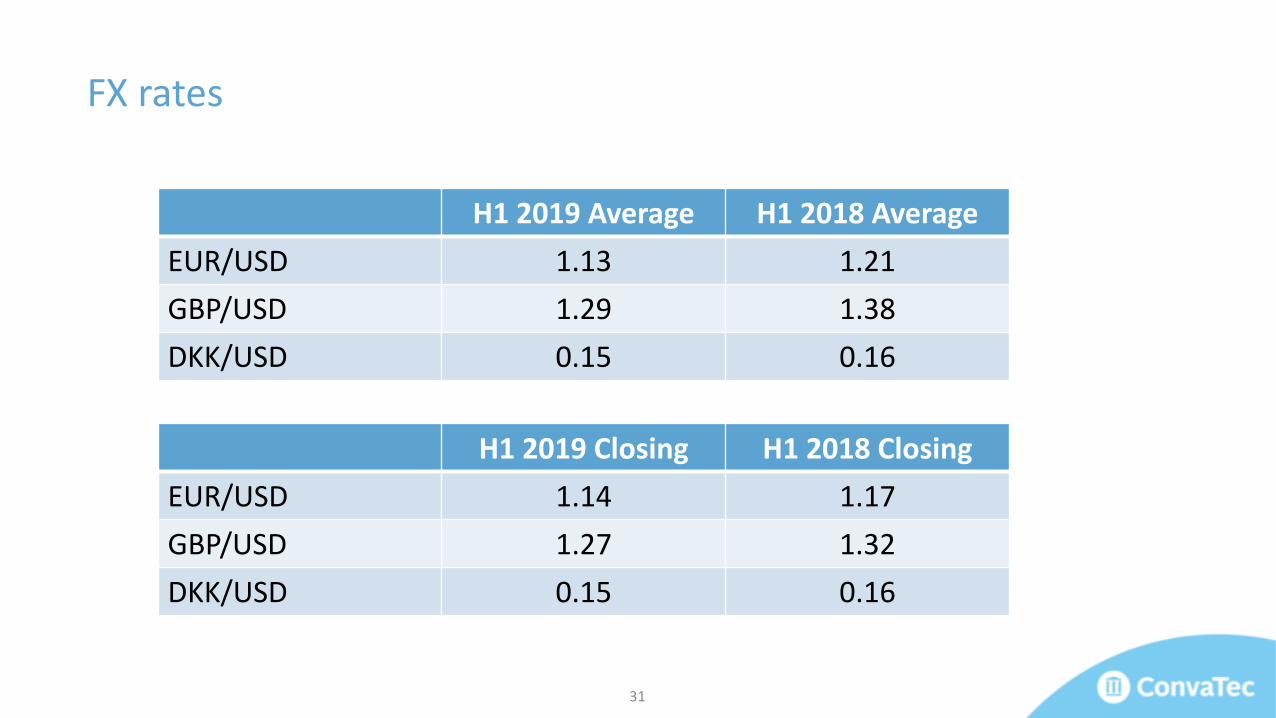
FX rates
H1 2019 Average H1 2018 Average
EUR/USD 1.13 1.21
GBP/USD 1.29 1.38
DKK/USD 0.15 0.16
H1 2019 Closing H1 2018 Closing
EUR/USD 1.14 1.17
GBP/USD 1.27 1.32
DKK/USD 0.15 0.16
31
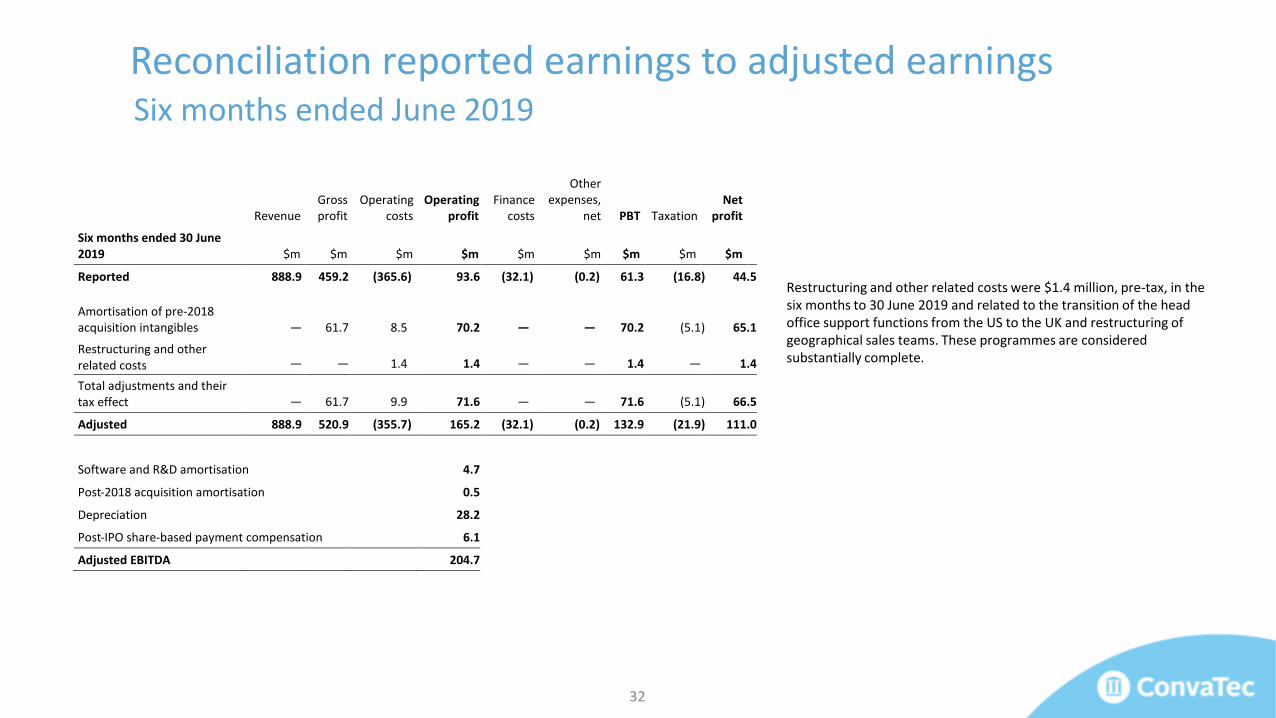
Reconciliation reported earnings to adjusted earningsSix months ended June 2019
Restructuring and other related costs were $1.4 million, pre-tax, in the six months to 30 June 2019 and related to the transition of the head office support functions from the US to the UK and restructuring of geographical sales teams. These programmes are considered substantially complete.
32
Revenue Gross profit
Operating costs
Operating profit
Finance costs
Other expenses,
net PBT Taxation Net
profit
Six months ended 30 June 2019 $m $m $m $m $m $m $m $m $m
Reported 888.9 459.2 (365.6 ) 93.6 (32.1 ) (0.2 ) 61.3 (16.8 ) 44.5
Amortisation of pre-2018 acquisition intangibles —
61.7
8.5
70.2
—
—
70.2
(5.1 ) 65.1
Restructuring and other related costs —
—
1.4
1.4
—
—
1.4
—
1.4
Total adjustments and their tax effect —
61.7
9.9
71.6
—
—
71.6
(5.1 ) 66.5
Adjusted 888.9 520.9 (355.7 ) 165.2 (32.1 ) (0.2 ) 132.9 (21.9 ) 111.0
Software and R&D amortisation 4.7
Post-2018 acquisition amortisation 0.5
Depreciation 28.2
Post-IPO share-based payment compensation 6.1
Adjusted EBITDA 204.7
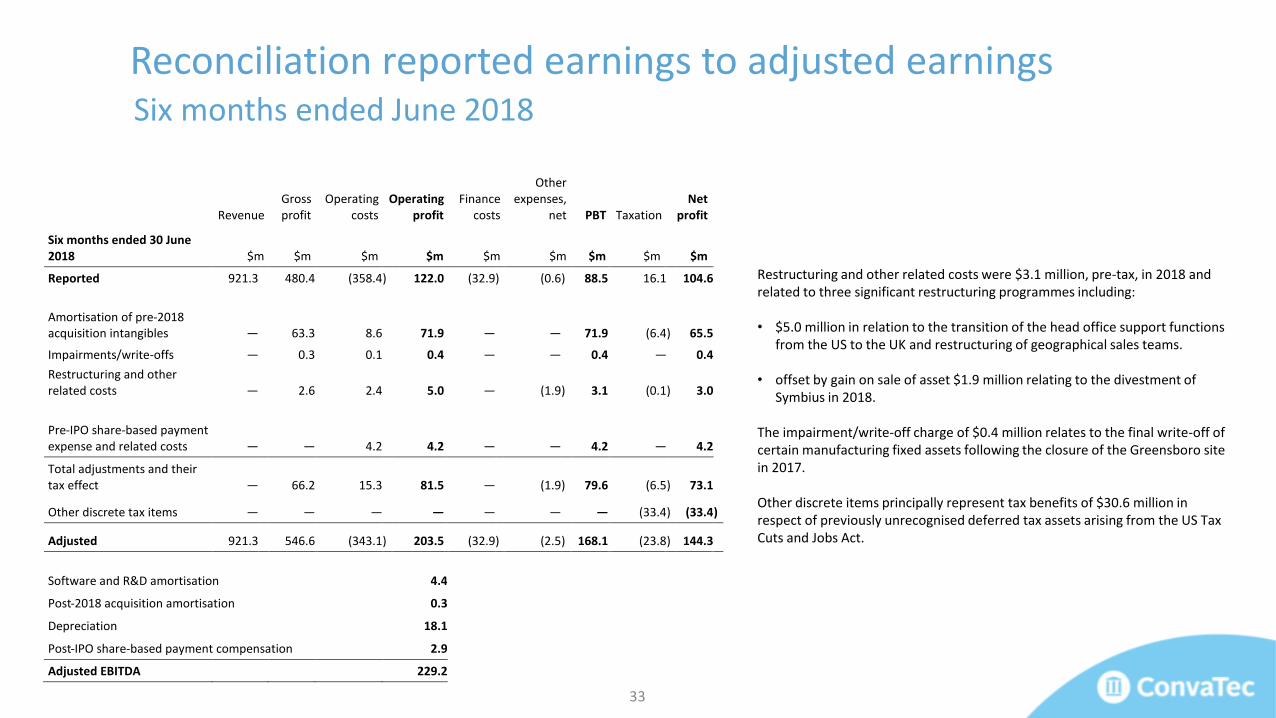
Restructuring and other related costs were $3.1 million, pre-tax, in 2018 and related to three significant restructuring programmes including:
• $5.0 million in relation to the transition of the head office support functions from the US to the UK and restructuring of geographical sales teams.
• offset by gain on sale of asset $1.9 million relating to the divestment of Symbius in 2018.
The impairment/write-off charge of $0.4 million relates to the final write-off of certain manufacturing fixed assets following the closure of the Greensboro site in 2017.
Other discrete items principally represent tax benefits of $30.6 million in respect of previously unrecognised deferred tax assets arising from the US Tax Cuts and Jobs Act.
33
Reconciliation reported earnings to adjusted earningsSix months ended June 2018
Revenue Gross profit
Operating costs
Operating profit
Finance costs
Other expenses,
net PBT Taxation Net
profit
Six months ended 30 June 2018 $m $m $m $m $m $m $m $m $m
Reported 921.3 480.4 (358.4 ) 122.0 (32.9 ) (0.6 ) 88.5 16.1 104.6
Amortisation of pre-2018 acquisition intangibles —
63.3
8.6
71.9
—
—
71.9
(6.4 ) 65.5
Impairments/write-offs — 0.3 0.1 0.4 — — 0.4 — 0.4
Restructuring and other related costs —
2.6
2.4
5.0
—
(1.9 ) 3.1
(0.1 ) 3.0
Pre-IPO share-based payment expense and related costs —
—
4.2
4.2
—
—
4.2
—
4.2
Total adjustments and their tax effect —
66.2
15.3
81.5
—
(1.9 ) 79.6
(6.5 ) 73.1
Other discrete tax items —
—
—
—
—
—
—
(33.4 ) (33.4 )
Adjusted 921.3
546.6
(343.1 ) 203.5
(32.9 ) (2.5 ) 168.1
(23.8 ) 144.3
Software and R&D amortisation 4.4
Post-2018 acquisition amortisation 0.3
Depreciation 18.1
Post-IPO share-based payment compensation 2.9
Adjusted EBITDA 229.2
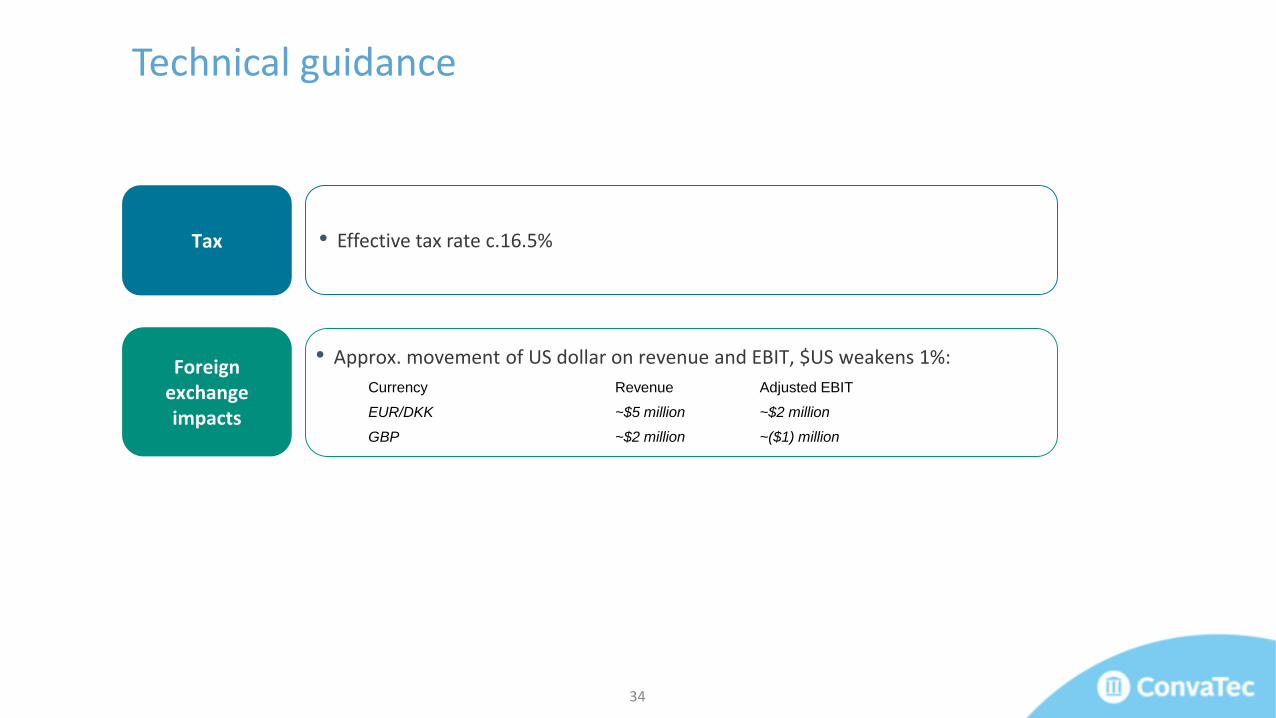
• Effective tax rate c.16.5%Tax
Foreign exchange impacts
Currency Revenue Adjusted EBIT
EUR/DKK ~$5 million ~$2 million
GBP ~$2 million ~($1) million
• Approx. movement of US dollar on revenue and EBIT, $US weakens 1%:
Technical guidance
34

![2018 Theatre Studies Written examination · Read Script excerpt 2. Script excerpt 2 [Dennis] enters through the downstairs door, knocking over the whole door flat1 with the chaise](https://img.pdfslide.us/doc/110x75/5e57fdd4d46c4f261f01e806/2018-theatre-studies-written-examination-read-script-excerpt-2-script-excerpt-2.jpg)