Embed Size (px)
Citation preview

Florida Department of Education Bureau of Exceptional Education and Student Services
2019 LEA Profile
Richard Corcoran Commissioner
Introduction
District: Enrollment Group: PK-12 Population: Percent Disabled:
Hernando 20,000 to 39,999 22,807 15%
The LEA profile is intended to provide districts with a tool for use in planning for systemic improvement in exceptional education programs. The profile contains a series of data indicators that describe measures of educational benefit, educational environment, prevalence, parent involvement and provides information about district performance as compared to state level targets in Florida’s State Performance Plan/ Annual Performance Report (SPP/APR). Required under the Individuals with Disabilities Education Act (IDEA), the SPP/APR for 2014-19 contains historical data and targets for 16 indicators along with a State Systemic Improvement Plan (SSIP). During the six-year period, Florida will annually submit progress reports for each indicator as well as the SSIP. As part of the process, Florida publicly reports data for both the state and each local education agency.
Data in the LEA profile are presented for the district and the state. Where appropriate and available, comparative data for enrollment group and/or general education students are included. Indicators in bold are part of the SPP/APR.
Data presented as indicators of educational benefit (Section One)
Federal uniform high school graduation rate
Standard diploma graduation rate
Federal dropout rate for students with disabilities
Postschool outcome data
Data presented as indicators of educational environment (Section Two)
Students with disabilities ages 6-21 by placement setting
Children with disabilities ages 3-5 by placement setting
Part C to Part B transition
Secondary Transition IEPs
Students with disabilities suspended/expelled for more than 10 days in a school year
Data presented as indicators of prevalence (Section Three)
Evaluations completed within 60 days
Student membership by race/ethnicity
Risk ratios of racial/ethnic groups identified as disabled
Hernando Profile, Page 1
LEA Profile 2019
Data presented as an indicator of parent involvement (Section Four)
Survey of parent perceptions
Selected State Performance Plan indicators
Summary information on selected state performance plan indicators submitted to the Federal Government
State level targets
District level data
Data Sources and Reporting The data contained in this profile were obtained from data submitted electronically by districts through the Department of Education Information Database in surveys 2 and 5, parent survey submissions, the Florida self-assessment monitoring system, the Florida Education and Training Placement Information Program (FETPIP), and through the Department of Health (DOH) Early Steps program.
Data contained in Section One through Section Four are rounded to the nearest whole number. Rounding is not used in the SPP Performance Report at the end of the document.
Districts in Enrollment Group: Clay, Leon, Okaloosa, Alachua, Santa Rosa, Bay, Hernando, Escambia
Section One: Educational Benefit
Educational benefit refers to the extent to which children benefit from their educational experience. Progression through and completion of school are dimensions of educational benefit as are postschool outcomes. This section of the profile provides data on indicators of school completion, and postschool outcomes.
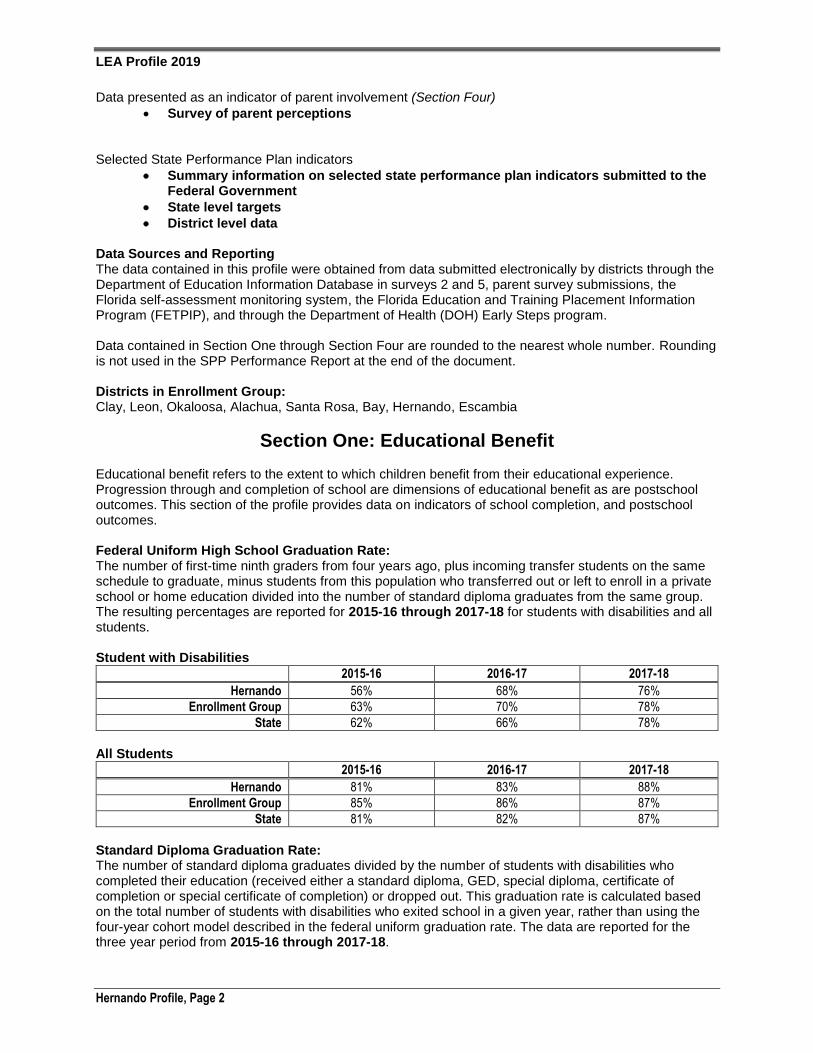
Federal Uniform High School Graduation Rate: The number of first-time ninth graders from four years ago, plus incoming transfer students on the same schedule to graduate, minus students from this population who transferred out or left to enroll in a private school or home education divided into the number of standard diploma graduates from the same group. The resulting percentages are reported for 2015-16 through 2017-18 for students with disabilities and all students.
Student with Disabilities
2015-16 2016-17 2017-18
Hernando 56% 68% 76%
Enrollment Group 63% 70% 78%
State 62% 66% 78%
All Students
2015-16 2016-17 2017-18
Hernando 81% 83% 88%
Enrollment Group 85% 86% 87%
State 81% 82% 87%
Standard Diploma Graduation Rate: The number of standard diploma graduates divided by the number of students with disabilities who completed their education (received either a standard diploma, GED, special diploma, certificate of completion or special certificate of completion) or dropped out. This graduation rate is calculated based on the total number of students with disabilities who exited school in a given year, rather than using the four-year cohort model described in the federal uniform graduation rate. The data are reported for the three year period from 2015-16 through 2017-18.
Hernando Profile, Page 2

Florida Department of Education
Standard Diploma Graduation Rate for Students with Disabilities
2015-16 2016-17 2017-18
Hernando 63% 70% 81%
Enrollment Group 71% 71% 81%
State 64% 66% 80%
Federal Dropout Rate for Students with Disabilities: The number of students who exited special education due to dropping out, divided by the number of students who graduated with a regular high school diploma, special diploma, certificate of completion, special certificate of completion, dropped out or died. The resulting percentages are reported for students with disabilities, students identified with an emotional or behavior disability (EBD) and students identified with a specific learning disability (SLD) for the years 2015-16 through 2017-18.
Federal Dropout Rate for Students with Disabilities
2015-16 2016-17 2017-18
Hernando 28% 28% 19%
Enrollment Group 11% 12% 10%
State 17% 16% 13%
Federal Dropout Rate for EBD Students
2015-16 2016-17 2017-18
Hernando 25% 46% 47%
Enrollment Group 28% 27% 25%
State 39% 34% 31%
Federal Dropout Rate for SLD Students
2015-16 2016-17 2017-18
Hernando 33% 27% 17%
Enrollment Group 12% 14% 13%
State 18% 18% 15%
Postschool Outcome Data: The Florida Education and Training Placement Information Program (FETPIP) is an interagency data collection system that obtains follow-up data on former students. The most recent FETPIP data available reports on students who exited Florida public schools during the 2016-17 school year. The table below displays percentage of students with disabilities exiting school in 2014-15 through 2016-17 who were found during the fall/winter following the school year and were (1) enrolled in higher education, (2) enrolled in higher education or competitively employed, and (3) enrolled in higher education or some other postsecondary education or training program or competitively employed or employed in some other employment.
Students with Disabilities in Higher Education
2014-15 2015-16 2016-17
Hernando 25% 18% 19%
Enrollment Group 30% 24% 23%
State 28% 28% 24%
Students with Disabilities in Higher Education/Competitively Employed
2014-15 2015-16 2016-17
Hernando 39% 35% 43%
Enrollment Group 47% 40% 50%
State 43% 44% 51%
Hernando Profile, Page 3

LEA Profile 2019
Students with Disabilities in any Employment or Continuing Education
2014-15 2015-16 2016-17
Hernando 51% 46% 53%
Enrollment Group 58% 51% 59%
State 55% 56% 59%
Section Two: Educational Environment
Indicators related to educational environment address the extent to which students with disabilities receive special education with their peers without disabilities, timely transition from Part C programs to Part B programs, secondary transition IEPs, and risk ratios of out-of-school suspensions/expulsions for students with disabilities when compared to peers without disabilities.
Regular Class, Resource Room, Separate Class Placement, and Other Separate Environments, Ages 6-21: The number of students with disabilities ages 6-21 in regular class, resource room, separate class, and other separate environment, divided by the total number of students with disabilities ages 6-21 reported October (survey 2). Regular class includes students who spend 80% or more of their school week with peers without disabilities. Resource room includes students spending between 40% and 80% of their school week with peers without disabilities. Separate class includes students spending less than 40% of their week with peers without disabilities. Other separate environment includes students served in public or private separate schools, residential placements or hospital/homebound placements. The resulting percentages are reported for the three years from 2016-17 through 2018-19. Students served in corrections facilities and students enrolled by their parents in private schools who are receiving special education and/or related services from the LEA are not included in this calculation.
Regular Class
2016-17 2017-18 2018-19
Hernando 76% 78% 78%
Enrollment Group 76% 78% 80%
State 74% 75% 76%
Resource Room
2016-17 2017-18 2018-19
Hernando 7% 7% 7%
Enrollment Group 8% 6% 4%
State 9% 8% 7%
Separate Class
2016-17 2017-18 2018-19
Hernando 16% 15% 15%
Enrollment Group 14% 13% 12%
State 14% 14% 14%
Other Separate Environment
2016-17 2017-18 2018-19
Hernando <1% <1% <1%
Enrollment Group 3% 3% 3%
State 4% 3% 3%
If an additional calculation reveals that students with disabilities ages 6-21 of any race are at least 3.5 times more likely to be placed in a separate class or other separate environment when compared to all
Hernando Profile, Page 4

Florida Department of Education
other races combined, the district will be required to set aside IDEA funds for coordinated early intervening services.
Early Childhood Education Settings, Ages 3-5: The number of students with disabilities ages 3-5 attending a regular early childhood program or kindergarten and receiving the majority of special education and related services inside the regular early childhood program; attending a regular early childhood program or kindergarten and receiving the majority of special education and related services outside the special education program (separate class, separate school, or residential facility); or served in another separate environment (home or service provider location) divided by the total number of students with disabilities ages 3-5 reported in October (survey 2). Students attending a regular early childhood program or kindergarten are those who spend any time in a program that includes at least 50% children without disabilities. The resulting percentages are reported for 2016-17 through 2018-19.
Regular Early Childhood Program or Kindergarten Receiving Services Inside the Classroom
2016-17 2017-18 2018-19
Hernando 30% 30% 27%
Enrollment Group 35% 29% 26%
State 37% 40% 39%
Regular Early Childhood Program or Kindergarten Receiving Services Outside the Classroom
2016-17 2017-18 2018-19
Hernando 29% 32% 40%
Enrollment Group 16% 14% 10%
State 10% 9% 11%
Separate Class, Separate School, or Residential Facility
2016-17 2017-18 2018-19
Hernando 40% 37% 32%
Enrollment Group 47% 54% 60%
State 50% 49% 47%
Home or Service Provider Location
2016-17 2017-18 2018-19
Hernando 2% 2% 1%
Enrollment Group 3% 3% 3%
State 3% 3% 3%
Part C to Part B Transition: The number of children referred for eligibility determination by Part C prior to age 3, who are found eligible for Part B, and who have an IEP developed and implemented by their third birthdays, divided by the number of children served in Part C and referred to Part B for eligibility determination (not including children determined to be ineligible for Part B prior to age 3 or children for whom parent refusal to provide consent caused delays in evaluation or initial services). The resulting percentages are reported for 2015-16 through 2017-18.
IEP Developed and Implemented by 3rd Birthday
2015-16 2016-17 2017-18
Hernando 100% 100% 100%
State 100% 100% 100%
Secondary Transition IEPs: The percentage of compliant transition IEPs are calculated by dividing (a) the number of students with IEPs aged 16 and above with an IEP that includes appropriate measurable postsecondary goals that are annually updated and based upon an age appropriate transition assessment, transition services, including courses of study, that will reasonably enable the student to meet those postsecondary goals, and annual
Hernando Profile, Page 5

LEA Profile 2019
IEP goals related to the student’s transition services needs by (b) the number of youth with an IEP age 16 and above. The resulting percentages are reported for 2015-16 through 2017-18.
Transition IEPs Found Compliant
2015-16 2016-17 2017-18
Hernando 100% 100% 100%
State 90% 94% 90%
Discipline Rates and Risk Ratios: Discipline rates for students with disabilities and students without disabilities are calculated by dividing the number of students who received out-of-school suspensions or expulsions totaling more than 10 days by total-year enrollment as reported at the end of the school year (survey 5). The risk ratio is calculated by dividing the discipline rate of students with disabilities by the discipline rate of students without disabilities. A risk ratio of 1.0 indicates that students with disabilities and students without disabilities are equally likely to be suspended/expelled. The resulting rates are reported for students with disabilities and students without disabilities for three years from 2015-16 through 2017-18 along with risk ratios for students with disabilities.
Students with Disabilities Suspended/Expelled For Greater than 10 Days
2015-16 2016-17 2017-18
Hernando 2% 2% 2%
State <1% <1% <1%
Students without Disabilities Suspended/Expelled For Greater than 10 Days
2015-16 2016-17 2017-18
Hernando <1% <1% 1%
State <1% <1% <1%
Discipline Risk Ratios
2015-16 2016-17 2017-18
Hernando 2.27 2.38 2.75
State 1.17 1.21 1.28
Discipline risk ratios by racial/ethnic group are calculated for students with disabilities by dividing the discipline rate of a specific racial/ethnic group by the rate of all students without disabilities. A risk ratio of 1.0 indicates that, for instance, Hispanic students with disabilities are equally likely to be suspended/expelled as all students without disabilities. The resulting risk ratios are reported for students with disabilities by race/ethnicity for the state and district during the 2017-18 school year. Blank cells indicate that there are less than 10 students with disabilities for a specific racial/ethnic group suspended/expelled for greater than 10 days.
Discipline Risk Ratios by Race/Ethnicity
State District
White 1.06 2.82
Black 2.43 5.58
Hispanic 0.62 1.52
Asian 0.41
American Indian/Alaskan Native 1.23
Native Hawaiian/Other Pacific Island 0.00
Two or more races 1.49
If an additional calculation reveals that incidents of removal of students with disabilities of any race through in-school suspension, out-of-school suspension, or expulsion are at least 3.5 times more likely to
Hernando Profile, Page 6

Florida Department of Education
occur when compared to all other races combined, the district will be required to set aside IDEA funds for coordinated early intervening services.
Section Three: Prevalence
Indicators relative to the prevalence of students with disabilities include the percentage of students evaluated within 60 days, student membership by racial/ethnic category, and risk ratios of racial/ethnic groups being identified as disabled.
Evaluation within 60 Days: The number of students who were evaluated within 60 days of receipt of parent consent divided by the total number of students with parental consent to evaluate in a given school year as reported via school district survey. The data are reported for 2015-16 through 2017-18.
Students Evaluated within 60 Days of Receipt of Parent Consent
2015-16 2016-17 2017-18
Hernando 96% 93% 96%
Enrollment Group 99% 98% 99%
State 97% 97% 98%
Student Membership by Racial/Ethnic Category: Racial/ethnic membership data for all students and students with disabilities are presented for the state and district as reported in October 2018 (survey 2).
All Students
State District
White 37% 63%
Black 22% 8%
Hispanic 34% 22%
Asian 3% 2%
American Indian/Alaskan Native <1% <1%
Native Hawaiian/Other Pacific Island <1% <1%
Two or more races 4% 5%
Students with Disabilities
State District
White 38% 62%
Black 25% 10%
Hispanic 32% 22%
Asian 1% <1%
American Indian/Alaskan Native <1% <1%
Native Hawaiian/Other Pacific Island <1% <1%
Two or more races 4% 5%
Selected Disabilities by Racial/Ethnic Category: Racial/ethnic data for students with a primary disability of SLD, EBD, and intellectually disabled (IND) are presented for the state and district as reported in October 2018 (survey 2).
Hernando Profile, Page 7

LEA Profile 2019
SLD, EBD, and IND Students
State SLD
District SLD
State EBD
District EBD
State IND
District IND
District All Disabled
Students
White 34% 59% 36% 61% 32% 55% 62%
Black 27% 13% 38% 20% 36% 12% 10%
Hispanic 35% 23% 20% 13% 27% 24% 22%
Asian <1% <1% <1% <1% 2% 3% <1%
American Indian/Alaskan Native
<1% <1% <1% <1% <1% <1% <1%
Native Hawaiian/Other Pacific Island
<1% <1% <1% <1% <1% <1% <1%
Two or more races 3% 5% 5% 6% 3% 5% 5%
Risk Ratios For Students Placed in Exceptional Education: The risk that students of a given race will be identified as a student with a disability or a student in selected disability categories when compared to students of all other races. A risk ratio of 1.0 indicates the students of a given race are equally likely as all other races combined to be identified as disabled. The data are presented for all students with a disability, students who are identified as IND, EBD, or SLD, and students who are identified as having autism spectrum disorder (ASD), speech or language impairments (SI-LI), other health impaired, or homebound or hospitalized (OHI-HH). The data are presented for the district and the state as reported in October 2018 (survey 2). A blank cell indicates less than 30 students of a specific race/ethnicity with the given disability.
State
IND EBD ASD SI-LI OHI-HH SLD All
Disabled
White 0.78 0.97 1.09 1.28 1.27 0.87 1.02
Black 1.97 2.10 0.81 1.06 1.02 1.36 1.18
Hispanic 0.73 0.51 1.05 0.77 0.86 1.03 0.91
Asian 0.64 0.10 1.05 0.60 0.26 0.28 0.49
American Indian/Alaskan Native 1.22 1.23 0.76 1.09 0.97 1.19 1.08
Native Hawaiian/Other Pacific Island 0.77 0.93 0.49 0.61 0.69
Two or more races 0.84 1.37 1.08 1.11 1.01 0.88 1.00
District
IND EBD ASD SI-LI OHI-HH SLD All
Disabled
White 0.71 0.89 1.14 1.01 1.03 0.83 0.94
Black 1.16 1.82 1.30
Hispanic 1.18 0.98 1.02 1.12 1.08 1.04
Asian
American Indian/Alaskan Native
Native Hawaiian/Other Pacific Island
Two or more races 0.82 0.92 0.94
Any risk ratio for students placed in exceptional education or placed in programs for SLD, IND, EBD, ASD, OHI, or SI-LI that is at least 3.5, will result in the district being required to set aside IDEA funds for coordinated early intervening services.
Hernando Profile, Page 8

Florida Department of Education
Section Four: Parent Involvement
Parent Survey: The parent involvement rate is the number of parents who perceive that schools facilitated parent involvement as a means of improving services and results for children with disabilities, divided by the total number of responding parents. These data are reported for parents of preschool children with disabilities and parents of children with disabilities in grades K-12 for 2015-16 through 2017-18. Preschool
2015-16 2016-17 2017-18
Hernando 61% 51% 74%
Enrollment Group 72% 71% 84%
State 73% 73% 83%
Grades K-12
2015-16 2016-17 2017-18
Hernando 70% 68% 83%
Enrollment Group 77% 80% 82%
State 77% 78% 80%
Hernando Profile, Page 9

0
Florida Department of Education Bureau of Exceptional Education and Student Services
Hernando 2019 Performance Report
Richard Corcoran Commissioner
Performance Report for selected State Performance Plan (SPP) Indicators
The following table includes selected state performance plan indicators, the state targets for 2017-18 for these indicators, district, data, and whether or not the district met the target. Because rounding is not used in determining if targets have been met, LEA data contain as many decimal places as needed to determine if the target has been met. Unless otherwise noted in the description, data are for 2017-18.
SPP Indicator Description LEA Data SEA Target
Target Met
1. Graduation rate* 2016-17
Percent of students with IEPs graduating with a standard diploma. (2016-17)* 68.16% 60.3% Y
2. Dropout Rate* 2016-17
Percent of students with IEPs dropping out. (2016-17)* 28.00% 11.7% N
3. Participation and performance of children with disabilities on statewide assessments
Percent of students with IEPs in grades three through ten that participate in statewide assessment for reading. 94.31% 99.0% N
Percent of students with IEPs in grades three through ten that participate in statewide assessment for math. 94.96% 99.0% N
Percent of students with IEPs in grades three through ten that demonstrate proficiency in reading. 21.09% 61.0% N
Percent of students with IEPs in grades three through ten that demonstrate proficiency in math. 29.26% 61.0% N
4. Rates of suspension and expulsion* (Risk Ratio Threshold <=3.0) 2016-17
Risk Ratio for significant discrepancy in the rates of suspensions and expulsions for students with IEPs compared to students without disabilities.** 2.38
3
Y
Percent of districts identified by the state as having both (a) a significant discrepancy in the rates of suspensions and expulsions of students with IEPs by race or ethnicity for greater than 10 days and (b) policies, procedures or practices that contribute to the significant discrepancy and do not comply with requirements relating to the development and implementation of IEPs, the use of positive behavioral interventions and supports, and procedural safeguards.**
0% Y

Florida Department of Education
SPP Indicator Description LEA Data SEA Target
Target Met
5. Least Restrictive Environment (LRE), children aged 6-21
Percent of students with IEPs aged 6 to 21 years served inside the regular class 80% or more of the day. 77.80% 83.0% N
Percent of students with IEPs aged 6 to 21 years served inside regular class less than 40% of the day. 15.38% 7.0% N
Percent of students with IEPs aged 6 to 21 years served in separate schools, residential facilities, or homebound or hospital placements.
0.00% 1.25% Y
6. Least Restrictive Environment, children aged 3-5
Percent of children with disabilities aged 3 to 5 attending regular early childhood program and receiving the majority of special education and related services in a regular early childhood program.
29.61% 48.0% N
Percent of children with disabilities aged 3 to 5 attending a separate special education class, separate school, or residential facility.
36.70% 46.3% Y
7. Prekindergarten Performance
Percent of children with disabilities, aged 3 to 5, who entered preschool below grade expectations and increased their growth in positive social emotional skills by the time they exited the preschool program. (A1)
86.96% 70.6% Y
Percent of children with disabilities, aged 3 to 5, who entered preschool below grade expectations and increased their growth in acquisition and use of knowledge and skills by the time they exited the preschool program. (B1)
69.57% 70.9% N
Percent of children with disabilities, aged 3 to 5, who entered preschool below grade expectations and increased their growth in use of appropriate behaviors to meet their needs by the time they exited the PK program. (C1)
84.21% 62.4% Y
Percent of children with disabilities, aged 3 to 5, who were functioning within age expectations in positive social emotional skills by the time they turned 6 years of age or exited the preschool program. (A2)
84.18% 84.4% N
Percent of children with disabilities, aged 3 to 5, who were functioning within age expectations in acquisition and use of knowledge and skills by the time they turned 6 years of age or exited the preschool program. (B2)
73.42% 75.9% N
Percent of children with disabilities, aged 3 to 5, who were functioning within age expectations in use of appropriate behaviors to meet their needs by the time they turned 6 years of age or exited the preschool program. (C2)
78.48% 81.5% N
8. Parent Involvement Percent of parents with a preschool child receiving special education services that reported schools facilitating parent involvement as a means of improving services and results for students with IEPs.
74.4% 85.0% N
Percent of parents with a child in grades K through 12 receiving special education services that reported schools facilitated parent involvement as a means of improving services and results for students with IEPs.
83.0% 85.0% N
2 | P a g e Hernando 2019 Performance Report

Florida Department of Education
SPP Indicator Description LEA Data SEA Target
Target Met
9. Disproportionate representation in special education**
Percent of students with disproportionate representation of racial and ethnic groups in special education and related services, the disproportionality can be attributed to inappropriate identification.
0.0% Y
10. Disproportionate representation in specific disability categories**
Percent of districts with disproportionate representation of racial and ethnic groups in special education and related services, the disproportionality can be attributed to inappropriate identification.
0.0% Y
11. Evaluation within 60 days
Percent of students referred, with parental consent, for evaluation who were evaluated within 60 calendar days of receiving parental consent for initial.
96.31% 100.0% N
12. Part C Children eligible for Part B who have IEPs developed and implemented by their third birthday.
Percent of children served and referred by part C prior to age 3, who were found eligible for Part B, and have an IEP developed and implemented by their third birthday.
100.00% 100.0% Y
13. Transition IEP compliance
Percent of students with IEPs aged 16 and above who have an IEP that includes appropriate measurable postsecondary goals that are annually updated and based upon an age appropriate transition assessment, transition services, including courses of study, that will reasonably enable the student to meet those postsecondary goals, and annual IEP goals related to the student’s transition services needs.
100.00% 100.0% Y
14. Postschool outcomes
Percent of students who exited secondary school in 2016-17 and had an IEP in effect at the time they left school, were found enrolled in higher education within one year of leaving high school.
18.67% 37.0% N
Percent of students who exited secondary school in 2016-17 and had an IEP in effect at the time they left school, were found enrolled in higher education or were competitively employed within one year of leaving high school.
43.37% 50.0% N
Percent of students who exited secondary school in 2016-17 and had an IEP in effect at the time they left school, were found enrolled in higher education or in some other postsecondary education or training program; or were competitively employed or in some other employment within one year of leaving high school.
53.01% 66.0% N
* For SPP Indicators 1, 2, and 4, the data lag one year, meaning that data are from the 2016-17 school year, although more recent data may be available.
** For SPP Indicators 4b, 9, and 10, an “N” in the “Target Met” Column means that a district’s data contributed to Florida not making the state target.
3 | P a g e Hernando 2019 Performance Report