Embed Size (px)
Citation preview

2019 HALF-YEAR REPORT EXTRACT

1. STATEMENTS OF COMPREHENSIVE INCOME
1.1 CONSOLIDATED INCOME STATEMENT
In € thousands 2018 H1 2018 H1 2019
Net Sales 1 883 578 941 458 1 163 487 Cost of goods & services sold -1 569 798 -787 809 -971 099 Research & development costs -23 908 -11 631 -14 576 Selling, marketing and service expenses -105 116 -51 499 -58 339 Administrative expenses -56 152 -27 973 -29 505 Other operating income and expenses 736 498 103
RECURRING OPERATING INCOME 129 341 63 045 90 071
Other non-recurring income and expenses -3 237 -1 121 -945
OPERATING INCOME 126 104 61 924 89 126
Share of profits of associates 2 326 1 017 957
OPERATING INCOME INCLUDING NET INCOME FROM ASSOCIATES 128 431 62 941 90 082
Financial income 24 698 15 162 24 094 Financial expenses -30 673 -18 711 -26 736 Net financial expenses -5 974 -3 550 -2 641
CONSOLIDATED INCOME (LOSS) BEFORE TAX 122 456 59 391 87 439
Income taxes -38 103 -18 377 -27 359
NET INCOME (LOSS) 84 354 41 014 60 079
Attributable to equity holders of the Parent 84 109 40 710 59 742 Attributable to minority interests 245 304 337
1.2 EARNINGS PER SHARE (IN EUROS)
2018 H1 2018 H1 2019 Net income (loss) attributable to the equity holders of the Parent 2,20 1,06 1,56 Diluted earnings per share 2,20 1,06 1,56
1 2019 Half-year financial report extract I Manitou Group
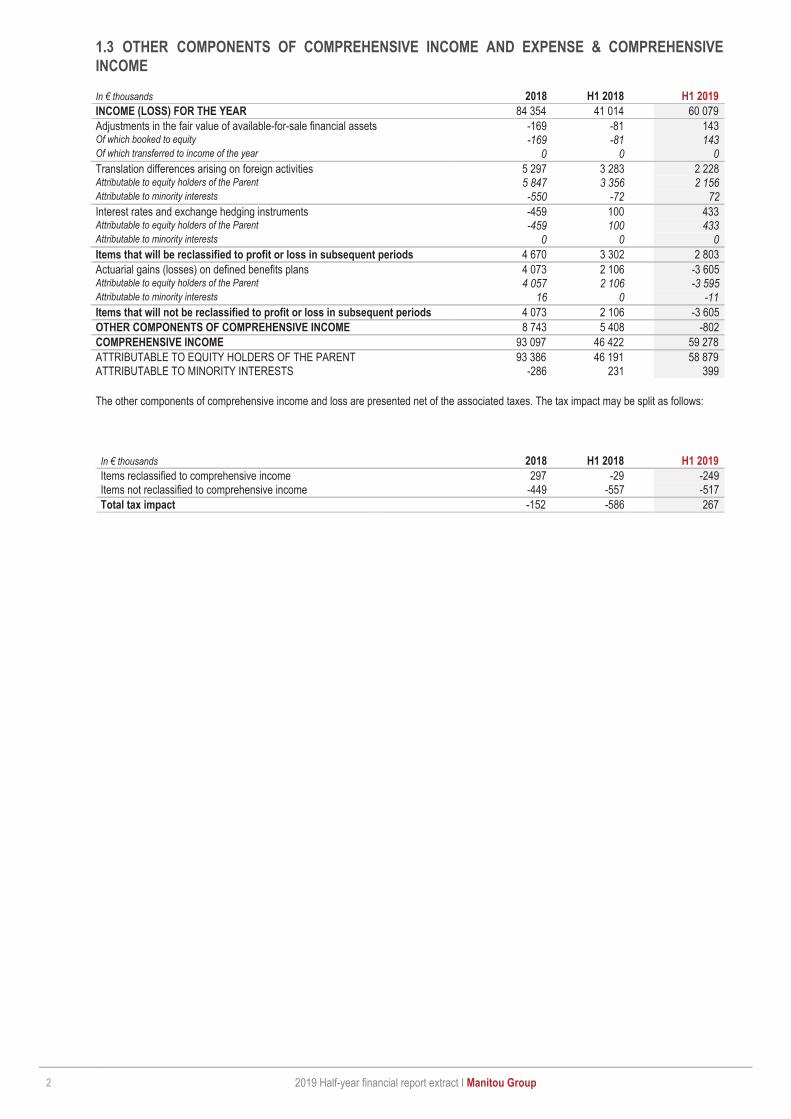
1.3 OTHER COMPONENTS OF COMPREHENSIVE INCOME AND EXPENSE & COMPREHENSIVE
INCOME In € thousands 2018 H1 2018 H1 2019
INCOME (LOSS) FOR THE YEAR 84 354 41 014 60 079
Adjustments in the fair value of available-for-sale financial assets -169 -81 143 Of which booked to equity -169 -81 143 Of which transferred to income of the year 0 0 0
Translation differences arising on foreign activities 5 297 3 283 2 228 Attributable to equity holders of the Parent 5 847 3 356 2 156 Attributable to minority interests -550 -72 72
Interest rates and exchange hedging instruments -459 100 433 Attributable to equity holders of the Parent -459 100 433 Attributable to minority interests 0 0 0
Items that will be reclassified to profit or loss in subsequent periods 4 670 3 302 2 803
Actuarial gains (losses) on defined benefits plans 4 073 2 106 -3 605 Attributable to equity holders of the Parent 4 057 2 106 -3 595 Attributable to minority interests 16 0 -11
Items that will not be reclassified to profit or loss in subsequent periods 4 073 2 106 -3 605
OTHER COMPONENTS OF COMPREHENSIVE INCOME 8 743 5 408 -802
COMPREHENSIVE INCOME 93 097 46 422 59 278
ATTRIBUTABLE TO EQUITY HOLDERS OF THE PARENT 93 386 46 191 58 879 ATTRIBUTABLE TO MINORITY INTERESTS -286 231 399
The other components of comprehensive income and loss are presented net of the associated taxes. The tax impact may be split as follows:
In € thousands 2018 H1 2018 H1 2019
Items reclassified to comprehensive income 297 -29 -249 Items not reclassified to comprehensive income -449 -557 -517
Total tax impact -152 -586 267
2 2019 Half-year financial report extract I Manitou Group

2. CONSOLIDATED STATEMENT OF FINANCIAL POSITION
ASSETS
Net Amount In € thousands 31.12.2018 30.06.2019
NON-CURRENT ASSETS
PROPERTY, PLANT AND EQUIPMENT 175 652 186 641 GOODWILL 288 288 INTANGIBLE ASSETS 43 333 47 823 RIGHT OF USE 14 421 INVESTMENTS IN ASSOCIATES 18 008 16 495 NON-CURRENT FINANCE CONTRACT RECEIVABLES 8 210 10 126 DEFERRED TAX ASSETS 16 588 16 660 NON-CURRENT FINANCIAL ASSETS 8 708 7 578 OTHER NON-CURRENT ASSETS 375 410
271 162 300 440
CURRENT ASSETS INVENTORIES & WORK IN PROGRESS 574 640 614 387 TRADE RECEIVABLES 361 685 438 552 CURRENT FINANCE CONTRACT RECEIVABLES 2 487 2 OTHER RECEIVABLES
Current income tax 5 858 1 692 Other receivables 41 538 39 075
CURRENT FINANCIAL ASSETS 4 412 4 365 CASH AND CASH EQUIVALENTS 27 623 93 679
1 018 243 1 191 752
NON CURRENT ASSETS AND DISPOSAL GROUP HELD FOR SALE 215 0
TOTAL ASSETS 1 289 620 1 492 192
LIABILITIES & EQUITY Net Amount In € thousands 31.12.2018 30.06.2019
Share capital 39 668 39 668 Share premiums 46 098 46 098 Treasury shares -24 018 -23 958 Consolidated reserves 442 629 493 247 Translation differences 3 903 5 583 Net profit (loss) – Equity holder of the Parent 84 109 59 742
SHAREHOLDERS’ EQUITY 592 389 620 381
MINORITY INTERESTS 4 585 4 989
TOTAL EQUITY 596 974 625 369
NON-CURRENT LIABILITIES NON-CURRENT PROVISIONS 45 368 48 632 OTHER NON-CURRENT LIABILITIES 3 101 3 283 DEFERRED TAX LIABILITIES 1 144 1 209 NON-CURRENT FINANCIAL LIABILITIES
Loans and other financial liabilities 38 477 151 389 NON-CURRENT RENTAL LIABILITIES 10 193
88 090 214 706
CURRENT LIABILITIES
CURRENT PROVISIONS 15 086 16 418 TRADE ACCOUNTS PAYABLE 292 715 325 564 OTHER CURRENT LIABILITIES
Current income tax 6 457 16 498 Other liabilities 148 640 155 648
CURRENT FINANCIAL LIABILITIES 141 658 132 080 CURRENT RENTAL LIABILITIES 5 908
604 556 652 116
TOTAL EQUITY & LIABILITIES 1 289 620 1 492 192
3 2019 Half-year financial report extract I Manitou Group

3. CONSOLIDATED SHAREHOLDERS’ EQUITY AS AT JUNE 30, 2019
I n € thousands
Share Capital
Share pre-
miums
Treasury shares
Reserves Group net profit
Translation differences
Reva- luation
surplus
TOTAL SHARE- HOLDERS’
EQUITY (Group share)
Minority interests
TOTAL EQUITY
Balance at 31.12.2017 39 622 45 529 -24 305 412 858 59 955 -3 440 908 531 126 1 974 533 100
Income for the year 2017 59 955 -59 955 0 0 0 Income at 30.06.2018 40 710 40 710 304 41 014 Dividends -23 765 -23 765 -103 -23 868 Change in translation differences 3 356 3 356 -72 3 283 Valuation differences under IFRS 72 72 72 First time application IFRS 15 -4 887 -4 887 -8 -4 694 Treasury shares 19 19 19 Actuarial (gain) losses on employee benefits
2 106 2 106 2 106
Change in consolidation scope & other
46 569 -62 10 563 189 752
Shareholders’ agreements 31 31
Balance at 30.06.2018 39 688 46 098 -24 286 446 277 40 710 -75 908 549 300 2 316 551 615
Income H2 2018 43 399 43 399 -59 43 340 Dividends 12 12 1 13 Change in translation differences 2 491 2 491 -478 2 014 Valuation differences under IFRS -918 -918 -918 Treasury shares 268 268 268 Actuarial (gain) losses on employee benefits
1 951 1 951 17 1 967
Change in consolidation scope & other
-5 600 1 486 -4 114 4 062 -52
Shareholders’ agreements -1 273 -1 273
Balance at 31.12.2018 39 668 46 098 -24 018 441 722 84 109 3 903 908 592 389 4 585 596 974
Income for the year 2018 84 109 -84 109 0 0 0 Income at 30.06.2019 59 742 59 742 337 60 079 Dividends -29 763 -29 763 -104 -29 867 Change in translation differences 2 156 2 156 72 2 228 Valuation differences under IFRS 647 647 647 First time application IFRS 15 -1 190 -1 190 -3 -1 193 Treasury shares 60 60 60 Actuarial (gain) losses on employee benefits
-3 594 -3 594 -11 -3 605
Change in consolidation scope & other
407 -475 -68 -345 -413
Shareholders’ agreements 458 458
Balance at 30.06.2019 39 668 46 098 -23 958 492 340 59 742 5 583 908 620 381 4 989 625 369
4 2019 Half-year financial report extract I Manitou Group

4. CASH FLOW STATEMENT AS AT JUNE 30, 2019
In € thousands 2018 H1 2018 H1 2019
INCOME (LOSS) FOR THE YEAR 84 354 41 014 60 079
Less share of profits of associates -2 326 -1 017 -957 Elimination of income and expense with no effect on operating cash flow and not linked to operating activities
+ Amortization and depreciation 35 925 17 748 21 397 - Provisions and impairment 728 2 607 1 885 - Change in deferred taxes 2 662 1 895 408 +/- Income (loss) from non-current asset disposal -47 -32 114 +/- Other 1 207 34 485
EARNINGS BEFORE DEPRECIATION AND AMORTIZATION 122 502 62 249 83 412
Changes in cash flows from operating activities +/- Change in inventories -114 396 -28 767 -32 230 +/- Change in trade receivables -35 548 -50 720 -75 571 +/- Change in finance contracts receivables -5 999 -4 177 797 +/- Change in other operating receivables -9 756 -3 404 2 643 +/- Change in trade accounts payable 35 450 55 218 31 910 +/- Change in other operating liabilities 18 534 1 829 6 850 +/- Change in taxes payable and receivable 3 648 5 322 14 194 +/- Change in liabilities linked to finance contracts receivables 0 0 0 Change in capitalised leased machines -19 146 -6 194 -11 332
CASH FLOW FROM OPERATING ACTIVITIES -4 712 31 357 20 672
Changes in cash flows from investing activities + Proceeds from sale of property, plant and equipment 165 67 469 + Proceeds from sale of long-term investments -35 -57 506 - Purchase of intangible assets, property, plant and equipment (excl. rental fleet) -46 412 -18 825 -28 674 - Decrease (increase) of other financial assets -132 -97 -935 +/- Acquisition of subsidiaries or minority interests 63 137 -459 - Increase in capital of associates 0 0 0 + Dividends received from associates 4 886 4 903 2 454
CASH FLOW FROM INVESTING ACTIVITIES -41 464 -13 872 -26 638
Changes in cash flows from financing activities + Increase in capital 615 615 0 - Capital reduction - Dividends paid -23 855 -23 868 -29 866 +/- Purchase / sale of treasury shares -65 0 -163 +/- Change in financial liabilities 30 805 -26 032 98 873 Of which loans taken during the year 40 087 17 148 855 Of which loans repaid during the year -9 282 -26 049 -49 982 +/- Other 4 630 3 012 -3 929
CASH FLOW FROM FINANCING ACTIVITIES 12 130 -46 272 64 914
NET INCREASE (DECREASE) IN CASH, CASH EQUIVALENTS, AND BANK OVERDRAFTS
-34 046 -28 787 58 948
Cash, cash equivalents and bank overdrafts at beginning of the year 34 135 34 135 -609 Exchange gains (losses) on cash and bank overdrafts -698 478 467
CASH, CASH EQUIVALENTS, AND BANK OVERDRAFTS AT END OF THE YEAR -609 5 826 58 806
5 2019 Half-year financial report extract I Manitou Group

5. EXTRACT FROM THE NOTES TO THE CONSOLIDATED FINANCIAL
STATEMENTS AS AT 30 JUNE 2019
FIRST-TIME APPLICATION OF NEW STANDARDS Standards, interpretations and amendments to existing and applicable standards, which are mandatory from 2019, do not have a material impact on the Group's financial statements, with the exception of IFRS 16. IFRS 16 “Leases” modifies the accounting treatment of leases by lessees. It replaces IAS 17 and IFRIC 4, SIC 15 and SIC 27 interpretations. IFRS 16, applied from January 1, 2019, requires lessees to apply a single method of accounting for leases. The Group has applied the simplified retrospective method with the calculation of the right of use from the outset for contracts ongoing on January 1, 2019. The cumulative effect of the initial application was recognized as of January 1, 2019. The Group thus reduced its opening equity by €1.2 million, net of deferred taxes, to reflect the cumulative effect of the first application of the standard. The application of IFRS 16 generated an increase in net debt of €15.5 million and right of use of €13.9 million. In the first half of 2019, current operating income improved by €0.5 million and financial income deteriorated by €0.6 million. The main quantitative and qualitative impacts resulting from the application of this standard are detailed below.
IMPACT OF THE APPLICATION OF IFRS 16 ON THE FINANCIAL STATEMENTS
ACCOUNTING PRINCIPLES
The Group now assesses if a contract is or contains a lease based on the new definition of a lease. Under IFRS 16, a contract or part of a contract is or contains a lease if it grants the right to control the use of an identified asset for a specified period of time in exchange for consideration. When concluding or reassessing a contract with a rental component, the Group allocates the remuneration provided in the contract to each component, lease and non-lease, on the basis of their separate relative price. The Group recognises a "right of use" and a rental liability at the start date of the lease. The "right of use" is initially measured at cost and subsequently at cost less any accumulated depreciation and impairment. The amount can be adjusted according to certain revaluations of the rental liability. Rental debt is initially measured at the discounted value of rents due but not yet paid at the start date of the contract. The discount rate used corresponds to the implicit interest rate of the contract or, if it cannot be easily determined, to the marginal borrowing rate of each subsidiary. It is the latter rate that the Group generally uses as discount rate. The rental debt is then increased by the interest expense and reduced by the amounts of rent paid. It is revalued in the event of a change in future rents following a change in index or rate, a new estimate of the amount to be paid under a residual value guarantee or, where applicable, a revaluation of the exercise of a call or extension option or the non-exercise of a termination option (which then becomes reasonably certain). The income statement is also impacted. Lessees recognize an amortization expense for the right of use and an interest expense, instead of operating expenses. The Group has reviewed its leases in order to analyse them in the light of the criteria for operating leases under IFRS 16. In accordance with the exemptions provided by the standard, the Group has excluded short-term contracts (less than 12 months) and contracts with a low asset value (less than €5,000). The contract term corresponds to the non-cancellable contractual period of use of the asset, taking into account, renewal options with a reasonably certain exercice. The option to apply IFRS 16 to leases of intangible assets has not been adopted by the Group.
IMPACTS ON THE FINANCIAL STATEMENTS
Impacts on the transition
As part of the transition to IFRS 16, the Group recognised "right of use" and additional rental liabilities in the balance sheet, with the difference recognised in retained earnings. The effects of the transition are summarized below:
In € thousands January 1st, 2019
Right of use 13 903
Deferred tax - Asset 378 Lease Liabilities 15 474 Retained Earnings -1 190
6 2019 Half-year financial report extract I Manitou Group

The book value of the right of use can be broken down as follows (data in thousands of euros).
Impact on the financial statements for the period
H1 2019
MHA CEP S&S TOTAL
In € thousands
Material Handling and
Access
Compact Equipment
Products Services &
Solutions
Cancellation of the cost of rent on contracts previously classified as operating leases
1 420 703 1 163 3 286
Amortizations - Right of use -1 167 -593 -1 001 -2 761 Financial expenses IFRS 16 -203 -285 -72 -560 TOTAL NET IMPACT BEFORE TAX 50 -175 90 35
SCOPE OF CONSOLIDATION: HMME - Hangzhou Manitou Machinery Equipment
The Group completed the sale of its stake in HMME (Hangzhou Manitou Machinery Equipment Co Ltd.) in March 2019. This sale concerns a company that has been virtually dormant for several years and doesn't concern the partnership that the Manitou group has with the Hangcha group on the design and assembly of industrial forklifts. The HMME shares were classified separately on the line "Assets held for sale" and had been valued at the lower of the accounting value or estimated selling price, net of costs relating to the sale. This transaction has no impact on the results for the first half of 2019.
FINANCING In June 2019, Manitou BF finalized a new €105 million corporate bond issue. The bonds are divided into 3 tranches with 6, 7 and mainly 8 years maturities. This private placement, concluded on favourable terms for Manitou Group, allows it to extend the maturity of its debt and pursue its strategy of diversifying its financing sources. The product of these issues will be used to refinance the existing bond debt in the long term and will be used mainly for the company's development.
7 2019 Half-year financial report extract I Manitou Group
FOLLOW-UP OF THE INFRINGEMENT LITIGATION
JCB Litigation
In May 2017, the Manitou group was summoned by the company JC Bamford Excavators Limited (JCB): in France (Manitou BF), in the United
Kingdom (Manitou BF & Manitou UK) and in Italy (Manitou Italia) for the alleged infringement of two European Patents relating to certain features
concerning the overload cut-off control system incorporated in certain telescopic forklifts manufactured and/or marketed in these three countries.
In financial respect, the applicant was demanding in May 2017 before the French court a provision of 20 million euros, to be adjusted, increased
in June 2018 by JCB to 50 million euros. Its financial claims before the English court were not calculated and they still are not on the date of
publication of this report, but the summons indicates for procedural purposes the commercial value of the claim is estimated at an amount
greater than 10 million pounds Sterling. For Italy, the summons does not specify any calculated claim.
1. In France, the legal proceeding regarding these disputes continued during the year 2019.
In the context of a procedural incident, JCB applied for interim injunctive relief against Manitou BF. A decision was rendered by the discovery
judge on 31 January 2019 who dismissed JCB’s application for a preliminary injunction regarding the first patent, on which JCB bases its
allegations and, concerning the second patent, preliminary injunction against Manitou BF from manufacturing, offering for sale, leasing and
holding a former configuration of certain Manitou telescopic forklifts. This decision has no impact on the activity of Manitou BF insofar as it
concerns the control system incorporated in certain models produced and sold before August 2017 which are thus no longer manufactured by
Manitou BF to date, which was emphasised by the ordinance. Manitou BF appealed this decision.
On the occasion of the same incident, Manitou BF had proposed on a subsidiary basis if the judge were to consider the interim injunctive relief
well founded, the putting in place of the injunctive relief of a bank guarantee of 470,000 euros for the two patents. This proposal has become
irrelevant for the first patent, for which the judge has not declared a preliminary injunction. JCB produced an expert assessment evaluating its
loss at 160 million euros (for both patents) in support of an application that the guarantee, if it were ordered, would be for 30 million euros (also
for both patents). This proposal was not upheld by the judge, nor was JCB’s application for a penalty of 100,000 euros per day of delay, since
the penalty pronounced by the judge was 1,000 euros per offence, and the decision emphasised that the loss alleged by JCB concerns only the
overload cut-off control system and not the machine in its entirety.
The proceeding on the merits continues before the Tribunal de Grande Instance of Paris.
2. In the United Kingdom, the proceeding progressed during the year 2019 and a hearing on procedure (“Case Management Conference”) was
held in January 2019 after JCB ultimately carried out the due diligence incumbent upon it. The schedule for the legal dispute during 2019-2020
was established and the trial was set for pleading in October 2020.
3. In Italy, the proceeding also continues on the merits but remains in a preliminary phase.
4. Then, in December 2018, JCB served on the Manitou group a new summons for infringement involving a third patent in France (Manitou BF)
and in the United Kingdom (Manitou BF and Manitou UK) and still relating to certain features concerning the overload cut-off control system for
certain telescopic forklifts manufactured and/or marketed in these two countries. That summons reproduces the request for a provision in the
amount of 50 million euros submitted in the first proceeding brought in France by JCB. It was the subject of a joining of proceedings in the United
Kingdom but remains separated in France.
5. Lastly, in April 2019, JCB submitted an application for a preliminary injunction against a model of articulated loader manufactured by the
Italian subsidiary of the MANITOU group in Italy (Manitou Italia), based on the third patent and one of the patents already opposed on the merits
in Italy. That proceeding is pending.
The Manitou group remains in full disagreement with the allegations of JCB and continues its defence as vigorously as possible.
In the current status of the proceedings, the financial risk likely to be incurred is difficult to estimate reliably. In addition, significant outgoing
resources for these claims seem unlikely in consideration of the facts put forward by the Manitou group to defend itself. Consequently, no
provision for these claims was recorded in the group's accounts.
INFORMATION ON OPERATING SEGMENTS The Group is organized around three divisions, two product divisions and a service division: - The MHA - Material Handling and Access product division: its mission is to optimize the development and production of telehandlers, rough-terrain and industrial forklifts, truck-mounted forklifts and aerial working platforms branded Manitou. - The CEP - Compact Equipment Products division optimizes the development and production of skidsteer loaders, track loaders, articulated loaders, backhoe loaders and telehandlers branded Gehl and Mustang. - The S&S - Services & Solutions, Service division includes service activities to support sales (financing approaches, warranty contracts, maintenance contracts, full service, fleet management, etc.), after-sales (parts, technical training, warranty management, fleet management, etc.) and services to end users (geo-location, user training, advice, etc.). The mission of the division is to develop service offers to meet the needs of each of our customers in our value chain and to increase resilient sales revenue for the Group.
8 2019 Half-year financial report extract I Manitou Group

These three divisions design and assemble the products and services which are distributed by the sales and marketing organisation to dealers and the group’s major accounts in 140 countries.
CONSOLIDATED INCOME STATEMENT BY DIVISION
H1 2019 MHA CEP S&S TOTAL
In € thousands
Material Handling
and Access
Compact Equipment
Products Services &
Solutions
Net sales 829 884 178 381 155 222 1 163 487 Cost of goods & services sold -705 816 -153 975 -111 309 -971 099 Research and development costs -11 155 -3 429 8 -14 576 Selling, marketing and service expenses -24 474 -9 247 -24 617 -58 339 Administrative expenses -17 235 -7 741 -4 530 -29 505 Other operating income and expense 431 -128 -199 103
RECURRING OPERATING INCOME 71 635 3 862 14 575 90 071
Impairment of assets 339 0 0 339 Other non-recurring income and expense -942 -194 -149 -1 284
OPERATING INCOME 71 032 3 668 14 426 89 126
Share of profits of associates 0 0 957 957
OPERATING INCOME INCLUDING NET INCOME FROM ASSOCIATES 71 032 3 668 15 383 90 082
H1 2018 MHA CEP S&S TOTAL
In € thousands
Material Handling
and Access
Compact Equipment
Products Services &
Solutions
Net sales 653 364 151 463 136 631 941 458 Cost of goods & services sold -557 082 -131 475 -99 252 -787 809 Research and development costs -9 686 -1 945 -11 631 Selling, marketing and service expenses -23 089 -7 307 -21 103 -51 499 Administrative expenses -16 057 -6 926 -4 989 -27 973 Other operating income and expense 706 -165 -43 498
RECURRING OPERATING INCOME 48 157 3 644 11 243 63 045
Impairment of assets -339 -339 Other non-recurring income and expense -604 -92 -86 -782
OPERATING INCOME 47 214 3 553 11 157 61 924
Share of profits of associates 16 1 001 1 017
OPERATING INCOME INCLUDING NET INCOME FROM ASSOCIATES 47 230 3 553 12 158 62 941
CONSOLIDATED SALES BY DIVISION AND GEOGRAPHIC REGION
H1 2019
I n € thousands Southern Europe Northern Europe Americas APAM TOTAL
MHA 328 433 382 997 57 929 60 524 829 883 CEP 10 926 21 709 124 610 21 137 178 382 S&S 58 597 49 289 26 294 21 043 155 222
TOTAL 397 956 453 994 208 834 102 703 1 163 487
H1 2018
In € thousands Southern Europe Northern Europe Americas APAM TOTAL
MHA 243 412 304 515 46 867 58 570 653 364 CEP 8 663 21 358 97 850 23 592 151 463 S&S 48 570 44 555 24 062 19 445 136 631
TOTAL 300 645 370 427 168 779 101 606 941 458
POST-CLOSING EVENTS None.
9 2019 Half-year financial report extract I Manitou Group

RÉALISATION : - RCS NANTES 500 547 260
CRÉDITS PHOTOS : GAËL ARNAUD, MANITOU GROUP IMPRESSION : GOUBAULT - CERTIFIÉ ISO 14001 IMPRIMÉ AVEC DES ENCRES VÉGÉTALES SUR PAPIER 60% RECYCLÉ, 40% FSC.
MANITOU BF SOCIÉTÉ ANONYME AU CAPITAL DE 39 621 598 € / RCS NANTES B857 802 508 / SIRET 857 802 508 00047 / APE 292 D / APE - NAF 2822Z
S I È G E S O C I A L
430, rue de l’Aubinière BP 10249 44158 Ancenis cedex - France
T +33 (0)2 40 09 10 11
W W W . M A N I T O U - G R O U P . C O M
@GroupManitou
fr.linkedin.com/company/manitou-bf