Embed Size (px)
Citation preview

2019 FULL YEAR RESULTS PRESENTATIONREVENUE ACCELERATION, ROBUST EPS GROWTH, STRONG CASH AND HIGHER ROIC3 March 2020

CAUTIONARY STATEMENT REGARDING FORWARD-LOOKING STATEMENTS
This presentation contains certain forward-looking statements with respect to the financial condition, results, operations and business of Intertek Group plc. These statements and forecasts involve risk and uncertainty because they relate to events and depend upon circumstances that will occur in the future. There are a number of factors that could cause actual results or developments to differ materially from those expressed or implied by these forward-looking statements and forecasts. IFRS 16 was adopted on 1 January 2019 for our statutory reporting, without restating prior year figures. As a result, the discussion of our operating results is on an IAS 17 basis for all periods presented, unless otherwise stated.Nothing in this presentation should be construed as a profit forecast.
3 March 2020
2
0501 03Performance
Highlights
02 042019 Financial
Results 5+5 Strategy
Review 2020 Outlook Conclusion

CONTINUOUS PROGRESS ON REVENUE, EPS, CASH AND DIVIDEND
4
2,093 2,166 2,567
2,769 2,8012,987
FY14 FY15 FY16 FY17 FY18 FY19
Revenue (£m)
324 343 410
468 482 513
FY 14 FY 15 FY 16 FY 17 FY 18 FY 19
Adjusted Operating Profit (£m)
15.5% 15.9% 16.0%16.9% 17.2%
FY 14 FY 15 FY 16 FY 17 FY 18 FY 19
Adjusted Operating Margin
132.1 140.7167.7
191.6 198.3 211.7
FY 14 FY 15 FY 16 FY 17 FY 18 FY19
Adjusted EPS (p) Free Cash Flow (£m)
+6.6%+4.8% CCR
+6.5%+5.2% CCR
+0bps+10bps CCR
+6.8%+5.2% CCR
+8.4%
17.2%
14-19 CAGR: 7.4% 14-19 CAGR: 9.6% 14-19: +170BPS
14-19 CAGR: 9.9% 14-19 CAGR: 15.5% 14-19 CAGR: +16.6%
185235
318342 351
380
FY 14 FY 15 FY 16 FY 17 FY 18 FY 19+6.8%
49.1 52.362.4
71.3
99.1 105.8
FY 14 FY 15 FY 16 FY 17 FY 18 FY 19
Dividend (p)

IMPROVED ORGANIC REVENUE GROWTH MOMENTUM IN H2
5
FY19 organic growth by division1
Note: (1) At 2019 constant currency rates
1.7%2.5%
3.4%4.0%
3.0%3.6%
H1 17 H2 17 H1 18 H2 18 H1 19 H2 19
Organic growth at constant currency
17% of
earnings
6%
0.0%
1.0%
2.0%
3.0%
4.0%
5.0%
6.0%
7.0%
0% 5% 10%
78% of
earnings
[]% of
earnings
[]%
Products: +2.3%
Trade: +4.1%
Resources: +5.7%
Organic revenue growth1 (%)
Revenue growth (%)

Note: (1) In bps and at constant currency of that year; (2) Annualised
5TH CONSECUTIVE YEAR OF MARGIN PROGRESSION AT CCR
6
Portfolio review
• Growth and margin accretive portfolio strategy Headcountreduction
Savings2
2017 400 £7m
2018 400 £7m
2019 300 £5m
Productivity management Portfolio strategy
• Monthly performance reviews for Top 30 countries/16 Business Lines
• Business Line and country benchmarking
• Site span of performance management
15.5%15.9% 16.0%
16.9% 17.2% 17.2%
FY14 FY15 FY16 FY17 FY18 FY19
Operating Margin, Actuals
20 30
110
40
10
FY15 FY16 FY17 FY18 FY19
Margin Accretion, CCR1
• Organic and inorganic investments
• Consolidation of facilities
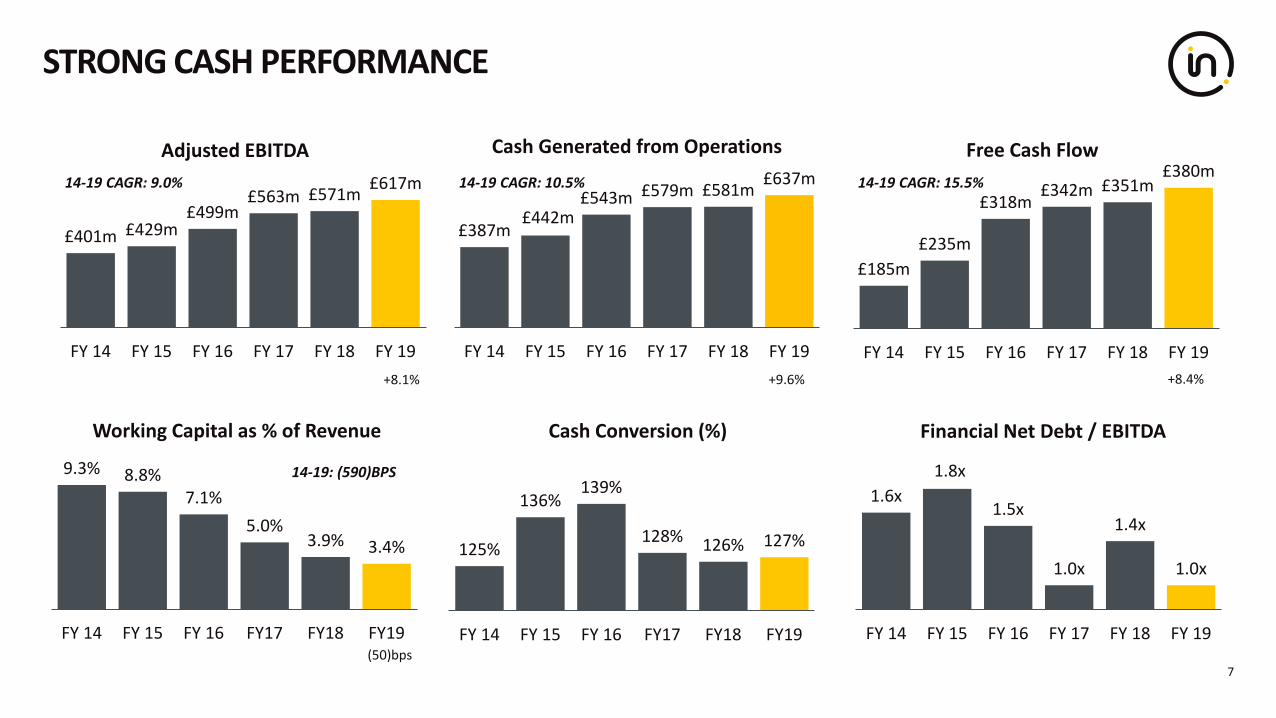
£387m£442m
£543m £579m £581m £637m
FY 14 FY 15 FY 16 FY 17 FY 18 FY 19
Cash Generated from Operations
STRONG CASH PERFORMANCE
7
9.3% 8.8%7.1%
5.0%3.9% 3.4%
FY 14 FY 15 FY 16 FY17 FY18 FY19
Working Capital as % of Revenue
1.6x1.8x
1.5x
1.0x
1.4x
1.0x
FY 14 FY 15 FY 16 FY 17 FY 18 FY 19
Financial Net Debt / EBITDA
£185m£235m
£318m£342m £351m
£380m
FY 14 FY 15 FY 16 FY 17 FY 18 FY 19
Free Cash Flow
£401m £429m£499m
£563m £571m £617m
FY 14 FY 15 FY 16 FY 17 FY 18 FY 19
Adjusted EBITDA14-19 CAGR: 9.0% 14-19 CAGR: 10.5% 14-19 CAGR: 15.5%
14-19: (590)BPS
+9.6% +8.4%
(50)bps
+8.1%
125%
136%139%
128% 126% 127%
FY 14 FY 15 FY 16 FY17 FY18 FY19
Cash Conversion (%)

0501 03Performance
Highlights
02 042019 Financial
Results 5+5 Strategy
Review 2020 Outlook Conclusion

KEY P&L FINANCIALS
9
YoY %
2019 IAS 17
Actual RatesIAS 17
Constant RatesIAS 17
2019IFRS 16
Δ versus IAS 17
Revenue £2,987.0m 6.6% 4.8% £2,987.0m -
Organic revenue1 £2,925.6m 5.1% 3.3% £2,925.6m -
Operating profit2 £513.3m 6.5% 5.2% £524.2m +£10.9m
Operating profit margin2 17.2% 0bps 10bps 17.5% +30bps
Adjusted diluted EPS2 211.7p 6.8% 5.2% 212.5p +0.8p
Notes: (1) Organic revenue excludes the impact of acquisitions and disposals in 2018 and 2019; (2) Before separately disclosed items

OPERATING MARGIN BRIDGE
17.2% 17.2%
0bps 10bps 10bps(10bps) 0bps (10bps)
13.0%
14.0%
15.0%
16.0%
17.0%
18.0%
FY 2
018
Prod
ucts
Trad
e
Reso
urce
s
Divi
siona
l mix
Excl
udin
g FX
and
Acqu
isitio
ns&
Disp
osal
s
Acqu
isitio
ns&
Disp
osal
s FX
FY 2
019
17.2%
10
0bps organic at constant rates
Note: Organic excludes the impact of acquisitions and disposals in 2018 and 2019
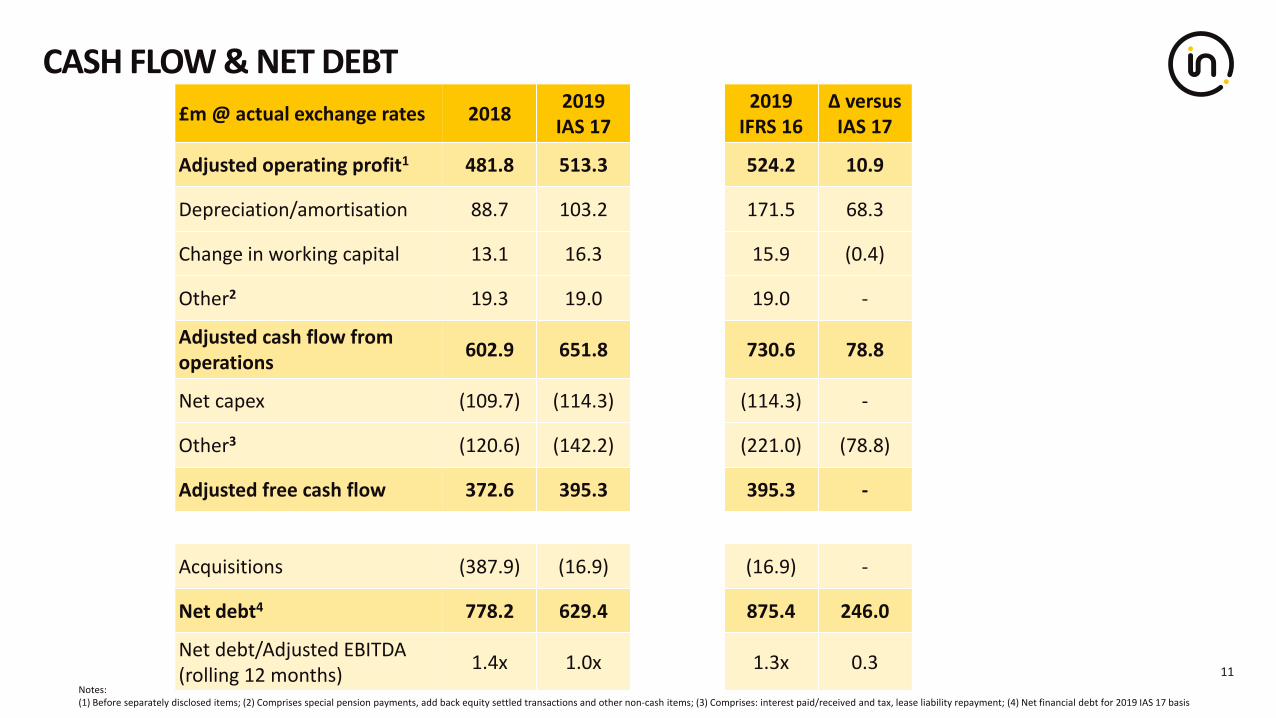
£m @ actual exchange rates 2018 2019 IAS 17
2019 IFRS 16
Δ versus IAS 17
Adjusted operating profit1 481.8 513.3 524.2 10.9
Depreciation/amortisation 88.7 103.2 171.5 68.3
Change in working capital 13.1 16.3 15.9 (0.4)
Other2 19.3 19.0 19.0 -
Adjusted cash flow from operations 602.9 651.8 730.6 78.8
Net capex (109.7) (114.3) (114.3) -
Other3 (120.6) (142.2) (221.0) (78.8)
Adjusted free cash flow 372.6 395.3 395.3 -
Acquisitions (387.9) (16.9) (16.9) -
Net debt4 778.2 629.4 875.4 246.0
Net debt/Adjusted EBITDA (rolling 12 months) 1.4x 1.0x 1.3x 0.3
CASH FLOW & NET DEBT
11Notes:(1) Before separately disclosed items; (2) Comprises special pension payments, add back equity settled transactions and other non-cash items; (3) Comprises: interest paid/received and tax, lease liability repayment; (4) Net financial debt for 2019 IAS 17 basis
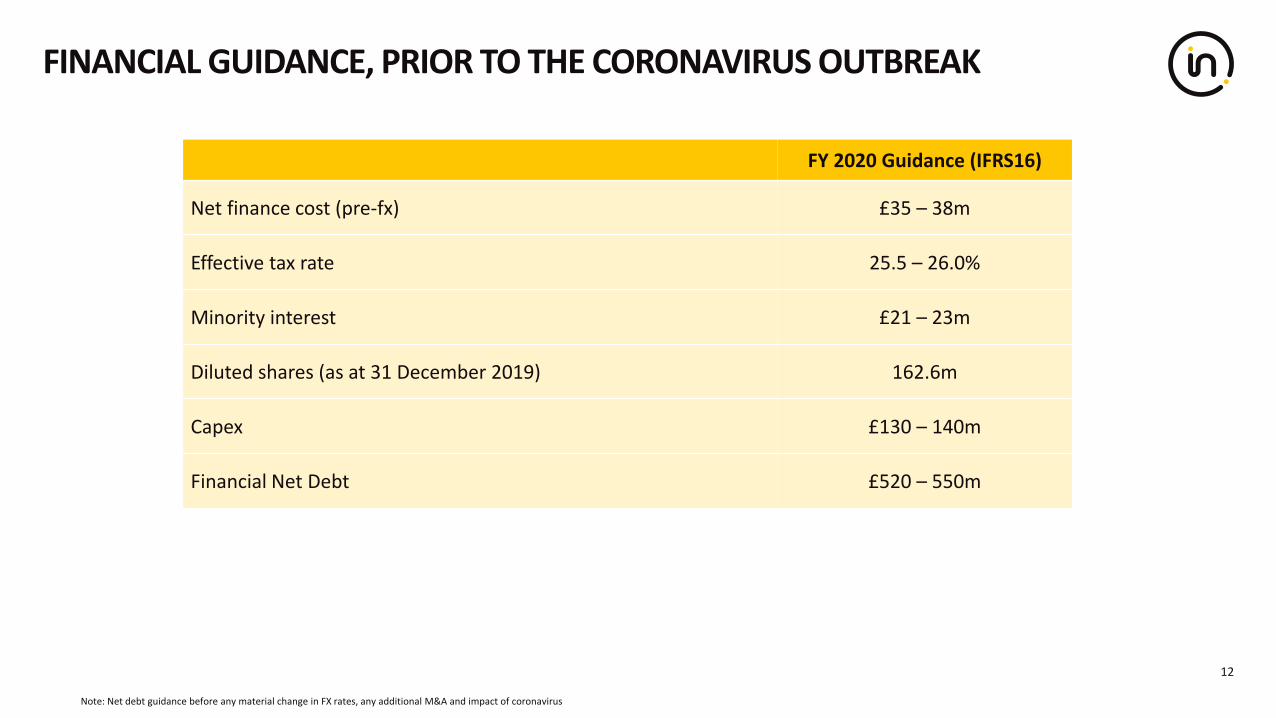
FINANCIAL GUIDANCE, PRIOR TO THE CORONAVIRUS OUTBREAK
12
FY 2020 Guidance (IFRS16)
Net finance cost (pre-fx) £35 – 38m
Effective tax rate 25.5 – 26.0%
Minority interest £21 – 23m
Diluted shares (as at 31 December 2019) 162.6m
Capex £130 – 140m
Financial Net Debt £520 – 550m
Note: Net debt guidance before any material change in FX rates, any additional M&A and impact of coronavirus

0501 03Performance
Highlights
02 042019 Financial
Results 5+5 Strategy
Review 2020 Outlook Conclusion

5 YEARS AGO, THIS IS WHAT WE SAID WE WILL DO…
14

STRONG PROGRESS ON OUR 5 STRATEGIC PRIORITIES
DIFFERENTIATED TQA BRAND PROPOSITION
• Positioned Intertek as the global market leader in TQA
• Created global awareness and understanding of TQA
• Launched distinct new brand identity
• Built depth and breadth of ATIC offering
• Developed innovative new solutions for our clients
SUPERIOR CUSTOMER SERVICE
• Focused on delivering the highest standards of customer service
• 7,000+ NPS interviews every month
• Customer centric organisational model ensures our people are in close personal contact with our Customers
• Developing mission-critical ATIC innovations in collaboration with our clients
EFFECTIVE SALES STRATEGY
• Introduced disciplined approach to Sales
• 5 Sales Goals to support Customer 1st
processes and create accountability:
• Customer Retention• Customer
Penetration• ATIC Selling• New Customer
Wins• Customer
Outsourcing
GROWTH AND MARGIN ACCRETIVE PORTFOLIO
• Moving Intertek's centre of gravity towards the sectors, geographies, businesses and service lines that deliver the best growth and margin prospects
OPERATIONAL EXCELLENCE
• Ever Better approach to continuous improvement across entire organisation
• Disciplined performance management cadence: daily, weekly, monthly, annual and 5-year basis
• Disciplined approach to capital allocation
15

STRONG PROGRESS ON PERFORMANCE DELIVERY
16
132.1
211.7
FY14 FY19
Adjusted EPS (p)
+60%
185
380
FY14 FY19
Free Cash Flow (£m)
+106%
16.3%
22.8%
FY14 FY19
ROIC - Actual (%)
+650bps
15.5%
17.2%
FY14 FY19
Adj. Operating Margin (%)
+170 bps
54,845
66,425
FY14 FY19
Revenue per employee (£)
+21%
2,093
2,987
FY14 FY19
Revenue (£m)
+43%

DISCIPLINED INVESTMENTS IN ATTRACTIVE GROWTH AND MARGIN SECTORS
17£560m in CAPEX and £710m in M&A invested in 2015-2019
CONNECTED WORLD SAAS PLATFORMS
FOOD & HOSPITALITYSUSTAINABILITY
GEOGRAPHIC EXPANSION
LAB EXPANSION

5X5 DIFFERENTIATED STRATEGY FOR GROWTH
Differentiated Brand Proposition
Superior Customer Service
Effective Sales Strategy
Growth and Margin Accretive Portfolio
Operational Excellence
5 Strategic Priorities 5 Enablers
Living Our Customer Centric Culture
Disciplined Performance Management
Superior Technology
Energising Our People
Delivering Sustainable Results
5x5 Mid-to Long-Term Goals
Fully engaged employees working in a safe environment
1 2 3 4 5
Superior customer service in Assurance, Testing, Inspection and Certification
Margin accretive revenue growth based on GDP+ organic growth
Strong cash conversion from operations
Accretive, disciplined capital allocation policy
18

LONG-TERM GROWTH
RESOURCES17% of Revenue
6% of Profit
Long term demand for
energyInvestment in infrastructure
Supply chain risk
managementFocus on health
& safety
Growth in alternative
energySustainability of energy supply
GDP GROWTH
TRADE23% of Revenue
16% of Profit
Population growth
GDP growth
Development of regional trade
Growth in port infrastructure
Growth in transport
infrastructureIncreased focus on traceability
GDP+
PRODUCTS60% of Revenue
78% of Profit
Increased number of
Brands & SKUs
Faster innovation
cycle
Increased regulation
Increased corporation focus on risk management
Increased consumer focus on sustainable
products
Improvements in safety,
performance and quality
$250BN+ GLOBAL ATIC MARKET
$50bn Currently Outsourced
$200bn Currently In-House
Untapped Potential
GDP+ ORGANIC REVENUE GROWTH IN REAL TERMSATTRACTIVE QUALITY ASSURANCE GROWTH PROSPECTS
GROWTH OUTLOOK: GDP+ ORGANIC REVENUE GROWTH IN REAL TERMS 19

LONG-TERM GROWTHGDP GROWTH$250BN+
GLOBAL ATIC MARKET
$50bn Currently Outsourced
$200bn Currently In-House
Untapped Potential TQA SUPERIOR CUSTOMER SERVICE
• Global network of state of the art facilities
• Industry leading Technical expertise
• Unique ATIC offering
• Customer proximity with NPS
• Pioneering innovations
POWERFUL PORTFOLIO
• Leadership positions
• Scale operations• Growth
accretive• Margin
accretive• Disciplined
capital allocation
HIGH QUALITY COMPOUNDER
EARNINGS MODEL
• GDP + organic growth
• Mission critical services
• Strong pricing power
• High Margin and Strongly cash generative
• 20% + ROIC
PASSIONATE CUSTOMER-CENTRIC
ORGANISATION
• Passionate & innovative culture
• Customer 1st structure
• Precise operating procedures
• Aligned reward system and frequent recognition
• Leading training and coaching
EVER BETTER PERFORMANCE MANAGEMENT
• Site-BL-Country-Region-GBL-Group data analytics/ benchmarking
• Leading and lagging indicators
• Weekly, monthly, Quarterly cadence
• Continuous improvement
• Total sustainability
WELL POSITIONED TO SEIZE THESE GROWTH OPPORTUNITIESCAPITALISING ON OUR STRONG OPERATING PLATFORM
20GROWTH OUTLOOK: GDP+ ORGANIC REVENUE GROWTH IN REAL TERMS

INNOVATIONS FOR A BETTER, SAFER AND MORE SUSTAINABLE WORLD
Customer Insights Based Innovations
0-1 and 1-100 Margin-Accretive Innovations
21
• Untapped growth opportunities in a more complex world
• Leading subject matter expertise
• Innovative solutions in attractive growth and margin sectors
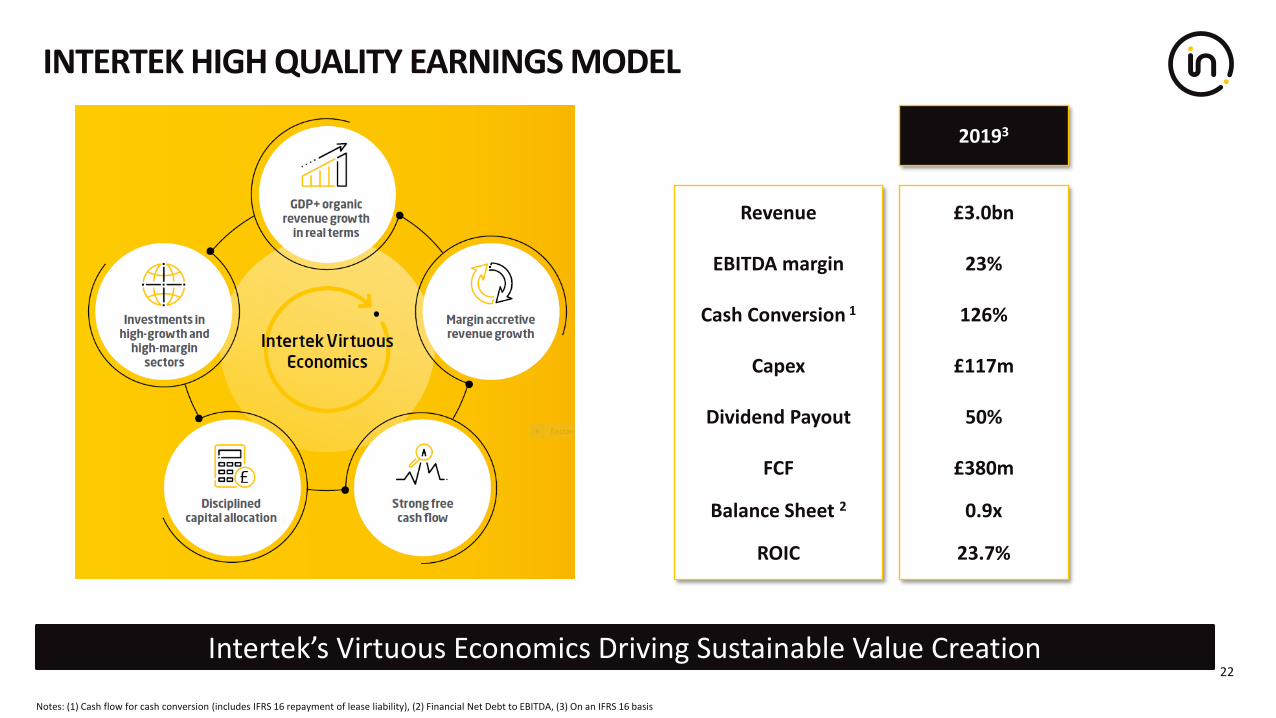
INTERTEK HIGH QUALITY EARNINGS MODEL
22Intertek’s Virtuous Economics Driving Sustainable Value Creation
20193
Revenue
EBITDA margin
Cash Conversion 1
Capex
Dividend Payout
FCF
Balance Sheet 2
ROIC
£3.0bn
23%
126%
£117m
50%
£380m
0.9x
23.7%
Notes: (1) Cash flow for cash conversion (includes IFRS 16 repayment of lease liability), (2) Financial Net Debt to EBITDA, (3) On an IFRS 16 basis

ACCRETIVE DISCIPLINED ALLOCATION OF CAPITAL
23
Capex and working capital investment to support organic growth (target c.5% of revenue in capex)
Efficient balance sheet with flexibility to invest in growth with Financial Net Debt / EBITDA target1
of circa 1.3x - 1.8x (IFRS 16)
M&A focused on strong growth and margin prospects in businesses with leading market positions or in new attractive growth areas, geographies or services
Sustainable shareholder returns through payment of progressive dividends based on a target payout ratio of c.50%
01
03
02
04
Note: (1) circa 1.5x – 2.0x on an IAS 17 basis

EVER BETTER PERFORMANCE MANAGEMENT
24
Weekly, Monthly, Quarterly, Yearly, 5 Yearly Performance Management across Financial and Operational Metrics
7,000+ Monthly Customer Interviews
DISCIPLINED PERFORMANCE MANAGEMENT SUPERIOR CUSTOMER SERVICE
Continuous improvement based on our frequent customer feedback
ALIGNED MANAGEMENT INCENTIVES GLOBAL PLATFORM FOR LEARNING
OUR PASSIONATE CUSTOMER CENTRIC CULTURE AND ORGANISATION
Intertek's online learning available to 46,000 employees worldwide

DRIVING SUSTAINABLE PERFORMANCE FOR ALL STAKEHOLDERSANCHORED IN OUR TOTAL SUSTAINABILITY APPROACH
DOING BUSINESS THE RIGHT WAY
25
INTERTEK CORPORATE GOALS
Fully engaged employees working in a safe environment
1 2 3 4 5
Superior customer service in Assurance, Testing, Inspection and Certification
Margin accretive revenue growth based on GDP+ organic growth
Strong cash conversion from operations
Accretive, disciplined capital allocation policy

0501 03Performance
Highlights
02 042019 Financial
Results 5+5 Strategy
Review 2020 Outlook Conclusion

CORONAVIRUSCARING FOR OUR PEOPLE AND OUR CLIENTS• Measures Intertek is taking in Greater China:
Focused on the health and safety of our employees and the mitigation of any disruption of our service to our clients
• Our Health, Safety, Well-being measures in Greater China: Hygiene and protection measures in the work-place and for field-based colleagues. Quarantine periods for colleagues who travelled during the holiday
• Our Commitment to our Clients: Working closely with our customers to mitigate the potential risks caused by the coronavirus, such that we provide business continuity of our customers’ operations
• Business Resumption: Our Mainland China business started operating from 10 February Our Hong Kong operations resumed as usual on 29 January. On 11 February, it was confirmed that one of our colleagues who returned to work at our Garment Centre in Kowloon had contracted the Coronavirus. We took the decision to temporarily close the Centre from 11 February for 14 days. The Centre reopened 25 FebruaryOur Taiwan operations resumed as usual 30 January
• Measures that Intertek is taking globally: Complete restriction on international travel by our people out of and into mainland China and Hong Kong. Health & Safety communications to all our people, in-line with WHO guidance
27

GROUP OUTLOOK 2020, PRIOR TOTHE CORONAVIRUS OUTBREAK• Good organic revenue growth at constant currency
− Good growth expected in Products
− Good growth expected in Trade
− Robust growth expected in Resources
• Moderate Group margin progression
− Portfolio strategy
− Continuous cost discipline
− Performance management
• Strong cash conversion
• Capex: £130-140m
• Financial Net debt: £520-550m
28
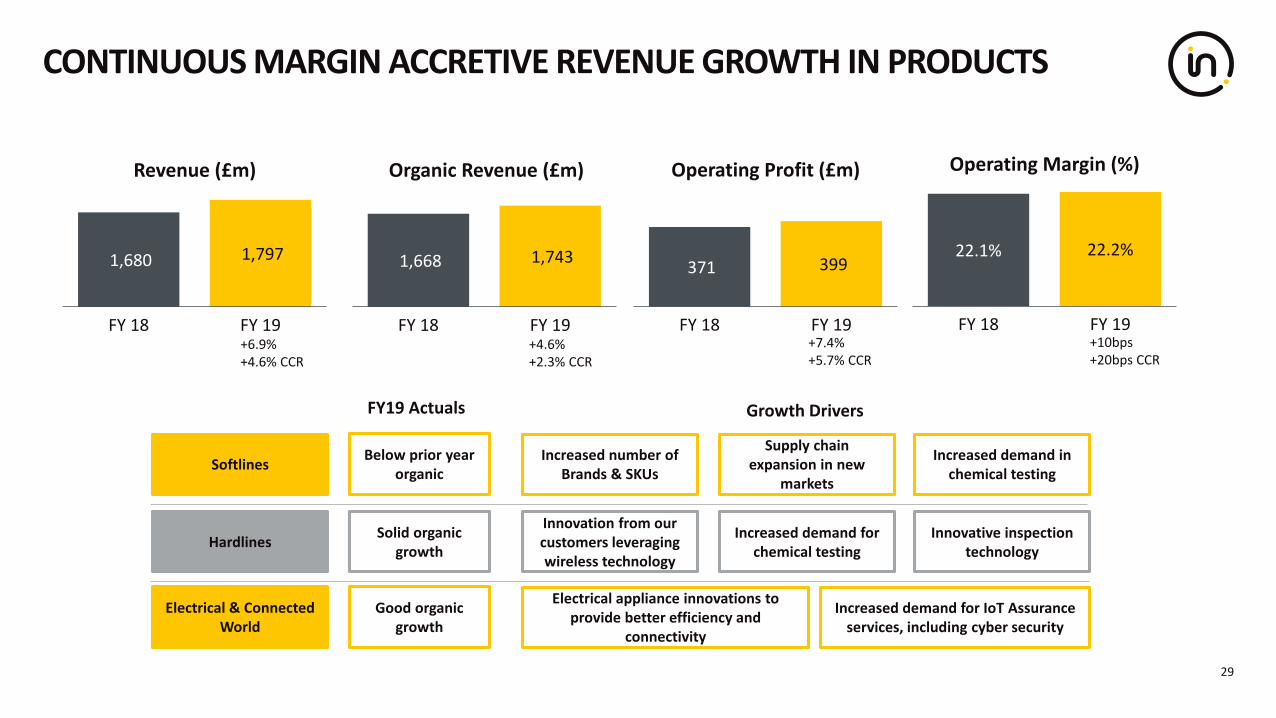
CONTINUOUS MARGIN ACCRETIVE REVENUE GROWTH IN PRODUCTS
29
1,680 1,797
FY 18 FY 19
Revenue (£m)
1,668 1,743
FY 18 FY 19
Organic Revenue (£m)
371 399
FY 18 FY 19
Operating Profit (£m)
22.1% 22.2%
FY 18 FY 19
Operating Margin (%)
+6.9%+4.6% CCR
+4.6%+2.3% CCR
+7.4%+5.7% CCR
+10bps+20bps CCR
Softlines
Hardlines
Electrical & Connected World
Growth Drivers
Increased number of Brands & SKUs
Supply chain expansion in new
markets
Increased demand in chemical testing
Innovation from our customers leveraging wireless technology
Increased demand for chemical testing
Innovative inspection technology
Electrical appliance innovations to provide better efficiency and
connectivity
Increased demand for IoT Assurance services, including cyber security
FY19 Actuals
Below prior year organic
Solid organic growth
Good organic growth

INNOVATIONS: PRODUCTS 30
Business Assurance
Building & Construction
Transportation Technology
Food
Chemicals and Pharma
Increased scrutiny on emissions
Increased concerns on product safety and traceability
Growth DriversFY19 Actuals
ISO standards upgrades
Increased focus of corporations on supply chain
and risk management
Increased consumer and government focus on ethical
and sustainable supply
Good organic growth
Growing demand for greener, safer and higher quality commercial buildings
Increased investment in large infrastructure projects
Good organic growth
Continued investment of our clients in new models and new
fuel efficient engines
Growth in the hybrid / electric engine segment
Robust organic growth
Continuous food innovation
Increased focus on the safety of supply chains
Growth in the food service assurance
business
Good organic growth
Below prior year organic
Growth of SKUs
Expansion of the supply base in emerging markets
CONTINUOUS MARGIN ACCRETIVE REVENUE GROWTH IN PRODUCTS
Cyber AssuredIntertek High Performance Mark
Pioneering Product Sustainability Certification

INNOVATIONS: TRADE
642 679
FY 18 FY 19
Revenue (£m)
637 671
FY 18 FY 19
Organic Revenue (£m)
83 84
FY 18 FY 19
Operating Profit (£m)
13.0%12.3%
FY 18 FY 19
Operating Margin (%)
+5.8%+4.5% CCR
+5.5%+4.1% CCR
+0.1%(0.2)% CCR
(70)bps(60)bps CCR
REVENUE ACCELERATION IN TRADE
31
Caleb Brett
Government & Trade Services
AgriWorld
Growth DriversFY19 Actuals
Double-digit organic growth
Global and regional trade structural growth drivers Increased transport infrastructure
Award of new contracts GDP growth Population growth
The expansion of our clients’ supply chains in fast growing markets New customer wins
Good organic growth
Good organic growth
Inflow for IMO2020 Compliance
QR Codes for Report Authentication

479 511
FY 18 FY 19
Revenue (£m)
479 511
FY 18 FY 19
Organic Revenue (£m)
27 31
FY 18 FY 19
Operating Profit (£m)
5.7% 6.1%
FY 18 FY 19
Operating Margin (%)
+6.7%+5.7% CCR
+6.7%+5.7% CCR
+13.9%+16.0% CCR
+40bps+50bps CCR
IMPROVED REVENUE MOMENTUM AND MARGIN ACCRETION IN RESOURCES
32
Minerals
Capex Inspection
Opex Inspection
Minerals demand Technological innovation
Demand for energy Asset productivity Technological innovation
Capacity utilisation Asset productivityAgeing of equipment
Outsourcing
Growth DriversFY19 Actuals
Robust organic growth
Stable revenue
Robust organic growth
INNOVATIONS: RESOURCES WindlifeRock Chip Imagery for AI Analysis

0501 03Performance
Highlights
02 042019 Financial
Results 5+5 Strategy
Review 2020 Outlook Conclusion

EVER BETTER… EVERYDAY... EVERYWHERE
34
• 5 years of continuous and consistent progress on Revenues, EPS, Cash and Dividends
• Attractive structural growth prospects combined with our superior ATIC customer Service and industry-leading innovations, pave the way for exciting growth ahead
• Ever Better, Every day, Everywhere: operational discipline to execute our 5x5 differentiated growth strategy and deliver sustainable results for all stakeholders.


FY 15 FY 16 FY 17 FY 18 FY 1910% 7% 6% 6% 6%22% 20% 19% 17% 16%
68%73%
75% 77% 78%
FY 15 FY 16 FY 17 FY 18 FY 19
24% 20% 18% 17% 17%
25% 23% 23% 23% 23%
51%57% 59% 60% 60%
FY 15 FY 16 FY 17 FY 18 FY 19
GROUP PERFORMANCE (2015 – 2019)
36
Margin
FY 15 FY 16 FY 17 FY 18 FY 19
Products 21.1% 20.3% 21.6% 22.1% 22.2%
Trade 14.1% 14.0% 13.7% 13.0% 12.3%
Resources 6.5% 5.8% 5.7% 5.7% 6.1%
Group 15.9% 16.0% 16.9% 17.2% 17.2%
Key Metrics 2019
% Group Revenue % Group Profit Organic Revenue Growth1
60% 78% 2.3%
23% 16% 4.1%
17% 6% 5.7%
100% 100% 3.3%
£343m
£410m £468m
£2,166m £2,567m
£2,769m
Adjusted Margin (%)
Note: (1) At 2019 constant currency rates
Revenue (£m) Adjusted Operating Profit (£m)
£2,801m
£482m 17.2%
£2,987m
£513m 17.2%
16.9%
16.0%15.9%

ADJUSTED EPS
37
£m @ actual exchange rates FY 18 FY 19 IFRS 16
Adjusted operating profit 481.8 513.3 +6.5% 524.2
Net interest expense (25.3) (30.3) (39.4)
Profit before tax 456.5 483.0 484.8
Tax (112.8) (118.4) (118.8)
Profit after tax 343.7 364.6 366.0
Non-controlling interest (20.8) (20.4) (20.5)
Net profit 322.9 344.2 345.5
Fully diluted shares (m) 162.8 162.6 162.6
Earnings per share (p) 198.3 211.7 +6.8% 212.5
Dividend (p) 99.1 105.8 +6.8% 105.8
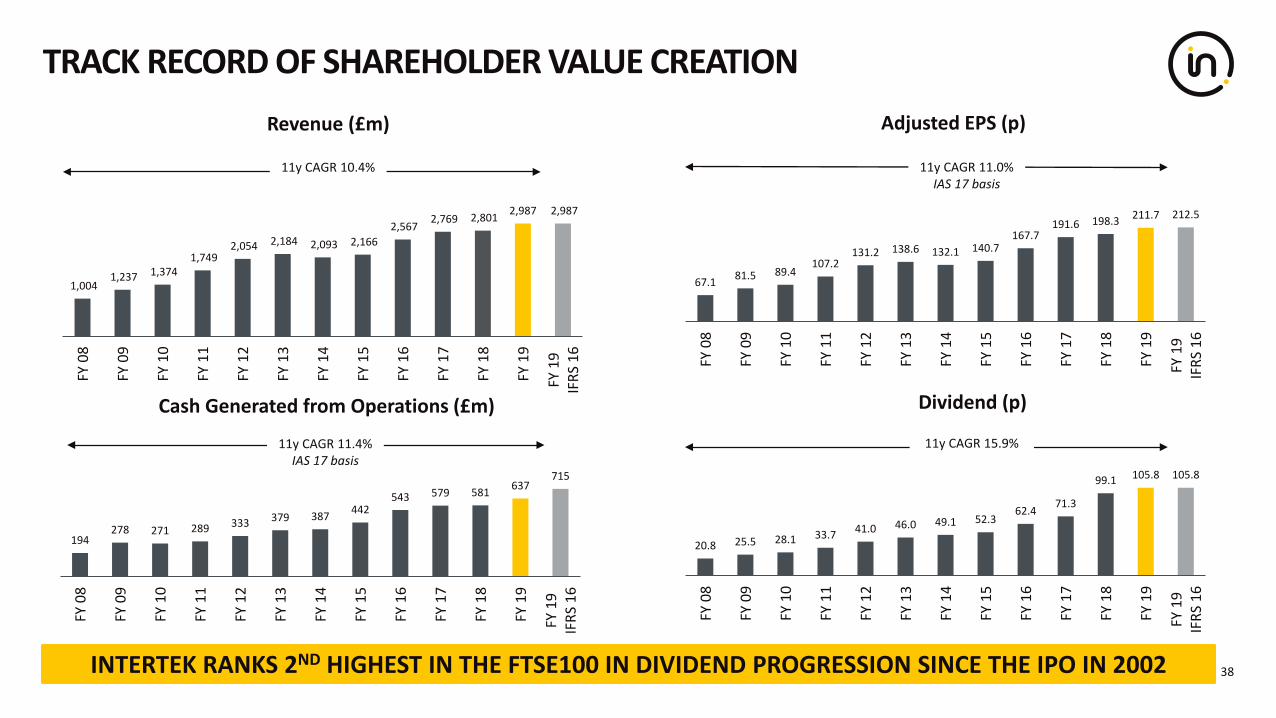
TRACK RECORD OF SHAREHOLDER VALUE CREATION
38
1,004 1,237 1,374
1,749 2,054 2,184 2,093 2,166
2,567 2,769 2,801 2,987 2,987
FY 0
8
FY 0
9
FY 1
0
FY 1
1
FY 1
2
FY 1
3
FY 1
4
FY 1
5
FY 1
6
FY 1
7
FY 1
8
FY 1
9
FY 1
9IF
RS 1
6
Revenue (£m)
11y CAGR 10.4%
194278 271 289 333 379 387 442
543 579 581 637715
FY 0
8
FY 0
9
FY 1
0
FY 1
1
FY 1
2
FY 1
3
FY 1
4
FY 1
5
FY 1
6
FY 1
7
FY 1
8
FY 1
9
FY 1
9IF
RS 1
6
Cash Generated from Operations (£m)
20.8 25.5 28.1 33.7 41.0 46.0 49.1 52.362.4 71.3
99.1 105.8 105.8
FY 0
8
FY 0
9
FY 1
0
FY 1
1
FY 1
2
FY 1
3
FY 1
4
FY 1
5
FY 1
6
FY 1
7
FY 1
8
FY 1
9
FY 1
9IF
RS 1
6
Dividend (p)
11y CAGR 11.4%IAS 17 basis
11y CAGR 15.9%
67.1 81.5 89.4107.2
131.2 138.6 132.1 140.7167.7
191.6 198.3 211.7 212.5
FY 0
8
FY 0
9
FY 1
0
FY 1
1
FY 1
2
FY 1
3
FY 1
4
FY 1
5
FY 1
6
FY 1
7
FY 1
8
FY 1
9
FY 1
9IF
RS 1
6
Adjusted EPS (p)
11y CAGR 11.0%IAS 17 basis
INTERTEK RANKS 2ND HIGHEST IN THE FTSE100 IN DIVIDEND PROGRESSION SINCE THE IPO IN 2002