Embed Size (px)
Citation preview

2019 Every Student Succeeds Act Consolidated Strategic Plan
Montgomery County Board of Education
October 8, 2019
Overview
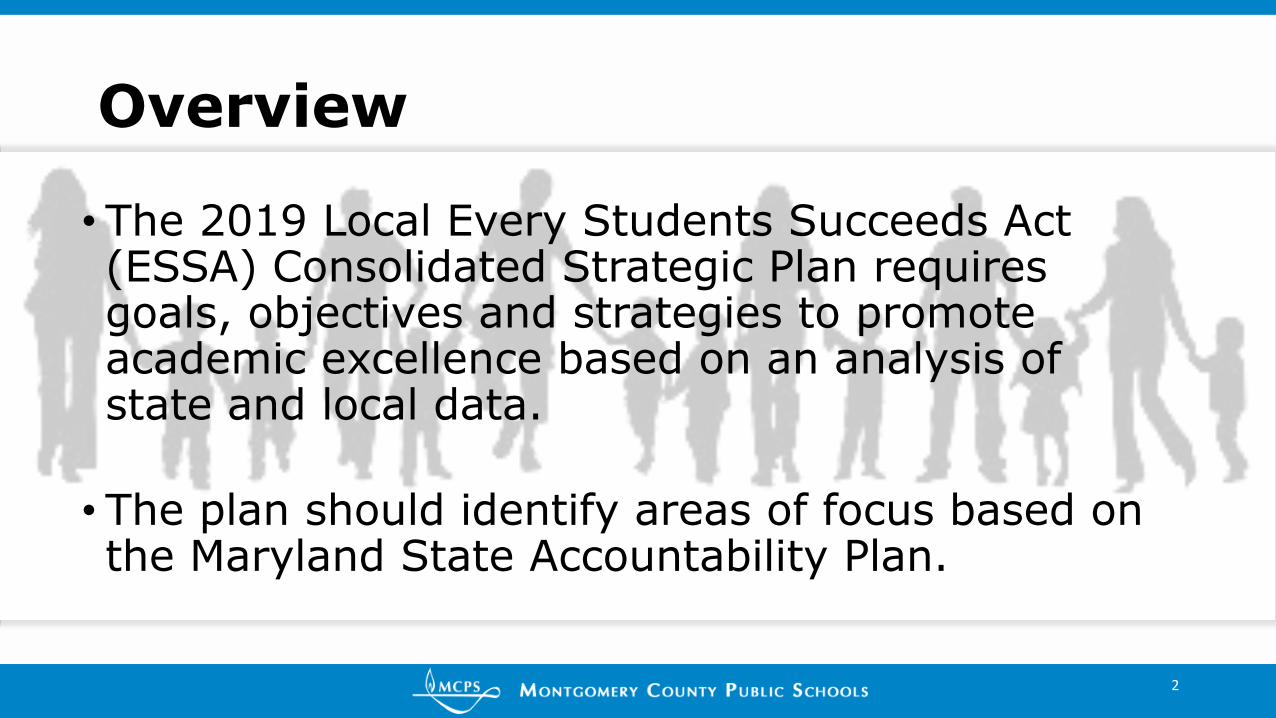
• The 2019 Local Every Students Succeeds Act (ESSA) Consolidated Strategic Plan requires goals, objectives and strategies to promote academic excellence based on an analysis of state and local data.
• The plan should identify areas of focus based on the Maryland State Accountability Plan.
2

2019 ESSA Consolidated Strategic Plan Components• Executive Summary – Summarizes progress Montgomery County Public Schools
(MCPS) is making in accelerating student performance and eliminating the achievement gap
• Finance Section – Presents a comparative look at Fiscal Year (FY) 2019 budget and actuals and the plan for FY 2020 to illustrate alignment with the MCPS goals and objectives
• Areas of Focus– Analyze state and local assessment data and report strategies to address any disparities
• Code of Maryland Regulations (COMAR) Reporting Requirements
Targeted Support and Improvement (TSI) Schools – Action plan to support TSIschools
Gifted and Talented Education – Identification process; program goals, targets and strategies
Teacher Induction Program – Overview of induction program for new teachers
3

2019 ESSA Consolidated Strategic Plan Components• 2018–2019 Federal and State Grant Applications
Title I, Part A—Improving Basic Programs
Title I, Part D—Prevention & Intervention Programs for Children & Youth Who Are Neglected, Delinquent or At-Risk
Title II, Part A—Systems of Supports for Excellent Teaching and Leading
Title III, Part A—English Language Acquisition, Language Enhancement, and Academic Achievement
Title IV, Part A—Student Supports and Academic Enrichment
Fine Arts
• Victims of Violent Criminal Offenses in Schools Report
4

What do the data show?
5

Partnership for Assessment of Readiness for College and Careers Proficiency (PARCC) – ELA Grades 3–5
6
Tested
Count
PARCC Performance Level
Level 3
Approached Level 4 Met Level 5 Exceeded %
Performance
Level 4 or 5Count % Count % Count %Grade Focus Group YearELA 3-5 All Students 2018 36,664 8,107 22.1 14,687 40.1 3,938 10.7 50.8
2019 36,413 7,727 21.2 15,028 41.3 4,041 11.1 52.4
Non-FARMS, All
other Student Groups
2018 15,621 2,515 16.1 8,382 53.7 3,169 20.3 73.9
2019 15,510 2,343 15.1 8,578 55.3 3,174 20.5 75.8
Non-FARMS, Black
or African American
2018 3,382 888 26.3 1,417 41.9 223 6.6 48.5
2019 3,430 883 25.7 1,432 41.7 255 7.4 49.2
Non-FARMS,
Hispanic/Latino
2018 3,481 891 25.6 1,425 40.9 224 6.4 47.4
2019 3,688 856 23.2 1,530 41.5 282 7.6 49.1
FARMS, All other
Student Groups
2018 1,765 477 27.0 665 37.7 95 5.4 43.1
2019 1,677 414 24.7 630 37.6 104 6.2 43.8
FARMS, Black or
African American
2018 4,405 1,216 27.6 1,186 26.9 127 ≤5.0 29.8
2019 4,332 1,165 26.9 1,249 28.8 125 ≤5.0 31.7
FARMS,
Hispanic/Latino
2018 8,010 2,120 26.5 1,612 20.1 100 ≤5.0 21.4
2019 7,776 2,066 26.6 1,609 20.7 101 ≤5.0 22.0
ESOL 2018 7,248 1,681 23.2 760 10.5 -- ≤5.0 10.7
2019 7,757 1,869 24.1 997 12.9 -- ≤5.0 13.0
Special Ed 2018 4,058 722 17.8 526 13.0 87 ≤5.0 15.1
2019 4,225 723 17.1 585 13.8 80 ≤5.0 15.7

PARCC Proficiency – Math Grades 3–5
7
Tested
Count
PARCC Performance Level
Level 3
Approached Level 4 Met Level 5 Exceeded
% Performance
Level 4 or 5Grade Focus Group Year Count % Count % Count %
MATH 3-5 All Students 2018 37,050 8,381 22.6 13,461 36.3 5,127 13.8 50.2
2019 36,911 8,466 22.9 13,801 37.4 5,023 13.6 51.0
Non-FARMS, All
other Student
Groups
2018 15,735 2,577 16.4 7,660 48.7 4,099 26.1 74.7
2019 15,644 2,507 16.0 7,821 50.0 4,043 25.8 75.8
Non-FARMS,
Black or African
American
2018 3,404 936 27.5 1,228 36.1 292 8.6 44.7
2019 3,447 962 27.9 1,288 37.4 264 7.7 45.0
Non-FARMS,
Hispanic/Latino
2018 3,517 969 27.6 1,251 35.6 279 7.9 43.5
2019 3,743 1,071 28.6 1,333 35.6 308 8.2 43.8
FARMS, All other
Student Groups
2018 1,811 493 27.2 646 35.7 158 8.7 44.4
2019 1,719 443 25.8 644 37.5 133 7.7 45.2
FARMS, Black or
African American
2018 4,445 1,187 26.7 1,080 24.3 113 ≤5.0 26.8
2019 4,378 1,254 28.6 1,054 24.1 136 ≤5.0 27.2
FARMS,
Hispanic/Latino
2018 8,138 2,219 27.3 1,596 19.6 186 ≤5.0 21.9
2019 7,980 2,229 27.9 1,661 20.8 139 ≤5.0 22.6
ESOL 2018 7,648 1,917 25.1 1,174 15.4 98 ≤5.0 16.6
2019 8,265 2,263 27.4 1,402 17.0 89 ≤5.0 18.0
Special Ed 2018 4,061 812 20.0 534 13.1 157 ≤5.0 17.0
2019 4,227 870 20.6 639 15.1 134 ≤5.0 18.3

PARCC Proficiency – ELA Grades 6–8
8
PARCC Performance Level
Tested
Count
Level 3 Approached
Level 4
Met
Level 5
Exceeded%
Performance
Level 4 or 5Grade Focus Group Year Count % Count % Count %ELA 6-8 All Students 2018 35,399 7,966 22.5 12,965 36.6 5,246 14.8 51.4
2019 35,984 7,745 21.5 13,660 38.0 5,781 16.1 54.0
Non-FARMS, All
other Student Groups
2018 15,918 2,625 16.5 7,769 48.8 4,248 26.7 75.5
2019 15,675 2,288 14.6 7,652 48.8 4,637 29.6 78.4
Non-FARMS, Black
or African American
2018 3,547 978 27.6 1,318 37.2 305 8.6 45.8
2019 3,730 1,000 26.8 1,455 39.0 380 10.2 49.2
Non-FARMS,
Hispanic/Latino
2018 3,606 986 27.3 1,284 35.6 287 8.0 43.6
2019 4,103 1,049 25.6 1,535 37.4 349 8.5 45.9
FARMS, All other
Student Groups
2018 1,605 441 27.5 545 34.0 150 9.3 43.3
2019 1,613 393 24.4 586 36.3 160 9.9 46.2
FARMS, Black or
African American
2018 4,033 1,154 28.6 897 22.2 123 ≤5.0 25.3
2019 4,099 1,130 27.6 1,075 26.2 135 ≤5.0 29.5
FARMS,
Hispanic/Latino
2018 6,690 1,782 26.6 1,152 17.2 133 ≤5.0 19.2
2019 6,764 1,885 27.9 1,357 20.1 120 ≤5.0 21.8
ESOL 2018 3,059 309 10.1 92 ≤5.0 -- -- ≤5.0
2019 3,356 453 13.5 112 ≤5.0 -- -- ≤5.0
Special Ed 2018 3,753 707 18.8 419 11.2 67 ≤5.0 12.9
2019 3,959 821 20.7 506 12.8 82 ≤5.0 14.9

PARCC Proficiency – Math Grade 6 Summary
9
PARCC Performance Level
Tested
Count
Level 3
Approached
Level 4
Met
Level 5
Exceeded%
Performance
Level 4 or 5Grade Focus Group Test Year Count % Count % Count %
Grade 6 All Students MAT06 2018 11,925 3,199 26.8 3,804 31.9 1,060 8.9 40.8
2019 12,155 3,276 27.0 3,741 30.8 1,101 9.1 39.8
ALG01 2018 52 -- -- 26 50.0 23 44.2 94.2
2019 89 24 27.0 25 28.1 35 39.3 67.4
GEO01 2018 -- -- -- -- -- -- -- --
2019 -- -- -- -- -- -- -- --

PARCC Proficiency – Math Grade 6
10
Grade 6 PARCC Exam PARCC Performance Level
Tested
Count
Level 3
Approached
Level 4
Met
Level 5
Exceeded% Performance
Level L 4 or 5Grade Test Focus Group Year Count % Count % Count %
Grade 6 MAT06 All Students 2018 11,925 3,199 26.8 3,804 31.9 1,060 8.9 40.8
2019 12,155 3,276 27.0 3,741 30.8 1,101 9.1 39.8
Non-FARMS,
All other
Student Groups
2018 5,155 1,180 22.9 2,532 49.1 916 17.8 66.9
2019 5,133 1,143 22.3 2,492 48.5 974 19.0 67.5
Non-FARMS,
Black or African
American
2018 1,101 383 34.8 304 27.6 45 ≤5.0 31.7
2019 1,220 394 32.3 319 26.1 41 ≤5.0 29.5
Non-FARMS,
Hispanic/Latino2018 1,187 382 32.2 333 28.1 56 ≤5.0 32.8
2019 1,329 420 31.6 360 27.1 48 ≤5.0 30.7
FARMS,
All other
Student Groups
2018 537 156 29.1 168 31.3 -- ≤5.0 34.6
2019 546 188 34.4 150 27.5 -- ≤5.0 31.1
FARMS,
Black or African
American
2018 1,449 425 29.3 192 13.3 -- ≤5.0 14.1
2019 1,420 403 28.4 178 12.5 -- ≤5.0 13.4
FARMS,
Hispanic/Latino2018 2,496 673 27.0 275 11.0 -- ≤5.0 11.5
2019 2,507 728 29.0 242 9.7 -- -- 9.9
ESOL 2018 1,113 134 12.0 53 ≤5.0 -- -- 5.2
2019 1,330 145 10.9 55 ≤5.0 -- -- ≤5.0
Special Ed 2018 1,323 255 19.3 122 9.2 -- ≤5.0 10.7
2019 1,344 276 20.5 120 8.9 -- ≤5.0 10.3

PARCC Proficiency – Math Grade 7 Summary
11
PARCC Performance Level
Tested
Count
Level 3
Approached
Level 4
Met
Level 5
Exceeded % Performance
Level 4 or 5Grade Focus GroupTest Year Count % Count % Count %Grade 7 All Students MAT07 2018 9,070 2,968 32.7 2,606 28.7 137 ≤5.0 30.2
2019 8,573 2,996 34.9 2,093 24.4 150 ≤5.0 26.2
ALG01 2018 2,685 256 9.5 1,768 65.8 588 21.9 87.7
2019 3,463 508 14.7 2,320 67.0 455 13.1 80.1
GEO01 2018 -- -- -- -- -- -- 76.5 ≥95.0
2019 49 -- -- -- 30.6 29 59.2 89.8
ALG02 2018 -- -- -- -- -- -- -- --
2019 -- -- -- -- -- -- -- --

PARCC Proficiency – Math Grade 7
12
Grade 7 PARCC Exam PARCC Performance Level
Tested
Count
Level 3
Approached
Level 4
Met
Level 5
Exceeded%
Performanc
e Level L 4
or 5Grade Test Focus Group Year Count % Count % Count %Grade 7 MAT07 All Students 2018 9,070 2,968 32.7 2,606 28.7 137 ≤5.0 30.2
2019 8,573 2,996 34.9 2,093 24.4 150 ≤5.0 26.2
Non-FARMS,
All other
Student Groups
2018 3,223 1,020 31.6 1,685 52.3 122 ≤5.0 56.1
2019 2,732 939 34.4 1,300 47.6 121 ≤5.0 52.0
Non-FARMS,
Black or African
American
2018 1,000 397 39.7 203 20.3 -- -- 20.6
2019 933 388 41.6 188 20.2 -- -- 20.8
Non-FARMS,
Hispanic/Latino2018 1,080 367 34.0 291 26.9 -- -- 27.5
2019 1,148 439 38.2 233 20.3 -- ≤5.0 21.9
FARMS,
All other
Student Groups
2018 464 173 37.3 122 26.3 -- -- 27.2
2019 424 148 34.9 104 24.5 -- -- 25.0
FARMS,
Black or African
American
2018 1,233 390 31.6 124 10.1 -- -- 10.1
2019 1,227 408 33.3 112 9.1 -- -- 9.2
FARMS,
Hispanic/Latino2018 2,070 621 30.0 181 8.7 -- -- 8.8
2019 2,109 674 32.0 156 7.4 -- -- 7.5
ESOL 2018 1,067 144 13.5 52 ≤5.0 -- -- 5.2
2019 1,165 160 13.7 57 ≤5.0 -- -- 5.3
Special Ed 2018 1,190 232 19.5 101 8.5 -- -- 8.6
2019 1,274 290 22.8 106 8.3 -- -- 8.7

PARCC Proficiency – Math Grade 8 Summary
13
PARCC Performance Level
Tested
Count
Level 3
Approached
Level 4
Met
Level 5
Exceeded % Performance
Level 4 or 5Grade Focus GroupTest Year Count % Count % Count %
Grade 8 All Students MAT08 2018 1,683 236 14.0 41 ≤5.0 -- -- ≤5.0
2019 1,587 177 11.2 31 ≤5.0 -- -- ≤5.0
ALG01 2018 8,181 2,433 29.7 3,414 41.7 204 ≤5.0 44.2
2019 7,782 2,476 31.8 2,691 34.6 93 ≤5.0 35.8
GEO01 2018 1,978 157 7.9 1,180 59.7 628 31.7 91.4
2019 2,531 272 10.7 1,462 57.8 777 30.7 88.5
ALG02 2018 -- -- -- -- -- -- 55.0 90.0
2019 25 -- -- -- -- -- 72.0 ≥95.0

PARCC Proficiency – Math Grade 8 Summary
14
Algebra 1 PARCC Exam PARCC Performance Level
Tested
Count
Level 3
Approached
Level 4
Met
Level 5
Exceeded%
Performanc
e Level L 4
or 5Grade Test Focus Group Year Count % Count % Count %
Grade 8 ALG01 All Students 2018 8,181 2,433 29.7 3,414 41.7 204 ≤5.0 44.2
2019 7,782 2,476 31.8 2,691 34.6 93 ≤5.0 35.8
Non-FARMS,
All other
Student Groups
2018 3,509 781 22.3 2,274 64.8 180 5.1 69.9
2019 3,083 858 27.8 1,776 57.6 79 ≤5.0 60.2
Non-FARMS,
Black or African
American
2018 938 346 36.9 294 31.3 -- -- 32.2
2019 962 387 40.2 229 23.8 -- -- 23.9
Non-FARMS,
Hispanic/Latino2018 934 344 36.8 303 32.4 -- ≤5.0 33.6
2019 1,018 339 33.3 290 28.5 -- -- 29.4
FARMS,
All other
Student Groups
2018 401 140 34.9 160 39.9 -- -- 40.6
2019 396 127 32.1 126 31.8 -- -- 32.6
FARMS,
Black or African
American
2018 898 314 35.0 161 17.9 -- -- 18.2
2019 870 300 34.5 116 13.3 -- -- 13.3
FARMS,
Hispanic/Latino2018 1,501 508 33.8 222 14.8 -- -- 14.8
2019 1,453 465 32.0 154 10.6 -- -- 10.7
ESOL 2018 564 113 20.0 57 10.1 -- -- 10.8
2019 587 111 18.9 41 7.0 -- -- 8.0
Special Ed 2018 591 136 23.0 109 18.4 -- -- 19.6
2019 680 175 25.7 109 16.0 -- -- 16.6
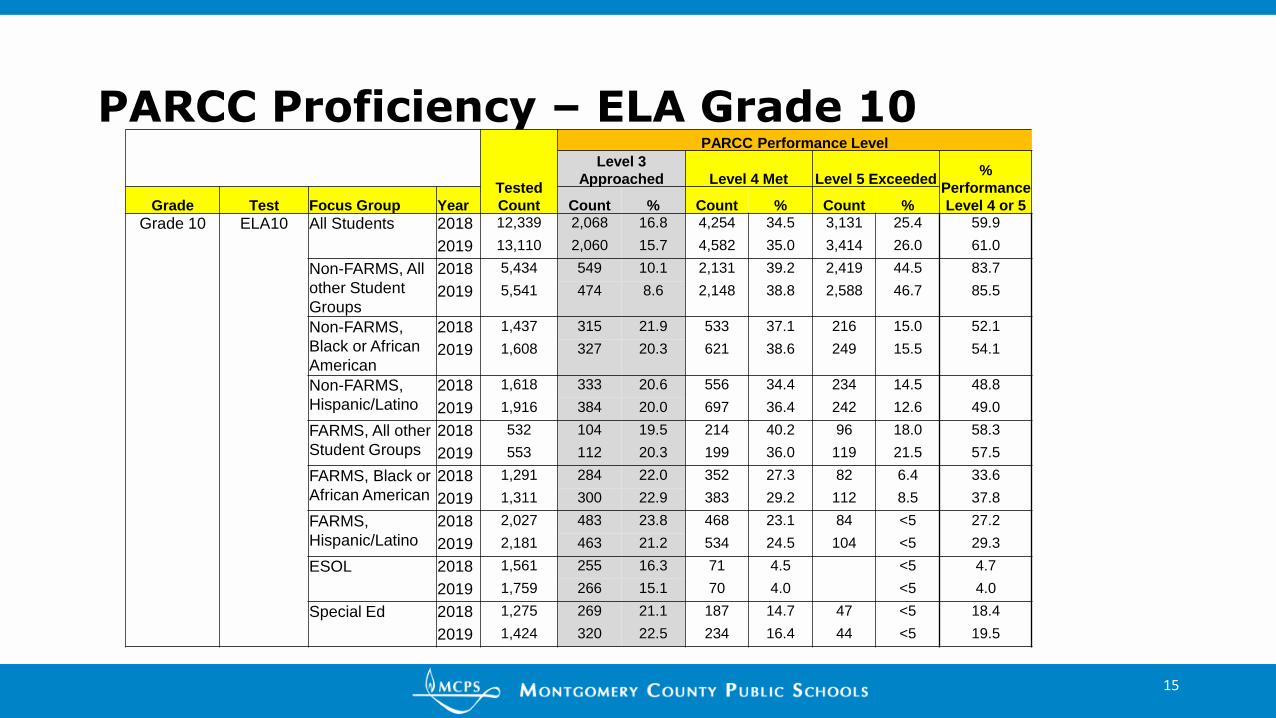
PARCC Proficiency – ELA Grade 10
15
PARCC Performance Level
Tested
Count
Level 3
Approached Level 4 Met Level 5 Exceeded%
Performance
Level 4 or 5Grade Test Focus Group Year Count % Count % Count %
Grade 10 ELA10 All Students 2018 12,339 2,068 16.8 4,254 34.5 3,131 25.4 59.9
2019 13,110 2,060 15.7 4,582 35.0 3,414 26.0 61.0
Non-FARMS, All
other Student
Groups
2018 5,434 549 10.1 2,131 39.2 2,419 44.5 83.7
2019 5,541 474 8.6 2,148 38.8 2,588 46.7 85.5
Non-FARMS,
Black or African
American
2018 1,437 315 21.9 533 37.1 216 15.0 52.1
2019 1,608 327 20.3 621 38.6 249 15.5 54.1
Non-FARMS,
Hispanic/Latino
2018 1,618 333 20.6 556 34.4 234 14.5 48.8
2019 1,916 384 20.0 697 36.4 242 12.6 49.0
FARMS, All other
Student Groups
2018 532 104 19.5 214 40.2 96 18.0 58.3
2019 553 112 20.3 199 36.0 119 21.5 57.5
FARMS, Black or
African American
2018 1,291 284 22.0 352 27.3 82 6.4 33.6
2019 1,311 300 22.9 383 29.2 112 8.5 37.8
FARMS,
Hispanic/Latino
2018 2,027 483 23.8 468 23.1 84 <5 27.2
2019 2,181 463 21.2 534 24.5 104 <5 29.3
ESOL 2018 1,561 255 16.3 71 4.5 <5 4.7
2019 1,759 266 15.1 70 4.0 <5 4.0
Special Ed 2018 1,275 269 21.1 187 14.7 47 <5 18.4
2019 1,424 320 22.5 234 16.4 44 <5 19.5

PARCC Proficiency – Algebra 1 Grades 9–12
16
Algebra 1 PARCC Exam PARCC Performance Level
Tested
Count
Level 3
Approached
Level 4
Met
Level 5
Exceeded%
Performance
Level L 4 or 5Grade Test Focus Group Year Count % Count % Count %
Grades9 - 12
ALG01 All Students 2018 5,183 1,395 26.9 663 12.8 40 ≤5.0 13.6
2019 5,456 1,435 26.3 495 9.1 31 ≤5.0 9.6
Non-FARMS, All
other Student
Groups
2018 985 347 35.2 328 33.3 26 ≤5.0 35.9
2019 912 304 33.3 232 25.4 21 ≤5.0 27.7
Non-FARMS, Black
or African American2018 638 193 30.3 77 12.1 -- -- 12.5
2019 811 242 29.8 77 9.5 -- -- 9.7
Non-FARMS,
Hispanic/Latino2018 931 235 25.2 99 10.6 -- -- 11.4
2019 1,047 296 28.3 66 6.3 -- -- 6.5
FARMS, All other
Student Groups2018 225 71 31.6 41 18.2 -- -- 19.6
2019 242 66 27.3 29 12.0 -- -- 14.0
FARMS, Black or
African American2018 732 184 25.1 59 8.1 -- -- 8.2
2019 915 220 24.0 62 6.8 -- -- 6.9
FARMS,
Hispanic/Latino2018 1,672 365 21.8 59 ≤5.0 -- -- ≤5.0
2019 1,529 307 20.1 29 ≤5.0 -- -- ≤5.0
ESOL 2018 1,870 332 17.8 117 6.3 -- ≤5.0 6.8
2019 1,712 291 17.0 74 ≤5.0 -- -- ≤5.0
Special Ed 2018 990 176 17.8 63 6.4 -- -- 6.4
2019 1,178 218 18.5 45 ≤5.0 -- -- ≤5.0

Strategies to Address Gaps
17

Priority Strategies
• Implementation of new K–8 Math and ELA Curricular and Instructional Materials
• High quality grade level instruction and professional development
• Equity Accountability Model
• Evidence of Learning
• Equitable Access to Resources
• School Improvement Process
18

Discussion
19