Embed Size (px)
Citation preview

EN EN
EUROPEAN COMMISSION
Brussels, 27.2.2019
SWD(2019) 1023 final
COMMISSION STAFF WORKING DOCUMENT
Country Report Slovenia 2019
Accompanying the document
COMMUNICATION FROM THE COMMISSION TO THE EUROPEAN
PARLIAMENT, THE EUROPEAN COUNCIL, THE COUNCIL, THE EUROPEAN
CENTRAL BANK AND THE EUROGROUP
2019 European Semester: Assessment of progress on structural reforms, prevention and
correction of macroeconomic imbalances, and results of in-depth reviews under
Regulation (EU) No 1176/2011
{COM(2019) 150 final}

1
Executive summary 3
1. Economic situation and outlook 6
2. Progress with country-specific recommendations 12
3. Reform priorities 16
3.1. Public finances and taxation 16
3.2. Financial sector 23
3.3. Labour market, education and social policies 26
3.4. Competitiveness reforms and investment 31
Annex A: Overview Table 43
Annex B: Commission Debt Sustainability Analysis and Fiscal Risks 47
Annex C: Standard Tables 48
Annex D: Investment Guidance on Cohesion Policy Funding 2021-2027 for Slovenia 54
References 60
LIST OF TABLES
Table 1.1: Key economic and financial indicators 11
Table 2.1: Assessment of 2018 Country-Specific Recommendations (CSRs) 13
Table 3.2.1: Financial soundness indicators - all banks in Slovenia 23
Table C.1: Financial market indicators 48
Table C.2: Headline Social Scoreboard indicators 49
Table C.3: Labour market and education indicators 50
Table C.4: Social inclusion and health indicators 51
Table C.5: Product market performance and policy indicators 52
Table C.6: Green growth 53
LIST OF GRAPHS
Graph 1.1: Composition of GDP growth 6
Graph 1.2: Composition of potential growth 6
Graph 1.3: Labour market developments in Slovenia 7
CONTENTS

2
Graph 1.4: Export market shares 8
Graph 1.5: Net International Investment Position (NIIP) by sector 8
Graph 1.6: Debt decomposition 9
Graph 1.7: Change in pro capita GDP from 2007 to 2016 10
Graph 2.1: Level of implementation of 2011-2018 CSRs 12
Graph 3.1.1: Gross debt as % of GDP - Debt Sustainability Analysis 17
Graph 1: Distributional (on the left) and labour supply (on the right) effects for both scenarios 22
Graph 3.3.1: Activity rate by age and educational attainment in 2017 26
Graph 3.3.2: Reasons for inactivity by age and sex, 2016 26
Graph 3.3.3: Labour shortages, Slovenia 2008-2018 27
Graph 3.3.4: At risk of poverty or social exclusion rate and its components 29
Graph 3.4.1: Labour productivity and total factor productivity (TFP), Slovenia and Euro area 31
Graph 3.4.2: Investment by type 31
Graph 3.4.3: R&D funding 32
LIST OF BOXES
Box 2.1: EU funds and programmes contribute to addressing structural challenges and to fostering
growth and competitiveness in Slovenia 15
Box 3.1.1: Shifting taxation from labour to immovable property 22
Box 3.3.1: Monitoring performance in light of the European Pillar of Social Rights 30
Box 3.4.1: Barriers to investment in Slovenia 35

3
Slovenia’s economy, currently experiencing a
robust growth, can be made more resilient to
future shocks by increasing investment and
addressing the challenges related to its ageing
population (1). The economy is growing strongly
and remains competitive internationally.
Investment is growing, but it is still below the EU
average as a share of GDP, which slows down
Slovenia’s convergence in terms of productivity.
Social indicators generally signal progress, while
inequality (between both citizens and regions) is
below the EU and OECD average. The banking
sector has improved further, also thanks to the
favourable economic climate. Structural reforms of
the pension, healthcare and long-term care systems
are becoming increasingly urgent if Slovenia is to
ensure that it remains on a sustainable growth path.
In 2018, Slovenia’s economy continued to grow
strongly. After achieving a growth rate of 4.9 % in
2017, GDP is expected to have expanded robustly
in 2018 with growth of 4.4 %. Economic growth is
expected to slow to 3.1 % in 2019 and 2.8 % in
2020, closer to Slovenia’s potential growth.
Although the expected slowdown is not dramatic,
it is nevertheless an indication that the favourable
economic climate of recent years is unlikely to
continue.
Economic growth is mostly driven by
investments. The main drivers of private
investment are expected to be: fully or almost fully
employed production facilities, increasing labour
costs and better availability of funding.
The unemployment rate continues to decline
towards its pre-crisis level. Helped by economic
growth, the unemployment rate fell to 5.6 % in
2018, and is expected to fall further in 2019 and
2020. The rate of long-term unemployment was
less than 3 % at the end of 2018, which is still
above the pre-crisis level but below the average
(1) This report assesses Slovenia’s economy in light of the
European Commission’s Annual Growth Survey published on 21 November 2018. In the survey, the Commission calls
on EU Member States to implement reforms to make the European economy more productive, resilient and
inclusive. In so doing, Member States should focus their
efforts on the three elements of the virtuous triangle of economic policy — delivering high-quality investment,
focusing reform efforts on productivity growth,
inclusiveness and institutional quality, and ensuring
macroeconomic stability and sound public finance.
rates in the EU (3.4 % in 2017) and the euro area
(4.4 %).
The inflation rate stabilised at 1.9 % in 2018.
Energy and fuel prices were the main drivers of the
increase in inflation. As nominal compensation
(i.e. without controlling for inflation) per employee
is projected to have increased by 3.9 %, real wages
will have increased by about 2 % in 2018.
Fiscal policy is becoming pro-cyclical. In 2017,
the general government balance turned positive,
(i.e. government revenues exceeded government
spending), rising from a negative balance of 1.9 %
of GDP in 2016 to a positive balance of 0.1 % of
GDP in 2017. The government balance is expected
to have increased to 0.8 % of GDP in 2018. Public
debt is forecast to decrease further to 62.5 % of
GDP in 2020, from a peak of 82.6 % in 2015,
thanks primarily to the economic recovery and
active debt management to reduce interest
payments. However, the structural deficit, that is if
taking Slovenia’s position in the business cycle
into account, deteriorated from 0.4 % in 2017 to
0.5 % in 2018, and is expected to deteriorate
further in 2019. Temporary consolidation measures
are now expiring and a substantial pay rise in the
public sector was agreed. The Fiscal Council
repeatedly stated that the intended fiscal policy
would be pro-cyclical.
Focusing investment (2) on skills,
environmental, transport and energy
infrastructure, as well as on research and
development would strengthen competitiveness
and productivity. Investment as a share of GDP
in Slovenia remains below the EU average. Skills
constraints and a slow digital transformation limit
productivity growth, while insufficient
environmental infrastructure, lacking sustainable
transport connections and a low share of green
energy hinder economic development in less
developed regions. The underused labour potential
of older workers is a challenge to inclusive growth.
Population ageing calls for significant investments
in measures to ease pressure on the healthcare and
long-term care systems. The research,
development and innovation ecosystem remains
inefficient. There are only weak links between
businesses and research institutions. Annex D
identifies key priorities for support by the
(2) Both private and public investment.
EXECUTIVE SUMMARY

Executive summary
4
European Regional Development Fund, the
European Social Fund Plus and the Cohesion Fund
over 2021-2027 in Slovenia, building on the
analysis of investment needs and challenges
outlined in this report.
Overall, Slovenia has made limited progress in
addressing the 2018 country-specific
recommendations (3).
There has been some progress in the following
areas.
Alternative sources of financing for fast-
growing companies - Slovenia is preparing
further EU-funded instruments to improve
equity funding.
Barriers for market entry and administrative
burden - The Investment Promotion Act brings
improvements but administrative burden and
regulatory restrictiveness remain problems.
Privatisation - Slovenia made an important step
in carrying out privatisations by privatising
65 % of the shares of its largest bank, Nova
Ljubljanska Banka (NLB), which was until
then fully owned by the state, and launching
the sales process for Abanka, the third largest
Slovenian bank.
There has been limited progress in the following
areas.
Older and low skilled workers - The Slovenian
government continued its efforts to increase the
employability of low-skilled and older workers
through lifelong learning and activation
measures. However, participation in adult
learning is still low, especially for this target
group.
Public procurement - Slovenia has adopted an
action plan to professionalise procurement
further, but the situation remains unchanged as
regards competition and independent oversight.
There has been no progress in the following areas.
(3) Information on the level of progress and actions taken to
address the policy advice in each respective subpart of a
country-specific recommendation is presented in the
overview table in the Annex.
Healthcare - Slovenia has not proposed any
clearly specified measure to address the
Country-Specific Recommendations. However,
as announced by the authorities, the adoption
of the draft healthcare act will follow by the
end of 2019.
Long-term care - No concrete measures have
been taken, and there is no agreed timetable for
a concrete legislative proposal. A two-year
pilot project has been initiated in 2018.
Pensions - No concrete measures have been
taken to ensure the long-term sustainability and
adequacy of the pension system, whether by
increasing the statutory retirement age or by
restricting early retirement.
Regarding progress towards its national targets
under the Europe 2020 strategy, Slovenia has
already achieved – or is well on track to achieving
– national targets for the early school leaving rate,
tertiary educational attainment, energy efficiency
and greenhouse gas emissions. However, Slovenia
is moving away from the 2020 renewable energy
target and the R&D spending target (in 2017,
Slovenia's overall R&D intensity was 1.86 % of
GDP, a significant decline from its 2013 value of
2.58 % of GDP). The employment rate is now
moving closer to the target.
Key structural issues analysed in this report, which
point to particular challenges for Slovenia’s
economy, are the following.
Slovenia is performing well on most
indicators of the Social Scoreboard
supporting the European Pillar of Social
Rights. Income inequality is low. The
education and training system is generally
performing well, but fairness in the system
could be improved. The risk of poverty and
social exclusion has decreased in recent years.
However, the labour market participation of
older workers and low-skilled is low and the
old-age poverty still remains a challenge.
The ageing of the population is putting a
strain on the pension, healthcare and long-
term care systems. Age-related expenditure
is expected to increase by six percentage
points of GDP between 2016 and 2070, one of

Executive summary
5
the highest increases in the EU. The main
driver of this is pension expenditure, with the
total amount spent on public pensions
expected to increase from 11 % of GDP in
2020 to 15.6 % in 2050. This increase can
partially be explained by the early exit from
the labour force. However, ensuring adequate
pensions remains a challenge, as some pension
recipients are still at or below the poverty line.
Financing for the healthcare system is
currently highly cyclical and inadequate to
face the expected cost increases from the
ageing of population and technological
change. Waiting times and public procurement
in healthcare are still inefficient despite recent
efforts to improve it. The authorities have
announced that the adoption of the draft
Healthcare Act will follow by the end of 2019.
Slovenia does not have an overarching law
that covers long-term care.
Inactivity rates of older and less skilled
workers are high while labour shortages
are emerging. The inactivity rate of 55-64
year-olds is significantly higher than the EU
average as is their unemployment rate. Long-
term unemployed people over 50 represent a
substantial share of the total number. This
means that a significant part of the workforce
is losing contact with the work environment.
A mismatch between the skills young people
acquire at school or in tertiary education and
the skills sought after by employers may be
contributing to the emerging labour shortages.
The situation of the Slovenian banking
sector has improved significantly, but
challenges remain and new risks emerge.
Thanks to the steady decline in non-
performing loans, banks’ profitability,
solvency and asset quality have improved.
Still, banks need to find new sources of
income and control costs to remain profitable.
House prices are growing fast but household
debt and stock of loans to the construction
sector remain low. Strong growth in consumer
lending raises credit risk and led Bank of
Slovenia to issue specific recommendations.
With the partial privatisation of NLB in
November 2018 and the initiation of the
privatisation of the third largest bank, Abanka,
by mid-2019 Slovenia is making good
progress with privatisation in the banking
sector. However, the state still plays a
dominant role in many sectors. This carries a
risk of distortion in competition and resource
allocation.
Slovenia’s small and medium-sized
enterprises (SMEs) rely extensively on bank
credit for their external financing.
Slovenia’s venture capital market is still less
developed than those of other Central and
Eastern European countries. The market
capitalisation of the national stock exchange is
low and shrinking. Public financial
instruments heavily depend on EU funding.
The lack of alternative sources of finance,
combined with limited financial and
investment literacy among many SMEs,
makes Slovenia’s SMEs less resilient if bank
credit becomes more expensive or less
available in the future.
Although the business environment is
improving, restrictive regulations and
administrative burden remain, as well as
certain weaknesses in public procurement
remain. Regulatory restrictions, including for
key professions, and administrative burdens
are still perceived as obstacles to investment,
and are considered to be one of the most
problematic factors when doing business in
Slovenia. Often lengthy commercial court
proceedings could influence the readiness of
companies to enter the market or invest. There
is further scope to improve competition,
transparency and independent oversight in
public procurement. The share of procurement
procedures for which only one bid was
received remains high as does the share of
procurement done without a call for tenders.
Strengthening safeguards against bid rigging
and corruption would also reduce the risk of
unnecessarily high procurement costs.

6
GDP growth
In 2018, Slovenia’s GDP is assumed to have
grown by 4.4 %, following the 4.9 % annual
growth recorded in 2017. Over the first three
quarters of 2018, investments grew by 11.0 %
compared to the same period in 2017. Investment
growth was particularly strong in non-residential
construction (19.5 %) and in machinery and
equipment (8.6 %). Investment in residential
construction grew by 5.0 %. During the same
period, private consumption increased by 1.8 %,
despite relatively strong growth in households’
disposable income. Exports increased by 8.3 %,
slightly less than imports which grew by 8.5 %.
Graph 1.1: Composition of GDP growth
Source: European Commission Winter 2019 forecast
Economic growth is forecast to slow down to
3.1 % in 2019 and 2.8 % in 2020. The growth
composition is expected to shift more towards
domestic demand, with net exports making a
negative contribution by 2020 (Graph 1.1). In the
medium term, growing employment and rising
wages are expected to continue to support private
consumption. Investment is expected to be driven
by high capacity utilisation rates and a tightening
labour market. Amid high-income growth, high
household savings and rapidly rising residential
real estate prices, residential investment growth is
forecast to remain strong over the forecast horizon.
Risks are mainly related to the external
environment.
Graph 1.2: Composition of potential growth
Source: European Commission Autumn 2018 forecast
Slovenia’s potential growth is rapidly
recovering. After the crisis, the country’s growth
potential was held back by low investments and
low total factor productivity growth. In 2018,
investment had a positive impact on potential
growth for the first time in several years, and total
factor productivity also contributed positively
(Graph 1.2). In the coming years, labour’s
contribution to growth will diminish as the
population ages and therefore the availability of
labour diminishes. Overall, potential growth is
currently expected to stabilise at 3 %.
Inflation
Inflation remains moderate. In 2018, it reached
1.9 %. Over the coming years, inflation is expected
to moderately increase, driven by energy prices
and expected wage growth. As the labour market
becomes tighter and wage growth continues, it is
expected that core inflation will reach 1.8 % by
2020 — driven mainly by the price increase in
services.
Labour market
The robust economic growth of recent years has
also boosted the labour market. Employment
growth was sustained (2.9 % in 2017), with job
creation across most sectors. The unemployment
rate continued to decline, falling from 8.0 % in
2016 to 6.6 % in 2017. In the same period, the
-6
-4
-2
0
2
4
6
11 12 13 14 15 16 17 18 19 20
% o
f G
DP
Public consumption Net exports
Inventories Private consumption
Investment Real GDP
forecast
-1,0
-0,5
0,0
0,5
1,0
1,5
2,0
2,5
3,0
3,5
4,0
05 07 09 11 13 15 17 19 21R
ate
of change y
-o-y
(%
)Capital Accumulation ContributionTFP ContributionTotal Labour (Hours) ContributionPF Potential Growth
1. ECONOMIC SITUATION AND OUTLOOK

1. Economic situation and outlook
7
activity rate increased from 76.2 % to 78.6 % (See
Graph 1.3).
Graph 1.3: Labour market developments in Slovenia
(1) Activity and employment rates (% of population), total,
ages 20-64, non-seasonally adjusted.
(2) Unemployment rate (% of labour force), total, ages 15-
74, seasonally adjusted.
Source: Eurostat
Despite these positive developments, structural
challenges remain. The working-age population is
shrinking as a result of demographic change. This
could hamper economic growth in the future. It
also poses challenges to the sustainability and
adequacy of the pension, health care and long-term
care systems. In addition, labour-market
participation remains low for older workers, in
particular those with lower levels of education.
The tightening labour market is putting some
upward pressure on wages, although wage
growth remains somewhat lower than expected.
Nominal compensation per employee increased by
3.2 % and by 1.5 % in real (GDP deflated) terms
(remaining somewhat below productivity growth)
in 2017. This growth rate is projected to reach
3.3 % in 2018 and 2019. Nominal compensation
per employee increased in 2017 the most in the
finance and business services sector (4.6 %) and in
the building and construction sector (4.3 %).
Despite increasing shortages being reported, the
industry sector exhibited the lowest increase in
nominal compensation per employee (2.9 %).
Social developments
Inequality in Slovenia is low and the share of
people at risk of poverty and social exclusion
has decreased, but remains high for the elderly.
The at-risk-of-poverty or social exclusion rate for
people over 65 was 18.3 % in 2017, above the all-
age-groups rate of 17.1 %. Inequality, as measured
by the ratio of incomes of the richest 20 % of
households compared to the incomes of the poorest
20 % of households, continued to decrease and
remains among the lowest in the EU.
Competitiveness
Sloveniaʼs competitiveness continued to
improve in 2017. After a small loss of export
market share in 2015, Sloveniaʼs export market
share increased by 6.8 pps in 2016 and 5.6 pps in
2017. (Graph 1.4). This increase was driven by
increases in both the export of goods and services.
Combined with modest productivity growth, the
nominal wage growth led to an increase in nominal
unit labour costs of 1.3 % in 2017. The effect on
cost competitiveness appears to be limited, as
nominal wage growth in 2017 remains only
slightly above the benchmark indicator for cost
competitiveness in both 2017 and 2018 (4).
Unit labour costs are expected to grow faster
between 2019 and 2020. Higher unit labour costs
and less demand for exports are expected to
contribute to somewhat slower export growth.
However, Slovenia’s export market shares should
continue improving in 2019 and remain stable in
2020. Imports are forecast to grow faster than
exports due to the stronger domestic demand.
(4) This hypothetical benchmark developed by the European
Commission compares actual wage developments with the wage growth that would be consistent with a constant real
effective exchange rate based on unit labour costs.
0
2
4
6
8
10
12
45
50
55
60
65
70
75
80
85
01 03 05 07 09 11 13 15 17
% of population
% of labour force
Unemployment rate 15-74 (rhs)
Activity rate 20-64
Employment rate 20-64
1. Economic situation and outlook
8
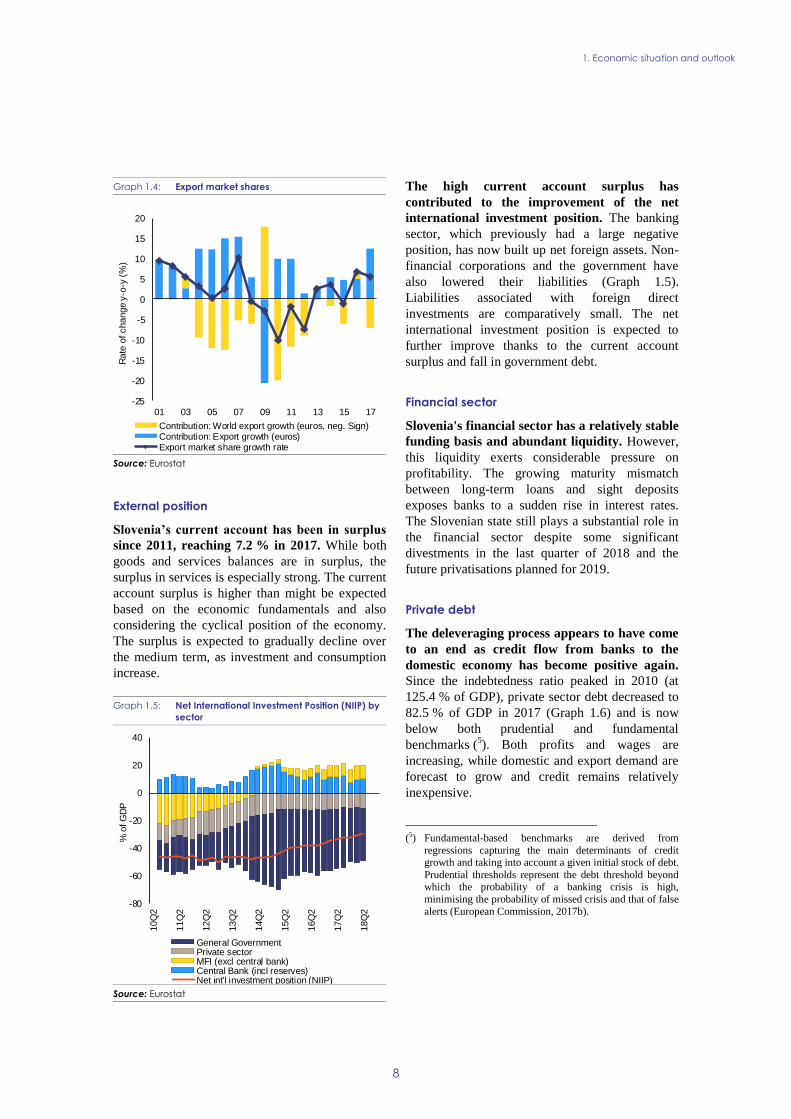
Graph 1.4: Export market shares
Source: Eurostat
External position
Sloveniaʼs current account has been in surplus
since 2011, reaching 7.2 % in 2017. While both
goods and services balances are in surplus, the
surplus in services is especially strong. The current
account surplus is higher than might be expected
based on the economic fundamentals and also
considering the cyclical position of the economy.
The surplus is expected to gradually decline over
the medium term, as investment and consumption
increase.
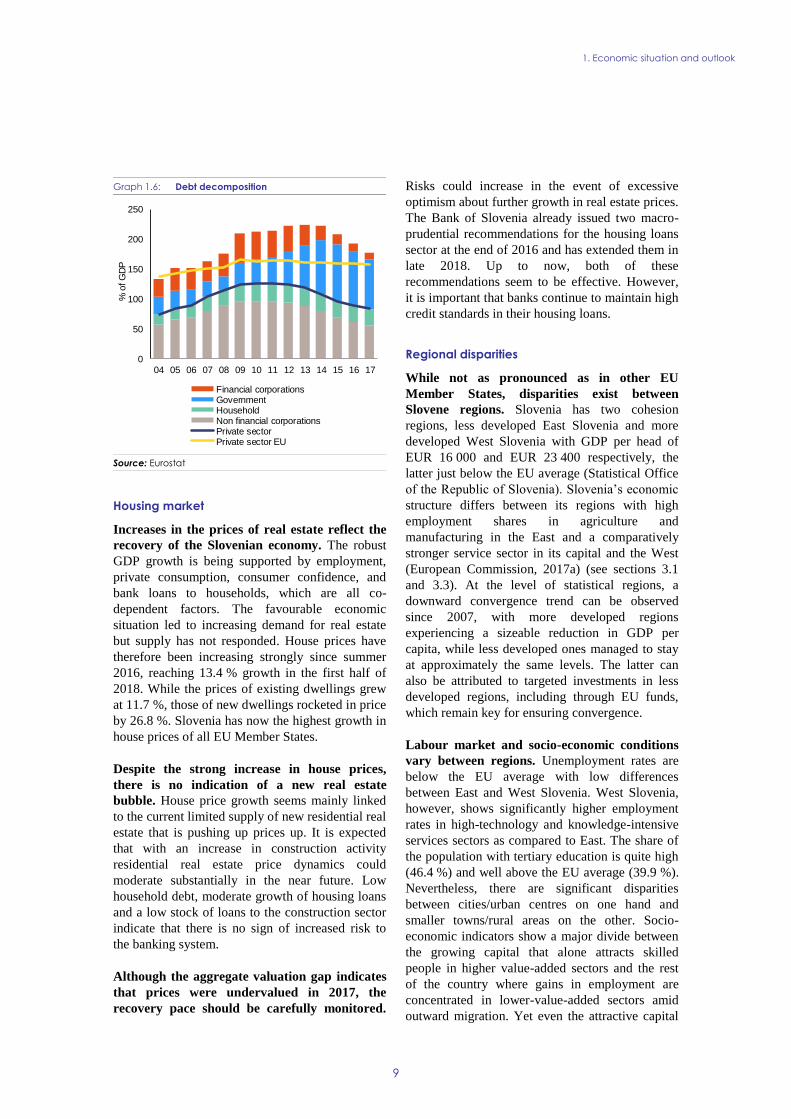
Graph 1.5: Net International Investment Position (NIIP) by
sector
Source: Eurostat
The high current account surplus has
contributed to the improvement of the net
international investment position. The banking
sector, which previously had a large negative
position, has now built up net foreign assets. Non-
financial corporations and the government have
also lowered their liabilities (Graph 1.5).
Liabilities associated with foreign direct
investments are comparatively small. The net
international investment position is expected to
further improve thanks to the current account
surplus and fall in government debt.
Financial sector
Slovenia's financial sector has a relatively stable
funding basis and abundant liquidity. However,
this liquidity exerts considerable pressure on
profitability. The growing maturity mismatch
between long-term loans and sight deposits
exposes banks to a sudden rise in interest rates.
The Slovenian state still plays a substantial role in
the financial sector despite some significant
divestments in the last quarter of 2018 and the
future privatisations planned for 2019.
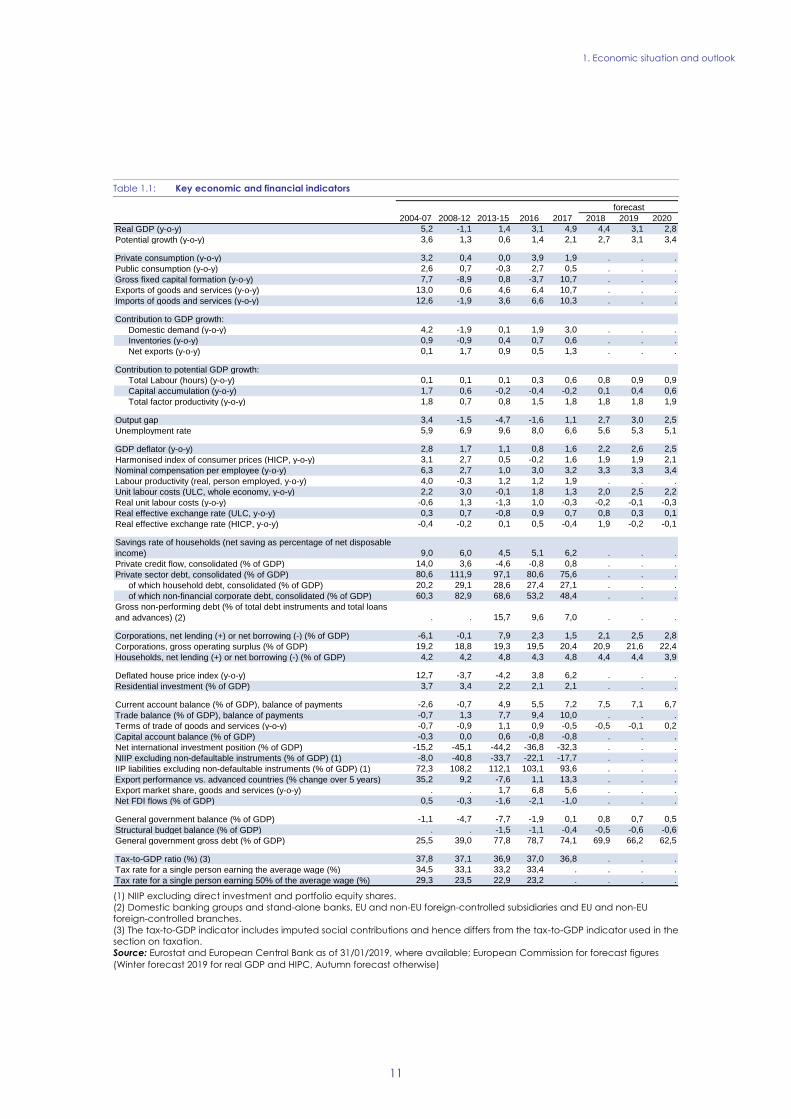
Private debt
The deleveraging process appears to have come
to an end as credit flow from banks to the
domestic economy has become positive again.
Since the indebtedness ratio peaked in 2010 (at
125.4 % of GDP), private sector debt decreased to
82.5 % of GDP in 2017 (Graph 1.6) and is now
below both prudential and fundamental
benchmarks (5). Both profits and wages are
increasing, while domestic and export demand are
forecast to grow and credit remains relatively
inexpensive.
(5) Fundamental-based benchmarks are derived from
regressions capturing the main determinants of credit growth and taking into account a given initial stock of debt.
Prudential thresholds represent the debt threshold beyond which the probability of a banking crisis is high,
minimising the probability of missed crisis and that of false
alerts (European Commission, 2017b).
-25
-20
-15
-10
-5
0
5
10
15
20
01 03 05 07 09 11 13 15 17
Rate
of change y
-o-y
(%
)
Contribution: World export growth (euros, neg. Sign)Contribution: Export growth (euros)Export market share growth rate
-80
-60
-40
-20
0
20
40
10Q
2
11Q
2
12Q
2
13Q
2
14Q
2
15Q
2
16Q
2
17Q
2
18Q
2
% o
f G
DP
General GovernmentPrivate sectorMFI (excl central bank)Central Bank (incl reserves)Net int'l investment position (NIIP)
1. Economic situation and outlook
9
Graph 1.6: Debt decomposition
Source: Eurostat
Housing market
Increases in the prices of real estate reflect the
recovery of the Slovenian economy. The robust
GDP growth is being supported by employment,
private consumption, consumer confidence, and
bank loans to households, which are all co-
dependent factors. The favourable economic
situation led to increasing demand for real estate
but supply has not responded. House prices have
therefore been increasing strongly since summer
2016, reaching 13.4 % growth in the first half of
2018. While the prices of existing dwellings grew
at 11.7 %, those of new dwellings rocketed in price
by 26.8 %. Slovenia has now the highest growth in
house prices of all EU Member States.
Despite the strong increase in house prices,
there is no indication of a new real estate
bubble. House price growth seems mainly linked
to the current limited supply of new residential real
estate that is pushing up prices up. It is expected
that with an increase in construction activity
residential real estate price dynamics could
moderate substantially in the near future. Low
household debt, moderate growth of housing loans
and a low stock of loans to the construction sector
indicate that there is no sign of increased risk to
the banking system.
Although the aggregate valuation gap indicates
that prices were undervalued in 2017, the
recovery pace should be carefully monitored.
Risks could increase in the event of excessive
optimism about further growth in real estate prices.
The Bank of Slovenia already issued two macro-
prudential recommendations for the housing loans
sector at the end of 2016 and has extended them in
late 2018. Up to now, both of these
recommendations seem to be effective. However,
it is important that banks continue to maintain high
credit standards in their housing loans.
Regional disparities
While not as pronounced as in other EU
Member States, disparities exist between
Slovene regions. Slovenia has two cohesion
regions, less developed East Slovenia and more
developed West Slovenia with GDP per head of
EUR 16 000 and EUR 23 400 respectively, the
latter just below the EU average (Statistical Office
of the Republic of Slovenia). Slovenia’s economic
structure differs between its regions with high
employment shares in agriculture and
manufacturing in the East and a comparatively
stronger service sector in its capital and the West
(European Commission, 2017a) (see sections 3.1
and 3.3). At the level of statistical regions, a
downward convergence trend can be observed
since 2007, with more developed regions
experiencing a sizeable reduction in GDP per
capita, while less developed ones managed to stay
at approximately the same levels. The latter can
also be attributed to targeted investments in less
developed regions, including through EU funds,
which remain key for ensuring convergence.
Labour market and socio-economic conditions
vary between regions. Unemployment rates are
below the EU average with low differences
between East and West Slovenia. West Slovenia,
however, shows significantly higher employment
rates in high-technology and knowledge-intensive
services sectors as compared to East. The share of
the population with tertiary education is quite high
(46.4 %) and well above the EU average (39.9 %).
Nevertheless, there are significant disparities
between cities/urban centres on one hand and
smaller towns/rural areas on the other. Socio-
economic indicators show a major divide between
the growing capital that alone attracts skilled
people in higher value-added sectors and the rest
of the country where gains in employment are
concentrated in lower-value-added sectors amid
outward migration. Yet even the attractive capital
0
50
100
150
200
250
04 05 06 07 08 09 10 11 12 13 14 15 16 17
% o
f G
DP
Financial corporationsGovernmentHouseholdNon financial corporationsPrivate sectorPrivate sector EU

1. Economic situation and outlook
10
region is facing the challenges of declining labour
productivity and capacity constraints linked to a
shortage of skills. Such inequalities can be tackled
through bottom-up initiatives, utilising the
community led local development approach,
targeting socio-economically deprived
persons/areas.
Graph 1.7: Change in pro capita GDP from 2007 to 2016
Source: Eurostat
Public finances indicators
The general government overall balance is
expected to stay in surplus for the third year in
a row. In 2017, the general government balance
turned positive, moving from -1.9 % of GDP in
2016 to 0.1 % of GDP. The ad-hoc forecast (6)
predicts a surplus of 0.8 % of GDP for 2018,
mainly due to strong revenue growth, reduced
interest expenditure and low absorption of EU
funds. Social transfers and compensation of public
6 The Commission Winter 2019 forecast, which was
published on 7 February 2019, only includes projections for GDP growth and inflation. In order to assess the
updated draft budgetary plan, the Commission Winter 2019
forecast was complemented by a fully-fledged “ad-hoc” forecast, including in particular projections for the general
government balance and the structural balance.
employees are expected to grow firmly in 2019,
driven by a continuing relaxation in temporary
restrictive measures and negotiations with trade
unions. At the same time, public investment is
projected to increase, supported by the improved
take-up of EU funds. Taking all this into account,
the government surplus is forecast to slightly
decline to 0.7 % of GDP in 2019. In structural
terms, Slovenia’s fiscal position is expected to
worsen to -0.6 % of GDP in 2019 and stay
unchanged in 2020, indicating that the country is
engaged in a pro-cyclical fiscal policy.
The debt-to-GDP ratio continues to decline.
Supported by the economic recovery and active
debt management, public debt is forecast to come
down steadily to 62.5 % of GDP in 2020.
Nevertheless, the long-term perspective is more
challenging, as government expenditure is forecast
to increase over the longer term, given that
expenditure on pensions, health care and long-term
care will increase due to the ageing of the
population.
1. Economic situation and outlook
11
Table 1.1: Key economic and financial indicators
(1) NIIP excluding direct investment and portfolio equity shares.
(2) Domestic banking groups and stand-alone banks, EU and non-EU foreign-controlled subsidiaries and EU and non-EU
foreign-controlled branches.
(3) The tax-to-GDP indicator includes imputed social contributions and hence differs from the tax-to-GDP indicator used in the
section on taxation.
Source: Eurostat and European Central Bank as of 31/01/2019, where available; European Commission for forecast figures
(Winter forecast 2019 for real GDP and HIPC, Autumn forecast otherwise)
2004-07 2008-12 2013-15 2016 2017 2018 2019 2020
Real GDP (y-o-y) 5,2 -1,1 1,4 3,1 4,9 4,4 3,1 2,8
Potential growth (y-o-y) 3,6 1,3 0,6 1,4 2,1 2,7 3,1 3,4
Private consumption (y-o-y) 3,2 0,4 0,0 3,9 1,9 . . .
Public consumption (y-o-y) 2,6 0,7 -0,3 2,7 0,5 . . .
Gross fixed capital formation (y-o-y) 7,7 -8,9 0,8 -3,7 10,7 . . .
Exports of goods and services (y-o-y) 13,0 0,6 4,6 6,4 10,7 . . .
Imports of goods and services (y-o-y) 12,6 -1,9 3,6 6,6 10,3 . . .
Contribution to GDP growth:
Domestic demand (y-o-y) 4,2 -1,9 0,1 1,9 3,0 . . .
Inventories (y-o-y) 0,9 -0,9 0,4 0,7 0,6 . . .
Net exports (y-o-y) 0,1 1,7 0,9 0,5 1,3 . . .
Contribution to potential GDP growth:
Total Labour (hours) (y-o-y) 0,1 0,1 0,1 0,3 0,6 0,8 0,9 0,9
Capital accumulation (y-o-y) 1,7 0,6 -0,2 -0,4 -0,2 0,1 0,4 0,6
Total factor productivity (y-o-y) 1,8 0,7 0,8 1,5 1,8 1,8 1,8 1,9
Output gap 3,4 -1,5 -4,7 -1,6 1,1 2,7 3,0 2,5
Unemployment rate 5,9 6,9 9,6 8,0 6,6 5,6 5,3 5,1
GDP deflator (y-o-y) 2,8 1,7 1,1 0,8 1,6 2,2 2,6 2,5
Harmonised index of consumer prices (HICP, y-o-y) 3,1 2,7 0,5 -0,2 1,6 1,9 1,9 2,1
Nominal compensation per employee (y-o-y) 6,3 2,7 1,0 3,0 3,2 3,3 3,3 3,4
Labour productivity (real, person employed, y-o-y) 4,0 -0,3 1,2 1,2 1,9 . . .
Unit labour costs (ULC, whole economy, y-o-y) 2,2 3,0 -0,1 1,8 1,3 2,0 2,5 2,2
Real unit labour costs (y-o-y) -0,6 1,3 -1,3 1,0 -0,3 -0,2 -0,1 -0,3
Real effective exchange rate (ULC, y-o-y) 0,3 0,7 -0,8 0,9 0,7 0,8 0,3 0,1
Real effective exchange rate (HICP, y-o-y) -0,4 -0,2 0,1 0,5 -0,4 1,9 -0,2 -0,1
Savings rate of households (net saving as percentage of net disposable
income) 9,0 6,0 4,5 5,1 6,2 . . .
Private credit flow, consolidated (% of GDP) 14,0 3,6 -4,6 -0,8 0,8 . . .
Private sector debt, consolidated (% of GDP) 80,6 111,9 97,1 80,6 75,6 . . .
of which household debt, consolidated (% of GDP) 20,2 29,1 28,6 27,4 27,1 . . .
of which non-financial corporate debt, consolidated (% of GDP) 60,3 82,9 68,6 53,2 48,4 . . .
Gross non-performing debt (% of total debt instruments and total loans
and advances) (2) . . 15,7 9,6 7,0 . . .
Corporations, net lending (+) or net borrowing (-) (% of GDP) -6,1 -0,1 7,9 2,3 1,5 2,1 2,5 2,8
Corporations, gross operating surplus (% of GDP) 19,2 18,8 19,3 19,5 20,4 20,9 21,6 22,4
Households, net lending (+) or net borrowing (-) (% of GDP) 4,2 4,2 4,8 4,3 4,8 4,4 4,4 3,9
Deflated house price index (y-o-y) 12,7 -3,7 -4,2 3,8 6,2 . . .
Residential investment (% of GDP) 3,7 3,4 2,2 2,1 2,1 . . .
Current account balance (% of GDP), balance of payments -2,6 -0,7 4,9 5,5 7,2 7,5 7,1 6,7
Trade balance (% of GDP), balance of payments -0,7 1,3 7,7 9,4 10,0 . . .
Terms of trade of goods and services (y-o-y) -0,7 -0,9 1,1 0,9 -0,5 -0,5 -0,1 0,2
Capital account balance (% of GDP) -0,3 0,0 0,6 -0,8 -0,8 . . .
Net international investment position (% of GDP) -15,2 -45,1 -44,2 -36,8 -32,3 . . .
NIIP excluding non-defaultable instruments (% of GDP) (1) -8,0 -40,8 -33,7 -22,1 -17,7 . . .
IIP liabilities excluding non-defaultable instruments (% of GDP) (1) 72,3 108,2 112,1 103,1 93,6 . . .
Export performance vs. advanced countries (% change over 5 years) 35,2 9,2 -7,6 1,1 13,3 . . .
Export market share, goods and services (y-o-y) . . 1,7 6,8 5,6 . . .
Net FDI flows (% of GDP) 0,5 -0,3 -1,6 -2,1 -1,0 . . .
General government balance (% of GDP) -1,1 -4,7 -7,7 -1,9 0,1 0,8 0,7 0,5
Structural budget balance (% of GDP) . . -1,5 -1,1 -0,4 -0,5 -0,6 -0,6
General government gross debt (% of GDP) 25,5 39,0 77,8 78,7 74,1 69,9 66,2 62,5
Tax-to-GDP ratio (%) (3) 37,8 37,1 36,9 37,0 36,8 . . .
Tax rate for a single person earning the average wage (%) 34,5 33,1 33,2 33,4 . . . .
Tax rate for a single person earning 50% of the average wage (%) 29,3 23,5 22,9 23,2 . . . .
forecast

12
Since the start of the European Semester in
2011, 88 % of all country-specific
recommendations addressed to Slovenia have
recorded at least ‘some progress' (see Graph
2.1). However, one out of nine CSRs have
recorded no or only limited progress in the
implementation.
Graph 2.1: Level of implementation of 2011-2018 CSRs
(1) The overall assessment of the country-specific
recommendations related to fiscal policy excludes
compliance with the Stability and Growth Pact.
(2) 2011-2012 annual assessment: Different CSR assessment
categories.
(3) The multiannual CSR assessment looks at the
implementation until 2019 Country Report since the CSRs
were first adopted.
(4) The multiannual CSR assessment looks at the
implementation until 2019 Country Report since the CSRs
were first adopted.
Source: European Commission
In 2018, the political process in Slovenia was
stalled by the snap elections held on 3 June 2018
and the difficult process of forming a new
government. The new coalition government was
endorsed by the parliament only on 13 September
2018. Since the resignation of the previous prime
minister on 14 March 2018, neither the caretaker
government nor the new government has tabled
any major policy reforms relevant to the
implementation of the 2018 CSRs (7). The
coalition agreement addresses a number of the
issues discussed in the CSRs but is not sufficiently
precise in terms of substance and timing to
conclude on progress in the implementation of the
CSRs and is neither politically nor legally binding.
(7) For the assessment of other reforms implemented in the
past, see in particular Section 3.
The public debt to GDP ratio was reduced but
pressure on public finance in the long term
remains. After the almost fourfold increase up to
82.6 % in 2015, public debt has decreased
significantly since then and is expected to have
been at 69.9 % of GDP in 2018. In parallel, the
fiscal framework has been strengthened. Some
measures have been taken to address the increase
in age-related expenditure, but the pressure on the
long-term sustainability of public finance remains
significant. At the same time, temporary measures
to contain public expenditure are expiring, leading
to a pro-cyclical fiscal policy.
The situation of the Slovenian banking sector
improved significantly. Thanks to the improved
macro-economic environment and robust policy
measures, the banking sector has improved
dramatically since 2014. The non-performing loans
ratio declined sharply to 7.4 % in June 2018, down
from 11.4 % one year earlier. At the same time,
profitability increased and the average capital
adequacy ratio is solid (18.8 % in June 2018)
despite renewed credit growth. The partial
privatisation of NLB carried out in 2018 and the
plan to privatise Abanka in the first half of 2019
represent important steps to ensure the long-term
viability of the sector.
Measures have been adopted to improve the
employability of low-skilled and older workers.
Since 2011 the Council has recommended that
Slovenia should take measures to increase the
employability of low-skilled and older workers.
The 2013 labour market reform and targeted active
labour market policies somewhat increased
employment opportunities for older and low-
skilled workers, but their participation rate remains
low.
The Slovenian authorities have taken action to
improve the business environment. They
reduced administrative burden, removed some
restrictions in regulated professions, and ensured
better governance of state-owned enterprises. A
comprehensive corporate governance system for
state-owned enterprises has been put in place in
recent years. Between 2010 and 2018, Slovenia
reduced the number of regulated professions from
323 to 215; however, the initially fast progress in
this area slowed down in recent years. In 2017, the
planning and construction legislation was
No Progress2%
Limited Progress10%
Some Progress47%
Substantial Progress21%
Full Implementation20%
2. PROGRESS WITH COUNTRY-SPECIFIC RECOMMENDATIONS
2. Progress with country-specific recommendations
13
overhauled to reduce the previously high burden
resulting from spatial and urban planning. Slovenia
also uses national and EU funding to provide
alternative funding for SMEs and fast growing
companies.
Slovenia has made limited progress in
addressing the first of the 2018 CSRs. The
government continued its efforts to increase the
employability of low-skilled and older workers
through lifelong learning and activation measures.
It announced that a new draft Healthcare Act
should be adopted by the government by the end of
2019, but it is still open how it should be financed.
While a two-year pilot project has been initiated in
2018, there are no plans to table a legislative
proposal on long-term care in 2019. No concrete
measures have been taken to ensure the long-term
sustainability and adequacy of the pension system.
Slovenia has made some progress in addressing
the second of the 2018 CSRs. Some progress has
been made in implementing key equity funding
support schemes. The so-called "Single
Document" and the Investment Promotion Act has
brought some progress in reducing barriers and
administrative burdens and to stimulate domestic
and international investments. The 2018 Action
Plan on Professionalisation is a good basis for
further professionalising public procurement in
Slovenia, while overall progress is only limited
due to a lack of action as regards competition,
independent oversight and health sector tender
aggregation. With the sale of 65 % in Nova
Ljubljanska Banka (NLB) and the launch of the
selling process for Abanka, Slovenia has made
some progress in the execution of its privatisation
plans.
Slovenia's draft budgetary plan for 2019 would
not ensure that the nominal growth rate of net
primary government expenditure does not
exceed 3.1 % in 2019. This draft budgetary plan
was transmitted to the European Commission on
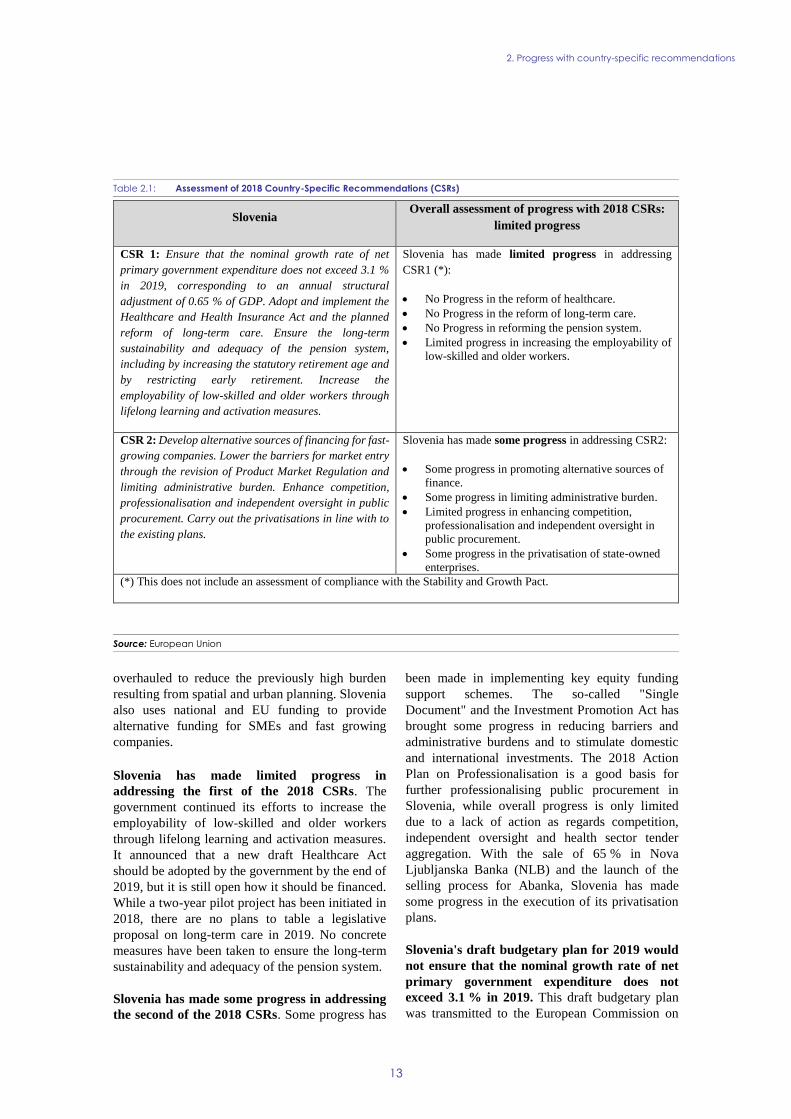
Table 2.1: Assessment of 2018 Country-Specific Recommendations (CSRs)
Source: European Union
Slovenia Overall assessment of progress with 2018 CSRs:
limited progress
CSR 1: Ensure that the nominal growth rate of net
primary government expenditure does not exceed 3.1 %
in 2019, corresponding to an annual structural
adjustment of 0.65 % of GDP. Adopt and implement the
Healthcare and Health Insurance Act and the planned
reform of long-term care. Ensure the long-term
sustainability and adequacy of the pension system,
including by increasing the statutory retirement age and
by restricting early retirement. Increase the
employability of low-skilled and older workers through
lifelong learning and activation measures.
Slovenia has made limited progress in addressing
CSR1 (*):
No Progress in the reform of healthcare.
No Progress in the reform of long-term care.
No Progress in reforming the pension system.
Limited progress in increasing the employability of
low-skilled and older workers.
CSR 2: Develop alternative sources of financing for fast-
growing companies. Lower the barriers for market entry
through the revision of Product Market Regulation and
limiting administrative burden. Enhance competition,
professionalisation and independent oversight in public
procurement. Carry out the privatisations in line with to
the existing plans.
Slovenia has made some progress in addressing CSR2:
Some progress in promoting alternative sources of
finance.
Some progress in limiting administrative burden.
Limited progress in enhancing competition,
professionalisation and independent oversight in
public procurement.
Some progress in the privatisation of state-owned
enterprises.
(*) This does not include an assessment of compliance with the Stability and Growth Pact.
2. Progress with country-specific recommendations
14
15 October and is based on a ‘no-policy-change’
assumption. The government plans to prepare
updated budget in the first quarter of 2019.

2. Progress with country-specific recommendations
15
Box 2.1: EU funds and programmes contribute to addressing structural challenges and to
fostering growth and competitiveness in Slovenia
Slovenia is a relatively large beneficiary of EU solidarity with EU investments representing almost 40 % of
all national public investment. The financial allocation from European Structural and Investment Funds (ESI
Funds) aimed to support Slovenia in facing development challenges, amounts to EUR 3.9 billion in the current
Multiannual Financial Framework, equivalent to around 1.4 % of the GDP annually. The additional national co-
financing of around EUR 1 billion brings the budget to EUR 5 billion. By the end of 2018, around EUR 2.8 billion
were already allocated to specific projects. In addition, EUR 332 million were allocated to specific projects on
strategic transport networks through a dedicated EU funding instrument, the Connecting Europe Facility.
Furthermore, numerous Slovenian research institutions, innovative firms and individual researchers benefited from
other EU funding instruments, notably Horizon 2020 which provided around EUR 210 million.
EU funding has helped to address policy challenges identified in the 2018 CSRs. ESI Funds support
competence centres for skills development in niche areas with the biggest potential for raising the international
competitiveness of the economy. ESI funds also play a key role in enhancing the implementation of the European
Pillar of Social Rights, with targeted investments in services and infrastructure designed to enhance the access to
affordable, sustainable and high quality healthcare, long-term care and social care. In addition, European Social
Fund supports tailor-made social inclusion and activation programmes for the most vulnerable groups, in particular
older, low-skilled or long-term unemployed workers. ESI Funds supported closer collaboration between business
and research institutions, and R&D investments in the private sector with direct support for nearly 6000
enterprises. Infrastructure in Slovenia was also improved, namely, 13 km of new motorways were constructed, the
projects for more than 51 000 tonnes of CO2 equivalent reduction have been decided, additional capacity of 26
megawatt of renewable energy capacity has already been contracted, and more than 300 000 persons will be
served by improved wastewater treatment.
In addition, the Commission can provide tailor-made technical support upon a Member State's request via
the Structural Reform Support Programme to help Member States implement growth-sustaining reforms to
address challenges identified in the European Semester process or other national reforms. Slovenia, for
example, received support from the Commission to assess and improve the performance of its health system, to
prepare work for the pending long-term care reform, and to provide better protection for children in need with the
development of a feasibility study for setting up a House of Children. Support is also being provided to Slovenia to
attract foreign direct investment, as well as to enhance the performance of state owned enterprises. In addition, the
Commission is assisting the authorities in their efforts to increase the awareness of capital market financing
possibilities, in particular on initial public offerings and to develop the national capital markets. In 2018,
preparatory work started to enhance the efficiency of the bank supervision system with a view to improving
financial stability and macro-prudential policy design.
EU funding contributes to mobilisation of public and private investment through grants and financial
instruments. Around EUR 306 million (7.8 % of the total) is earmarked to be delivered in the form of loans,
microloans, portfolio guarantees and equity. The investments carried out via Financial instruments will be focused
on R&D, SMEs, energy efficiency, urban development, processing of agricultural products and development of
non-agricultural and forestry activities in rural areas. In Slovenia, the overall volume of operations backed by the
European Investment Plan's European Fund for Strategic Investments (EFSI) by December 2018 amounts to
EUR 161 million, which is set to trigger a total of EUR 941 million in additional private and public investments.
EU actions strengthen national, regional and local authorities and the civil society. EUR 209 million (from
ESIF) have been allocated for strengthening the capacity of public administrations at different levels by prompting
close cooperation with stakeholders. The Regions in industrial transition action helps to address specific
challenges, such as low skills-base, high unit labour costs and deindustrialisation.
https://cohesiondata.ec.europa.eu/countries/SI
16
3.1.1. FISCAL POLICY
The general government headline balance
turned positive in 2017 but the structural deficit
has been declining since then. In 2017, the
budget reached a surplus of 0.1 % of GDP, up
from a deficit of -1.9 % of GDP in 2016.
According to the ad-hoc forecast, the surplus
accelerated further to 0.8 % of GDP in 2018 and is
expected to decline slightly to 0.7 % of GDP in
2019. In structural terms, the government balance
is forecast to have reached a structural deficit of
0.5 % of GDP in 2018. The structural deficit is
expected to worsen further to 0.6 % of GDP in
2019 (8). Taking Slovenia’s position in the
economic cycle into account, this indicates a pro-
cyclical fiscal policy and a missed opportunity to
strengthen fiscal sustainability.
Expenditure pressures continue to build up.
Over the course of 2018 and 2019, previously
introduced temporary consolidation measures in
the field of public-sector pay and social allowances
have been gradually relaxed. In addition,
Slovenian authorities and trade unions reached
agreement on a substantial pay rise amounting to
EUR 308m in 2019-2020 in November 2018.
Therefore, after recording high growth in 2018,
social transfers and compensation of employees
are projected to further increase in 2019.
Recurrent taxation of immovable property and
capital is below the EU average while the tax
burden on labour is relatively high. Recurrent
taxation of immovable property is considered to be
less distortive to economic growth than labour
taxes. However, the share of recurrent tax revenues
from immovable property to GDP is around three
times lower in Slovenia compared to the EU
average (0.5 % of GDP compared to an EU
average of 1.6 % in 2017). A larger fraction
(around 70 % according to OECD data) of
property tax burden is borne by businesses. In
terms of revenues from capital taxes relative to
GDP, Slovenia ranks among the lowest in the EU
(8) For Slovenia, the output gap (and therefore the structural
balance) estimate is subject to uncertainty. The
Commission considers this in its assessment of Slovenia’s updated draft budgetary plan.
(4.3 % of GDP compared to an EU average of
8.6 % in 2017). At the same time, secondary
earners with low wages face high labour tax rates,
decreasing their work incentives (9). A new reform
on real estate tax is planned for 2020 with the aim
to relieve businesses and to link the tax base to the
properties’ market value in a budget neutral way,
using a mass valuation system. The Mass
Valuation Act was adopted and is expected to be
applied to all properties in mid-2019. Box 3.1.1
discusses the simulation results of an increase in
real estate tax for households, compensated by a
revenue-neutral reduction in tax burden on labour
and a strengthening of the social safety net.
3.1.2. FISCAL FRAMEWORK
The Fiscal Council warns of non-compliance
with fiscal rules in the years 2018 to 2021. The
Fiscal Council assessed that most fiscal rules were
respected in 2017 and that the fiscal policy was
appropriate (Fiscal Council, 2018a). However,
after examining the 2018 stability programme
drafted based on unchanged policies, it called on
the government to take additional measures to
avoid non-compliance with the fiscal rules in the
years 2018 to 2021. According to the Fiscal
Council, the coalition agreement fails to address
adequately long-term risks to fiscal sustainability.
The Fiscal Council warned in autumn 2018, and
again in January 2019, that, if implemented as
agreed, the fiscal policy of the new government
would be pro-cyclical (Fiscal Council, 2018b;
Fiscal Council, 2019).
3.1.3. DEBT SUSTAINABILITY ANALYSIS AND
FISCAL RISKS
Government debt has been gradually
decreasing from its peak of 82.6 % of GDP in
2015. Since 2016, Slovenia has been extending the
maturity of its debt portfolio and executing cross-
currency liability management transactions, thus,
benefiting from the low interest rate environment.
Due to this, Slovenia could reduce its implicit
(9) The average labour tax rate for secondary earners at 67 %
of average wage is at 35.6 % and significantly above the
EU average of 31.3 %.
3. REFORM PRIORITIES
3.1. PUBLIC FINANCES AND TAXATION

3.1. Public finances and taxation
17
interest rate to below 3 % of GDP by the end of
2018 from 4.1 % of GDP in 2015. Because of
strong economic growth, reduced interest
expenditure, and the 2017 primary surplus, the
debt-to-GDP ratio declined from 74.1 % of GDP in
2017 to 69.9 % of GDP in 2018. Based on the ad-
hoc forecast, the debt ratio will stand at 66.2 % of
GDP in 2019.
The outlook for fiscal sustainability appears
sound in the short term. The short-term risks of
fiscal stress in the short term, as indicated by the
sustainability gap indicator S0, are low, with both
fiscal and financial competitiveness sub-indices far
below the critical thresholds.
Overall, Slovenia is deemed to face medium
fiscal sustainability risks in the medium term.
The sustainability gap indicator S1 points to
medium risks, mainly due to the projected increase
in age-related public spending (10
). According to
this indicator, a cumulative gradual improvement
in the structural primary balance of 0.2 percentage
points of GDP, relative to the baseline scenario,
would be required over 5 years to reach the debt
ratio of 60 % of GDP by 2033 (11
). At the same
time, the debt sustainability analysis points to low
risks over the medium term. Under the baseline
scenario of no-policy-change (12
), the government
debt level is expected to decline until 2027, thanks
to the projected fiscal effort and a favourable
differential between the implicit interest rate on
government debt and the growth rate of the
economy (snowball effect). As ageing costs start
outpacing these two positive effects, debt is
projected to increase again in 2028 and 2029, but
stay well below the 60 % government debt-to-GDP
ratio reference value. If Slovenia was to adhere to
the fiscal rules under the Stability and Growth Pact
(13
), the debt-to-GDP ratio would lie 15 percentage
(10) For an overview of the Commission’s assessment of fiscal
sustainability, see European Commission (2019c). (11) The following thresholds apply: (i) for values lower than 0
the country is assigned low risk; (ii) for values lower than 2.5 it is assigned medium risk; (iii) for values greater than
2.5 the country is assigned high risk.
(12) This scenario is based on the 2018 Autumn Forecast (European Commission, 2018a) and on long-run
convergence assumptions of underlying macroeconomic variables (real interest rate, real GDP growth, inflation)
agreed by the Economic Policy Committee. Under the
baseline scenario, it is assumed that fiscal policy stays constant beyond the forecast horizon.
(13) European Commission forecasts for the first projection year; thereafter assumption of full compliance with
points below the baseline projection in 2029. By
contrast, government debt in 2029 would exceed
the 60 % of GDP threshold if the structural
primary balance converges to its historical average
(Graph 3.1.1) (14
).
Graph 3.1.1: Gross debt as % of GDP - Debt Sustainability
Analysis
Source: European Commission
The projected increase in age-related
expenditure poses a challenge to the
sustainability of Slovenia’s public finances in
the long term. Age-related public spending is
expected to rise from 21.9 % of GDP in 2016 to
28.2 % of GDP in 2070, strongly affecting the
sustainability gap indicator S2. The S2 indicator
shows that a fiscal adjustment of 5.5 percentage
points of GDP is required to ensure the debt-to-
GDP ratio stabilises in the long term (15
). This
result is primarily due to the projected increase in
spending on pensions (contributing 3.3 pps of GDP
to the increase), health care (0.8 pps of GDP) and
long-term care (0.7 pps of GDP). Slovenia is
considered at medium risk in the baseline long-
term projections. However, the more adverse
excessive deficit procedure recommendations and
convergence to the medium-term objective, according to the matrix of required fiscal adjustment from the
Commission Communication on flexibility in fiscal rules. (14) The historical structural primary balance scenario assumes
gradual convergence to the historical average for the
structural primary balance over the four years following the forecast. All other macroeconomic assumptions are the
same as in the baseline.
(15) The following thresholds apply: (i) if the value is lower
than 2, the country is assigned low risk; (ii) if it is between
2 and 6, it is assigned medium risk; and (iii) if it is greater than 6, the country is assigned high risk.
25
35
45
55
65
75
85
95
13 14 15 16 17 18 19 20 21 22 23 24 25 26 27 28 29
% o
f G
DP
Baseline no-policy change scenario
Historical Structural Primary Balance scenario
Stability and Growth Pact (SGP) scenario

3.1. Public finances and taxation
18
scenarios (including greater spending on health
care and long-term care, historical patterns for
structural primary balance or higher life
expectancy) indicate high long-term fiscal
sustainability risks to be borne by future
generations.
3.1.4. PENSION SYSTEM
The 2012 pension reform brought tangible
benefits, but population ageing puts
considerable pressure on the sustainability and
adequacy of the pension system. The pension
reform (ZPIZ-2) (16
) has temporarily slowed down
the increase (17
) in the number of old-age
pensioners. It also decreased the number of other
types of pensioners (18
). The current rules are
expected to keep the pension system relatively
stable over the next 10years but the long-term
sustainability of the pension system is not ensured.
In 2017, the previous government reached a
consensus with the social partners on key starting-
points for the modernisation of the pension and
disability insurance system. They agreed upon the
broad outline of a pension reform to be adopted by
2020. The outline includes measures to achieve a
sustainable and transparent pension system, which
will also provide adequate pensions in the long
run. The work priorities for the government
published in January 2019 refer only to an update
of the White Paper and the “drafting of core points
of departure” for a reform but do not provide a
time line.
Long-term projections indicate that pension
spending will soon start increasing again and
that the ratio of the active working population
to pensioners will deteriorate faster. Gross
public pension expenditure, as a share of GDP,
will rise from 11 % in 2020 to 15.6 % in 2050.
This shows that expenditure on pensions will
increase at one of the fastest rate among all EU
countries (European Commission, 2018b). This
can mostly be explained by (i) early exit from the
(16) Pension and Disability Insurance act (2012)
(17) According to the Institute of Macroeconomic Analysis and Development (IMAD) the slow-down in the increase of
number of pensioners might be a one-off effect reflecting a surge in their number in the years before and after the
adoption of the act.
(18) Beneficiaries of disability, survivor's, widower's and partial old-age pension insurance benefits
labour force, itself largely a result of previous
pension legislation, and (ii) the retirement of the
most sizeable generations, which will also enjoy
longer retirement due to increased longevity
(IMAD and MoLFSAEO, 2018).
Previous financial consolidation measures
heavily affected the level of current and future
pensions and the minimum income provision
for older people. The challenge to ensure
adequate pensions is especially significant for
people with incomplete or short working careers,
those working in intermittent jobs, and the self-
employed. As the number of people working part-
time or on fixed-term labour contracts increased
during the economic crisis, pension adequacy
might become even more critical in the future
(European Commission and Social Protection
Committee, 2018).
The at-risk-of-poverty rate (AROPE) (19
)
among those over 65 remains above the EU
average, mostly due to relatively low pensions
(see Section 3.3.3). At present, the replacement
ratio of pension income to income before
retirement is below the EU average. The Slovenian
pension system produces a lower aggregate
replacement ratio (0.47 compared with the EU
average of 0.58). And even though total household
savings are high compared to other EU countries,
Slovenes save relatively little for old age (IMAD
and MoLFSAEO, 2018). The act Amending the
Pension and Disability Insurance Act in 2017
(ZPIZ-2C) increased the minimum old-age and
disability pension to EUR 500 per month for
pensioners who had fulfilled the full retirement
conditions. This amount slightly exceeds the
income threshold for entitlement to income
supplement, thus ensuring basic social security for
this group of pensioners. (European Commission,
2018b) The number of pensioners affected by this
reform was estimated at 45 291 (46 % of all
pensioners with a pension between EUR 400 and
EUR 500) (European Commission and Social
Protection Committee, 2018).
Data on the working years of younger
generations reveal substantially lower values of
(19) AROPE: At-risk-of-poverty or social exclusion rate (% of
total population). People who are at-risk-of poverty and/or suffering from severe material deprivation and/or living in
household with zero or very low work intensity.

3.1. Public finances and taxation
19
pension base. Younger generations will have
accrued a lower number of working years at
retirement age and consequently receive lower
pensions. (European Commission and Social
Protection Committee, 2018). The low number of
accrued working years is even more of a concern
for non-standard workers, whose lower density of
work (compared to standard employment) is an
additional problem. Relatively short insurance
periods have negative consequences for the long-
term social security of workers on fixed-term
contracts (including casual and seasonal workers,
temporary agency workers, workers on civil
contracts, etc.). Student work now qualifies as a
pension insurance period, but the insurance base is
low.
Self-employed workers face challenges for the
adequacy of their pensions if they only pay
minimum contributions. Self-employed
people (20
) in Slovenia are insured against all risks
and at the same rates as employees on permanent
full-time employment contracts and their
employers. However, almost 70 % of the self-
employed pay social security contributions at the
minimum base and will be entitled to the minimum
old-age pension only (European Commission and
Social Protection Committee, 2018).
3.1.5. HEALTH CARE AND LONG-TERM CARE
The projected increase in healthcare spending
threatens the long-term fiscal sustainability of
the system. In 2017, Slovenia spent 8.0 % of GDP
on healthcare, which is below the EU average of
9.6 %. However, driven by changes in
demographic structure, public spending on health
care is projected to increase by 18% or 1.0 pp. of
GDP, more than the 13% average increase in the
EU (0.9 pps) according to the ‘AWG reference
scenario’ (European Commission, 2017a). When
taking into account the impact of non-demographic
drivers on future spending growth (‘AWG risk
scenario’), healthcare expenditure is expected to
increase by 2 pps of GDP from now until 2070
(EU: 1.6 pps).
(20) A ‘self-employed person’ is defined by the Labour Market
Regulation Act (2010, Article 5), but also by the acts regulating social security insurance; primarily the Pension
and Disability Insurance Act (2012)
The share of government budget funding for
healthcare is one of the lowest in the EU but
healthcare financing is still highly pro-cyclical.
General national and municipal-level taxation
represents only 6 % of current health expenditure.
Transitioning towards a system that is less reliant
on contributions could improve the future stability
of healthcare financing. The Slovenian authorities
are currently preparing a policy reform to avoid
further strain in the financing of the system, but no
act has been adopted yet. The services intend to
update a new draft Health Care and Health
Insurance Act and the draft Long Term Care Act
and to consult on them publicly before submitting
them to the parliament in 2019.
The authorities plan to focus on efficiency and
effectiveness of healthcare. They aim to reduce
waiting times and to improve the efficiency and
effectiveness of the public health network (the
management of healthcare institutions, quality and
safety in healthcare and in long-term care for the
elderly and decent ageing). The financing of the
reform remains the main unresolved issue.
Amenable mortality levels are in general low,
but challenges remain. Life expectancy at birth
remain one of the best in the EU. On the other
hand, preventable mortality and obesity rates are
above the EU average with evident differences
between NUTS 3 regions. Mortality from liver
cirrhosis in men is among the highest in Europe. In
the elderly population, healthy life years at the age
of 65 are below EU average. In 2016, healthy life
years were 8 pps below the EU average for women
and 6 pps below the EU average for men (IMAD,
2018). Investments in modernising health
infrastructure, such as addressing disparities
between regions in terms of hospital beds per
population ratio, services for prevention, screening
and early diagnosis at the primary care level,
specialised diagnostic and treatment programmes
at outpatient and palliative care can improve
efficiency in healthcare. EU funds are supporting
health promotion activities to reduce health
inequalities at community level and promote
healthy lifestyles.
An ageing population and a growing burden of
chronic diseases is expected to boost demand
for a more efficient mix of care models.
Provision of acute care hospitals beds is above the
EU average (422 beds per 100 000 inhabitants in

3.1. Public finances and taxation
20
2015 versus 402 in the EU) However, the
occupancy rate of acute care hospital beds is below
average (68.8 % in Slovenia compared to 76.8 %
in the EU). This points to excess capacity,
suggesting there is room to improve efficiency
with the existing infrastructure (21
). The proportion
of surgical procedures conducted as day cases is
extremely low compared to the EU average (9.7 %
versus 32.3 % in 2015). Moreover, there may be
scope to increase medical equipment if the lack of
such equipment contributes to excessive waiting
times for diagnostics (22
).
Attracting physicians to primary care remains
difficult. Although there has been a steady
increase in recent years, the number of physicians
and the share of general practitioners are still
below the EU average (19 % versus 23 % in the
EU). The uneven geographic distribution of
doctors and difficulties in recruiting and retaining
doctors in all areas are significant policy issues.
Slovenia does not have enough healthcare
personnel, which makes it a priority for the
country to use its available resources as effectively
as possible, for example through training, research
opportunities and e-health solutions.
Public procurement aggregation in Slovenia's
health sector remains underdeveloped (23
). In
2018, not much progress was made to improve
procurement aggregation, besides the extension of
a database on prices. The reason for this was a lack
of staff. Slovenia has not yet set up a dedicated
central purchasing body for health sector
procurement, which would bring about a higher
level of professionalisation. This would make it
possible to organise centralised procurement
procedures and to advise individual hospitals on
procurement procedures for very technical
supplies. The lack of a proper procurement
strategy for the health sector limits Slovenia's
ability to harmonise tenders, share expertise for
tenders and effectively mitigate the risk of bid-
rigging.
(21) In 2016, there were 533 hospital beds per 100 000
inhabitants in Western but only 373 in Eastern Slovenia. (22) For example, the number of computed tomography
scanners and magnetic resonance imaging units per 100 000 inhabitants is below the EU average (1.3
compared to 2.2 EU average and 0.8 compared to the 1.7
EU average, respectively). (23) For a discussion on public procurement more generally see
section 3.4.4 below.
The services envisage the creation of a health
technology assessment agency. Health
technology assessment would be an asset in the
efficient allocation of resources and could help to
determine which benefits should be covered by the
Health Insurance Institute of Slovenia. Only
certain mechanisms of it are used during regular
assessments within the Agency for Medicinal
Products and Medical Devices of the Republic of
Slovenia, the Health Insurance Institute of
Slovenia and the Health Council.
Waiting times for medical treatment depend on
efficient healthcare services. The share of unmet
need due to waiting times is broadly in line with
the EU average. However, waiting times have
increased markedly in Slovenia (see also box
3.3.1). The share of people reporting waiting times
for some specialist services increased from 6 % in
2007 to 13 % in 2015 (OECD/European
Observatory on Health systems and Policies,
2017). Moreover, only about 67 % of patients aged
65 and over were operated on within 2 days of
their admission for a hip fracture, below the EU
average of 77 %. Information and communications
technology could improve nationwide access to
information, including the monitoring of waiting
times for a broad set of services.
In 2014, the share of Slovenes reporting
depression was above the EU average. National
reports suggest an increasing trend of mental
health incidents in children and young people in
recent years (24
). Reports also suggest
overcrowding in social-welfare institutions. In
March 2018, national authorities started to follow
up on these issues with the adoption of a
Resolution on a National Mental Health
Programme 2018-2028.
Due to population ageing, the number of elderly
needing long-term care (LTC) has been
increasing, and will continue to increase. In
2015, there were more than 61 000 recipients of
long-term care (25
). The provision of services is
quite fragmented, as only recipients in institutional
setting receive integrated long-term care. The rest
are in home care (OECD/European Commission
2018). It has been estimated (Majcen et al., 2016)
(24) Resolution on a National Mental Health Programme 2018–
2028. (25) Statistical office of the Republic of Slovenia, www.stat.si

3.1. Public finances and taxation
21
that, in addition to home and institutional care,
there were 104 000 people receiving informal care
in Slovenia, and that the care needs of 35 500 were
unmet. There is also a discrepancy between urban
and rural areas. Rural areas frequently do not
provide sufficient institutional care or home care,
while urban areas tend to offer a wide range of
services.
The coalition agreement mentions the
establishment of an autonomous, integrated and
sustainable LTC system one of the main goals
of the new government. To date, there is still no
single, overarching legislative act in Slovenia that
covers LTC. The current fragmented system in
Slovenia results in financing challenges, risks of
inefficiencies and may cause difficulties for users
(European Commission, 2018b). In 2020, the
government intends to put forward a unified
legislative act on LTC with a comprehensive
description of the services to be provided.
However, at present, the financing of the services
still needs to be agreed at inter-ministerial level.
There will also be accompanying measures such as
training of staff, use of information and
communication technologies, promotion of social
inclusion and elderly employability programmes to
achieve a higher quality of life for the elderly and
help them stay at home as long as possible. There
is also a plan to set up a real estate strategy to take
care of the specific needs of an ageing population.
A two-year pilot project was launched in 2018
to help prepare concrete measures to reform
LTC. Its main objective is to assess solutions
proposed in a draft legislative act on LTC in three
environments (urban, semi-rural and rural) and to
show their advantages and shortcomings in
practice. The project therefore aims to establish a
single entry point for the LTC system in Slovenia
that will provide an affordable, accessible and fair
service to the population. It will also offer training
and support coordination between service
providers, non-governmental organisations,
volunteers and local communities.
3.1.6. STATE OWNED ENTREPRISES
The performance of state-owned enterprises
further improved in 2017. In 2017, the
performance of state-owned enterprises, that are
fully managed by the Slovenian Sovereign Holding
(SSH), exceeded the targets set in the management
acts, with a 6.5 % net return on equity on an
aggregated basis (SSH, 2018). While the return on
equity increased by 0.6 pps to 6.3 % for the
‘strategic companies’ (26
), it decreased by 1 pp. to
8.9 % for the rest of the portfolio.
The sale of 65 % of the shares in NLB on the
stock market in autumn 2018 is a significant
step in the reduction of state ownership in the
banking sector. Until that sale, NLB was fully
state-owned and the state still remains the largest
individual shareholder. With the sale, which had
been long delayed, Slovenia has fulfilled the first
set of commitments (as amended in 2018) given to
the European Commission in reaction to the state
aid provided to NLB in 2013. SSH intends to
proceed with the privatisation according to the
strategy and in line with the commitments given by
Slovenia to the European Commission. This means
that the remaining proportion of shares (of up to
75 % minus one share) will be sold before the end
of 2019.
As a next step, Abanka, the third largest bank
in Slovenia, will be privatised in 2019. The sales
process was already launched in October 2018.
The privatisation of this fully state-owned bank
should be completed in 2019.
(26) Strategic companies have, in addition to economic goals, to
attain strategic and development goals; in particular the
realisation of important social interest and maintaining key
development factors in Slovenia.

3.1. Public finances and taxation
22
Box 3.1.1: Shifting taxation from labour to immovable property
The European Commission Joint Research Centre conducted simulations of the effects of a tax
shift from labour to immovable property in Slovenia. The simulations are based on the
EUROMOD model using 2016 EU-SILC data (1). The key assumption is an increase in the
revenues from recurrent taxation of immovable property from currently 0.5 % of GDP to the EU
average of 1.6 % of GDP (European Commission, 2018c). In addition, the households’ share in the
revenues from recurrent property taxation is set to rise from around 30 % to 50 %, in line with the
government’s intention to reduce the burden on businesses (as indicated in the released blueprint
for the new recurrent property tax). The simulation estimates the distributional and labour
supply (2) effects of two hypothetical scenarios to use the extra revenues for: (i) a refundable
means-tested benefit for residents with low incomes (‘Scenario 1’) (3); (ii) a refundable lump-sum
reduction in employees’ social insurance contributions (SIC) for active employees older than 55 or
with low incomes (‘Scenario 2’) (4). Both scenarios would result in a revenue-neutral reform.
Scenario 1 reduces the tax burden on labour for employees and strengthens the social support for
vulnerable groups, i.e. pensioners (see section 3.1.4.). The results reveal a strong positive
distributional effect as the increase in disposable income caused by the means-tested benefit more
than offsets the reduction caused by the higher tax rate on immovable property for lower-income
households. Inequality as measured by the S80/S20 quintile ratio decreases by 1.9 % (Graph 1). In
terms of labour supply, Scenario 1 shows a shift to part-time work (increase by 0.6 %) while the
labour market participation remains broadly unchanged (decrease by 0.05 %). This result could be
explained by employees’ decision to substitute work time for leisure (income effect) combined
with the choice of inactive people not eligible for the benefit to take-up work (substitution effect).
In Scenario 2, the impact on labour supply is positive, especially for singles, with their labour
market participation and total hours worked rising by 0.4 % (see section 3.3.3.). At the same time,
the inequality decreases, although only slightly compared to Scenario 1. Overall, both scenarios
show a positive impact of a revenue-neutral tax shift from labour to immovable property, with a
positive distributional effect in Scenario 1 and a favourable labour supply outcome in Scenario 2.
Graph 1: Distributional (on the left) and labour supply (on the right) effects for both scenarios
Source: European Commission Joint Research Centre, calculations based on the EUROMOD model / EU-SILC
(1) EUROMOD is the tax-benefit microsimulation model for the EU. It simulates individuals' and households' benefit entitlements and tax liabilities (including social security contributions) according to the rules in place in each Member
State. Incomes reported in the EU-SILC (EU Statistics on Income and Living Conditions) of 2016 refer to 2015. (2) The labour supply model does not capture any shifts in or out of retirement and self-employment.
(3) The following annual income thresholds and amounts of refundable means-tested benefit apply: (i) for incomes lower
than EUR 11 166.37, the benefit equals EUR 307.41; (ii) for incomes above EUR 11 166.36, it decreases proportionally to the tax base until it reaches zero at EUR 18 903.76 (i.e. average wage based on 2017 OECD data).
(4) Active employees receive an annual refundable lump-sum SIC reduction of (i) EUR 1 500 if they are older than 55; (ii)
EUR 633.97 if their income is below EUR 12 602.51 (i.e. 67 % of average wage based on 2017 OECD data).
-1,0%
0,0%
1,0%
2,0%
3,0%
Scenario 1 Scenario 2
Reduction in inequality
-0,10%
0,00%
0,10%
0,20%
0,30%
Scenario 1 Scenario 2
Change in labour market participation
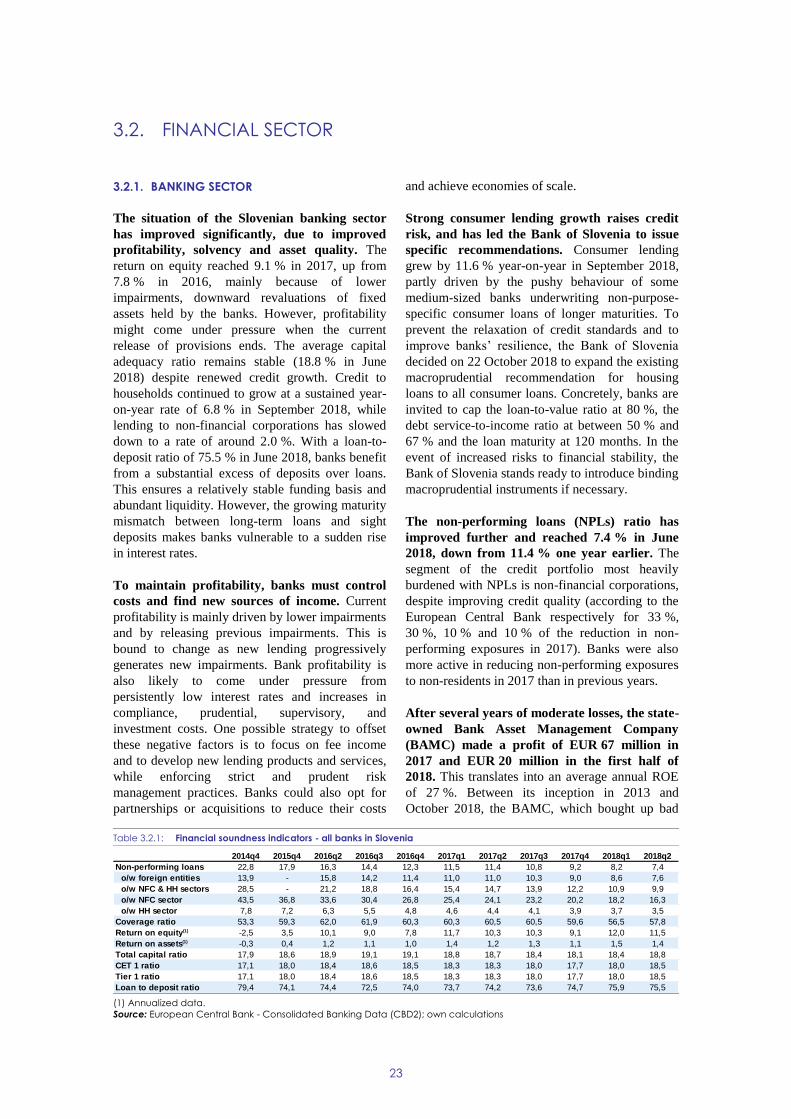
23
3.2.1. BANKING SECTOR
The situation of the Slovenian banking sector
has improved significantly, due to improved
profitability, solvency and asset quality. The
return on equity reached 9.1 % in 2017, up from
7.8 % in 2016, mainly because of lower
impairments, downward revaluations of fixed
assets held by the banks. However, profitability
might come under pressure when the current
release of provisions ends. The average capital
adequacy ratio remains stable (18.8 % in June
2018) despite renewed credit growth. Credit to
households continued to grow at a sustained year-
on-year rate of 6.8 % in September 2018, while
lending to non-financial corporations has slowed
down to a rate of around 2.0 %. With a loan-to-
deposit ratio of 75.5 % in June 2018, banks benefit
from a substantial excess of deposits over loans.
This ensures a relatively stable funding basis and
abundant liquidity. However, the growing maturity
mismatch between long-term loans and sight
deposits makes banks vulnerable to a sudden rise
in interest rates.
To maintain profitability, banks must control
costs and find new sources of income. Current
profitability is mainly driven by lower impairments
and by releasing previous impairments. This is
bound to change as new lending progressively
generates new impairments. Bank profitability is
also likely to come under pressure from
persistently low interest rates and increases in
compliance, prudential, supervisory, and
investment costs. One possible strategy to offset
these negative factors is to focus on fee income
and to develop new lending products and services,
while enforcing strict and prudent risk
management practices. Banks could also opt for
partnerships or acquisitions to reduce their costs
and achieve economies of scale.
Strong consumer lending growth raises credit
risk, and has led the Bank of Slovenia to issue
specific recommendations. Consumer lending
grew by 11.6 % year-on-year in September 2018,
partly driven by the pushy behaviour of some
medium-sized banks underwriting non-purpose-
specific consumer loans of longer maturities. To
prevent the relaxation of credit standards and to
improve banks’ resilience, the Bank of Slovenia
decided on 22 October 2018 to expand the existing
macroprudential recommendation for housing
loans to all consumer loans. Concretely, banks are
invited to cap the loan-to-value ratio at 80 %, the
debt service-to-income ratio at between 50 % and
67 % and the loan maturity at 120 months. In the
event of increased risks to financial stability, the
Bank of Slovenia stands ready to introduce binding
macroprudential instruments if necessary.
The non-performing loans (NPLs) ratio has
improved further and reached 7.4 % in June
2018, down from 11.4 % one year earlier. The
segment of the credit portfolio most heavily
burdened with NPLs is non-financial corporations,
despite improving credit quality (according to the
European Central Bank respectively for 33 %,
30 %, 10 % and 10 % of the reduction in non-
performing exposures in 2017). Banks were also
more active in reducing non-performing exposures
to non-residents in 2017 than in previous years.
After several years of moderate losses, the state-
owned Bank Asset Management Company
(BAMC) made a profit of EUR 67 million in
2017 and EUR 20 million in the first half of
2018. This translates into an average annual ROE
of 27 %. Between its inception in 2013 and
October 2018, the BAMC, which bought up bad
3.2. FINANCIAL SECTOR
Table 3.2.1: Financial soundness indicators - all banks in Slovenia
(1) Annualized data.
Source: European Central Bank - Consolidated Banking Data (CBD2); own calculations
2014q4 2015q4 2016q2 2016q3 2016q4 2017q1 2017q2 2017q3 2017q4 2018q1 2018q2
Non-performing loans 22,8 17,9 16,3 14,4 12,3 11,5 11,4 10,8 9,2 8,2 7,4
o/w foreign entities 13,9 - 15,8 14,2 11,4 11,0 11,0 10,3 9,0 8,6 7,6
o/w NFC & HH sectors 28,5 - 21,2 18,8 16,4 15,4 14,7 13,9 12,2 10,9 9,9
o/w NFC sector 43,5 36,8 33,6 30,4 26,8 25,4 24,1 23,2 20,2 18,2 16,3
o/w HH sector 7,8 7,2 6,3 5,5 4,8 4,6 4,4 4,1 3,9 3,7 3,5
Coverage ratio 53,3 59,3 62,0 61,9 60,3 60,3 60,5 60,5 59,6 56,5 57,8
Return on equity(1) -2,5 3,5 10,1 9,0 7,8 11,7 10,3 10,3 9,1 12,0 11,5
Return on assets(1) -0,3 0,4 1,2 1,1 1,0 1,4 1,2 1,3 1,1 1,5 1,4
Total capital ratio 17,9 18,6 18,9 19,1 19,1 18,8 18,7 18,4 18,1 18,4 18,8
CET 1 ratio 17,1 18,0 18,4 18,6 18,5 18,3 18,3 18,0 17,7 18,0 18,5
Tier 1 ratio 17,1 18,0 18,4 18,6 18,5 18,3 18,3 18,0 17,7 18,0 18,5
Loan to deposit ratio 79,4 74,1 74,4 72,5 74,0 73,7 74,2 73,6 74,7 75,9 75,5

3.2. Financial sector
24
loans from the country's banks in 2013 and 2014,
generated cumulative cash flows of EUR 1.5
billion, representing nearly 72 % of the transfer
value of its assets. The last bonds issued to finance
asset transfers were repaid in December 2017 and
refinanced by bank loans. In June 2018, the
BAMC managed to sell 56 % of the initial EUR 2
billion of assets transferred to it. Its objective is to
reduce its assets to EUR 100 million by the end of
its mandate in December 2022. Still, the BAMC is
confronted with a number of challenges. For
example, achieving the cost efficiency ratio set by
the government will become more and more
difficult as residual assets are more costly to
manage. In addition, keeping skilled staff with
knowledge of the files in a company with a short
life expectancy is challenging as their competences
can sometimes be better remunerated elsewhere.
The stake of the Slovenian state in the financial
sector has recently decreased; however it
remains substantial, in particular in insurance.
The Slovenian state controls a significant share of
the financial sector through its stakes in NLB,
Abanka-Celje and Sava Re. It has recently made
steps in the right direction such as the sale of NLB
shares in 2018, the commitment to reduce state
ownership to 25 % plus one share by the end of
2019 and the privatisation of Abanka-Celje in
2019 (see Section 3.1.6.). In the insurance sector,
the stake of the state is 60 %, an unusually high
share in such a non-strategic sector, making
Slovenia an outlier in the EU. Two attempts by a
foreign insurance group to increase its stake in
Sava Re were rejected. As demonstrated by the
crisis that hit Slovenia in 2013, maintaining a high
level of state involvement may entail risks in the
long run for financial stability, economic
efficiency and public finances.
3.2.2. ACCESS TO FINANCE FOR SMALL AND
MEDIUM-SIZED COMPANIES
Internal finance and bank credit conditions are
satisfactory for Slovenian businesses. Slovenian
businesses, notably SMEs, heavily rely on bank
credit (27
) and internal finance to cover their
(27) According to the 2018 Survey on Access to Finance of
Enterprises (SAFE), for Slovenian SMEs the three most important sources of finance are credit lines (62 %), bank
loans (61 %) and grants (51 %). In the period April-
funding needs (EIB, 2018; SAFE, 2018). While
larger Slovenian businesses do not perceive
funding as a major constraint, the situation for
SMEs is more nuanced (28
). Banks in Slovenia
remain cautious when lending to SMEs. High
guarantee requirements by banks remain an issue
(Bank of Slovenia, Survey 01/2018).
A lack of equity funding options in Slovenia is a
risk for the prospective financing of debt-
leveraged firms and might constrain the growth
of innovative businesses. Access to alternative
finance is slowly improving in Slovenia, though
from a very low level. Equity funding represents
only a minor share of financial resources available
to SMEs. Private equity in Slovenia amounts to
only 0.05 % of GDP compared to 0.2 % in Central
and Eastern Europe and 0.44 % on average across
the EU (Invest Europe CEE, 2018). The country
ranked among the lowest of EU Member States in
terms of venture capital share of GDP (Invest
Europe, 2017). While many SMEs consider equity
capital as relevant, few really use it (SAFE,
2018) (29
). The limited and underdeveloped capital
market, combined with the unfavourable
framework conditions, hampers inflows of equity
and venture capital into the country. This type of
funding is particularly important for innovative
start-ups in high tech and high growth sectors (see
Section 3.4.2).
The role of capital markets in financing the
Slovenian economy is limited and falling.
Despite the favourable economic conditions, the
market capitalisation of the Ljubljana Stock
Exchange is low and the number of stocks listed
there has actually fallen (IMAD, 2018). To address
this, the Ljubljana Stock Exchange, following the
initiative of the Securities Market Regulator
(ATVP), has provided tailored technical assistance
and advisory support on listings and the issuance
of bonds to SMEs (Ljubljana Stock Exchange,
2018). Development of the local capital market
September 2018, Slovenian SMEs most often used credit lines (38%).
(28) In the 2018 EIB survey, 6 % of SMEs, but not a single
large firm, considered their access to external finance as constrained (EIB 2018). According to the 2018 SAFE
results, access to finance is the most important concern for 6% of Slovenian SMEs (compared to 7% at EU level). This
is a decline from 17% in 2009, and 23% in 2013.
(29) According to the 2018 SAFE results, equity financing is relevant for 24% of Slovenian SMEs but only 1% of them
used it recently.
3.2. Financial sector
25
could be stimulated by growth funds, further
listings (including of state-owned enterprises), and
a pension reform (including long-term
supplementary savings), resulting in more equity
investments by pension funds.
The lack of financial and investment literacy in
SMEs remains an issue. Despite advice and
training offered by public institutions, SMEs'
access to finance is still hindered by a lack of
financial and investment literacy and of support in
the process of applying for bank loans, public
financial incentives and alternative financial
sources (European Commission, 2018i).
Slovenia offers various finance schemes for
businesses, notably SMEs. These schemes
provide, for example, microloans or guarantees (30
)
and also create or participate in new instruments to
support business funding. They are backed,
directly or indirectly, by EU funds, including the
cross-border Central Europe Fund of Funds.
Implementation of most of them is ongoing so that
it is too early to assess their impact.
Slovenia is strong in blockchain-based financial
technology solutions and has started to work on
a corresponding regulatory framework.
Slovenian companies have had a high success rate
on several international crowdfunding platforms,
notably Kickstarter. Over 300 SMEs have raised
around EUR 8.8 million in recent years (European
Commission, 2018i). Slovenian companies also
raised significant funding through initial coin
offerings in the last 2 years. In 2017, around 5 %
of funds raised in global initial coin offerings went
to Slovenian projects. The government is actively
promoting block-chain technologies (31
) and has
adopted an action plan in May 2018. It is now
preparing a regulatory framework for investor
protection in this area.
Broader use of financial instruments for EU
funds presents untapped potential to improve
Slovenia’s funding system. With a wide portfolio
of different products, EU funds are helping to
diversify financial markets and improve the
(30) However, according to the European Investment Fund
(European Investment Fund, 2018), Slovenia is among the
three EU countries where new guarantee activity decreased
the most in the first semester of 2018. (31) Initial coin offerings are only one type of application for
block-chain technology.
capacities of commercial banks, through which the
instruments are delivered. Broader use of financial
instruments for revenue generating or cost-saving
activities in the future could result in better access
to financial markets. It could also make it easier to
find the optimal financing mix to address regional
disparities.
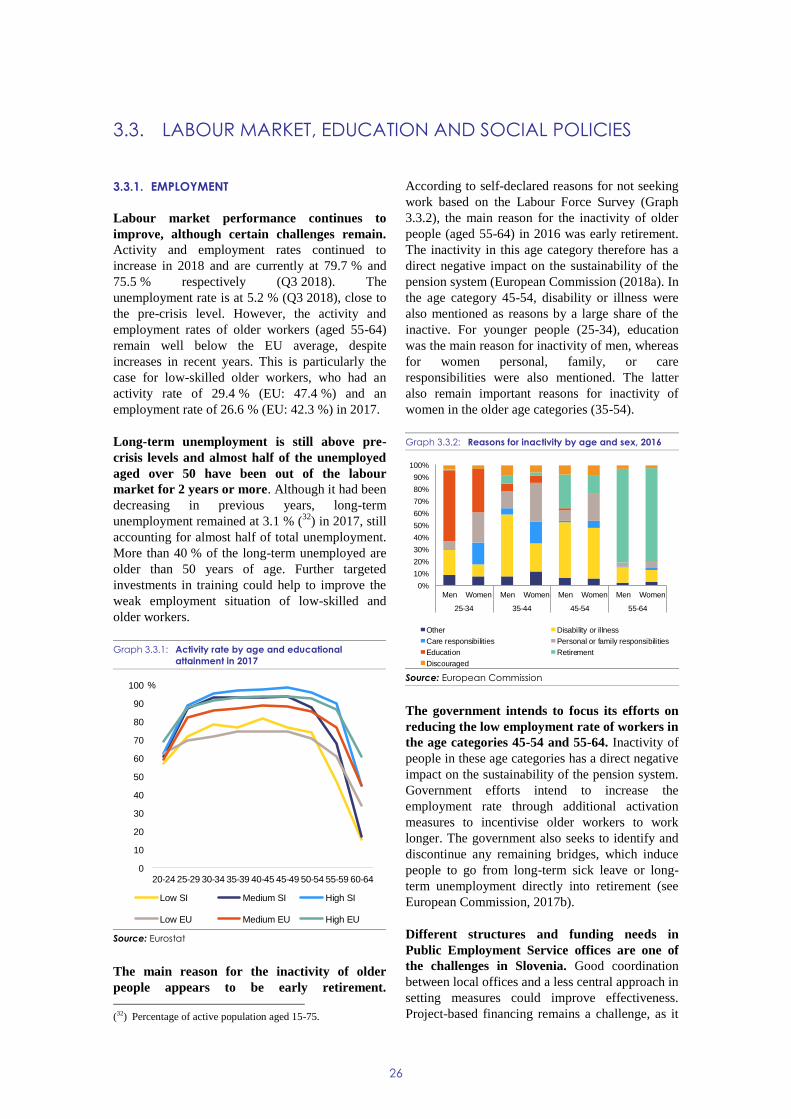
26
3.3.1. EMPLOYMENT
Labour market performance continues to
improve, although certain challenges remain.
Activity and employment rates continued to
increase in 2018 and are currently at 79.7 % and
75.5 % respectively (Q3 2018). The
unemployment rate is at 5.2 % (Q3 2018), close to
the pre-crisis level. However, the activity and
employment rates of older workers (aged 55-64)
remain well below the EU average, despite
increases in recent years. This is particularly the
case for low-skilled older workers, who had an
activity rate of 29.4 % (EU: 47.4 %) and an
employment rate of 26.6 % (EU: 42.3 %) in 2017.
Long-term unemployment is still above pre-
crisis levels and almost half of the unemployed
aged over 50 have been out of the labour
market for 2 years or more. Although it had been
decreasing in previous years, long-term
unemployment remained at 3.1 % (32
) in 2017, still
accounting for almost half of total unemployment.
More than 40 % of the long-term unemployed are
older than 50 years of age. Further targeted
investments in training could help to improve the
weak employment situation of low-skilled and
older workers.
Graph 3.3.1: Activity rate by age and educational
attainment in 2017
Source: Eurostat
The main reason for the inactivity of older
people appears to be early retirement.
(32) Percentage of active population aged 15-75.
According to self-declared reasons for not seeking
work based on the Labour Force Survey (Graph
3.3.2), the main reason for the inactivity of older
people (aged 55-64) in 2016 was early retirement.
The inactivity in this age category therefore has a
direct negative impact on the sustainability of the
pension system (European Commission (2018a). In
the age category 45-54, disability or illness were
also mentioned as reasons by a large share of the
inactive. For younger people (25-34), education
was the main reason for inactivity of men, whereas
for women personal, family, or care
responsibilities were also mentioned. The latter
also remain important reasons for inactivity of
women in the older age categories (35-54).
Graph 3.3.2: Reasons for inactivity by age and sex, 2016
Source: European Commission
The government intends to focus its efforts on
reducing the low employment rate of workers in
the age categories 45-54 and 55-64. Inactivity of
people in these age categories has a direct negative
impact on the sustainability of the pension system.
Government efforts intend to increase the
employment rate through additional activation
measures to incentivise older workers to work
longer. The government also seeks to identify and
discontinue any remaining bridges, which induce
people to go from long-term sick leave or long-
term unemployment directly into retirement (see
European Commission, 2017b).
Different structures and funding needs in
Public Employment Service offices are one of
the challenges in Slovenia. Good coordination
between local offices and a less central approach in
setting measures could improve effectiveness.
Project-based financing remains a challenge, as it
0
10
20
30
40
50
60
70
80
90
100
20-24 25-29 30-34 35-39 40-45 45-49 50-54 55-59 60-64
%
Low SI Medium SI High SI
Low EU Medium EU High EU
0%
10%
20%
30%
40%
50%
60%
70%
80%
90%
100%
Men Women Men Women Men Women Men Women
25-34 35-44 45-54 55-64
Other Disability or illness
Care responsibilities Personal or family responsibilities
Education Retirement
Discouraged
3.3. LABOUR MARKET, EDUCATION AND SOCIAL POLICIES

3.3. Labour market, education and social policies
27
leaves many offices with budgetary constraints and
a fluctuating number of counsellors. The changing
labour market situation requires a rich and stable
pool of counsellors in local offices to guarantee
services to the unemployed. An integrated
approach that also involves the support of social
services, developed with the help of the European
Social Fund, should have a positive impact when it
is launched.
Graph 3.3.3: Labour shortages, Slovenia 2008-2018
(1) Labour shortages in Slovenia as reported in the industry,
construction and services sectors, ESB indicator (2008, 2018).
Source: Eurostat
In order to reduce long-term unemployment,
the focus group of Employ.me 2017/2019 (33
),
the active labour market policy programme,
was expanded last year. Persons older than 50
and persons aged over 30 (34
) may now be
included in subsidised employment immediately
after having registered as unemployed, rather than
after having been registered for at least 6 months
as was previously the case (MOLFSAEO, 2018).
In December 2018, the Slovenian parliament
adopted an act to increase the minimum wage
gradually to EUR 700 net in 2020. The minimum
wage will increase from EUR 638 at present to
EUR 667 in 2019 and to EUR 700 in 2020. In
(33) “Employ.me” (“Zaposli.me), is a subsidy programme
(EUR 5 000 - 7 000), subsidising the employment of disadvantaged groups for a minimum period of one year.
According to a study of University of Primorska
“Employ.me” 2009-2012 was the active labour market policy with the biggest labour market impact, although it
was also the most expensive one. Co-financing from the European Social Fund amounts to 80 %.
(34) Without an elementary education or with no more than an
elementary education.
addition, bonuses, which are currently included in
the minimum wage, would be excluded as of 1
January 2020. The provisions will ensure that the
minimum wage will be at least 20 % above
minimum living expenses and will not exceed
them by more than 40 %. While this measure
would help those in low-paid jobs and increase
their purchasing power, there is a risk that it may
create inflexibility in the labour market and reduce
the number of (new) job creations, in particular
when the business climate is less favourable.
Participation in adult learning by low-skilled
people, older workers and the inactive is below
the EU average. In 2017, 12 % of adults
participated in learning, which is 1.1 pps above the
EU average. However, the share of low-qualified
adults participating in learning (as percentage of
all low-qualified adults) was 2.9 % in 2017 below
the EU average of 4.3 %. The 2016 Adult
Education Survey shows that 97.5 % of older
workers and 95.9 % of low-skilled workers were
not willing to participate in adult learning and
training activities.
To address falling participation in adult
learning, the government adopted a new Adult
Education Act in 2018. The Act establishes
educational guidance in adult learning as a public
service in support of lifelong learning
participation, self-directed learning as well as the
validation and recognition of prior learning.
Professional counsellors can help adults identify
learning needs, develop a career plan, find relevant
programmes and financial support, and achieve
completion (OECD, 2018). Encouraging
participation in adult education – in particular of
low-skilled, older and inactive workers – is also a
promising way to fill shortages in some
occupations, presenting opportunities for the long-
term unemployed to return to the labour market.
The share of employees in temporary and
precarious jobs remains above the EU average.
The share of temporary contracts was at 14.6 % in
2017, while the EU average was at 11.3 %. At the
same time, the transition rate from temporary to
permanent contracts has increased by 2.5 pps since
2007 and was relatively high at 38.4 % in 2017.
Nevertheless, the share of involuntary temporary
employees was 9.4 %, above the EU average of
7.8 % (2017). Moreover, the share of employees
0
10
20
30
40
50
07 08 09 10 11 12 13 14 15 16 17 18
%
Industry Construction Services

3.3. Labour market, education and social policies
28
with a precarious job (35
) was 5.1 % in 2017, more
than double the EU average of 2.3 %.
3.3.2. EDUCATION AND SKILLS
Slovenia has a generally well performing
education system, but it could be improved in
certain areas and sustained for the future.
Slovenian students in general education perform
well in international comparisons. Socio-economic
status is comparatively less important for
education outcomes (European Commission
2018b). Its importance, however, grows with the
level of education (Cankar et al., 2017) and there
are visible disparities when looking at pupil
underachievement rates, especially when
comparing the top and bottom socioeconomic
quartiles (European Commission 2018d). Literacy
among young people has improved significantly
and is high by international standards, though
performance of boys in reading literacy is still a
concern. At 4.3 %, the proportion of early school
leavers is the second lowest in the EU. The rate of
over 4-year-olds participating in early childhood
education and care is increasing slowly but
continuously (European Commission, 2018e). It
stood at 90.9 % in 2017, still 4.4 pps below the EU
average. There is also a need to review general
school curricula and improve the situation of
teachers to attract a sufficient number of qualified
students to choose pedagogical studies (OECD
2018). Slovenia’s teachers are relatively old with
38 % of teachers aged over 50.
Education spending as a share of GDP
decreased during the crisis, but it remains
above the EU average. Between 2010 and 2015,
expenditure per student in primary and secondary
education fell by 13 %, one of the highest
decreases among OECD countries. Expenditure
per student in tertiary education only increased by
1 %, compared to an average increase of 11 %
across OECD countries (OECD, 2018). The
government aims to keep the share of education
financing at a stable 6 % of GDP in the future,
0.5 pps below the share of 2013. Reforms on
higher education financing continue, but a more
substantial legislative overhaul has been
postponed.
(35) The work contract did not exceed 3 months’ duration.
Although participation in tertiary education is
widespread, inequalities in access persist. In
2017, 46.4 % of 30-34-year-olds had obtained
tertiary education, above the 40 % national target
and the EU average (39.9 %). However, the gender
gap in Slovenia in 2017 was 24.1 pps, the biggest
in the EU. Access to higher education is
particularly difficult for those with a weak
socioeconomic background: only 2.9 % of new
tertiary entrants are from parents of low
attainment. The European Centre for the
Development of Vocational Training (Cedefop)
has forecast a significant further shift to high
qualifications by 2025.
The Apprenticeship Act, in force since
December 2017, is trying to link education and
practical experience. By October 2018, only 186
out of approximately 12 000 students in vocational
education and training are enrolled in one of the
eight different programmes that link work
experience with classroom education. 20 % of the
curriculum is flexible, making the apprenticeship
adjustable to labour market demands. According to
the Ministry of Education, the main disincentive
for higher participation in vocational education and
training or apprenticeship is low wages.
Young people lack digital skills. The
International Computer and Information Literacy
results from 2013 show that only 16 % of pupils in
primary school acquire the necessary digital skills
to use information and communications
technology for collecting and processing data and
solving problems independently (Ministry of
Education, 2018). In addition, only around 5.5 %
of high school students met all the digital skills
targets (National Examination Centre RIC, 2016;
Ministry of Education, 2018).
Knowledge and skills are insufficiently adjusted
to the current and future needs of the economy.
The structure of students enrolled in educational
programmes and the skills of workers are adjusting
only slowly to labour market changes. Reading,
mathematical and digital skills of older generations
as well as of people with a low level of education
are relatively poor (Government of Republic of
Slovenia, 2017). According to a 2017 business
survey, 64 % of companies in Slovenia encounter
difficulties when searching for adequately skilled
personnel (SPIRIT, 2017). Differences in
unemployment rates between sectors are relatively
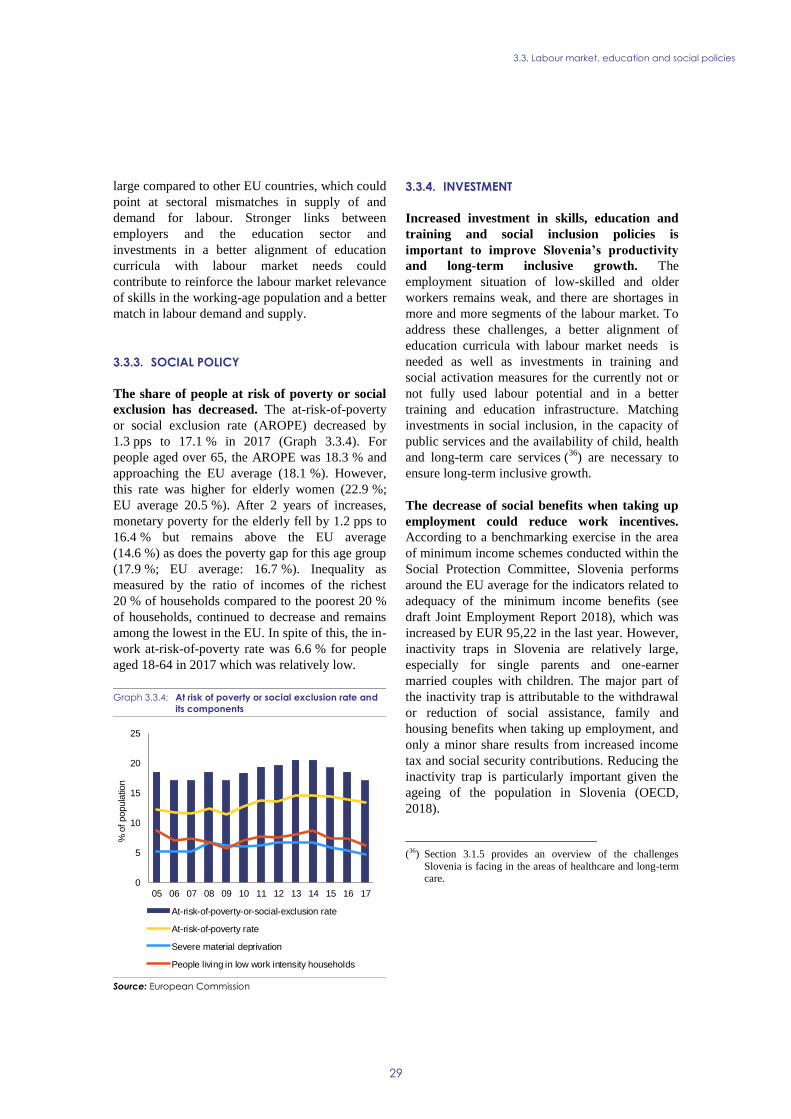
3.3. Labour market, education and social policies
29
large compared to other EU countries, which could
point at sectoral mismatches in supply of and
demand for labour. Stronger links between
employers and the education sector and
investments in a better alignment of education
curricula with labour market needs could
contribute to reinforce the labour market relevance
of skills in the working-age population and a better
match in labour demand and supply.
3.3.3. SOCIAL POLICY
The share of people at risk of poverty or social
exclusion has decreased. The at-risk-of-poverty
or social exclusion rate (AROPE) decreased by
1.3 pps to 17.1 % in 2017 (Graph 3.3.4). For
people aged over 65, the AROPE was 18.3 % and
approaching the EU average (18.1 %). However,
this rate was higher for elderly women (22.9 %;
EU average 20.5 %). After 2 years of increases,
monetary poverty for the elderly fell by 1.2 pps to
16.4 % but remains above the EU average
(14.6 %) as does the poverty gap for this age group
(17.9 %; EU average: 16.7 %). Inequality as
measured by the ratio of incomes of the richest
20 % of households compared to the poorest 20 %
of households, continued to decrease and remains
among the lowest in the EU. In spite of this, the in-
work at-risk-of-poverty rate was 6.6 % for people
aged 18-64 in 2017 which was relatively low.
Graph 3.3.4: At risk of poverty or social exclusion rate and
its components
Source: European Commission
3.3.4. INVESTMENT
Increased investment in skills, education and
training and social inclusion policies is
important to improve Slovenia’s productivity
and long-term inclusive growth. The
employment situation of low-skilled and older
workers remains weak, and there are shortages in
more and more segments of the labour market. To
address these challenges, a better alignment of
education curricula with labour market needs is
needed as well as investments in training and
social activation measures for the currently not or
not fully used labour potential and in a better
training and education infrastructure. Matching
investments in social inclusion, in the capacity of
public services and the availability of child, health
and long-term care services (36
) are necessary to
ensure long-term inclusive growth.
The decrease of social benefits when taking up
employment could reduce work incentives.
According to a benchmarking exercise in the area
of minimum income schemes conducted within the
Social Protection Committee, Slovenia performs
around the EU average for the indicators related to
adequacy of the minimum income benefits (see
draft Joint Employment Report 2018), which was
increased by EUR 95,22 in the last year. However,
inactivity traps in Slovenia are relatively large,
especially for single parents and one-earner
married couples with children. The major part of
the inactivity trap is attributable to the withdrawal
or reduction of social assistance, family and
housing benefits when taking up employment, and
only a minor share results from increased income
tax and social security contributions. Reducing the
inactivity trap is particularly important given the
ageing of the population in Slovenia (OECD,
2018).
(36) Section 3.1.5 provides an overview of the challenges
Slovenia is facing in the areas of healthcare and long-term care. 0
5
10
15
20
25
05 06 07 08 09 10 11 12 13 14 15 16 17
% o
f popula
tion
At-risk-of-poverty-or-social-exclusion rate
At-risk-of-poverty rate
Severe material deprivation
People living in low work intensity households
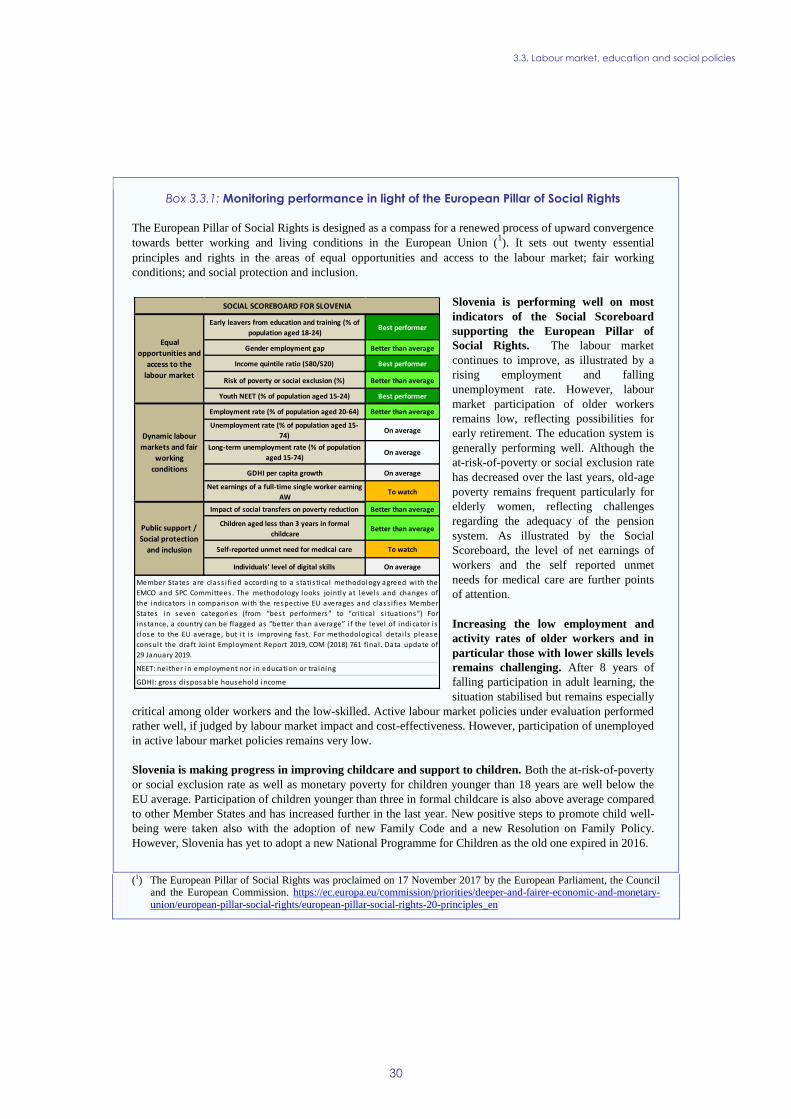
3.3. Labour market, education and social policies
30
Box 3.3.1: Monitoring performance in light of the European Pillar of Social Rights
The European Pillar of Social Rights is designed as a compass for a renewed process of upward convergence
towards better working and living conditions in the European Union (1). It sets out twenty essential
principles and rights in the areas of equal opportunities and access to the labour market; fair working
conditions; and social protection and inclusion.
Slovenia is performing well on most
indicators of the Social Scoreboard
supporting the European Pillar of
Social Rights. The labour market
continues to improve, as illustrated by a
rising employment and falling
unemployment rate. However, labour
market participation of older workers
remains low, reflecting possibilities for
early retirement. The education system is
generally performing well. Although the
at-risk-of-poverty or social exclusion rate
has decreased over the last years, old-age
poverty remains frequent particularly for
elderly women, reflecting challenges
regarding the adequacy of the pension
system. As illustrated by the Social
Scoreboard, the level of net earnings of
workers and the self reported unmet
needs for medical care are further points
of attention.
Increasing the low employment and
activity rates of older workers and in
particular those with lower skills levels
remains challenging. After 8 years of
falling participation in adult learning, the
situation stabilised but remains especially
critical among older workers and the low-skilled. Active labour market policies under evaluation performed
rather well, if judged by labour market impact and cost-effectiveness. However, participation of unemployed
in active labour market policies remains very low.
Slovenia is making progress in improving childcare and support to children. Both the at-risk-of-poverty
or social exclusion rate as well as monetary poverty for children younger than 18 years are well below the
EU average. Participation of children younger than three in formal childcare is also above average compared
to other Member States and has increased further in the last year. New positive steps to promote child well-
being were taken also with the adoption of new Family Code and a new Resolution on Family Policy.
However, Slovenia has yet to adopt a new National Programme for Children as the old one expired in 2016.
(1) The European Pillar of Social Rights was proclaimed on 17 November 2017 by the European Parliament, the Council and the European Commission. https://ec.europa.eu/commission/priorities/deeper-and-fairer-economic-and-monetary-
union/european-pillar-social-rights/european-pillar-social-rights-20-principles_en
Early leavers from education and training (% of
population aged 18-24)Best performer
Gender employment gap Better than average
Income quintile ratio (S80/S20) Best performer
Risk of poverty or social exclusion (%) Better than average
GDHI per capita growth On average
Net earnings of a full-time single worker earning
AWTo watch
Impact of social transfers on poverty reduction Better than average
Children aged less than 3 years in formal
childcareBetter than average
Self-reported unmet need for medical care To watch
Individuals’ level of digital skills On average
Member States are class i fied according to a statis tica l methodology agreed with the
EMCO and SPC Committees . The methodology looks jointly at levels and changes of
the indicators in comparison with the respective EU averages and class i fies Member
States in seven categories (from “best performers” to “cri tica l s i tuations”) For
instance, a country can be flagged as “better than average” i f the level of indicator is
close to the EU average, but i t i s improving fast. For methodologica l detai l s please
consult the draft Joint Employment Report 2019, COM (2018) 761 fina l . Data update of
29 January 2019.
NEET: neither in employment nor in education or tra ining
GDHI: gross disposable household income
SOCIAL SCOREBOARD FOR SLOVENIA
Equal
opportunities and
access to the
labour market
Best performer
Dynamic labour
markets and fair
working
conditions
Better than average
On average
On average
Public support /
Social protection
and inclusion
Youth NEET (% of population aged 15-24)
Employment rate (% of population aged 20-64)
Unemployment rate (% of population aged 15-
74)
Long-term unemployment rate (% of population
aged 15-74)

31
3.4.1. PRODUCTIVITY GROWTH
Investments in R&D, digitalisation and
infrastructure, in particular related to
transport and rail, would help the convergence
process. Slovenia’s growth potential would benefit
if the trend of declining investment into research,
development and innovation could be reversed.
Investments in the digitalisation of Slovenia's
firms, which are active in more traditional sectors,
as well as in the uptake of e-government solutions
are also important to ensure that Slovenia remains
competitive. Bottlenecks in infrastructure, in
particular rail transport, continue to adversely
impact on the economy and the society as a whole.
Graph 3.4.1: Labour productivity and total factor
productivity (TFP), Slovenia and Euro area
Source: Eurostat
Labour productivity is slowly converging to the
euro area driven by total factor productivity
(TFP), as recent reforms are starting to pay off.
Slovenia's labour productivity in purchasing power
standard relative to the EU went from 76.1 % to
80.5 % of the EU average between 2000 and 2017.
After falling by more than in the euro area during
the crisis, Slovenia's labour productivity has been
growing faster than the euro area since 2015, but
the pace of convergence with the euro area remains
slow. Labour productivity is driven primarily by
fast growth in TFP, a sign that the economy is
gaining efficiency, although the low TFP growth
of medium and large-sized state-
owned- enterprises still weighs on aggregate
productivity (European Commission 2018b).
Investment fell rapidly during the crisis and
remains below the euro area average as a share
of GDP, although it is now recovering slightly.
Investment averaged over 26 % of GDP in 2000-
2005, well above the euro area average of 22 %.
After increasing rapidly in the run-up to the crisis,
it fell rapidly thereafter. In 2017, although
continuing to grow, the level of investment was
still well below the euro area average (18.5 % vs
20.5 % of GDP). In particular, private investment
was below the euro area average while public
investment was slightly above. Construction
investment suffered the most during the crisis, both
for dwellings and, even more so for other buildings
and structures. Investment in machinery and
equipment also fell. Investment in information and
communication technology fell from 2 % of GDP
on average in 2000-2005 (0.9 % of GDP in the
euro area) to 0.8 % of GDP in 2017 (0.7 % of GDP
in the euro area). Investment in intellectual
property products had been rather stable but is now
substantially lower than in the euro area (3.0 % vs
3.9 % of GDP). The 2018 Investment Promotion
Act harmonizes support for domestic and foreign
investments and facilitates investments that are
deemed strategic.
Graph 3.4.2: Investment by type
Source: Eurostat
Inward foreign direct investment (IFDI)
remains comparatively low. For a small open
economy like Slovenia, IFDI is a key driver of
productivity growth. Slovenia's stock of IFDI as a
share of GDP was 31.8 % at the end of 2016. In
most similar EU Member States this rate is much
85
90
95
100
105
110
115
120
07 08 09 10 11 12 13 14 15 16 17 18 19 20
2010=100
Labour productivity Euro area
Labour productivity Slovenia
TFP Euro area
TFP Slovenia
0
5
10
15
20
25
30
35
01 03 05 07 09 11 13 15 17
% o
f G
DP
Intellectual property products
Other machinery and equipment
Information communication technologies equipment
Transport equipment
Other buildings and structures
Dwellings
3.4. COMPETITIVENESS REFORMS AND INVESTMENT

3.4. Competitiveness reforms and investment
32
higher, up to 80 % of GDP and more. Furthermore,
the distribution of IFDI (in value terms) within
Slovenia contributes to regional disparities as
nearly 61 % of all IFDI is concentrated in the
Osrednjeslovenska region while at least 8 of the
regions are under 5 % (Bank of Slovenia, 2016).
Most of Slovenia’s regions thus benefit only very
marginally from the productivity spillover effects
of IFDI.
Research and development
Slovenia is a strong innovator but recent
progress was limited and weaknesses persist.
According to the 2017 summary innovation
performance index Slovenia falls in the category of
strong innovators with a score just below the EU
average. More importantly, its performance change
from 2010 to 2017 was rather moderate, with an
increase of only about 1.4 % (European
Commission, 2018f). One of the main weaknesses
is the reduced and inefficient R&D expenditure in
the public sector. Slovenia is also relatively weak
in terms of the effects of innovation activity on
competitiveness. This weakness is reflected
particularly in the low shares of exports of
knowledge-intensive services and of persons
employed in high-growth enterprises.
Innovation performance across Slovenia's
regions is uneven. East Slovenia is a moderate
innovator, though it has improved its innovation
performance over time. In contrast, West Slovenia
is a strong innovator albeit with a decreasing
innovation performance.
Slovenia has not yet reached the R&D-intensity
target of 3.0 % of GDP. Slovenia’s investment in
R&D is slightly below the EU average and remains
dependent on EU funds, with the European
Regional and Development Funds (ERDF)
providing 33.9 % of public R&D expenditure. In
2017, Slovenia's overall R&D intensity was
1.86 % of GDP, a significant decline from its 2013
value of 2.58 %. This decline was mainly caused
by a decrease in business enterprise expenditure on
R&D from a peak of 1.98 % of GDP in 2013 to
1.39 % of GDP in 2017. In addition to grants, the
Slovenian government strongly relies on tax
incentives to promote R&D in firms. R&D tax
incentives accounted for 63 % of total government
support for business expenditure for R&D in 2015
(OECD, 2017a). Public R&D expenditure fell to
its lowest level ever at 0.47 % of GDP in 2017,
down from a peak of 0.66 % of GDP in 2010. This
decline is mostly due to fiscal consolidation and
the cyclical nature of EU funds.
The efficiency of Slovenia’s public R&D
spending and the quality of its research system
remain relatively low. The Slovenian Research
Agency is responsible for the allocation of funding
based on research excellence criteria. Looking at
scientific excellence (as measured by the share of
publications among the top 10 % most cited
worldwide), Slovenia lags behind the EU average,
and ranks only 17th
among EU Member States.
However, the share of international co-publications
in the total number of publications was 58.8 % in
2017 and exceeded the EU average (49.4 %).
Slovenia achieved compound growth in
international co-publications of 4.5 % between
2010 and 2016.
Graph 3.4.3: R&D funding
Source: Eurostat
Support for young researchers has declined and
Slovenia has problems attracting foreign
research talent. Slovenia's education system
performs well in producing science and
engineering graduates and doctoral graduates. Yet,
the decline in public investment in R&D has also
been felt in a reduction of funding for young
researchers. In 2017, the Slovenian Research
Agency provided funds for 840 young people
involved in doctoral studies (European
Commission, 2017b). The number of researchers
(full-time equivalents) employed by the public
1
1,2
1,4
1,6
1,8
2
2,2
2,4
2,6
01 03 05 07 09 11 13 15 17
% o
f G
DP
EU Slovenia
3.4. Competitiveness reforms and investment
33
sector (whether in government or higher
educations) per thousand active population has
declined from 4.3 in 2011 to 3.7 in 2016. There is
little influx of foreign researchers and academics.
This is partially due to the public sector employer
system and the old-fashioned habilitation system in
universities. Slovenia attracts a lower share of
international students at all levels of tertiary
education, especially at the doctoral level: less than
9 % of Slovene doctoral students are international
compared to an OECD average of 25.7 % (OECD,
2017b). International mobility or mobility between
academia and industry are not incentivised. These
are key obstacles to the attraction and re-
integration of talent and to the much-needed
openness of Slovenia’s research and innovation
system (European Commission, 2018b).
The share of innovative enterprises in Slovenia
is decreasing and lags behind the EU average.
In the period 2014-2016, 40 % of all enterprises in
Slovenia carried out innovation activities, and this
share was 6 pps higher in the period 2012-2014.
Looking at the shares per enterprise segment, only
about 34 % of small companies carried out
innovation activities, while the share rises to 80 %
in large ones (Statistical Office of the Republic of
Slovenia). The employment share in fast-growing
firms within innovative sectors is well below the
EU average. In Slovenia, only 3.2 % of the
workforce was employed in fast-growing firms in
innovative sectors, whereas the EU average was
4.8 %. This indicates at a lack of dynamism, which
is especially pronounced in innovative parts of the
economy (European Commission, 2018i).
Most SMEs in Slovenia have a low innovation
capacity. They tend to be poorly integrated in
domestic, regional or international clusters, with a
low potential to attract critical mass investment
and to develop large-scale innovations. A lack of
sufficiently equipped R&D units in SMEs (low
absorption capacity) seriously limits the
opportunities for science-industry cooperation.
Only 19.9 % of Slovenian enterprises are engaged
in co-operations with government, public or
private research institutions. 14.4 % of Slovenian
enterprises co-operate with higher education
institutions (European Commission, 2014). The
research interests in most of Slovenia’s (small)
firms lie in cost reduction and relatively routine
improvements in their processes. Their “R&D” or
development departments mostly perform routine
procedures, such as quality control and testing.
Investing in knowledge is not seen as part of their
competitive strategy. In contrast, firms from the
highly impactful medium-and high-tech segments
(e.g. the automotive sector, machinery) are more
intensively involved in science-industry links.
Finding business and research partners can be
a challenge due to small market size. Slovenia
recognizes this shortcoming by taking part in
several interregional innovation actions. These
include the Interregional innovation pilot project
(Sustainable buildings - Smart campus pilot
project), the Industrial transition project focusing
on addressing challenges of skills mismatches,
modernisation and adaptation to new technologies,
and the Smart Specialization Cooperation in
Central Europe project. At the same time, Slovenia
performs well in delivering projects within the
cross-border programmes and macro-regional
strategies. Slovenia could benefit from further
possibilities, such as further enhancing
transnational partnerships for SMEs by
participating in business networks.
The Slovenian smart specialisation strategy
aims at tackling many of these challenges inter
alia by establishing Strategic research and
innovation partnerships (SRIPs). It was adopted
in 2015 and governs the delivery of almost EUR 1
billion of EU funds. It aims to develop top-level
conditions for creativity and innovation in several
niche areas. SRIPs have been established around
nine focus areas of the strategy. Through SRIPs,
the governance of smart specialisation is entrusted
to around 700 non-governmental stakeholders
(including knowledge, institutions, businesses,
NGOs etc.) which paves the path for a structural
transformation empowering and strengthening the
innovation ecosystem of Slovenia. SRIPs have
already helped to improve the internationalisation
and networking of Slovene research and
innovation stakeholders through their participation
in thematic smart specialisation platforms. For
example, Slovenia is co-leading the thematic area
‘SME integration to Industry 4.0’ through the
‘Factories of the Future’ SRIP, and the thematic
area ‘Digitalisation and Safety for Tourism’,
through the ‘Sustainable Tourism’ SRIP, and is a
partner in other areas. This enables Slovene
stakeholders to learn from more experienced peers
from well-advanced regions and Member States,

3.4. Competitiveness reforms and investment
34
thus improving the skills, knowledge and expertise
available in the R&D sector in Slovenia.
Slovenia lacks a well-coordinated system to
govern its R&D efforts and is not implementing
strategic R&D policy reforms. Frequent changes
in public governance of the national research and
innovation system combined with fragmentation of
policies and instruments remain challenges. One of
the key problems identified by public research
organisations and business entities is the
irregularity of the government’s announcements
and the funding of support measures such as the
co-financing of joint R&D projects. In 2018,
further calls for co-financing of R&D projects
were issued, and a new instrument related to the
smart specialisation strategy was introduced in
August 2018. The so-called DEMO projects under
the call should fit within the focus areas of the
SRIP action plans. The Slovenian authorities have
requested support from the Horizon 2020 Policy
Support Facility with a special focus on the
internationalisation of the Slovenian science base,
and its cooperation with businesses (European
Commission, 2018g). Additionally, Slovenian
business could benefit from investment in high
performance computing and artificial intelligence.
Digitalisation
The adoption of digital technologies and
business models is generally well advanced, but
some sectors lag behind. There is a growing
awareness of the need to integrate digital
technologies into business processes. However, the
degree of the actual integration of these
technologies varies considerably across different
sectors of the economy, with a higher degree of
digitalisation in services than in manufacturing
(Statistical Office of the Republic of Slovenia
Index 6373). Overall, digitalisation of Slovenian
businesses is better than the EU average, especially
in e-commerce, the tourism sector, and companies
integrated into foreign value chains (e.g. the
automotive sector). Slovenian businesses lag
behind their EU peers in specific technologies,
such as electronic information sharing and cloud
services. Slovenia has no specific tax breaks for
investments in digital technologies or business
models. The Ministry for Economy and
Technological Development has launched a call
for interest for funding (EUR 8 million) to promote
the digitalisation of business processes.
Slovenia ranks low in terms of mobile
broadband take up, fast broadband take up and
the broadband price index. In 2016, Slovenia set
itself the objective of ensuring that 96 % of its
population had internet speeds of at least 100
Mbps and the remaining 4 % at least 30 Mbps by
2020. In Slovenia, the ultra-fast broadband
coverage rate for households is 75 %. The take-up
of ultra-fast broadband remains close to the EU
average of 13 % (European Commission 2018h).
Relatively high prices for broadband connectivity
might be the reason for low take-up of fast
broadband with speeds of 30 Mbps and above. In
the period 2014-2020, approximately EUR 56
million from the ERDF and EUR 7.5 million from
the European Agricultural Fund for Rural
Development were earmarked to ensure better
network coverage. The ERDF allocation was
subsequently reduced by half due to an expected
increase in market interest. The latest calls for
expression of market interest still triggered limited
interest.
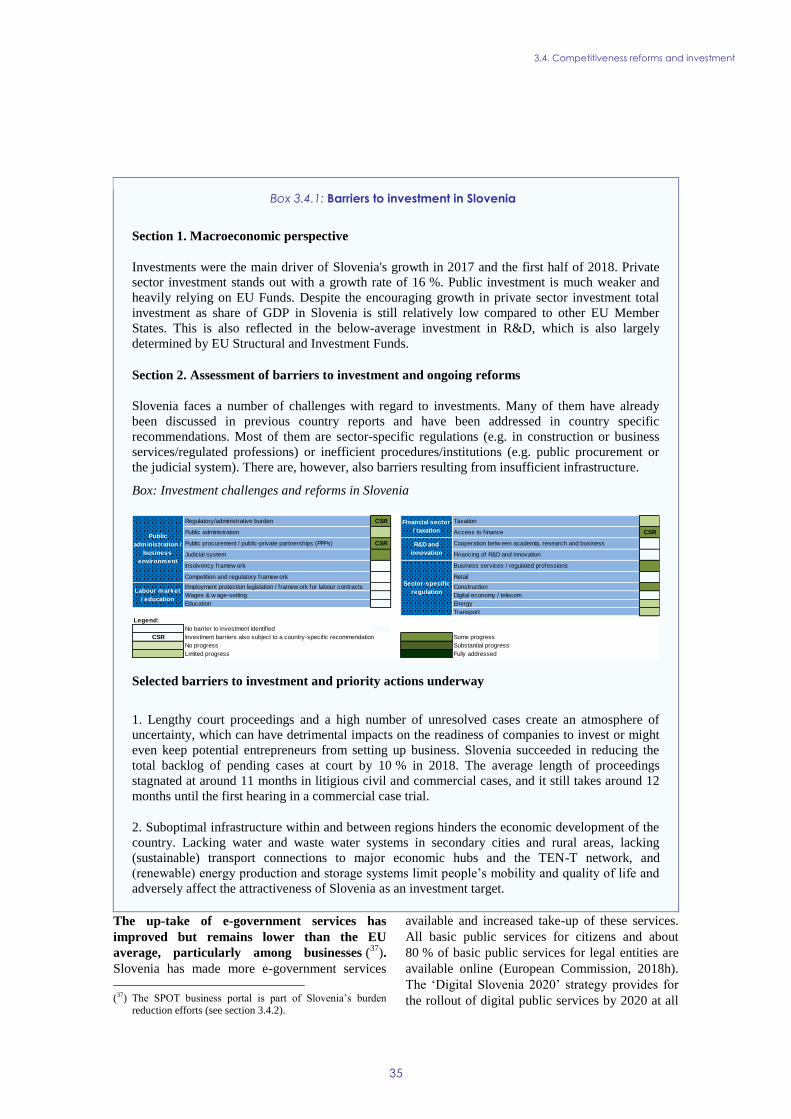
3.4. Competitiveness reforms and investment
35
Box 3.4.1: Barriers to investment in Slovenia
Section 1. Macroeconomic perspective
Investments were the main driver of Slovenia's growth in 2017 and the first half of 2018. Private
sector investment stands out with a growth rate of 16 %. Public investment is much weaker and
heavily relying on EU Funds. Despite the encouraging growth in private sector investment total
investment as share of GDP in Slovenia is still relatively low compared to other EU Member
States. This is also reflected in the below-average investment in R&D, which is also largely
determined by EU Structural and Investment Funds.
Section 2. Assessment of barriers to investment and ongoing reforms
Slovenia faces a number of challenges with regard to investments. Many of them have already
been discussed in previous country reports and have been addressed in country specific
recommendations. Most of them are sector-specific regulations (e.g. in construction or business
services/regulated professions) or inefficient procedures/institutions (e.g. public procurement or
the judicial system). There are, however, also barriers resulting from insufficient infrastructure.
Box: Investment challenges and reforms in Slovenia
Selected barriers to investment and priority actions underway
1. Lengthy court proceedings and a high number of unresolved cases create an atmosphere of
uncertainty, which can have detrimental impacts on the readiness of companies to invest or might
even keep potential entrepreneurs from setting up business. Slovenia succeeded in reducing the
total backlog of pending cases at court by 10 % in 2018. The average length of proceedings
stagnated at around 11 months in litigious civil and commercial cases, and it still takes around 12
months until the first hearing in a commercial case trial.
2. Suboptimal infrastructure within and between regions hinders the economic development of the
country. Lacking water and waste water systems in secondary cities and rural areas, lacking
(sustainable) transport connections to major economic hubs and the TEN-T network, and
(renewable) energy production and storage systems limit people’s mobility and quality of life and
adversely affect the attractiveness of Slovenia as an investment target.
The up-take of e-government services has
improved but remains lower than the EU
average, particularly among businesses (37
).
Slovenia has made more e-government services
(37) The SPOT business portal is part of Slovenia’s burden
reduction efforts (see section 3.4.2).
available and increased take-up of these services.
All basic public services for citizens and about
80 % of basic public services for legal entities are
available online (European Commission, 2018h).
The ‘Digital Slovenia 2020’ strategy provides for
the rollout of digital public services by 2020 at all
Regulatory/administrative burden CSR Taxation
Public administration Access to f inance CSR
Public procurement / public-private partnerships (PPPs) CSR Cooperation betw een academia, research and business
Judicial system Financing of R&D and innovation
Insolvency framew ork Business services / regulated professions
Competition and regulatory framew ork Retail
Employment protection legislation / framew ork for labour contracts Construction
Wages & w age-setting Digital economy / telecom
Education Energy
Transport
Legend:
No barrier to investment identif ied
CSR Investment barriers also subject to a country-specif ic recommendation Some progress
No progress Substantial progress
Limited progress Fully addressed
Public
administration /
business
environment
Financial sector
/ taxation
R&D and
innovation
Sector-specific
regulationLabour market
/ education

3.4. Competitiveness reforms and investment
36
levels of government. The strategy introduces the
‘digital by default’ and ‘once only’ principle and
includes the development of various key enablers
for access to and interoperability of e-government
services. Interoperability across governmental
departments remains a challenge. The lack of a
widely spread and easy to use national electronic
identification means for using e-government
services is a significant barrier to uptake. Slovenia
puts great efforts to make the process of electronic
identification and electronic signature in e-
government services simpler and user-friendlier.
3.4.2. MARKET FUNCTIONING AND BUSINESS
ENVIRONMENT
Entrepreneurship and scale-up
Entrepreneurship has been growing slowly and
steadily. Slovenia’s business dynamic has been
positive, with a constant net gain in the number of
active businesses in recent years. The number of
nascent and new companies has been increasing
since 2012 (IMAD, 2018). This positive trend is
linked to the economic upswing. However, the
early-stage entrepreneurial activity by women and
the choice of entrepreneurship as a desirable career
remain somewhat below the EU average
(European Commission, 2018i). The ‘Start:up
Slovenia’ initiative and the annual Podim
conference (which attracts more than 700
participants from Slovenia and neighbouring
countries) are helping Slovenia’s start-up
community.
Scaling-up, competitiveness and
internationalisation of SMEs remain key
challenges. Slovenia's share of high growth
enterprises remains below the EU average (8.74 %
in Slovenia compared to an EU average of 9.9 %;
European Commission, 2018i). Company growth
in a small economy, such as Slovenia, is linked to
the companies’ ability to compete in international
markets. And while the Slovenian economy as a
whole is well integrated in global value chains
(IMAD, 2018), its smaller firms and firms in more
traditional sectors lag behind in
internationalisation. Policy measures to address
this weakness, such as export loans granted by the
Slovenian Export and Development Bank or the
more recent Investment Promotion Act, have so far
yielded only limited effect. Employing foreign
experts is one of the key challenges for enterprises,
in particular start-ups and scale-ups (high-growth
companies). Under the new Investment Promotion
Act, a register of innovative start-ups and a register
of high-value added firms were established.
However, these registers were not widely known
about among the target groups in the months
following their establishment. Slovenia plans to
address some of the specific needs of these
businesses in 2019.
Developing the support environment for
businesses further could help to improve the
current poor performance on business
education and technology transfers in Slovenia.
According to the Global Entrepreneurship Monitor
(GEM) Slovenia performs poorly in business
education and technology transfer, scoring only
3.37 and 4.20 out of 9 points, respectively. Both
are below the EU average (GEM, 2018). At the
same time, the support for businesses seems not to
function optimally in all areas. Satisfaction with
the local support environment differs widely across
companies of different sizes. While over 70 % of
large companies expressed their satisfaction, only
about 10 % of micro companies did so. According
to businesses, the main downside of the existing
entrepreneurial-support environment is that public
officials work in this field often lack knowledge
and experience in business subjects (SPIRIT
Slovenia, 2017).
Regulatory and administrative burden
Administrative burden continues to subdue
growth and investment in Slovenia. As in
previous years, red tape is one of the more
problematic factors in doing business in Slovenia.
Specific problems exist in the area of tax
procedures, which are considerably longer and
more uncertain than in other Member States.
According to GEM 2018, two thirds of EU
countries rank above Slovenia in terms of
government policies that address taxes and
bureaucracy. This is the area where Slovenia is
farthest behind the EU average. The World Bank's
Doing Business 2019 report, which indicates the
ease of doing business in individual countries,
ranked Slovenia slightly lower than the year before
but still in the top quarter among the 190 surveyed
countries. In the protection of minority investors,
Slovenia dropped also a few ranks but stays among
the top fifth. Enforcement of contracts remains the
3.4. Competitiveness reforms and investment
37
country’s weak area. Even though it improved its
respective score by some ranks, it is still in the
lower half. On other business environment
indicators, Slovenia improved its position.
Regulatory restrictions are still in place for key
professions. Slovenia regulates lawyers,
architects, civil engineers, real estate agents and
tourist guides more strictly than the weighted EU
average (European Commission, 2017c). Among
these key professions, restrictiveness is the highest
for lawyers. There is a restriction that only
attorneys may be shareholders or owners of an
attorney’s office established in Slovenia. Slovene
citizenship is required to qualify as a lawyer in
Slovenia. In its national action plan submitted to
the Commission in January 2018, Slovenia
reported on reforms already undertaken, including
professions in the crafts, education, trade,
architecture, engineering and tourist sectors.
Slovenia also announced its intention to ease
restrictions for real estate agents and abolish the
nationality requirement for lawyers. However,
these reforms have not been finalised yet.
Slovenia is making progress with its efforts to
reduce administrative burden, such as the SME
test and the ‘Single Document’. The
implementation of the Single Document is
progressing, but a number of old as well as more
recently added measures still await
implementation. Business stakeholders ask for
more detailed and transparent information on the
measures formally reported as implemented. One
of the key measures on which progress has been
made is regulatory impact assessments. Slovenia is
using regulatory impact assessments, including an
SME test, to determine how draft laws would
affect SMEs. Such impact assessments have been
made compulsory for draft laws under regular
parliamentary procedure. However, they are not
yet done for the numerous laws adopted in urgent
procedure.
The SPOT business portal is being expanded
but its scope is still limited. The SPOT portal
encompasses the previous system called ‘e-VEM’.
This portal should become a digital one-stop shop
for key administrative procedures in the lifecycle
of Slovenian businesses. It currently covers around
40 of the most important administrative procedures
and is being expanded constantly. The portal is a
one-stop interface connecting to existing
databases. It is complemented by 150 local SPOT
points, including one special SPOT centre in each
statistical region where consultants provide free-
of-charge assistance and services to businesses and
to regional entities. SPOT has found wide
acceptance in the business community, with
roughly 2 million procedures being performed
every year. Tax procedures, other than value added
tax registration, will remain in the separate e-tax
portal.
The insolvency and restructuring framework
showed improved recovery rates while caseload
mostly decreased. In 2018, the number of new
personal insolvency cases and all types of
restructuring cases continued to decrease by 10 %
and 15 %, respectively. However, corporate
bankruptcy cases further increased by 6 %.
Creditors are increasingly initiating personal
insolvency cases against debtors The duration of
corporate bankruptcy proceedings (from the start
until a court decision on the merits) decreased.
Elapsed period to distribution to creditors is 1 052
days. Recovery rates increased to about 14 % in
corporate bankruptcy and personal insolvency
cases, and above 30 % in court-led restructuring
(both types of compulsory settlement procedures).
3.4.3. ENERGY, ENVIROMENT AND
INFRASTRUCTURE
Climate, energy, environment and resources
efficiency
Slovenia is well on the way to reaching its
Europe 2020 sustainability targets. It has already
achieved its energy efficiency and greenhouse gas
emission targets and is above the indicative
trajectory for the renewable energy target (for
details see below and Annex C). However, energy
consumption in Slovenia is above the EU average
and increasing. This puts the achievement of the
EU 2020 target under pressure (European
Commission, 2018b). Primary and secondary
energy consumption increased in 2016. The
transport sector saw the biggest increase (5.9 %
from 2015 to 2016 and 27 % from 2005 to 2016).
This is mainly due to road transport, which
includes transit transport (Energy Union factsheet
Slovenia, 2017). Energy consumption of
Slovenia’s industry, services and residential sector
are all above the EU average. The residential
3.4. Competitiveness reforms and investment
38
sector in particular presents a problem, as energy
poverty is quite widespread. Approximately 40 %
of the population spends more than 10 % of their
income on energy (38
). This limits their scope to
switch to equipment that is more energy efficient.
For the period until 2030, Slovenia has
identified investment priorities in energy
infrastructure, energy efficiency in buildings
and renewable energy sources. This promotes
long-term certainty and predictability for investors.
Slovenia’s national energy and climate plan will be
adopted by 31 December 2019 in line with the
Regulation on the Governance of the Energy
Union and Climate Action (39
). It will provide an
overview of investment needs until 2030 for the
different dimensions of the Energy Union,
including renewable energy, energy efficiency,
security of supply, and climate mitigation and
adaptation. The draft plan submitted on 31
December 2018 will further contribute to the
identification and assessment of energy and
climate-related investment needs for Slovenia.
Slovenia’s economy is more carbon intensive
than the EU average, and the share of
renewables is stagnating or declining. Slovenia’s
carbon intensity remains above the EU average
and its rate of reduction since 1990 is below the
EU average (European Commission, 2018). The
share of renewable energy sources declined from
22.4 % in 2013 to around 20.1 % (Eurostat, 2018).
Traditional renewable energy sources such as
wood and hydropower account for the bulk of
renewable energy sources in Slovenia
(Government of the Republic of Slovenia, 2017).
In the use of other renewable energy sources,
Slovenia ranks towards the bottom of the EU with
the gap in wind energy being particularly wide.
This is in large part due to the opposition of the
local population.
Slovenia’s greenhouse gas emissions in relation
to GDP are declining but they are above the EU
average; air quality remains a concern. (IMAD,
2018). Despite emission reductions for several air
pollutants, air quality in Slovenia continues to raise
concerns. There are still breaches of air quality
requirements and fluctuating emission trends for
(38) Statistical office of the Republic of Slovenia, www.stat.si
(39) Regulation (EU) 2018/1999 on the Governance of the Energy Union and Climate Action.
air pollutants (40
). Transport has become the
biggest source of CO2 emissions accounting for
31.8 % of Slovenia’s total CO2 emissions, which
is above the average share of this sector in the EU
(European Commission, 2019a; IMAD, 2018). The
number of years of life lost per 1 000 inhabitants
was higher in Slovenia than in the EU for fine
particulate matter concentrations, ozone and
nitrogen dioxide in 2015. (EEA, 2017).
Slovenia is progressing towards a resource-
efficient circular economy, but waste
management remains challenging. On average
71 % of raw materials consumed domestically are
imported. Waste collection, prevention, reuse and
high-quality recycling to close the materials loop
are thus important to reduce Slovenia’s
dependency on imported materials and to retain
value within the Slovenian economy (Ministry of
the Environment, 2018). The municipal waste
recycling rate in Slovenia was well above the EU
average in 2016 (European Commission, 2017b),
but Slovenia still has difficulties in this sector. For
example, there was recently backlog in the
treatment of municipal packaging waste.
Slovenia’s economy depends on its natural
environment, which is deteriorating. Natural
assets are used for a variety of purposes, such as
developing niche green businesses that drive local
economies. However, the status of habitats and
species is deteriorating, particularly because of
inappropriate urbanisation, farming and water
management practices (Slovenian Development
Strategy 2030).
Infrastructure
Slovenia’s transport infrastructure suffers from
declining quality and insufficient connectivity.
Slovenia has made significant investments in the
transport sector in recent years, helped by EU
funds (see box 2.1.). The initial focus of these
investments was on the motorway network, while
investments in rail infrastructure have only been
increasing more recently. However, the declining
quality of the rail infrastructure, rated 2.9 out of 7
by the World Economic Forum (WEF, 2018)
indicates that there is a clear investment backlog.
(40) EU Environmental Implementation Review Country Report
– Slovenia, 2017, http://ec.europa.eu/environment/eir/pdf/report_si_en.pdf.

3.4. Competitiveness reforms and investment
39
Furthermore, the inter-modality of rail and other
modes of transport is insufficient.
Slovenia’s heavy reliance on road transport
creates problems of high energy and carbon
intensity, as well as road fatalities. Road
transport also accounts for the largest share of
freight with 66.7 %, with railways covering
33.3 %, which is significantly above the EU
average of 17.4 % (European Commission,
2018k). Car trips accounted for 86.3 % of all
passenger-kilometres travelled, which is 3.4
percentage points above the EU average, with
buses and coaches accounting for around 11.8 %
and trains for only 2 %. The state road
infrastructure has been deteriorating in quality and
there are issues with connectivity in certain areas
(European Commission, 2018j). The share of
renewable energy used in transport fell below 2 %
in 2016, in contrast with the EU average, which
rose to 7 % (European Commission, 2019a). The
recharging infrastructure is relatively well
developed, but the share of new cars using
alternative fuels is low (European Commission,
2016). In terms of sustainable urban mobility, 62
sustainable urban mobility plans have been
prepared. In 2017, 50 road deaths per million
inhabitants were reported, which was slightly
higher than the EU average (European
Commission, 2019a).
Although Slovenia’s gas and electricity
infrastructure is well developed, solutions for
better usage of smart metering and storage
need to be found. There is a need for
improvement in the completion or commissioning
of reverse flow projects at Slovenia’s borders. As
regards its electricity grid, Slovenia has already
vastly exceeded its interconnection target, with
84 % of its installed electricity production capacity
currently interconnected (compared to the targets
of 10 % for 2020, and 15 % for 2030). It is also
solving remaining operational issues (41
). The
share of smart meters for electricity has increased
by 10 percentage points from 2013 to 2015 to a
share of around 50 % in 2016 (European
Commission, 2017d) and by 2023, the coverage is
(41) Although the system is well developed Slovenia is
encountering some operational issues (e.g. solved issue of
voltage profiles) which should be solved by implementing
a smart grid project of common interest (i.e. Sincrogrid) in cooperation with the Croatian transmission system
operator.
expected to be around 85 %. However, available
smart meters do not offer advanced solutions for
clients, so there is scope for an upgrade of
information and communications technology
solutions that take full advantage of the
functionality and information that the measuring
devices allow and offer. Moreover, the existing
energy storage is underdeveloped and thus fails to
address the needs linked to the non-integrated
network of local production of renewable energy
sources. The draft energy concept of Slovenia
(Ministry of Infrastructure, 2018) has identified
energy storage as one of the priorities for the
country.
While Slovenia’s drinking water supply system
has improved, the urban wastewater sector
experiences difficulties. Slovenia has made
considerable improvements to its drinking water
infrastructure in recent years. This is in contrast to
urban wastewater collection and treatment
infrastructure, where Slovenia’s performance is
unsatisfactory and does not comply with EU
standards (42
).
Slovenia is vulnerable to natural disasters,
which cause damage to the economy. The
frequency and severity of floods, droughts and
forest fires are expected to increase due to climate
change. Slovenia’s risk assessment has identified
floods as its most common and expensive natural
disaster (around EUR 1 billion in damages due to
flood events in recent years) (Ministry of
Environment, 2018). Slovenia is using EU funds to
invest EUR 90 million in flood protection and
EUR 15 million in forest restoration measures (see
box 2.1).
3.4.4. INSTITUTIONAL QUALITY AND
GOVERNANCE
Public procurement
Slovenia's performance as regards public
procurement remains mixed (43
). The main
problems remain competition and transparency as
well as independent oversight and legal uncertainty
(42) Slovenia is 3 years late in transposing the Urban Waste
Water Directive. (43) For a discussion on public procurement in the healthcare
sector, see section 3.1.4 above.
3.4. Competitiveness reforms and investment
40
in the area of concessions (44
). On professionalism
and in the area of e-government, Slovenia is
advancing. Furthermore, Slovenia ensures a high
participation of SMEs in public procurement. In
2018, 78 % of contractors were SMEs, and 44 %
of tenders were divided in lots, making bidding
easier for SME (compared to 58 % and 30 % EU
averages). There are thus comparatively low
barriers for smaller firms to participate in public
procurement procedures.
Slovenia is advancing in the roll-out of e-
procurement. An e-submission functionality has
been in place since April 2018, and is widely used
today. The e-procurement system relies on
structured data that is shared between different
databases. The ‘eDosje’ module, which gathers
evidence for exclusion criteria, is also linked with
national databases and the e-submission module.
Further actions are planned: rolling out electronic
catalogues, electronic auctions and electronic
appeals. Slovenia is actively involved in a number
of EU-funded calls aimed to further digitalise
public procurement.
Competition and transparency remain issues in
public procurement. Slovenia has a
comparatively high number of single bids in
tenders and a low average number of bids
received 45
. This hints at a lack of competition in
markets for public procurement, not least due to
small size of the market. As regards transparency,
24 % of the public contracts in Slovenia were
concluded through negotiated procedures without
publication in 2018, the same share as in 2017.
This is one of the worst scores in the EU and can
only partly be explained by a particular use of this
type of procedure.
Slovenia’s safeguards against collusion and
corruption in public procurement have had an
impact at national level, but they have not yet
had an impact on procurement by local
administrations and by state-owned enterprises.
Cartel agreements, bid-rigging and misuse of
public procurement procedures have been
identified by the Corruption Prevention
Commission (CPC) and the Court of Audit as
(44) Public procurement aggregation in healthcare also remains
an issue (see 3.1.5). (45) Last available figures for single bids are 37 % in 2016 and
39 % in 2015.
issues in local administrations and state owned
enterprises. In its annual reports the Corruption
Prevention Commission has also highlighted
conflicts of interest in the evaluation of bids,
collusive bidding, non-open tenders and single-
bids as concerns. Although there was a 22 pp.
decrease in the proportion of companies feeling
that corruption exists in public procurement
managed by national authorities (46
), 79 % of
Slovenian businesses still feel that collusive
bidding practices are widespread in public
procurement procedures overall (47
). Slovenia is
one of the 11 Member States participating in the
Integrity Pact pilot projects (48
).
Slovenia has started to improve the
professionalism of those involved in public
procurement. Slovenia has set up an action plan
to professionalise local contracting authorities. It
has also issued guidance to public authorities on
specific topics, such as IT procurement, public
works and cleaning services. It is currently
working on further guidance notes. Contracting
authorities in Slovenia are increasingly resorting to
preliminary market consultations with industry
prior to publication of calls for tender. This means
that Slovenia is on the right track when it comes to
professionalising the public-procurement process.
There remains legal uncertainty in the area of
concessions. Public procurement practices for
concessions in Slovenia are still marked by legal
uncertainty. There is a discrepancy between the
understanding of a concession contract under
national law and the European law. In addition, the
Concessions Directive still has not been transposed
into national law. The absence of legal certainty
may discourage foreign businesses from investing
in Slovenia, since they risk early termination of
contracts or unsuccessful remedy procedures.
Slovenia has not yet addressed the issue of
independent oversight of public procurement.
Slovenia has chosen a remedy system with only
one instance, the National Review
(46) Eurobarometer question 5.1.
(47) Eurobarometer question 4.7. (48) Such participation can contribute to increasing
transparency, accountability and efficiency in the public-procurement procedures for these projects.

3.4. Competitiveness reforms and investment
41
Commission (49
). There is no possibility for an
appeal against the Commission's decisions, but
dissatisfied stakeholders can start proceedings
before civil courts (50
). The members of the
Commission do not benefit from the same
guarantees of independence as Slovenian judges.
Unlike Slovenian judges, these members are not
proposed for appointment to the parliament by a
body independent from the legislative and
executive branches, nor is such a body charged
with conducting disciplinary proceedings against
them.
Justice system and fight against corruption
The justice system has further reduced backlogs
and measures to improve its quality are being
implemented. The 2019 EU Justice Scoreboard
(European Commission, 2019b) shows
improvements in the perception of judicial
independence and in reducing pending cases in all
courts, except for the administrative court, which
was impacted by an extraordinary influx of cases.
In 2018, the total backlog decreased by more than
10 %, compared to 2017. The courts continued to
resolve more cases than they received (total
clearance rate of 102 %), despite resolving fewer
cases than in the past (about 71 000 per month
compared to nearly 100 000 per month in 2012).
The average length of proceedings stagnated at
around 11 months in litigious civil and commercial
cases, and it still takes around 12 months until the
first hearing in a commercial case trial. The share
of litigious civil and commercial cases, which are
resolved through a court settlement, further
increased to above 20 %. Criminal courts resolved
more cases than they received (clearance rate of
103 %). The length of criminal cases increased in
local courts to about 10 months, and decreased in
district courts (to less than 14 months). While the
Council for the Judiciary increased its
administrative capacity, there is room for
improvement in providing better reasoning of its
opinions and decisions on the career of (candidate
national/international) judges, based on existing
criteria and procedures.
(49) Recognised by the Court of Justice in Case C 296/15 -
Medisanus as a 'national court or tribunal' for the purposes
of Article 267 TFEU 50 Claim for damages or contesting the concluded contract.
The prosecution service appears to be
experiencing certain challenges in efficiency
and quality, despite generally resolving more
criminal notifications than it receives. Some
proceedings take several years from the arrival of
the criminal notification from the police, until the
decision to prosecute. Efficiency and quality
challenges are being addressed through promoting
best practices among prosecutors, by improving
cooperation with courts (e.g. ensuring that the
prosecutor attending a court hearing does not
change until the trial ends), and through enhanced
monitoring of prosecutors’ work in the ICT
system. Quality issues in the area of economic and
financial crime, including anti-money laundering,
are being tackled through an action plan, which
envisages additional training, improving the
analytical capacity and upgrading the ICT system.
The State Prosecutorial Council lacks human
resources, which also contributes to delays in the
appointment of prosecutors and does not allow the
Council to work on analysing and improving the
general quality of the Prosecution Service.
A comprehensive survey of court users has been
launched, aiming to further improve the quality
of justice, but the judicial map reform remains
pending. The Supreme Court’s detailed
examination of court users’ view of the justice
system will feed into the reform agenda on quality
of justice. Several projects, including on
publishing all first instance judgments and on
informing parties about the progress of their case,
are also being implemented. However, the judicial
map reform remains pending. While consumers’
trust in courts for resolving their disputes has
increased, their confidence in alternative dispute
resolution mechanisms has decreased to the lowest
level ever. Consumers’ trust in public authorities to
safeguard their rights also remains among the
lowest in the EU (European Commission, 2019d).
Perceptions of corruption are improving, but
challenges remain. The 2017 General
Eurobarometer on corruption shows that Slovenia
has the highest proportion of citizens in the EU
(71 %) who feel that there are not enough
successful prosecutions of corruption to deter
people from corrupt practices. However, Slovenia
registered the largest rise in disagreement with this
statement, a 12 pp. increase compared to previous
figures. Although Slovenia’s score has remained
stable in the Transparency International corruption

3.4. Competitiveness reforms and investment
42
perceptions index (51
) its score in the World Bank's
control of corruption index has gradually improved
(76.5 in 2015 to 79.33 in 2017).
Concerns remain regarding the independence
and effectiveness of regulatory agencies and the
Corruption Prevention Commission. Regulatory
agency independence remains an issue, even if the
2017 Draft Law on Public Agencies has been
withdrawn (European Commission, 2018b). Such
concerns as regards the Corruption Prevention
Commission were e.g. expressed by the second
compliance report of the Group of States against
Corruption second compliance report (GRECO
2018) and by the OECD Working Group on
Bribery (OECD WGB, 2016). There has been a
significant decrease (-18pps) in the proportion of
Slovenes who mention the national anti-corruption
agency as an institution they would trust to deal
with corruption (52
). This decrease has coincided
with a significant decrease (-11pps) in the
proportion of respondents who feel that people do
not report incidents of corruption because doing so
would be pointless (53
).
Most of the goals in the 2017-2019 programme
of government measures for integrity and
transparency were met, or partly met. Almost
all documents for meetings of the government and
parliament are available online. Several
applications make it possible to monitor public
procurement expenses and the use of public funds
(including pensions, salaries of public employees,
health expenditure and public utility services).
Slovenia does not make the rules on contacts with
lobbyists by members of the National Assembly
subject to any assessment. While the National
Council has adopted a code of conduct, it has been
considered insufficient in respect of conflicts of
interest, supervision and sanctions. The amended
Integrity and Prevention of Corruption Act (IPCA)
is still on hold, despite initially being scheduled for
adoption in 2015, due to concerns over stakeholder
consultation and non-transparent drafting
procedures. Post-employment issues (‘revolving
doors’ between government and the private sector)
(51) In the Transparency International 2017 corruption
perception index, Slovenia ranks 14 in the EU with a score slightly below the EU average.
(52) 2017 Special Eurobarometer on corruption (EB 470 European Commission, 2017), question 11.
(53) 2017 Special Eurobarometer on corruption (EB 470
European Commission, 2017), question 14.
and the transparency of lobbying records remain
unaddressed. Trading in influence, conflicts of
interest, favouritism and nepotism also remain
obstacles to the impartiality of the decision-making
process. Shadow lobbying, where third parties can
influence government decision making outside
reported contacts, is not covered in the IPCA.
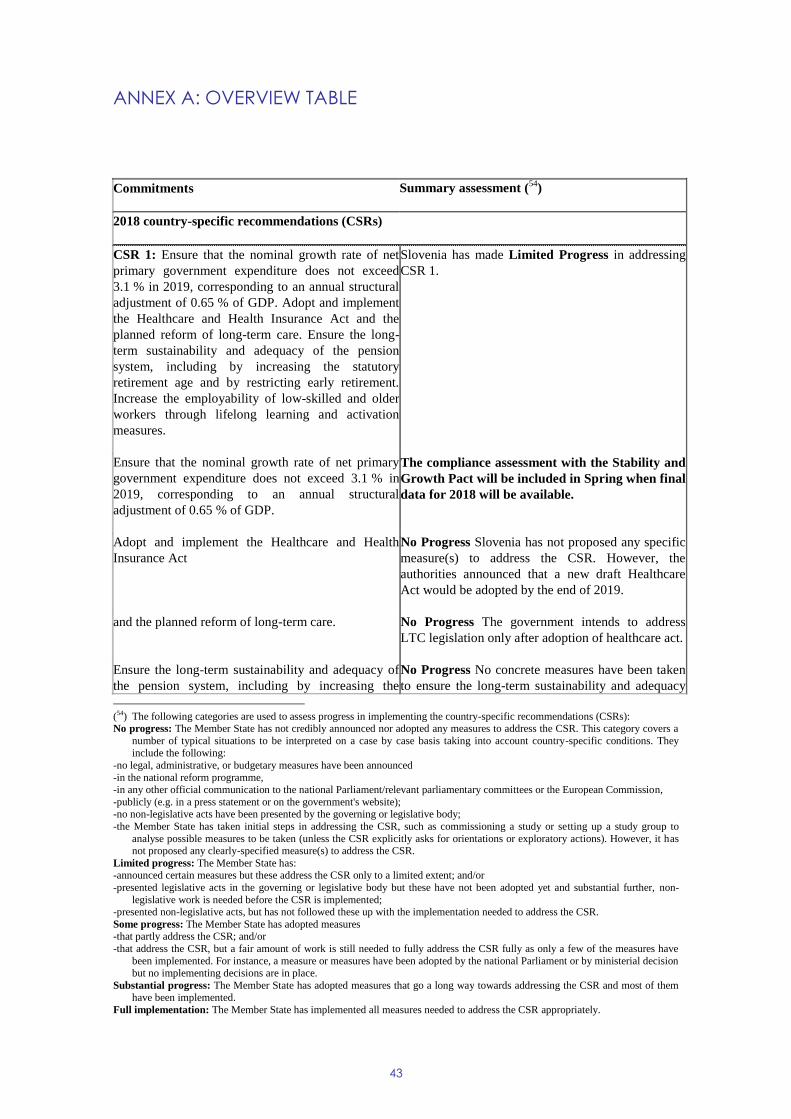
43
Commitments Summary assessment (54
)
2018 country-specific recommendations (CSRs)
CSR 1: Ensure that the nominal growth rate of net
primary government expenditure does not exceed
3.1 % in 2019, corresponding to an annual structural
adjustment of 0.65 % of GDP. Adopt and implement
the Healthcare and Health Insurance Act and the
planned reform of long-term care. Ensure the long-
term sustainability and adequacy of the pension
system, including by increasing the statutory
retirement age and by restricting early retirement.
Increase the employability of low-skilled and older
workers through lifelong learning and activation
measures.
Slovenia has made Limited Progress in addressing
CSR 1.
Ensure that the nominal growth rate of net primary
government expenditure does not exceed 3.1 % in
2019, corresponding to an annual structural
adjustment of 0.65 % of GDP.
The compliance assessment with the Stability and
Growth Pact will be included in Spring when final
data for 2018 will be available.
Adopt and implement the Healthcare and Health
Insurance Act
No Progress Slovenia has not proposed any specific
measure(s) to address the CSR. However, the
authorities announced that a new draft Healthcare
Act would be adopted by the end of 2019.
and the planned reform of long-term care. No Progress The government intends to address
LTC legislation only after adoption of healthcare act.
Ensure the long-term sustainability and adequacy of
the pension system, including by increasing the
No Progress No concrete measures have been taken
to ensure the long-term sustainability and adequacy
(54) The following categories are used to assess progress in implementing the country-specific recommendations (CSRs): No progress: The Member State has not credibly announced nor adopted any measures to address the CSR. This category covers a
number of typical situations to be interpreted on a case by case basis taking into account country-specific conditions. They
include the following:
-no legal, administrative, or budgetary measures have been announced
-in the national reform programme, -in any other official communication to the national Parliament/relevant parliamentary committees or the European Commission,
-publicly (e.g. in a press statement or on the government's website); -no non-legislative acts have been presented by the governing or legislative body;
-the Member State has taken initial steps in addressing the CSR, such as commissioning a study or setting up a study group to
analyse possible measures to be taken (unless the CSR explicitly asks for orientations or exploratory actions). However, it has not proposed any clearly-specified measure(s) to address the CSR.
Limited progress: The Member State has: -announced certain measures but these address the CSR only to a limited extent; and/or
-presented legislative acts in the governing or legislative body but these have not been adopted yet and substantial further, non-
legislative work is needed before the CSR is implemented; -presented non-legislative acts, but has not followed these up with the implementation needed to address the CSR.
Some progress: The Member State has adopted measures -that partly address the CSR; and/or
-that address the CSR, but a fair amount of work is still needed to fully address the CSR fully as only a few of the measures have
been implemented. For instance, a measure or measures have been adopted by the national Parliament or by ministerial decision
but no implementing decisions are in place.
Substantial progress: The Member State has adopted measures that go a long way towards addressing the CSR and most of them have been implemented.
Full implementation: The Member State has implemented all measures needed to address the CSR appropriately.
ANNEX A: OVERVIEW TABLE

A. Overview Table
44
statutory retirement age and by restricting early
retirement.
of the pension system, whether by increasing the
statutory retirement age or by restricting early
retirement.
Increase the employability of low-skilled and older
workers through lifelong learning and activation
measures.
Limited Progress The Slovenian government
continued its efforts to increase the employability of
low-skilled and older workers through lifelong
learning and schemes to help the inactive find work.
However, participation in adult learning is still low,
especially among the group of older workers and the
low-skilled.
CSR 2: Develop alternative sources of financing for
fast-growing companies. Lower the barriers for
market entry through the revision of Product Market
Regulation and limiting administrative burden.
Enhance competition, professionalisation and
independent oversight in public procurement. Carry
out the privatisations in line with to the existing
plans.
Slovenia has made Some Progress in addressing
CSR 2.
Develop alternative sources of financing for fast-
growing companies.
Some Progress In 2018 Slovenia took important
steps in the implementation of, notably, the Slovene
Equity Growth Investment Programme and the
Central European Fund-of-Funds. These steps related
to support amounts, intermediaries and beneficiaries.
The Ljubljana Stock Exchange has improved its
support for SME listings. Slovenia also adopted an
action plan on block chain technology, which is also
used for crypto-currencies and initial coin offerings.
Lower the barriers for market entry through the
revision of Product Market Regulation and limiting
administrative burden.
Some Progress Slovenia adopted the Investment
Promotion Act in early 2018. This act facilitates
investment inter alia by harmonising support
conditions for domestic and foreign investors and by
reducing barriers for strategic investments. Impact
assessments are performed for draft laws under
regular parliamentary procedure but not for the many
laws in urgent procedure. Stakeholders benefit since
2018 from a new online tool for their input to this
SME test. Slovenia’s justice system also continued
reducing the backlog of pending cases. Slovenia also
progressed with one-stop online portals for key
administrative procedures and with the so-called
"Single Document". A good part of the suggested
administrative burden reduction measures, as well as
planned measures to reduce regulatory restrictions on
professions is still pending.
Enhance competition, professionalisation and
independent oversight in public procurement.
Limited progress: In May 2018, Slovenia presented
an action plan detailing planned improvements,
notably on further professionalisation of public

A. Overview Table
45
procurement, for 2018-2020. Slovenia also made
progress in rolling out e-procurement, which is
widely used since April 2018. Rather little progress
was made to increase competition in procurement,
which remains a key problem. Slovenia also did not
strengthen the independence of the National Review
Commission. Slovenia did not achieve a higher
degree of tender aggregation for health sector
procurement.
Carry out the privatisations in line with to the
existing plans.
Some Progress: Slovenia made some progress in the
privatisation of SOEs as only one privatisation took
place in 2018. With the partial privatisation of
Slovenia’s biggest bank in 2018 and the launch of
the sale of its third biggest bank, Slovenia took
important steps in implementing its privatisation list.
Europe 2020 (national targets and progress)
Employment rate target set in the NRP: 75 %. The employment rate for 20-64 years old workers
increased by 3.3 pp. to 73.4 % in 2017, and, for the
first time since 2009, is now again above the EU
average (72.2 %).
R&D target set in the NRP: 3 % of GDP R&D intensity has been declining since 2013, driven
by declines in both the public and private sectors, but
reached its lowest level at 1.86 % in 2017.
In 2017, R&D intensity in Slovenia was composed of
75% (1.39% of GDP ) private investment and 25%
public investment (0.47% of GDP).
The declining R&D intensity shows a clear risk of
Slovenia not meeting its national R&D target of 3 %
of GDP in 2020.
National greenhouse gas (GHG) emissions target:
+ 4 % in 2020 compared with 2005 (in sectors not
included in the EU emissions trading scheme).
Slovenia is also well on track to reach its greenhouse
gas emissions target in the non-ETS sector of +4 %
in 2020 compared to 2005 since most recent Slovene
projections expect a reduction by -9 % for this
period.
2020 renewable energy target: 25 % The share of renewable energy sources (RES) is
above the EU average but has stagnated or even
deteriorated in recent years.
The renewable energy share in Slovenia was around
21 % in 2016. While being above the 2015/2016
indicative trajectory (20.1 %), increased efforts are
necessary to reach the 2020-target (25 %). Regarding

A. Overview Table
46
the use of other RES (wind, solar, biogas,
geothermal, biofuels, heat pumps), Slovenia ranks at
the tail end of the EU, with the gap in wind energy
being particularly wide. In particular, in the
electricity and transportation sectors Slovenia is
lagging behind its sectoral renewable energy targets.
Nevertheless, Slovenia has a high potential to
develop renewable energy sources further in a cost-
effective way, in all sectors.
Energy efficiency, 2020 energy consumption targets:
Slovenia’s 2020 energy efficiency target is 7.3
million tonnes of oil equivalent (Mtoe) expressed in
primary energy consumption (5.1 Mtoe expressed in
final energy consumption.)
In terms of energy efficiency, primary as well as
final energy consumption are already below the
indicative national 2020 targets.
In 2017, the Government adopted a new National
Energy Efficiency Action Plan (NEEAP) for the
period 2017-2020, which confirms that Slovenia is
on track to meet its 2020 target in energy efficiency.
Nonetheless, additional efforts are needed as both
primary and final energy consumption has been
increasing in 2016 and this puts at risk the
achievement of the EU 2020 energy efficiency target.
The rise in energy use was most prominent in the
transport sector, which accounts for 38% of the total
energy use. The latest data show that energy use in
transport increased by 5.9% in 2016 compared to
2015.
Early school/training leaving target: 5 %. In 2017, Slovenia retained the early school-leaving
rate under the national target by 0.7 pps. With early
school leaving well below the Europe 2020 target of
10 %, Slovenia is placed among the leading EU
Member States.
Tertiary education target: 40 % of population aged
30-34.
The tertiary education attainment continuously
improved. After exceeding the 2020 target in 2013,
in 2017 there were 46.4 % Slovenian young adults
(30-34 year-olds) with a tertiary degree.
Target for reducing the number of people at risk of
poverty or social exclusion, expressed as an absolute
number of people: 40 000 (base year 2010: 360 000).
In 2017, the number of people at risk of poverty and
social exclusion fell for the third consecutive year.
However, 345 000 people were still at risk of poverty
or social exclusion.

47
General Government debt projections under baseline, alternative scenarios and sensitivity tests
2017 2018 2019 2020 2021 2022 2023 2024 2025 2026 2027 2028 2029
Gross debt ratio 74.1 70.2 66.3 62.6 59.6 57.3 55.8 54.2 53.1 52.4 52.3 52.6 53.5
Changes in the ratio (-1+2+3) -4.6 -3.9 -3.8 -3.7 -3.0 -2.3 -1.5 -1.6 -1.1 -0.7 -0.1 0.3 0.9
of which
(1) Primary balance (1.1+1.2+1.3) 2.6 2.4 2.1 1.8 1.3 0.9 0.3 0.2 0.0 -0.2 -0.4 -0.8 -1.1
(1.1) Structural primary balance (1.1.1-1.1.2+1.1.3) 2.1 1.2 0.7 0.6 0.5 0.5 0.3 0.2 0.0 -0.2 -0.4 -0.8 -1.1(1.1.1) Structural primary balance (bef. CoA) 2.1 1.2 0.7 0.6 0.6 0.6 0.6 0.6 0.6 0.6 0.6 0.6 0.6
(1.1.2) Cost of ageing 0.0 0.0 0.2 0.4 0.5 0.7 1.0 1.3 1.6
(1.1.3) Others (taxes and property incomes) 0.0 0.0 0.0 0.0 0.0 0.0 0.0 0.0 0.0
(1.2) Cyclical component 0.5 1.3 1.4 1.2 0.8 0.4 0.0 0.0 0.0 0.0 0.0 0.0 0.0
(1.3) One-off and other temporary measures -0.1 -0.1 0.0 0.0 0.0 0.0 0.0 0.0 0.0 0.0 0.0 0.0 0.0
(2) Snowball effect (2.1+2.2+2.3) -2.3 -2.6 -2.3 -1.9 -1.7 -1.4 -1.2 -1.4 -1.1 -0.9 -0.6 -0.4 -0.2(2.1) Interest expenditure 2.5 2.0 1.7 1.6 1.5 1.4 1.4 1.4 1.5 1.6 1.7 1.8 1.9
(2.2) Growth effect -3.6 -3.0 -2.2 -1.9 -1.7 -1.6 -1.5 -1.8 -1.5 -1.4 -1.2 -1.2 -1.1
(2.3) Inflation effect -1.2 -1.6 -1.7 -1.6 -1.4 -1.3 -1.1 -1.1 -1.1 -1.0 -1.0 -1.0 -1.0
(3) Stock-flow adjustments 0.3 1.2 0.5 0.0 0.0 0.0 0.0 0.0 0.0 0.0 0.0 0.0 0.0
Note: For further information, see the European Commission Fiscal Sustainability Report (FSR) 2018.
b. For the medium-term, the risk category (low/medium/high) is based on the joint use of the S1 indicator and of the DSA results. The S1 indicator measures the fiscal adjustment
required (cumulated over the 5 years following the forecast horizon and sustained thereafter) to bring the debt-to-GDP ratio to 60 % by 2033. The critical values used are 0 and 2.5
pps. of GDP. The DSA classification is based on the results of 5 deterministic scenarios (baseline, historical SPB, higher interest rate, lower GDP growth and negative shock on the
SPB scenarios) and the stochastic projections. Different criteria are used such as the projected debt level, the debt path, the realism of fiscal assumptions, the probability of debt
stabilisation, and the size of uncertainties.
c. For the long-term, the risk category (low/medium/high) is based on the joint use of the S2 indicator and the DSA results. The S2 indicator measures the upfront and permanent
fiscal adjustment required to stabilise the debt-to-GDP ratio over the infinite horizon, including the costs of ageing. The critical values used are 2 and 6 pps. of GDP. The DSA results
are used to further qualify the long-term risk classification, in particular in cases when debt vulnerabilities are identified (a medium / high DSA risk category).
[2] The charts present a series of sensitivity tests around the baseline scenario, as well as alternative policy scenarios, in particular: the historical structural primary balance (SPB)
scenario (where the SPB is set at its historical average), the Stability and Growth Pact (SGP) scenario (where fiscal policy is assumed to evolve in line with the main provisions of the
SGP), a higher interest rate scenario (+1 pp. compared to the baseline), a lower GDP growth scenario (-0.5 pp. compared to the baseline) and a negative shock on the SPB (calibrated
on the basis of the forecasted change). An adverse combined scenario and enhanced sensitivity tests (on the interest rate and growth) are also included, as well as stochastic
projections. Detailed information on the design of these projections can be found in the FSR 2018.
SI - Debt projections baseline scenario
[1] The first table presents the baseline no-fiscal policy change scenario projections. It shows the projected government debt dynamics and its decomposition between the primary
balance, snowball effects and stock-flow adjustments. Snowball effects measure the net impact of the counteracting effects of interest rates, inflation, real GDP growth (and exchange
rates in some countries). Stock-flow adjustments include differences in cash and accrual accounting, net accumulation of assets, as well as valuation and other residual effects.
[3] The second table presents the overall fiscal risk classification over the short, medium and long-term.
a. For the short-term, the risk category (low/high) is based on the S0 indicator. S0 is an early-detection indicator of fiscal stress in the upcoming year, based on 25 fiscal and financial-
competitiveness variables that have proven in the past to be leading indicators of fiscal stress. The critical threshold beyond which fiscal distress is signalled is 0.46.
30
40
50
60
70
80
90
2016 2017 2018 2019 2020 2021 2022 2023 2024 2025 2026 2027 2028 2029
Debt as % of GDP - SI
Baseline Enhanced lower GDP growth scenario
Adverse combined scenario Enhanced higher interest rate scenario
30
40
50
60
70
80
90
2016 2017 2018 2019 2020 2021 2022 2023
(% of GDP) Stochastic debt projections 2019-2023 - SI
p10_p20 p20_p40 p40_p60
p60_p80 p80_p90 p50 Baseline
30
40
50
60
70
80
90
2016 2017 2018 2019 2020 2021 2022 2023 2024 2025 2026 2027 2028 2029
Debt as % of GDP - SI
Baseline Historical SPB scenario SGP scenario
30
40
50
60
70
80
90
2016 2017 2018 2019 2020 2021 2022 2023 2024 2025 2026 2027 2028 2029
Debt as % of GDP - SI
Baseline Higher interest rate scenario
Negative shock on the SPB Lower GDP growth scenario
BaselineHistorical
SPB
Lower GDP
growth
Higher
interest rate
Negative
shock on
SPB
Stochastic
projections
Risk category LOW MEDIUM LOW LOW LOW LOW
Debt level (2029) 53.5 60.4 56.4 56.3 56.4
Debt peak year 2018 2018 2018 2018 2018
Percentile rank 48.0% 62.0%
Probability debt higher 6.0%
Dif. between percentiles 23.5
MEDIUM
Long
termDSA
LOW
Debt sustainability analysis (detail)Medium
term
MEDIUM MEDIUM
Short
term
LOW
(S0 = 0.1) (S1 = 0.2)
S2
MEDIUM
(S2 = 5.5)
S1
ANNEX B: COMMISSION DEBT SUSTAINABILITY ANALYSIS AND
FISCAL RISKS
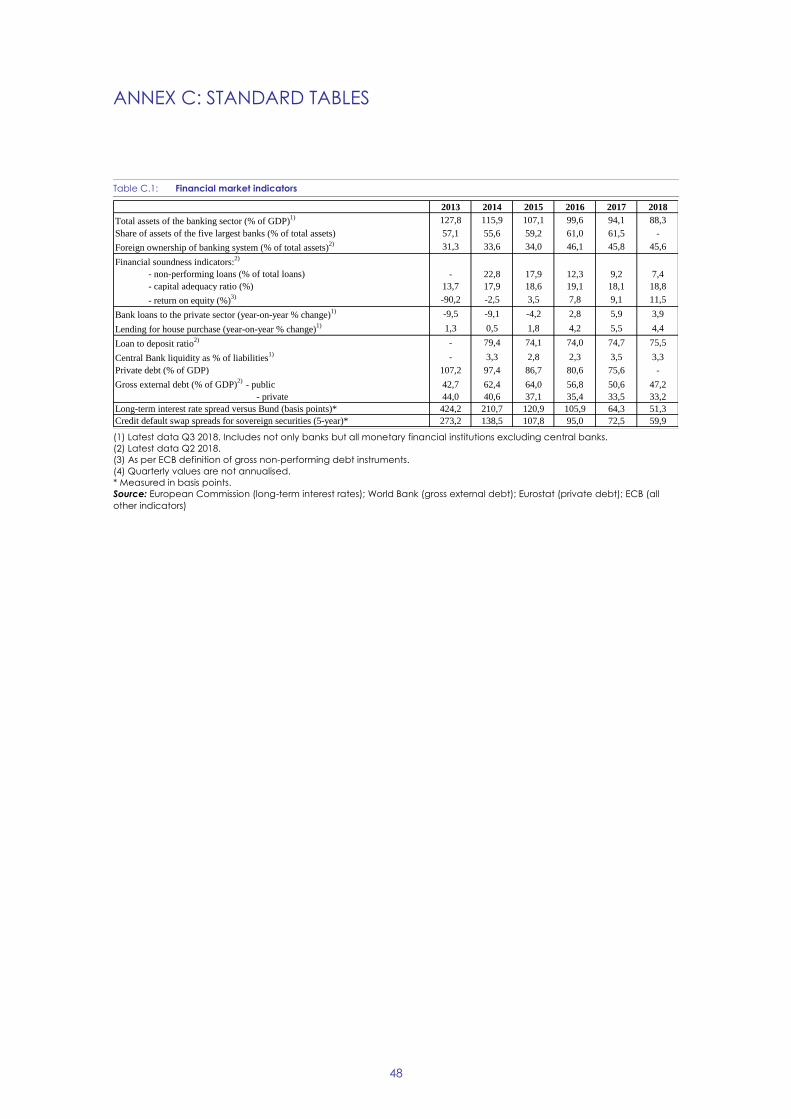
48
ANNEX C: STANDARD TABLES
Table C.1: Financial market indicators
(1) Latest data Q3 2018. Includes not only banks but all monetary financial institutions excluding central banks.
(2) Latest data Q2 2018.
(3) As per ECB definition of gross non-performing debt instruments.
(4) Quarterly values are not annualised.
* Measured in basis points.
Source: European Commission (long-term interest rates); World Bank (gross external debt); Eurostat (private debt); ECB (all
other indicators)
2013 2014 2015 2016 2017 2018
Total assets of the banking sector (% of GDP)1) 127,8 115,9 107,1 99,6 94,1 88,3
Share of assets of the five largest banks (% of total assets) 57,1 55,6 59,2 61,0 61,5 -
Foreign ownership of banking system (% of total assets)2) 31,3 33,6 34,0 46,1 45,8 45,6
Financial soundness indicators:2)
- non-performing loans (% of total loans) - 22,8 17,9 12,3 9,2 7,4
- capital adequacy ratio (%) 13,7 17,9 18,6 19,1 18,1 18,8
- return on equity (%)3) -90,2 -2,5 3,5 7,8 9,1 11,5
Bank loans to the private sector (year-on-year % change)1) -9,5 -9,1 -4,2 2,8 5,9 3,9
Lending for house purchase (year-on-year % change)1) 1,3 0,5 1,8 4,2 5,5 4,4
Loan to deposit ratio2) - 79,4 74,1 74,0 74,7 75,5
Central Bank liquidity as % of liabilities1) - 3,3 2,8 2,3 3,5 3,3
Private debt (% of GDP) 107,2 97,4 86,7 80,6 75,6 -
Gross external debt (% of GDP)2)
- public 42,7 62,4 64,0 56,8 50,6 47,2
- private 44,0 40,6 37,1 35,4 33,5 33,2
Long-term interest rate spread versus Bund (basis points)* 424,2 210,7 120,9 105,9 64,3 51,3
Credit default swap spreads for sovereign securities (5-year)* 273,2 138,5 107,8 95,0 72,5 59,9

C. Standard Tables
49
Table C.2: Headline Social Scoreboard indicators
(1) People at risk of poverty or social exclusion (AROPE): individuals who are at risk of poverty (AROP) and/or suffering from
severe material deprivation (SMD) and/or living in households with zero or very low work intensity (LWI).
(2) Unemployed persons are all those who were not employed but had actively sought work and were ready to begin
working immediately or within two weeks.
(3) Long-term unemployed are people who have been unemployed for at least 12 months.
(4) Gross disposable household income is defined in unadjusted terms, according to the draft Joint Employment Report 2019.
(5) Reduction in percentage of the risk of poverty rate, due to social transfers (calculated comparing at-risk-of poverty rates
before social transfers with those after transfers; pensions are not considered as social transfers in the calculation).
(6) Average of first three quarters of 2018 for the employment rate, long-term unemployment rate and gender employment
gap. Data for unemployment rate is seasonally adjusted (annual series, for EE, EL, HU, IT and UK data based on first three
quarters of 2018).
Source: Eurostat
2013 2014 2015 2016 2017 2018 6
Equal opportunities and access to the labour market
Early leavers from education and training
(% of population aged 18-24)3,9 4,4 5,0 4,9 4,3 :
Gender employment gap (pps) 8,2 8,0 8,6 6,6 7,2 7,4
Income inequality, measured as quintile share ratio (S80/S20) 3,6 3,7 3,6 3,6 3,4 :
At-risk-of-poverty or social exclusion rate1 (AROPE) 20,4 20,4 19,2 18,4 17,1 :
Young people neither in employment nor in education and
training (% of population aged 15-24)9,2 9,4 9,5 8,0 6,5 :
Dynamic labour markets and fair working conditions†
Employment rate (20-64 years) 67,2 67,7 69,1 70,1 73,4 75,1
Unemployment rate2 (15-74 years) 10,1 9,7 9,0 8,0 6,6 5,4
Long-term unemployment rate3 (as % of active population) 5,2 5,3 4,7 4,3 3,1 2,3
Gross disposable income of households in real terms per capita4
(Index 2008=100) 91,6 92,8 94,6 99,1 101,9 :
Annual net earnings of a full-time single worker without
children earning an average wage (levels in PPS, three-year
average)
14424 14741 14958 15049 : :
Annual net earnings of a full-time single worker without
children earning an average wage (percentage change, real
terms, three-year average)
-0,7 -0,5 0,5 1,2 : :
Public support / Social protection and inclusion
Impact of social transfers (excluding pensions) on poverty
reduction5 42,7 42,2 42,3 42,8 44,6 :
Children aged less than 3 years in formal childcare 39,0 37,4 37,4 39,6 44,8 :
Self-reported unmet need for medical care 0,0 0,2 0,2 0,4 3,5 :
Individuals who have basic or above basic overall digital skills
(% of population aged 16-74): : 51,0 53,0 54,0 :

C. Standard Tables
50
Table C.3: Labour market and education indicators
* Non-scoreboard indicator.
(1) Difference between the average gross hourly earnings of male paid employees and of female paid employees as a
percentage of average gross hourly earnings of male paid employees. It is defined as "unadjusted", as it does not correct for
the distribution of individual characteristics (and thus gives an overall picture of gender inequalities in terms of pay). All
employees working in firms with ten or more employees, without restrictions for age and hours worked, are included.
(2) PISA (OECD) results for low achievement in mathematics for 15 year-olds.
(3) Impact of socio-economic and cultural status on PISA (OECD) scores. Values for 2012 and 2015 refer respectively to
mathematics and science.
(4) Average of first three quarters of 2018. Data for youth unemployment rate is seasonally adjusted (annual series, for EE, EL,
HU, IT and UK data based on first three quarters of 2018).
Source: Eurostat, OECD
Labour market indicators 2013 2014 2015 2016 2017 2018 4
Activity rate (15-64) 70,5 70,9 71,8 71,6 74,2 :
Employment in current job by duration
From 0 to 11 months 10,7 8,8 12,4 10,9 13,4 :
From 12 to 23 months 7,0 7,1 7,8 8,3 8,0 :
From 24 to 59 months 13,1 14,2 13,7 14,2 13,8 :
60 months or over 69,2 68,3 66,2 66,5 64,8 :
Employment growth*
(% change from previous year) -1,1 0,4 1,3 1,8 2,9 3,0
Employment rate of women
(% of female population aged 20-64) 63,0 63,6 64,7 66,7 69,7 71,3
Employment rate of men
(% of male population aged 20-64)71,2 71,6 73,3 73,3 76,9 78,7
Employment rate of older workers*
(% of population aged 55-64)33,5 35,4 36,6 38,5 42,7 46,4
Part-time employment*
(% of total employment, aged 15-64)9,3 10,0 10,1 9,3 10,3 9,9
Fixed-term employment*
(% of employees with a fixed term contract, aged 15-64)16,3 16,5 17,8 16,9 17,6 16,2
Participation in activation labour market policies
(per 100 persons wanting to work)10,5 10,6 7,8 6,1 : :
Transition rate from temporary to permanent employment
(3-year average)37,1 41,0 41,2 42,4 38,4 :
Youth unemployment rate
(% active population aged 15-24)21,6 20,2 16,3 15,2 11,2 9,7
Gender gap in part-time employment 6,1 6,9 6,7 7,1 7,8 8,7
Gender pay gap1 (in undadjusted form) 6,3 7,0 8,1 7,8 : :
Education and training indicators 2013 2014 2015 2016 2017 2018
Adult participation in learning
(% of people aged 25-64 participating in education and training)12,5 12,1 11,9 11,6 12,0 :
Underachievement in education2 : : 16,1 : : :
Tertiary educational attainment (% of population aged 30-34 having
successfully completed tertiary education)40,1 41,0 43,4 44,2 46,4 :
Variation in performance explained by students' socio-economic
status3 : : 13,5 : : :
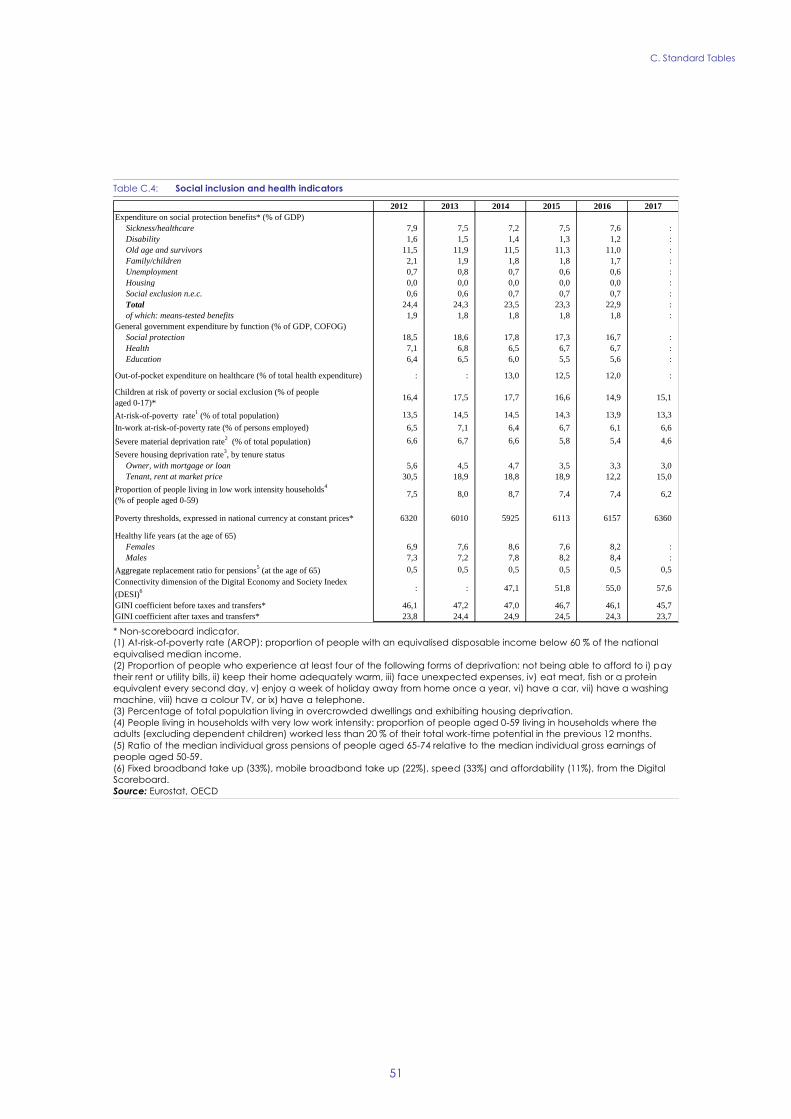
C. Standard Tables
51
Table C.4: Social inclusion and health indicators
* Non-scoreboard indicator.
(1) At-risk-of-poverty rate (AROP): proportion of people with an equivalised disposable income below 60 % of the national
equivalised median income.
(2) Proportion of people who experience at least four of the following forms of deprivation: not being able to afford to i) pay
their rent or utility bills, ii) keep their home adequately warm, iii) face unexpected expenses, iv) eat meat, fish or a protein
equivalent every second day, v) enjoy a week of holiday away from home once a year, vi) have a car, vii) have a washing
machine, viii) have a colour TV, or ix) have a telephone.
(3) Percentage of total population living in overcrowded dwellings and exhibiting housing deprivation.
(4) People living in households with very low work intensity: proportion of people aged 0-59 living in households where the
adults (excluding dependent children) worked less than 20 % of their total work-time potential in the previous 12 months.
(5) Ratio of the median individual gross pensions of people aged 65-74 relative to the median individual gross earnings of
people aged 50-59.
(6) Fixed broadband take up (33%), mobile broadband take up (22%), speed (33%) and affordability (11%), from the Digital
Scoreboard.
Source: Eurostat, OECD
2012 2013 2014 2015 2016 2017
Expenditure on social protection benefits* (% of GDP)
Sickness/healthcare 7,9 7,5 7,2 7,5 7,6 :
Disability 1,6 1,5 1,4 1,3 1,2 :
Old age and survivors 11,5 11,9 11,5 11,3 11,0 :
Family/children 2,1 1,9 1,8 1,8 1,7 :
Unemployment 0,7 0,8 0,7 0,6 0,6 :
Housing 0,0 0,0 0,0 0,0 0,0 :
Social exclusion n.e.c. 0,6 0,6 0,7 0,7 0,7 :
Total 24,4 24,3 23,5 23,3 22,9 :
of which: means-tested benefits 1,9 1,8 1,8 1,8 1,8 :
General government expenditure by function (% of GDP, COFOG)
Social protection 18,5 18,6 17,8 17,3 16,7 :
Health 7,1 6,8 6,5 6,7 6,7 :
Education 6,4 6,5 6,0 5,5 5,6 :
Out-of-pocket expenditure on healthcare (% of total health expenditure) : : 13,0 12,5 12,0 :
Children at risk of poverty or social exclusion (% of people
aged 0-17)*16,4 17,5 17,7 16,6 14,9 15,1
At-risk-of-poverty rate1 (% of total population) 13,5 14,5 14,5 14,3 13,9 13,3
In-work at-risk-of-poverty rate (% of persons employed) 6,5 7,1 6,4 6,7 6,1 6,6
Severe material deprivation rate2 (% of total population) 6,6 6,7 6,6 5,8 5,4 4,6
Severe housing deprivation rate3, by tenure status
Owner, with mortgage or loan 5,6 4,5 4,7 3,5 3,3 3,0
Tenant, rent at market price 30,5 18,9 18,8 18,9 12,2 15,0
Proportion of people living in low work intensity households4
(% of people aged 0-59)7,5 8,0 8,7 7,4 7,4 6,2
Poverty thresholds, expressed in national currency at constant prices* 6320 6010 5925 6113 6157 6360
Healthy life years (at the age of 65)
Females 6,9 7,6 8,6 7,6 8,2 :
Males 7,3 7,2 7,8 8,2 8,4 :
Aggregate replacement ratio for pensions5 (at the age of 65) 0,5 0,5 0,5 0,5 0,5 0,5
Connectivity dimension of the Digital Economy and Society Inedex
(DESI)6 : : 47,1 51,8 55,0 57,6
GINI coefficient before taxes and transfers* 46,1 47,2 47,0 46,7 46,1 45,7
GINI coefficient after taxes and transfers* 23,8 24,4 24,9 24,5 24,3 23,7

C. Standard Tables
52
Table C.5: Product market performance and policy indicators
(1) Value added in constant prices divided by the number of persons employed.
(2) Compensation of employees in current prices divided by value added in constant prices.
(3) The methodologies, including the assumptions, for this indicator are shown in detail here:
http://www.doingbusiness.org/methodology.
(4) Average of the answer to question Q7B_a. "[Bank loan]: If you applied and tried to negotiate for this type of financing
over the past six months, what was the outcome?". Answers were codified as follows: zero if received everything, one if
received 75% and above, two if received below 75%, three if refused or rejected and treated as missing values if the
application is still pending or don't know.
(5) Percentage population aged 15-64 having completed tertiary education.
(6) Percentage population aged 20-24 having attained at least upper secondary education.
(7) Index: 0 = not regulated; 6 = most regulated. The methodologies of the OECD product market regulation indicators are
shown in detail here: http://www.oecd.org/competition/reform/indicatorsofproductmarketregulationhomepage.htm.
(8) Aggregate OECD indicators of regulation in energy, transport and communications (ETCR).
Source: European Commission; World Bank - Doing Business (for enforcing contracts and time to start a business); OECD (for
the product market regulation indicators); SAFE (for outcome of SMEs' applications for bank loans).
Performance indicators 2012 2013 2014 2015 2016 2017
Labour productivity per person1 growth (t/t-1) in %
Labour productivity growth in industry -1,39 1,75 4,52 -0,17 2,21 4,27
Labour productivity growth in construction -0,12 -1,91 11,60 -1,89 -2,72 5,70
Labour productivity growth in market services -2,10 0,61 2,46 1,31 0,93 1,55
Unit Labour Cost (ULC) index2 growth (t/t-1) in %
ULC growth in industry 3,41 0,24 -1,29 2,00 0,70 -1,13
ULC growth in construction -1,83 2,77 -6,18 5,03 4,89 -0,81
ULC growth in market services -0,44 -1,72 -0,56 -0,20 1,51 1,78
Business environment 2012 2013 2014 2015 2016 2017
Time needed to enforce contracts3 (days) 1290 1270 1270 1160 1160 1160
Time needed to start a business3 (days) 6,0 6,0 6,0 6,0 6,0 6,0
Outcome of applications by SMEs for bank loans4 : 0,38 1,08 0,41 0,67 0,61
Research and innovation 2012 2013 2014 2015 2016 2017
R&D intensity 2,57 2,58 2,37 2,20 2,01 1,86
General government expenditure on education as % of GDP 6,40 6,50 6,00 5,50 5,60 :
Employed people with tertiary education and/or people employed in
science and technology as % of total employment42 43 43 44 44 45
Population having completed tertiary education5 23 24 25 27 27 29
Young people with upper secondary education6 90 92 90 91 91 91
Trade balance of high technology products as % of GDP -0,83 -0,60 -0,83 -0,62 -0,65 -0,72
Product and service markets and competition 2003 2008 2013
OECD product market regulation (PMR)7, overall : 1,89 1,70
OECD PMR7, retail : 0,90 0,63
OECD PMR7, professional services : : 2,56
OECD PMR7, network industries
8 4,84 3,41 2,90

C. Standard Tables
53
Table C.6: Green growth
All macro intensity indicators are expressed as a ratio of a physical quantity to GDP (in 2010 prices)
(i) Energy intensity: gross inland energy consumption (in kgoe) divided by GDP (in EUR)
(ii) Carbon intensity: greenhouse gas emissions (in kg CO2 equivalents) divided by GDP (in EUR)
(iii) Resource intensity: domestic material consumption (in kg) divided by GDP (in EUR)
(iv) Waste intensity: waste (in kg) divided by GDP (in EUR)
Energy balance of trade: the balance of energy exports and imports, expressed as % of GDP.
Weighting of energy in HICP: the proportion of 'energy' items in the consumption basket used for the construction of the HICP.
Difference between energy price change and inflation: energy component of HICP, and total HICP inflation (annual %
change).
Real unit energy cost: real energy costs as % of total value added for the economy.
Industry energy intensity: final energy consumption of industry (in kgoe) divided by gross value added of industry (in 2010
EUR).
Real unit energy costs for manufacturing industry excluding refining : real costs as % of value added for manufacturing
sectors.
Share of energy-intensive industries in the economy: share of gross value added of the energy-intensive industries in GDP.
Electricity and gas prices for medium-sized industrial users: consumption band 500–20 00MWh and 10 000–100 000 GJ; figures
excl. VAT.
Recycling rate of municipal waste: ratio of recycled and composted municipal waste to total municipal waste.
Public R&D for energy or for the environment: government spending on R&D for these categories as % of GDP.
Proportion of GHG emissions covered by EU emissions trading system (ETS) (excluding aviation): based on GHG emissions (excl
land use, land use change and forestry) as reported by Member States to the European Environment Agency.
Transport energy intensity: final energy consumption of transport activity (kgoe) divided by transport industry gross value
added (in 2010 EUR).
Transport carbon intensity: GHG emissions in transport activity divided by gross value added of the transport industry.
Energy import dependency: net energy imports divided by gross inland energy consumption plus consumption of
international maritime bunkers.
Aggregated supplier concentration index: Herfindahl-Hirschman index for net imports of crude oil and NGL, natural gas and
hard coal. Smaller values indicate larger diversification and hence lower risk.
Diversification of the energy mix: Herfindahl-Hirschman index of the main energy products in the gross inland consumption of
energy.
* European Commission and European Environment Agency.
Source: European Commission and European Environment Agency (Share of GHG emissions covered by ETS); European
Commission (Environmental taxes over labour taxes and GDP); Eurostat (all other indicators)
Green growth performance 2012 2013 2014 2015 2016 2017
Macroeconomic
Energy intensity kgoe / € 0,20 0,19 0,18 0,17 0,18 0,17
Carbon intensity kg / € 0,54 0,52 0,46 0,46 0,46 -
Resource intensity (reciprocal of resource productivity) kg / € 0,72 0,72 0,75 0,74 0,69 0,70
Waste intensity kg / € 0,13 - 0,13 - 0,14 -
Energy balance of trade % GDP -6,7 -5,5 -4,1 -3,1 -2,1 -2,6
Weighting of energy in HICP % 14,5 14,4 14,7 14,2 13,0 11,9
Difference between energy price change and inflation % 2,9 0,6 -0,9 -2,9 -2,6 0,2
Real unit of energy cost% of value
added10,1 10,1 9,5 9,7 9,9 -
Ratio of environmental taxes to labour taxes ratio 0,20 0,21 0,21 0,21 0,21 -
Environmental taxes % GDP 3,9 3,9 3,9 3,9 3,9 3,7
Sectoral
Industry energy intensity kgoe / € 0,13 0,13 0,13 0,13 0,12 0,12
Real unit energy cost for manufacturing industry excl.
refining
% of value
added14,0 13,2 12,1 12,2 12,3 -
Share of energy-intensive industries in the economy % GDP 11,2 11,3 11,5 11,0 11,3 11,5
Electricity prices for medium-sized industrial users € / kWh 0,09 0,10 0,09 0,08 0,08 0,08
Gas prices for medium-sized industrial users € / kWh 0,06 0,05 0,04 0,04 0,03 0,03
Public R&D for energy % GDP 0,01 0,01 0,01 0,01 0,01 0,02
Public R&D for environmental protection % GDP 0,02 0,01 0,01 0,03 0,02 0,03
Municipal waste recycling rate % 41,9 34,8 36,0 54,1 55,6 57,8
Share of GHG emissions covered by ETS* % 39,7 40,4 36,9 36,4 36,6 -
Transport energy intensity kgoe / € 1,12 1,08 1,04 0,98 0,96 0,89
Transport carbon intensity kg / € 3,36 3,20 3,08 2,91 2,90 -
Security of energy supply
Energy import dependency % 52,1 47,8 45,5 49,7 49,3 50,4
Aggregated supplier concentration index HHI 33,3 26,8 26,6 24,2 25,7 -
Diversification of energy mix HHI 0,24 0,24 0,25 0,23 0,24 0,23
54
Building on the Commission proposal for the next Multi-Annual Financial Framework for the period
2021-2027 of 2 May 2018 (COM (2018) 321), this Annex presents the preliminary Commission services
views on priority investment areas and framework conditions for effective delivery for the 2021-2027
Cohesion Policy (55
). These priority investment areas are derived from the broader context of investment
bottlenecks, investment needs and regional disparities assessed in the report. This Annex provides the
basis for a dialogue between Slovenia and the Commission services in view of the programming of the
cohesion policy funds (European Regional Development Fund, Cohesion Fund and European Social Fund
Plus).
Policy Objective 1: A Smarter Europe – Innovative and smart industrial transformation
The national targets for spending on research and development remain far from achieved and the
proportion of innovative enterprises lags behind the EU average. High priority investment needs (56
) have
therefore been identified to enhance research and innovation capacities and uptake of advanced
technologies, and in particular to:
strengthen research and innovation performance and foster productivity growth by identifying smart
specialisation areas on the basis of national and regional needs and potential;
increase the value added of the economy and strengthen the strong innovator position by increasing
the number of innovative firms in the smart specialisation areas;
foster cooperation between research and business including across the EU Strategy for the Adriatic-
Ionian Region, EU Strategy for the Alpine Region and EU strategy for the Danube Region via
strategic research and innovation partnerships, centres of competence, interregional projects and use
of Cloud services.
The uptake of Information and Communications Technology services in small and medium-sized
enterprises and further development of digital public services remain a challenge. Priority investment
needs have therefore been identified to reap the benefits of digitisation for citizens, companies and
governments, and in particular to:
increase uptake of Information and Communication Technology in small and medium-sized
enterprises , including supporting infrastructures and services; all with a view to improving the
number of enterprises reaching a high digital intensity;
increase the uptake of e-Government services (e-inclusion, e-health, e-learning, e-skilling) and
general use of internet services by citizens.
Scale-up and growth rates of enterprises remain low which, combined with a challenging business
environment and low capacities for technology transfer, hinders the growth of the economy. High
priority investment needs have therefore been identified to enhance growth and competitiveness in
small and medium-sized enterprises, and in particular to:
promote entrepreneurship and increase survival rates of firms in particular by facilitating the
economic exploitation of new ideas and integration of business education in the business ecosystem;
(55) This Annex is to be considered in conjunction with the EC Proposal for a Regulation of the European Parliament and of the
Council on the European Regional Development Fund and on the Cohesion Fund COM(2018) 372 and the EC Proposal for a
Regulation of the European Parliament and of the Council on the European Social Fund Plus COM(2018) 382, in particular as regards the requirements for thematic concentration and urban earmarking outlined in these proposals.
(56) The intensity of needs is classified in three categories in a descending order – high priority needs, priority needs, needs.
ANNEX D: INVESTMENT GUIDANCE ON COHESION POLICY
FUNDING 2021-2027 FOR SLOVENIA

D. Investment Guidance on Cohesion Policy Funding 2021-2027 for Slovenia
55
raise competitiveness and internationalisation of small and medium-sized enterprises, through
stronger participation in industry led and research driven international and macro-regional clusters;
This can be the basis for further innovations and co-operation, in line with the EU Strategy for the
Adriatic-Ionian Region, EU Strategy for the Alpine Region and EU strategy for the Danube Region;
reduce barriers for doing business, especially in less developed regions at level 3 of the Nomenclature
of Territorial Units for Statistics, through upgrading the entrepreneurial support ecosystem;
address increasing demographic challenges by supporting silver economy small and medium-sized
enterprises.
Skills shortages and mismatches are among the main barriers for the further economic development of
Slovenia. Priority investment needs have therefore been identified to develop skills for smart
specialisation, industrial transition and entrepreneurship, and in particular to:
reduce the capacity constraints in the economy, address technological change and industrial transition
challenges by providing training and skilling in smart specialisation areas;
support small and medium-sized enterprises growth and open up internationalisation opportunities by
providing skills trainings on (innovation) management, stock market participation, business
development, internationalisation.
Policy Objective 2: A low carbon and greener Europe – Clean and fair energy transition, Green
and blue investment, circular economy, climate adaptation and risk prevention
Energy intensity performance is below the EU average in industry, services and the residential sector
with energy consumption increasing, which exacerbates the high rate of energy poverty. Priority
investment needs have therefore been identified to promote energy efficiency measures, and in
particular to:
reduce energy consumption in residential buildings with focus on energy-poor households (Integrated
territorial investments );
reduce energy consumption by improving energy efficiency in services sector and industry.
The share of renewable energy sources has stagnated or even deteriorated in recent years, with a lot of
potential, such as wind, solar and geothermal sources remaining largely untapped. High priority
investment needs have therefore been identified to promote renewable energy, and in particular to:
support the transition to renewables in heating and cooling, especially enabling the deployment of
renewable energy technologies, which are not yet widely developed (wind, solar, geothermal).
Intelligent energy distribution systems have been developing, however, there remains a need to ensure
optimal utilisation of the energy distribution and storage network. Investment needs have therefore been
identified to develop smart energy systems, grids and storage at local level, and in particular to:
upgrade the smart energy systems, including smart electricity distribution grids by development and
deployment of new technologies for optimal energy utilisation, along with investing in energy storage
(Integrated territorial investments).

D. Investment Guidance on Cohesion Policy Funding 2021-2027 for Slovenia
56
With a large share of the population living in flood risk areas and increasing flood risks, a timely
implementation of flood prevention measures is vital. High priority investment needs have therefore been
identified to promote climate change adaptation, risk prevention and disaster resilience, and in
particular to:
support flood prevention and protection measures through ecosystem-based approaches, including the
implementation of disaster risk management strategies, including on the level of the EU Strategy for
the Adriatic-Ionian Region, EU Strategy for the Alpine Region and EU strategy for the Danube
Region.
Slovenia lags behind in achieving waste water collection and treatment targets. Priority investment needs
have therefore been identified to promote sustainable water management, and in particular to:
invest in the collection and treatment of wastewater in agglomerations where it is needed to reach the
targets, ensuring that bigger and more critical agglomerations are covered first, including in the frame
of the EU Strategy for the Danube Region.
Slovenia faces difficulties in the waste sector and is highly dependent on imported materials. Priority
investment needs have therefore been identified to promote the transition to a circular economy, and
in particular to:
develop alternatives to raw materials and promote recycled materials as secondary raw materials;
increase resource efficiency and further promote the circular economy in small and medium-sized
enterprises in synergy with policy objective 1 also through shared experience and best practices with
other member states;
support actions/campaigns to raise awareness, sustainable consumption practices and behaviour.
Slovenia’s biodiversity is declining, while air quality continues to raise concern despite improvements in
recent years. Investment needs have therefore been identified to enhance biodiversity, green
infrastructure in the urban environment, and reduce pollution, and in particular to:
support biodiversity in protected areas, as well as green infrastructure in the urban environment
(preparation of management plans, ecosystem restoration projects, improve the knowledge base),
including in the frame of the EU Strategy for the Danube Region (Integrated territorial investments);
support measures to improve air quality (environmentally friendly production, green infrastructure).
Policy Objective 3: A more connected Europe – Mobility and regional Information and
Communications Technology connectivity
The railway network is lagging behind the motorways in terms of quality and connectivity. High priority
investment needs have therefore been identified to develop a sustainable, climate resilient, intelligent,
secure and intermodal Trans-European Transport Network, and in particular to:
complete and upgrade the railway Trans-European Transport Network, including cross-border
sections, taking also into account the EU Strategy for the Adriatic-Ionian Region, EU Strategy for the
Alpine Region and EU strategy for the Danube Region;
invest in multi-modal transport with priority to improve the connectivity of different sustainable

D. Investment Guidance on Cohesion Policy Funding 2021-2027 for Slovenia
57
transport modes in conjunction with neighbouring networks, where relevant.
Transport is the biggest source of CO2 emissions, with an increasing energy consumption, decreasing
share of renewable energy sources and a fluctuating road fatalities rate. Priority investment needs have
therefore been identified to develop sustainable, climate resilient, intelligent and intermodal
national, regional and local mobility, including improved access to the Trans-European Transport
Network and cross-border mobility, and in particular to:
address negative externalities (safety, greenhouse gas, air pollution) by investing in sustainable and
accessible modes of transport;
invest in a smarter, more connected and cleaner transport system and deploy infrastructure which
decarbonises road transport (alternative fuels infrastructure facilitating integration of renewables);
improve connection of national networks to the Trans-European Transport Network, with positive
economic impact, including in the frame of the EU Strategy for the Danube Region.
Slovenia is highly dependent on cars, with a low use of other modes of passenger transport and
challenges in implementing sustainable urban mobility plans. Investment needs have therefore been
identified to promote sustainable multimodal urban mobility, and in particular to:
improve urban transport systems (in line with sustainable urban mobility plans) to reduce dependency
on cars and enable a shift towards sustainable and accessible modes of transport (Integrated territorial
investments);
invest into reducing the negative externalities of transport and developing Intelligent Transport
System solutions.
Policy Objective 4: A more social Europe – Implementing the European Pillar of Social Rights
Slovenia faces some structural labour market weaknesses, notably a weak employment situation of low-
skilled and older workers, as well as a mismatch of labour market needs and skills. Priority investment
needs have therefore been identified to modernise labour market institutions and services to assess
and anticipate skills needs in particular to:
improve targeting of active labour market policy measures for long term unemployed and inactive;
anticipate long-term employment challenges and provide lifelong guidance and learning
opportunities;
promote prolonging working activity and elderly-friendly forms of work organisation and conditions;
support integration between various service providers and implement national skills strategies;
ensure the tools to analyse current labour market needs and anticipate future labour demand.
Slovenia has a relatively well performing education system, but there are still discrepancies between
supply and demand for skills and at present, the adaptation to labour market changes is generally slow.
Priority investment needs have therefore been identified to improve the quality, effectiveness and
labour market relevance of education and training and support the acquisition of key
competences; to promote lifelong learning and new skills requirements based on labour market

D. Investment Guidance on Cohesion Policy Funding 2021-2027 for Slovenia
58
needs, and in particular to:
promote vocational education and training as a quality and highly skilled career pathway;
modernise education/training sectors, pedagogical staff policies, including digital learning,
transversal skills and other skills/knowledge for the future;
support access to inclusive and quality education, also focusing on enhancing digital skills (Integrated
territorial investments);
support infrastructure and equipment aimed at up-re/skilling people;
upgrade skills of the adult population and increase overall participation in lifelong learning.
The share of people at risk of poverty and social exclusion has decreased, but remains high for the
elderly and there are notable regional differences. Priority investment needs have therefore been
identified to promote the social integration of people at risk of poverty or social exclusion, and in
particular to:
foster active social inclusion and alleviate poverty, including by supporting transfer to community
based care and home-care, with a focus on elderly, people with disabilities and mental conditions.
Population ageing calls for improvements in the effectiveness and resilience of healthcare and long-term
care systems. High priority investment needs have therefore been identified to enhance the equal and
timely access to quality, sustainable and affordable services, and in particular to:
support integration of healthcare (primary and hospital), long-term care and social care services
including through investing in preventive and outpatient healthcare infrastructure, and equipment and
digital tools;
tackle geographical disparities in access to healthcare, with a focus on the socioeconomically
deprived;
invest in healthcare equipment in order to optimize the waiting times and improve transparency;
prolong healthier lives by promoting healthy lifestyles and tackling health-damaging behaviour and
health risks arising from pollution.
Policy Objective 5 – A Europe closer to citizens by fostering the sustainable and integrated
development of urban, rural and coastal areas and local initiatives
Cities, their surrounding functional areas and rural areas face different challenges, such as high pupil
underachievement rates in socioeconomically deprived areas, to be addressed through a bottom-up
approach. Other regional disparities are to be addressed through sectorial policies in policy objectives 1
through 4, while an optimal implementation is to be ensured by limiting investments to areas with
enough administrative capacity to prepare, select and implement projects. Investment needs have
therefore been identified to foster the integrated socio-economic development in urban and rural
areas, and in particular to:
support services in order to build an inclusive society, especially focusing on socio-economically
deprived persons/areas (Community Led Local Development).

D. Investment Guidance on Cohesion Policy Funding 2021-2027 for Slovenia
59
Factors for effective delivery of Cohesion policy
Additional efforts are needed to increase the administrative capacity necessary for the effective
administration and implementation of the Funds.
strong support and involvement of social partners, local authorities and other public bodies and
stakeholders, which are essential for effective implementation;
enhanced dialogue and strengthened capacities of intermediate bodies and final beneficiaries to
prepare and implement projects; focusing on continuing to build up the administrative capacity of the
intermediate body in charge of integrated territorial investments;
reduced administrative burden, improved and simplified procedures, eliminating excessive
documentation and over bureaucratic requirements to project proposals;
functioning of IT systems to enable proper monitoring and implementation of EU funds;
Improved public procurement performance by ensuring sufficient administrative capacity and its
support, as well as by reducing single bidder, one bidder or no bids rates;
development and implementation of a roadmap on administrative capacity building – to effectively
manage and use EU funds;
improved and more efficient measures to prevent and address conflict of interest, fraud and
corruption;
broader use of financial instruments and/or contributions to the Slovene compartment under InvestEU
for revenue-generating and cost-saving activities, also ensuring synergies with other EU funds;
taking account of experience available under different initiatives, such as the Coal Regions in
Transition initiative or the Regions in Industrial Transition, in particular about the impact of new
technologies, decarbonisation and the promotion of inclusive growth.
60
Bank of Slovenia (2016), Neposredne naložbe 2016, Ljubljana
(https://bankaslovenije.blob.core.windows.net/publication-
files/gdgehbqhggfBGU_neposredne_nalozbe_2016.pdf).
Bank of Slovenia (2018), Survey 01/2018, Predstavitev raziskave o dostopnosti financnih virov za
podjetha 2017, Ljubljana (https://bankaslovenije.blob.core.windows.net/publication-
files/gdgfzgcHIZMfe_informacija-o-sme-za-svet-2017-zdr.pdf).
Cankar G., Bren M., Zupanc D. (2017), Za večjo pravičnost šolskega sistema v Sloveniji, Državni izpitni
center, Ljubljana.
European Commission (2014), Share of enterprises cooperation with academia, Slovenia
(https://rio.jrc.ec.europa.eu/en/country-analysis/Slovenia/key-indicators/27835.).
European Commission (2016), EU Transport Scoreboard (https://ec.europa.eu/transport/facts-
fundings/scoreboard_en).
European Commission (2017a), The 2018 ageing report. Underlying assumptions and projection
methodologies, Institutional Paper 065/2017, Publications Office of the European Union, Luxembourg.
European Commission (2017b), Country report Slovenia 2017. Including an in-depth review on the
prevention and correction of macroeconomic imbalances, Commission Staff Working Document,
SWD(2017) 89 final, Brussels.
European Commission (2017c). Reform recommendations for regulation in professional services.
COM(2016)820, SWD(2016)436, Brussels.
European Commission (2017d), Energy union factsheet Slovenia, Commission Staff Working Document,
SWD(2017) 412 final, Brussels, https://ec.europa.eu/commission/sites/beta-political/files/energy-union-
factsheet-slovenia_en.pdf.
European Commission (2017a), Regional innovation scoreboard 2017
(http://ec.europa.eu/growth/industry/innovation/facts-figures/regional_en).
European Commission (2017b), The EU Environmental implementation review Country report, Slovenia,
Commission Staff Working Paper SWD(2017) 57 final, Brussels
(http://ec.europa.eu/environment/eir/pdf/report_si_en.pdf).
European Commission (2018a), European Commission Forecast, Autumn 2018, Institutional paper
089/2018, Brussels.
European Commission (2018b), Country report Slovenia 2018. Including an in-depth review on the
prevention and correction of macroeconomic imbalances, Commission Staff Working Document,
SWD(2018) 22 final, Brussels.
European Commission (2018c), Taxation trends in the European Union. Data for the EU Member States,
Iceland and Norway, Publications Office of the European Union, Luxemburg.
European Commission (2018d), Employment and social developments in Europe 2018. Annual review
2018, Publications Office of the European Union, Luxemburg.
REFERENCES
References
61
European Commission (2018e), Education and training monitor
(https://ec.europa.eu/education/policy/strategic-framework/et-monitor_en).
European Commission (2018f), European Innovation Scoreboard 2018, Brussels
(https://ec.europa.eu/growth/content/european-innovation-scoreboard-2018-europe-must-deepen-its-
innovation-edge_en).
European Commission (2018g), Horizon 2020 Policy Support Facility. Specific Support to Slovenia:
Internationalisation of the science base and science-business cooperation, Brussels
(https://rio.jrc.ec.europa.eu/en/policy-support-facility/specific-support-slovenia).
European Commission (2018h), The Digital Economy and Society Index (DESI),
(https://ec.europa.eu/digital-single-market/en/desi).
European Commission (2018i), 2018 Small Business Act (SBA) Fact Sheet, Slovenia
(https://ec.europa.eu/docsroom/documents/32581/attachments/26/translations/en/renditions/native).
European Commission (2018j), Transport in the European Union. Current trends and issues,
(https://ec.europa.eu/transport/sites/transport/files/2018-transport-in-the-eu-current-trends-and-
issues.pdf).
European Commission (2018k), EU transport in figures. Statistical pocketbook 2018, Brussels
(https://ec.europa.eu/transport/facts-fundings/statistics/pocketbook-2018_en).
European Commission (2019a), Transport in the European Union. Current trends and issues, Brussels
(forthcoming).
European Commission (2019b), The 2019 EU Justice Scoreboard. Communication from the Commission
to the European Parliament, the Council, the European Central Bank, the European Economic and Social
Committee and the Committee of the Regions, Brussels (forthcoming).
European Commission (2019c), Fiscal Sustainability Report 2018, European Economy, Institutional
Paper 094/2019, Brussels (https://ec.europa.eu/info/publications/economy-finance/fiscal-sustainability-
report-2018_en).
European Commission (2019d), 2019 Consumer Conditions Scoreboard, Staff Working Document,
Brussels (forthcoming).
European Commission/European Central Bank (2018), Survey on the access to finance of enterprises
(SAFE) (https://ec.europa.eu/growth/access-to-finance/data-surveys_en).
European Commission/European Council (2018), Draft joint employment report from the Commission
and the Council, COM(2018) 761 final.
European Commission and Social Protection Committee (2018), The 2018 Pension adequacy report:
Current and future income adequacy in old age in the EU, Country profiles, Vol. II, Publications Office
of the European Union, Luxembourg.
European Environment Agency (EEA) (2017), Air Quality in Europe
(https://www.eea.europa.eu/publications/air-quality-in-europe-2017).
European Investment Bank (EIB) (2018), EIB investment survey 2018. Slovenia overview
(http://www.eib.org/attachments/efs/eibis_2018_slovenia_en.pdf).

References
62
European Investment Fund (2018), European small business finance outlook, December 2018, EIF
Working paper 2018/053, Luxemburg.
Fiscal Council (2018a), Report on the Fiscal Council’s operations in 2017, Document No.: 00-2/2018/1,
Ljubljana (http://www.fs-rs.si/wp-content/uploads/2018/05/Report-on-the-FC-operations-in-2017.pdf).
Fiscal Council (2018b), Assessment of fiscal and macroeconomic consequences of the Coalition
Agreement on Cooperation within the Government of the Republic of Slovenia in the 2018-2022 term-of-
office, Ljubljana (http://www.fs-rs.si/wp-content/uploads/2018/09/Assessment-of-fiscal-and-
macroeconomic-consequences-of-the-Coalition-Agreement.pdf).
Fiscal Council (2019), Public Finance and macroeconomic developments, Ljubljana (http://www.fs-
rs.si/wp-content/uploads/2019/01/Public-Finance-and-Macroeconomic-
Developments_January_2019.pdf).
Global Entrepreneurship Monitor (GEM) (2018), GEM 2017/18 Global Report
(https://www.gemconsortium.org/report/50012).
Government of the Republic of Slovenia (2017xx), Slovenian Development Strategy 2030, Ljubljana
(http://www.vlada.si/fileadmin/dokumenti/si/projekti/2017/srs2030/en/Slovenia_2030.pdf).
Government of the Republic of Slovenia, Ministry of Education, Science and Sport of Slovenia (Ministry
of Education) (2018), Snovalci digitalne prihodnosti ali le uporabniki? Ljubljana
(http://www.mizs.gov.si/fileadmin/mizs.gov.si/pageuploads/Aktualno/Porocilo_RINOS_30_5_18.pdf).
Government of the Republic of Slovenia, Ministry of the Environment and Spatial Planning (Ministry of
Environment) (2018), Roadmap Towards the Circular Economy in Slovenia, Ljubljana
(https://circulareconomy.europa.eu/platform/sites/default/files/roadmap_towards_the_circular_economy_i
n_slovenia.pdf).
Government of the Republic of Slovenia, Ministry of Infrastructure (2018), Draft Energy Concept of
Slovenia (http://www.energetika-portal.si/fileadmin/dokumenti/publikacije/eks/resolucija_eks/re-
eks_jo_avg_2018.pdf).
Government of the Republic of Slovenia, Ministry of Labour, Family, Social Affairs and Equal
Opportunities (MoLFSAEO) (2018b), Sprememba ciljne skupine javnega povabila Spodbujanje
zaposlovanja, Zaposli.me 2017/2019 (http://www.mddsz.gov.si/si/medijsko_sredisce/novica/8450/).
Institute of Macroeconomic Analysis and Development of the Republic of Slovenia (IMAD) (2018),
Development report 2018, Ljubljana.
Institute of Macroeconomic Analysis and Development of the Republic of Slovenia (IMAD) and Ministry
of Labour, Family, Social Affairs and Equal Opportunities (MoLFSAEO) (2018), Active Ageing Strategy,
Ljubljana.
Invest Europe (2017), 2017 European Private Equity Activity. Statistics of fundraising, investments and
divestments, Brussels (https://www.investeurope.eu/media/711867/invest-europe-2017-european-private-
equity-activity.pdf).
Invest Europe (2018), 2017 Central and Eastern Europe. Private equity statistics, Brussels
(https://www.investeurope.eu/media/727455/Invest-Europe-CEE-Activity-Report-2017-05072018.pdf).
References
63
Ljubljana Stock Exchange (2018), Launch of the SME pre-listing programme in Slovenia
(http://www.ljse.si/cgi-bin/jve.cgi?doc=19630).
Majcen, B et al. (2016), Further development and maintenance of dynamic modelling platform, Institute
for Economic Research, Ljubljana
National Examination Centre RIC (2016), Splosna matura – letno porocilo,
(https://www.ric.si/mma/Letno%20porocilo%20SM%202016/2016112913591985/).
OECD (2017a), R&D Tax Incentives: Slovenia, 2017, OECD Publishing Paris
(https://www.oecd.org/sti/rd-tax-stats-slovenia.pdf).
OECD (2017b), Science, Technology and Industry Scoreboard 2017 (http://www.oecd.org/sti/oecd-
science-technology-and-industry-scoreboard-20725345.htm).
OECD Working Group on Bribery (2017), 2016 data on enforcement of the anti-bribery convection.
Special focus on international co-operation, OECD, Paris (http://www.oecd.org/daf/anti-bribery/Anti-
Bribery-Convention-Enforcement-Data-2016.pdf)
OECD/European Commission (2017), Health at a glance 2017 OECD Publishing, Paris.
OECD/European Observatory on Health System and Policies (2017), State of Health in the EU, Slovenia,
Country Health Profile 2017, OECD Publishing, Paris.
OECD (2018), Skill strategy implementation guidance for Slovenia: Improving the governance for adult
learning, OECD Skills Studies, OECD Publishing, Paris.
OECD/European Commission (2018), Health at a Glance: Europe 2018: State of Health in the EU Cycle,
OECD Publishing, Paris (https://doi.org/10.1787/health_glance_eur-2018-en).
SPIRIT (2017), Tuji investitorji o slovenskem poslovnem okolju 2017. Rezultati raziskave med podjetji s
tujim kapitalom 2017, University of Ljubljana, Ljubljana.
Statistical Office of the Republic of Slovenia, Labour Force Survey (LFS) Results 2018, Ljubljana
(https://www.stat.si/StatWeb/en/News/Index/7707).
Slovenian Sovereign Holding (2018), Annual report. Management of capital assets of RS and SSH in
2017 submitted to Parliament, Ljubljana.
World Bank (2019), Doing business 2019 report
(http://www.doingbusiness.org/content/dam/doingBusiness/media/Annual-Reports/English/DB2019-
report_web-version.pdf).
World Economic Forum (WEF) (2018), The global competitiveness report 2017-2018, World Economic
Forum, Geneva (http://www3.weforum.org/docs/GCR2017-
2018/05FullReport/TheGlobalCompetitivenessReport2017–2018.pdf).